Abstract
In pursuit of sustainable development goal 5 (SDG5), this study underscores gender equity and women’s empowerment as pivotal themes in sustainable development. It examines the drivers of women’s empowerment, including education, economics, finance, and legal rights, using data from individuals, primarily women (68.4%) aged 20–30 (69.6%). The research methodology integrates descriptive statistical measures, machine learning (ML) algorithms, and graphical representations to systematically explore the fundamental research inquiries that align with SDG5, which focuses on achieving gender equity. The results indicate that higher educational levels, captured through ordinal encoding and correlation analyzes, are strongly linked to increased labor market participation and entrepreneurial activity. The random forest (RF) and support vector machine (SVM) classifiers achieved overall accuracies of 89% and 93% for the categorization of experience, respectively. Although 91% of women have bank accounts, only 47% reported financial independence due to gendered barriers. Logistic regression correctly identified financially independent women with a 93% recall, but the classification of non-independent participants was less robust, with a 44% recall. Access to legal services, modeled using a neural network, was a potent predictor of empowerment (F1-score 0.83 for full access cases), yet significant obstacles persist for those uncertain about or lacking legal access. These findings underscore that, while formal institutional access is relatively widespread among educated women literate in the digital world, perceived and practical barriers in the financial and legal realms continue to hinder empowerment. The results quantify these effects and highlight opportunities for tailored, data-driven policy interventions targeting persistent gaps.
1. Introduction
In an era of rapid digitization, economies and societies are being radically transformed, shattering long-held paradigms of participation, equity, and opportunity [1]. This digital revolution is blazing trails for opportunities while simultaneously posing formidable challenges that must be overcome for truly inclusive development [2,3]. Within this dynamic and ever-evolving landscape, the advancement of gender equity emerges as a critical pillar not only for personal empowerment, but also for system resilience and the sustainable growth of our digital economy [4]. Socioeconomic empowerment for women, intricately linked with their active participation in education, labor markets, access to financial systems, and participation in legal frameworks, requires a thorough and robust analysis that leverages advances in data science, artificial intelligence (AI), and the vibrant realms of interactive digital media [5].
Recent advances in computational and data-driven approaches, especially through the deployment of machine learning (ML) algorithms and advanced statistical modeling, now provide immensely powerful tools capable of unraveling complex and nuanced interconnections among educational attainment, economic participation, financial inclusion, and legal empowerment [6,7]. These analyses, rendered more interpretable and accessible through modern data visualization platforms, provide transparent and actionable insights designed to empower a diverse spectrum of stakeholders.
In recent scholarly investigations, various authors have systematically examined gender disparities using extensive datasets and sophisticated algorithms. Yang et al. [8] employed survival models to analyze gender disparities in an extensive dataset of scholars, emphasizing the influence of early career factors despite dropout rates. This mirrors the complexity observed in our analysis, where educational attainment substantially affects labor participation, albeit in differing contexts. Mishra et al. [9] investigated the impact of financial inclusion on sustainable development, examining the interaction between financial services and empowerment. Our study similarly identifies financial barriers as pivotal to women’s economic independence, aligning with Mishra’s findings on the necessity of expanding access to financial services. Enrico’s multilayer network analysis of Reddit cultural dynamics assesses bias and diversity within social systems [10]. Our research aligns with this focus, employing ML to discern biases that impact empowerment in legal service access.
Numerous studies, including ours, tackle the issue of mitigating algorithmic bias while ensuring transparency and fairness, as highlighted by Elias and Maria [11]. The shift towards computational methodologies requires a careful equilibrium between qualitative understanding and quantitative precision, a challenge underscored both in our study and in the broader literature by authors such as Srour et al. [12]. This comparative analysis underscores the shared themes and challenges in investigating socioeconomic empowerment through computational lenses, thereby enriching the study’s contextual foundation.
This study delves deep into the fundamental drivers of women’s empowerment that encompass educational attainment, economic participation, financial access, and legal rights, meticulously analyzing the rich data collected from a sample of 223 individuals, predominantly women (68.4%) mostly between 20 and 30 years of age (69.6%). Through the sophisticated integration of descriptive statistics, cutting-edge ML models, and vivid graphical visualizations, the research robustly addresses three critical research questions: (R.Q.1) How do educational attainment levels among women influence their participation in the labor market and entrepreneurial activities? (R.Q.2) What barriers to accessing financial services do women face and how do such barriers affect their financial independence? (R.Q.3) What role does access to legal services and awareness of legal rights play in empowering women?
The findings compellingly demonstrate that higher educational levels, meticulously quantified through both ordinal encoding and intricate correlation analyzes, are strongly linked to increased participation in the labor market and vibrant entrepreneurial activity; indeed, the RF and SVM classifiers achieved an impressive overall precision of 89% and 93% in categorization of experiences, respectively. Interestingly, despite 91% of women possessing bank accounts, a mere 47% reported true financial independence, significantly hampered by established gender barriers—logistic regression astutely pinpointed financially independent women with an 86% recall rate, although with a lower 25% recall rate for identifying non-independent participants. Access to legal services, astutely modeled using a sophisticated neural network, emerged as a powerful predictor of empowerment (with an F1 score of 0.81 for fully accessible cases), but formidable obstacles remain for those confused about or completely lacking legal access. These vital findings highlight that, even though formal institutional access is abundantly available among educated, digitally literate women, enduring perceived and tangible barriers within financial and legal spheres persistently thwart full empowerment. The results precisely quantify these impacts, illuminating fertile ground for bespoke, data-driven policy interventions specifically engineered to bridge these enduring gaps. The main contributions of this research are:
- Empirical Identification of Drivers: Quantitatively identifies education, financial inclusion, and legal awareness as key factors influencing women’s economic participation in the digital era.
- Advanced Analytical Application: It applies ML and statistical models (RF, SVM, logistic regression, neural networks) to rigorously analyze social engagement patterns.
- Insightful Predictive Modeling: Demonstrates the effectiveness of SVM and neural networks in predicting economic participation and the use of legal services among women.
- Data-Driven Policy Recommendations: Provides actionable policy insights to improve education, financial access, and legal empowerment towards gender equity.
- Visualization of Progress and Gaps: Uses graphical analysis to highlight both advances and persistent disparities in the economic inclusion of women.
The imperative of advancing gender equity has emerged as a crucial pillar of sustainable development. This study strategically aligns with the sustainable development goal 5 (SDG5) of the United Nations by examining critical areas [13,14] such as education, financial independence, and legal empowerment among women. Our approach incorporates machine learning models and statistical graphical methods to provide robust, data-driven insights into the multidimensional aspects of women’s empowerment. This alignment is further detailed in the Section 3.8 subsection of our methodology, where specific targets and indicators guide our research questions and analysis framework.
2. Background and Related Work
2.1. Socioeconomic Background
Socioeconomic empowerment represents the dynamic progression of individuals or groups as they navigate upward or downward through the intricate strata of social and economic hierarchies. This progression is increasingly reshaped by the rapid advancements in digital transformation and the precision afforded by data-driven policy interventions [15]. Enhancing women’s socioeconomic empowerment is not merely significant but essential in creating pathways to gender equity, eradicating poverty, and cultivating an environment conducive to inclusive and sustainable economic growth [16]. The avenues to empowerment are intricately interwoven with a constellation of influential factors, ranging from access to quality education to active engagement in evolving labor markets, with an increasingly significant emphasis on the digital and knowledge-based sectors [17]. Furthermore, legal rights, sociocultural norms, and complex family structures play a critical role, forming a dynamic landscape for socioeconomic empowerment [18].
Although substantial progress has been achieved through technological innovations and policy reforms, persistent challenges remain [19]. Structural barriers continuously impede women’s ability to obtain high-quality employment, assume ownership of property, and access digital resources, often exacerbated by the pervasive forces of gender-based discrimination and systemic biases [20]. Moreover, the intricate interaction between gender and factors such as ethnicity, socioeconomic status, and geographic location not only amplifies these challenges but also engenders unique and varied empowerment pathways [21]. Addressing these complex factors with a synergistic blend of multidisciplinary research—utilizing the revolutionary power of big data analytics, pioneering ML, and data visualization—reveals significant insights into the intricate determinants of women’s empowerment [22]. This dynamic and data-driven approach is indispensable for developing informed policy strategies, cultivating inclusive digital economies, and decisively bridging persistent gender gaps [23].
2.2. The Pursuit of Gender Equity: Insights from SDG5
The 2030 Agenda outlines 17 SDGs as a unified action plan for governments, businesses, and civil society. SDG5 aims for gender equality and empowerment of women and girls, crucial for the entire agenda, addressing discrimination, violence, unpaid care, leadership, and economic access [13]. Research highlights the need for integrating these goals into strategies and accountability to move beyond symbolic support [14,24]. Current measurement challenges include inadequate mechanisms for capturing social outcomes, demanding improved metrics and decision-making tools [25]. Innovation and digitalization are seen as drivers for SDG5, though inclusivity is key to prevent worsening inequities. UN Women emphasizes inclusive design and access to ensure technology benefits women [1]. Reviews suggest blockchain can enhance inclusion and transparency for women, but challenges like skills and regulation persist [26]. Sector transitions to decarbonization offer gender equality opportunities, yet may also reinforce disparities if representation issues aren’t addressed [27].
Empirical evidence from industries reveals that green recovery and circular innovation in mature manufacturing are driven by the value of circular products and sustainability certifications. These can align with inclusive employment and supply-chain strategies to advance SDG5 and environmental goals [28]. In fashion, where women are predominant, post-COVID-19 circular models with a “circular premium” integrate resilience and gender-responsive procurement [29]. In transport and shipping, gender equality is crucial for decarbonization, with a focus on technology responsibility and preventing occupational segregation [30,31].
CSR connects SDGs to practical implementation, shifting from philanthropy to a stakeholder-focused approach that integrates risk management and innovation [24]. For SDG5, this means adopting gender-transformative strategies with metrics like pay equity and representation targets. The challenge remains in aligning disclosures with impact. Integrating accounting and sustainability reporting with outcome-focused indicators can clarify synergies and trade-offs among SDGs, such as decarbonization and equitable employment [14,25]. Progress in gender equality can benefit health, education, innovation, and climate action, while its neglect may hinder broader SDG progress [27].
2.3. Educational Attainment on Women’s Socioeconomic Empowerment
The complex fabric of women’s socioeconomic empowerment has been developed through a comprehensive history of academic investigation. Initially, scholarly work concentrated on the transformative roles of education and active engagement in the labor force as fundamental components for upward empowerment [32]. For instance, Elsayed and Shirshikova [33] conducted an analysis on the establishment of public universities in Egypt during the 1960s–1970s, discovering that these educational institutions enhanced access to higher education and positively influenced women’s employment and marriage prospects. The construction of universities also altered migration patterns, diminishing migration prior to enrollment, while amplifying it post-enrollment. Additionally, Kien and Nguyen [34] examined the influence of education on women’s empowerment across 70 developing nations, demonstrating that education enhances decision-making capacity and reduces psychological abuse by comparing sisters with varying educational levels.
The advantages stem from improved information, assortative matching, and advanced labor market conditions. For example, Yadav et al. [35] investigated the interaction of the 4Es (Education, Employment, Economic Status, Empowerment) and sociodemographics on maternal healthcare outcomes in India, utilizing data from the National Family Health Survey 4 (2015–2016). Using logistic regression, they assessed antenatal visits, skilled birth attendance, and postnatal care. Education was found to augment antenatal care and skilled birth attendance—most prominently at higher levels—and bolster employment, economic status, and empowerment. Nevertheless, its influence on postnatal care dissipates when considering economic status and empowerment. Moreover, significant gender disparities persist in Latin America, where empowering women and bridging these gaps may decrease adolescent pregnancy rates. Braverman-Bronstein et al. [36] investigated the association between urban women’s empowerment, gender inequity, and adolescent birth rates across 366 cities in nine Latin American countries.
Over the past 15 years, Turkey has experienced an expansion in higher education with the elimination of tuition fees, the establishment of a public university in every city, the proliferation of foundation universities, and the lifting of headscarf bans. These changes have led to women surpassing men in higher education attainment. Cin et al. [37] examined the correlation between education and gender equity in the workforce through labor force data from 2005, 2008, 2011, and 2017, focusing on participation, occupational segregation, and the gender pay gap. The study concluded that women with formal education enter the workforce more frequently than those without it. Parveen [38] analyzed the empowerment of Saudi women entering the labor market, highlighting the policies and reforms implemented by the Saudi Government that promote gender parity in the workplace, as well as evaluating measures undertaken to empower women and their economic impact.
2.4. Financial Barriers on Women’s Economic Autonomy
Financial barriers, such as restricted access to credit, banking, and digital financial services, impede women’s economic independence by limiting their capacity to establish businesses, invest in education, and accumulate assets, thereby reinforcing gender-based socioeconomic inequalities. Saluja et al. [39] elucidated theoretical and empirical dimensions by systematically reviewing barriers to and interventions for women’s financial inclusion. The existing literature predominantly accentuates exclusion factors and is fragmented, often overlooking interventions. The study integrated previous findings with current and prospective research to bridge this discrepancy. For example, Al-shami et al. [40] assessed the effect of the microcredit provided by Al-Amal Bank on Yemeni women’s empowerment, employing household surveys and matching propensity scores. The study provided recommendations for Yemeni and international policymakers to improve financial services for women’s self-development to mitigate poverty, thus reducing reliance on governmental and international entities.
Women’s empowerment is a pivotal element in development economics and modernization theories, enhancing human resources for economic growth. The study by Pal et al. [41] examined the influence of socioeconomic factors on women’s empowerment through financial inclusion in rural India. In addition, Mishra et al. [9] explored the ramifications of financial inclusion on sustainable development by analyzing 325 scholarly articles from a pool of 620 studies, using search terms such as financial literacy and fintech to highlight the urgency of expanding financial access to underserved populations in the developing world. Aziz et al. [42] investigated the more pronounced challenges of financial inclusion faced by women compared to men in Asian countries, with an emphasis on the role of religion. Their study exposed a substantive correlation between gender and the utilization of financial services. In nations where religious constraints impede women’s employment, their probability of possessing bank accounts diminishes. In contrast, countries that advocate for gender equity and uphold stringent regulatory frameworks exhibit increased female financial participation.
2.5. Women’s Access to Legal Services and Rights Awareness
Legal empowerment profoundly influences lives by equipping women with the necessary knowledge and tools to assert autonomy and combat discrimination [43]. The global movement for women’s rights focuses on legal equity, acknowledging that legislation plays a pivotal role in shaping women’s roles within the domestic sphere and influencing their educational and professional prospects. Geetha and Pretty [44] conducted an examination of the effects of legislation on women, particularly married Hindu women, through an assessment of their awareness and perceptions of their legal rights, thus investigating the practical realization of gender equity through laws. Maru [45] undertook a review of the World Bank’s initiatives concerning access to justice and proposed additional steps. The review identifies six focal areas: court reforms, legal aid, information dissemination, alternative dispute resolution, public sector accountability, and research. Motivated by discussions surrounding ‘legal empowerment,’ it evaluates how these endeavors influence the agency of impoverished populations, culminating in insights and recommendations derived from the Bank’s experiences.
National governments perceive legal empowerment as a crucial strategy in the fight against poverty. Despite its global promotion by civil society, the full extent of its impact remains partially understood. Goodwin et al. [46] offered the first comprehensive review of existing evidence regarding legal empowerment. Joshi et al. [47] provided a scoping review concerning the utilization of legal empowerment to enhance access to quality health services in low- and middle-income nations. The review identifies key lessons regarding program strategy, its impact on health empowerment and outcomes, as well as research gaps, areas of consensus, and points of contention.
2.6. Machine Learning in Social Science
Digital transformation is transforming the socioeconomic empowerment of women, presenting novel challenges and opportunities through advances in computing, data science, and ML. Techniques such as machine learning (ML), natural language processing (NLP), and network analysis are essential to elucidate the interconnections between education, economic participation, financial inclusion, and legal access. These computational methodologies are critical for the analysis and formulation of gender equity policies within digital societies. Recent scholarly investigations systematically examine gender disparities using extensive datasets and sophisticated algorithms. Yang et al. [8] employ survival models on data that cover more than 24 million scholars, demonstrating that women in the early stages of their careers exert significant influence despite elevated dropout rates. Liu et al. [48] apply NLP and regression techniques on 300,000 biomedical theses, revealing enduring gender disparities in scientific innovation, which have implications for mentorship and policy. These studies underscore the importance of information science methodologies in understanding contemporary gender empowerment and leadership. ML facilitates the understanding of bias, diversity, and fairness within online communities and social systems. Enrico [10] utilizes multilayer network analysis to investigate cultural dynamics on Reddit. Qian et al. [49] scrutinize e-commerce data to expose gender-related discrepancies in consumer protection, illustrating the impact of digital interventions on gender equity. These approaches indicate a transition towards evidence-based social policy informed by computational tools.
Social scientists are increasingly deploying ML to analyze extensive datasets, transforming their discipline. Unlike its application in computer science, ML in the social sciences identifies concepts, quantifies causal relationships, and predicts outcomes. This data-centric approach transitions from deductive to interactive methodologies, thereby enhancing a variety of inquiries [50]. Moreover, ML surpasses traditional techniques in analyzing large longitudinal datasets without the presumption of variable distribution or population homogeneity [51]. ML is revolutionizing social science by augmenting data analysis, predictive modeling, and causal inference in fields such as political science, economics, and psychology. Elias and Maria [11] investigate AI techniques, including ML, NLP, network science, and explainable AI (XAI), addressing research challenges focused on bias mitigation, fairness, causal discovery, and model interpretability. While improving analytical capabilities, these tools also raise concerns about bias, transparency, and ethics.
Knowledge discovery and data mining transcend traditional statistical approaches, uncovering new insights, refining predictions, fitting models, and recognizing patterns and non-linear effects [52]. Tools for demographic interaction analysis remain limited. Srour et al. [12] employ decision trees to detect interactions and predict outcomes, with the Blau index assessing diversity and knowledge sharing. Decision trees reveal demographic faultlines beyond the scope of linear regression. Large language models (LLMs) are transforming social science research, enabling the simulation of human responses and facilitating expedient testing of behavioral theories. The primary challenge lies in the effective adoption of AI while ensuring transparency and replicability [53]. The study by Castorena et al. [54] introduces a deep learning neural network to detect gender-based violence within Twitter messages. From a corpus of 1,857,450 messages obtained from Mexico, 61,604 were manually classified as negative, positive, or neutral for training and testing purposes. The findings demonstrate the efficacy of the deep neural network, with an accuracy rate of approximately 89%.
2.7. Statistical Analysis in Social Science
Statistical analysis in the social sciences offers robust methodologies for quantitatively assessing complex social phenomena [55]. Unearthing latent patterns within extensive datasets provides insights that refine theoretical frameworks, inform policy-making, and enhance practical applications, thus exerting a significant influence on the social sciences [56]. Ungureanu et al. [57] critically assess the application of statistical methods across domains such as medicine and the natural sciences, with a particular focus on data collection and interpretation. They evaluated applied statistical methods within the social sciences and examined their outcomes. Computational analysis plays an crucial role in identifying and mitigating gender bias within information systems. Simon et al. [58] measure and identify gender bias on LinkedIn through the use of textual embedding and statistical testing. Fabris et al. [59] formulate metrics to assess the reinforcement of gender stereotypes within ranking algorithms by employing word embeddings and information retrieval models. Slokom et al. [60] advance privacy and equity in recommender systems by employing obfuscation techniques to obscure gender signals. Silva et al. [61] utilize natural language processing applied to literary corpora to examine patterns of gendered language, underscoring the importance of computational linguistics in gender studies.
Despite the wealth of data available in the “Big Data” era, statistical power analysis is frequently neglected, even at the graduate study level. Statistical acumen is vital for tackling complex issues and discerning “statistically significant” minor discrepancies [62]. The field of computational social science amalgamates a variety of scientific methodologies, transcending beyond mere digital data and technical approaches. The perspective provided by Hofman et al. [63] reconciles these variances, harmonizing causal explanation with predictive outcomes, and advocates for ‘integrative modeling’ alongside practical strategies. As an illustration, mobility initiatives prioritize sustainability, resilience, and civic involvement in urban planning. While scooters are favored for short-distance connectivity, they exhibit a gender disparity. The study by Campisi et al. [64] examines the cities of Catania and Palermo to elucidate factors influencing gender balance in micromobility, such as demographic attributes, professional engagement, and perceptions of safety, thereby informing the strategic planning of e-scooter services to redress the gender gap.
3. Methodology
This work explores women’s empowerment through education, economic participation, and access to financial and legal services. We used an electronic data collection method shared via social networks among university personnel, collecting responses. Our methods include statistical analysis, ML, and graphical visualizations, tailored to provide information on regional challenges to women empowerment. This approach forms the framework for addressing research questions and informs policy to empower women.
3.1. Data Collection
Data for the study were obtained through a structured questionnaire that focused on women’s empowerment and was primarily distributed within the author’s interactions and network. The electronic distribution method facilitated responses from 223 participants, resulting in a cohort diverse in gender, age, educational background, and employment status. The data collection phase spanned from 10 June to 10 September 2025, indicating variability in response rates. To preserve confidentiality and privacy, data anonymization techniques were employed to remove any identifying information from participant responses, thereby protecting the datasets from being traceable to specific individuals.
Although the data garnered through social interactions and networking provide significant insights, it should be noted that the findings predominantly reflect perspectives likely from the Middle Eastern regions. This inference is drawn from the author’s predominantly Middle Eastern network, despite the lack of region-specific data collection. Therefore, it is recommended that future research stratify analyses by region to incorporate a range of socio-cultural contexts and verify these findings across varied environments.
3.2. Instrument Description
This study utilized a structured questionnaire detailed in Appendix A. It comprises 12 sections, each addressing different aspects of women’s empowerment—such as demographics, education, and legal rights—using various scales (e.g., Likert scale, Yes/No scale). Content validation was reviewed and approved by the local research ethics committee (elaborated upon in the final section of the manuscript) to ensure appropriateness and relevance, ensuring the instrument’s rigor and adhered to ethical research practices for participant welfare and data integrity.
3.3. Participants
The study included participants, among whom identified as female, as male, and a minor proportion opted not to disclose their gender identity. A predominant segment, , of these participants was between 20 and 30 years old, with fewer people representing other age brackets, thus encapsulating a youthful cohort likely to possess technological proficiency and increased exposure to contemporary gender role paradigms and empowerment concepts. The educational attainment of the participants varied, with a notable proportion of those with university-level qualifications, indicative of a comparatively well-educated cohort. The employment status predominantly categorized as ‘student’ aligns with the observations of a younger demographic. This demographic aspect is significant, as it can shape their perspectives on empowerment and accessibility to diverse services.
3.4. Distribution and Sampling
The non-random sampling methodology used both convenience and snowball sampling techniques, starting with author’s network which are in majority university personnel and subsequently expanding through their social networks via social media platforms. Although this approach is advantageous for quickly garnering a substantial quantity of diverse responses, it may introduce certain biases related to the socioeconomic and educational backgrounds of the participants. This is due to the method’s tendency to primarily mirror the attributes of higher education communities and their networks.
3.5. Dataset Description
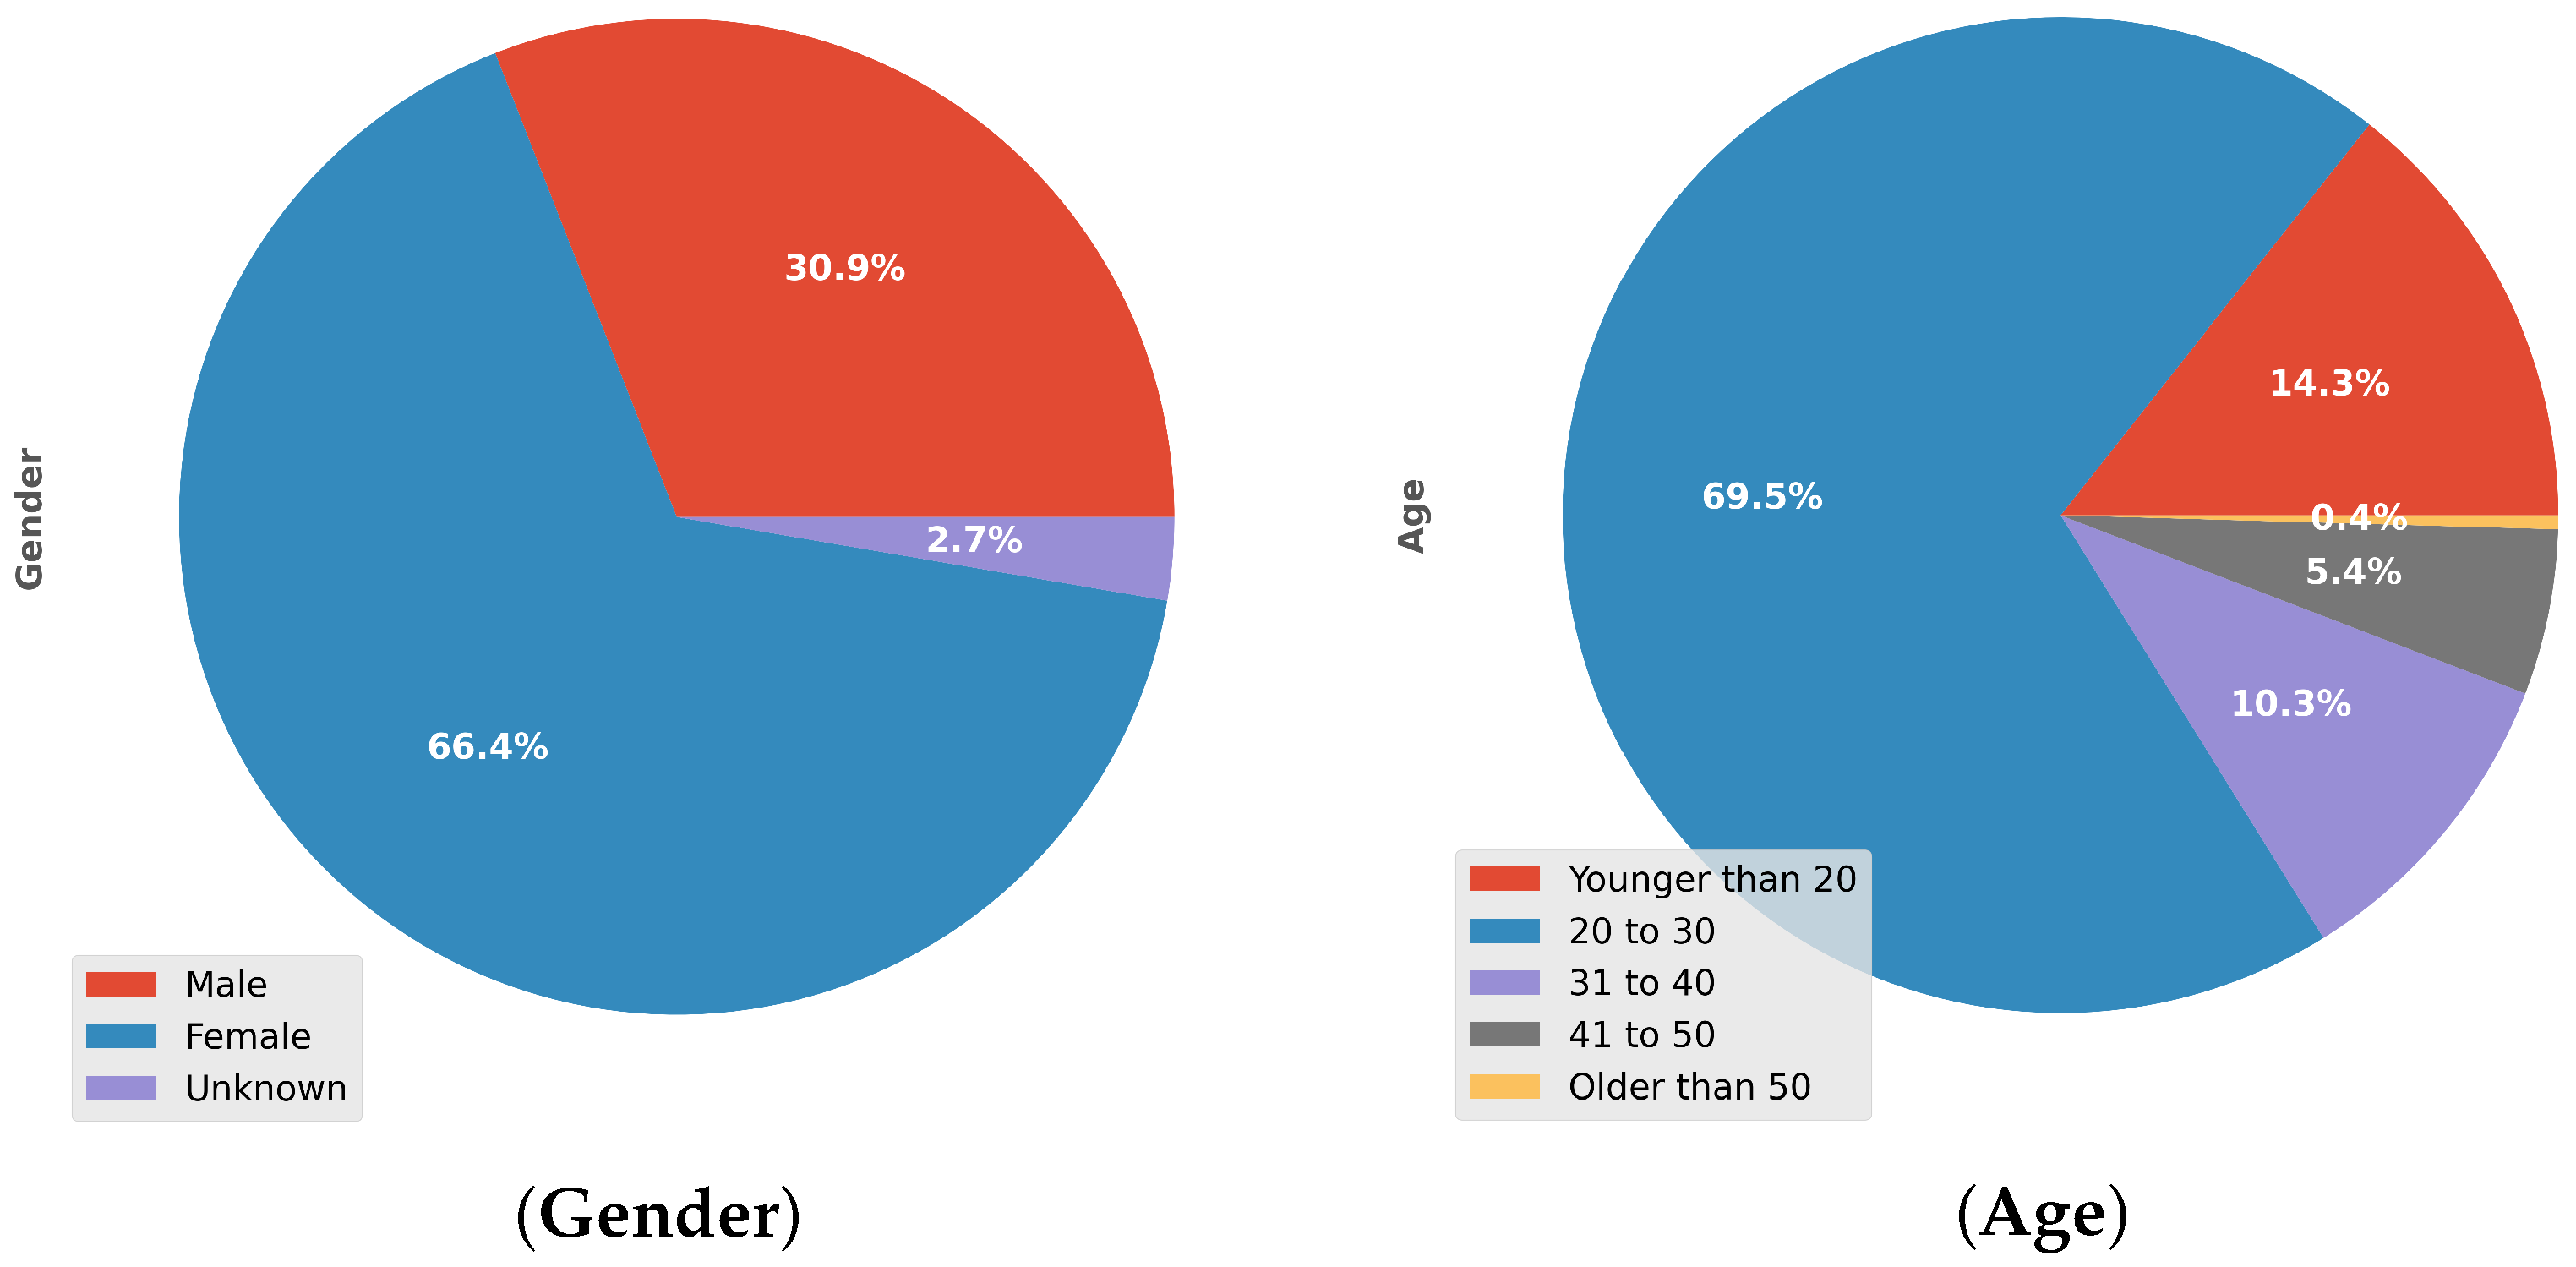
The data set analyzed in this study was derived from a structured electronic form, strategically distributed through social media platforms to university personnel and their extended networks. In total, 223 responses were collected, providing a robust sample with significant gender and age diversity. Of the respondents, 68.4% identified as women, 30.9% as men, and a small fraction preferred not to disclose their gender identity. The age distribution was predominantly concentrated in the 20–30 year range (69.6%), indicating a young cohort with a high probability of digital literacy and modern perspectives on empowerment.
The key demographic variables included gender, age, educational attainment, and employment status. In particular, a substantial portion of the sample had university-level qualifications, reflecting a relatively well-educated pool of participants. The employment status was dominated by students, aligning with the predominance of younger respondents, while income and occupational status varied, further enriching the diversity of the data set.
The sampling method was non-random, employing both convenience and snowball techniques. The process began within university networks and expanded through the social circles of the participants, as mediated by the sharing of social networks. Although this enabled a diverse and sizable response pool, it may skew representativeness toward individuals connected to higher educational environments.
The form addressed a range of themes related to women’s empowerment, including:
- Demographics: Gender, age, educational levels (including those of immediate social circles, parents, siblings, peers, teachers), employment status, and income.
- Socioeconomic status: Income, employment history, and position.
- Perceived gender equity: Attitudes towards gender egalitarianism on the job (remuneration, promotions, recognition) and access to social protection.
- Access to resources: Financial services utilization (e.g., bank/savings accounts, credit cards), legal services, and awareness of rights.
The dataset was designed to support both descriptive and inferential statistical analyzes and was further processed for ML, with numerically encoded categorical responses, and missing values appropriately handled to ensure data integrity. The deidentified dataset and analysis scripts are available via the study repository and upon request from the corresponding author.
Figure 1 shows that the sample is predominantly female (66.4%), with males comprising 30.9% and 2.7% did not reveal their gender, highlighting both a gender imbalance and the inclusion of the data set for non-binary responses. The age distribution, also illustrated in Figure 1, is concentrated in the 31–40 age group (69.5%), with smaller contributions from other age groups, indicating minimal representation for those under 20 years of age.
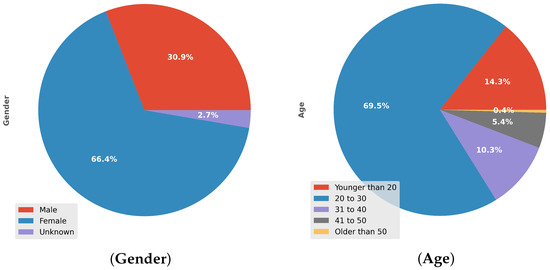
Figure 1.
Pie charts illustrating demographic information of participants based on gender and age.
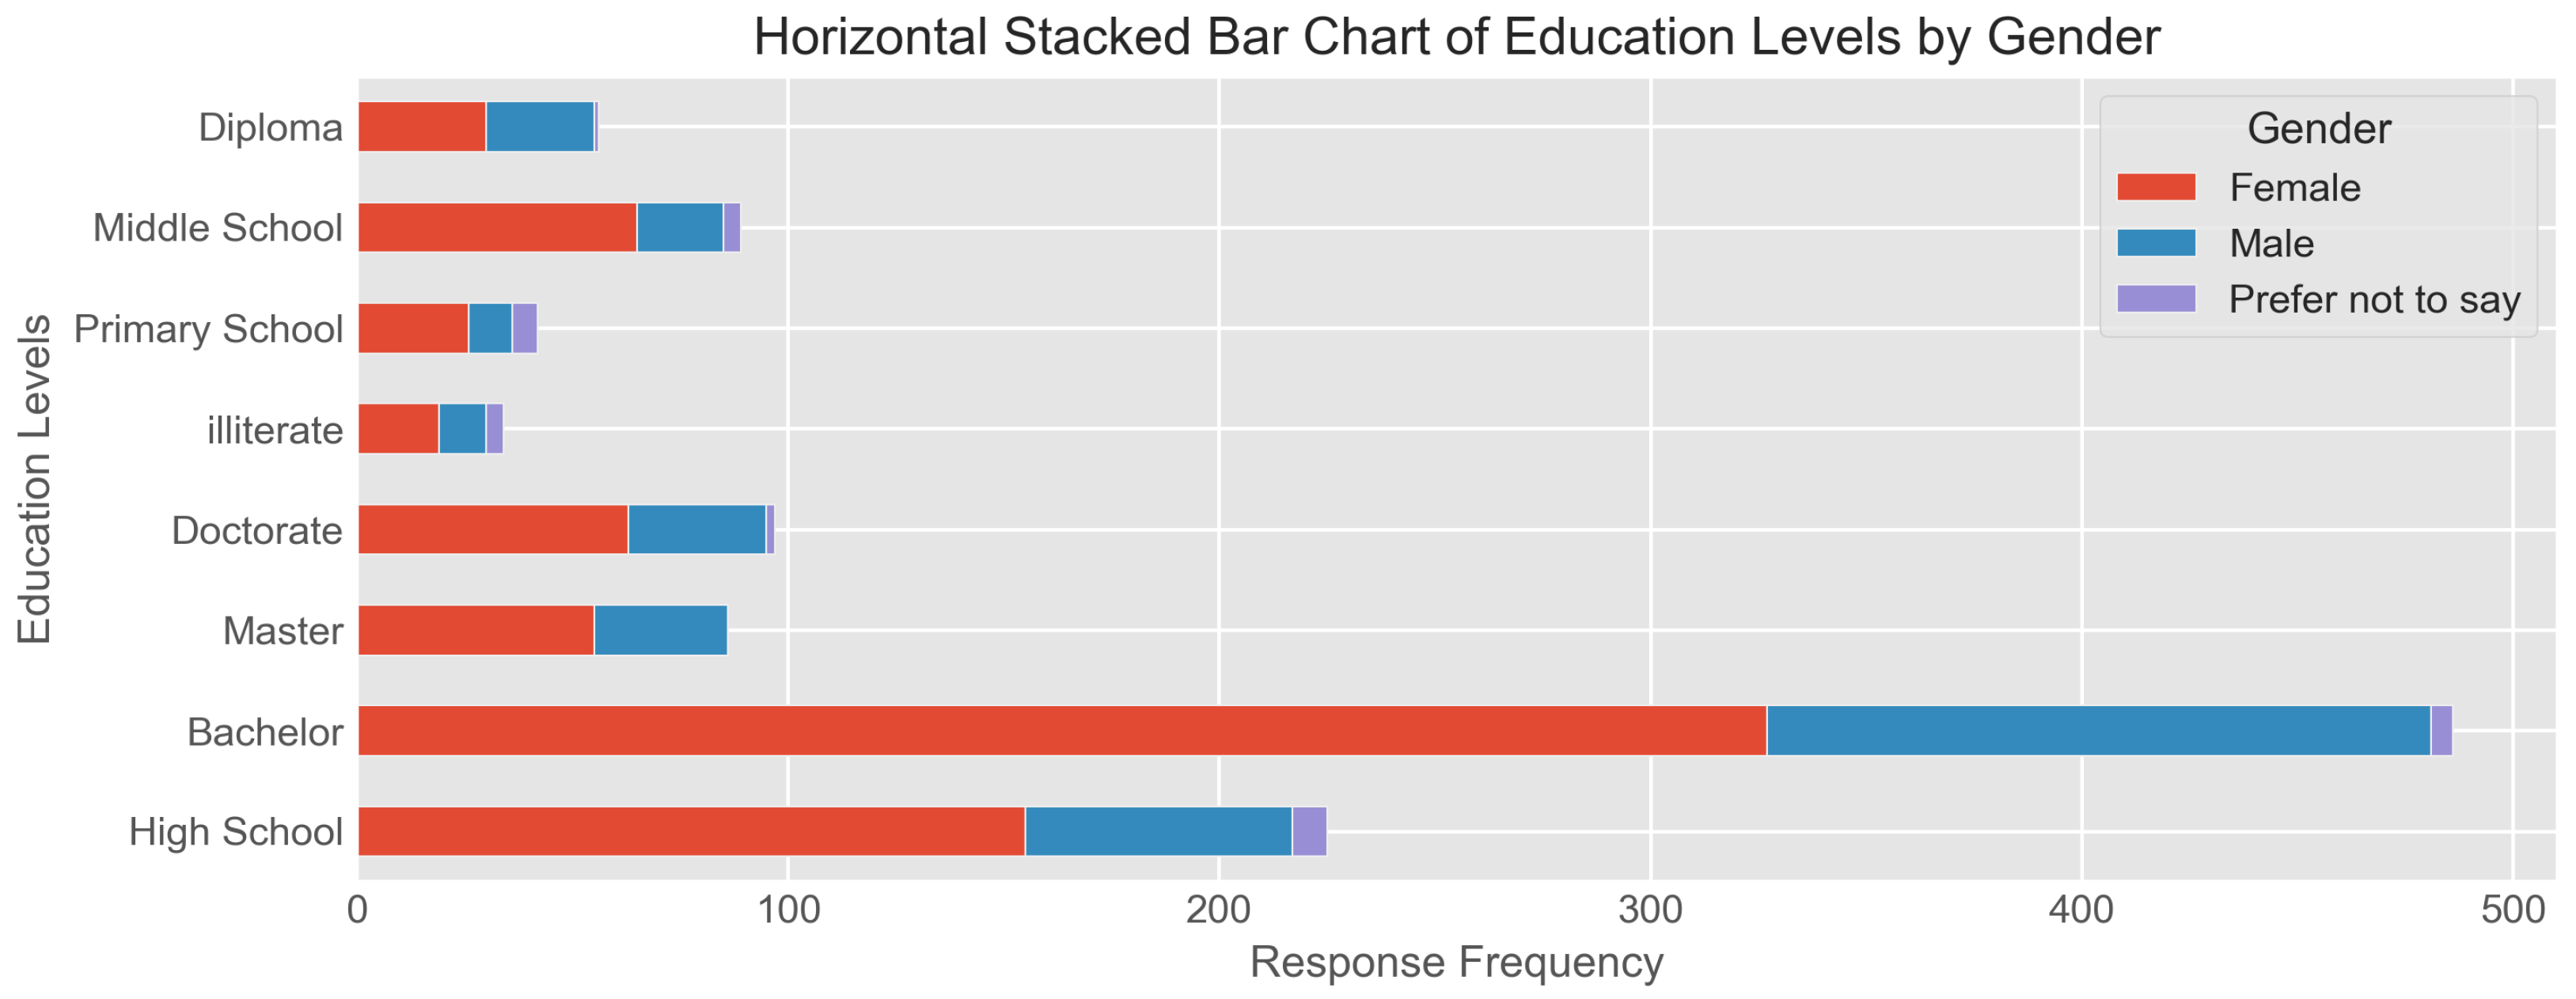
The educational attainment by gender, shown in Figure 2, reveals that the highest proportion of the respondents hold a bachelor’s degree, with subsequent frequencies for high school diplomas and master’s degrees. Doctoral and diploma recipients remain rare across all genders, reflecting potential gaps in higher educational achievement throughout the sample and their immediate networks.
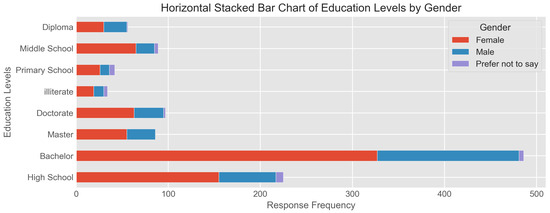
Figure 2.
Stacked bar chart of educational attainment by gender among participants and their social circles (parents, siblings, peers, and teachers).
The variables of economic and employment status encompass income levels, current employment status, duration of work experience, and perceptions of egalitarianism in the workplace with respect to remuneration, promotions, and recognition. As shown in Table 1, women report disproportionately lower incomes and higher rates of ‘not applicable’ status (student or unemployed). Employment data indicate a high prevalence of students (especially women) and more men in government and private sector jobs, mirrored by men’s higher rates of 3–5 and 10+ years of experience. Such distributions offer substantial information on socioeconomic disparities and gendered career trajectories.

Table 1.
Demographic information of participants based on income, employment status, and experience.
Perceptions of gender egalitarianism in the workplace, summarized in Figure 3, generally tend towards the belief in equity in respect to pay, opportunities, promotions and recognition, although notable proportions report perceiving inequity or expressing uncertainty, especially among those with irregular employment status.

Figure 3.
Horizontal stacked bar chart displays the distribution of responses to various questions about gender egalitarianism in the workplace, segmented by employment and economic status.
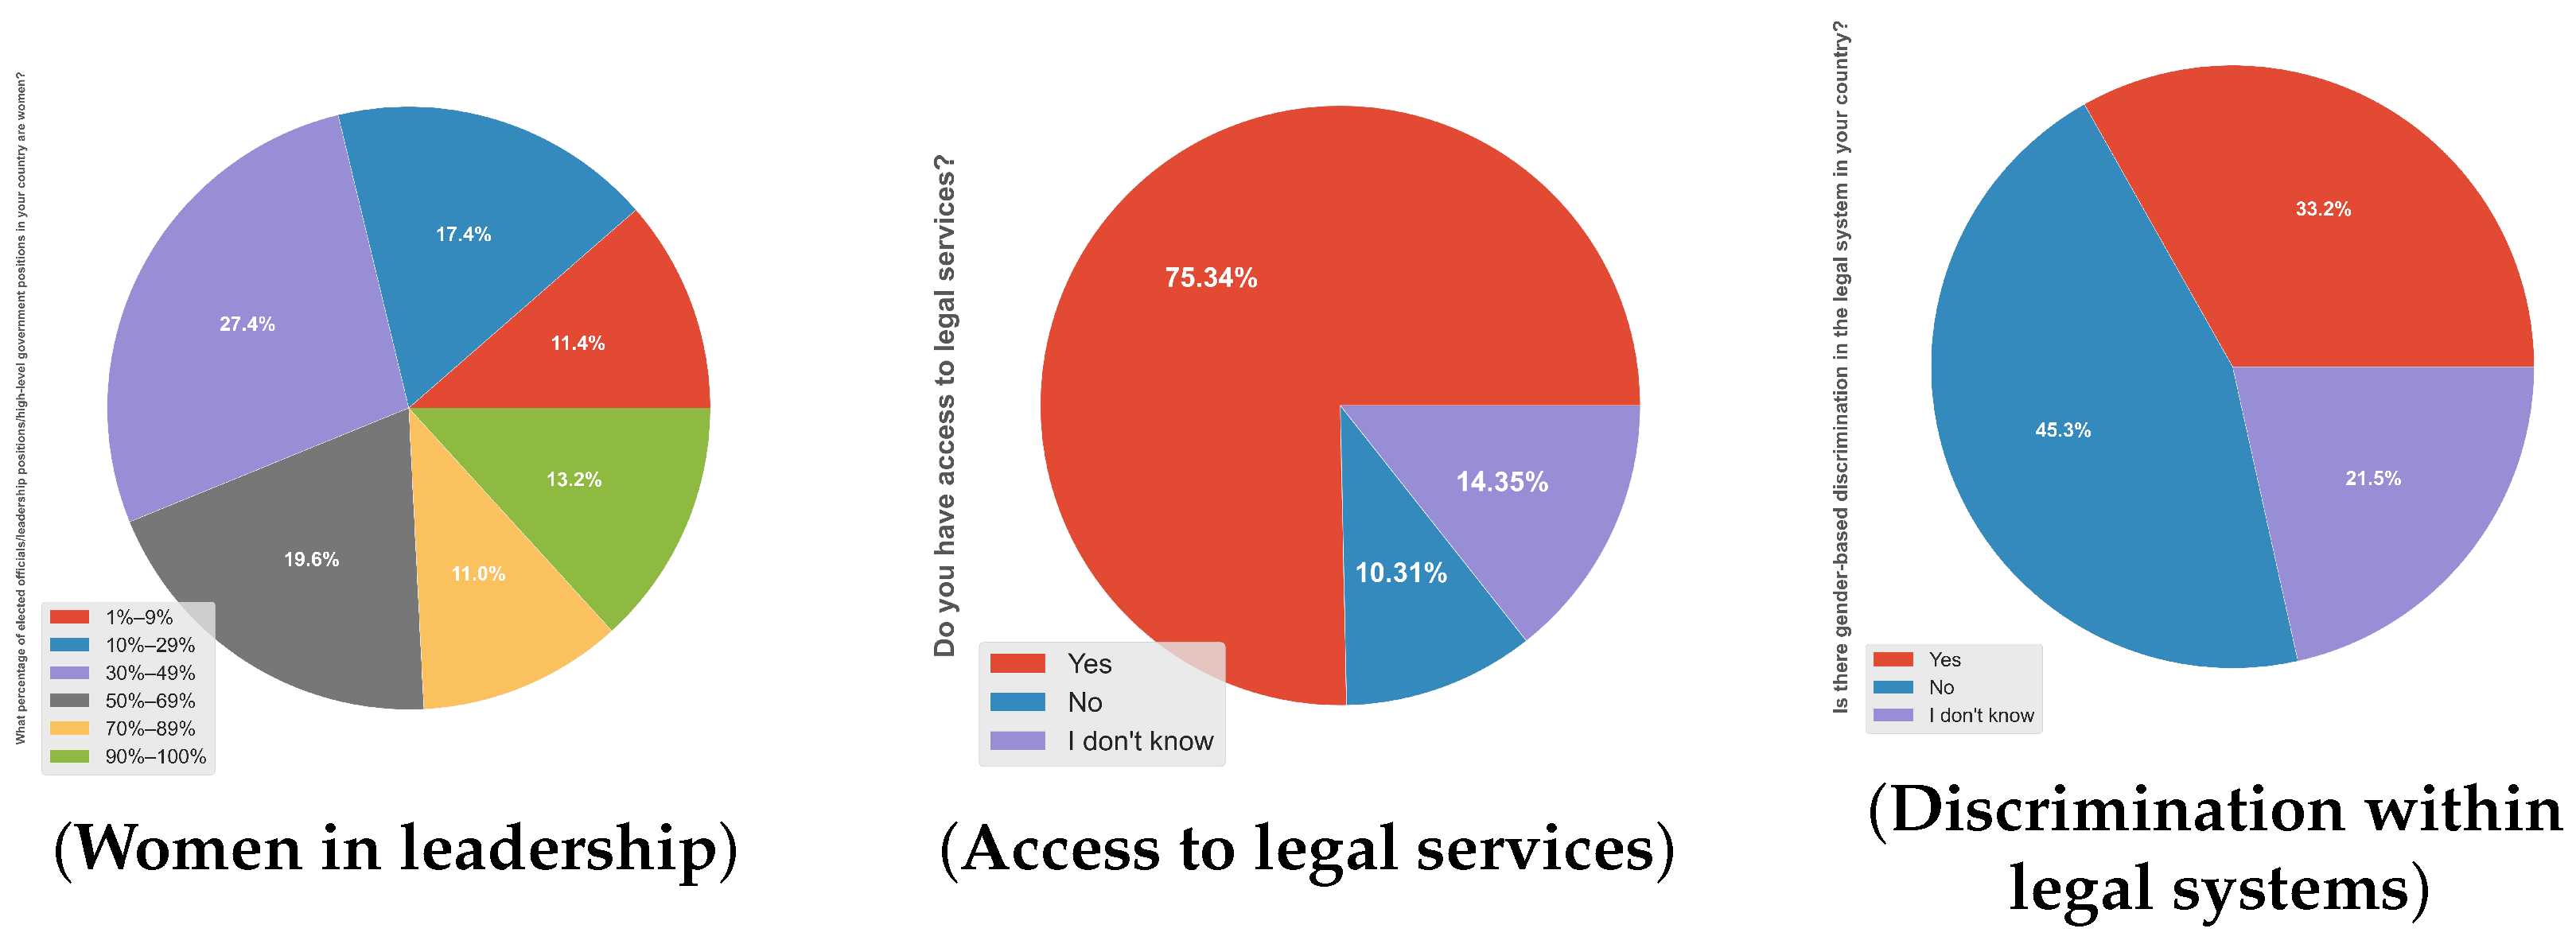
Political empowerment and participation are examined through self-reported estimates of women’s representation in elected and high-level government roles, as well as awareness of support organizations or initiatives in key sectors. According to Figure 4, there is striking variability in perceptions of women’s leadership: 27.4% of respondents estimate 70–89% representation, while 19.6% perceive only 1–9%. The same figure also records public opinion on access to legal services (with 75.3% indicating access) and the perceived prevalence of gender-based discrimination in legal systems, for which opinions are sharply divided.
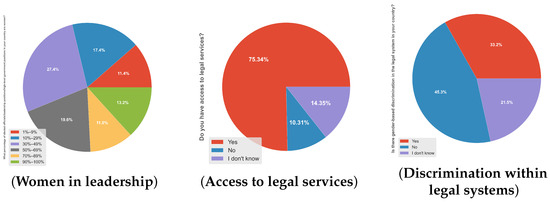
Figure 4.
Public perceptions about gender representation and discrimination, indicating varied beliefs on systemic fairness issues and women’s participation in high-level governance roles.
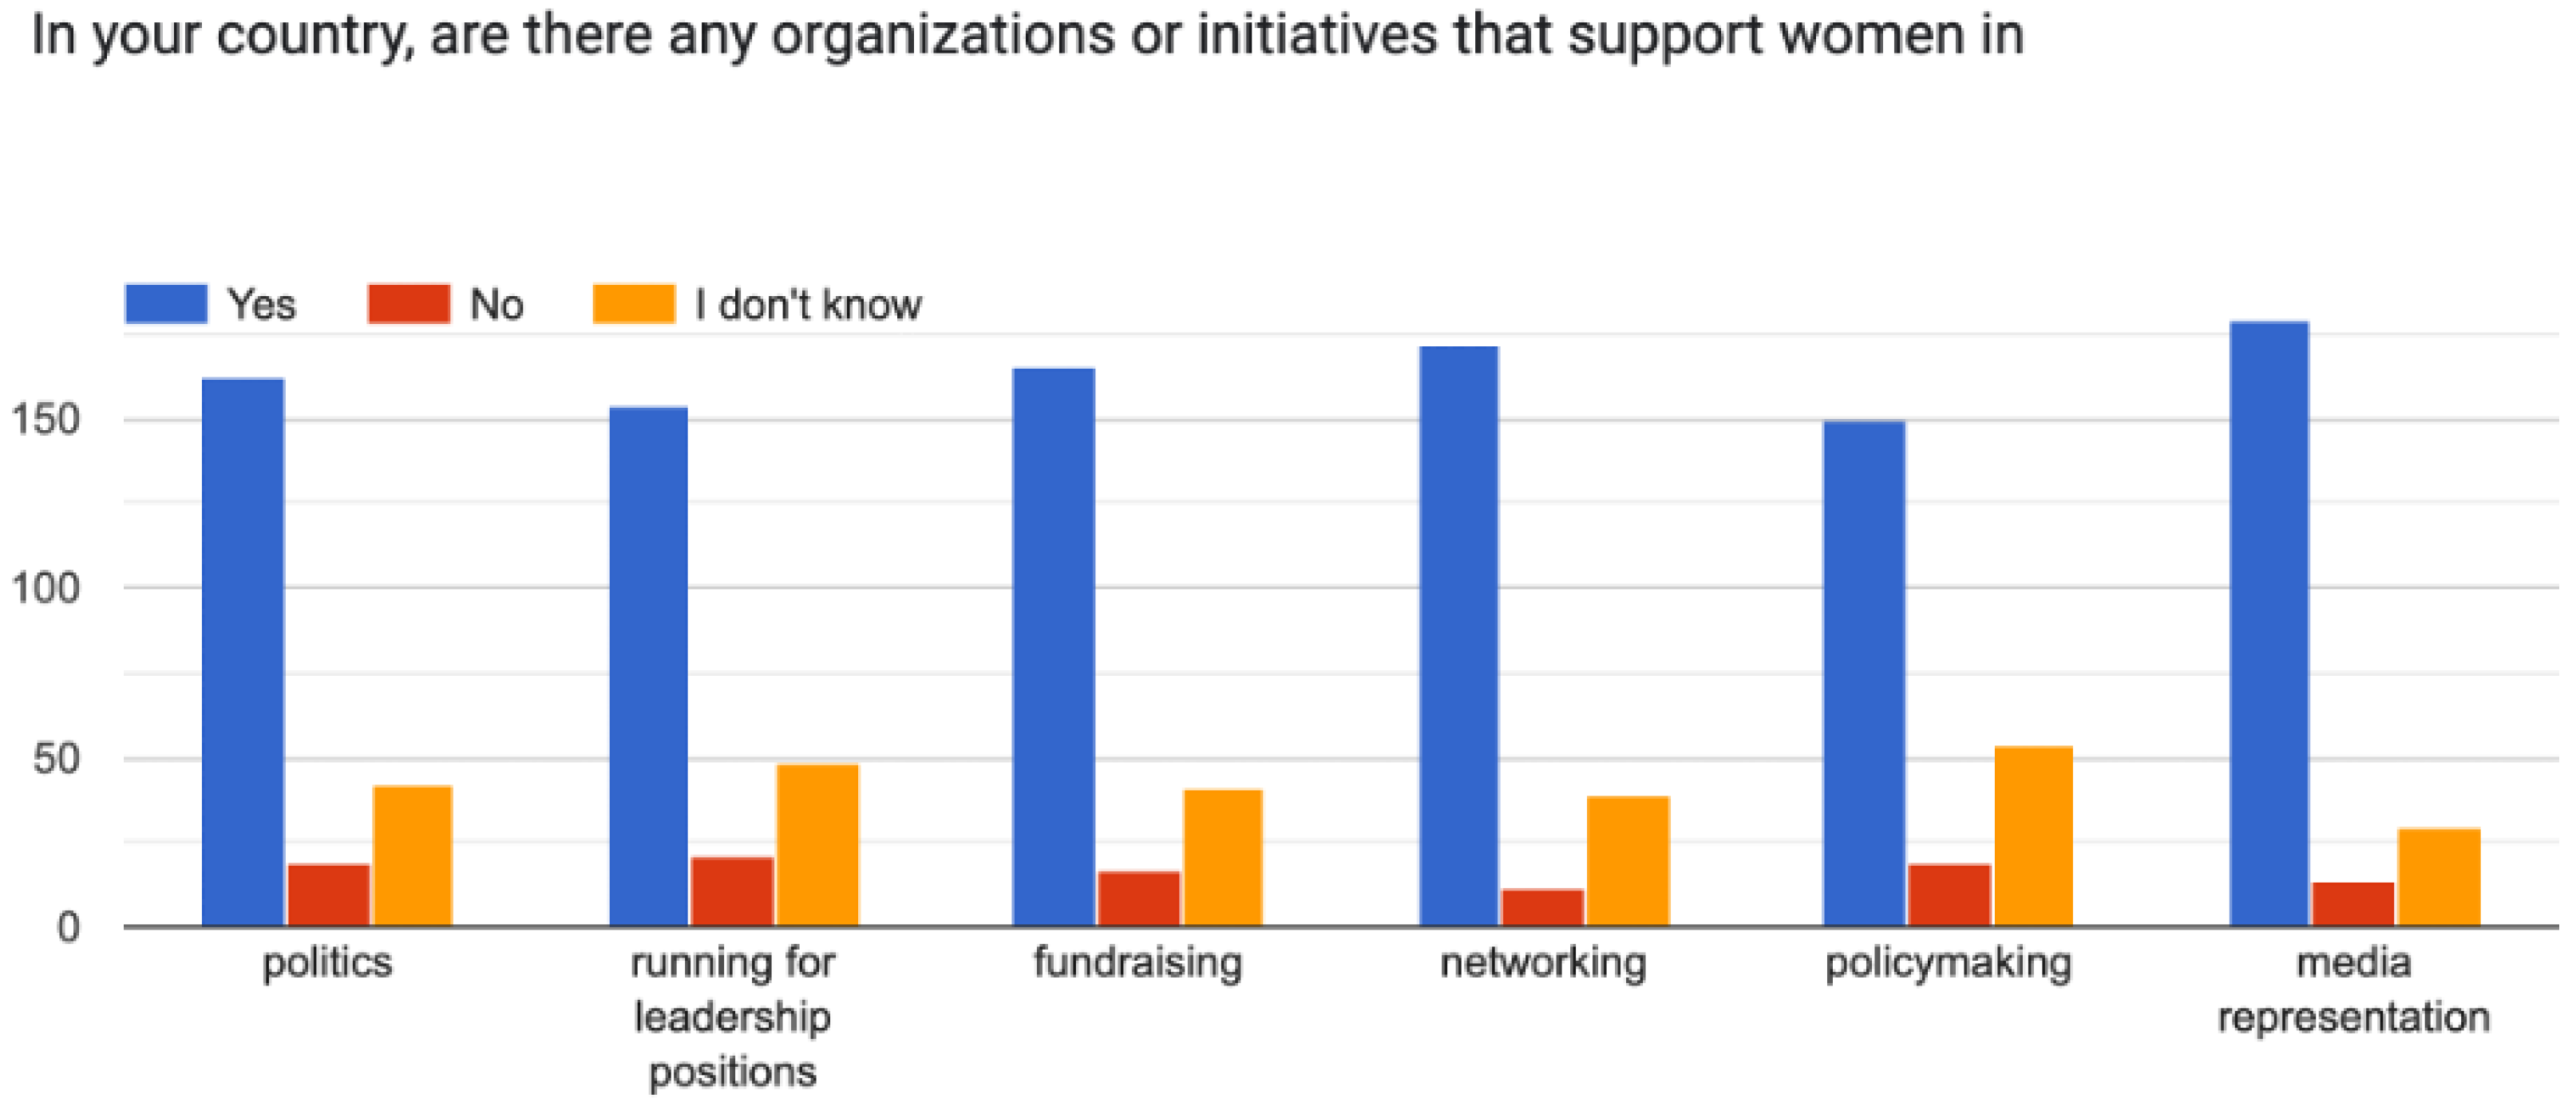
Furthermore, Figure 5 shows that while many respondents recognize organizations that support women in politics, leadership, fundraising, policymaking, media, and related fields, a significant fraction remain unaware, which highlights the need to increase visibility and impact of such initiatives.
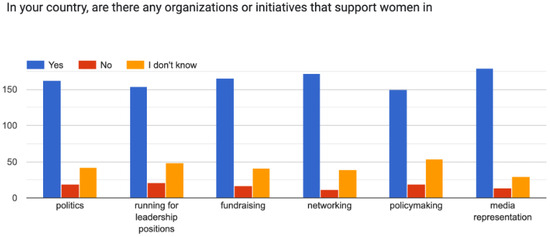
Figure 5.
Bar graph showing awareness of organizations and initiatives supporting women in various sectors such as politics, leadership positions, fundraising, networking, policymaking, and media representation.
Financial inclusion, an essential facilitator of economic empowerment, is interrogated through questions about access to financial resources such as bank and savings accounts, credit cards, loans, mobile money, digital wallets, prepaid cards, financial advisors, and financial literacy. Figure 6 indicates high self-reported access to bank and savings accounts and mobile money, but reveals significant gaps in access to financial advisors and literacy programs, underscoring areas for policy and programmatic attention.

Figure 6.
Bar chart illustrates respondents’ access to various financial services, showing high availability of bank accounts, savings accounts, and mobile money, with visible disparities in access to financial advisors and literacy programs.
The data set also contains measures on technological accessibility, documenting both the availability and frequency of use of digital devices and the Internet, which are increasingly critical to equitable participation in education and the economy in a digitally interconnected world.
Social services are assessed through ratings of their availability, quality, cost, and ease of access, with an additional focus on gender disparities in provision, uptake, and management. These subjective perceptions are vital for evaluating the equity and effectiveness of the existing infrastructure.
Cultural and social norms are elucidated by evaluating agreement with statements about women’s rights and freedoms, including the right to work, engage in politics, make decisions independently, and other essential markers of social equity. This allows for a subjective and collective understanding of the constraints and drivers of empowerment.
Finally, to uncover actionable barriers and enablers, participants provide opinions regarding what society supplies, or should supply, to promote or hinder women’s advancement in economic, political, and social spheres. This direct feedback is invaluable for informing targeted interventions and institutional reform.
3.6. Research Questions
The goal of exploring women’s empowerment presents an opportunity to explore various socioeconomic factors that influence women’s lives and social roles. Although the data gathered offer potential for a broader analysis, this study will focus on three specific research questions that are poised to significantly advance our understanding and yield new insights.
- (R.Q.1) How do educational attainment levels among women influence their participation in the labor market and entrepreneurial activities?
- (R.Q.2) What barriers to accessing financial services do women face and how do such barriers affect their financial independence?
- (R.Q.3) What role does access to legal services and awareness of legal rights play in empowering women?
3.7. Data Preprocessing
We implemented various data preprocessing and modeling techniques to ensure robust analysis of the dataset. Using the bootstrap method, confidence intervals for model accuracies were computed to assess the reliability of the prediction. Categorical variables, including gender and financial attributes, were assigned to numeric formats based on domain-specific knowledge and content analysis, ensuring accurate interpretation. Missing data were managed using mean imputation, under the assumption of randomness, preserving completeness without significant bias. Data coding involved converting all variables to numeric scales and handling missing values with fillna() in pandas.
The hyperparameters as shown in Table 2 for RF and SVM models were tuned using GridSearchCV. RF hyperparameters included n_estimators, max_depth, min_samples_split, and min_samples_leaf, while SVM configurations such as C, kernel, gamma, and class_weight were optimized. The radial basis function (RBF) kernel was chosen for its ability to handle non-linear relationships, and gamma was set to scale for adaptable boundary formation.

Table 2.
Hyperparameters for RF, SVM, MLP, and Logistic Regression Models.
For Logistic Regression, max_iter was set to 1000, allowing sufficient iterations for solver convergence. Default parameters, like the solver choice, were utilized for optimal algorithm selection. In the Multilayer Perceptron (MLP) model, hyperparameters included single-layer size of 100 neurons, relu activation, adam solver, 200 maximum iterations, and a seed random_state of 42 for reproducibility. These configurations serve as initial standards for model evaluation, with potential for further refinement.
The ethical application of ML models was prioritized by employing methodologies that harmonize with empowerment constructs. Techniques such as RF, SVMs, and Neural Networks were selected based on their capabilities for interpretative transparency and high predictive accuracy. To address class imbalances, resampling was conducted using the synthetic minority over-sampling Technique (SMOTE) and re-weighting was performed with cost-sensitive learning strategies. Group fairness was evaluated utilizing metrics such as disparate impact and equalized odds. To enhance transparency, Explainable AI tools, including Local interpretable model-agnostic explanations (LIME) and shapley additive explanations (SHAP), were employed to clarify model decisions. This approach not only reinforced stakeholder trust but also informed ethical policymaking.
3.8. SDG5 Mapping
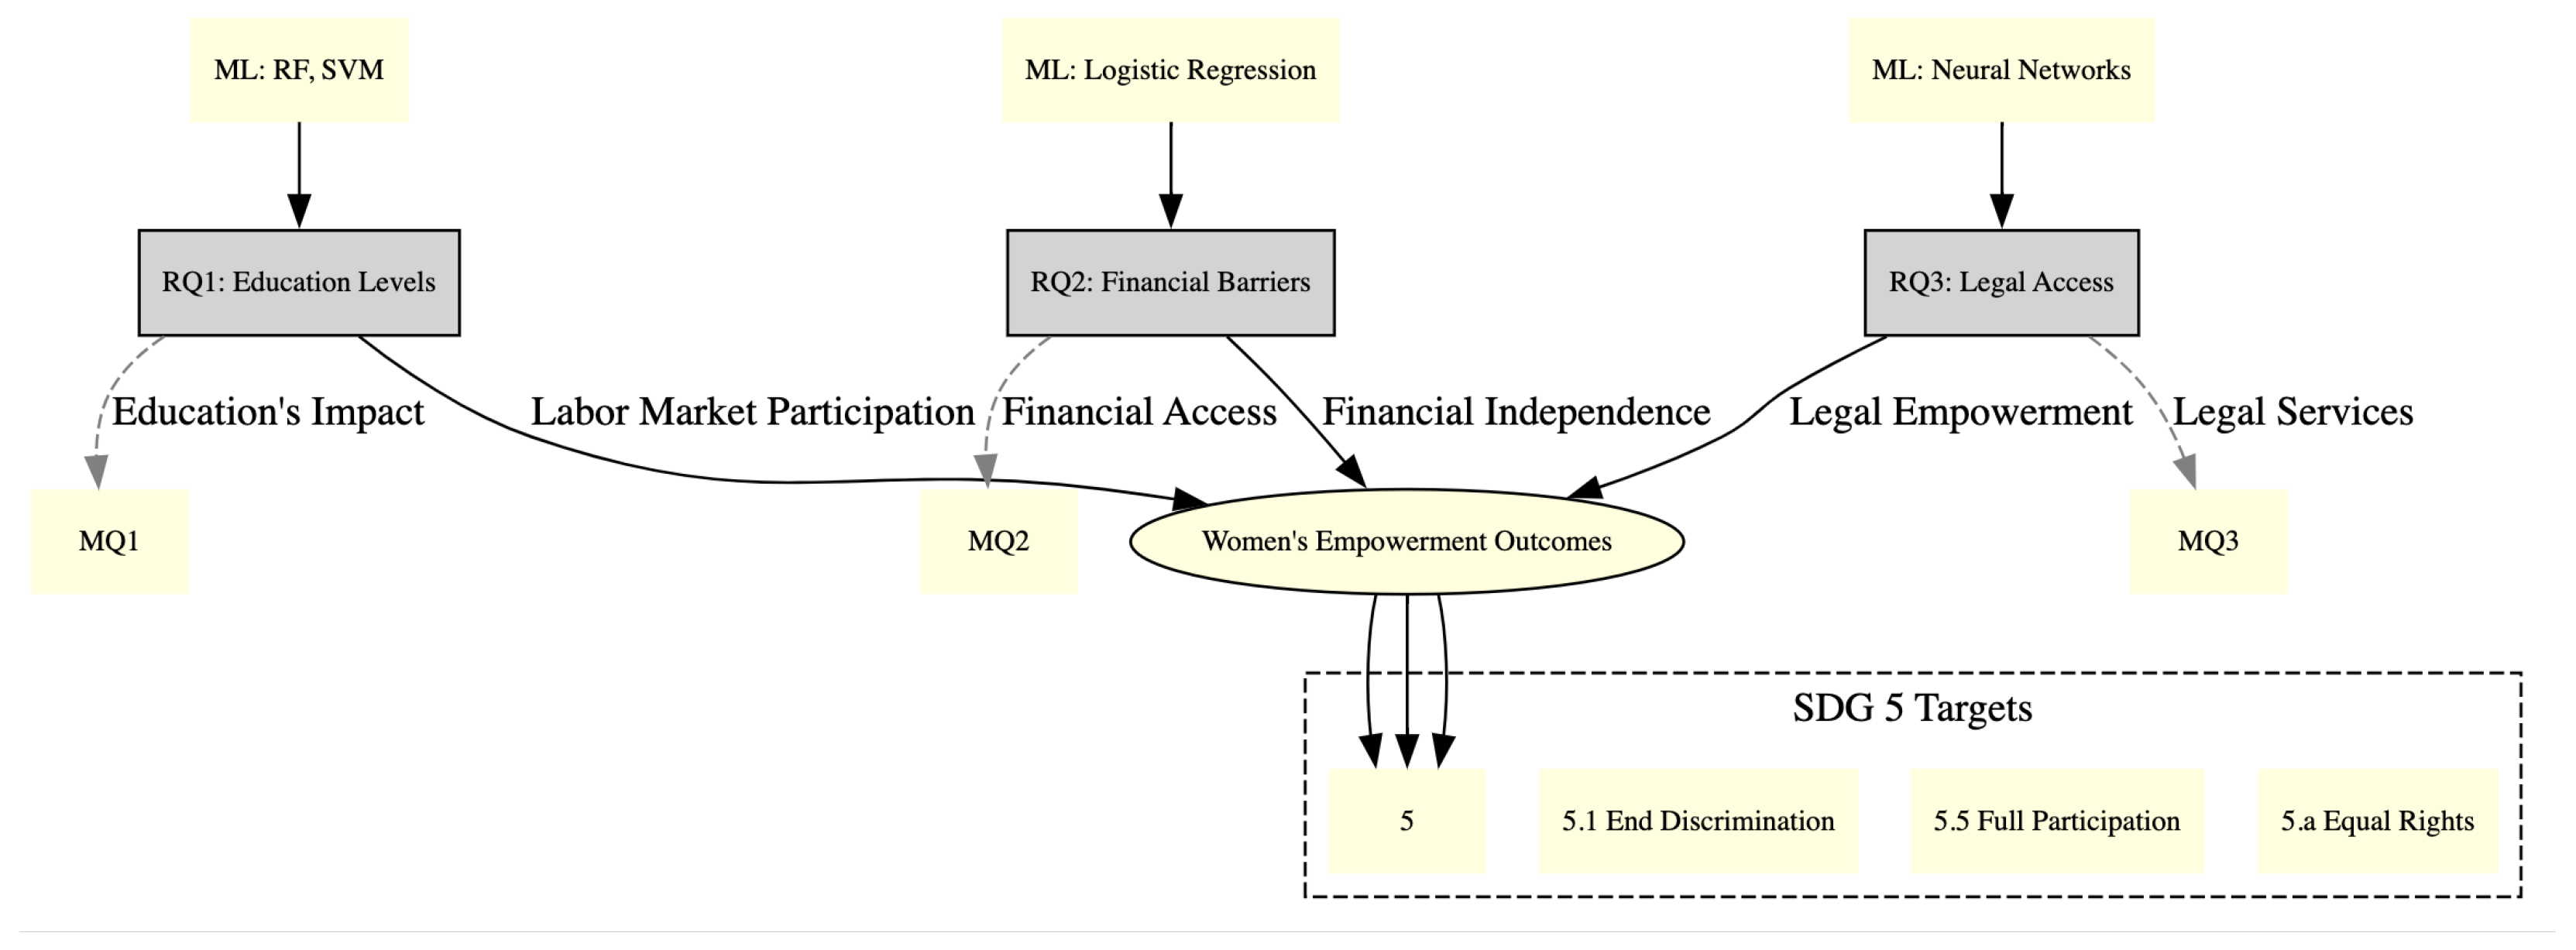
This section delineates the pathways through which the study’s predictors relate to women’s empowerment outcomes, pertinent to SDG5. Figure 7 represents the theory of change, illustrating the role of different predictors—education levels, financial access, and legal rights—in influencing empowerment outcomes such as labor market participation and economic independence. The integration of machine learning models, including RF, SVM, and Neural Networks, highlights the data-driven insights that inform policy adaptation and strategy. These models enable the identification of key variables and causal pathways, aligning with specific SDG5 targets such as 5.1 (End Discrimination), 5.5 (Full Participation), and 5.a (Equal Rights). Table 3 delineates the relationship between our research inquiries and the respective SDG targets, in addition to detailing the metrics and anticipated mechanisms involved.
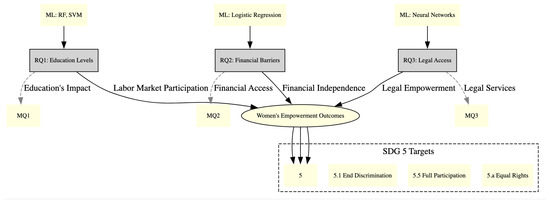
Figure 7.
Theory of change: pathways to women’s empowerment and SDG5 outcomes.

Table 3.
Mapping of SDG5 to research questions R.Qs.
4. Results and Evaluation
In this section, we conduct a thorough analysis of the complex factors influencing women’s participation in economic and social structures. This investigation directly addresses the primary research questions previously outlined, ensuring that each element of the analysis is meticulously aligned with the study’s objectives.
4.1. Educational Empowerment and Economic Participation
Research Question (R.Q.1): How do educational attainment levels among women influence their participation in the labor market and entrepreneurial activities?
The study investigates the role of education as a fundamental catalyst for economic empowerment. Through the application of statistical analysis alongside ML techniques, the research systematically examines patterns and relationships within the data to elucidate the impacts of educational attainment on economic activities.
4.1.1. Model Development for Educational Attainment
To facilitate ML analysis, categorical attributes are systematically transformed into numerical representations. The Gender variable is encoded as:
Education levels are assigned an ordinal scale, with values ranging from to ; this preserves the inherent ordering of educational attainment. Employment status similarly receives structured codes, from to , while professional experience is represented as an increasing integer scale, with 0 for ‘Less than a year’ to 4 for ‘More than 10 years’:
Entries marked as ‘Not Applicable’ are set to . Binary responses such as Yes/No are mapped as 1 (Yes) and 0 (No), with ambiguous or missing responses set to NaN. For Likert-scale agreement items, responses span (‘Totally disagree’) to 2 (‘Totally agree’), enabling quantitative sentiment analysis.
Feature vectors are subsequently normalized using z-score standardization to enforce zero mean and unit variance for each feature, assuming approximately Gaussian distributions:
where is the value of feature j for observation i.
The processed data are then partitioned into training and testing subsets via stratified random sampling, assigning to the training set and to the test set . A fixed random seed is used to ensure reproducibility.
The implemented classification models include RF and SVM algorithms. In FR, a set of T independently trained decision trees are constructed, and predictions aggregated by majority vote:
This ensemble approach mitigates overfitting and improves classification robustness. The SVM is initialized with a linear kernel, defined by the decision function:
where and b are optimized to maximize the margin between classes. If linear separability is not achieved, an RBF kernel,
is used to capture nonlinear relationships in feature space.
4.1.2. Graphical Data Visualization for Educational Attainment
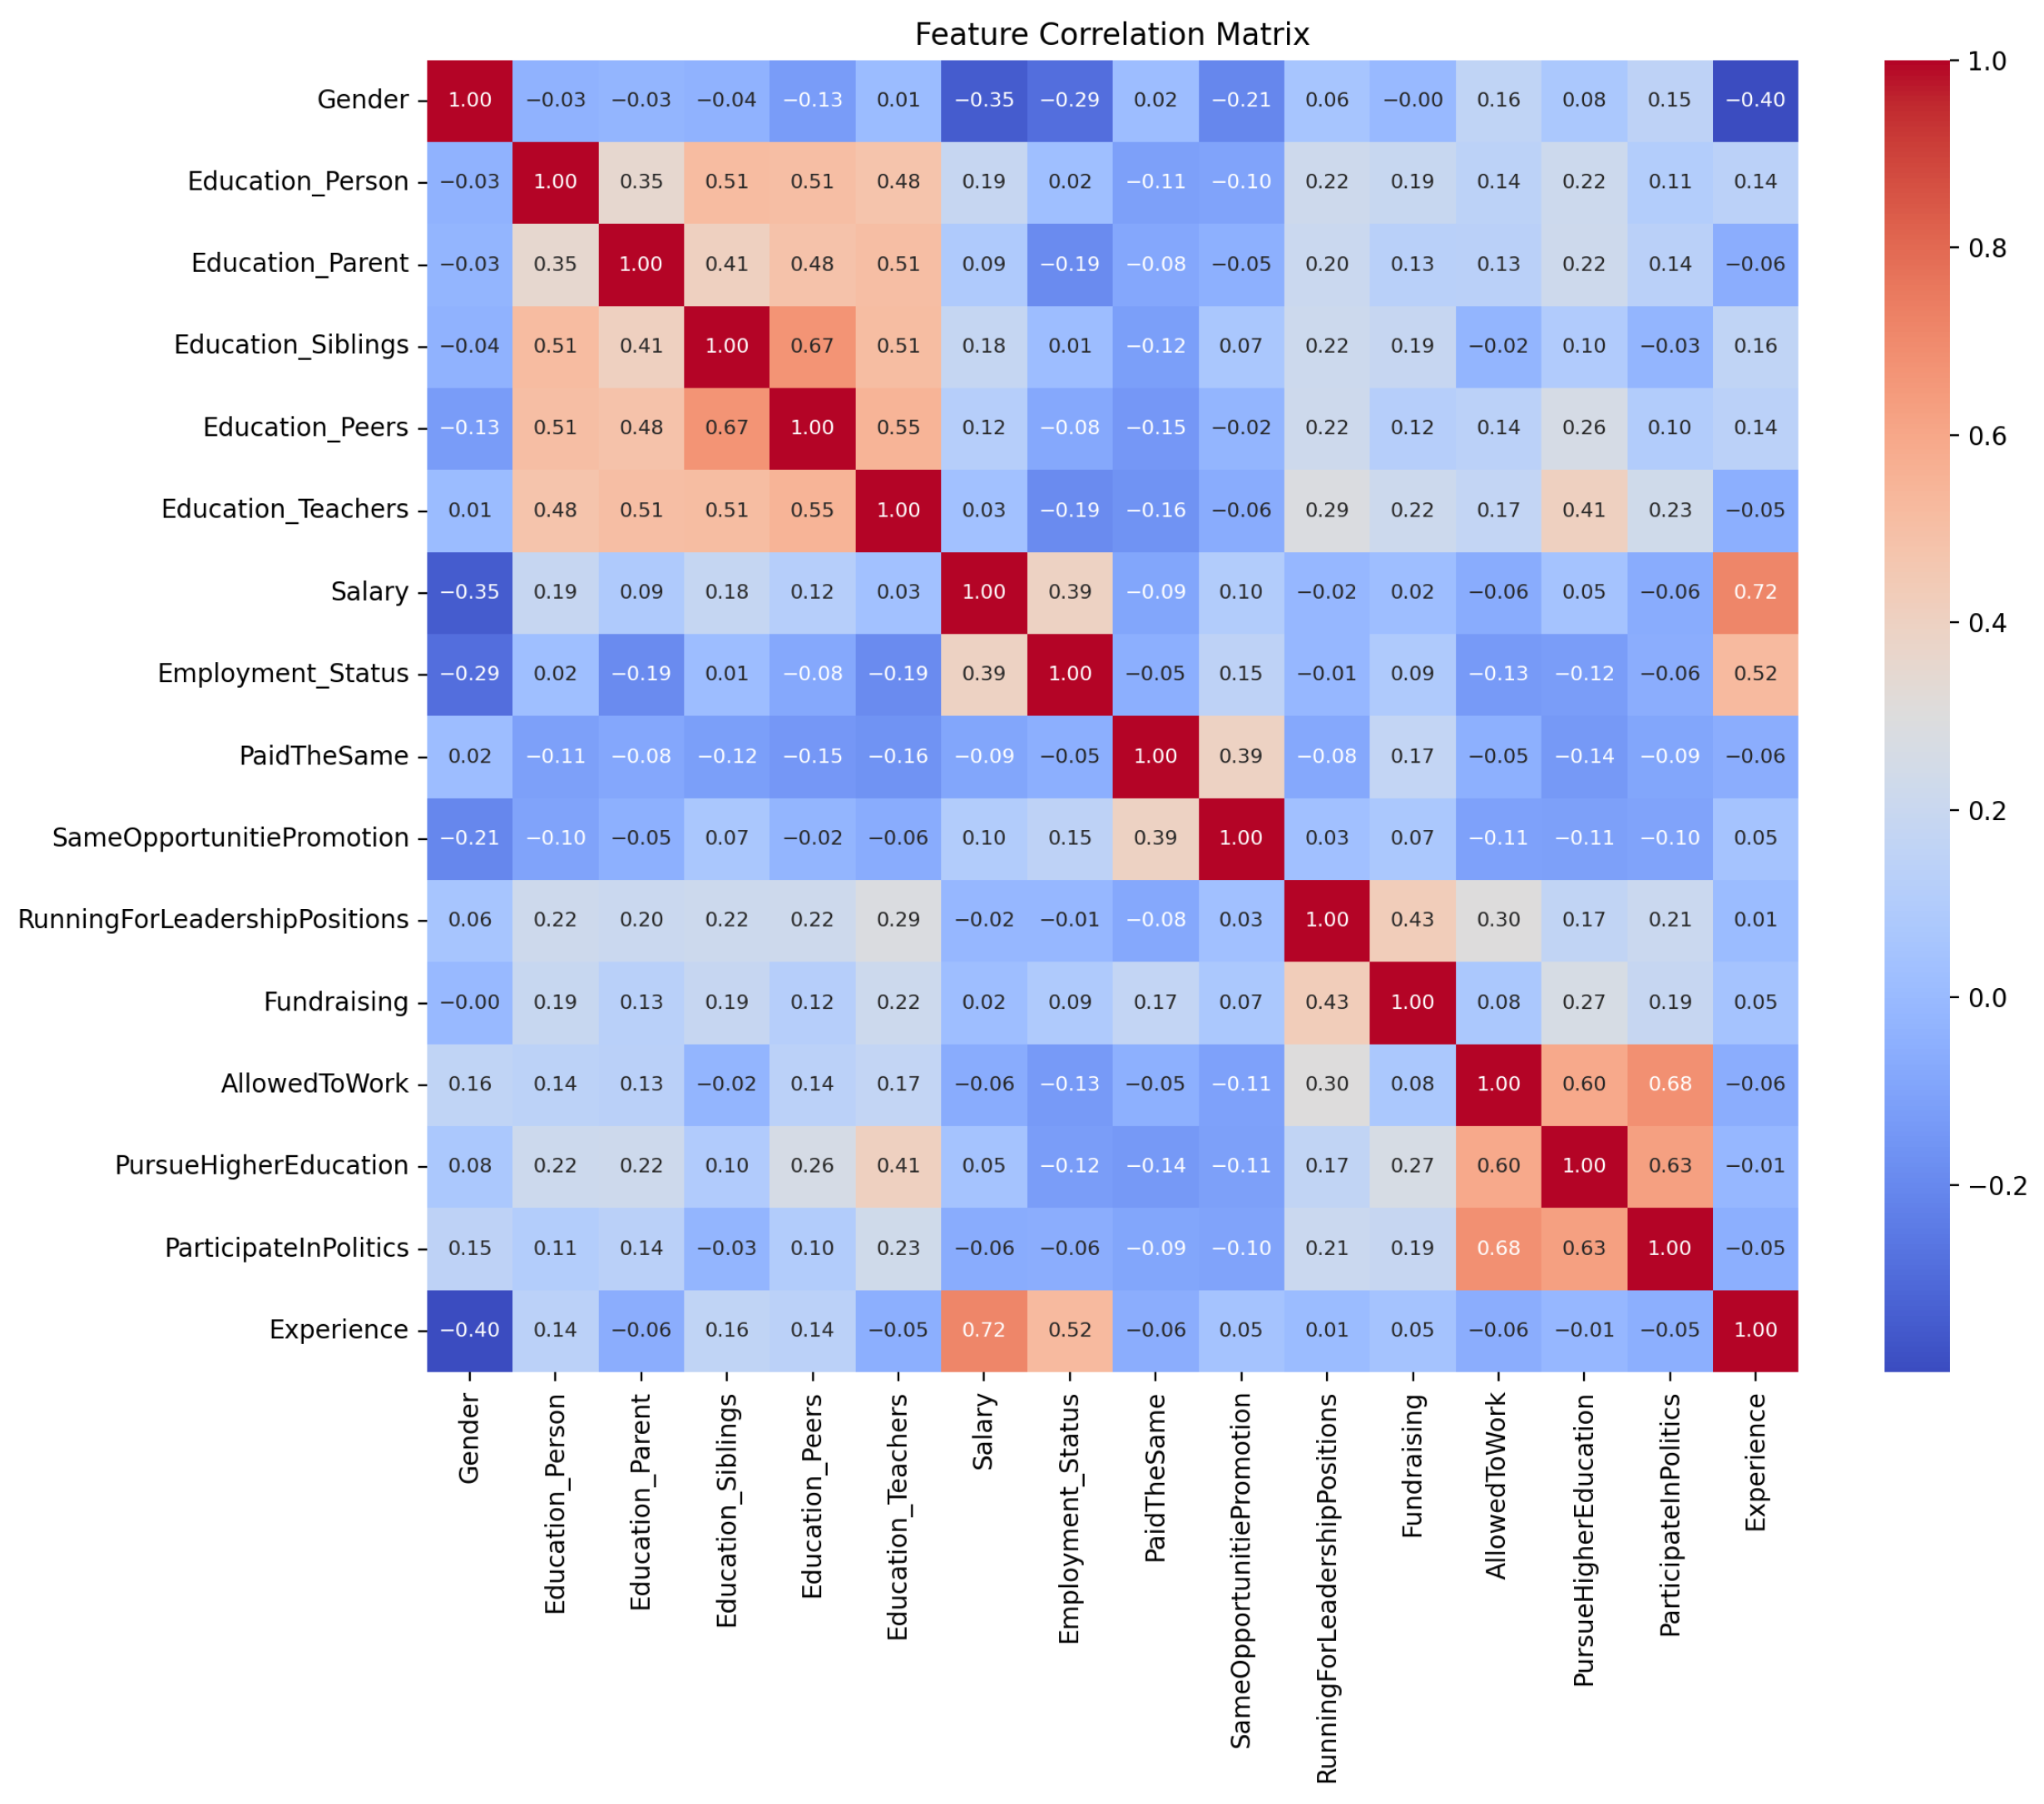
The study employs advanced data visualization to highlight key aspects of the dataset, focusing on women’s education levels and feature interdependencies. A count plot displays education levels from illiteracy to doctorate, offering a clear view of educational demographics. Next, a correlation matrix quantifies linear relationships and a heat map illustrates these with a divergent color scheme to differentiate positive and negative correlations. Correlation coefficients are shown to two decimal places for precision, enhancing clarity and readability. This visualization clarifies relationships and reveals patterns relevant to research. The Pearson correlation coefficient ranges from −1 to +1, with +1 indicating a perfect positive linear relationship, −1 a perfect negative relationship, and 0 no correlation.
The Pearson correlation coefficient, central to this analysis, is mathematically expressed as:
where represents the correlation coefficient between variables X and Y; denotes the covariance; and and signify the standard deviations of X and Y, respectively.
Figure 8 shows the Pearson correlations among the personal, educational, and employment characteristics of women. High correlations appear in educational attributes, indicating alignment in personal and social circles. In addition, moderate to strong positive correlations are found in workplace fairness perceptions and political participation, suggesting areas for further analysis. Correlation Heatmap displays relationships among various features such as education and employment, which parallel correlations found in studies such as Pal et al. [41] (India) and Maru’s review [45]. These correlations illustrate shared global patterns of empowerment drivers despite regional differences.
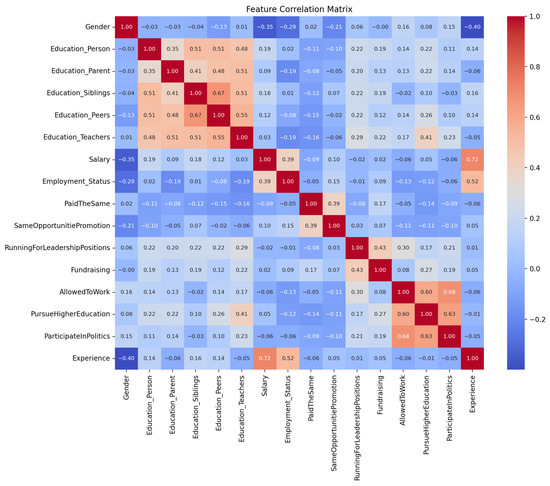
Figure 8.
Correlation heatmap showing the relationships between various educational, employment, and perception features among women. Each square denotes the Pearson correlation coefficient, providing insights into the degree of linear association between pairs of variables.
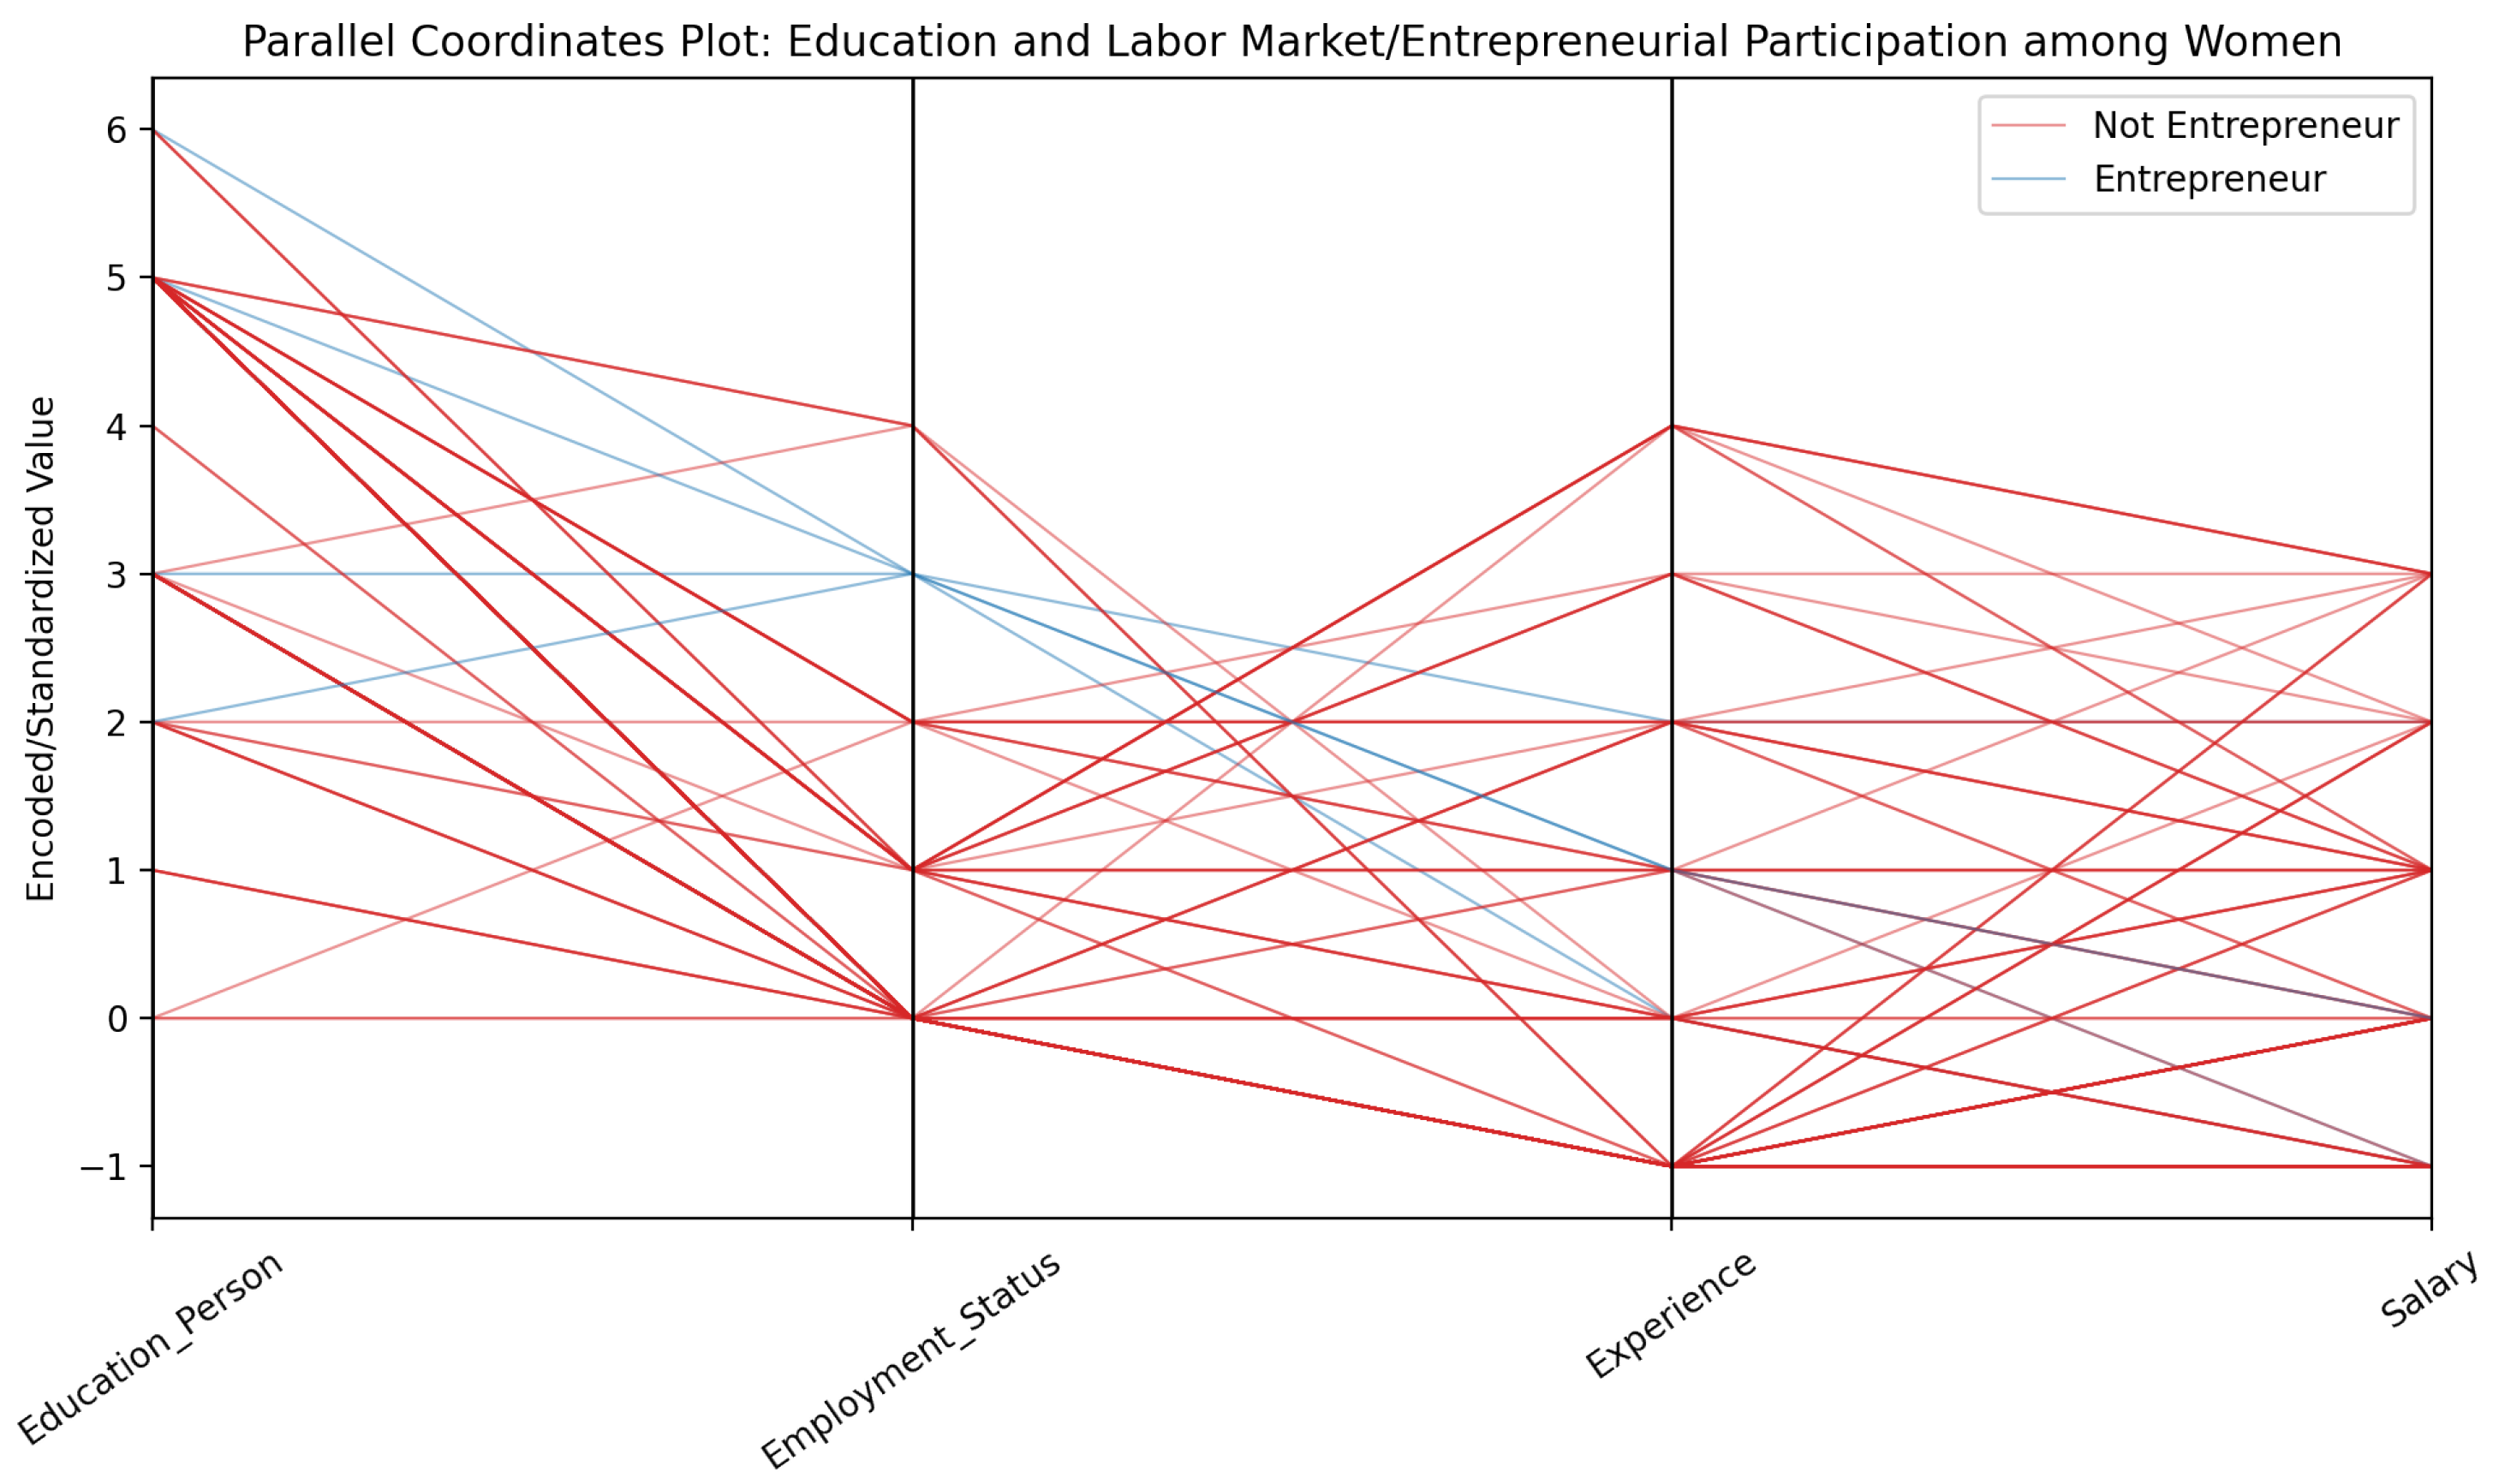
Figure 9 is a parallel coordinates plot showing the link between women’s education and their labor market or entrepreneurial status. Each line represents a woman, capturing her education, job status, experience, and salary. Lines are color-coded: blue represents entrepreneurs (self-employed) and red represents non-entrepreneurs. While both groups vary in education and experience, entrepreneurs cluster at specific education and salary levels, whereas non-entrepreneurs are more spread out. This visualization helps identify patterns, like if entrepreneurs have higher education or differing salaries than other workers. The Parallel Coordinates Plot identifies distinct educational influences on entrepreneurial status, demonstrating patterns similar to those observed in studies by Braverman-Bronstein et al. [36] in Latin America.
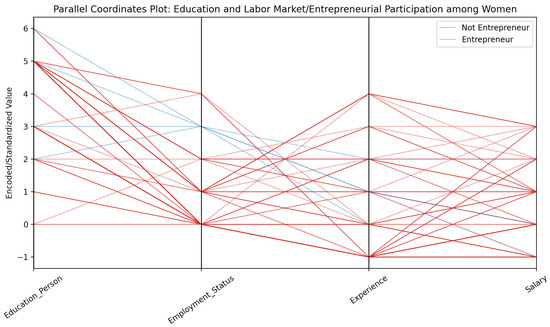
Figure 9.
Parallel Coordinates Plot showing how educational attainment among women relates to their labor market participation and entrepreneurial activity. Each line corresponds to a female respondent, with entrepreneurial status distinguished by color. This visualization facilitates the identification of associations between education level, employment status, work experience, and salary specifically for women.
These insights into empowerment facilitate a comparative analysis with findings from various regions, thereby enhancing the contextual comprehension of women’s empowerment dynamics. By correlating these visual analyses with empirical studies outlined in Section 5.4, this research elucidates the intricate regional distinctions and shared empowerment pathways that can inform policy and strategy formulation.
4.1.3. Model Evaluation for Educational Attainment
The assessment of the models, particularly the Random Forest and SVM classifiers, yields important insights into the impact of educational attainment on women’s participation in the labor market. The Random Forest model attained an overall accuracy of 89% as illustrated in Table 4, with precision and recall metrics reflecting strong classification performance across various experience categories. Significantly, the experience code −1 was flawlessly classified, highlighting the model’s adeptness in recognizing individuals with non-applicable experience levels.

Table 4.
Summary of classification performance metrics by experience categories using Random Forest model.
Model performance is evaluated using metrics such as precision, recall, and F1-score:
where , , and represent true positives (TP), false positives (FP) and false negatives (FN), respectively.
In contrast, Table 5 illustrates the SVM classifier’s performance, demonstrating an enhanced overall accuracy of 93%. The precision and recall were particularly remarkable for lower experience codes, underscoring the SVM model’s efficacy in discerning the subtle dynamics of labor market participation among individuals with less experience. Notably, the differentiation in metrics for experience code 3 emphasizes potential obstacles in the transition from education to entrepreneurship or advanced positions, indicating that educational attainment constitutes a crucial factor.

Table 5.
Performance metrics of SVM classifier across various experience categories.
4.1.4. SDG5 Implications: Educational Empowerment and Economic Participation
The findings presented here address Research Question 1 (R.Q.1) by elucidating the substantial influence of educational attainment on labor market participation, which is intrinsically associated with SDG5, specifically target 5.5, which aims to ensure complete participation in economic activities and leadership roles. The results indicate that elevated levels of education facilitate a range of entrepreneurial and employment opportunities. This is evidenced by the predictive accuracy of the SVM models’ of 93% for employment outcomes, thus highlighting the critical role of education as a catalyst for economic empowerment and leadership. These findings require the implementation of policies designed to improve both access to and quality of education, thus supporting the objectives outlined in SDG5.
4.2. Financial Barriers and Access
Research Question (R.Q.2): What barriers to accessing financial services do women face and how do such barriers affect their financial independence?
This section examines the obstacles faced by women in procuring financial services and the subsequent effects on their financial independence. The analysis addresses systemic barriers and recommends strategies to surmount them.
4.2.1. Model Development for Financial Independence
The analysis focuses exclusively on female respondents, isolating features relevant to financial service access and indicators of perceived structural barriers (such as responses regarding gender differences in access and affordability). Categorical variables were mapped to numeric values to facilitate analysis:
The imputation of missing data was conducted using the strategy of substituting the most frequently occurring value. This approach ensures the preservation of both the structure and integrity of the dataset.
The logistic regression model predicts the probability of financial independence given predictors :
In this context, represents the intercept, while denotes the coefficients corresponding to each predictor variable. The model was established using the Logistic Regression algorithm, employing iterative optimization techniques to determine the optimal parameters.
The default threshold for classification in logistic regression is 0.5, which means that predictions with a probability equal to or greater than 0.5 are classified as the positive class (1), while those below 0.5 are classified as the negative class (0).
4.2.2. Graphical Data Visualizations for Financial Independence
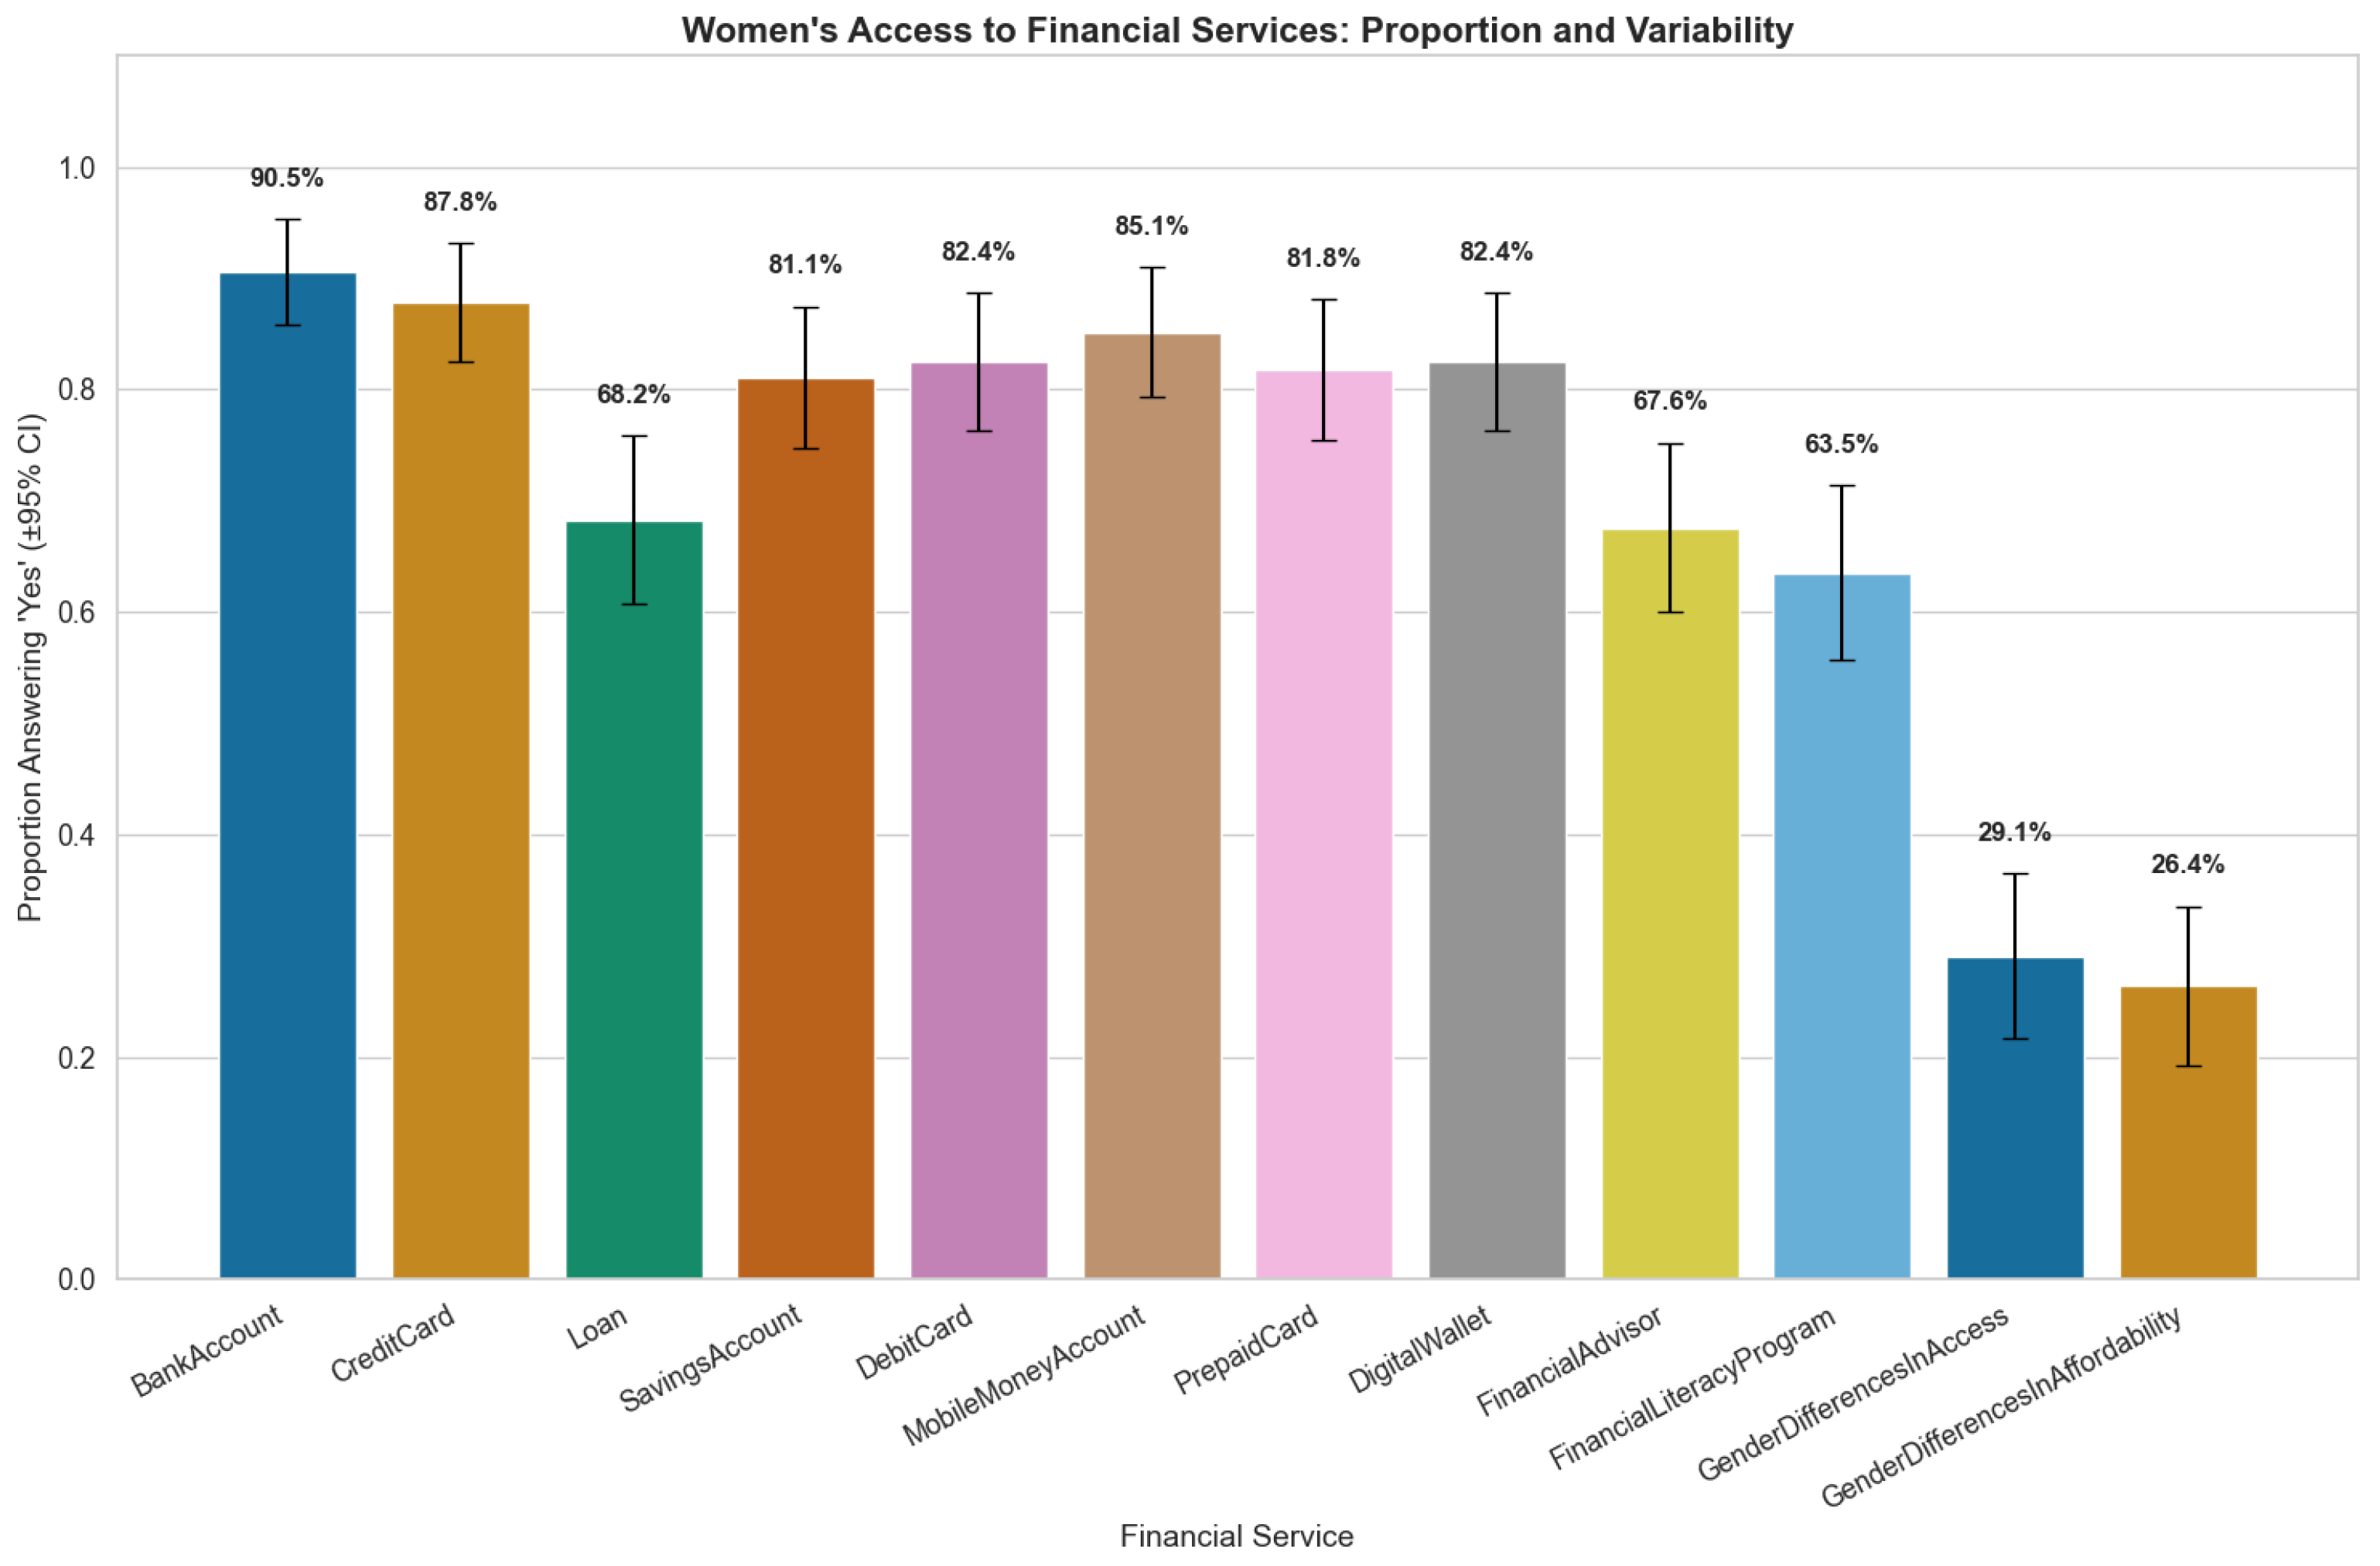
Figure 10 summarizes the prevalence of access and the barriers faced by women. Elevated average rates for services (e.g., Bank Account, Credit Card, Mobile Money) imply that legal or bureaucratic access is typically available. Nevertheless, approximately one-third of women report gender-based differences in access or affordability, underscoring persistent and less conspicuous forms of exclusion.
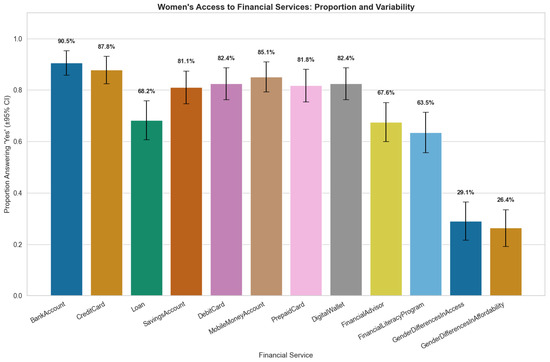
Figure 10.
Proportion of women reporting access to various financial services, with error bars indicating standard deviation. The data reveals high formal access but highlights perceived gender-based barriers, suggesting persistent informal exclusions.
The distribution of self-reported financial independence is almost evenly split, with only considering themselves financially independent, despite overall high access to services. This gap illustrates the potential impact of persistent, non-quantifiable barriers.
4.2.3. Model Evaluation for Financial Independence
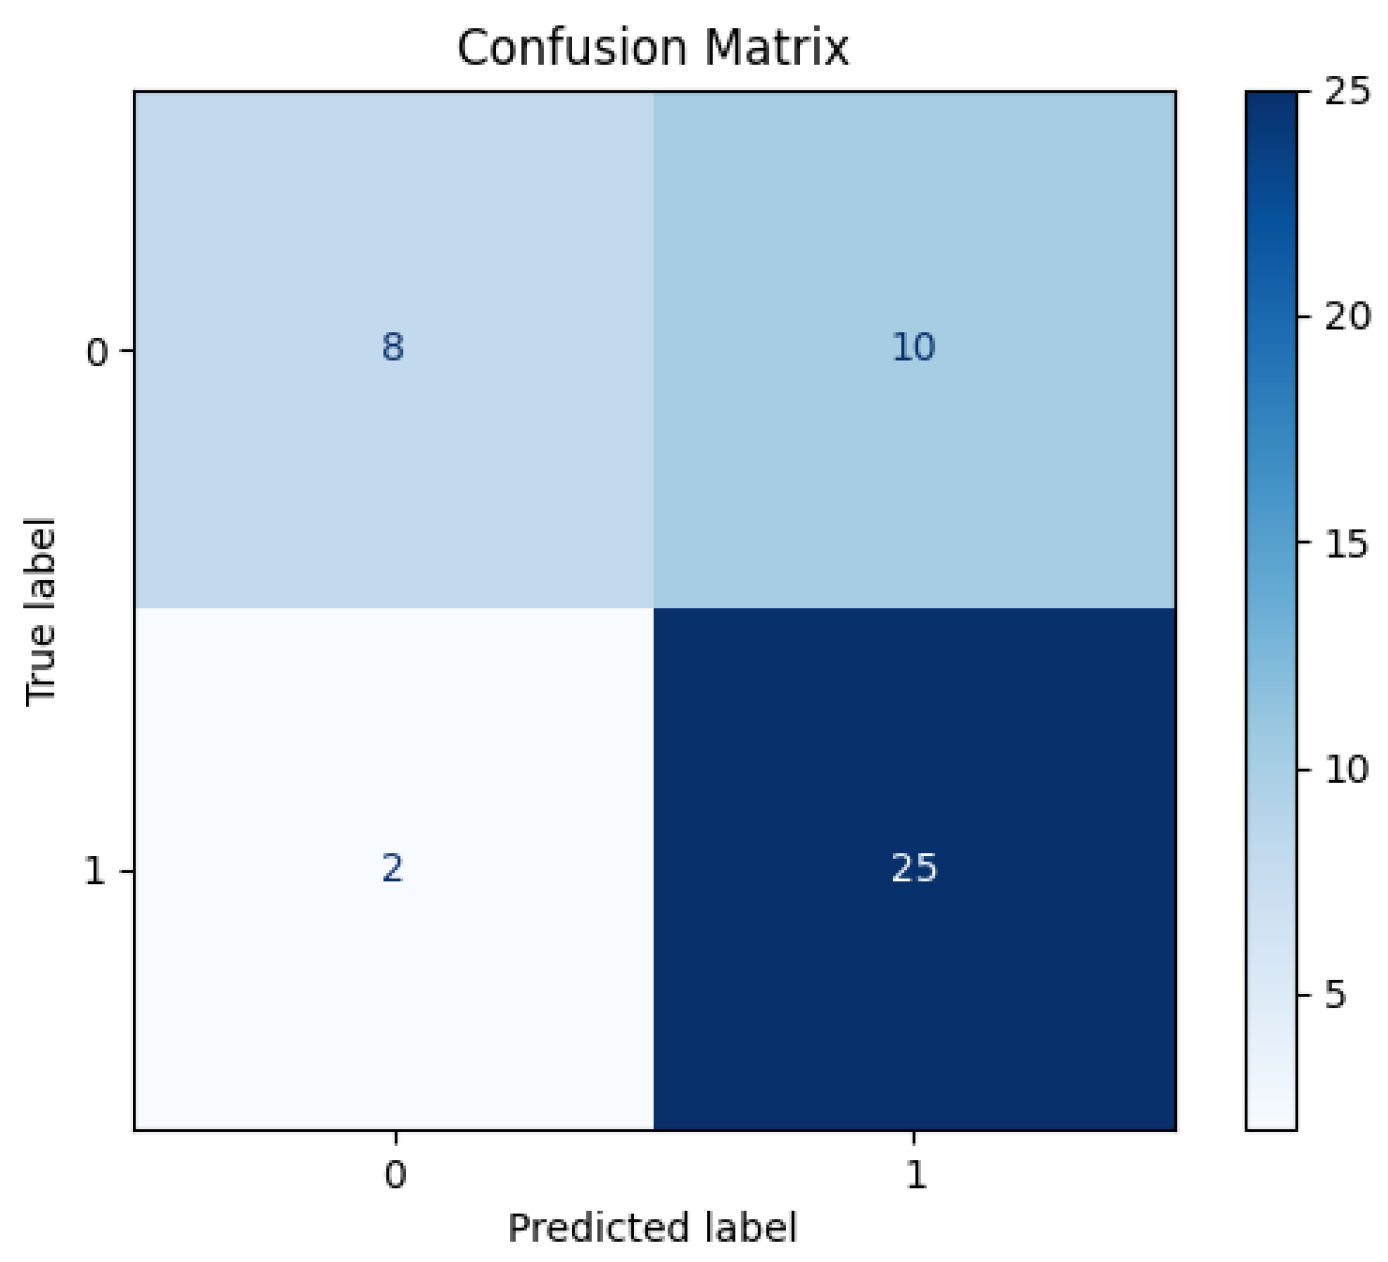
The logistic regression model serves as a critical tool in elucidating the obstacles women encounter in accessing financial services and the consequent effects on their financial autonomy. As demonstrated in Table 6, the model attained an overall accuracy of 73%. Particularly, the precision for predicting financial independence was 71%, coupled with a recall of 93%, underscoring the model’s efficacy in identifying individuals who have attained financial independence. Conversely, the prediction concerning those who remain financially dependent exhibited limitations, evidenced by a precision of 80% and a recall of 44%. This variation highlights potential challenges in comprehensively capturing the array of barriers women face. The classification metrics suggest that while the model proficiently identifies financially independent women, it concurrently discloses substantial obstacles encountered by those who have yet to achieve independence, see Figure 11.

Table 6.
Classification performance for logistic regression predicting women’s financial independence.
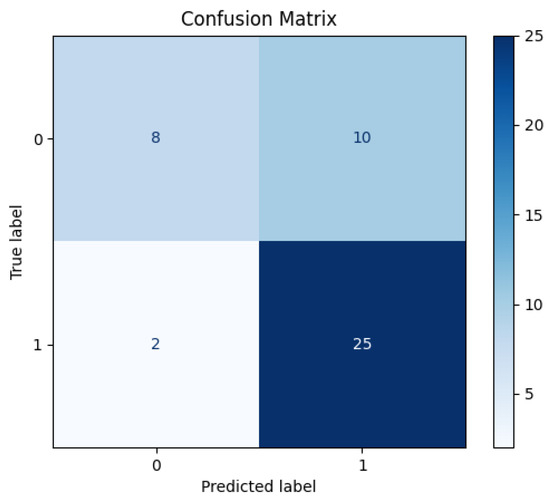
Figure 11.
Confusion matrix for logistic regression model of women’s financial independence. The model better classifies independent women but underestimates the not-independent group, indicating the multifactorial nature of financial barriers.
4.2.4. SDG5 Implications: Financial Barriers and Access
In response to Research Question (R.Q.2), the present analysis elucidates substantial impediments to accessing financial services, which adversely affect women’s financial autonomy and are congruent with SDG5, specifically target 5.a, which advocates for equal rights to economic resources. Despite a high rate of banking access, only 47% of women report financial independence, attributable to systemic barriers. Logistic regression analyses underscore these disparities, achieving a recall rate of 93% for financially independent women. The results underscore the imperative for the development of tailored financial literacy programs and the formulation of equitable policies to bolster economic autonomy, thereby furthering the objectives delineated by SDG5.
4.3. Legal Access and Rights Awareness
Research Question (Q.R.3):What role does access to legal services and awareness of legal rights play in empowering women?
This section of the analysis evaluates the influence of accessibility to legal services and awareness of rights on women’s empowerment, emphasizing critical predictors of empowerment and identifying potential areas for intervention.
4.3.1. Model Development for Legal Rights
The dataset is imported from an Excel spreadsheet into a Pandas DataFrame, denoted as , where n is the number of observations and m the number of features. Nominal categorical variables, such as Gender, are numerically encoded for computational compatibility:
This transformation is generalized for all categorical responses, including those related to legal service access and gender equity indicators, resulting in a transformed data matrix .
Let represent the j-th feature of the i-th sample after encoding. For columns with missing values, mean imputation is applied:
where is the count of non-missing values for feature j, and is the original (potentially missing) value.
The resulting feature matrix and target vector (denoting Access to Legal Services) are standardized using z-score normalization to prevent scale-related bias in subsequent modeling:
where and are the mean and standard deviation of feature j, respectively.
The standardized data is then partitioned into a training set () containing of the observations, and a test set () comprising the remaining :
We employ a fully connected feedforward neural network (multilayer perceptron, MLP) for the classification task. The network consists of: An input layer of size m (number of features). One hidden layer with h neurons, each with the rectified linear unit (ReLU) activation function:
An output layer using the sigmoid function for binary classification:
The network is optimized using the Adam optimizer, a stochastic gradient descent method with adaptive learning rates [65].
The training objective is to minimize the binary cross-entropy loss:
where is the true label, and is the predicted probability of accessing legal services for the i-th sample.
4.3.2. Graphical Data Visualizations for Legal Rights
The performance of the model is evaluated using the classification report, and a bar chart visualizes the impact of each feature on the prediction of access to legal services. This analysis offers insights into factors that affect access to legal services. Figure 12 shows a bar chart of features influencing individuals’ experiences with the legal system, such as ‘Gender,’ ‘Experience with the legal system’, ‘Gender-Based Discrimination’, ‘Women Access Legal Services’, ‘Women Respected’, and ‘Women Same Rights as Men’. Each bar’s magnitude and direction indicate the feature’s influence on model predictions: positive values reflect a positive impact, while negative values indicate an inverse relationship. This visualization helps identify influential factors in legal system experiences, aiding in further analysis and decision making in gender- and discrimination-related legal studies.

Figure 12.
Bar chart illustrating the feature importance in predicting experiences with the legal system. Each feature’s impact is quantified, showing positive and negative influences on the model’s predictions.
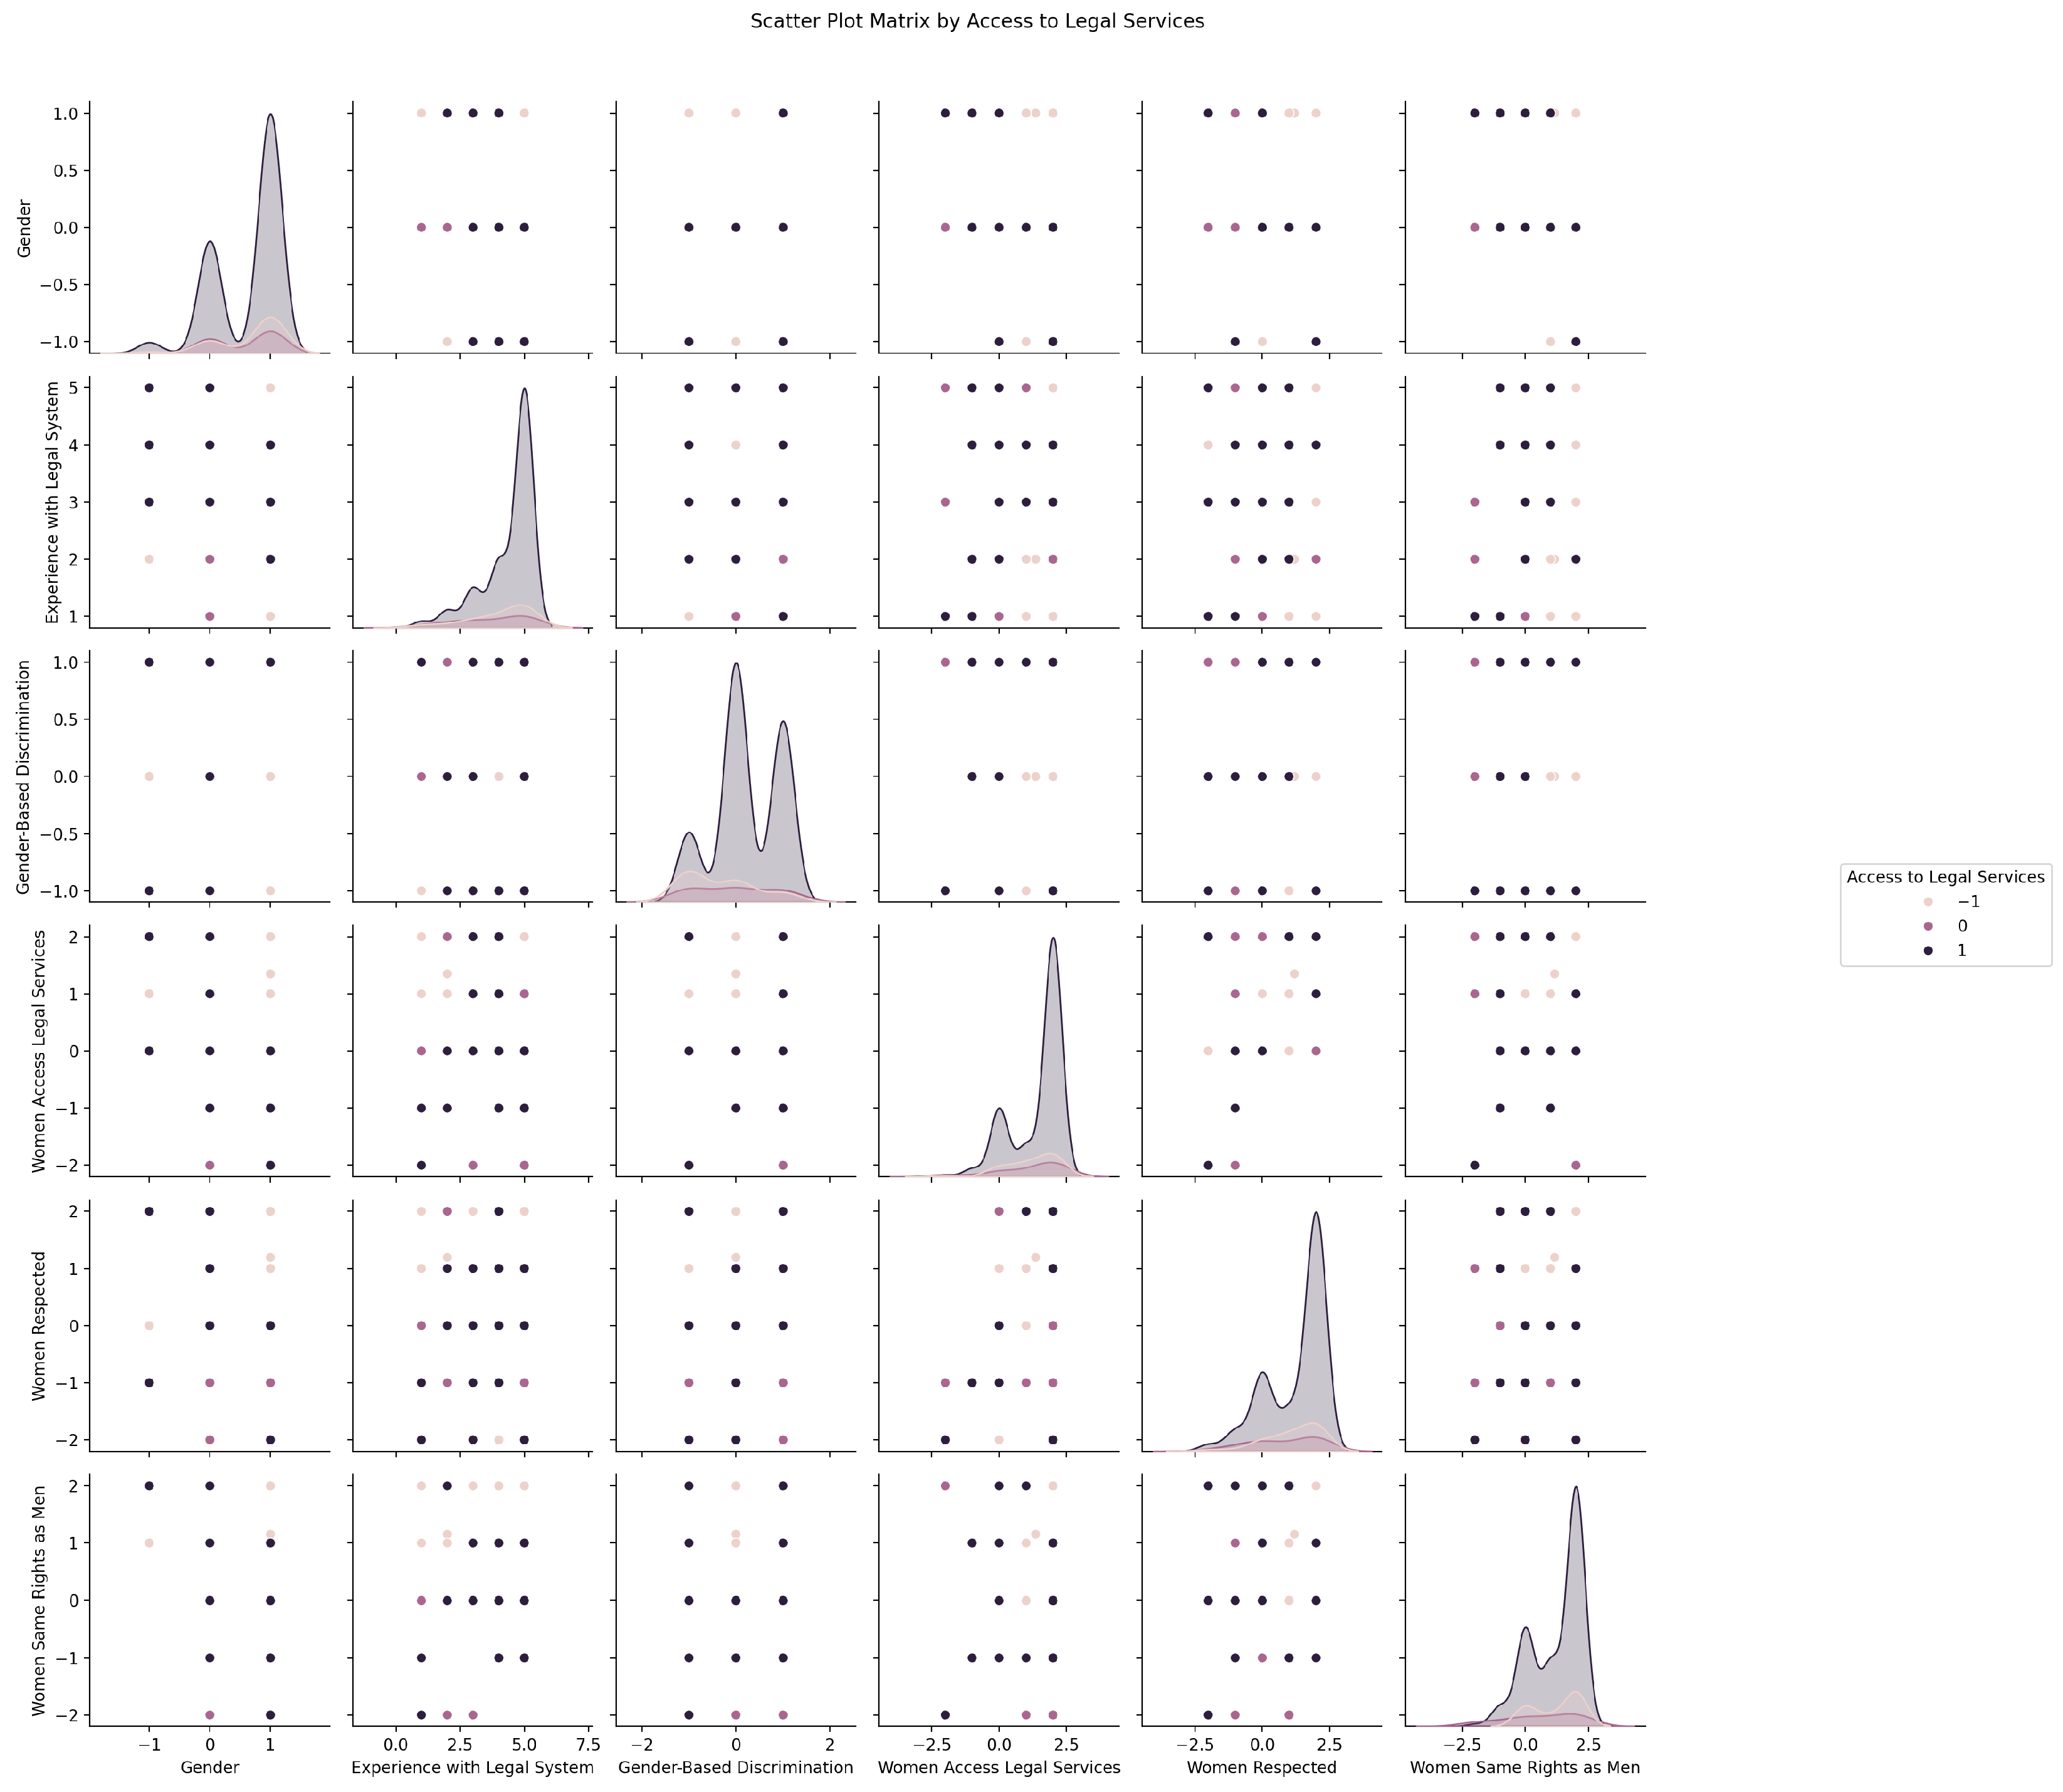
Figure 13 presents a scatter plot matrix with pairwise relationships and feature distributions, differentiated by ‘Access to Legal Services’. Off-diagonal subplots show scatter plots for variable pairs, while diagonal plots use density plots with colors for each access category (‘Yes’, ‘No’, ‘I don’t know’). This helps identify how access affects other attributes and highlights patterns or anomalies across categories.
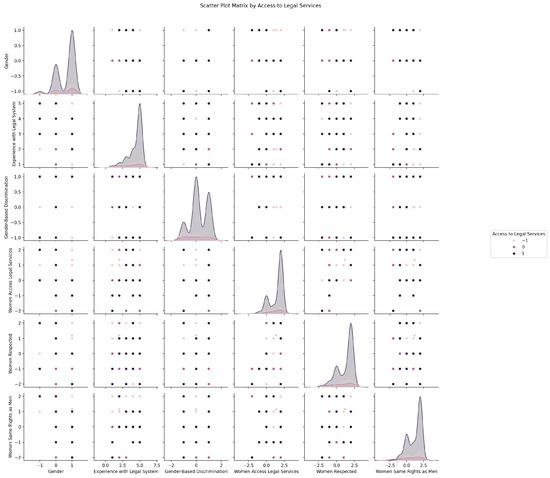
Figure 13.
Scatter plot matrix categorized by access to legal services, illustrating the interrelations and distributions of variables across different categories of legal service accessibility. Each off-diagonal subplot shows the relationship between two variables, and the diagonal provides density plots that summarize the distribution within each access category.
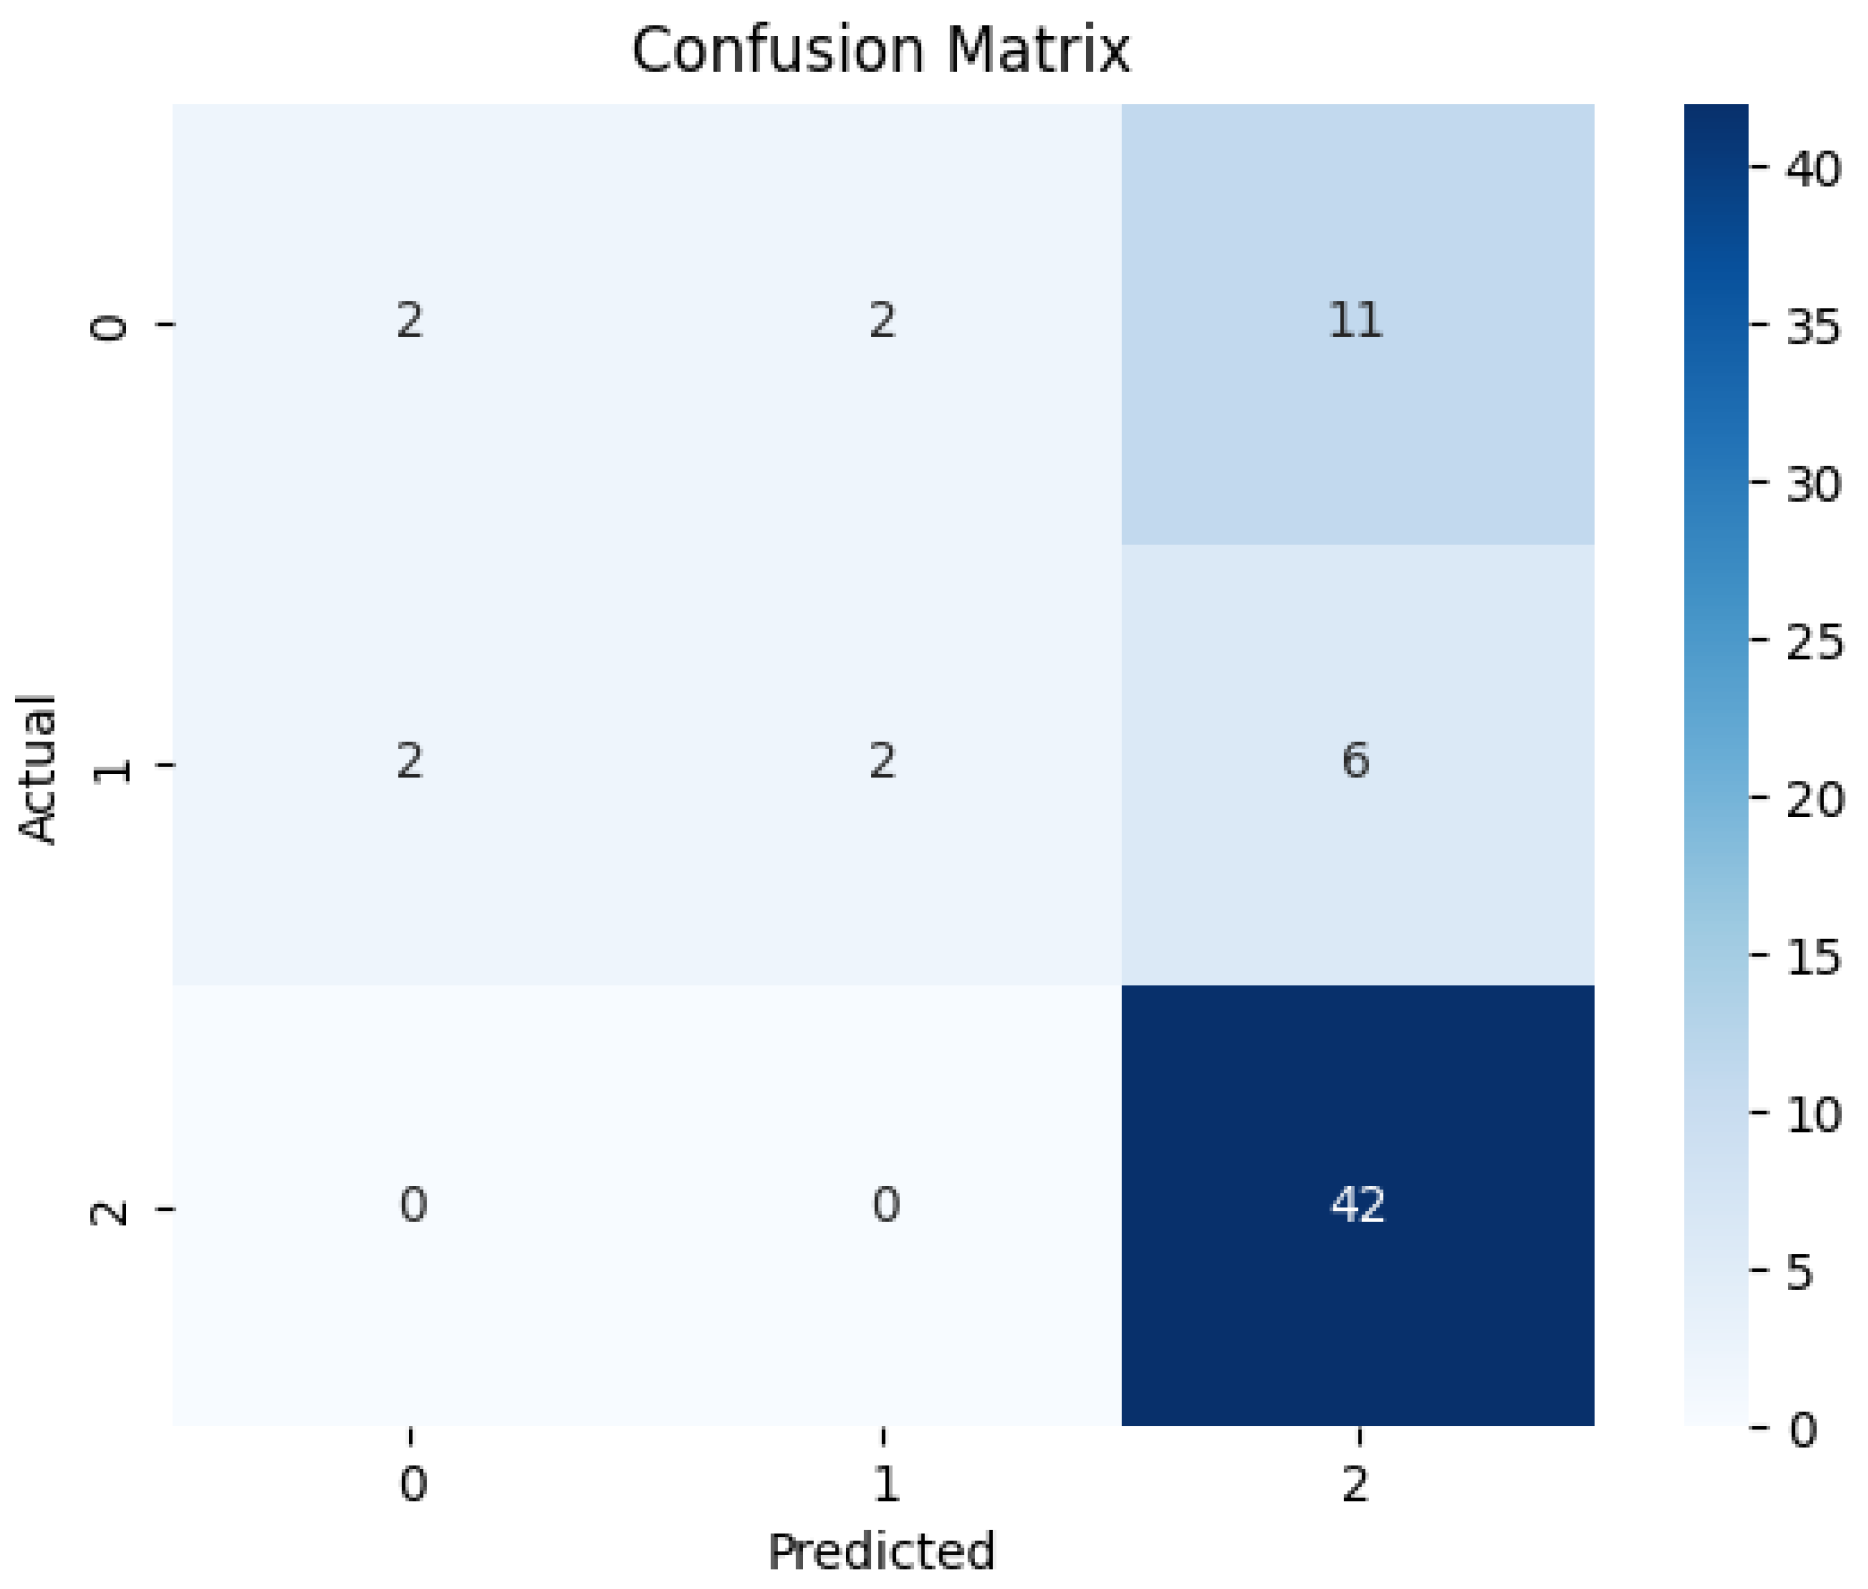
The confusion matrix (Figure 14) provides an illustration of the classification performance across various classes, emphasizing both areas of strength in predictions and those necessitating improvement.
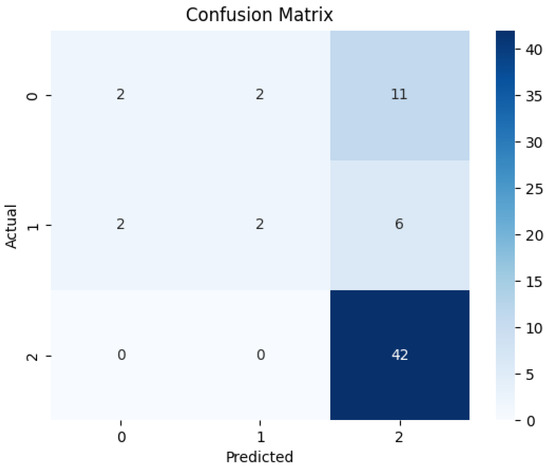
Figure 14.
Confusion Matrix of the MLP Model showing true vs. predicted classifications.
4.3.3. Model Evaluation for Legal Rights
The assessment of the neural network model, specifically the MLPClassifier, demonstrated its efficacy in predicting access to legal services, achieving a balanced accuracy of 69%, as presented in Table 7. The optimal parameters, identified through comprehensive hyperparameter optimization, included an activation function of ‘tanh’, a hidden layer size of 100, a solver of ‘adam’, and a regularization term (alpha) of 0.0001. The classification report reflects that the model attains high precision and recall for individuals who are likely to have access to legal services ( for class 1.0), indicating the model’s proficiency in differentiating between varying levels of access to legal services.

Table 7.
Classification Metrics for Predicting Access to Legal Services.
4.3.4. SDG5 Implications: Legal Access and Rights Awareness
This section addresses Research Question 3 (R.Q.3), elucidating the pivotal role of legal access in the empowerment of women, in relation to SDG5, target 5.1, which aims to eradicate discrimination. Employing neural network analyses, characterized by an F1-score of 0.83, it is evident that legal services are indispensable, yet remain insufficiently accessible to a significant number of women. Although the availability of legal services markedly enhances empowerment, this underscores the imperative for policy initiatives to bolster legal literacy and accessibility. Such measures are essential for realizing gender equity as delineated in SDG5.
4.4. Cross-Validation Performance of Machine Learning Models
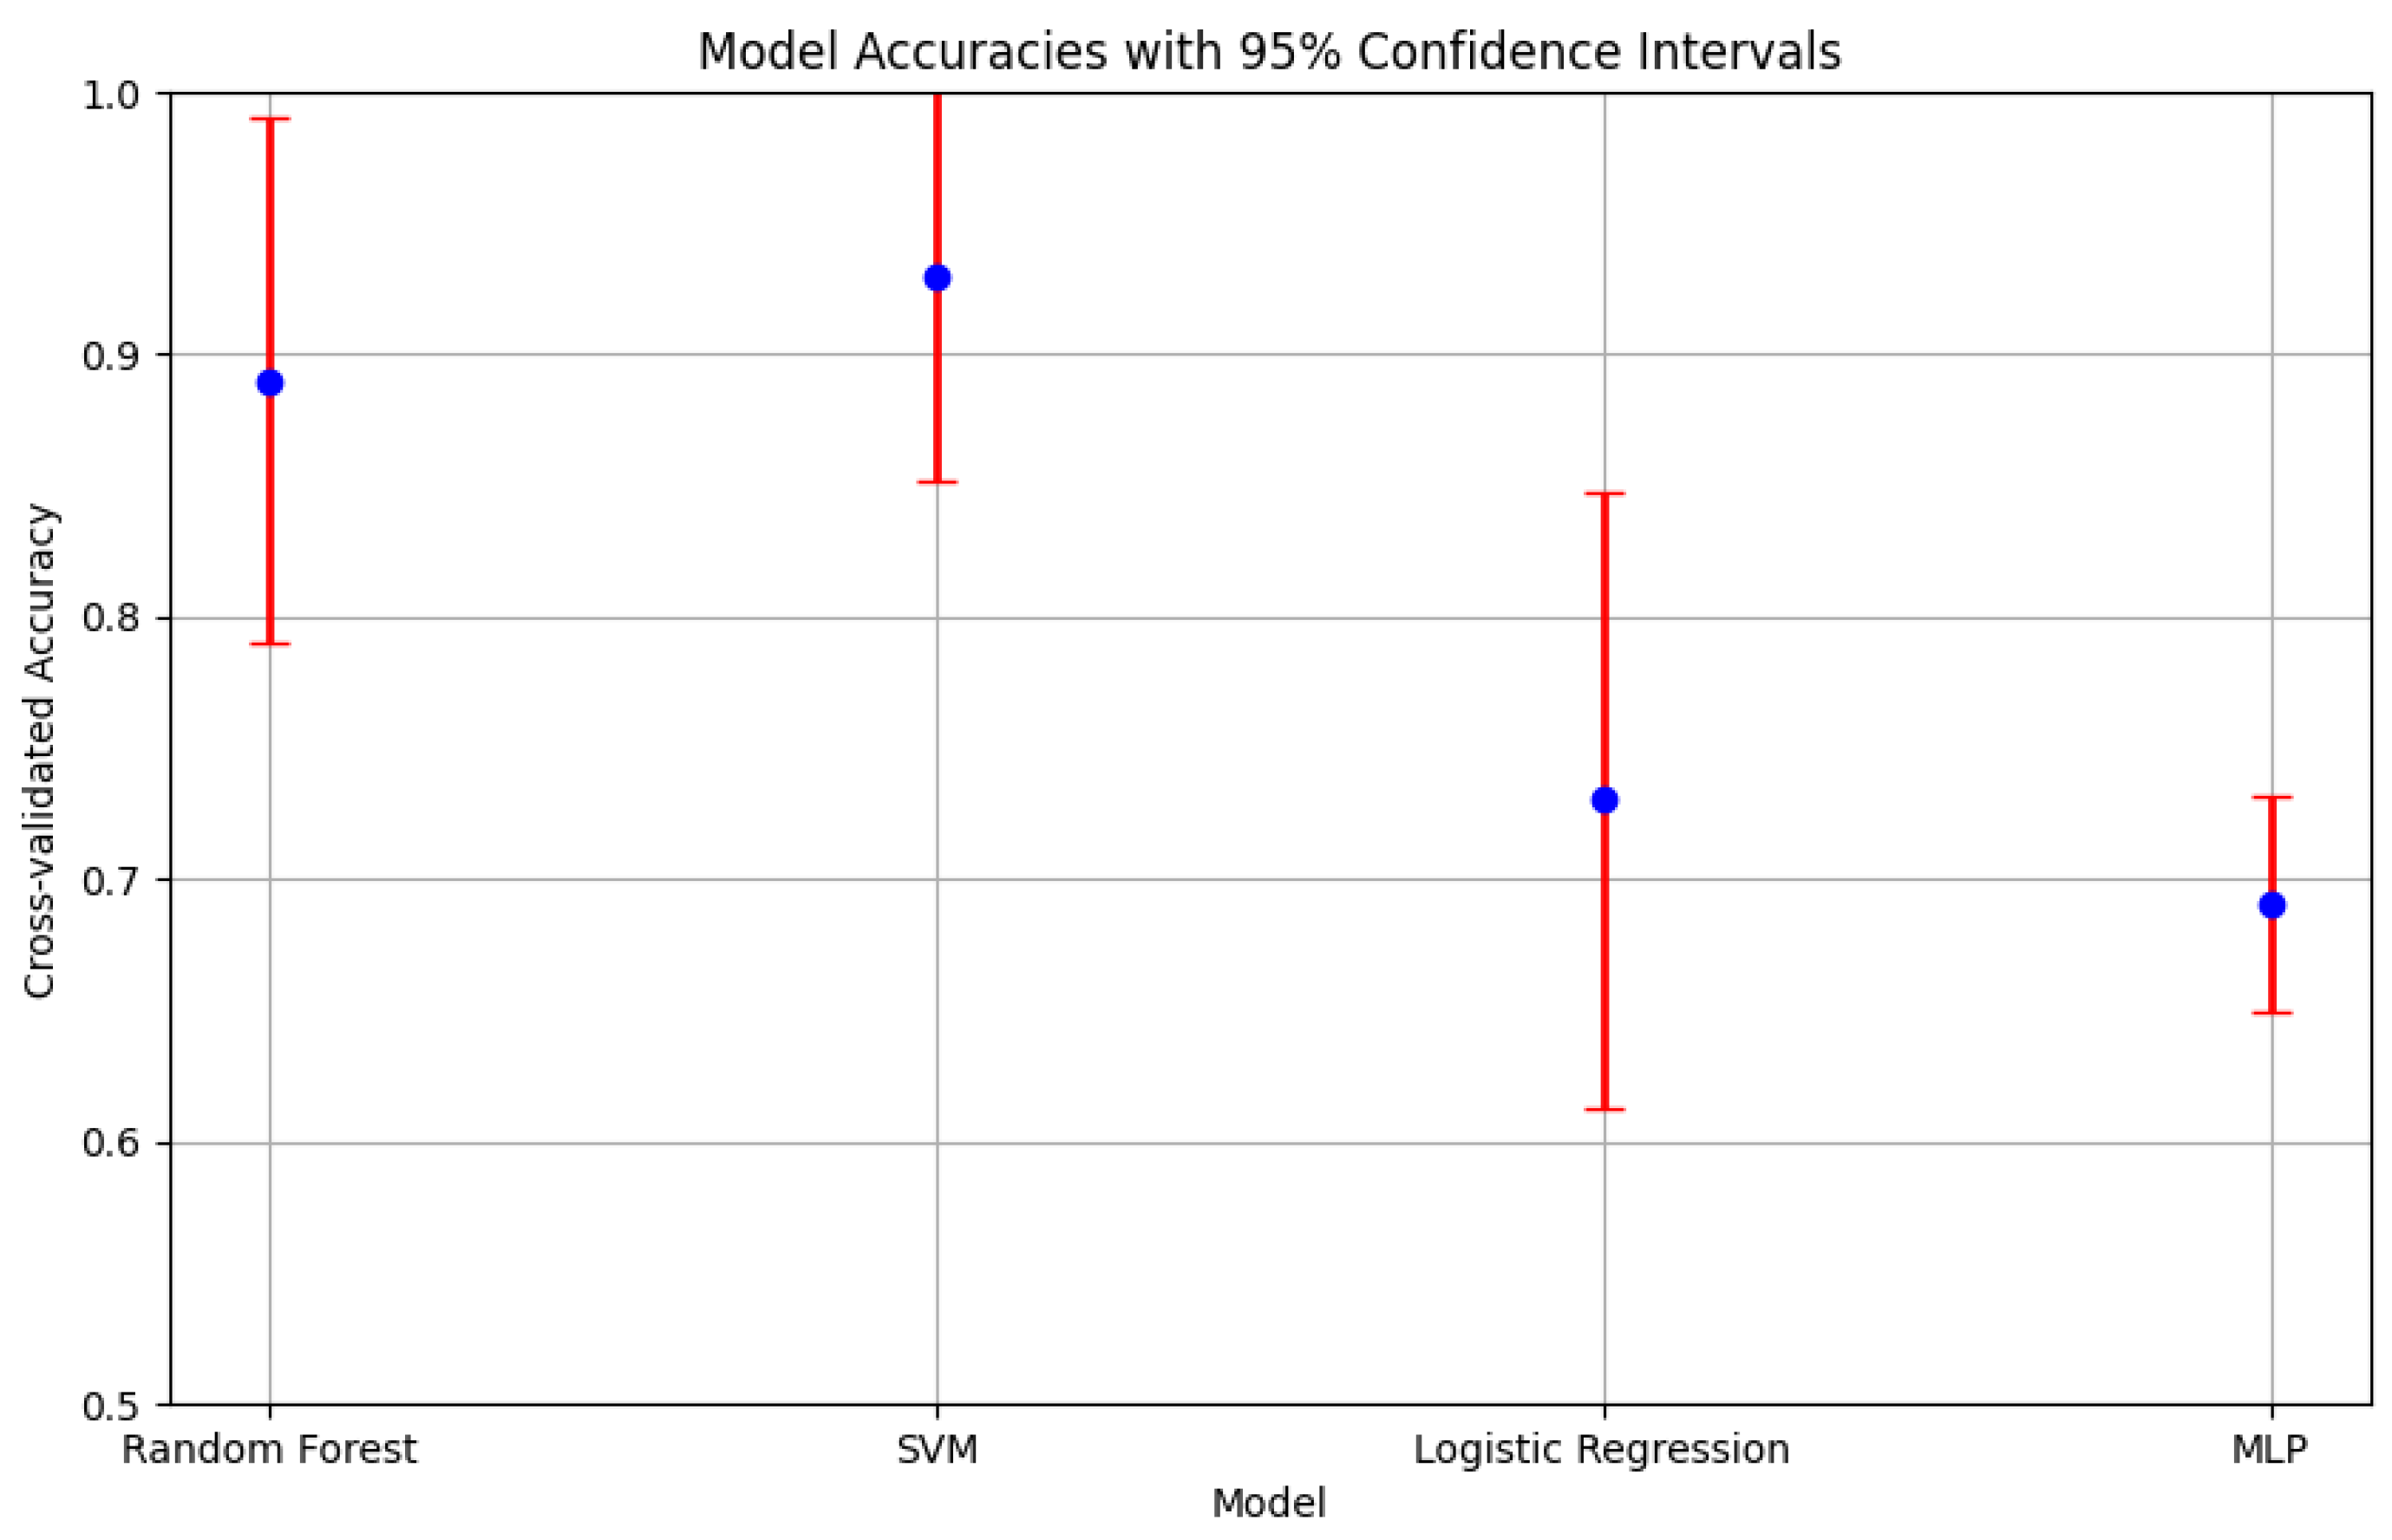
For every ML model used in this study, Figure 15 illustrates the cross-validated accuracies of four ML models: RF, SVM, logistic regression and MLP. The accuracy of each model is indicated by a point, and the corresponding 95% confidence interval is represented by an error bar. These confidence intervals provide a statistical range that reflects the reliability of the accuracy measurements. The models under evaluation are RF, SVM, Logistic Regression, and MLP, with cross-validated accuracies of 0.89, 0.93, 0.73, and 0.69, respectively. The confidence intervals, calculated as half-widths for each model, offer insights into the precision and variability of the accuracy estimates.
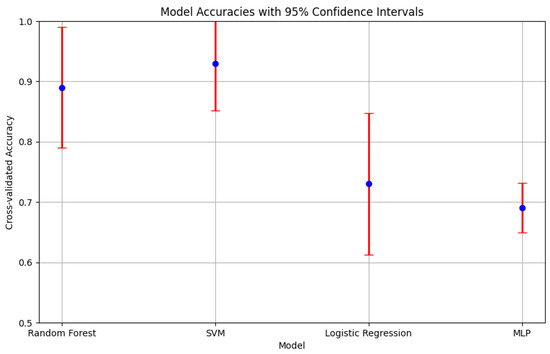
Figure 15.
Comparison of Cross-validated Accuracies among Models with 95% Confidence Intervals. The plot shows each model’s accuracy along with its statistical reliability, helping to determine the most robust model.
5. Discussion and Implications
5.1. Theoretical Implications
This research contributes to the theoretical understanding of women’s socioeconomic empowerment by integrating contemporary statistical learning methodologies into a comprehensive systems-level policy modeling framework. Utilizing advanced machine learning techniques such as random forests, support vector machines (SVM), logistic regression, and neural networks, the study transcends traditional linear models to reveal complex, multidimensional interdependencies among educational attainment, financial inclusion, and legal empowerment in the digital age. The high performance of the models—demonstrated by an SVM accuracy rate of 93% and a neural network F1 score of 0.81—suggests these sophisticated patterns in empowerment data can be effectively captured, thereby illuminating mechanisms and potential leverage points often missed by conventional methods.
In the context of SDG5 scholarship, our findings bolster the advocacy for decision-relevant, governance-focused analytics capable of operationalizing the ambitions outlined in the 2030 Agenda [13,14]. This study contributes to the dialogue on technology and gender by providing an empirically substantiated systems perspective that quantifies interaction effects, translating them into actionable insights and thereby extending narrative syntheses with predictive and diagnostic evidence [1,26,27,31]. Our results also correspond with broader literature on sustainability and accountability, demonstrating how predictive analytics can enhance the tractability of empowerment outcomes for organizational monitoring, corporate social responsibility (CSR), and performance management [24,25]. Moreover, the identified synergistic effects among education, finance, and legal rights align with initiatives on inclusive transition toward green recovery and sectoral decarbonization, where gender equality serves as a crucial enabler of systemic transformation [28,29,30]. Relative to existing SDG5 literature, this research introduces three key advancements:
- We provide empirical evidence that empowerment stems from non-linear complementarities, with education serving not only as an independent predictor but also as a catalyst for financial and legal agency, thus supporting the implementation of integrated, multisector policy bundles over isolated interventions [13,14].
- We present a reproducible, systems-level modeling framework that operationalizes empowerment through high-fidelity predictions and interpretable interaction structures, strengthening the interface between gender-and-technology research and policy analytics [1,26,27,31].
- We pinpoint data-driven leverage points and interaction patterns that can guide the sequencing and prioritization of interventions, introducing decision-useful metrics to discussions on accountability and CSR [24,25].
5.2. Practical Implications
Our empirical findings provide substantiated, evidence-based recommendations for the formulation of policies, monitoring of programs, and allocation of resources in alignment with SDG5 [13,14].
- Policymakers: Design and implement coordinated, multisectoral interventions that concurrently enhance access to quality education, formal financial services, and legal resources. The detected gender disparity in access to social protection (p = 0.02) highlights the imperative for targeted reforms in safety nets and welfare programs, thereby aligning with principles of inclusive sustainability governance [14].
- Educational institutions: Utilize digital curricula and tools to augment the preparedness of young women for evolving labor markets, consistent with the strong predictive associations observed between educational attainment and labor market participation (SVM macro F1 = 0.77), and in support of technology-enabled inclusion agendas [1].
- Financial sector actors: Leverage the high access rates for fundamental financial products (bank accounts 98.8%, credit cards 96.3%, savings 93.8%) as indicators of progress, whilst employing granular analytics to address remaining disparities in product design, distribution channels, and consumer protection [27].
- Legal service providers and civil society: Augment initiatives for legal literacy and accessible services. The neural network’s efficacy (F1 = 0.81) associates legal empowerment with enhanced agency and reported outcomes, underscoring the benefits of building legal capabilities within empowerment strategies [26,31].
To ensure the ethical and effective implementation of recommendations, it is essential for policymakers to adopt transparent modeling practices, conduct algorithmic audits, and utilize XAI to mitigate biases and enhance trust in data-driven policy instruments that are consistent with SDG5 accountability [14,25].
5.3. Socio-Cultural Influences on Women’s Empowerment
A comprehensive understanding of empowerment requires an examination of the socio-cultural heterogeneity that influences educational, economic, and legal dimensions in different regions. Cultural norms, traditional practices, and family structures can restrict access to educational opportunities and participation in the labor force, thus limiting economic empowerment; they also influence the extent to which legal reforms translate into actualized rights. Interventions that fail to consider these factors may experience limited adoption or produce unintended consequences. In alignment with global SDG reporting and research at the intersection of gender and technology, culturally responsive design—developed collaboratively with community stakeholders—has the potential to align programs with local values while promoting equality [1,13]. Future research efforts should incorporate contextual variables into modeling frameworks to account for normative constraints and to develop policies that are both respectful of and effective in promoting inclusive transitions across various sectors and regions [27,30].
5.4. Comparative Analysis of Women’s Empowerment Across Regions
In this section, we synthesize our study’s findings with similar international research, enhancing a nuanced comprehension of women’s empowerment across a variety of sociocultural environments, as detailed in Table 8. Our research exhibits congruent trends in empowering women through financial inclusion, akin to observations in rural India by Pal et al. [41]. Both investigations underscore the transformative capacity of financial services, while accentuating distinct regional challenges. Our results concerning the role of legal services as pivotal empowerment mechanisms align with Maru’s analysis [45] of World Bank undertakings. Both studies highlight the imperative nature of legal access; however, our research further reveals several urban-specific impediments. The augmentation of decision-making capacities via higher education in our study corresponds with findings by Braverman-Bronstein et al. [36] in Latin America and Yadav et al. [35] in India, although differing sociocultural contexts influence these effects. Our research also identifies persistent cultural barriers, consistent with the investigations by Cin et al. [37] in Turkey and Yadav et al. [35] on socioeconomic influences in India.

Table 8.
Comparative Analysis of Women’s Empowerment Studies.
Furthermore, our study situates its findings within the scholarship of SDG5 to offer a comparative, cross-regional analysis of women’s empowerment. Aligned with the global monitoring framework of the 2030 Agenda, we identify education, financial inclusion, and legal rights as interdependent drivers of empowerment, whose efficacy and prominence differ between various regions and sectors [13,14]. Our results corroborate existing evidence suggesting that technology and innovation can accelerate empowerment, contingent upon resolution of digital divides, structural inequities, and limitations in governance capacity [1,27]. In addiion, our findings are consistent with sector-specific analyzes that posit gender equality as fundamental to inclusive transitions in decarbonization and circular economic models, where context-specific barriers influence outcomes [26,28,29,30,31]. By integrating these diverse perspectives, our research provides a comprehensive comparative assessment of empowerment trajectories, thus contributing to policy development and improving the broader understanding of gender equity within the context of SDG5.
5.5. Ethical Considerations in Machine Learning Applications
The application of ML can significantly enhance the monitoring and policy design related to SDG5. Nevertheless, it is imperative to implement ethical safeguards. Biases, which may originate from sampling processes, feature construction, or model design, have the potential to skew recommendations if they remain unaddressed. Thus, we advocate for transparency in both the development and deployment of models, algorithmic accountability, and the use of explainable artificial intelligence (XAI) to elucidate decision-making processes [14,25]. According to guidelines related to technology and gender, the adoption of inclusive data strategies and participatory design methodologies can alleviate digital divides and ensure that technological tools adequately address the needs of women in diverse contexts [1,26]. Organizational governance and corporate social responsibility (CSR) mechanisms can incorporate these practices by establishing clear roles, conducting audits, and implementing performance indicators that align analytical processes with equity objectives [24,25].
5.6. Limitations and Future Research
5.6.1. Data
Our sampling methodology was anchored in social networks associated with the academic milieu of the author, resulting in a cohort characterized by younger age and higher educational attainment. Proxy indicators may demonstrate measurement error and exhibit missing data across various locations and temporal frameworks. These factors constrain representativeness and have the potential to introduce bias into model estimations. To enhance construct validity and broaden coverage, future research should aim to expand sampling frames, standardize indicators, and incorporate microdata [13].
5.6.2. External Validity
The findings are representative of specific contexts and temporal periods; structural variations across different regions and sectors, alongside potential future disruptions, may limit their generalizability. It is advisable to conduct replications using locally adapted models and perform cross-validation across diverse settings prior to implementing policy recommendations [13,14].
5.6.3. Causality
The analyses conducted are observational and predominantly predictive in nature; we do not assert any causal relationships between education, financial, or legal reforms and empowerment. Concerns remain regarding potential omitted variables, reverse causality, and algorithmic bias. Future studies should integrate identification strategies (such as natural experiments, difference-in-differences, and instrumental variables), employ causal machine learning techniques, and implement routine fairness audits to fortify causal inference and ensure equity safeguards [25,26].
5.6.4. Research Agenda
In alignment with the priorities of SDG5, subsequent research efforts should (i) incorporate socio-cultural covariates to model normative constraints and account for heterogeneous treatment effects; (ii) investigate sectoral pathways (such as transport and manufacturing) to align empowerment strategies with inclusive transitions [28,29,30]; and (iii) participate in the co-production of tools with local stakeholders to ensure relevance, transparency and accountability of data-driven policy processes [1,14].
6. Conclusions
In this era characterized by digital transformation and dynamic policy environments, the present research provides a rigorous, data-driven investigation into the determinants influencing women’s socio-economic empowerment. Employing advanced statistical methodologies and cutting-edge machine learning techniques—including the precision of Random Forest (RF), the robust classification capabilities of Support Vector Machines (SVMs), and the predictive intelligence of logistic regression and neural networks—this study underscores the pivotal role of educational attainment as a crucial determinant of women’s economic engagement. Notably, the SVM-based model demonstrates a remarkable classification accuracy of 93%, effectively forecasting labor market participation based on educational qualifications.
Despite the substantial prevalence of fundamental financial products (91% bank account availability), the logistic regression analysis indicates that only 47% of women report financial independence, thereby highlighting persistent gender disparities. These findings draw attention to entrenched challenges persisting despite significant financial inclusion, emphasizing the necessity for equitable financial frameworks. Moreover, the neural network models exhibit exceptional predictive capabilities (F1 = 0.83) in identifying women with comprehensive access to legal services, illustrating the empowerment facilitated by legal competence.
This thorough, model-informed analysis advocates for three principal policy directives: (1) strategic investment in women’s education to unlock labor market and entrepreneurial prospects; (2) development of inclusive financial systems to address enduring disparities; and (3) promotion of legal literacy to enhance advocacy for gender equity. Together, this research emphasizes that educational achievements, financial access, and legal empowerment are foundational to gender equity, aligning with inclusive policy strategies for equitable advancement in a digital world.
While the study provides significant insights, it acknowledges limitations associated with demographic concentration, predominantly focusing on younger, well-educated cohorts. Consequently, future research should validate these findings across more diverse and representative samples to ensure broad applicability and robustness, reflecting the need for comprehensive data that informs policy and strategy development in alignment with SDG5 objectives.
Funding
This research received no external funding.
Institutional Review Board Statement
Ethical approval for this study was obtained from the Local Research Ethics Committee (LREC) at the University of Tabuk, located in Tabuk City, Saudi Arabia (Approval No. UT-727-440-2025). The approval encompassed the research protocol, the collection of informed consent from participants, and the submission of the final report upon study completion.
Informed Consent Statement
In the electronic survey, participants were briefed on the study’s objectives, methodology, risks, and benefits. Those willing to participate provided their informed consent by completing the survey; thus, consent was explicitly obtained before any data collection. The study maintains anonymity, ensuring no personal information that could identify participants was gathered.
Data Availability Statement
The original data and code used in this study are available for confidential access in the Women repository at https://github.com/Aaeshah/Women (accessed on 23 October 2025).
Conflicts of Interest
The author declares no conflict of interest.
Abbreviations
The following abbreviations are used in this manuscript:
| Adam | Adaptive Moment Estimation |
| AI | Artificial Intelligence |
| CSR | Corporate Social Responsibility |
| EDA | Exploratory Data Analysis |
| FN | False Negative |
| FP | False Positive |
| Null Hypothesis | |
| LLM | Large Language Model |
| LIME | Local Interpretable Model-agnostic Explanations |
| ML | Machine Learning |
| MLP | Multilayer Perceptron |
| NaN | Not a Number |
| NLP | Natural Language Processing |
| p | p-value |
| ReLU | Rectified Linear Unit |
| RBF | Radial Basis Function |
| RF | Random Forest |
| SDG | Sustainable Development Goal |
| SVM | Support Vector Machine |
| STD | Standard Deviation |
| SHAP | SHapley Additive exPlanations |
| SMOTE | Synthetic Minority Over-sampling TEchnique |
| TP | True Positive |
| Chi-square Statistic | |
| n | Sample Size |
| XAI | Explainable Artificial Intelligence |
Appendix A
This appendix includes the list of items, measurements and scales of the questionnaire.
Section 1 of 12: Demographics
- Gender:
- Male
- Female
- Age:
- Younger than 20
- 20 to 30
- 31 to 40
- 41 to 50
- Older than 50
Section 2 of 12: Education - What is the highest level of education completed:[Scales: Individual/Parents/Siblings/Peers/Teachers]
- ∗
- Illiterate
- ∗
- Primary School
- ∗
- Middle School
- ∗
- High School
- ∗
- Diploma
- ∗
- Bachelor
- ∗
- Master
- ∗
- Doctorate
Section 3 of 12: Employment - Salary:
- Not Applicable
- Less than 5000
- 5000 to 10,000
- 10,000 to 15,000
- More than 15,000
- Employment status:
- Student
- Government employee
- Private sector employee
- Self-employed
- At liberty
- Experience in current job:
- ∗
- Not Applicable
- ∗
- Less than a year
- ∗
- 1–2 years
- ∗
- 3–5 years
- ∗
- 6–10 years
- ∗
- More than 10 years
- Equity in Employment: [Scales: Yes/No/I don’t know/Not Applicable]
- paid the same as your colleagues of the same gender?
- have the same opportunities for promotion as your colleagues of the same gender?
- treated the same as your colleagues of the same gender?
- given the same amount of responsibility as your colleagues of the same gender?
- given the same amount of recognition as your colleagues of the same gender?
Section 4 of 12: Political Representation - Percentage of women in leadership positions:
- 1–9%
- 10–29%
- 30–49%
- 50–69%
- 70–89%
- 90–100%
- Are there any organizations or initiatives that support women in: [Scales: Yes/No/I don’t know]
- Politics
- Running for leadership positions
- Fundraising
- Networking
- Policymaking
- Media representation
Section 5 of 12: Healthcare - Do you have access to healthcare services: [Scales: Yes/No/I don’t know]
- Are there any differences in access to healthcare services between: [Scales: Yes/No/I don’t know]
- Gender
- Age groups
- Income levels
- Ethnic groups
Section 6 of 12: Legal Rights - Do you have access to legal services: [Scales: Yes/No/I don’t know]
- Experience with the legal system: [Bad (1) to Good (5)]
- Gender-based discrimination in the legal system: [Scales: Yes/No/I don’t know]Section 7 of 12: Financial Services
- Do you have access to financial services: [Scales: Yes/No/Not Applicable]
- ∗
- Bank account
- ∗
- Credit card
- ∗
- Loan
- ∗
- Savings account
- ∗
- Debit card
- ∗
- Mobile money account
- ∗
- Prepaid card
- ∗
- Digital wallet
- ∗
- Financial advisor
- ∗
- Financial literacy program
Section 8 of 12: Access to Technology - Do you have access to Devices: [Scales: Yes/No/Not Applicable]
- ∗
- Computer or laptop
- ∗
- Internet
- ∗
- Smartphone
- ∗
- Tablet
- ∗
- Others
- Frequency of use:
- Not Applicable
- Discreetly
- Rarely
- 2–3 h/day
- 4–6 h/day
- Freely
Section 9 of 12: Public ServicesExamples of public services include: Courts, Education, Electricity, Emergency services, Environmental protection, Healthcare, Mail, Military. - Rate the following: [Scales: Low/Below average/Average/Above average/High]
- Availability of services
- Quality of services
- Cost of services
- Ease of access to services
- Gender of people using, providing, or benefiting from services:
- Mostly men
- Mostly women
- Both
- I don’t know
Section 10 of 12: Social Protection - Differences in social protection services: [Scales: Yes/No/Not Applicable]
- Access
- Quality
- Availability
- Affordability
- Coverage
- Timeliness
- Effectiveness
- Utilization
- Satisfaction
Section 11 of 12: Statements - Rate your agreement with the following statements: [Scales: Totally agree/Somewhat agree/Neutral/Somewhat disagree/Totally disagree]
- Women should have the same rights as men
- Women should be allowed to work outside the home
- Women should be allowed to make their own decisions
- Women should be respected and treated equally
- Women should be allowed to pursue higher education
- Women should be allowed to participate in politics
- Women should be allowed to travel freely
- Women should be allowed to dress as they please
- Women should be allowed to express their opinions freely
- Women should be allowed to choose their own partners
- Women should be allowed to own property
- Women should be allowed to access healthcare
- Women should be allowed to access legal services
Section 12 of 12: Open Questions - In your opinion, what can society provide to embrace women?
- In your opinion, what can society do to hinder women?
References
- UN Women. Making Innovation and Technology Work for Women, 2017. Recuperado a Partir de La Desigualdad de Género en la Economía Digital Mexicana. Available online: https://www.unwomen.org/en/digital-library/publications/2017/7/making-innovation-and-technology-work-for-women (accessed on 23 October 2025).
- Djatmiko, G.H.; Sinaga, O.; Pawirosumarto, S. Digital Transformation and Social Inclusion in Public Services: A Qualitative Analysis of E-Government Adoption for Marginalized Communities in Sustainable Governance. Sustainability 2025, 17, 2908. [Google Scholar] [CrossRef]
- Akanfe, O.; Bhatt, P.; Lawong, D.A. Technology Advancements Shaping the Financial Inclusion Landscape: Present Interventions, Emergence of Artificial Intelligence and Future Directions. Inf. Syst. Front. 2025, 27, 1–24. [Google Scholar] [CrossRef]
- Alqahtani, M.H. Women in Saudi secondary school EFL textbooks: A critical study of women’s empowerment as enshrined in the Saudi Vision 2030. Front. Sociol. 2024, 9, 1307623. [Google Scholar] [CrossRef]
- Al-Ghamdi, N.A.; Alqahtani, A.; Alshahrani, L.; Elyas, T. A semiotic analysis of images of Saudi Women’s rights in caricatures in light of Saudi Women’s empowerment. Semiotica 2022, 2022, 217–247. [Google Scholar] [CrossRef]
- Alhawsawi, S.; Jawhar, S.S. Education, employment, and empowerment among Saudi women. Gend. Educ. 2023, 35, 401–419. [Google Scholar] [CrossRef]
- Samargandi, N.; Al Mamun, M.; Sohag, K.; Alandejani, M. Women at work in Saudi Arabia: Impact of ICT diffusion and financial development. Technol. Soc. 2019, 59, 101187. [Google Scholar] [CrossRef]
- Yang, Y.; Zhang, C.; Xu, H.; Bu, Y.; Liu, M.; Ding, Y. Unveiling the loss of exceptional women in science. Inf. Process. Manag. 2024, 61, 103829. [Google Scholar] [CrossRef]
- Mishra, D.; Kandpal, V.; Agarwal, N.; Srivastava, B. Financial Inclusion and Its Ripple Effects on Socio-Economic Development: A Comprehensive Review. J. Risk Financ. Manag. 2024, 17, 105. [Google Scholar] [CrossRef]
- Corradini, E. Deconstructing cultural appropriation in online communities: A multilayer network analysis approach. Inf. Process. Manag. 2024, 61, 103662. [Google Scholar] [CrossRef]
- Dritsas, E.; Trigka, M. Machine Learning and Data Science in Social Sciences: Methods, Applications, and Future Directions. IEEE Access 2025, 13, 105334–105352. [Google Scholar] [CrossRef]
- Srour, F.J.; Karkoulian, S. Exploring diversity through machine learning: A case for the use of decision trees in social science research. Int. J. Soc. Res. Methodol. 2022, 25, 725–740. [Google Scholar] [CrossRef]
- United Nations. The Sustainable Development Goals Report; United Nations: New York, NY, USA, 2016. [Google Scholar]
- Bebbington, J.; Unerman, J. Achieving the United Nations sustainable development goals. Accounting, Audit. Account. J. 2018, 31, 2–24. [Google Scholar] [CrossRef]
- AlKharouf, R.; Shehadeh, A.; Alrefaee, A.; Alshboul, O. Integrative strategies for social inclusion and equity: Enhancing refugee access to higher education in Jordan. Heliyon 2024, 10, e31762. [Google Scholar] [CrossRef]
- Moss, N.E. Gender equity and socioeconomic inequality: A framework for the patterning of women’s health. Soc. Sci. Med. 2002, 54, 649–661. [Google Scholar] [CrossRef]
- Vaz, E. Regional Knowledge Economies; Springer: Berlin/Heidelberg, Germany, 2024. [Google Scholar] [CrossRef]
- Chikh-Amnache, S.; Mekhzoumi, L. The influence of socioeconomic factors on female entrepreneurship in Southeast Asian countries. J. Entrep. Emerg. Econ. 2024, 16, 33–70. [Google Scholar] [CrossRef]
- Perifanis, N.A.; Kitsios, F. Investigating the Influence of Artificial Intelligence on Business Value in the Digital Era of Strategy: A Literature Review. Information 2023, 14, 85. [Google Scholar] [CrossRef]
- Nilan, P.; Maunati, Y. Wealth, Poverty and Health in Southeast Asia. In Decolonising Social Science Research in Southeast Asia: New Ways of Knowing; Springer: Berlin/Heidelberg, Germany, 2025; pp. 85–110. [Google Scholar] [CrossRef]
- Tong, Y.; Chen, R.K. Rethinking Gender Inequality in China’s Rural-to-Urban Migration: An Intersectionality Approach. Sociol. Compass 2025, 19, e70075. [Google Scholar] [CrossRef]
- Sethi, S.S.; Jain, K. AI technologies for social emotional learning: Recent research and future directions. J. Res. Innov. Teach. Learn. 2024, 17, 213–225. [Google Scholar] [CrossRef]
- Ukhova, D. Gender inequality and inter-household economic inequality in emerging economies: Exploring the relationship. Gend. Dev. 2015, 23, 241–259. [Google Scholar] [CrossRef]
- Carroll, A.B.; Brown, J.A. Corporate social responsibility: A review of current concepts, research, and issues. In Corporate Social Responsibility; Emerald Publishing Limited: Leeds, UK, 2018; Volume 2, pp. 39–69. [Google Scholar] [CrossRef]
- Schaltegger, S. Linking Environmental Management Accounting: A Reflection on (Missing) Links to Sustainability and Planetary Boundaries. Soc. Environ. Account. J. 2018, 38, 19–29. [Google Scholar] [CrossRef]
- Di Vaio, A.; Hassan, R.; Palladino, R. Blockchain technology and gender equality: A systematic literature review. Int. J. Inf. Manag. 2023, 68, 102517. [Google Scholar] [CrossRef]
- Ali, S.; Appolloni, A.; Cavallaro, F.; D’Adamo, I.; Di Vaio, A.; Ferella, F.; Gastaldi, M.; Ikram, M.; Kumar, N.; Martin, M.; et al. Development Goals towards Sustainability. Sustainability 2023, 15, 9443. [Google Scholar] [CrossRef]
- Appolloni, A.; Jabbour, C.J.C.; D’Adamo, I.; Gastaldi, M.; Settembre-Blundo, D. Green recovery in the mature manufacturing industry: The role of the green-circular premium and sustainability certification in innovative efforts. Ecol. Econ. 2022, 193, 107311. [Google Scholar] [CrossRef]
- D’Adamo, I.; Lupi, G. Sustainability and resilience after COVID-19: A circular premium in the fashion industry. Sustainability 2021, 13, 1861. [Google Scholar] [CrossRef]
- UK COP26 Presidency. The Role of Gender Equality in Decarbonizing Transport. 2021. Available online: https://ukcop26.org/events/the-role-of-gender-equality-in-decarbonising-transport/ (accessed on 23 October 2025).
- Di Vaio, A.; Zaffar, A.; Balsalobre-Lorente, D.; Garofalo, A. Decarbonization technology responsibility to gender equality in the shipping industry: A systematic literature review and new avenues ahead. J. Shipp. Trade 2023, 8, 9. [Google Scholar] [CrossRef]
- Kasnauskiene, G.; Badaras, R.; Pauliene, R.; Thrassou, A. Economic effectiveness of investment in higher education: An evaluation at the individual and national levels. Euromed J. Bus. 2024, 20, 1–16. [Google Scholar] [CrossRef]
- Elsayed, A.; Shirshikova, A. The women-empowering effect of higher education. J. Dev. Econ. 2023, 163, 103101. [Google Scholar] [CrossRef]
- Le, K.; Nguyen, M. How Education Empowers Women in Developing Countries. BE J. Econ. Anal. Policy 2021, 21, 511–536. [Google Scholar] [CrossRef]
- Yadav, A.K.; Sahni, B.; Jena, P.K. Education, employment, economic status and empowerment: Implications for maternal health care services utilization in India. J. Public Aff. 2021, 21, e2259. [Google Scholar] [CrossRef]
- Braverman-Bronstein, A.; Ortigoza, A.F.; Vidaña-Pérez, D.; Barrientos-Gutiérrez, T.; Baldovino-Chiquillo, L.; Bilal, U.; de Lima Friche, A.A.; Diez-Canseco, F.; Maslowsky, J.; Vives V., A.; et al. Gender inequality, women’s empowerment, and adolescent birth rates in 363 Latin American cities. Soc. Sci. Med. 2023, 317, 115566. [Google Scholar] [CrossRef]
- Cin, F.M.; Gümüş, S.; Weiss, F. Women’s empowerment in the period of the rapid expansion of higher education in Turkey: Developments and paradoxes of gender equality in the labour market. High. Educ. 2021, 81, 31–50. [Google Scholar] [CrossRef]
- Parveen, M. Women empowerment: New paradigm shift of Saudi women into labor workforce. Soc. Bus. Rev. 2021, 17, 66–91. [Google Scholar] [CrossRef]
- Saluja, O.B.; Singh, P.; Kumar, H. Barriers and interventions on the way to empower women through financial inclusion: A 2 decades systematic review (2000–2020). Humanit. Soc. Sci. Commun. 2023, 10, 148. [Google Scholar] [CrossRef]
- Al-shami, S.A.; Al Mamun, A.; Rashid, N.; Al-shami, M. Microcredit Impact on Socio-Economic Development and Women Empowerment in Low-Income Countries: Evidence from Yemen. Sustainability 2021, 13, 9326. [Google Scholar] [CrossRef]
- Pal, M.; Gupta, H.; Joshi, Y.C. Social and economic empowerment of women through financial inclusion: Empirical evidence from India. Equal. Divers. Incl. Int. J. 2021, 41, 294–305. [Google Scholar] [CrossRef]
- Aziz, F.; Sheikh, S.M.; Shah, I.H. Financial inclusion for women empowerment in South Asian countries. J. Financ. Regul. Compliance 2022, 30, 489–502. [Google Scholar] [CrossRef]
- Puh, K.M.C.; Yiadom, A.; Johnson, J.; Fernando, F.; Gruet, L. Chapter 13 Legal Rights: Women’s Economic Empowerment—Case Studies. In Gender Equality and Economic Development in Sub-Saharan Africa; International Monetary Fund: Bretton Woods, NH, USA, 2024; p. CH013. [Google Scholar] [CrossRef]
- Reddy, R.G.; Rani, P. Legal empowerment and status of women. J. Community Mobilization Sustain. Dev. 2024, 19, 541–546. [Google Scholar] [CrossRef]
- Maru, V. Access to Justice and Legal Empowerment: A Review of World Bank Practice. Hague J. Rule Law 2010, 2, 259–281. [Google Scholar] [CrossRef][Green Version]
- Goodwin, L.; Maru, V. What do we know about legal empowerment? Mapping the evidence. Hague J. Rule Law 2017, 9, 157–194. [Google Scholar] [CrossRef]
- Joshi, A.; Schaaf, M.; Zayed, D. The use of legal empowerment to improve access to quality health services: A scoping review. Int. J. Equity Health 2022, 21, 136. [Google Scholar] [CrossRef] [PubMed]
- Liu, M.; Xie, Z.; Yang, A.J.; Yu, C.; Xu, J.; Ding, Y.; Bu, Y. The prominent and heterogeneous gender disparities in scientific novelty: Evidence from biomedical doctoral theses. Inf. Process. Manag. 2024, 61, 103743. [Google Scholar] [CrossRef]
- Qian, Z.; Li, J.; Zhang, Y.; Liu, Y.; Wang, Q. Understanding gender differences in online protective products purchases through an impression management perspective: Evidence from a natural experiment. Inf. Process. Manag. 2025, 62, 104181. [Google Scholar] [CrossRef]
- Grimmer, J.; Roberts, M.E.; Stewart, B.M. Machine Learning for Social Science: An Agnostic Approach. Annu. Rev. Political Sci. 2021, 24, 395–419. [Google Scholar] [CrossRef]
- Sheetal, A.; Jiang, Z.; Di Milia, L. Using machine learning to analyze longitudinal data: A tutorial guide and best-practice recommendations for social science researchers. Appl. Psychol. 2023, 72, 1339–1364. [Google Scholar] [CrossRef]
- Shu, X.; Ye, Y. Knowledge Discovery: Methods from data mining and machine learning. Soc. Sci. Res. 2023, 110, 102817. [Google Scholar] [CrossRef]
- Grossmann, I.; Feinberg, M.; Parker, D.C.; Christakis, N.A.; Tetlock, P.E.; Cunningham, W.A. AI and the transformation of social science research. Science 2023, 380, 1108–1109. [Google Scholar] [CrossRef] [PubMed]
- Castorena, C.M.; Abundez, I.M.; Alejo, R.; Granda-Gutiérrez, E.E.; Rendón, E.; Villegas, O. Deep Neural Network for Gender-Based Violence Detection on Twitter Messages. Mathematics 2021, 9, 807. [Google Scholar] [CrossRef]
- Kaplan, D. Bayesian Statistics for the Social Sciences; Guilford Publications: New York, NY, USA, 2023. [Google Scholar]
- Abu-Bader, S. Using Statistical Methods in Social Science Research: With a Complete SPSS Guide; Oxford University Press: Oxford, UK, 2021. [Google Scholar]
- UNGUREANU, L. Statistics in Social Sciences. J. Res. Educ. Sci. 2024, 15, 57–71. [Google Scholar] [CrossRef]
- Simon, V.; Rabin, N.; Gal, H.C.B. Utilizing data driven methods to identify gender bias in LinkedIn profiles. Inf. Process. Manag. 2023, 60, 103423. [Google Scholar] [CrossRef]
- Fabris, A.; Purpura, A.; Silvello, G.; Susto, G.A. Gender stereotype reinforcement: Measuring the gender bias conveyed by ranking algorithms. Inf. Process. Manag. 2020, 57, 102377. [Google Scholar] [CrossRef]
- Slokom, M.; Hanjalic, A.; Larson, M. Towards user-oriented privacy for recommender system data: A personalization-based approach to gender obfuscation for user profiles. Inf. Process. Manag. 2021, 58, 102722. [Google Scholar] [CrossRef]
- Silva, M.O.; de Melo-Gomes, L.; Moro, M.M. From words to gender: Quantitative analysis of body part descriptions within literature in Portuguese. Inf. Process. Manag. 2024, 61, 103647. [Google Scholar] [CrossRef]
- Breur, T. Statistical Power Analysis and the contemporary “crisis” in social sciences. J. Mark. Anal. 2016, 4, 61–65. [Google Scholar] [CrossRef]
- Hofman, J.M.; Watts, D.J.; Athey, S.; Garip, F.; Griffiths, T.L.; Kleinberg, J.; Margetts, H.; Mullainathan, S.; Salganik, M.J.; Vazire, S.; et al. Integrating explanation and prediction in computational social science. Nature 2021, 595, 181–188. [Google Scholar] [CrossRef] [PubMed]
- Campisi, T.; Skoufas, A.; Kaltsidis, A.; Basbas, S. Gender Equality and E-Scooters: Mind the Gap! A Statistical Analysis of the Sicily Region, Italy. Soc. Sci. 2021, 10, 403. [Google Scholar] [CrossRef]
- Kingma, D.P.; Ba, J. Adam: A Method for Stochastic Optimization. CoRR 2014, 1412, 6980. Available online: https://api.semanticscholar.org/CorpusID:6628106 (accessed on 23 October 2025).
Disclaimer/Publisher’s Note: The statements, opinions and data contained in all publications are solely those of the individual author(s) and contributor(s) and not of MDPI and/or the editor(s). MDPI and/or the editor(s) disclaim responsibility for any injury to people or property resulting from any ideas, methods, instructions or products referred to in the content. |
© 2025 by the author. Licensee MDPI, Basel, Switzerland. This article is an open access article distributed under the terms and conditions of the Creative Commons Attribution (CC BY) license (https://creativecommons.org/licenses/by/4.0/).

