Abstract
Residual and waste materials such as biowaste and the perennial energy crop Silphium perfoliatum (cup-plant) contain high fiber contents, which limit their energetic utilization in biogas plants. Pre-separating the fiber fraction can improve overall valorization. The recovered natural fibers can be further used as raw materials, e.g., in paper production or fiber-reinforced composites. This study aimed to optimize fiber extraction from biogenic residues and renewable raw materials using pilot-scale Thermal-pressure hydrolysis (TPH). Biowaste and cup-plant were used as substrates. Process parameters (150, 160, 170 °C; 15, 30, 60 min) were systematically varied to evaluate their influence on process efficiency, chemical composition, and functional properties of the resulting fiber and pulp fractions. Biowaste and cup-plant produced final products with similar dry matter (DM) contents—fibers (~36% DM) and pulp (~3.2% DM)—but differed markedly in chemical composition: biowaste was richer in nutrients, whereas the cup plant contained more fiber. Sugar release from the cup-plant increased by over 1900% during TPH and, like the organic acids, was largely relocated to the pulp fraction. Methane yields of the resulting pulps ranged between 310 and 375 LCH4kgODM−1, significantly higher than those measured in the fiber fractions, which ranged from 180 to 250 LCH4kgODM−1. Approximately 55% of the total energy potential was transferred into the pulp. Despite the formation of organic acids and potential inhibitors during TPH, no critical threshold values were exceeded. The energy balance of the Biowaste fiber processing was neutral (biowaste: energy demand 475 kWh/t, energy yield from biogas 484 kWh/t). For papermaking applications, the cup-plant proved to be significantly more suitable, as the heterogeneity and contamination of biowaste limited its material usability. The results highlight the potential of TPH for the combined energetic and material utilization of biogenic residues.
1. Introduction
The efficient use of renewable raw materials and biogenic residues from agriculture, forestry, industry, and municipalities is crucial for a circular economy, especially amid rising global energy demand and resource scarcity [1]. In Germany, changes to the Renewable Energy Act (EEG) are expected to reduce energy maize cultivation for biogas plants in favor of diverse, biodiversity-rich energy crops and the use of residual and waste materials. The Cup-plant, native to eastern North America, is thus gaining importance as a bioenergy crop in Germany [2,3]. Initially introduced as a fodder plant, it is now mainly grown for biogas production. Its perennial growth and ecological benefits align well with Germany’s sustainable bioeconomy strategy [4]. Another key feedstock in this strategy is the organic fraction of municipal solid waste (OFMSW), one of the main components of municipal waste, typically collected separately in biowaste bins. This type of biowaste was selected because it represents one of the largest biogenic residue streams in Germany and, due to its high organic content, offers significant potential for both material and energetic valorization pathways. Until now, organic waste has primarily been treated through composting and/or anaerobic digestion to generate biogas, digestate, and compost.
Biowaste and cup-plant contain organic compounds that are often difficult to degrade in biogas digesters, as they are trapped in lignocellulosic complexes and thus remain inaccessible to microorganisms. Therefore, alternative approaches that complement composting and anaerobic digestion could help optimize the value chain of these fiber-rich feedstocks. Depending on their composition, various biochemical, thermochemical, and biotechnological strategies have been investigated [5,6,7,8]. The organic fraction of OFMSW, which is rich in carbohydrates, lipids, proteins, and fibers [9,10], also offers potential for the biotechnological production of high-value products. A promising approach is TPH, a hydrothermal treatment process in which the material is exposed to temperatures of approximately 160–180 °C and a pressure of 6–10 bar. Under these conditions, fibers and soluble organic compounds can be separated. At the same time, the intensive thermal treatment ensures hygienization in accordance with the German Biowaste Ordinance (BioAbfV), making the treated material safe for reintegration into the natural nutrient cycle [11].
TPH treats biomass by heating it to 150 to 240 °C in a pressure reactor, generating overpressure of 6 to 35 bar [12]. A rapid pressure release causes instant evaporation of intracellular water. This sudden decompression creates shear forces that hydrolyze glycosidic bonds and hydrogen bridges, while steam expansion further disrupts the biomass structure [13]. The process breaks down complex fiber structures, releases organic nutrients, and enhances enzymatic hydrolysis and fermentation [14]. The degree of defibration depends on temperature and holding time, varying from surface fissures to complete disintegration of the wood structure [15], resulting in hygienization, fibril exposure, and cleavage of the lignocellulose matrix [16].
This study investigates the suitability of two fiber-rich substrates—regional biowaste and cup-plant—for fiber extraction via the TPH under systematically varied reaction temperatures and holding times. Biowaste represents a common municipal residue with significant untapped valorization potential, whereas cup-plant, a perennial crop with high land productivity, low cultivation costs, and a sustainable, fast-growing fiber alternative, constitutes a promising option for resource-efficient applications [3]. An innovative TPH process was developed to enable dual utilization of these substrates: the recovery of fibers for potential applications in the paper and fiber industry, and the energetic use of the liquid fraction as a substrate for anaerobic digestion. Reaction temperature (150–170 °C) and holding time (15–60 min) were systematically varied to optimize fiber liberation and enhance material quality. The resulting samples were comprehensively characterized with respect to chemical composition, structural properties, and potential usability. The fiber fraction was assessed according to key paper production criteria, including sheet formation, fiber length, and mechanical strength. In addition, a detailed component analysis was performed using the Weender-van-Soest method. The liquid phase was evaluated for its energetic potential by measuring specific methane yield, acid profiles, and the presence of potential inhibitory compounds for the biogas process.
Integrating material and energetic assessments within a single process design represents a novel contribution to the cascade utilization of biogenic residues. Importantly, this study constitutes the first systematic investigation of cup-plant silage and regional biowaste under varying hydrothermal process parameters in the context of TPH. The findings provide valuable insights for process optimization and the development of sustainable material-to-energy utilization pathways for previously underexploited raw material sources.
2. Materials and Methods
The experiments were conducted at the TPH facility of the State Institute for Agricultural Engineering and Bioenergy, University of Hohenheim (Backnang, Germany). Analyses took place at the University of Hohenheim (Stuttgart, Germany), Hochschule Offenburg (Offenburg, Germany), and ISF GmbH (Wahlstedt, Germany). The fiber quality analyses were conducted by Stuttgart Media University (Lenningen, Germany). All experiments were performed with multiple replicates, and results are presented as means ± standard deviations.
2.1. Samples—Biowaste
The biowaste samples used in this study originated from the Rems-Murr district (Germany) and were provided by the Rems-Murr Waste Management Authority (AWRM, Backnang, Germany) on the respective test days. The material represented the organic fraction of municipal biowaste, typically consisting of kitchen and garden waste from private households, including fruit and vegetable residues, coffee grounds, bread remains, and smaller fractions of green waste such as grass clippings and thin branches. This composition reflects the typical mixture of organic waste collected in German biowaste bins and is therefore representative of the feedstock available for decentralized biorefinery applications.
Prior to the experiments, the biowaste underwent standard pretreatment procedures commonly applied in biowaste digestion by AWRM. It was processed using a twin-shaft shredder, a magnetic separator, and a star sieve (all Günther GmbH, Wartenberg, Germany) to remove contaminants. Subsequently, the biowaste was further treated at the University of Stuttgart (ISWA, Stuttgart, Germany) to eliminate remaining impurities. Approximately 1000 kg of biowaste was loaded into a weighing and mixing tank using a wheel loader and suspended using a twin-shaft shredder (XRipper® XRL, Vogelsang GmbH & Co. KG, Essen, Germany). An eccentric screw pump (CC-Series®, Vogelsang GmbH & Co. KG) conveyed the suspension through a RotaCut® rotating rake mechanism (RCQ) for additional size reduction and separation of larger heavy contaminants. A hydrocyclone (MEIKO GREEN Waste Solutions GmbH, Offenburg, Germany) removed heavier impurities via centrifugal force, preparing the lightweight organic fraction for TPH. Finally, a screw press separator extracted process water, delivering the pretreated biowaste for the experiments. Contaminant separation settings remained constant throughout all tests. The experimental campaign using the biowaste substrate was conducted between February and April 2024.
2.2. Samples—Cup-Plant
The Cup-plant silage was taken from a silo in Bavaria (Ziemetshausen, Germany), packaged in big bags, transported to the pilot facility, and processed on the same day. The Cup-plant had been separately ensiled in a drive-over silo in September 2023. The experimental series with the Cup-plant was conducted in May 2024.
2.3. Description of the Experimental Facility
The fiber treatment plant (Figure 1.) for natural fiber production was established in 2023 at the biogas plant of the Rems-Murr Waste Management Authority (Backnang-Neuschöntal, Germany). Supported by the Baden-Württemberg Ministry of Environment within the ERDF “Bioeconomy Bio-Up-Cycling” program, modular biorefineries for recovering high-quality raw materials from biowaste were developed. The “Biowaste to Products (BW2Pro)” project expanded the biowaste treatment facility into a decentralized biorefinery, running from October 2021 to October 2024 and co-financed by the Ministry and the EU. Recovered natural fibers are intended for packaging paper or composite materials, while the liquid phase is separated mechanically and used for energy production in a new two-stage biogas plant with a fixed-bed digester.

Figure 1.
Control cabinet of the TPH system (left), 200 L hydrolysis reactor (center), 400 L expansion tank and pulper, deflaker (right).
The TPH system (Figure 2), manufactured by Agres Systems GmbH (Seekirchen, Austria), processes up to 1000 kg of substrate per day in semi-continuous mode. Each cycle loads 100–200 kg of substrate via a screw feeder from the storage tank into a gas-tight, pressure-resistant reactor, which is heated to 140–170 °C at a pressure of 6–10 bar using an electric thermal oil heating system. After thermal treatment, the biomass is released Via explosive decompression (steam explosion) into a buffer/pulper tank, where the suspension is adjusted to 2–7% dry matter (DM) for further processing. The suspension passes once through a deflaker (Hueber, HO-G, Kulmbach, Germany) for mechanical fiber separation, with the deflaker settings kept constant throughout all experiments. The resulting suspension is then fed into a screw press separator, separating it into fiber and liquid fractions. Mass flows of both fractions are continuously monitored to ensure process control and reproducibility. The entire process, excluding the holding time, takes approximately two hours per cycle.
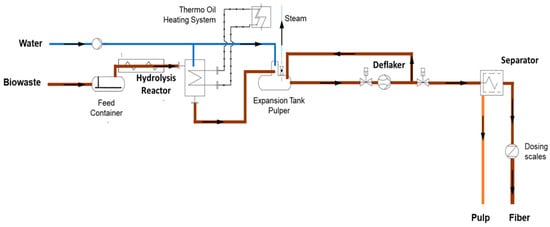
Figure 2.
Schematic of the installed TPH system in Backnang (2024).
2.4. Experimental Setup
The TPH experiments were conducted according to a randomized design based on a predefined parameter matrix (Table 1). Each cycle used 150 kg of substrate, which was mixed with water to achieve a dry matter content of approximately 25% in the reactor suspension. The reactor volume was 200 L, and the substrate was introduced Via a twin-shaft screw feeder and continuously stirred during treatment using an agitator. Reactor temperature varied between 150 and 170 °C, holding time ranged from 15 to 60 min, and the pressure ranged from 6 to 10 bar, depending on the specific experimental setting. After thermal treatment, the biomass was released via explosive decompression into a 400 L expansion/pulper tank, where the suspension was adjusted to approximately 5% DM for mechanical processing using a deflaker. The deflaker settings were kept constant throughout all experiments. A flowmeter ensured that the entire 400 L tank contents passed at least once through the deflaker. The resulting suspension was then fed over the deflaker into the screw press for separation into fiber and liquid fractions. Fibers were collected, weighed, and subsequently frozen. At least two independent runs per parameter combination were conducted on separate days to ensure reproducibility and account for substrate variability. Prior to each experiment, a preparatory run without sampling was performed to prevent cross-contamination; these runs were excluded from the analysis. Through all experiments, electrical power consumption and material flows were continuously monitored. The detailed information on substrate mass, reactor and expansion volumes, temperature, pressure, holding time, feeding, suspension preparation, constant deflaker settings, flow monitoring, and product separation ensures that all TPH experiments are fully reproducible.

Table 1.
Overview of the tested parameter combinations (reaction temperature and holding time) used in TPH for fiber extraction from cup-plant and biowaste. Experimental points were randomly selected from the full matrix.
Not all temperature–holding time combinations were tested for the cup-plant. 160 °C for 15 min and 60 min as well as 170 °C for 30 min were not included. This was due to limited substrate availability and the high logistical effort required to provide approximately 250 kg of fresh silage per experiment (including blank run). In addition, the operating limits of the TPH system prevented adjustment of the boundary conditions, resulting in a relatively narrow range of tested temperatures. Under these constraints, it was unclear in advance whether significant differences could be expected between the untested combinations. The selection of the tested conditions was made to ensure meaningful results for evaluating process performance. Despite the omitted combinations, the systematic variations in the remaining temperatures and holding times allow a robust analysis of process trends. The untested conditions will be addressed in future studies to further optimize the TPH process.
2.5. Determination of Biogas Potential
The methane potential of each sample was determined using the Hohenheim Biogas Yield Test (HBT) according to VDI 4630 [17,18]. The HBT assesses maximum methane yield, methane content, methane formation kinetics, and potential inhibitors. It uses 100 mL glass syringes sealed with silicone and a plastic clip. During incubation at 37 °C, syringes rotate in a disk within an incubator. Methane volume is read directly from a volumetric scale once more than 20 mL of gas is produced. Methane content is measured by infrared analysis (Advanced Gasmitter, Pronova Analysetechnik, Berlin, Germany) after drying the gas with SICAPENT® desiccant (Merck KGaA, Darmstadt, Germany). The retention time was 35 days. Each sample was analyzed in triplicate. The inoculum to substrate ratio was 2.25:1 based on organic dry matter (ODM). The inoculum came from a 400 L laboratory reactor operated at 37 °C with controlled feeding to ensure low intrinsic methane potential. Besides the inoculum correction per VDI 4630, a positive correction using two standard substrates (hay and compound feed) was applied. Gas volumes were normalized to standard conditions (0 °C, 1013 hPa, dry gas). Further methodological details are in Hülsemann et al. (2020) [19].
2.6. Analytic Parameters
The DM and ODM contents were determined according to DIN EN 12879 [20] and DIN EN 12880 [21].
Fatty acid concentrations were analyzed using gas chromatography (GC 2010plus, Shimadzu, Kyoto, Japan) and high-performance liquid chromatography (HPLC, Bischoff Analysetechnik, Leonberg, Germany). Volatile fatty acids (VFAs) were determined by GC equipped with a flame ionization detector (FID) and a 50 m capillary column (CP-Wax 58/FFAP CB, Agilent, Santa Clara, CA, USA). Helium was used as the carrier gas. The injector temperature was set to 150 °C, and the detector temperature to 280 °C. Prior to analysis, samples were acidified with 17% phosphoric acid. The liquid phase was analyzed directly, while solid samples were centrifuged (Eppendorf 5415, Eppendorf, Hamburg, Germany) to obtain a clear supernatant.
Lactic acid and alcohol concentrations were measured by HPLC equipped with a refractive index (RI) detector and a BioRad Aminex HPX-87H column (7.8 × 300 mm, 5.0 µm particle size) with a matching pre-column. Samples were diluted with 0.2 N sulfuric acid and water, then centrifuged at 13,200 rpm (Eppendorf 5415 D). For solid samples, the supernatant was prepared in the same way as for GC analysis.
The pH value of each sample was measured using a pH meter (HANNA Instruments 211, Woonsocket, RI, USA).
Fiber components were characterized according to the Weender–Van Soest analysis, differentiating between neutral detergent fiber (NDF), acid detergent fiber (ADF), and acid detergent lignin (ADL), as described by Van Soest et al. [22].
All chemical analyses were carried out at least in duplicate to ensure data reliability.
2.7. Investigation of the Toxicity of the Pulp
Liquid samples were thawed, shaken, filtered, and partly diluted with water to remain within the linear measurement range. Quantification was performed using external standards. For ICP-OES, samples were evaporated and ionized in plasma. Heavy metals were analyzed at the following wavelengths (nm): Cu 324.754, Zn 213.856, Cr 283.563, Cd 228.802, Pb 220.353, Ni 221.647. HMF and furfural were measured using an HPLC column (Merck LiChrospher 100 RP-18, 5 µm, 250 × 3 mm, Merck, Darmstadt, Germany) with UV detection at 284 nm. The phenol index was determined using the LCK3468 cuvette test (Hach Lange, Düsseldorf, Germany) and a DR3900 spectrophotometer (Hach Lange, Düsseldorf, Germany). Standards applied were ISO 6964:2017 and DIN 38409 H16 [23,24].
2.8. Investigation of Fiber Quality at the Institute for Natural Product Processing Stuttgart
Fiber samples from the TPH process were analyzed in a commissioned study at the Institute for Natural Product Processing, Hochschule der Medien, located on the research campus in Lenningen, Baden-Württemberg, Germany. After each TPH trial at the biorefinery, samples were packed on-site, deep-frozen, and transported to Lenningen for detailed analysis of fiber structure and quality.
2.8.1. Machines and Equipment Used for the Investigation of Fiber Structure and Quality
Fiber properties and preparation were analyzed using specialized laboratory equipment, including image analyzers, climate data loggers, tensile testers, balances, mills, and sheet formers. All measurements were performed according to relevant DIN EN ISO standards, ensuring reproducibility and accuracy (Table 2).

Table 2.
Machines and Equipment used for fiber analysis and processing.
2.8.2. Separation of Fiber Samples
Different processing methods were required for the raw fiber materials. The cup-plant samples were highly homogeneous with minimal contaminants. No dry separation or further pre-treatment was necessary. In contrast, biowaste samples, being heterogeneous and containing significant impurities, required preparatory treatment for smooth mechanical processing. Based on prior tests, the samples were first homogenized by shredding in a commercial kitchen cutter for one minute to break up clumps and facilitate separation. A specially designed suction screen with an attached cyclone and two collection containers separated the material into a fiber-rich light fraction and an impurity-rich heavy fraction. The fiber-rich fraction was further processed for paper production, while the heavy impurities were removed. To increase fiber yield, the heavy fraction underwent an additional screening step. Sieving was considered as an alternative but proved ineffective due to the wide variation in impurity densities and particle sizes.
2.8.3. Sheet Formation
To assess the strength properties and overall papermaking suitability of cup-plant and biowaste materials, laboratory hand sheets were produced. The resulting fiber suspension was also used to determine the degree of refining and conduct image-based fiber analysis. For each sample, 30 g oven-dry material was dispersed in 2 L of water using a laboratory pulper in accordance with DIN EN ISO 5263-1:2004 [25] to ensure a homogeneous suspension. Cup-plant samples were subsequently refined using a PFI mill (DIN EN ISO 5264-2:2011 [26]) at 3000 revolutions to reduce residual shive content. After filtration Via Nutsche, the suspension was diluted and processed accordingly. Due to potential contaminants, biowaste samples were not refined but directly transferred to sheet formation. Hand sheets were prepared at a consistency of 0.3% following the Rapid-Köthen method (DIN EN ISO 5269-2:2005 [27]), with four sheets per sample and a target basis weight of 200 g/m2. Given the typically reduced drainage of natural fibers, a coarser mesh was used to ensure uniform and reproducible sheet formation.
2.8.4. Determination of the Degree of Refining
The drainage behavior of all suspensions was assessed using the Schopper-Riegler method in accordance with ISO 5267-2:2022 [28]. This analysis was performed on both refined and solely pulped samples.
2.8.5. Image-Based Fiber Analysis
All prepared suspensions were characterized using image analysis with the Fiber Analyzer (Valmet FS5). Particular emphasis was placed on average fiber length, fiber width, fines and gel-like substance content, as well as fibrillation degree.
2.8.6. Mechanical Strength Analysis of Laboratory Sheets
Mechanical strength properties of the laboratory sheets were determined by tensile testing. Prior to testing, basis weight was measured according to DIN EN ISO 536:2012 [29], and thickness, density, and specific volume were determined following DIN EN ISO 534:2012 [30]. Tensile tests were conducted in vertical mode according to DIN EN ISO 1924-2:2009 [31], with the specimen length reduced to 90 mm to accommodate the limited stability of the sheets.
3. Results and Discussion
3.1. Results of the Weender-Van-Soest Analysis (Feed Analysis)
Material properties of the raw substrates, hydrothermally treated fibers, and pulps are summarized in Table 3. The input of biowaste exhibited a significantly higher DM content (Biowaste 33.90 ± 3.43% DM, Cup-plant 26.12 ± 0.41% DM). However, the impact of this difference in input DM was largely mitigated during TPH processing of the fibers, primarily due to the addition of 400 L of water in the deflaker. A comparison of the input substrates reveals that biowaste contains lower amounts of crude fiber structural carbohydrates such as NDF and ADF compared to the cup-plant (Table 3). At the same time, biowaste contains higher proportions of crude protein crude fat starch and sugar. These differences persist in the resulting fibers after TPH treatment. The cup-plant fibers continue to show significantly higher levels of crude fiber and structural substances, while biowaste fibers are characterized by a higher content of easily degradable organic components. These differences are also reflected in the pulp: pulp obtained from biowaste contains significantly higher amounts of crude protein, crude fat, starch, and sugar than pulp from the cup-plant.

Table 3.
Comparative analysis of constituent components in biowaste and cup-plant substrates and their respective fractions obtained from the TPH treatment, based on Weender-van-Soest methodologies. Different letters indicate statistically significant differences between the fractions of biowaste and cup-plant at p < 0.05 according to Tukey’s HSD/Kramer post hoc test.
The analysis revealed a pronounced increase in total sugar content of the biomass following TPH. While biowaste exhibited only moderate increases of approximately 4% FM in starch and 10% FM in sugar, cup-plant responded much more strongly, with sugar concentrations rising by up to 1900% FM and starch showing a calculated increase of 19% FM. These differences reflect the distinct chemical composition and reactivity of the substrates under TPH conditions. The apparent rise in starch is most likely due to improved extractability or methodological and computational effects, as no enzymatic starch synthesis can occur under thermal-hydrolytic conditions. In contrast, the substantial increase in sugar content results from the hydrolytic cleavage of complex polysaccharides within the lignocellulosic matrix. During TPH, glycosidic bonds in hemicelluloses and cellulose chains are broken, leading to the formation of mono- and oligosaccharides, particularly low-molecular-weight sugars such as glucose. This transformation significantly increases the soluble organic fraction and enhances substrate accessibility for subsequent anaerobic digestion [32]. Overall, the results demonstrate the effectiveness of TPH in converting recalcitrant lignocellulosic biomass into more readily degradable and biologically accessible substrates. These findings are consistent with those of Świątek et al. (2020) [33], who likewise reported that thermochemical hydrolysis effectively depolymerizes complex polysaccharides and releases low-molecular-weight sugar compounds.
TPH treatment causes a distinct redistribution of organic and inorganic substances between fiber and pulp fractions. The solid phases are enriched in ODM (88.30 ± 3.06% DM for biowaste; 94.24 ± 0.21% DM for cup-plant), whereas pulps contain significantly less organic matter (biowaste: 83.61 ± 2.69% DM; cup-plant: 77.16 ± 0.61% DM). This behavior is consistent with observations in hydrothermal fractionation studies, where solid fractions retain a higher proportion of organic constituents while soluble inorganics accumulate in the liquid phase [34].
This suggests that organic compounds preferentially partition into the fiber phase during fractionation, while inorganic materials such as sand, clay, and fine minerals accumulate in the pulp. This effect primarily occurs during the deflaking process, where the substrate is mechanically fragmented and intensively washed with water. Insoluble and denser inorganic particles are removed from the fibers and transferred into the pulp fraction. The resulting compositional shift has important implications for downstream processing, as the elevated mineral content in the pulp can cause issues such as sedimentation, abrasion, or interference with biological degradation, which require careful management in subsequent utilization steps.
TPH treatment has a significant effect on the DM content of the resulting fiber and pulp fractions, with intensified process conditions leading to a significant increase. This effect was confirmed for both substrates studied. In both cases, higher temperatures and longer holding times resulted in notable increases in DM content of both fiber and pulp fractions (Table 4). Several factors contribute to the increase in DM content during TPH treatment. As the treatment intensity increases, both pressure and temperature inside the reactor rise accordingly. The subsequent rapid depressurization, known as steam explosion, causes the vaporization of water bound within the substrate as well as unbound water present in the reactor, thereby increasing the DM content in both the fiber and pulp fractions. More intensive treatment also induces thermomechanical effects such as fiber swelling, cell wall rupture, and shear-induced disintegration, which break down the fibers and release smaller organic compounds into the pulp, further enhancing its DM content [34]. In addition, a more intensively treated fiber structure can be more effectively compacted, as larger fiber particles become more flexible and compressible due to improved cell wall disruption. This leads to denser packing of the press cake in the screw separator and enhances dewatering efficiency, resulting in a further increase in the DM content of the fiber fraction [35]. These results align with the findings of Mosier et al. (2005) [35], who demonstrated that severe thermo-chemical pretreatment disrupts the cell wall structure of lignocellulosic biomass, significantly altering water retention, solubility, and dewaterability. The increased DM content is particularly relevant for the energetic utilization of the pulp fraction and should be considered in integrated process evaluations.

Table 4.
Comparison of DM content of biowaste, cup-plant, and the resulting fiber and pulp fractions after TPH treatment. Different letters indicate statistically significant differences in the fractions of biowaste and cup-plant under different TPH treatments (p < 0.05, Tukey’s HSD/Kramer post hoc test).
Table 5 presents the CF content of the fractions under different TPH conditions. In the untreated substrates, the CF content was 32.07 ± 1.18% DM for biowaste and 36.99 ± 1.97% DM for cup-plant. Following TPH, the CF content increased in the fiber fraction by up to +18% for biowaste and +8% for cup-plant, while the pulp fraction increased by +66% (biowaste) and +40% (cup-plant), respectively, from the mildest to the most intensive treatment. These increases are largely attributed to the same mechanisms responsible for the rise in DM content: high steam pressure followed by rapid depressurization (steam explosion) and thermomechanical effects such as cell wall rupture, fiber splitting, and improved dewatering efficiency. These processes enhance the transfer of soluble organic components into the pulp, while the remaining fiber fraction becomes enriched in lignocellulosic material. It should be emphasized, however, that the increase in CF content cannot be entirely explained by the same factors as the DM increase; the enrichment of lignin and cellulose residues in the fiber fraction likely contributes specifically to the CF increase. Overall, TPH enables a targeted redistribution of constituents, increasing crude fiber content for material applications and improving the energetic value of the pulp [35,36].

Table 5.
Comparison of CF in DM according to the Weender–Van Soest analysis was conducted for biowaste and cup-plant, as well as for their respective fractions resulting from the TPH treatment process. Different letters indicate statistically significant differences in the fractions of biowaste and cup-plant under different TPH treatments (p < 0.05, Tukey’s HSD/Kramer post hoc test).
The TPH process enables the selective fractionation of lignin, cellulose, and hemicellulose, enhancing their potential for various downstream industrial and material applications [37]. During TPH, elevated temperatures combined with rapid pressure release in a steam explosion promote the depolymerization of hemicellulose and its solubilization into the aqueous phase [12]. The thermomechanical stresses involved disrupt the hemicellulose-lignin-cellulose matrix, increasing the accessibility of hemicellulose to hydrolysis [33]. As a result, hemicellulose content in the fiber fraction decreases progressively with increasing process intensity due to partial breakdown and transfer into the liquid fraction. In this study, biowaste initially contained 9.05% DM hemicellulose, which was reduced to 2.63% DM after the most intensive TPH treatment (170 °C, 60 min), representing a decrease of approximately 71.0%. Similarly, the cup-plant hemicellulose content decreased from 12.83% DM to 4.11% DM under the same conditions, a reduction of about 68.0%. Under milder treatment conditions, hemicellulose degradation was minimal, as also reflected in Table 6. These findings demonstrate that TPH effectively mobilizes hemicellulose from solid biomass into the liquid phase, facilitating subsequent valorization routes such as fermentation or chemical conversion. However, the reduction in hemicellulose in the fiber fraction may alter its mechanical and rheological properties, highlighting the need to optimize hemicellulose removal depending on the intended end use of the fiber.

Table 6.
Comparison of hemicellulose content (% DM) determined by Weender-van-Soest analysis for biowaste and cup-plant samples, including their respective fractions obtained after TPH pretreatment. Different letters indicate statistically significant differences in the fractions of biowaste and cup-plant under different TPH treatments (p < 0.05, Tukey’s HSD/Kramer post hoc test).
3.2. Results of the Acid Analysis and Specific Methane Yield
3.2.1. pH-Value
TPH alters both the physical structure and chemical composition of the substrates. Increasing treatment intensity (higher temperature and longer holding time) led to a significant decrease in pulp pH, e.g., to pH 4.43 (biowaste) and pH 4.67 (cup-plant) at 170 °C and 60 min. The mildest treatment (150 °C, 15 min) resulted in the highest pH values. This pH reduction, shown in Figure 3, indicates the formation of organic acids from the degradation of readily available carbohydrates [38,39]. Importantly, the pulp pH can be deliberately controlled via TPH process parameters, especially temperature and holding time (Figure 3). This allows for optimization of chemical conditions to enhance downstream processes such as anaerobic digestion. The high initial pH variability in biowaste highlights substrate heterogeneity and underscores the need for targeted input characterization [40]. The cup-plant silage showed too high pH of 5.5, indicating insufficient lactic acid fermentation and poor silage quality [41]. Well-fermented silages typically have pH values ≤ 4.2. Elevated pH negatively affects storage stability and microbial availability during digestion. The pH-value strongly influences microbial activity and chemical stability in subsequent process steps [42,43], making targeted pH control via TPH a key factor for process optimization. TPH partially degrades organic material by attacking chemical bonds, cleaving macromolecules into smaller soluble units and altering biomass composition without complete decomposition [44]. Adjusting pulp pH via process parameters enhances carbon bioavailability and improves downstream biological process efficiency. Treatment above 150 °C with a holding time of 15 min significantly decreased pH in both substrates, affecting fiber and pulp fractions. The lowest pulp pH values were observed under the most intensive conditions (170 °C, 60 min), highlighting TPH’s potential to optimize pulp pH for subsequent biological applications.
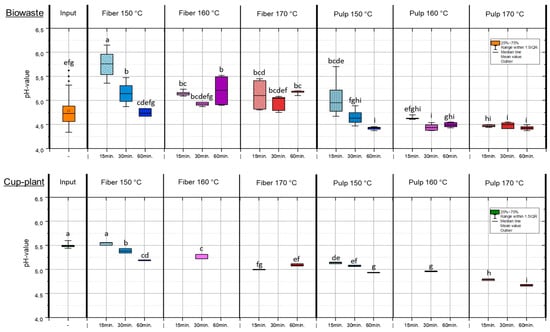
Figure 3.
pH-values in the FM under temperature and holding time settings during TPH treatment. Different letters indicate statistically significant differences between treatments at p < 0.05 according to Tukey’s HSD/Kramer post hoc test.
3.2.2. Lactic-, Acetic- and Butyric Acid Content
Figure 4 shows the lactic acid content in the DM of various substrates after TPH treatment. The results demonstrate that lactic acid can be efficiently extracted from the substrate and predominantly transferred into the pulp fraction, thereby increasing its availability for downstream applications. The lactic acid content is primarily determined by the initial substrate composition and only marginally influenced by process parameters such as temperature and holding time. In biowaste, which exhibited a considerably higher initial lactic acid content, approximately 24% of the total lactic acid (based on FM) was transferred into the pulp, about 14% remained in the fiber fraction, while around 62% was lost during treatment. These losses mainly resulted from conversion into other organic compounds under hydrothermal conditions and evaporation during pressure release [45,46,47]. A similar distribution was observed for cup-plant. The targeted transfer of lactic acid and other organic acids into the pulp through TPH makes this fraction particularly valuable, as it serves as a readily available carbon source for downstream biological processes such as anaerobic digestion. The input substrate cup-plant contained on average only 2.63 ± 0.86 g/kg DM lactic acid. This is attributed to the low content of water-soluble sugars in the raw plant, which are essential for natural lactic acid fermentation during ensiling. Combined with a pH of 5.5 [48], lactic acid formation during ensiling was strongly limited, promoting undesirable fermentation pathways. Compared to collected biowaste, cup-plant exhibited an approximately 16-fold lower initial value in DM, resulting in significantly lower lactic acid concentrations in both fiber and pulp fractions. Overall, the results show that lactic acid from biowaste as well as from cup-plant can be efficiently separated and enriched in the pulp fraction, significantly enhancing its usability in biological processes. While the lactic acid content of cup-plant remained notably low across all fractions due to faulty fermentation during ensiling, biowaste exhibited higher concentrations, albeit with substantial variability caused by its heterogeneous substrate composition.
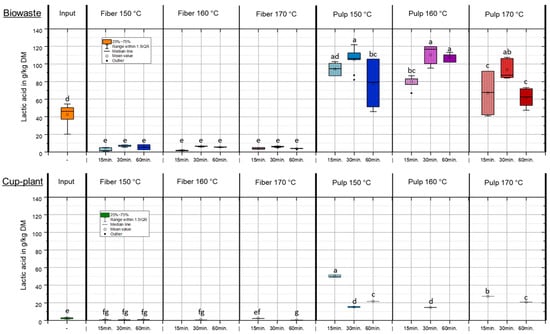
Figure 4.
Lactic acid content in DM under temperature and holding time settings during TPH treatment. Different letters indicate statistically significant differences between treatments at p < 0.05 according to Tukey’s HSD/Kramer post hoc test.
Figure 5 shows the acetic acid content in the DM under varying temperature and holding time conditions during TPH. During TPH, complex organic compounds such as lignocellulose and proteins are broken down into low-molecular-weight substances at temperatures of 160–230 °C and pressures of 6–40 bar. Acetic acid is one of the main products and is primarily formed through the hydrothermal cleavage of acetyl groups from hemicelluloses and the thermal degradation of monosaccharides via intermediates such as 5-HMF [46,49]. Both mechanisms occur simultaneously and contribute significantly to acetic acid accumulation in the liquid phase [50]. After TPH, biowaste exhibited an average increase in acetic acid content (FM) of 87% compared to the untreated input. A more pronounced effect was observed for cup-plant, which had approximately twice the initial concentration of biowaste and showed a marked increase in acetic acid in the pulp fraction under more intensive conditions (>160 °C) (Figure 5). Subsequent solid–liquid separation via screw press revealed that the majority of acetic acid was transferred into the pulp: 93% for biowaste and 90% for cup-plant, with the latter containing higher absolute amounts due to its elevated initial content. This phase-specific enrichment is advantageous for downstream processes, as it facilitates the utilization of organic acids in biotechnological or chemical applications [49]. The yield and distribution of acetic acid are strongly influenced by the substrate composition. With increasing treatment intensity, the hemicellulose fraction in the fibers is degraded (Table 6) and accumulates as acetic acid in the pulp. This effect is particularly evident for cup-plant, whereas it is less pronounced for biowaste—even though both substrates have similar hemicellulose contents and biowaste contains higher sugar levels in the input. Since the relative increase in acetic acid is comparable for both substrates, the initial acetic acid content in the input ultimately represents the decisive factor influencing the outcome.
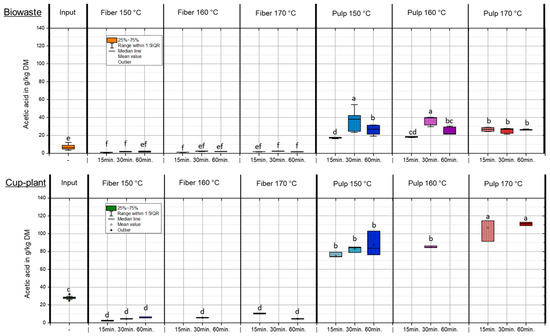
Figure 5.
Acetic acid content in the DM under different temperature and holding time settings during TPH treatment. Different letters indicate statistically significant differences between treatments at p < 0.05 according to Tukey’s HSD/Kramer post hoc test.
Butyric acid concentrations in the fiber and pulp fractions following TPH were generally low, with the acid nearly entirely transferred into the pulp (Appendix A Figure A1). In the biowaste fiber fraction, less than 0.4 g/kg DM was detected, indicating an almost odorless baseline condition. In contrast, the input silage of cup-plant exhibited a significantly elevated butyric acid content of 11.55 ± 0.59 g/kg DM, clearly indicating severe fermentation defects during ensiling, as previously described by Baumgart [48]. After TPH treatment, butyric acid in the fiber fraction of cup-plant was markedly reduced but still ranged from 0.5 to 1.8 g/kg DM, suggesting a remaining potential for odor emissions. The fresh mass balance revealed substantial total butyric acid reductions compared to the input: −63.6% for biowaste and −85.3% for cup-plant. These losses are attributed to two primary mechanisms: First, under TPH conditions—high temperature, pressure, and acidic pH—butyric acid may degrade into smaller molecules or other organics. Second, due to its high volatility, it can partially evaporate during the pressure release phase (“flash release”) [46,47].
3.2.3. Specific Methane Yield
Figure 6 shows the specific methane yields (SMY) of biowaste and cup-plant under different TPH conditions. In both substrates, the energetic potential was markedly shifted toward the pulp fraction, with an average of approximately 55% (biowaste) and 53% (cup-plant) transferred to the pulp, and the remainder retained in the fiber. This indicates a comparable energy redistribution for both substrates, with biowaste showing a slightly stronger shift toward the pulp. The SMYs of the substrates and their fractions fall within the range reported in the literature for organic residues and energy crops [51,52,53]. The results demonstrate that TPH preferentially transfers easily degradable compounds into the pulp, thereby enhancing its energetic value, even though a substantial portion of the organic matter remains in the fiber fraction. For the cup-plant, more intensive treatment (170 °C, 60 min) led to a pronounced increase in the SMY of the pulp (+13% compared to 150 °C, 15 min). This effect is attributed to enhanced disintegration of the fiber-rich biomass under harsher conditions, which improves microbial accessibility. Given the higher fiber content of cup-plant compared to biowaste (Table 3), this explains the substantial increase in pulp SMY. In contrast, biowaste exhibited a lower SMY under intensive conditions (170 °C, 60 min), decreasing by approximately 11%. Here, thermal degradation of easily degradable components such as sugars and proteins led to the formation of inhibitory by-products, reducing bioavailability. Similar observations were reported by Mosier et al. [35] and Barakat et al. [54], showing that high temperatures and extended holding times can promote fiber disruption while simultaneously degrading fermentable sugars, thereby reducing SMY.
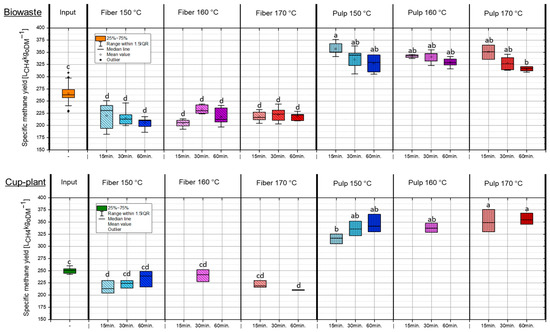
Figure 6.
SMY in the ODM across the investigated temperature and holding time settings during TPH treatment. Different letters indicate statistically significant differences between treatments at p < 0.05 according to Tukey’s HSD/Kramer post hoc test.
Overall, the results indicate that TPH predominantly transfers easily degradable material into the pulp, enhancing its SMY. For cup-plant, more intensive treatment improves fiber degradability, whereas biowaste under harsh conditions is negatively affected by sugar and protein degradation. Therefore, TPH can optimize energetic utilization in a fraction-specific manner but must be adapted to the substrate.
3.3. Effect of TPH Treatment on the Concentration of Toxic Substances in the Pulp
Figure 7 illustrates phenol concentrations (g/L FM) in both substrates throughout the TPH process. Alongside acetic acid, phenolic compounds are major byproducts of TPH, while inhibitors like HMF and furfural appear only above ~150 °C [55]. In cup-plant, phenol content in DM increased with process severity. Maximum values were 0.085 g/L FM (biowaste) and 0.102 g/L FM (cup- plant). Phenols impair microbial cells by altering membrane permeability and inactivating key enzymes [56,57,58,59]. Khan et al. [60] identified phenol as the most potent inhibitor in biogas processes. Fang et al. [61] reported two degradation pathways: via benzoate to VFAs (meso- and thermophilic) and via caproate to acetate (thermophilic only). Chapleur et al. [62] showed that low phenol levels (0.01–0.1 g/L FM) degrade fully within 20 days under a 140-day HRT. The measured values in this study (0.085 and 0.102 g/L) fall within this degradable range. Medium levels (0.5–1 g/L) required ~60 days, while concentrations > 1.5 g/L caused notable inhibition (IC50 = 1.25 g/L). Although the highest TPH intensity (170 °C, 60 min) increased phenol concentrations in cup-plant, levels remained well below inhibitory thresholds. Changes in SMY in the pulp (Figure 6) are therefore not attributable to phenols, but to substrate-specific TPH effects—enhanced fiber disruption in cup-plant and thermal degradation of easily fermentable sugars/proteins in biowaste. Overall, TPH releases only minor amounts of phenols, which do not significantly affect anaerobic digestion.

Figure 7.
Phenol content in FM across the investigated temperature and holding time settings during TPH treatment. Different letters indicate statistically significant differences between treatments at p < 0.05 according to Tukey’s HSD/Kramer post hoc test.
Hydroxymethylfurfural (HMF), or 5-(hydroxymethyl)furfural, is an aldehyde and furan derivative formed through the non-enzymatic thermal degradation of sugars. Commonly used as a marker for heat treatment in food, HMF and related furan compounds such as furfural are known to inhibit microbial growth, cause DNA damage, and block key glycolytic enzymes [63,64].
Figure 8 illustrates HMF concentrations in the DM of pulp fractions under various TPH conditions. HMF levels in biowaste pulp were significantly higher than in cup-plant, primarily due to the higher sugar content of the biowaste feedstock. In contrast, sugar degradation during ensiling reduces HMF formation in cup-plant (see Table 3). For both substrates, more intensive TPH treatments led to increased HMF levels, indicating enhanced thermal breakdown of carbohydrates.

Figure 8.
HMF content in the FM across the investigated temperature and holding time settings during TPH treatment. Different letters indicate statistically significant differences between treatments at p < 0.05 according to Tukey’s HSD/Kramer post hoc test.
Maximum HMF concentrations detected were 0.074 g/L FM in biowaste and 0.013 g/L FM in cup-plant pulp. According to Barakat et al. [54], HMF levels up to 1 g/L FM in a xylose environment do not impair methane yield. Similarly, Badshah, M. [65], found no inhibition of methane production up to 3 g/L FM, with complete inhibition only at 6 g/L FM. Thus, the values observed in this study are far below inhibitory thresholds. HMF concentrations increased significantly with TPH severity, especially at 170 °C and 60 min. This is attributed to enhanced thermal degradation of hexose sugars such as glucose and fructose [66,67]. Although more intensive treatments promote formation of inhibitors like HMF, the levels remain within a non-inhibitory range, allowing improved substrate accessibility and methane yield. Furfural was also analyzed (Figure 9). Concentrations were notably lower than HMF or phenols: 0.011 g/L FM in biowaste and 0.009 g/L FM in cup-plant.

Figure 9.
Furfural content in FM across the investigated temperature and holding time settings during TPH treatment. Different letters indicate statistically significant differences between treatments at p < 0.05 according to Tukey’s HSD/Kramer post hoc test.
The results of this study demonstrate that thermochemical treatment of biowaste and cup-plant via TPH increases the concentrations of potentially inhibitory compounds, such as phenols, HMF, and furfural. However, the measured levels in both substrates remained well below critical thresholds known to significantly impair anaerobic digestion. Therefore, TPH treatment appears promising for enhancing the energetic valorization of the pulp without substantially compromising methane production.
3.4. Mass and Energy Balancing of the TPH
3.4.1. Mass Flow Diagrams Through TPH
During the experimental series with TPH, the mass balances of the newly developed fiber processing system were also evaluated. The results obtained under varying temperature and holding time conditions showed no significant differences and were therefore averaged (N = 27 for biowaste, N = 12 for cup-plant). The fresh mass balance shown in Figure 10 includes both substrates, as no significant differences were observed here either (N = 39). The observed variability in the measurements is attributed primarily to system-specific effects rather than to the applied process settings.
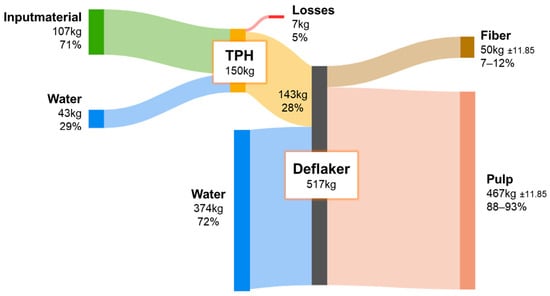
Figure 10.
FM balance throughout the processing steps of the TPH in Backnang.
To achieve the optimal DM content of ~25% in the TDH reactor, additional water was introduced prior to each experiment. Minor mass losses occurred during the steam explosion due to vapor release into the atmosphere. For the mechanical treatment by the destipper, a substantial addition of water was required to produce a pumpable suspension, indicating potential for improving water efficiency. Following the destipper and final separation, a fiber-rich fraction remained, suitable for material applications, while the majority of the substrate was recovered as pulp for energetic utilization in fixed-bed anaerobic digestion. The high number of measurement repetitions and the consistent reproducibility of the mass balances confirm efficient recovery of organic matter and reliable process performance of the fiber processing system. Variations in process parameters such as temperature and holding time had no measurable impact on the distribution of mass flows. For standardization, fresh water was used; however, future applications should evaluate the use of recycled process water to reduce overall consumption while simultaneously enriching the organic content of the system. This could further enhance biogas yields. Additional investigations into closed water cycles and their microbial implications are therefore recommended.
Figure 11 shows the distribution of ODM from biowaste after fiber processing. A larger proportion of the organic matter remains in the fiber fraction, while the remainder is retained in the pulp. The high organic content of biowaste necessitates both material utilization of the fiber and energetic valorization of the pulp.
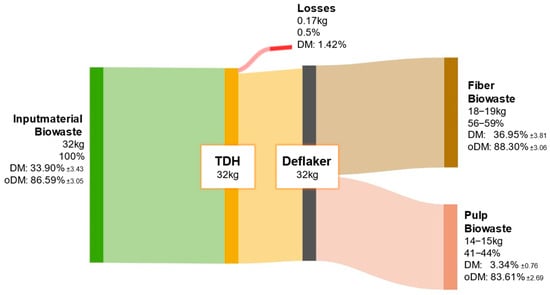
Figure 11.
ODM balance of biowaste throughout the processing steps of TPH.
The ODM balance of the cup-plant is shown in Appendix A Figure A2. Of the initial 25 kg ODM input from the cup-plant substrate after the TPH process, approximately 15 to 16 kg (60–64%) was assigned to the fiber fraction, while 9 to 10 kg (36–40%) remained in the pulp. Compared to biowaste, a more pronounced shift toward the fiber fraction was observed, due to the higher structural fiber content in the cup-plant (Table 5). This enables more efficient mechanical separation of fiber-rich components during TPH.
3.4.2. Energy Flow Diagrams Through TPH
Figure 12 presents the average energy balance derived from 36 experimental runs with municipal biowaste carried out at the TPH pilot plant in Backnang. All values are standardized to one tonne of FM, enabling a reliable assessment of the overall energy efficiency of the process. These findings provide a robust basis for the further development of the TPH concept with respect to potential energy self-sufficiency, as well as for the ecological and economic evaluation of different substrate types in the treatment of organic primary and residual feedstocks.
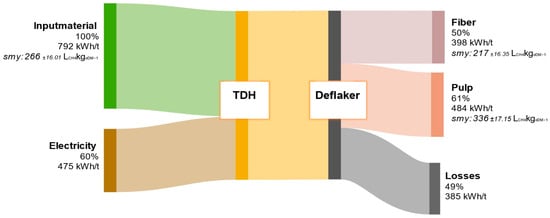
Figure 12.
Energy flow diagram of biowaste throughout the processing steps in the TPH. Values are given relative to the input material.
The combination of TPH and subsequent mechanical fractionation results in substantial substrate disintegration, significantly enhancing the anaerobic bioavailability of organic matter. This is reflected in the SMY of the separated pulp fraction, which rises to 336 ± 17.15 LCH4kgODM−1—markedly higher than the untreated raw material (266 ± 16.01 LCH4kgODM−1). The fiber fraction yields only 217 ± 16.35 LCH4kgODM−1, indicating enrichment of recalcitrant cell wall components (e.g., lignocellulose) that are marginally biodegradable. The total theoretical energy yield is 882 kWh/t FM, with the pulp contributing the largest share at 484 kWh/t. This slightly exceeds the average process energy demand of 475 kWh/t. However, practical losses of about 385 kWh/t due to thermal dissipation, steam depressurization, and heat transfer highlight the need for an effective heat recovery system to sustainably improve process efficiency.
In contrast, the energy balance of the cup-plant, shown in Figure 13, demonstrates a significantly lower energetic performance. The untreated material exhibits a SMY of 250 ± 5.95 LCH4kgODM−1 and a lower DM content, resulting in a total energy potential of 570 kWh/t FM—about 28% less than that of biowaste. While the TPH process energy demand for cup-plant is reduced by 13% (414 kWh/t), this is mainly due to the lower DM content and the more homogeneous substrate matrix produced by prior field chopping and ensiling. These conditions improve heat transfer during the hydrothermal heating phase, thereby reducing the overall energy input. The hydrolyzed pulp fraction from cup-plant yields an energy output of 392 kWh/t FM and thus almost covers the plant’s internal energy demand of 414 kWh/t. However, a deficit of 22 kWh/t remains, meaning that full energy self-sufficiency cannot yet be achieved with this substrate. A direct comparison of pulp fractions reveals that biowaste yields 484 kWh/t, whereas cup-plant provides only 392 kWh/t—a reduction of approximately 19%. This discrepancy can primarily be attributed to the distinct chemical compositions of the input materials: biowaste contains significantly higher levels of readily biodegradable components such as lipids, sugars, proteins, and starches, all of which enhance methane production [51,68,69]. Additional process losses of approximately 182 kWh/t for the cup-plant are mainly due to the current non-optimized configuration of the pilot plant. In contrast to industrial-scale systems, the plant lacks features such as recirculation of heated process liquid and efficient heat exchangers to recover excess thermal energy [47,70]. While these technical limitations negatively affect the energy balance, they also indicate substantial potential for future optimization.
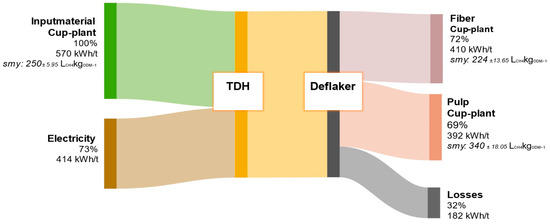
Figure 13.
Energy flow diagram of cup-plant throughout the processing steps of TPH. Values are referenced to the input material.
3.4.3. Energy Consumption of the Pilot Plant Across the Experimental Settings in TPH
The energy balance across the temperature variations (Figure 14) revealed that the TPH reactor accounted for the largest proportion of total energy consumption, whereas the theoretically calculated heating demand represented only about half of the actually measured energy use. This finding indicates considerable potential for optimization in terms of heat recovery and overall process efficiency.
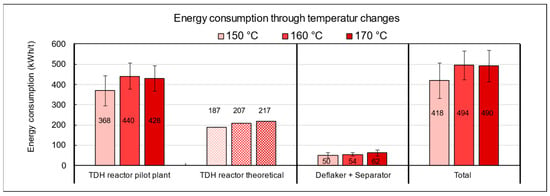
Figure 14.
Energy consumption of the pilot plant during TPH processing of biowaste as a function of temperature settings.
The discrepancy between theoretical and real energy input can be explained by several operational factors. In addition to unavoidable heat losses at the reactor, particularly at the interface between the thermal oil system and the substrate, various peripheral components such as agitators, screw conveyors, circulation pumps, and especially the deflaker, which is responsible for mechanical disintegration and fiber bundle separation, significantly contribute to the total energy demand. These units are essential for substrate homogenization and processability but are not considered in purely thermal model calculations. In the experiments conducted with municipal biowaste, the lowest overall energy consumption was observed at a target temperature of 150 °C. The specific energy demand at this setting was 418 kWh per ton, which is approximately 18% lower than at 160 °C (494 kWh/t) and 170 °C (490 kWh/t). From an energy efficiency perspective, operation at lower temperatures is thus advantageous, provided that methane yield and fiber quality are not significantly compromised.
The influence of holding time in the TPH reactor on energy consumption is shown in Figure A3 in the Appendix A. At 15 min, the specific energy demand was 434 kWh/t FM, while extending the run to 60 min increased consumption by about 15%. This additional demand is mainly caused by the prolonged operation of energy-intensive units, particularly the heating system, which must continuously maintain the target temperature. In comparison, the theoretical heating requirement under ideal conditions is only 208 kWh/t, whereas the measured average of 500 kWh/t exceeds this value by 140%. The discrepancy is primarily due to heat losses from insufficient insulation, the absence of heat recovery, and extended operation of auxiliary units. These findings highlight significant optimization potential, especially in the heating system. From both an energetic and economic perspective, operation at 150 °C with a short holding time of 15 min is most advantageous.
The results reveal significant differences in specific energy consumption between biowaste and cup-plant silage (Figure 15). The total process energy demand for cup-plant silage is approximately 13% lower than that of biowaste. Within the TPH reactor, energy consumption is also reduced, while mechanical fiber defibration requires about 15% more energy for biowaste. These differences are mainly attributed to the physical and structural properties of the substrates: biowaste is heterogeneous, exhibits irregular particle shapes, and has non-uniform density [71], resulting in air pockets that reduce thermal conductivity and impair heat transfer [72,73]. In addition, biowaste has a higher DM content (33.90% DM) compared to cup-plant silage (26.16% DM). Lower solids content improves convective heat distribution, as liquid phases allow more efficient temperature equalization [74]. In contrast, solid-rich substrates such as biowaste show poorer thermal homogeneity, increasing energy requirements [75]. Based on the process data, cup-plant silage is more energy-efficient in the TPH system, mainly due to better homogeneity, particle structure, and lower DM content. A complete assessment of the overall life cycle, including cultivation and collection of the raw materials, would require additional data.
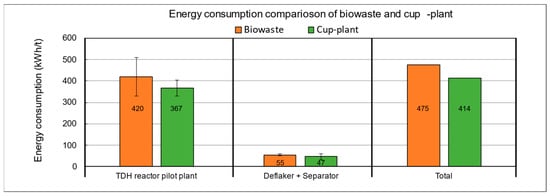
Figure 15.
Energy consumption of the pilot plant during TPH processing of biowaste and cup-plant silage in direct comparison.
3.5. Results on Fiber Quality of Biowaste Compared to Cup-Plant
3.5.1. Substrate Properties During Dry Processing for Fiber Analysis
The investigations on dry processing behavior revealed significant differences between the two substrates examined, cup-plant silage and biowaste. The cup-plant samples proved to be homogeneous and free of contaminants, showing no visible foreign materials. Due to this uniform composition, the material is generally well suited for further processing, for example with regard to material utilization such as paper production.
In contrast, the biowaste is characterized by strong heterogeneity. Numerous contaminants were identified during preliminary tests, which excluded direct processing on analytical devices. These included, among others, stones, plastic particles, film fragments, nutshells, sand, and aluminum composite materials. Through homogenization and subsequent separation in the laboratory, a large portion of these foreign materials was successfully removed (Figure 16). Additionally, coarse material lumps were disintegrated during processing without damaging the fibrous structures. The resulting material exhibited a fibrous texture that, in principle, could be considered for material utilization, for instance in paper manufacturing. However, significant material losses occurred during the separation process. These high losses are attributed to the fact that, despite mechanical shredding and air classification, the contaminants could only be inadequately separated from the usable fiber material. Consequently, the generated reject still contained a considerable share of recoverable fibers.
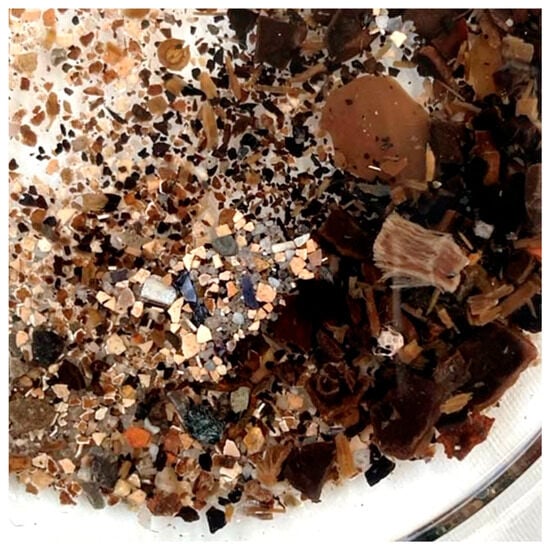
Figure 16.
Settled contaminants from biowaste samples in the fiber after TPH for paper production.
For future process optimization, alternative or combined separation methods should be developed that are better adapted to the material properties of biowaste. The goal must be to minimize the loss of usable fiber material and to significantly increase the efficiency of material recovery.
3.5.2. Substrate Properties During Wet Processing and Sheet Formation
The investigations into the behavior of the two substrates, cup plant silage and biowaste, during wet processing and sheet formation revealed significant differences. These differences highlight their varying suitability for potential paper-like applications. All cup-plant samples exhibited uniform behavior with inefficient dewatering performance. Despite the use of a coarse mesh screen, prolonged suction times were recorded during sheet formation. This is problematic in continuous paper production, where rapid water removal is essential for economic operation [76]. Delays increase cycle times and raise the risk of pulp overflow [76,77]. This inefficiency is reflected in Schopper-Riegler (°SR) values ranging from 55 to 70, whereas optimal dewatering is typically achieved between 30 and 40 °SR (DIN EN ISO 5267-1:2000 [78]). Additionally, all samples showed poor release from the forming screen: wet sheets adhered strongly and required mechanical removal, which stressed the fibers and may impair final paper strength [79]. The general wet strength was insufficient, complicating industrial handling. Improving dewatering could be achieved by removing primary fines—such as soil or fine plant debris—that are not generated by milling but significantly hinder water drainage.
Due to the presence of contaminants, grinding of the biowaste was omitted to prevent equipment damage. This omission significantly affected fiber structure and sheet formation behavior. The laboratory-produced sheets showed an unusually leathery and soft texture, in contrast to those made from cup-plant silage. Despite excellent dewatering performance with Schopper-Riegler values between 20 and 30 °SR, the sheets exhibited poor wet strength, complicating handling in continuous processing [76]. The absence of grinding likely led to insufficient fiber fibrillation and bonding, explaining the low wet strength and leathery texture. At the same time, the lack of fines—typically generated during milling—facilitated rapid dewatering. Nonetheless, the mechanical properties, particularly tensile strength, were significantly impaired by the absence of grinding.
3.5.3. Fiber Morphology and Composition of Biowaste Compared to Cup-Plant
The key parameters from the image-based suspension analysis are shown in Figure 17. Besides samples from biowaste and cup-plant silage, reference measurements of commercial pulp commonly used in the paper industry were included as a quality benchmark for fiber materials. When examining particle size and fiber-fines composition, only minor differences appear between cup-plant and biowaste. Both substrates exhibit a dominant short fiber structure with relatively wide fibers. This morphology is unfavorable for forming a stable fiber network, as short and wide fibers ave limited potential for mechanical entanglement or hydrogen bonding needed to build a strong sheet structure [76,79].
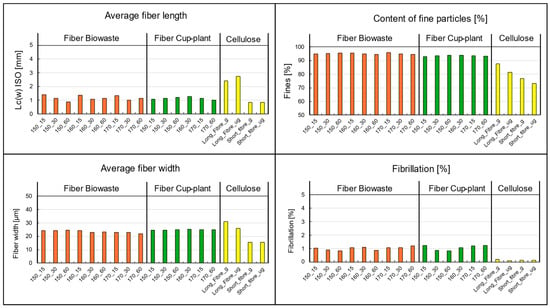
Figure 17.
Morphological fiber analysis performed with the Valmet FS5: Comparison between biowaste and cup-plant samples processed under different TPH conditions, including reference measurements of cellulose (short fiber/long fiber). g = ground cellulose; ug = unground cellulose. Note: L: Length c: weighted by fiber length contribution (w): weight-weighted ISO:16065-2 [80].
A particularly notable finding is the high fines content in both cup-plant and biowaste samples, regardless of the applied TPH process parameters. Compared to the reference pulp, characterized by a balanced fiber length, fibrillation, and low fines content, this deviation is significant. The case of biowaste is especially remarkable: despite its high fines content, very good drainage performance was observed—an unusual correlation since high fines typically impair drainage by clogging screen pores quickly. A possible explanation is the low water holding capacity of the fines present, such as mineral components like sand or synthetic materials like microplastics or film residues.
The fiber morphology analysis indicates that these fibers are of limited suitability for papermaking: they are short, contain a high proportion of fines, and exhibit low fibrillation, resulting in low tensile strength. Consequently, their use as a raw material for the paper industry is highly constrained. However, the fibers may still be valuable for alternative applications, such as in composite materials or as fillers.
3.5.4. Mechanical Properties Related to Fiber Quality: Comparison of Biowaste and Cup-Plant
During the production of laboratory sheets from biowaste, significant particle detachment was observed when peeling the sheets from the carrier board, indicating insufficient internal cohesion of the fiber structure. The samples exhibited pronounced brittleness, complicating preparation for tensile testing. Both fibers and fines were inadequately bonded in the planar (x-y) and thickness (z) directions, resulting in mechanical damage and deviations from testing standards. Despite these limitations, the samples were included in the analysis as the deficiencies were attributed to material properties rather than improper handling. Even minor mechanical stresses caused creasing and damage. Tensile tests (Figure 18) revealed very low strength values; tear lengths frequently fell below 150 m, whereas values below 2000 m are considered non-processable according to DIN EN ISO 1924-2 [31]. The main issues comprised an inhomogeneous fiber distribution (Figure 19), insufficient fiber bonding, and structural voids within the sheet matrix Samples treated at 150 °C with holding times of 30 and 60 min yielded no usable measurement data, confirming the unsuitability of the biowaste material for paper-based applications.

Figure 18.
Comparison of tear lengths of laboratory sheets made from biowaste (left), cup-plant (middle) after TPH, and industrial short-fiber pulp (right) as a reference. g = ground cellulose, ug = unground cellulose. The illustration highlights the significant differences in strength among the various fiber sources.
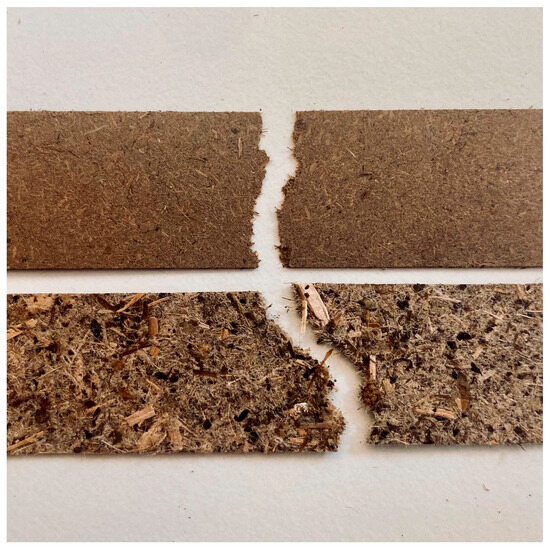
Figure 19.
Sheet structure and fracture edge (top: cup-plant; bottom: biowaste).
Although biowaste and cup-plant showed comparable morphological characteristics in image-based suspension analysis regarding particle size distribution and fines content (Figure 17), significant differences were observed in their mechanical properties (Figure 18). These differences are likely attributable less to fiber morphology than to the chemical composition of the biowaste. A substantial portion of the fines likely consists of non-fibrous contaminants such as fragmented plastics or sand, which lack a cellulose structure, are non-hygroscopic, and cannot form hydrogen bonds essential for fiber bonding. These particles act as structural defects, explaining the observed low tensile strengths.
In contrast, the cup-plant exhibited markedly superior mechanical properties (Figure 18). Even at lower processing intensities, higher strengths were achieved. Measured tear lengths reached up to 3000 m, well above the 2000 m minimum threshold defined in DIN EN ISO 1924-2 [31] for industrial processing of fibrous materials. This highlights the superior strength of the cup-plant compared to biowaste and supports its potential suitability as an alternative fiber raw material in papermaking.
Fracture surface analysis (Figure 19) corroborates these qualitative differences. While biowaste samples showed large particles and fibers detaching uncontrollably from the matrix, indicating poor internal cohesion, the cup-plant displayed homogeneous, well-defined fracture surfaces, suggesting uniform fiber distribution and stable fiber integration within the sheet structure.
These results demonstrate that biowaste, due to its heterogeneous fiber distribution, high content of non-fibrous impurities, and insufficient fiber bonding, exhibits significantly reduced mechanical strength and internal cohesion. Consequently, the material is unsuitable for paper-based applications. Nonetheless, biowaste offers diverse alternative material applications, such as a raw material for fiber-reinforced composites, mulch mats, or foam products that can be used in construction for insulation or other technical purposes.
The results indicate that additional cleaning or processing steps are required to improve fiber bonding and enhance the tear length of biowaste. Due to unreliable or non-evaluable measurement data, regression analysis of the effects of temperature and holding time on tear length could not be performed for biowaste; consequently, this analysis was conducted using the bast fiber plant. Further studies under industrial papermaking conditions are recommended for the bast fiber plant to comprehensively evaluate its processing potential and scalability.
3.5.5. Regression Analysis with JMP Pro for Cup-Plant
Based on the individual tensile test data, a regression analysis was conducted to examine the influence of the TPH process parameters on fiber strength. The results (Figure 20) indicate that temperature, as well as the interaction between temperature and holding time, have a significant effect on the tear length. While temperature generally acts as a decisive factor, its impact varies depending on the specific holding time.

Figure 20.
Influence of temperature, holding time, and their interaction on the tear length of laboratory sheets from cup-plant silage. The analysis is based on individual tensile test data. Significant effects are highlighted.
Figure 21 illustrates the goodness of fit of the performed regression analysis. With a coefficient of determination of R2 = 0.51, the model shows only a moderate fit. The relatively low explanatory power is due to the considerable scatter in the individual data points, which prevents the formation of clear trend lines. Additionally, the small sample size limits the reliability of the estimates and reduces the statistical robustness of the model.
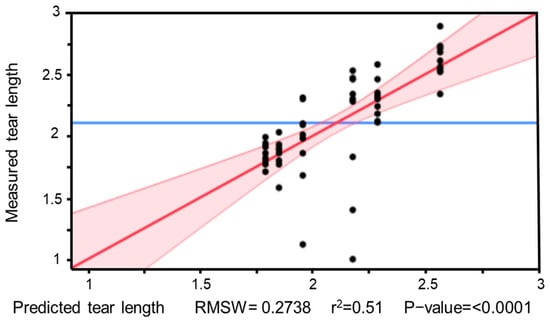
Figure 21.
Model graph of the regression analysis for tear length depending on TPH parameters. The individual data points show considerable scatter, which is reflected in a limited model fit (R2 = 0.51).
To assess the model quality, a residual analysis of the parameter groups was additionally conducted (Figure 22). The residuals are mostly evenly distributed around the zero line, which generally indicates an acceptable model fit. However, some deviations, particularly for the samples cup-plant 150_30 and cup-plant 160_30, suggest outliers with greater variability.
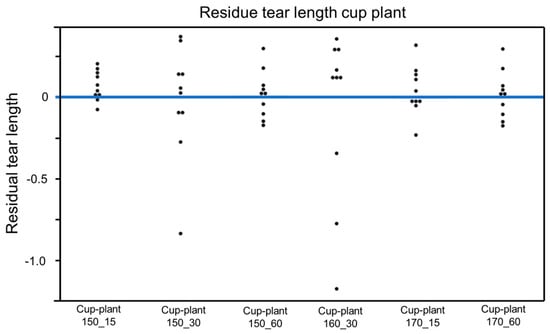
Figure 22.
Residual analysis (individual data points)—dispersion of residuals around the zero line for assessing model fit in the regression analysis of tensile strength.
The predictive analyses (Appendix A Figure A4 and Figure A5) and the response surface plot (Figure 23) indicate that a high process temperature of 170 °C combined with a short holding time of 15 min provides optimal conditions for maximizing tensile strength. Temperature emerges as the critical factor influencing the results. Longer holding times at lower temperatures of 150 °C or 160 °C yield only marginal improvements, as these temperatures are insufficient to trigger the necessary chemical and physical transformations within the fiber material required to enhance fiber bonding and mechanical strength.
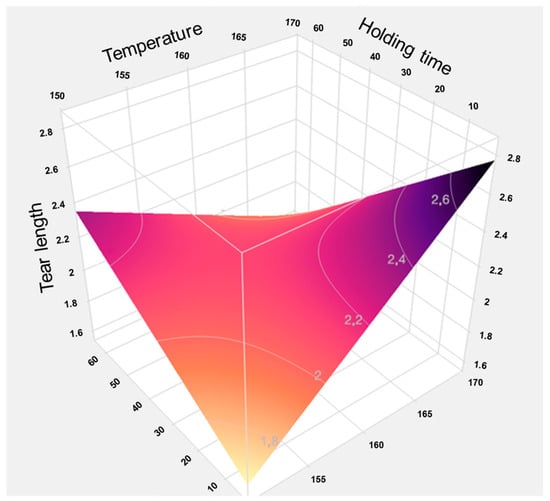
Figure 23.
Response surface of the model for tensile strength based on individual data. The graphical representation illustrates the interaction effects between temperature and holding time in TPH. It clearly shows that high temperatures combined with short holding times lead to the highest tensile strengths, while longer holding times at lower temperatures have little positive effect.
Thus, a thermally intensive but temporally limited treatment proves more effective than prolonged processing at milder temperatures. Elevated temperatures induce rapid structural changes, such as lignin softening and partial hemicellulose degradation, which enhance mechanical stability without the need for extended heat exposure. In contrast, longer holding times at lower temperatures are less effective and may even be detrimental to the material.
4. Conclusions
TPH proved to be an efficient pretreatment method for the fractionation of lignocellulosic biomass, enabling the simultaneous recovery of a fiber-rich solid fraction and a sugar-rich, fermentable pulp. The process enhanced substrate accessibility by depolymerizing complex polysaccharides and releasing low-molecular-weight sugars such as glucose, while also improving the energetic potential of the pulp for biogas production.
The distinct behaviors of biowaste and cup plant highlight the critical role of substrate composition in process optimization. Cup plant exhibited superior homogeneity and suitability for fiber-based material applications, whereas biowaste was constrained by its heterogeneity and high contaminant content. The best mechanical properties of Cup-plant fibers were achieved under high temperature and short retention time, indicating that both process conditions and physiological stage strongly influence TPH efficiency and product quality. Nonetheless, both substrates benefited from TPH through reduced recalcitrance and enhanced biodegradability.
From an energetic perspective, TPH showed a nearly balanced energy profile, as the pretreatment demand was largely offset by methane generation from the pulp. This positions TPH as a promising element within integrated biorefinery systems that aim for both material and energetic valorization.
Future research should focus on optimizing process parameters—particularly energy efficiency, scale-up potential, and contaminant management—to fully realize the potential of TPH as a sustainable technology for the circular utilization of biogenic residues.
Author Contributions
Conceptualization, B.H.; Investigation, M.B. and F.M.; Supervision, H.O. and J.M. All authors have read and agreed to the published version of the manuscript.
Funding
This research was funded by the Ministry of the Environment, Climate and Energy of Baden-Württemberg within the EFRE program “Bioeconomy Bio-Ab-Cycling” and financed through the European Regional Development Fund as well as the state of Baden-Württemberg. Project “BW2PRO”, grant number Bioök_2076229.
Institutional Review Board Statement
Not applicable.
Informed Consent Statement
Not applicable.
Data Availability Statement
Data are contained within the article.
Acknowledgments
Many thanks to all institutions that supported this study, especially by supplying the substrates. Special thanks go to the Ministry for Environment, Climate and Energy of Baden-Württemberg. Further thanks go to the people involved in the analysis, especially the laboratory staff at the State Institute for Agricultural Engineering and Bioenergy, as well as the scientific assistants who participated in the experiments.
Conflicts of Interest
The authors declare no conflicts of interest.
Appendix A
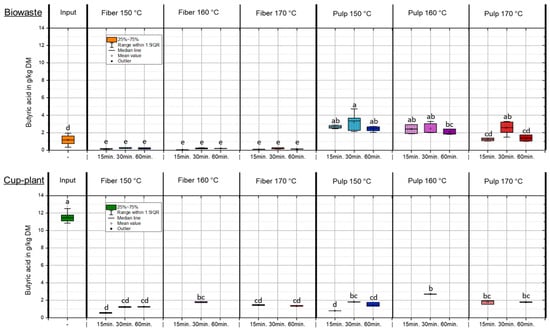
Figure A1.
Butyric acid content in the DM across the investigated temperature and holding time settings during TPH. Different letters indicate statistically significant differences between treatments at p < 0.05 according to Tukey’s HSD/Kramer post hoc test.
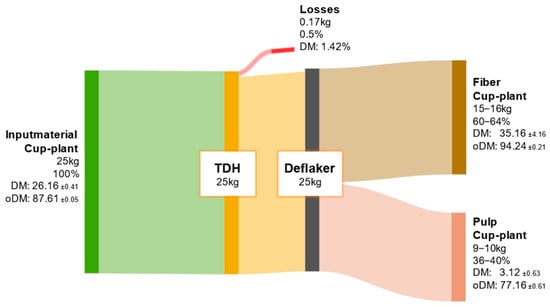
Figure A2.
ODM balance of cup-plant throughout the processing steps of TPH.
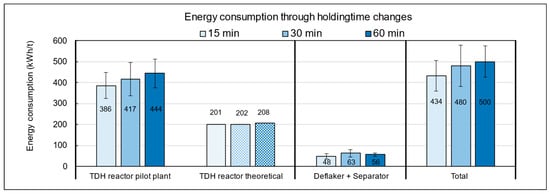
Figure A3.
Energy consumption of the pilot plant during TPH processing of biowaste depending on holding time settings.
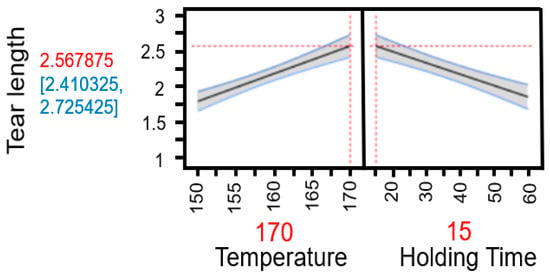
Figure A4.
Prediction analysis of tensile strength based on individual data at maximum temperature setting (170 °C) and minimum holding time (15 min).
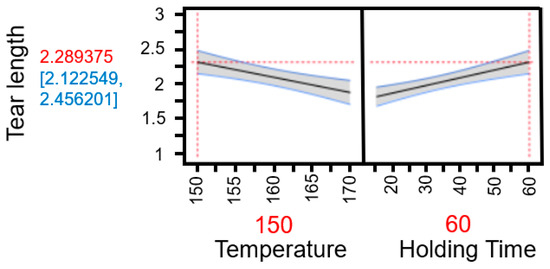
Figure A5.
Prediction analysis of tensile strength based on individual data at minimum temperature setting (150 °C) and maximum holding time (60 min).
References
- Kamm, B.; Gruber, P.R.; Kamm, M. Biorefineries—Industrial Processes and Products: Status Quo and Future Directions; Wiley-VCH Verlag GmbH & Co. KGaA: Weinheim, Germany, 2016. [Google Scholar]
- Röder, M.; Rötter, R. Auswirkungen der EEG-Novelle auf den Anbau von Energiepflanzen in Deutschland. Berichte Landwirtsch. 2020, 98, 124–141. [Google Scholar]
- Głowacka, K.; Krzyżaniak, M. Silphium perfoliatum (cup-plant)—Perspektiven für die Nutzung als Energiepflanze in Mitteleuropa. Renew. Energy Sustain. Dev. 2021, 7, 45–53. [Google Scholar]
- Lichtfouse, E.; Dupont, C.; Rumpel, C.; Pirot, R. Perennial energy crops for sustainable biogas production: Ecological and economic perspectives in Germany. Biomass Bioenergy 2021, 148, 106017. [Google Scholar]
- Khan, M.U. A Review of Recent Advancements in Pretreatment Technologies for Lignocellulosic Biomass. Chem. Eng. J. Adv. 2022, 11, 100314. [Google Scholar]
- Howaniec, N.; Smoliński, A. Thermochemical conversion of lignocellulosic biomass for energy production: A review. Energy Convers. Manag. 2017, 149, 483–499. [Google Scholar]
- Woźniak, A.; Kuligowski, K.; Świerczek, L.; Cenian, A. Review of Lignocellulosic Biomass Pretreatment Using Physical, Thermal and Chemical Methods for Higher Yields in Bioethanol Production. Sustainability 2025, 17, 287. [Google Scholar] [CrossRef]
- Gao, Z.; Alshehri, K.; Li, Y.; Qian, H.; Sapsford, D.; Cleall, P.; Harbottle, M. Advances in biological techniques for sustainable lignocellulosic waste utilization in biogas production. Renew. Sustain. Energy Rev. 2022, 170, 112995. [Google Scholar] [CrossRef]
- Campuzano, R.; González-Martínez, S. Characteristics of the organic fraction of municipal solid waste and methane production: A review. Waste Manag. 2016, 54, 3–12. [Google Scholar] [CrossRef]
- López-Gómez, J.P.; Greenman, J.; Duff, S.J.B. Valorisation of OFMSW via microbial fermentation: Biochemical pathways and process integration. Bioresour. Technol. 2019, 293, 122155. [Google Scholar]
- Müller, W.; Strehler, A.; Rechberger, H. Hydrothermal treatment of municipal biowaste: Process evaluation and hygienization efficiency. Waste Biomass Valorization 2017, 8, 1491–1502. [Google Scholar]
- Rahmati, S.; Doherty, W.; Dubal, D.; Atanda, L.; Moghaddam, L.; Sonar, P.; Hessel, V.; Ostrikov, K. Pretreatment and fermentation of lignocellulosic biomass: Reaction mechanisms and process engineering. React. Chem. Eng. 2020, 5, 2017–2047. [Google Scholar] [CrossRef]
- Rodríguez, F.; Sánchez, A.; Parra, C. Role of Steam Explosion on Enzymatic Digestibility, Xylan Extraction, and Lignin Release of Lignocellulosic Biomass. ACS Sustain. Chem. Eng. 2017, 5, 5234–5240. [Google Scholar] [CrossRef]
- Phojaroen, J.; Jiradechakorn, T.; Kirdponpattara, S.; Sriariyanun, M.; Junthip, J.; Chuetor, S. Performance Evaluation of Combined Hydrothermal-Mechanical Pretreatment of Lignocellulosic Biomass for Enzymatic Enhancement. Polymers 2022, 14, 2313. [Google Scholar] [CrossRef] [PubMed]
- Hosseini, S.B.; Gaff, M.; Li, H.; Hui, D. Effect of fiber treatment on physical and mechanical properties of natural fiber-reinforced composites: A review. Rev. Adv. Mater. Sci. 2023, 62, 20230131. [Google Scholar] [CrossRef]
- Sun, D.; Lv, Z.-W.; Rao, J.; Tian, R.; Sun, S.-N.; Peng, F. Effects of hydrothermal pretreatment on the dissolution and structural evolution of hemicelluloses and lignin: A review. Carbohydr. Polym. 2022, 281, 119050. [Google Scholar] [CrossRef]
- VDI-Fachbereich Energietechnik. Fermentation of Organic Materials—Characterisation of the Substrate, Sampling, Collection of Material Data, Fermentation Tests; VDI 4630; VDI-Gesellschaft Energie und Umwelt: Düsseldorf, Germany, 2016. [Google Scholar]
- Helffrich, D.; Oechsner, H. Hohenheimer Biogasertragstest. Landtechnik 2003, 58, 148–149. [Google Scholar] [CrossRef]
- Hülsemann, B.; Zhou, L.; Merkle, W.; Hassa, J.; Müller, J.; Oechsner, H. Biomethane Potential Test: Influence of Inoculum and the Digestion System. Appl. Sci. 2020, 10, 2589. [Google Scholar] [CrossRef]
- DIN EN 12879; Sludge, Treated Biowaste and Soil—Determination of Dry Residue and Water Content. Beuth Verlag: Berlin, Germany, 2018.
- DIN EN 12880; Sludge, Treated Biowaste and Soil—Determination of Organic Matter Content by Ignition. Beuth Verlag: Berlin, Germany, 2018.
- Van Soest, P.J.; Robertson, J.B.; Lewis, B.A. Methods for dietary fiber, neutral detergent fiber, and nonstarch polysaccharides in relation to animal nutrition. J. Dairy Sci. 1991, 74, 3583–3597. [Google Scholar] [CrossRef]
- ISO 6964:2017; Plastics—Determination of Carbon Black Content—Thermal Analysis Method. ISO: Geneva, Switzerland, 2017.
- DIN 38409 Teil H16; Deutsche Einheitsverfahren zur Wasser-, Abwasser- und Schlammuntersuchung—Organisch-Chemische Untersuchungsverfahren; Bestimmung des Kohlenstoffs Mittels Verbrennung. Beuth Verlag: Berlin, Germany, 2018.
- ISO 5263-2:2022; Pulps—Laboratory Wet Disintegration—Part 2: Disintegration of Mechanical Pulps at 20 °C. ISO: Geneva, Switzerland, 2024.
- DIN EN ISO 5264-2; Pulps—Laboratory Beating—Part 2: PFI Mill Method. Beuth Verlag: Berlin, Germany, 2011.
- DIN EN ISO 5269-2; Pulps—Preparation of Laboratory Sheets for Physical Testing—Part 2: Rapid-Köthen Method. Beuth Verlag: Berlin, Germany, 2005.
- ISO 5267-2:2022; Pulps—Determination of Drainability—Part 2: “Canadian Standard” Freeness Method. ISO: Geneva, Switzerland, 2022.
- DIN EN ISO 536; Paper and Board—Determination of Grammage. Beuth Verlag: Berlin, Germany, 2012.
- DIN EN ISO 534; Paper and Board—Determination of Thickness, Density and Specific Volume. Beuth Verlag: Berlin, Germany, 2012.
- DIN EN ISO 1924-2; Paper and Board—Determination of Tensile Properties—Part 2: Constant Rate of Elongation Method (20 mm/min). Beuth Verlag: Berlin, Germany, 2009.
- Scapini, T.; dos Santos, M.S.N.; Bonatto, C.; Wancura, J.H.C.; Mulinari, J.; Camargo, A.F.; Klanovicz, N.; Zabot, G.L.; Tres, M.V.; Fongaro, G.; et al. Hydrothermal pretreatment of lignocellulosic biomass for hemicellulose recovery. Bioresour. Technol. 2021, 342, 126033. [Google Scholar] [CrossRef]
- Świątek, P.; Chwastowski, J.; Różyło, R. Thermochemical hydrolysis of lignocellulosic biomass: Breakdown of polysaccharides into fermentable sugars. Bioresour. Technol. Rep. 2020, 10, 100380. [Google Scholar]
- Pažitný, S. Hydrothermal treatment of lignocellulosic biomass: Organic matter distribution between solid and liquid fractions. Acta Chim. Slovaca 2019, 12, 145–156. [Google Scholar]
- Mosier, N.; Wyman, C.; Dale, B.; Elander, R.; Lee, Y.Y.; Holtzapple, M.; Ladisch, M. Features of promising technologies for pretreatment of lignocellulosic biomass. Bioresour. Technol. 2005, 96, 673–686. [Google Scholar] [CrossRef]
- Wang, C.; Lin, M.; Yang, Q.; Fu, C.; Guo, Z. The principle of steam explosion technology and its application in food processing by-products. Foods 2023, 12, 3307. [Google Scholar] [CrossRef]
- Fraunhofer-Institut für Grenzflächen- und Bioverfahrenstechnik IGB. Thermisch-Chemische Hydrolyse (TPH) zur Selektiven Fraktionierung von Lignin, Cellulose und Hemicellulose; Fraunhofer IGB: Stuttgart, Germany, 2018. [Google Scholar]
- Carrère, H.; Dumas, C.; Battimelli, A.; Batstone, D.J.; Delgenès, J.P.; Steyer, J.P.; Ferrer, I. Pretreatment methods to improve sludge anaerobic degradability: A review. J. Hazard. Mater. 2010, 183, 1–15. [Google Scholar] [CrossRef] [PubMed]
- Li, Y.; Park, S.Y.; Zhu, J. Solid-state anaerobic digestion for methane production from organic waste. Renew. Sustain. Energy Rev. 2013, 26, 595–605. [Google Scholar] [CrossRef]
- Kumar, D.J.P.; Mishra, R.K.; Chinnam, S.; Binnal, P.; Dwivedi, N. A comprehensive study on anaerobic digestion of organic solid waste: A review on configurations, operating parameters, techno-economic analysis and current trends. Biotechnol. Notes 2024, 5, 33–49. [Google Scholar] [CrossRef]
- Kolečkář, J.; Mrkvicová, E.; Šťastník, O. Effect of silage quality on the health and performance of high-producing dairy cows: A review. Agric. Food Sci. 2025, 27, 266–276. [Google Scholar] [CrossRef]
- Bhatia, S.K.; Gurav, R.; Yang, Y.H. A review on waste activated sludge pretreatment for enhanced anaerobic digestion. Bioresour. Technol. 2025, 365, 127212. [Google Scholar]
- Greses, S.; Hernández, J.; Melero, J. Influence of pH on microbial communities and biogas production in anaerobic digestion processes. Renew. Energy 2021, 164, 1222–1231. [Google Scholar]
- Zhou, Y.; Yuan, H.; Zhang, Q.; Zhang, W. Effects of pH adjustment on anaerobic digestion and microbial community of corn stover hydrolysate. Bioresour. Technol. 2018, 250, 710–718. [Google Scholar]
- Wang, Q.; Chen, H.; Wang, Y.; Chen, Y. Effects of hydrothermal pretreatment on lignocellulosic biomass for bioethanol production. Renew. Sustain. Energy Rev. 2015, 47, 266–274. [Google Scholar]
- Ewanick, S.; Bura, R. Hydrothermal Pretreatment of Lignocellulosic Biomass. In Bioalcohol Production; Woodhead Publishing: Sawston, UK, 2010; pp. 3–23. [Google Scholar] [CrossRef]
- Zhang, B.; Biswal, B.K.; Zhang, J.; Balasubramanian, R. Hydrothermal Treatment of Biomass Feedstocks for Sustainable Production of Chemicals, Fuels, and Materials: Progress and Perspectives. Chem. Rev. 2023, 123, 7193–7294. [Google Scholar] [CrossRef]
- Baumgart, M.; Hülsemann, B.; Orth, F.; Oechsner, H. Effects of harvest date and ensiling additives on the optimized ensiling of Silphium perfoliatum to prevent faulty fermentation. Agriculture 2024, 14, 1363. [Google Scholar] [CrossRef]
- Kakar, F.I.; Koupaie, E.H.; Hafez, H.; Elbeshbishy, E. Effect of hydrothermal pretreatment on volatile fatty acids production from source-separated organics. Processes 2019, 7, 576. [Google Scholar] [CrossRef]
- Kruse, A.; Dinjus, E. Hot compressed water as reaction medium and reactant. J. Supercrit. Fluids 2007, 39, 362–380. [Google Scholar] [CrossRef]
- Weiland, P. Biogas production: Current state and perspectives. Appl. Microbiol. Biotechnol. 2010, 85, 849–860. [Google Scholar] [CrossRef]
- Zhao, S.; Wang, M.; Zhou, D.; Pan, S. Methane yield predictive model based on the composition of biomass: Focus on the anaerobic digestion mode and regression method. BioResources 2020, 15, 3850–3858. [Google Scholar] [CrossRef]
- KTBL (Kuratorium für Technik und Bauwesen in der Landwirtschaft). Methane Yields of Maize and Barley Silage: Practical Field Data; KTBL Report; KTBL: Darmstadt, Germany, 2010. [Google Scholar]
- Barakat, A.; Monlau, F.; Steyer, J.P.; Carrère, H. Effect of furan derivatives and lignin phenols on biomethane production from lignocellulosic biomass. Bioresour. Technol. 2012, 104, 90–99. [Google Scholar] [CrossRef]
- Reza, M.T.; Wirth, B.; Lüder, U.; Werner, M. Behavior of selected hydrolyzed and dehydrated products during hydrothermal carbonization: HMF, furfural, phenol and derivatives. J. Ind. Crops Prod. 2014, 58, 264–271. [Google Scholar]
- Campos, J.L.; Hernández, S.; de la Rubia, M.A. Phenol toxicity and biotransformation: Mechanisms and biotechnological applications. J. Hazard. Mater. 2009, 170, 423–436. [Google Scholar]
- Murínová, S.; Dercová, K. Response mechanisms of bacterial degraders to environmental contaminants on the level of cell walls and cytoplasmic membrane. BioMed Res. Int. 2014, 2014, 873081. [Google Scholar] [CrossRef]
- Poirier, S.; Chapleur, O. Inhibition of anaerobic digestion by phenol and ammonia: Effect on degradation performances and microbial dynamics. Data Brief 2016, 6, 494–499. [Google Scholar] [CrossRef] [PubMed]
- Kuroda, K.; Maeda, R.; Shinshima, F.; Urasaki, K.; Kubota, K.; Nobu, M.K.; Noguchi, T.Q.P.; Satoh, H.; Yamauchi, M.; Narihiro, T.; et al. Microbiological insights into anaerobic phenol degradation in UASB reactors. Sci. Total Environ. 2024, 872, 158703. [Google Scholar]
- Khan, M.A.; Ahmad, A.; Wang, X. Impact of phenol on biogas production: A comprehensive review. Renew. Sustain. Energy Rev. 2022, 160, 112343. [Google Scholar]
- Fang, H.H.P.; Liang, D.W.; Zhang, T.; Liu, Y. Anaerobic treatment of phenol in wastewater under mesophilic condition. Water Res. 2006, 40, 827–834. [Google Scholar] [CrossRef]
- Chapleur, O.; Madigou, C.; Civade, R.; Rodolphe, Y.; Mazéas, L.; Bouchez, T. Increasing concentrations of phenol progressively affect anaerobic digestion of cellulose and associated microbial communities. Biodegradation 2016, 27, 15–27. [Google Scholar] [CrossRef]
- Almeida, J.R.M.; Modig, T.; Petersson, A.; Hähn-Hägerdal, B.; Lidén, G.; Gorwa-Grauslund, M.F. Increased tolerance and conversion of inhibitors in lignocellulosic hydrolysates by Saccharomyces cerevisiae. J. Chem. Technol. Biotechnol. 2009, 84, 34–44. [Google Scholar] [CrossRef]
- Palmqvist, E.; Hahn-Hägerdal, B. Fermentation of lignocellulosic hydrolysates. II: Inhibitors and mechanisms of inhibition. Bioresour. Technol. 2000, 74, 25–33. [Google Scholar] [CrossRef]
- Badshah, M. Effects of furfural and hydroxymethylfurfural on anaerobic digestion: Inhibition thresholds and process adaptation. J. Environ. Manag. 2012, 101, 105–110. [Google Scholar]
- Liu, Z.H.; Cao, N.; Gao, C. Thermal degradation pathways of hexose sugars and implications for biofuel production. Energy Fuels 2013, 27, 3863–3870. [Google Scholar]
- Park, C.; Yoo, S.M.; Lee, J.S.; Kim, T.H. Effect of furfural on anaerobic digestion performance and microbial community dynamics. Bioresour. Technol. 2011, 102, 437–444. [Google Scholar]
- Jahic, M.; Meyer, A.S.; Sørensen, H.R. Influence of substrate composition on methane yield during anaerobic digestion of organic waste. Renew. Energy 2021, 169, 1249–1257. [Google Scholar]
- Braun, R.; Huth, S.; Linke, B. Biogas production: Fundamentals and perspectives. Adv. Biochem. Eng. Biotechnol. 2009, 113, 53–72. [Google Scholar]
- Lindorfer, H.; Jungmeier, G.; Brunner, P.H. Thermal hydrolysis of biomass: Effects on substrate characteristics and methane yields. Waste Manag. 2010, 30, 1032–1039. [Google Scholar]
- Møller, H.B.; Sommer, S.G.; Ahring, B.K. Methane productivity of manure, straw and solid fractions of manure. Biomass Bioenergy 2009, 33, 123–130. [Google Scholar] [CrossRef]
- Heeren, N.; Schmidt, J.; Horn, H. Thermal conductivity and heat transfer in heterogeneous biowaste. Waste Manag. 2018, 75, 1–9. [Google Scholar]
- Zhang, L.; Li, X.; Chen, Y. Influence of particle shape and density on heat transfer in biomass. Renew. Energy 2020, 147, 1760–1767. [Google Scholar]
- Barlaz, M.A.; Ham, R.K.; Schaefer, D.M.; Christensen, T.H. Heat transfer in solid waste landfills: Implications for waste degradation. Waste Manag. 2010, 30, 1839–1848. [Google Scholar]
- Kratky, L.; Jirout, T. Heat transfer in solid-rich biomass substrates. Bioresour. Technol. 2011, 102, 6060–6065. [Google Scholar]
- Hubbe, M.A.; Sjöstrand, B.; Nilsson, L.; Koponen, A.; McDonald, J.D. Rate-limiting mechanisms of water removal during the formation, vacuum dewatering, and wet pressing of paper webs: A review. Bioresources 2020, 15, 9672–9755. [Google Scholar] [CrossRef]
- Bajpai, P. Biermann’s Handbook of Pulp and Paper: Raw Material and Pulp Making, 3rd ed.; Elsevier: Amsterdam, The Netherlands, 2018. [Google Scholar]
- DIN EN ISO 5267-1:2000; Pulps—Determination of Drainability—Part 1: Schopper-Riegler Method (SR). ISO: Geneva, Switzerland, 2000.
- Smook, G.A. Handbook for Pulp and Paper Technologists, 4th ed.; TAPPI Press: Atlanta, GA, USA, 2016. [Google Scholar]
- ISO 16065-2:2014; Pulps—Determination of Fibre Length by Automated Optical Analysis—Part 2: Unpolarized Light Method. ISO: Geneva, Switzerland, 2014. Available online: https://www.iso.org/standard/60375.html (accessed on 1 September 2025).
Disclaimer/Publisher’s Note: The statements, opinions and data contained in all publications are solely those of the individual author(s) and contributor(s) and not of MDPI and/or the editor(s). MDPI and/or the editor(s) disclaim responsibility for any injury to people or property resulting from any ideas, methods, instructions or products referred to in the content. |
© 2025 by the authors. Licensee MDPI, Basel, Switzerland. This article is an open access article distributed under the terms and conditions of the Creative Commons Attribution (CC BY) license (https://creativecommons.org/licenses/by/4.0/).