Article

Synergistic Optimization of Building Energy Use and PV Power Generation: Quantifying the Role of Urban Block Typology and PV Shading Devices

1
Department of Environmental Design, School of Fine Arts, South-Central Minzu University, Wuhan 430074, China
2
School of Architecture and Urban Planning, Huazhong University of Science and Technology, Wuhan 430074, China
3
Hubei New Technology Research Centre for Urbanization, Wuhan 430074, China
4
Wuhan Planning and Design Institute, Wuhan 430014, China
*
Author to whom correspondence should be addressed.
Sustainability 2025, 17(21), 9665; https://doi.org/10.3390/su17219665
Submission received: 16 September 2025 / Revised: 14 October 2025 / Accepted: 20 October 2025 / Published: 30 October 2025

Abstract

In high-density cities, integrating photovoltaic shading devices (PVSDs) with urban block typology optimization is crucial for low-carbon development, yet the understanding of their synergistic effects remains limited. This study develops a novel multi-scale evaluation framework that bridges block-building hierarchies to address this research gap. Through parametric modeling, this study coupled 27 representative office block morphologies with 18 PVSDs in Wuhan, a prototype city for China’s hot-summer–cold-winter climate zone, systematically generating 486 scenarios for comprehensive evaluation. Using Rhino–Grasshopper (7.0) with Ladybug (1.7), Honeybee (1.6), and EnergyPlus (9.4), we then examined urban block typology-PVSDs interactions across these scenarios. Our findings demonstrate that coordinated block typology and PVSD variables serve as critical determinants of energy-performance synergy. High-Rise Hybrid blocks emerge as the superior configuration for integrated performance, achieving maximal passive energy savings, optimal renewable energy utilization, and substantial carbon reduction. PVSDs that are 0.4 m in width, with specific distance-to-width ratios, yield the highest integrated benefits. This work advances sustainable urban design by establishing a morphology–energy nexus framework, providing architects and urban planners with actionable strategies for climate-responsive design in similar regions, with direct implications for maximizing energy–PV synergy through morphology-aware design approaches.

1. Introduction

Buildings account for 30% of global final energy consumption [1], presenting particular challenges in hot-summer–cold-winter climates like Wuhan, where simultaneous cooling and heating demands create complex energy dynamics. High-density urban environments exacerbate these challenges through intricate block typology–solar access interactions, where inter-building shading reduces photovoltaic (PV) generation potential by 5–50.73% while creating microclimate variations that impact energy performance [2].
Though existing research has established typology-dependent variations in energy use and PV generation potential [2,3,4], a critical gap remains in understanding the synergistic optimization of block-scale morphology and building-scale PV systems, particularly in climates requiring careful solar–energy balance. This study addresses this gap by developing a novel multi-scale evaluation framework that systematically examines urban block typology–photovoltaic shading device (PVSD) interactions through parametric modeling of 27 representative block types. Focusing on Wuhan’s office buildings, the research quantifies how typology–PVSD interactions simultaneously influence energy use intensity, passive energy savings, and power generation potential. The framework advances sustainable urban design by bridging the divide between multi-scale morphology variables and building energy, providing actionable metrics for early-stage design decisions. By establishing climate-specific design principles and optimized block typology—PVSDs combinations, this work offers transformative strategies for achieving energy–PV synergy in high-density urban development, with potential applications in similar climatic regions worldwide. The integrated performance quantification methodology represents a comprehensive evaluation paradigm beyond conventional isolated assessment methods for urban energy optimization.

1.1. Literature Review

1.1.1. How Could Energy Use Be Minimized and Solar Energy Utilization Be Maximized by Optimizing Block Morphology?

Urban block morphology plays a pivotal role in shaping building energy performance through shading effects and microclimate regulation [2,3,5]. Research on real-world urban blocks offers valuable data that better reflect the complexities of energy dynamics. Research indicates that tall blocks with a small width exhibit the lowest energy use intensity (EUI) at 30 kWh/(m2·y), with shape factor, building density, and floor area ratio as the primary determinants [6]. Correspondingly, integrating building morphological metrics with annual energy data significantly improves predictive accuracy, yielding R2 values of 0.975 and 0.99 for residential and public buildings, respectively [7].
Prototype block analysis further highlights the impact of morphology on energy use. Research has identified the tunnel court type as the most energy-efficient, while the pavilion type showed the worst performance [8]. Morphological differences between typologies resulted in up to 50% variation in load match, emphasizing trade-offs between form and environmental performance [9].
The impact of block morphology extends to solar access and energy generation. High-density configurations often cause mutual shading, limiting solar energy utilization.
Research on solar potential assessment has employed diverse methodologies across different urban block typologies. Prototype-based simulation approaches have been applied to evaluate PV suitability for office [10,11], residential [12,13], campus [4], and industrial blocks [14]. Concurrently, advanced computational techniques have enhanced prediction accuracy. For example, a U-Net-based model estimated Wuhan’s rooftop PV potential to be 17,292.30 × 106 kWh/year [15], while an ANN analysis quantified solar potential variation across morphological prototypes at 36.8% [16]. These studies demonstrate significant non-linear relationships between urban form and energy yield.
Urban block morphology exhibits dual impacts on both energy efficiency and solar utilization through coupled shading–microclimate–radiation mechanisms, with optimized configurations demonstrating significant co-benefits across multiple studies. Strategic typology variations can yield 200% greater PV generation, alongside twelve-fold cooling load reductions and 25% lower EUI [17], while energy performance variations of 12.25–35.85% have been observed in campus typologies with PV integration [4]. Furthermore, demonstrations of simultaneous PV yield enhancement and energy demand reduction through multi-objective optimization of density, shape coefficient, and orientation [13] complement these findings. Together, they establish morphology as a critical performance multiplier. The consistent identification of these geometric parameters across studies suggests they should serve as primary design levers.

1.1.2. How Could Energy Use Be Minimized and Solar Energy Utilization Be Maximized by Optimizing PVSDs?

PVSDs have emerged as a promising solution for simultaneously addressing building energy efficiency and renewable energy generation. By integrating PV panels with shading mechanisms, these systems can reduce cooling energy use by up to 30% [18] while potentially meeting a building’s entire energy demand [19,20]. Extensive research has identified key design parameters influencing PVSD performance, including optimal 60° inclination angles and specific distance-to-length ratios [21], with south-facing PV-integrated systems proving particularly effective for simultaneous electricity generation and thermal regulation [22]. Recent evaluations confirm that well-integrated PV shading solutions maintain energy performance and economic feasibility across diverse climates, achieving both energy savings and generation when properly designed [23]. Recent advances in multi-objective optimization have further demonstrated that semi-circular–rectangular hybrid designs can effectively balance energy generation, daylight utilization, and thermal performance, though with significant climate-dependent variations (40–50%) requiring location-specific solutions [24,25].
However, despite these important developments, a critical research gap persists in understanding the synergistic optimization between urban block morphology and building-scale PVSDs—particularly in climates requiring careful solar–energy balance, like China’s hot-summer–cold-winter zone. The current literature predominantly examines either urban block morphology or PVSDs in isolation, creating an artificial disconnect between urban design and architectural solutions. This fragmentation obscures the coupled effects of block-scale geometric parameters and building-scale PVSD variables on integrated energy performance. Furthermore, no comprehensive methodology exists to quantitatively assess and optimize the trade-offs between passive shading benefits and active solar energy generation across multi-scale design variables, limiting the practical implementation of PVSDs in complex urban environments.

1.2. Research Aim and Novelty

This study addresses these gaps by developing a novel multi-scale evaluation framework that bridges block-building hierarchies to systematically quantify synergistic effects between morphological typologies and PVSDs. The framework’s innovation lies in its integrated approach combining parametric typology modeling, hourly energy simulations, and PV power generation analysis to address three key performance dimensions simultaneously: (1) building energy use intensity (EUI) with seasonal variations, (2) PV power generation potential, and (3) integrated energy savings benefits combining passive and active contributions. The research aims to answer two fundamental questions that remain unexplored in the current literature:
  • How do block-scale typology and building-scale PVSD variables interact to differentially influence EUI, passive energy savings, and PV output in hot-summer–cold-winter climates?
  • What are the optimal block typology-PVSDs combinations for maximizing integrated energy-saving benefits while minimizing embodied carbon across representative office building morphologies?
By establishing quantitative relationships between multi-scale design variables and energy performance outcomes, this work provides a transformative methodology for achieving energy–PV synergy in high-density urban development, with particular relevance for climate-responsive design in similar regions worldwide.

2. Materials and Methods

2.1. The Workflow of This Study

The study adopts a systematic workflow (Figure 1) structured into four interconnected phases:
  • Selection of Urban Block Typologies and PVSD Variables: Six major urban block categories (totaling 27 typologies) were identified based on morphological diversity. Four key PVSD variables were selected to evaluate their impact on energy performance.
  • Energy Performance Simulation: Rhino 7 with Grasshopper plugins (Ladybug 1.7 and Honeybee 1.6) was employed to simulate heating, cooling, lighting energy uses, and solar energy potential. The simulations utilized hourly weather data (EPW format) from Wuhan, China.
  • Statistical Analysis: Post-simulation, the data is systematically analyzed using statistical methods to identify significant patterns and relationships. The goal is to determine the effect size of multi-scale design factors on various energy responses for each urban archetype, crucial for understanding the impact of these factors on energy performance.
  • Low-Energy Design Strategies: Building upon the analysis of multi-scale design variables, this study proposes optimization strategies for low-energy urban block typologies and PVSDs. These evidence-based strategies integrate the key findings to enhance energy efficiency and sustainability in urban design.

2.2. Urban Block Typologies

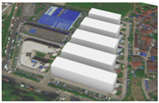
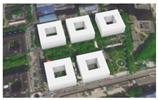
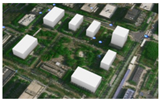
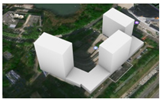
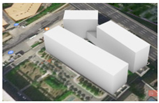
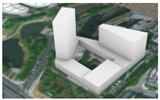
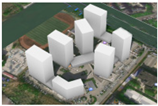
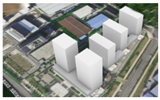
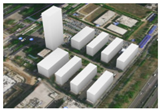
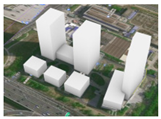
This investigation focuses on Wuhan (30.59° N, 114.31° E), a prototype city for China’s hot-summer–cold-winter climate characterized by seasonally distinct yet substantial heating and cooling demands, which drive significant energy use. This study systematically analyzed 48 office blocks in Wuhan using typo-morphological methods, classifying them along two dimensions: building height and layout configuration. Blocks were first categorized into multi-story and high-rise groups based on height. Each category was then further subdivided according to planar layout characteristics, resulting in six major categories: multi-story (slab, tower, courtyard, perimeter) and high-rise (hybrid, perimeter) configurations. The sampled blocks were selected to achieve morphological saturation, comprehensively covering all major functional zones—including Wuchang, Hankou, Hanyang, and the Optics Valley—and representing a full spectrum of development intensities, with floor area ratios ranging from 0.9 to 4.0.
Based on this classification framework, a rigorous two-stage stratified sampling protocol was employed to select representative typologies. Specifically, three prototypes per category were initially selected in each stage, generating 36 candidate cases. Morphologically redundant cases were subsequently eliminated, resulting in the final selection of 27 most representative block typologies. This procedure ensures that the final typological set covers over 85% of morphological variants present in Wuhan’s office blocks, thereby guaranteeing statistical representativeness.
To ensure simulation reliability and comparability, all 27 representative typologies were modeled using standardized parameters. These parameters (Table 1), derived from statistical analysis of three-dimensional morphological data from the 48 sample blocks (Table 2), primarily include standardized block dimension (150 × 150 m, refined from the observed average of 148 m), 5-story configuration with FAR 1.5 for multi-story typologies, a 10-story structure with FAR 3.0 for high-rise typologies, and a uniform floor-to-floor height of 4 m (The complete dataset is available in Appendix B).

2.3. Photovoltaic Shading Devices

2.3.1. Types of PVSDs

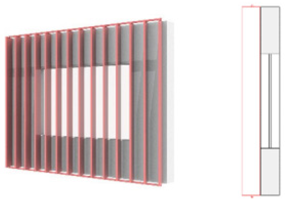
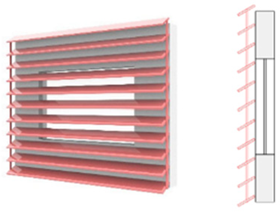
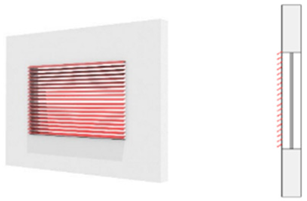
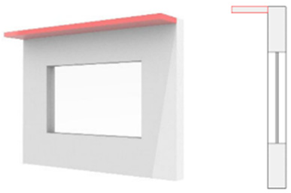
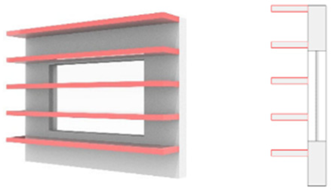
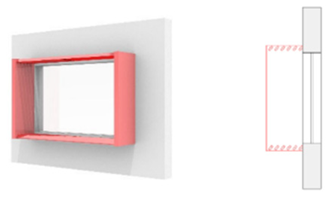
Based on a systematic categorization of twelve prevalent PVSD configurations (Table 3) [26], horizontal PV louvers were identified as the dominant type in an analysis of 18 PVSD cases in China, accounting for approximately 12 cases. This prevalence is supported by literature confirming the maturity and strong power generation performance of horizontal PV louvers under diverse climatic conditions, especially with optimized tilt angles and dynamic controls, positioning them as a key direction for future BIPV development [26,27,28]. Consequently, horizontal louvers are established as the primary focus of this study.

2.3.2. Materials of PVSDs

As of 2024, crystalline silicon dominates the global PV market (92%) [29], owing to its cost-effectiveness, high efficiency, durability, and versatility across residential, commercial, and utility-scale applications. Our analysis of 47 PV products from five leading Chinese manufacturers reveals that monocrystalline silicon panels are currently the market leader, with an average efficiency of 22%; 74% of these products offer a 25-year operational lifespan (Appendix A). Based on these findings, this study adopts monocrystalline silicon PV panels (22% efficiency, 25-year lifespan) for all PVSDs.

2.3.3. Design Variables of PVSDs

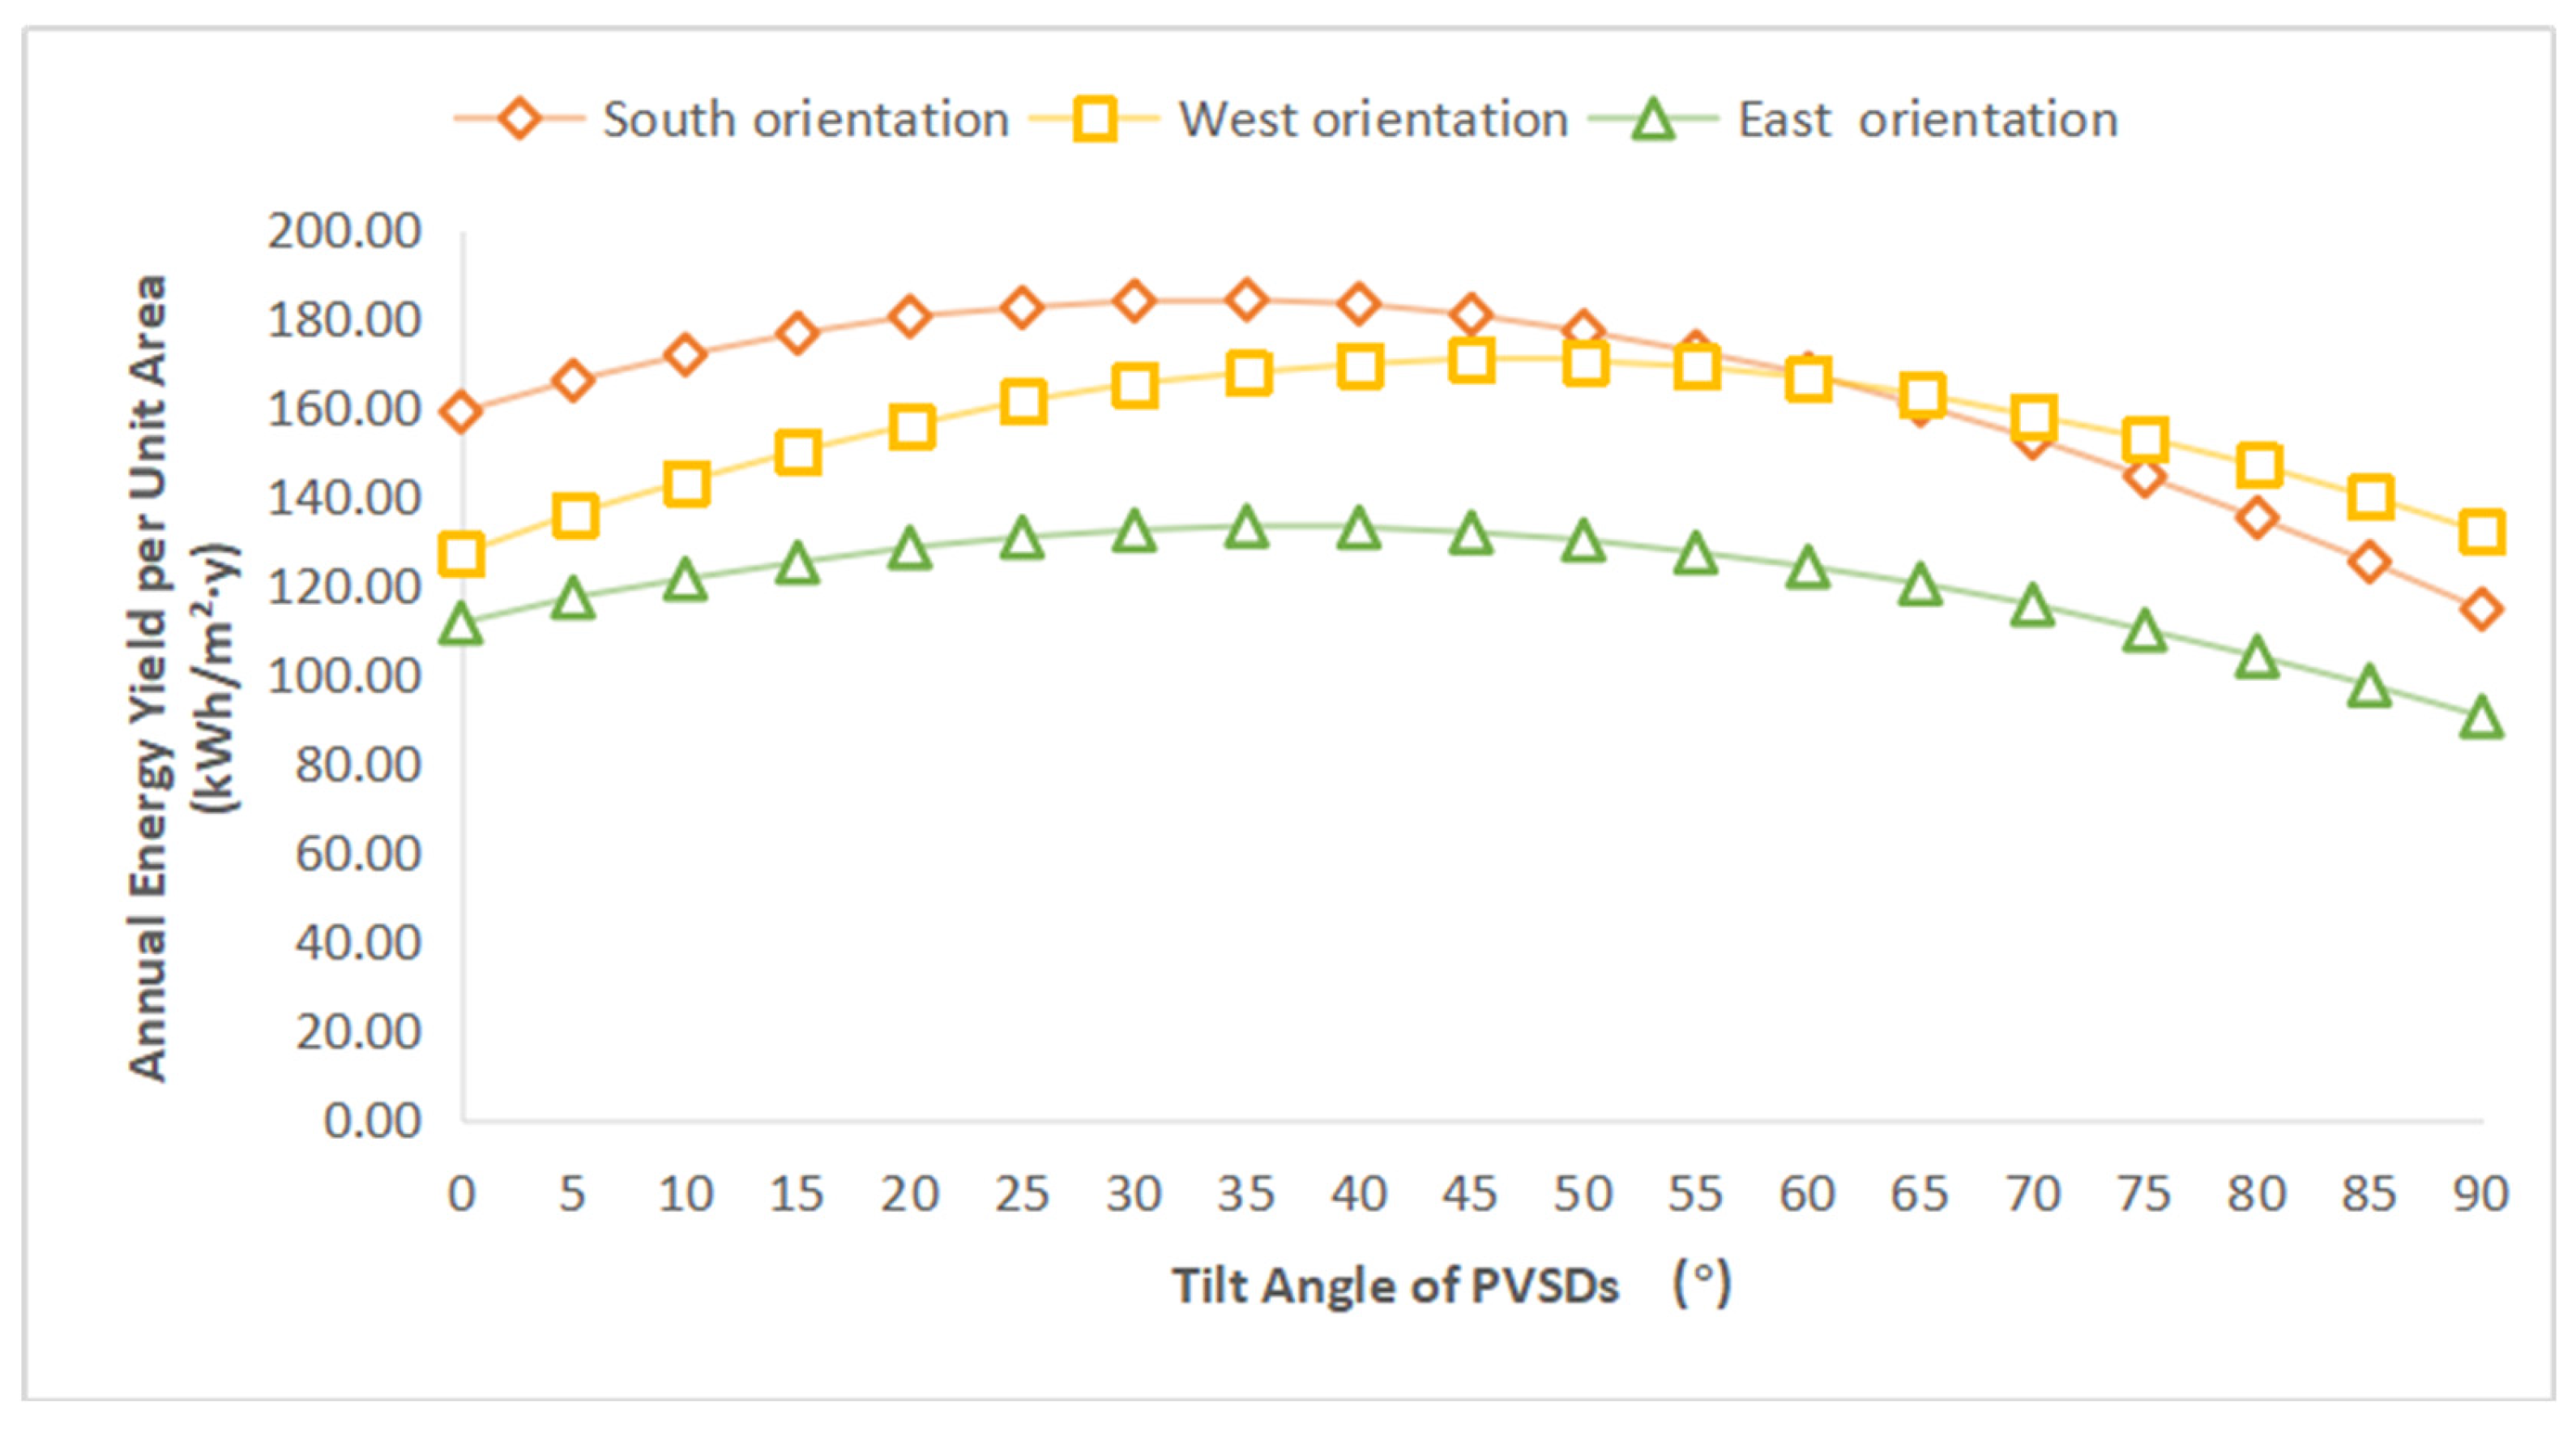
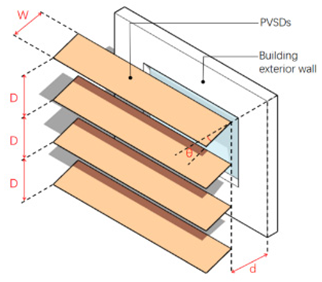
The energy output of PV systems depends on the geometric relationship between panels and solar radiation. Under fixed environmental conditions (e.g., location, altitude, solar availability), the key adjustable parameters are tilt angle and azimuth [30]. The study employs a validated office building model equipped with horizontal PV louvers (1.5 m × 0.8 m) installed on eastern-, southern-, and western-facing windows of the third floor. The annual electricity generation per unit area was evaluated over a complete operational year, with simulation results detailed in Figure 2. The findings reveal optimal tilt angles for façade-mounted PVSDs: 30° for south orientation, 35° for east, and 45° for west. Based on market research and literature [31], this study defines four design variables for louver-type PVSDs: width (W), Distance/Width ratio (D/W ratio), tilt angle (θ), and distance from the wall (D) (Table 4).

2.4. Building Energy Performance Calculation Methods

2.4.1. Building Energy Use Before PVSD Deployment

This study adopted a Rhino–Grasshopper workflow with the Ladybug and Honeybee plugins and EnergyPlus as the simulation engine to evaluate office building energy performance before and after PVSD integration.
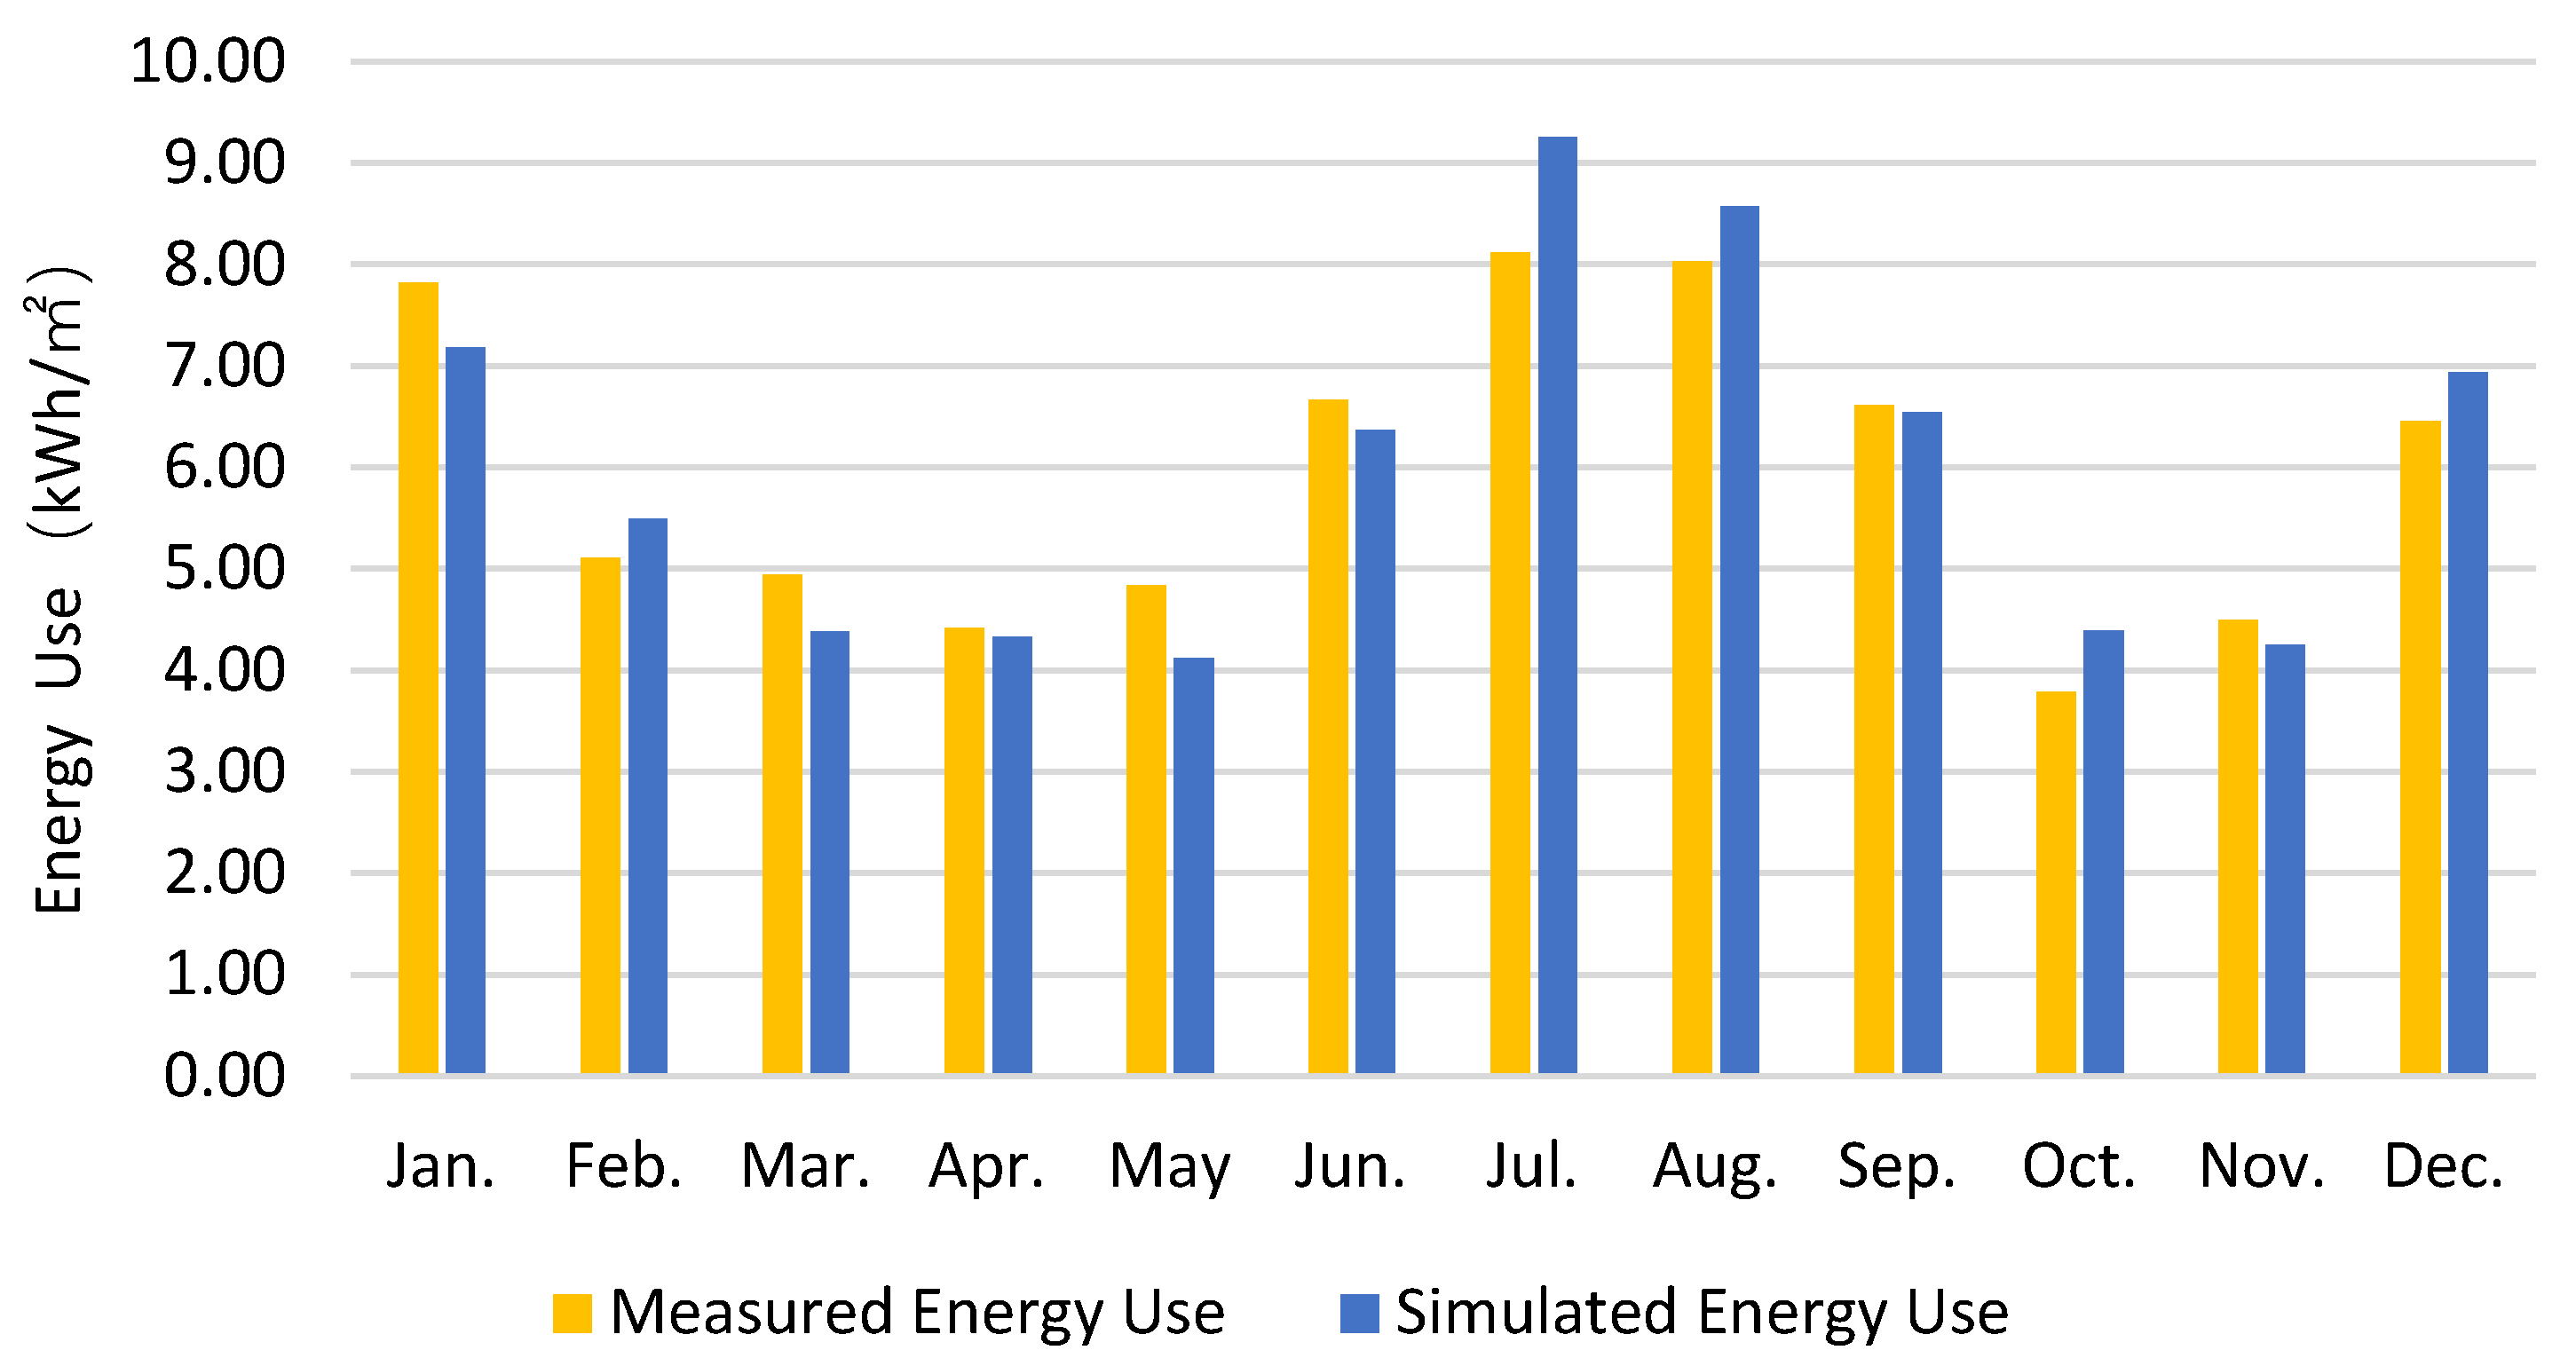
The reliability of EnergyPlus for building energy modeling is well established [2]. In this study, we further validated the proposed simulation framework using actual energy use data from office buildings in Wuhan (Figure 3). As shown in Figure 4, the simulated monthly energy use aligns well with measured values in both magnitude and temporal variation. Quantitative validation yielded an RMSE of 0.556, indicating acceptable deviation, and an R2 of 0.87, demonstrating that the model explains 87% of the observed variance. These results collectively confirm that the simulation model achieves reliable accuracy for building performance evaluation.
To systematically evaluate the impact of urban block typology and PVSDs on building energy performance, this study implemented a comprehensive standardization protocol for all secondary variables. Based on field survey data, we uniformly configured building geometry and envelope characteristics (Table 5) and utilized Wuhan’s Typical Meteorological Year (TMY) data in EPW format from the EnergyPlus database for climate inputs. All standardized parameter settings of air conditioning were further normalized according to established field studies and literature references (Table 6), ensuring methodological consistency and reliability in isolating the targeted variables’ effects. Key assumptions included static occupant behavior, fixed internal loads, and idealized HVAC operation schedules. The primary limitations encompass the exclusion of microclimate feedback effects and dynamic occupant interactions, which may influence real-world energy performance. These simplifications enhance comparability across typologies while acknowledging inherent uncertainties in urban energy modeling.
This study adopts energy use intensity (EUI), expressed as annual energy consumption per unit floor area (kWh/m2·y), as the key performance metric for urban building energy evaluation. As an established benchmarking indicator in building energy research [3], EUI enables standardized cross-comparison of energy performance across diverse building typologies and scales. The computational approach for EUI determination follows Equation (1).
E U I = E S A
  • EUI—energy use intensity (kWh/m2·y);
  • E—total building energy use (kWh/y);
  • S A —total building floor area (m2).

2.4.2. The PV Power Generation Potential from PVSDs

  • Calculation of solar radiation threshold
This study employed a Radiance engine-based solar radiation simulation approach implemented through the Ladybug toolset on the Rhinoceros and Grasshopper platform to assess PV generation potential. Our research team independently validated this simulation method through scaled urban block model experiments, demonstrating radiation calculation errors within 10% [32].
The solar radiation threshold (t)—defined as the minimum radiation required for PV system economic viability [33]—serves as a critical feasibility criterion. This threshold represents the break-even point where lifecycle energy outputs balance inputs. Following established methodologies [33,34], Equations (2) and (3) quantify this threshold based on system input–output equilibrium.
t = C s y s η i × K × C e l e × 1 N ( 1 R d ) N 1
Based on domestic PV product specifications (Section 2.3.1), the key parameters are set as follows: PV module efficiency ( η i ) = 22%, integrated efficiency factor (K) = 85%, on-grid electricity price ( C e l e ) = 0.5 RMB/kWh (per policy surveys), degradation rate of the PV system ( R d ) = 0.48%, and lifecycle of the PV system (N) = 25 years. The installation cost C s y s is calculated via Equation (3).
C s y s = C s u × P D × ( 1 + R A n n × N )
  • C s u —installation cost of PV modules;
  • P D —power density of PV modules;
  • R A n n —system annual maintenance coefficient.
Based on CPIA [35] data, the key parameters are set as follows: the installation cost of PV modules ( C s u ) = 3.74 RMB/W, the system annual maintenance coefficient ( R A n n ) = 1%, and the power density of PV modules ( P D ) = 217 W/m2. Using these inputs with a 25-year system lifespan, the solar radiation threshold for Wuhan is calculated as 471 kWh/m2·y.
2.
Calculation of PV power generation
The PV generation potential is calculated using solar radiation simulation results and the established radiation threshold (471 kWh/m2·y). Based on the PV generation models, the annual power output is computed via Equation (4) [4,12].
E p = H A × A p v × η i × K × ( 1 R d ) N 1
  • E p —annual energy generation of PV equipment (kWh/y);
  • H A —annual accumulated solar radiation on building surface (kWh/y);
  • A p v —available installation area for PV panels (m2);
  • η i —PV module efficiency (%);
  • K —integrated efficiency factor (%);
  • R d —attenuation rate of PV power generation (%);
  • N —durable years of PV equipment (y).
For consistent comparison with building energy performance, this study evaluates PV generation potential using annual power output per unit building area, calculated via Equations (5) and (6).
S E G I = E P S B u i l d i n g
U R R E = S E G I E U I × 100 %
  • S E G I —solar energy generation intensity (kWh/m2·y);
  • E P —annual energy generation of PV equipment (kWh);
  • S B u i l d i n g —the total building area (m2);
  • URRE—utilization ratio of renewable energy (%).

2.4.3. Building Energy-Saving Benefits After PVSD Deployment

The Energy-Saving Benefits from PV Shading
PVSD installations provide measurable passive energy benefits through two key metrics: Passive Energy Saving (PES, calculated using Equation (7))—representing mainly energy savings achieved through passive shading effects—and its relative performance indicator, the Passive Energy Saving Rate (PESR = PES/EUIBL, Equation (8)).
P E S = E U I B L E U I a P V D
P E S R = P E S E U I B L × 100 %
  • P E S —Passive Energy Saving (kWh/m2·y);
  • E U I B L —energy use intensity before PV deployment (kWh/m2·y);
  • E U I a P V D —energy use intensity after PV deployment (kWh/m2·y);
  • P E S R —Passive Energy Saving Rate (%).
Integrated Energy-Saving Benefits After PV Deployment
The integrated energy savings concept quantifies the combined benefits of PVSDs, incorporating both passive shading effects and active PV generation, as calculated in Equation (9). The integrated energy saving rate (IESR) evaluates these combined savings relative to EUI, with computation detailed in Equation (10).
I E S = P E S + S E G I
I E S R = I E S E U I B L × 100 %
  • I E S —integrated energy savings (kWh/m2·y);
  • P E S —Passive Energy Saving (kWh/m2·y);
  • S E G I —solar energy generation intensity (kWh/m2·y);
  • I E S R —integrated energy saving rate (%).

2.4.4. Building Energy-Saving Benefits After PVSD Deployment

This study employs a life cycle assessment (LCA) approach to evaluate the net carbon benefits of PVSDs in urban contexts. While PVSDs offer potential energy savings, their environmental performance must account for embodied carbon emissions across three key phases: manufacturing (160.86 kgCO2-eq/m2), operation (4.93 kgCO2-eq/m2), and end-of-life processing (33.59% reduction via pyrolysis) [36].
According to existing research [37], the carbon reduction effect of PV power generation is calculated using Equation (11). Based on the statistical data [38], the electricity carbon emission factor (M) is set at 0.828 kg/kW·h for this study.
E R C O 2 = E × M
  • E R C O 2 —reduction in carbon emissions (kg);
  • E —electricity consumption (kW·h);
  • M —carbon emission factor of electricity (kg/kW·h).
This study evaluates carbon reduction benefits using a normalized metric (CERB) calculated as Equation (12).
C E R B = C E R S B u i l d i n g
  • C E R B —carbon emission reduction benefits (kg/m2);
  • C E R —carbon emission reduction (kg);
  • S B u i l d i n g —block-building area (m2).

3. Results

3.1. Building Energy Use Before PVSD Deployment

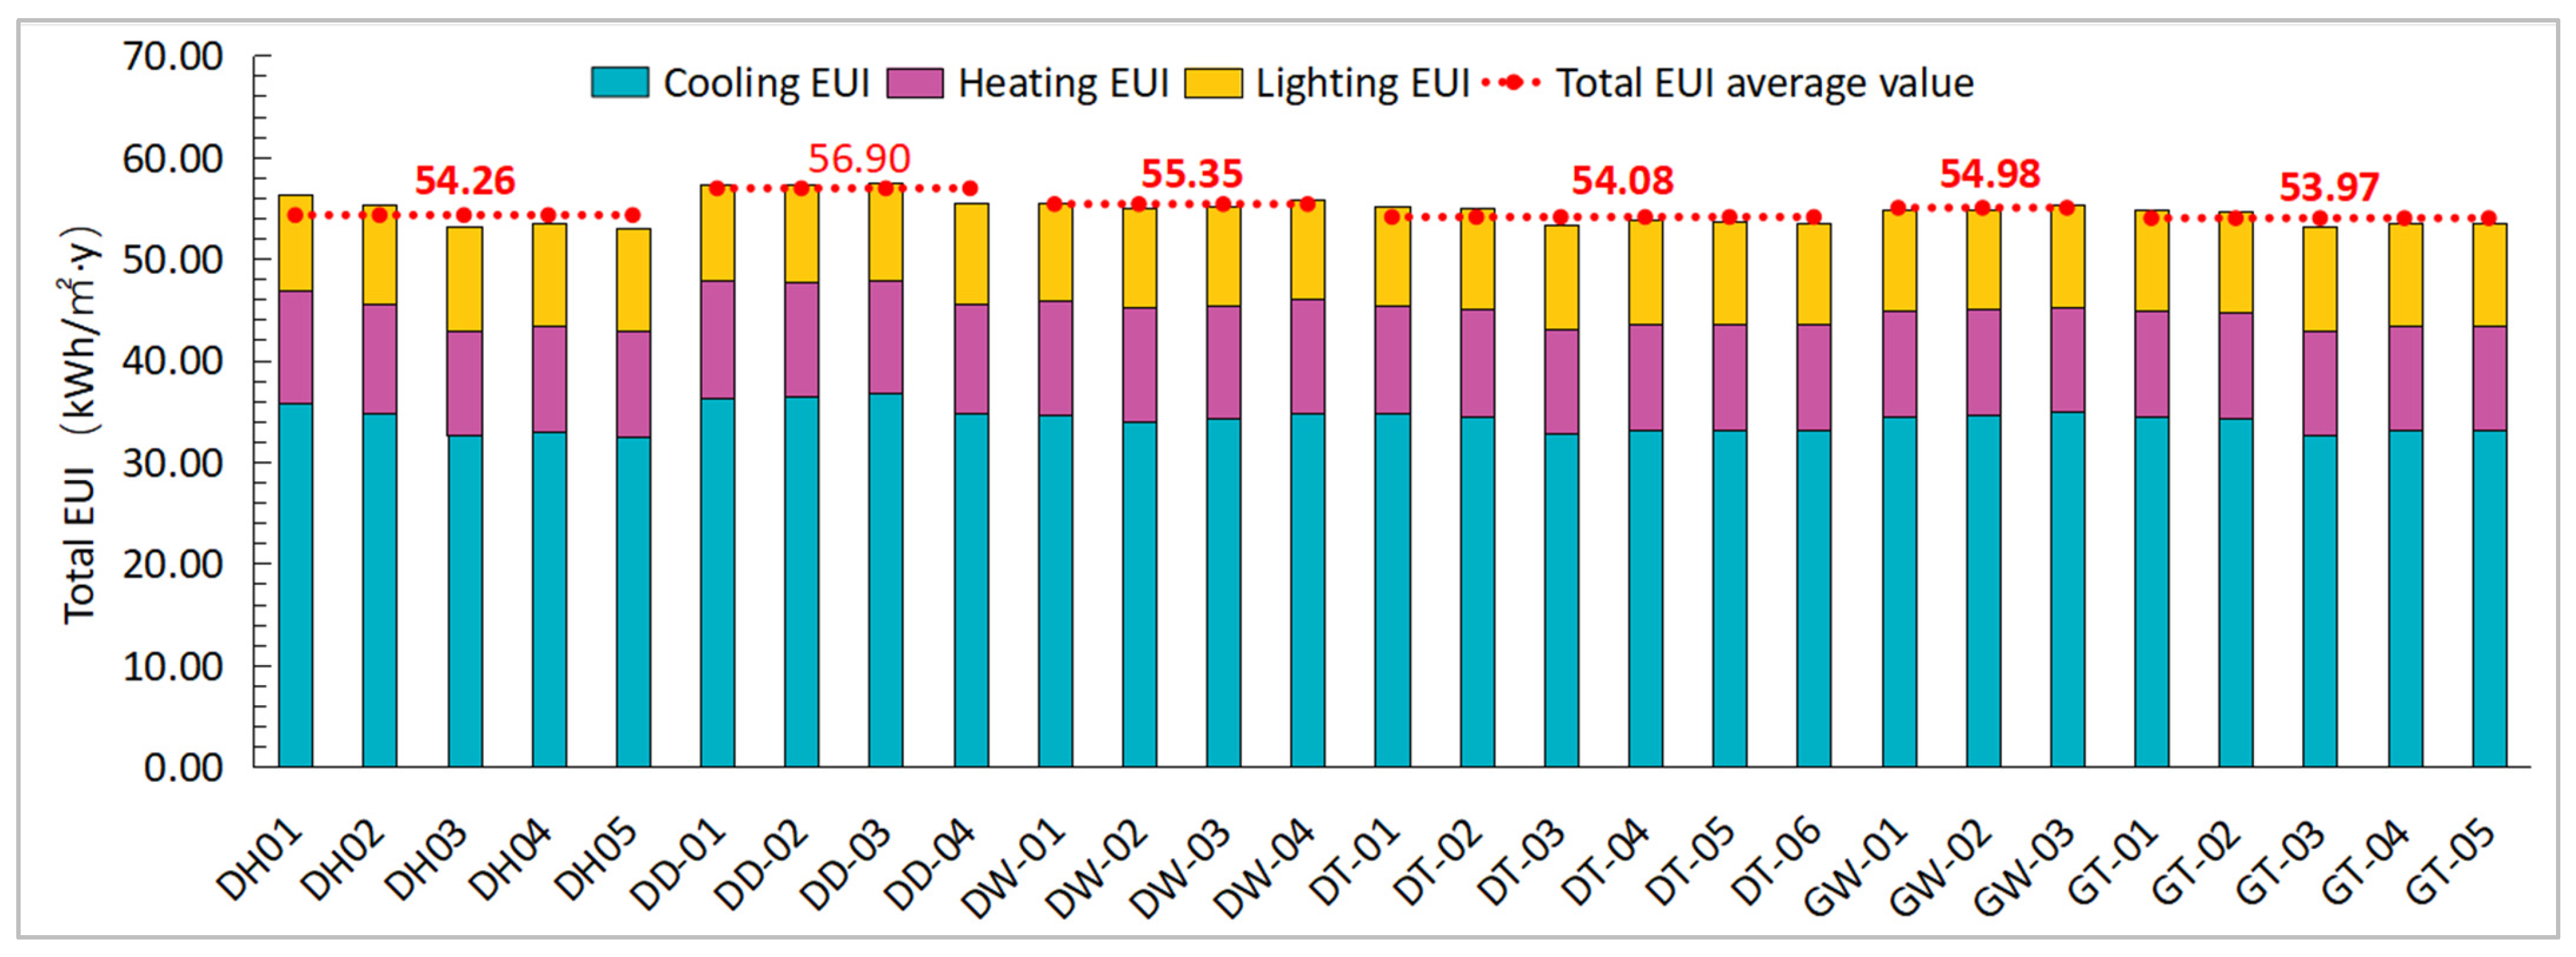
Figure 2 presents cooling, heating, and lighting EUI distributions across six urban block typologies, revealing significant morphological impacts. The findings are consistent with prior studies demonstrating minimal block-type influence on equipment energy use [3,4]
Analysis of cooling energy demand revealed pronounced variations between urban block configurations, with Multi-Story Tower blocks demonstrating the highest EUI (36.07 kWh/m2·y)—7.6% greater than the most efficient High-Rise Perimeter block (33.52 kWh/m2·y). Heating demand exhibited distinct patterns, with Multi-Story Courtyard blocks (11.26 kWh/m2·y) showing 9.1% higher EUI than the most efficient High-Rise Perimeter block (10.32 kWh/m2·y). Lighting requirements revealed an inverse relationship, where High-Rise Perimeter blocks (10.13 kWh/m2·y) demonstrated 4.4% greater EUI than Multi-Story Tower and Multi-Story Courtyard configurations (both 9.7 kWh/m2·y), reflecting the inherent trade-off between solar protection and daylight availability. Aggregate analysis identified Multi-Story Tower blocks as the least energy efficient overall (56.90 kWh/m2·y), exceeding High-Rise Perimeter blocks’ consumption (53.97 kWh/m2·y) by 5.4%, with cooling demand emerging as the primary determinant of total energy performance. These findings collectively demonstrate the complex, morphology-dependent relationships between urban form and various energy end-uses (Figure 5).

3.2. The Energy-Saving Benefits from PV Shading

3.2.1. The Impact of PVSDs on Energy-Saving Benefits from PV Shading

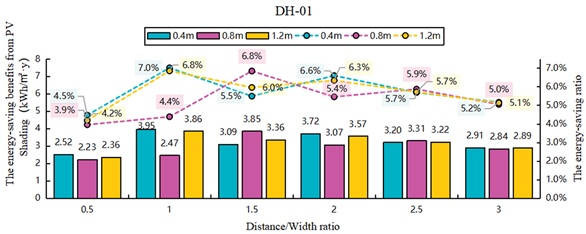
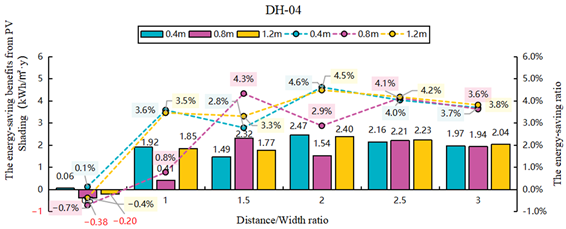
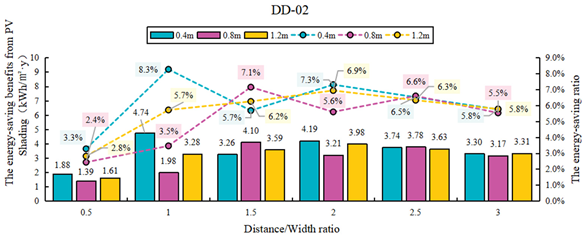
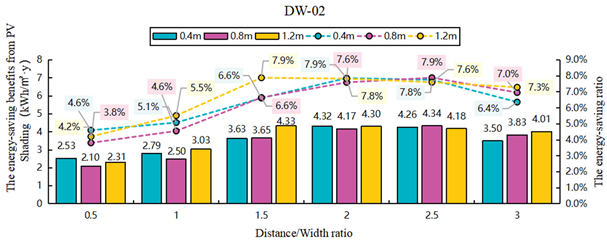
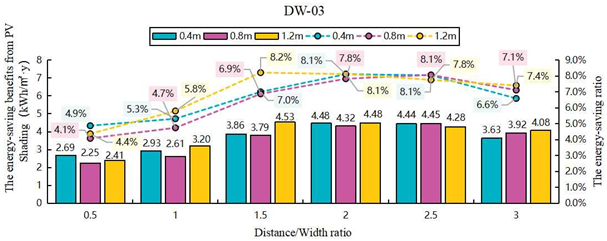
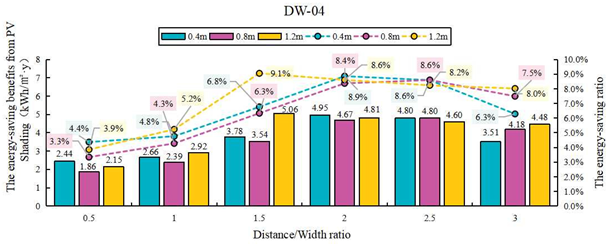
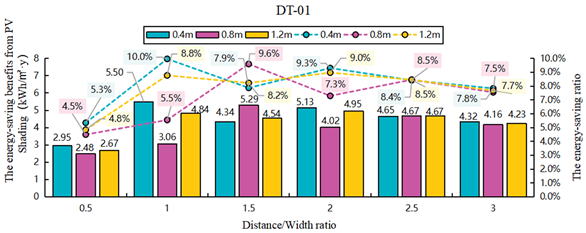
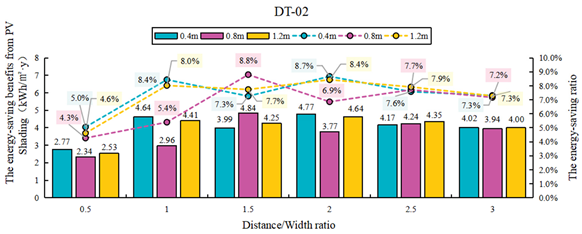
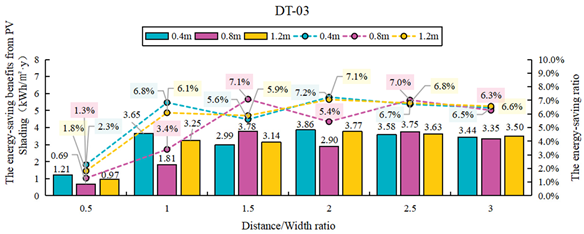
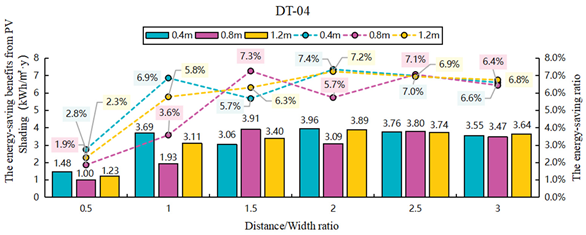
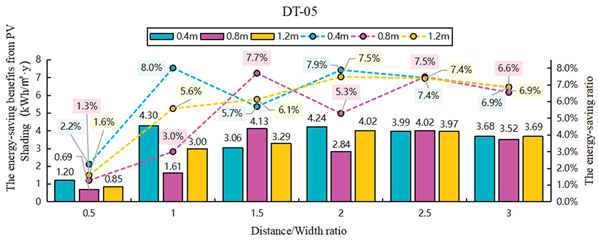
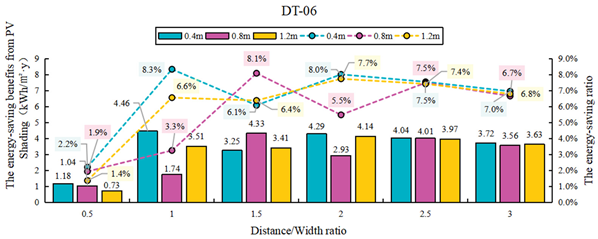
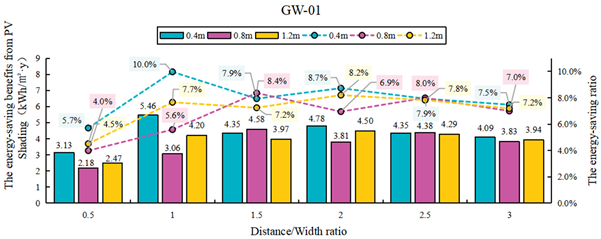
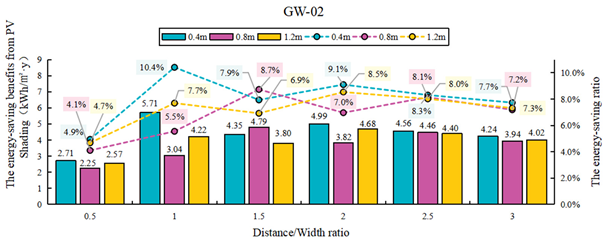
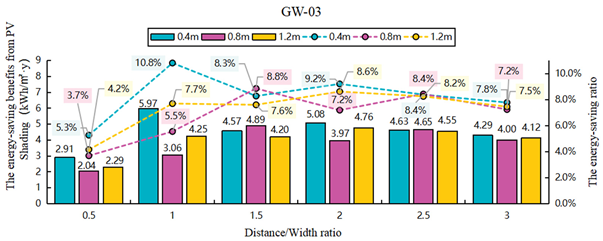
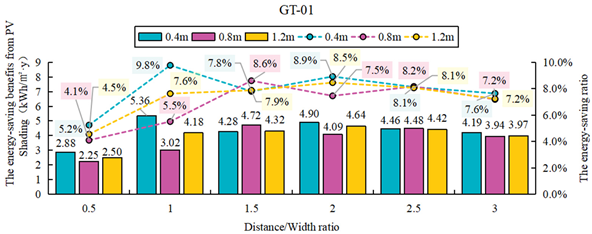
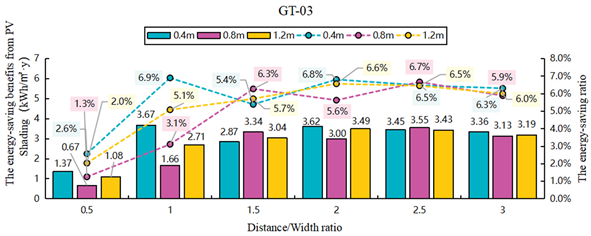
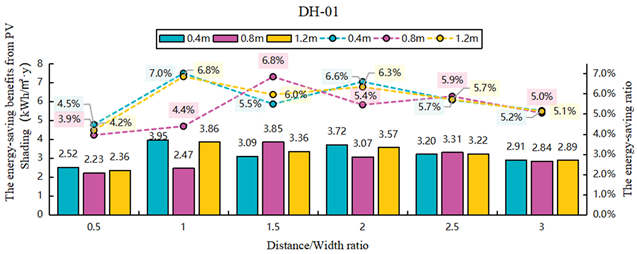
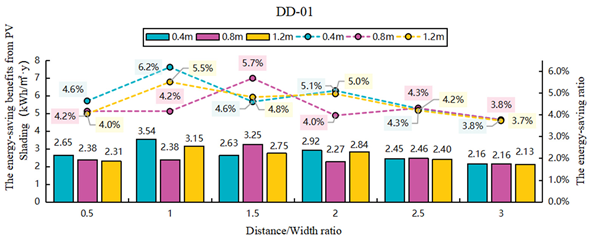
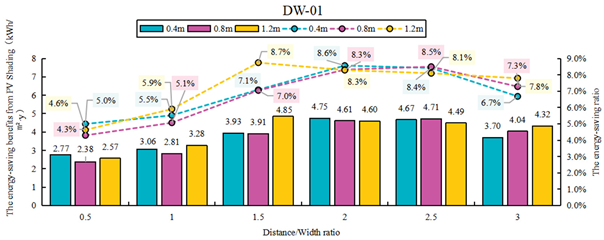
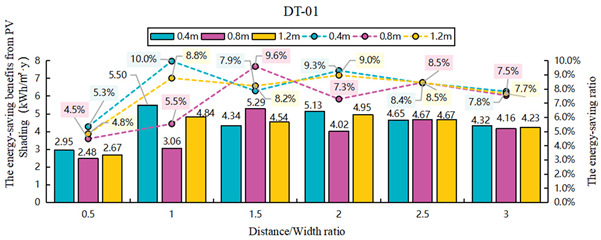
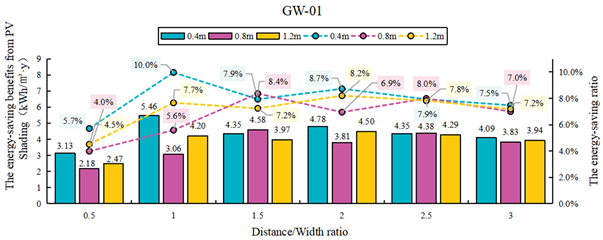
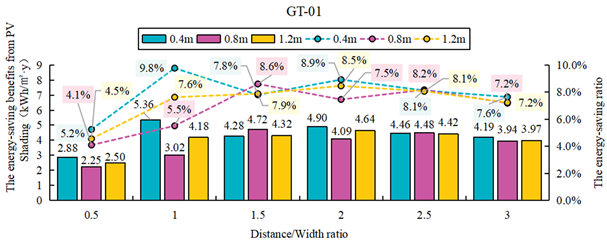
The comprehensive analysis of 486 scenarios across 27 office blocks revealed distinct optimization patterns for PVSDs. As shown in Table 7, most block typologies exhibited bimodal energy-saving curves with peak efficiencies at D/W ratios of 1 and 2, while Multi-Story Courtyard blocks demonstrated unique unimodal optimization at D/W = 2.5. Comparative analysis identified 0.4 m PVSDs as the most effective overall (6.23% average savings), outperforming 1.2 m (5.97%) and 0.8 m (5.44%) configurations. Significant typological variations emerged, with High-rise Hybrid blocks achieving maximum savings (8.1% for 0.4 m PVSDs)—2.6 times greater than the least efficient Multi-Story Slab blocks (3.83%). The optimal case (High-rise Hybrid block-03 with 0.4 m PVSDs at D/W = 1) reached an exceptional 10.8% passive savings rate, establishing new indicators for integrated PV shading systems. These findings provide critical insights for climate-responsive design, particularly the non-linear relationship between design parameters and energy performance.

3.2.2. The Impact of Block Typology on Energy-Saving Benefits from PV Shading

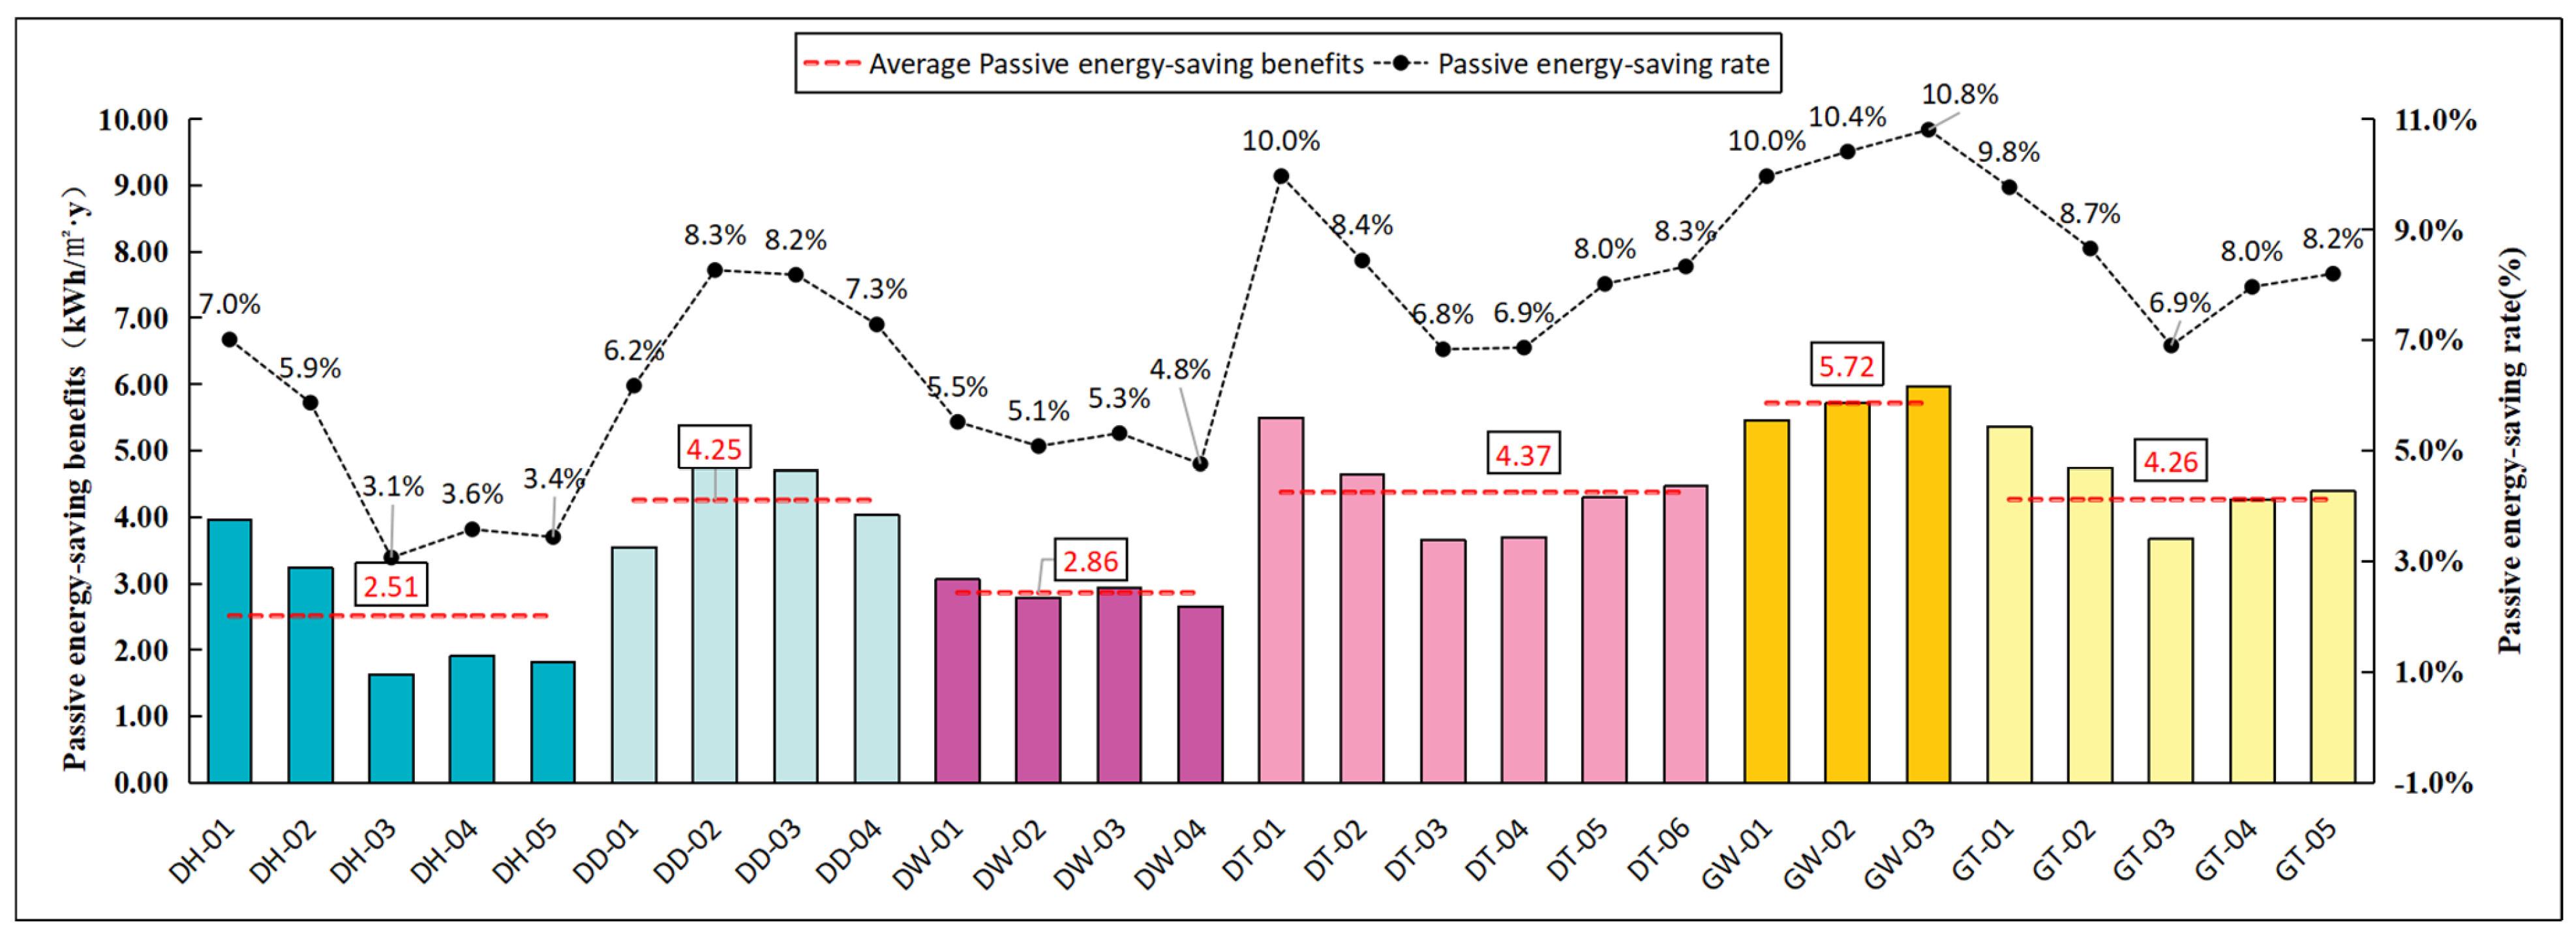
Figure 6 demonstrates that PVSDs (W = 0.4 m, D/W = 1) can achieve remarkable passive energy savings, with peak performance reaching 10.8%. Analysis of the 27 office blocks revealed substantial typological variations, where High-Rise Perimeter blocks demonstrated superior performance (10.40%, 5.72 kWh/m2·y), contrasting sharply with Multi-Story Slab blocks’ minimal gains (4.63%, 2.51 kWh/m2·y)—representing a significant 5.77% disparity. The passive energy-saving benefits followed a consistent hierarchy: High-Rise Hybrid (5.72 kWh/m2·y) > Multi-Story Perimeter (4.37 kWh/m2·y) > High-Rise Perimeter (4.26 kWh/m2·y) > Multi-Story Tower (4.25 kWh/m2·y) > Multi-Story Courtyard (2.86 kWh/m2·y) > Multi-Story Slab (2.51 kWh/m2·y) blocks. These findings not only quantify the morphological dependence of PVSDs’ effectiveness but also establish clear design priorities for maximizing passive benefits in office buildings.

3.3. The PV Power Generation Potential from PVSDs

3.3.1. The Impact of PVSDs on PV Power Generation Potential

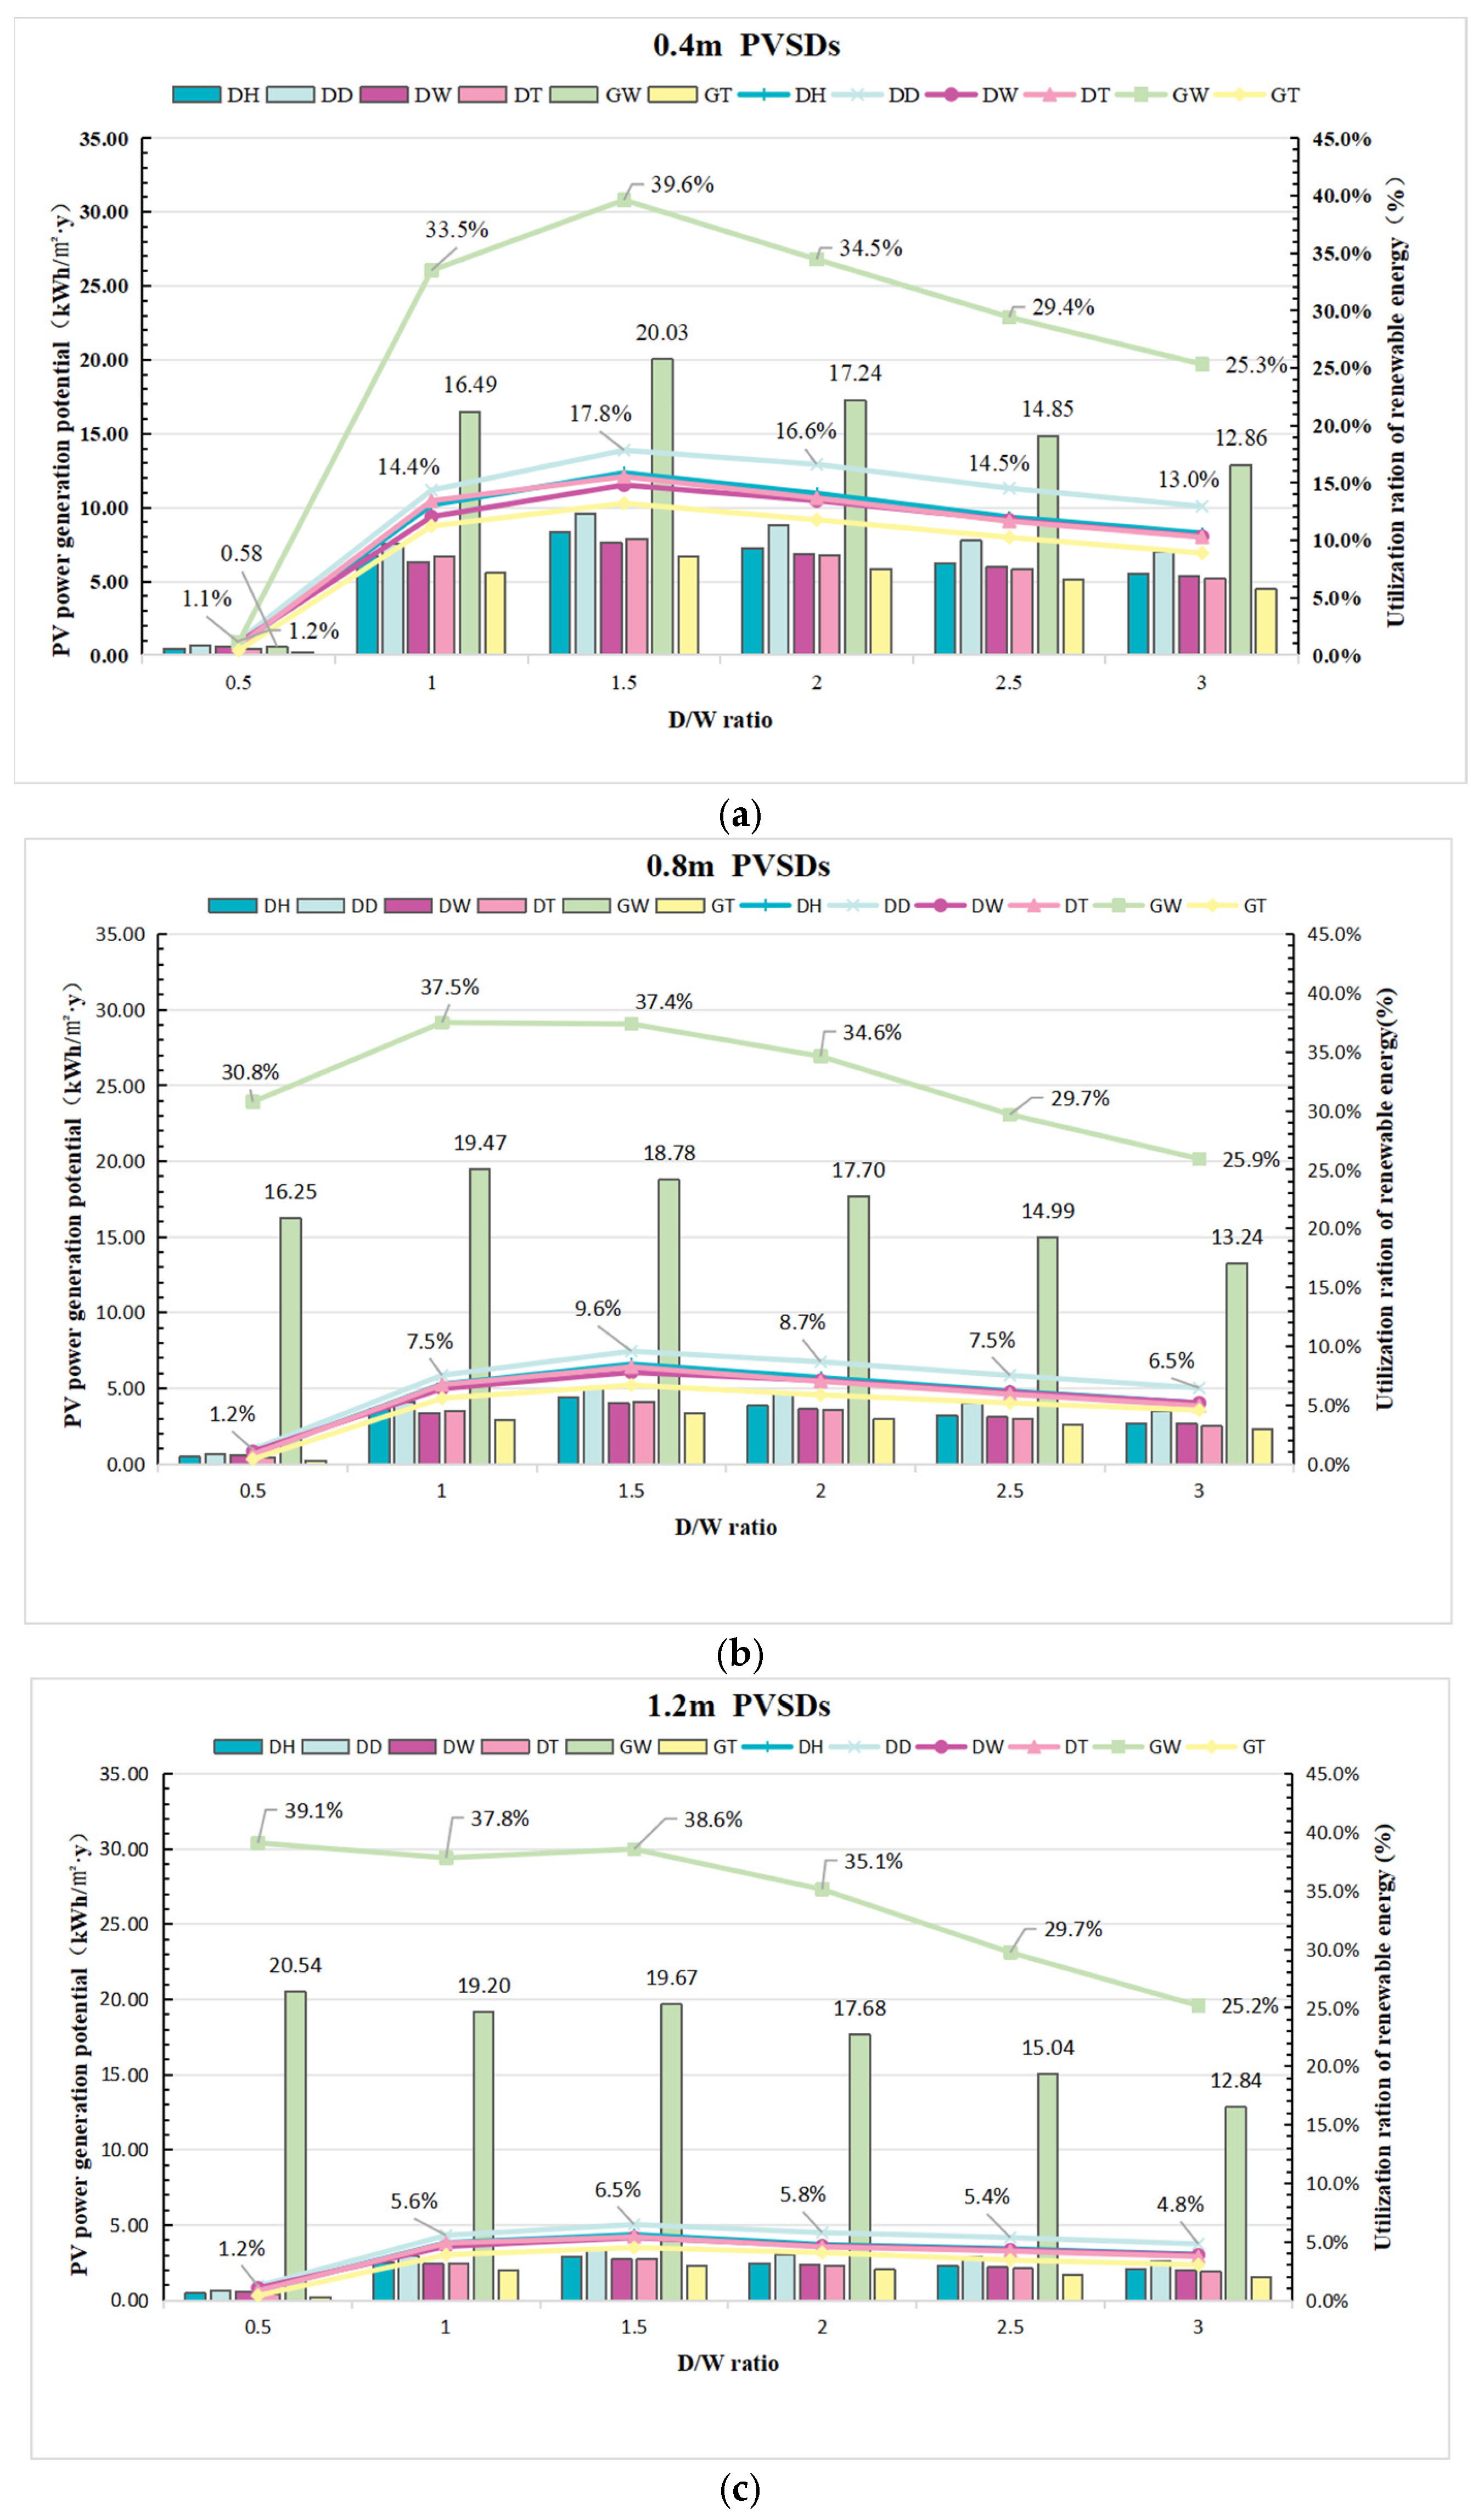
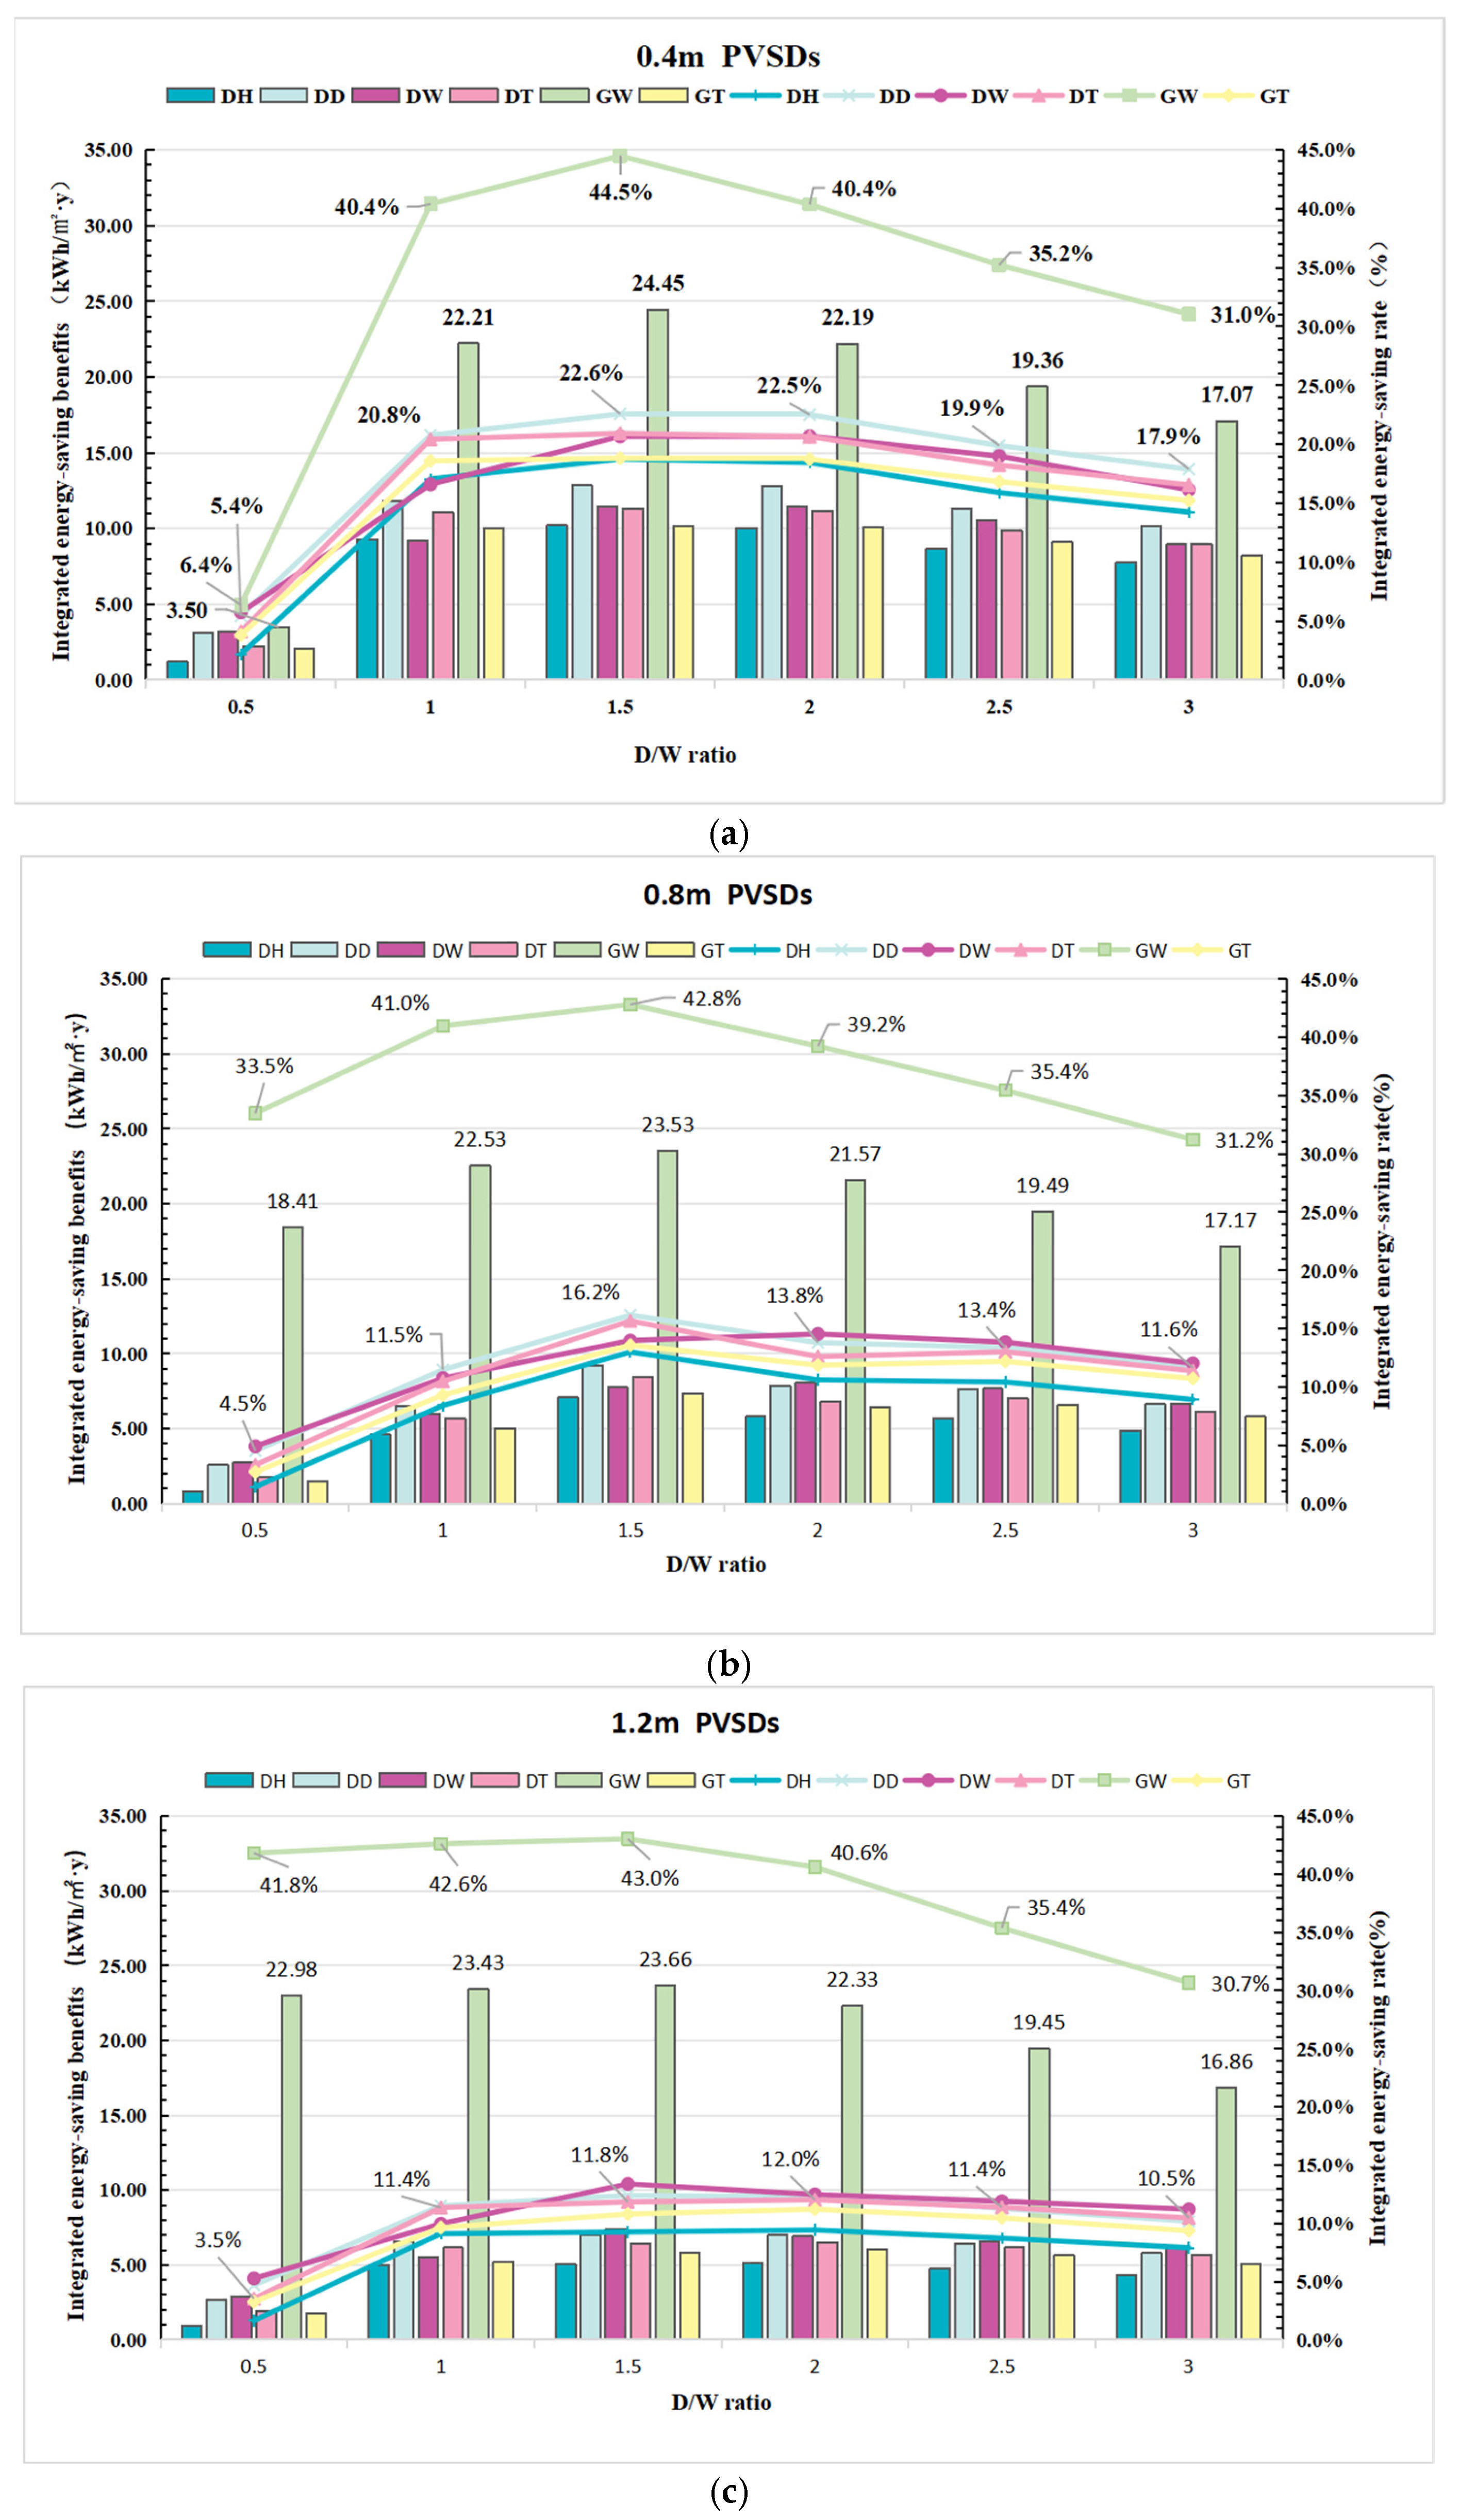
The analysis of 162 scenarios reveals distinct optimization patterns for PVSDs, with most block typologies exhibiting peak generation potential at D/W = 1.5 (Figure 7). Exceptionally, Multi-Story Courtyard blocks showed width-dependent optima: 0.4 m/0.8 m PVSDs peaked at D/W = 1.5, while 1.2 m units performed best at D/W = 0.5. The 0.4 m PVSDs achieved the highest average URRE (12.71%), surpassing 1.2 m (8.67%) and 0.8 m (7.35%) configurations. Striking typological variations emerged, with High-rise Hybrid blocks demonstrating exceptional performance (27.24–34.26% URRE across widths)—3.7 times greater than the least efficient High-Rise Perimeter blocks (3.23–9.30%). The optimal configuration (High-rise Hybrid block-03 with 0.4 m PVSDs at D/W = 1.5) achieved a remarkable 40.8% URRE.

3.3.2. The Impact of Block Typology on PV Power Generation Potential

To compare the impact of different block typologies on the PV power generation potential of PVSDs, this study uses the scenario with the overall best-performing PVSDs—0.4 m width and a D/W ratio of 1.5—as a basis for a cross-sectional comparison of various block typologies.
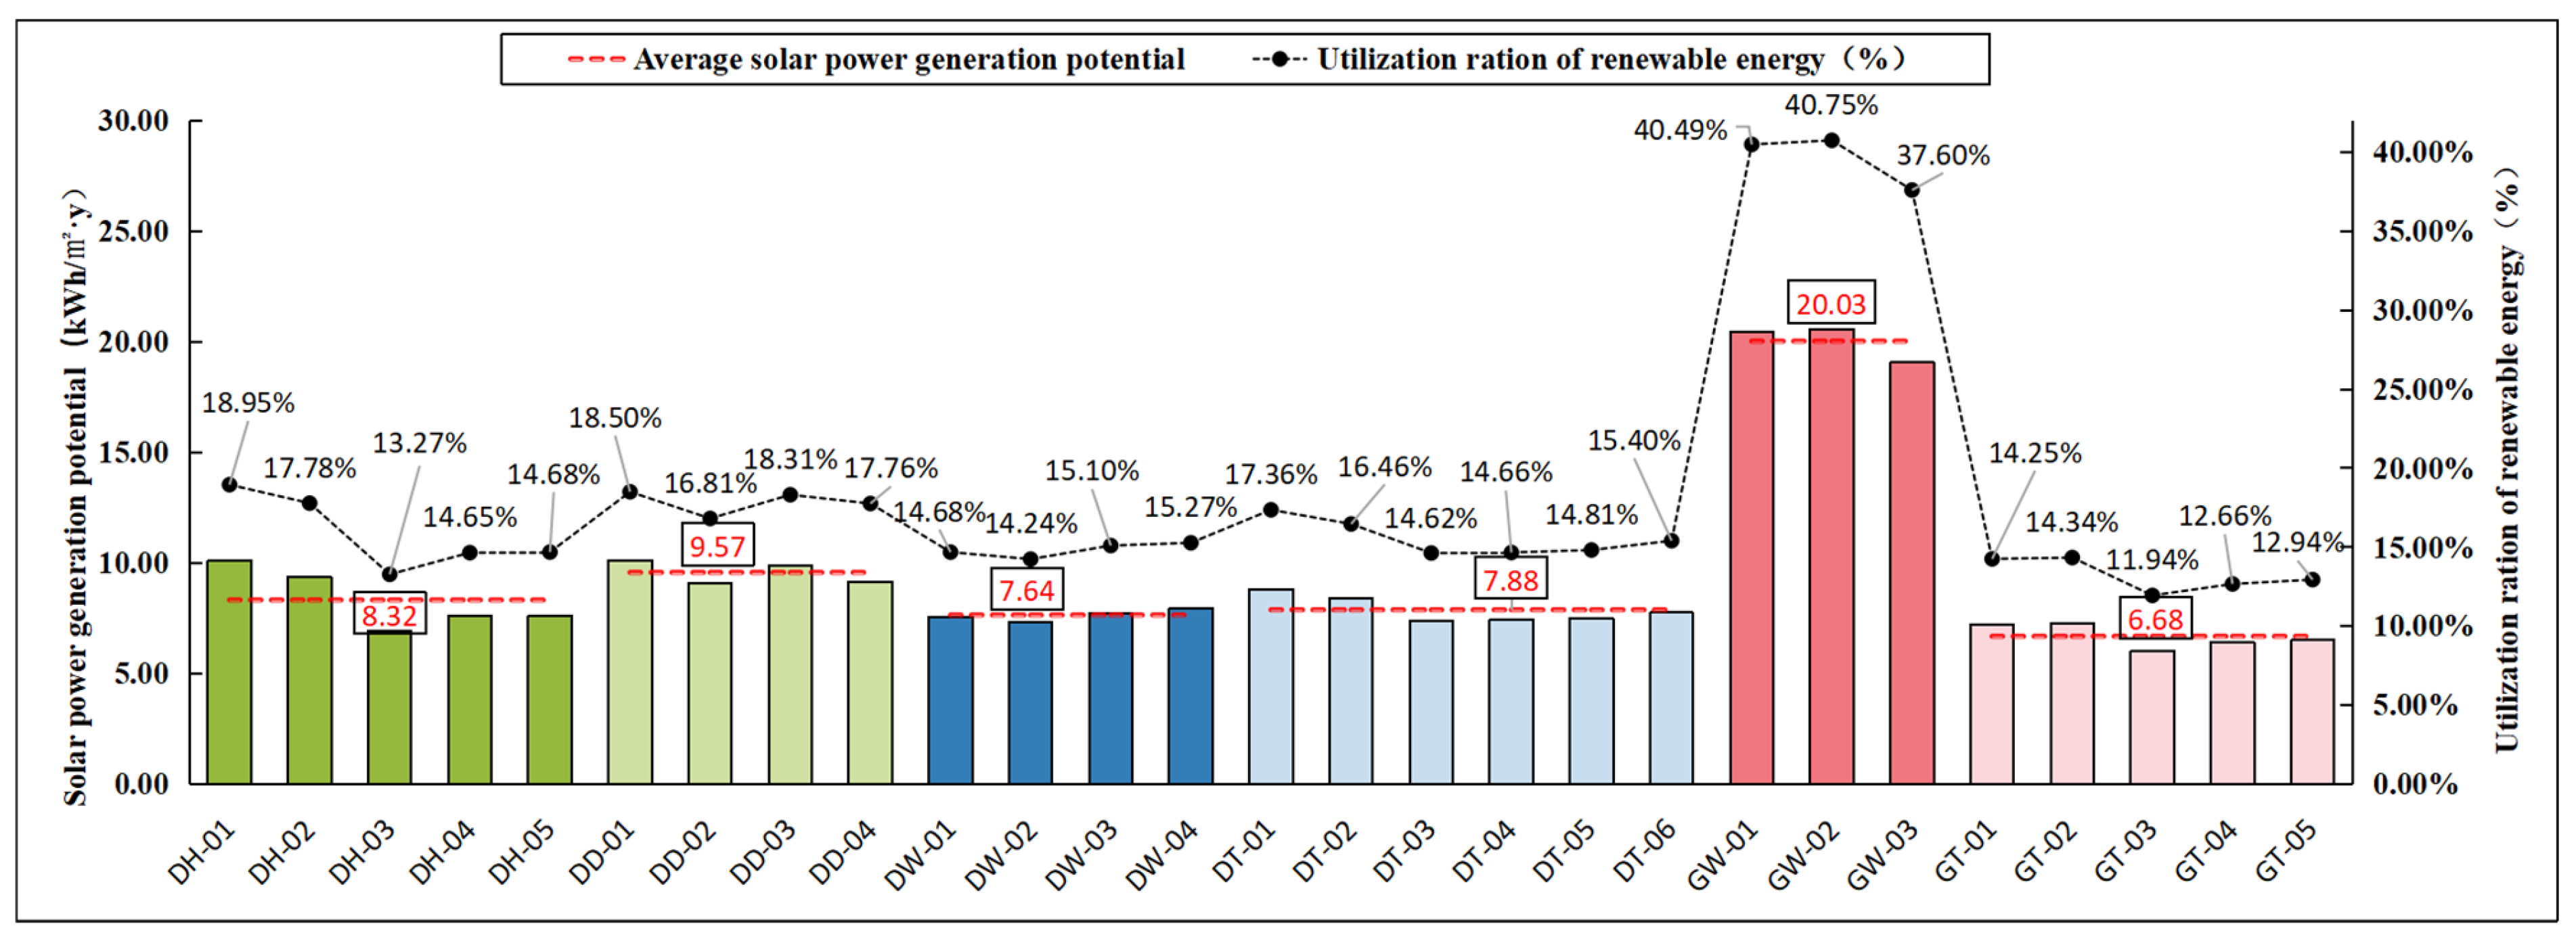
Figure 8 shows that PVSDs (0.4 m width, D/W = 1.5) can achieve exceptional renewable energy utilization, with peak performance reaching 40.75% URRE. Significant morphological influences were observed, as High-rise Hybrid blocks yielded the highest generation capacity (20.03 kWh/m2·y), contrasting sharply with the poorest-performing High-Rise Perimeter blocks (6.68 kWh/m2·y)—representing a three-fold performance differential. The typological performance hierarchy was consistently as follows: High-rise Hybrid (20.03 kWh/m2·y) > Multi-Story Tower (9.57 kWh/m2·y) > Multi-Story Slab (8.32 kWh/m2·y) > Multi-Story Perimeter (7.88 kWh/m2·y) > Multi-Story Courtyard (7.64 kWh/m2·y) > High-Rise Perimeter (6.68 kWh/m2·y). This revealed distinct correlations between block typology characteristics and renewable energy harvesting efficiency.

3.4. Building-Integrated Energy-Saving Benefits After PVSD Deployment

3.4.1. The Impact of PVSDs on Building-Integrated Energy-Saving Benefits

Figure 9 illustrates that all PVSD widths (0.4 m, 0.8 m, 1.2 m) exhibit a consistent performance pattern, reaching peak generation potential at D/W = 1.5 before declining. Comparative analysis of 162 scenarios revealed the 0.4 m PVSDs delivered superior integrated energy savings (average 18.05%), outperforming both 1.2 m (13.57%) and 0.8 m (12.82%) configurations. Significant typological variations were observed, with High-rise Hybrid blocks achieving remarkable efficiency (32.98–39.02% across widths)—nearly three times greater than the least effective Multi-Story Slab blocks (7.69–14.43%). The optimal configuration (High-rise Hybrid block-02: 0.4 m PVSD, D/W = 1.5) established a new performance reference value with 45.5% energy savings, demonstrating the substantial potential of morphology-optimized PVSD integration in urban environments.

3.4.2. The Impact of Block Typology on Building-Integrated Energy-Saving Benefits

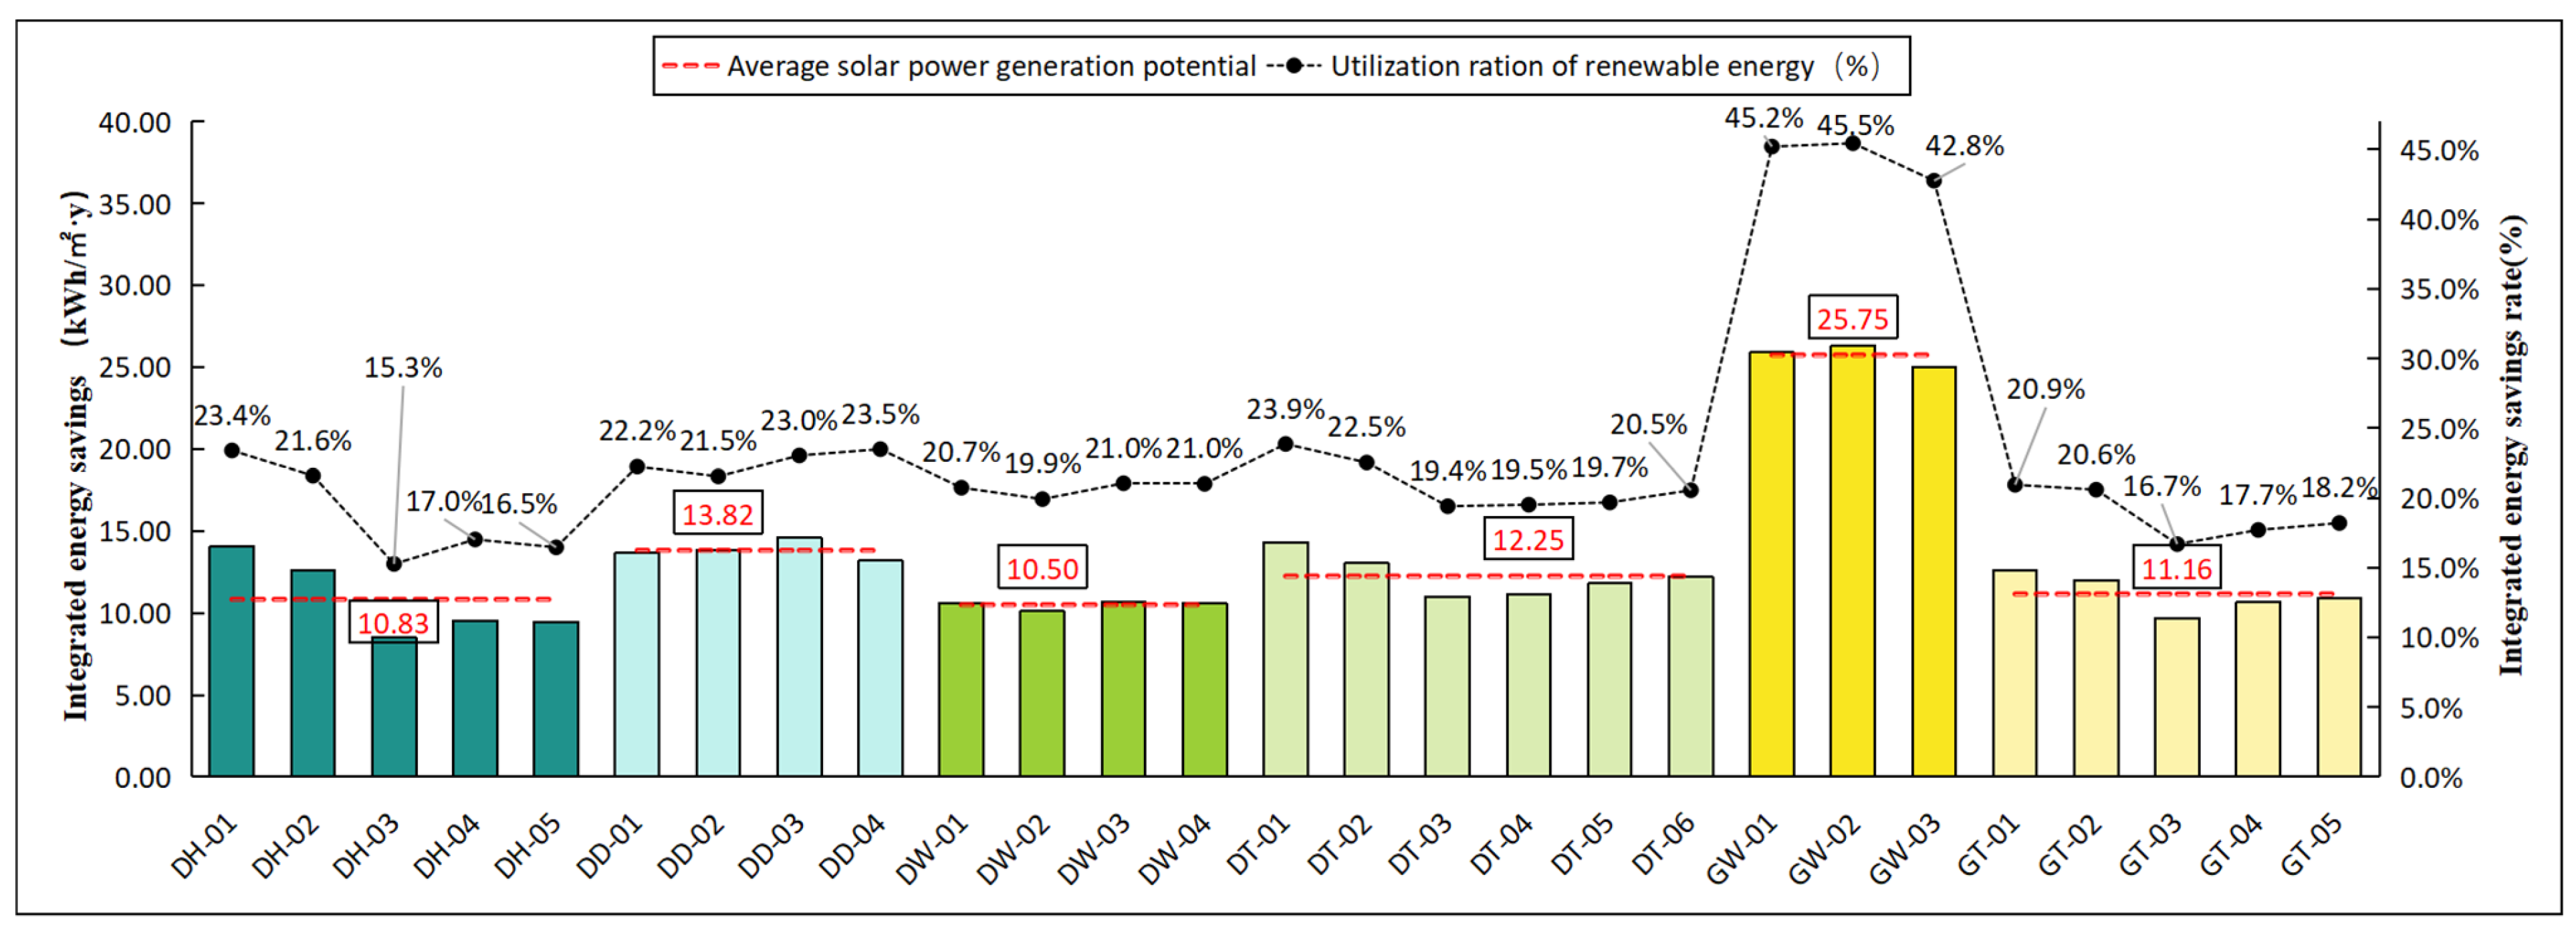
Figure 10 reveals that PVSDs (0.4 m width, D/W = 1.5) achieve a peak integrated energy saving rate (IESR) of 41.7%, with High-rise Hybrid blocks demonstrating superior performance (24.45 kWh/m2·y)—nearly double that of optimal multi-story configurations (Tower blocks: 10.17 kWh/m2·y). While minimal variation occurs among multi-story typologies (Perimeter, Slab, Courtyard), the overall performance hierarchy remains consistent: High-rise Hybrid (24.45 kWh/m2·y) > Multi-Story Tower (12.83 kWh/m2·y) > Multi-Story Courtyard (11.44 kWh/m2·y) > Multi-Story Perimeter (11.32 kWh/m2·y) > Multi-Story Slab (10.21 kWh/m2·y) > High-Rise Perimeter (10.17 kWh/m2·y). These findings quantitatively establish the critical relationship between block typology and synergistic energy benefits from integrated PV systems.

3.5. The Carbon Reduction Benefits of PVSD Deployment

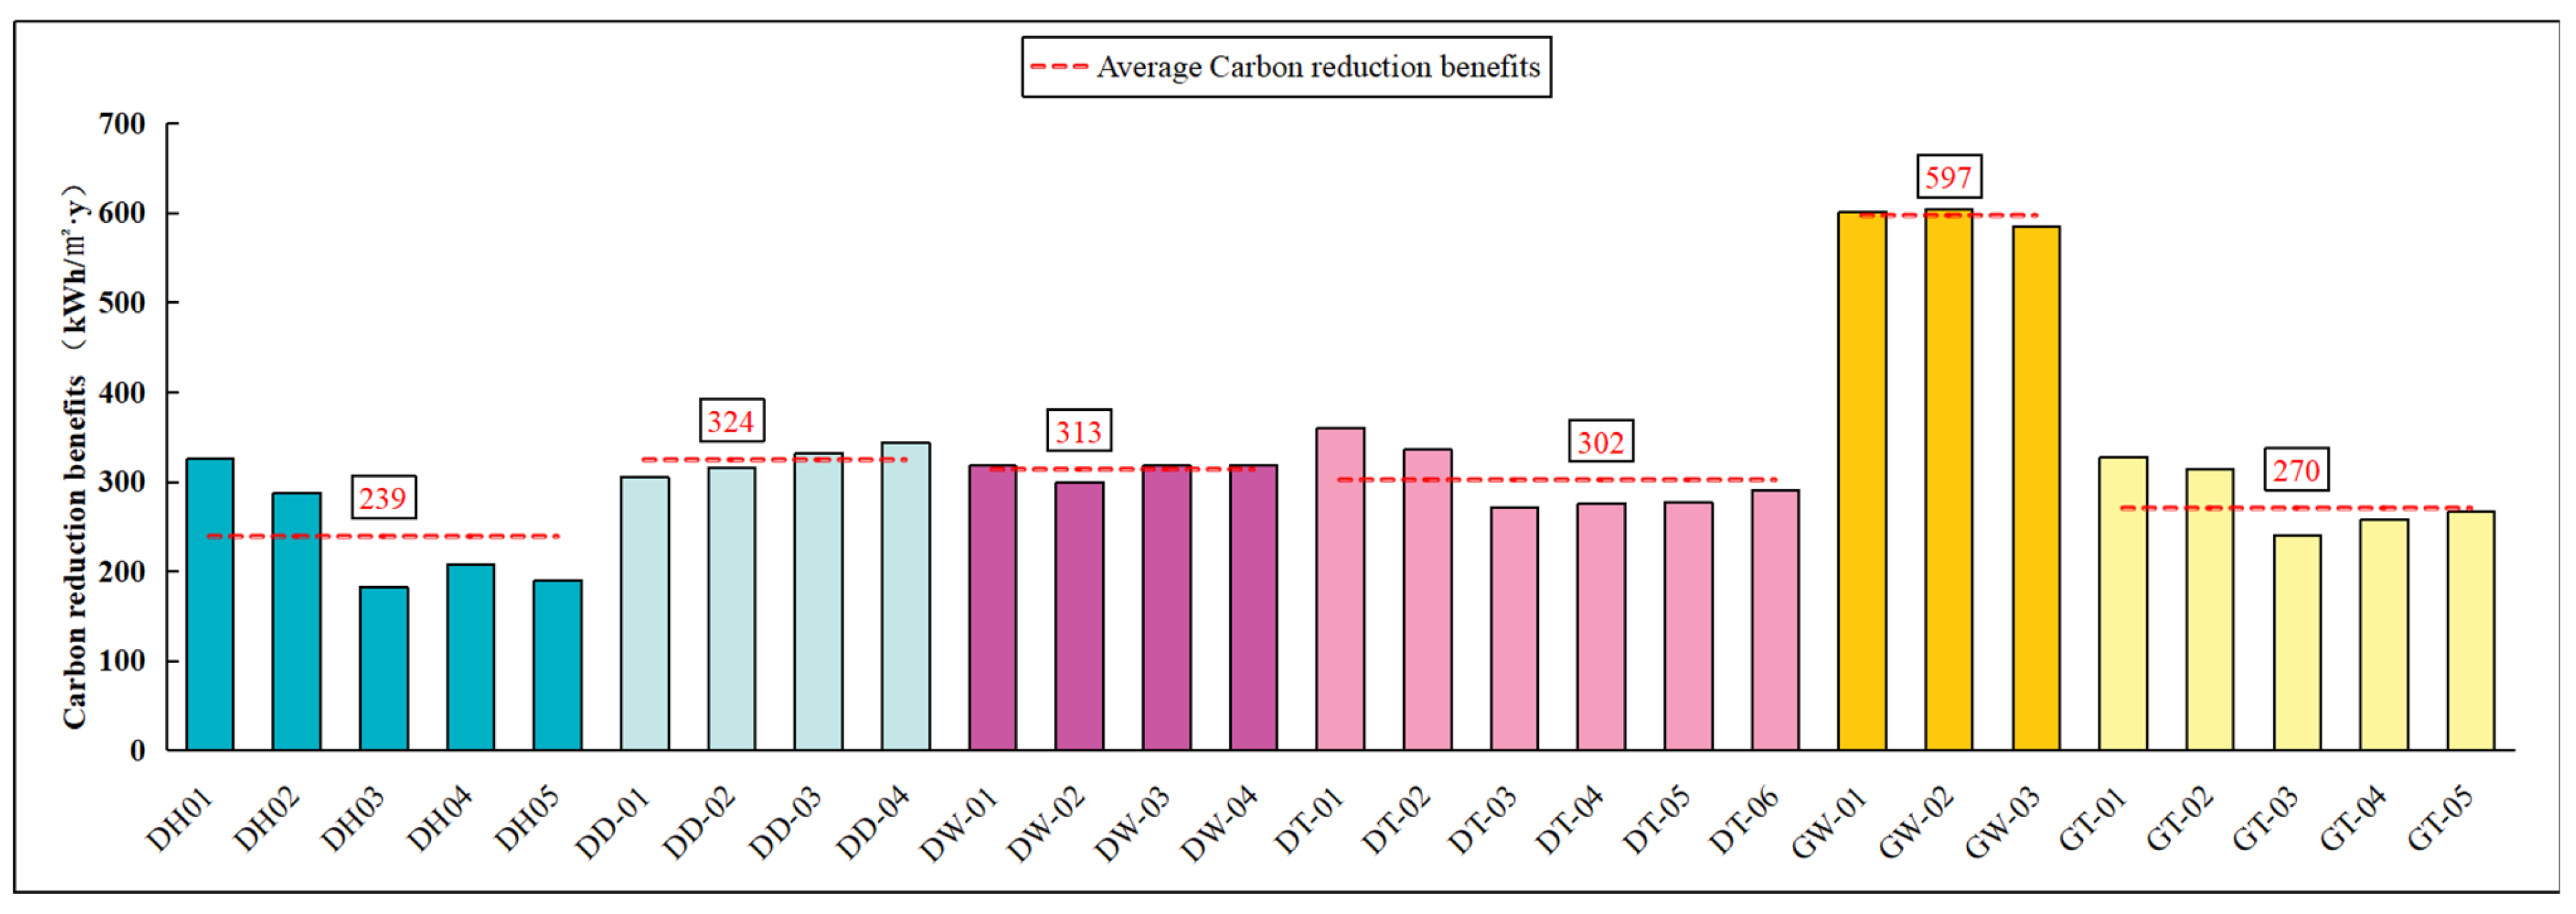
Figure 11 illustrates significant carbon mitigation potential (239–597 kg/m2) for 0.4 m PVSDs (D/W = 1) across 27 office blocks. The High-rise Hybrid block achieved exceptional performance (597 kg/m2), yielding 2.5 times greater carbon reduction than the least effective Multi-Story Slab block (239 kg/m2). A consistent efficacy hierarchy emerged: High-rise Hybrid (597 kg/m2) > Multi-Story Tower (324 kg/m2) > Multi-Story Courtyard (313 kg/m2) > Multi-Story Perimeter (302 kg/m2) > High-Rise Perimeter (270 kg/m2) > Multi-Story Slab (239 kg/m2). This highlights the substantial influence of block typology on PVSDs’ carbon performance.

4. Discussion

4.1. Synergistic Mechanisms Insights of Urban Typology–PVSD Integration

Existing studies have demonstrated significant impacts of urban typology on building energy use [3,7]. In contrast to tropical climates like Singapore, where cooling demand dominates the energy profile [17], Wuhan, as a representative city in China’s hot-summer–cold-winter climate zone, demonstrates complex thermo-optical coupling mechanisms between cooling, heating, and lighting energy use systems through distinct urban morphological interventions. The urban morphology influences these three energy demand components via differentiated pathways, exhibiting non-linear interactions that manifest as a tripartite energy nexus.
This study reveals differential impact mechanisms of block typologies on energy use: High-Rise Perimeter blocks achieve the lowest integrated EUI (53.97 kWh/m2·y) through a compact S/V ratio (7.6% cooling energy reduction versus Multi-Story Tower blocks) and shading advantages, despite a 4.4% increase in lighting energy use from mutual shading. This validates that in hot-summer–cold-winter zones, where cooling-dominated energy structures account for over 60% of total use, shading benefits substantially outweigh daylighting penalties. Conversely, Multi-Story Tower blocks exhibit elevated energy demands for both cooling and heating (36.07 and 11.13 kWh/m2·y, respectively) due to excessive surface-to-volume ratios (S/V ratio). These findings provide quantitative evidence for climate-adaptive design principles, demonstrating that strategic trade-offs favoring shading over daylighting yield whole-building energy efficiency advantages when cooling loads predominate.
Existing research has extensively investigated various parameters of PVSDs [26], but few studies have examined their coupling effects with urban typology. Our findings demonstrate that for all building types except multi-story courtyard blocks, PVSDs with a width of 0.4 m exhibit a distinct bimodal energy-saving pattern from PV Shading, peaking at D/W ratios of 1 and 2, with maximum energy savings reaching 10.8%. This phenomenon can be primarily attributed to variations in shading and ventilation effects at different spacing intervals. At D/W = 1, the first energy-saving peak occurs due to an optimal balance between shading and ventilation. When PVSDs are positioned 0.4 m from the wall surface (D/W = 1), the close proximity provides excellent shading that blocks most direct sunlight, while maintaining modest ventilation. The second peak at D/W = 2 emerges as increased spacing enhances ventilation performance, despite slightly reduced shading effectiveness, ultimately creating the observed bimodal energy-saving pattern.
The multi-story courtyard block represents an exceptional case, achieving optimal performance only at D/W = 2.5. This unique behavior likely stems from the microclimate interaction characteristics of its enclosed courtyard morphology. The enclosed courtyard design features significantly higher east/west facade exposure, while suffering from more severe internal shading. Furthermore, the thermal stack effect ventilation dominates in the courtyard’s central atrium space, creating vertical temperature gradients. The building’s self-shading characteristics are particularly pronounced—when D/W ratios fall below 2.5, PVSDs positioned closer to the wall fail to fully realize their shading potential.
These findings underscore the imperative of incorporating specific urban morphological considerations in PVSD system design and implementation, particularly in complex climatic zones requiring meticulous balance between cooling, heating, and lighting energy demands. The research yields significant insights for climate-responsive architectural design in multi-energy utilization zones.
From the perspective of urban typology, high-rise buildings generally demonstrate superior passive shading benefits from PVSDs compared to the multi-story blocks. The High-Rise Perimeter block achieves optimal performance with energy savings of 5.72 kWh/m2·y, while the Multi-Story Courtyard block and Multi-Story Slab block show the poorest energy-saving benefits at 2.51 and 2.86 kWh/m2·y, respectively. This discrepancy primarily stems from the shading network formed through vertical stacking in high-rise structures, which generates persistent shadow coverage. Additionally, the enhanced wind velocity at elevated heights improves convective heat transfer, reducing building surface temperatures. In tropical regions such as Singapore, where building energy performance is predominantly governed by cooling demand, the passive shading benefits of PVSDs in high-rise buildings are further accentuated [17].
This study reveals that PV power generation potential from PVSDs shows substantially higher sensitivity to urban typology and PVSD variations than building energy use and PV shading benefits. These results are consistent with prior findings, such as those in [2,3,4]. Quantitative analysis demonstrates that urban typology impacts building energy use by 5.4%, affects PV shading benefits by 5.77%, and influences PV generation potential by 59.5%. As a result, the integrated energy-saving benefits, combining all three factors, predominantly follow patterns similar to PV power generation potential.
The study reveals significant performance differences in urban blocks before and after PVSD deployment. Pre-deployment, High-Rise Perimeter blocks achieved the lowest EUI (53.97 kWh/m2·y) due to their compact layout’s shading benefits. Post-deployment, high-rise hybrid blocks demonstrated superior performance with optimal photovoltaic potential (URRE 40.8%) and integrated energy saving rate (IESR 45.5%). Mechanistic analysis shows that while compact layouts improve EUI by reducing cooling loads (dominant in total EUI), their mutual shading significantly compromises PVSD generation potential. In contrast, the staggered configuration of high-rise hybrid blocks enhances PV generation potential by 3-fold through three-dimensional morphological complexity that captures superior solar radiation. This demonstrates that in hot-summer–cold-winter climates, three-dimensional morphological complexity—rather than mere compactness—is the critical determinant of PVSDs’ integrated energy-saving benefits, establishing a new paradigm for morphology optimization in PV-integrated low-carbon urban design.
A clear understanding of the distinction between the Passive Energy Saving Rate (PESR) and the integrated energy saving rate (IESR) is therefore fundamental to interpreting these performance differentials. PESR (PES/EUIBL) quantifies the relative reduction in energy demand achieved purely through the passive shading effects of PVSDs. IESR ((PES+SEGI)/EUIBL), however, represents the total benefit, combining this passive saving (PES) with the active energy generation from the PV system (SEGI). Thus, IESR inherently encompasses and exceeds PESR, providing a holistic performance metric. In this study, the mean PESR is 6.01%; values above this benchmark indicate effective passive shading. The mean IESR is 22.95%, with higher values signifying superior overall energy performance. PESR is therefore vital for evaluating the passive design efficacy of the shading devices themselves, while IESR offers a comprehensive gauge of the system’s total contribution to building energy sustainability, enabling a more complete assessment of the PVSDs’ integrated value.

4.2. Practical Implications for Low-Carbon Urban Design

This study provides actionable strategies for optimizing urban block design and PVSD deployment to enhance energy efficiency and renewable energy utilization. For achieving the lowest building energy use intensity (EUI), High-Rise Perimeter blocks are recommended, with an EUI of 53.97 kWh/m2·y, representing a 5.4% reduction compared to Multi-Story Tower blocks. However, for superior integrated performance encompassing energy saving, PV generation, and carbon reduction, High-Rise Hybrid blocks are the optimal choice. Although they exhibit a slightly higher EUI, they excel in PV generation potential (34.26% URRE), integrated energy savings (39.02% IESR), and carbon reduction (585 kg/m2), substantially outperforming Perimeter blocks.
Regarding PVSDs, the configuration with a width of 0.4 m and a D/W ratio of 1.5 is identified as the most effective, achieving an average integrated energy saving of 18.05% and a peak PV generation efficiency of 40.8% URRE. This setup balances shading benefits and energy generation better than wider alternatives (0.8–1.2 m). Furthermore, to maximize carbon mitigation, High-Rise Hybrid blocks should be prioritized, as they can achieve up to 597 kg/m2 in carbon reduction—2.5 times that of Multi-Story Slab blocks.

4.3. Transferability of Findings to Other Climate Zones

While this study provides robust evidence for optimizing urban block typology and PVSD integration in hot-summer–cold-winter climates like Wuhan, the transferability of these findings to other climatic regions warrants further discussion. In tropical climates, characterized by year-round cooling demands and minimal heating requirements, the shading benefits of PVSDs are likely to be more pronounced and sustained. The extended cooling season would amplify passive energy savings, potentially exceeding the rates observed in Wuhan. However, careful attention must be paid to avoiding excessive shading that could impede natural ventilation, a crucial strategy in many tropical contexts. For temperate climates, which typically experience more balanced heating and cooling loads, the optimization challenge becomes more complex. The seasonal shift in solar geometry and energy demand necessitates a dynamic balance; PVSDs must provide adequate summer shading without significantly blocking desirable solar heat gain in winter. This might favor adjustable PVSD systems or specific D/W ratios that offer a compromise across seasons. Conversely, in cold climates, where heating energy consumption dominates the annual energy profile, the strategic trade-offs become even more critical. The potential thermal penalty from winter shading—reducing beneficial solar heat gain—must be carefully weighed against the concurrent benefits of reduced lighting energy (if daylight is compromised) and the value of the electricity generated by the PV system. In such regions, the priority might shift towards maximizing PV power generation to offset high heating-related carbon emissions, even if it entails accepting a modest increase in heating demand due to shading, provided the net energy and carbon balance is positive. Therefore, while the fundamental synergistic mechanisms between morphology and PVSDs remain relevant, the optimal block typology and PVSD configuration—particularly the D/W ratio, tilt angle, and the choice between static versus dynamic systems—will be highly climate-specific. Future research should prioritize cross-climate comparative studies using the multi-scale framework established here, systematically quantifying these trade-offs to develop tailored design guidelines for tropical, temperate, and cold climates, thereby enhancing the global applicability of integrated energy–PV synergy strategies.

4.4. Limitations and Future Study

While this study establishes a comprehensive evaluation framework for block typology and PVSDs performance in Wuhan’s office blocks, certain limitations should be acknowledged to guide future research. First, the typological analysis, though representative, is based on 48 surveyed cases, which may not fully capture the morphological diversity of urban environments. Future studies could expand the sample size and incorporate more nuanced typological variations to strengthen generalizability. Second, the current work focuses on static horizontal PVSDs; investigating dynamic shading systems or alternative PVSD configurations could yield deeper insights into performance optimization under varying climatic conditions. Finally, integrating economic feasibility analysis—particularly addressing regional variations in installation costs and differential photovoltaic subsidy policies—along with occupant comfort metrics would further bridge the gap between technical potential and practical implementation. These extensions would build upon the present methodology while advancing toward holistic, climate-responsive urban energy solutions.

5. Conclusions

This study developed a multi-scale evaluation framework that systematically quantifies the synergistic relationship between urban block typology and PVSDs in China’s hot-summer–cold-winter climate. Through parametric analysis of 27 representative block types in Wuhan, we revealed several significant findings that advance sustainable urban design.
(1)
High-Rise Perimeter blocks demonstrate optimal energy efficiency with an EUI of 53.97 kWh/m2·y, achieving 5.4% lower energy use compared to Multi-Story Towers.
(2)
The 0.4 m PVSDs showed optimal performance with an average savings rate of 6.23% (vs 5.97% for 1.2 m and 5.44% for 0.8 m), peaking at 8.1% in High-rise Hybrid blocks—2.6 times higher than Multi-Story Slab blocks’ 3.83%.
(3)
High-Rise Hybrid blocks emerge as the superior choice for integrated performance, delivering exceptional PV generation potential (34.26% URRE), substantial energy savings (39.02% IESR), and significant carbon reduction (585 kg/m2).
(4)
The PVSDs with a width of 0.4 m and a D/W ratio of 1.5 represent the most effective configuration, providing 18.05% average integrated energy savings and achieving peak PV generation efficiency at 40.8% URRE, outperforming wider alternatives by 41%.
(5)
The High-rise Hybrid block achieved exceptional performance (597 kg/m2), yielding 2.5-times-greater carbon reduction than the least effective Multi-Story Slab block (239 kg/m2).
(6)
Future research should focus on validating these findings across diverse climate zones, particularly examining dynamic PVSDs adaptations for different regions, while incorporating economic and occupant comfort evaluations for practical implementation.
This study bridges a critical gap between block-scale planning and building-scale energy interventions by developing a multi-scale workflow that (1) introduces a multi-scale evaluation framework that systematically quantifies the synergistic relationship between block typology and PVSDs, (2) establishes evidence-based guidelines for PVSDs across diverse morphologies, and (3) provides insights for climate-responsive design in similar regions. By quantifying the synergistic effects of block typology and PVSDs, we provide architects and urban planners with actionable strategies to maximize energy–PV synergy through morphology-aware design. The framework advances climate-responsive urban practice while establishing a foundation for future research on multi-scale, low-carbon solutions.

Author Contributions

Conceptualization, S.X. and M.X.; methodology, S.X. and M.X.; software, J.H.; validation, J.H., Y.D. and C.Y.; formal analysis, C.Y. and Y.D.; investigation, J.H., J.L. and W.L.; resources, S.X. and H.H.; data curation, J.H.; writing—original draft preparation, S.X. and J.H.; writing—review and editing, M.X.; visualization, J.H. and C.Y.; supervision, S.X. and H.H.; project administration, S.X. and M.X.; funding acquisition, S.X. and M.X. All authors have read and agreed to the published version of the manuscript.

Funding

This research was funded by the Fundamental Research Funds for the Central Universities of South-Central Minzu University (Grant Number: CSQ24049); The Research Start-Up Funds of South-Central Minzu University (Grant Number: YZY24003); the Educational Research Fund of SCMU (No. JYX24004); the Artificial Intelligence Course Development Fund, SCMU (No. RGZNX24020); the National Natural Science Foundation (No. 52378020); the Program for HUST Academic Frontier Youth Team (No. 2019QYTD10); and the Urban Renewal and Transportation Joint Laboratory of Anhui Province (No. 2024CSGX-KF01).

Institutional Review Board Statement

Not applicable.

Informed Consent Statement

Not applicable.

Data Availability Statement

The data are available upon reasonable request.

Conflicts of Interest

The authors declare no conflicts of interest.

Abbreviations

The following abbreviations are used in this manuscript:
ANNArtificial Neural Network
BIPVBuilding-Integrated Photovoltaics
COPCCoefficient of Performance (Cooling)
COPHCoefficient of Performance (Heating)
EPWEnergyPlus Weather file
EUIEnergy Use Intensity
FARFloor Area Ratio
GHGGreen House Gas
IESIntegrated Energy Saving
IESRIntegrated Energy Saving Rate
MAPEMean Absolute Percentage Error
NEUINet Energy Use Intensity
PESRPassive Energy Saving Rate
PVSDsPhotovoltaic Shading Devices
RMSERoot Mean Squared Error
SHGCSolar Heat Gain Coefficient
URREUtilization Ratio of Renewable Energy

Appendix A

Table A1. Survey data on the top five PV product brands in the China PV market.
BrandsProduct NamePV MaterialPower
Density
(W/m2)
PV
Module
Efficiency
Degradation RateLifecycle
TrinasolarTSM-DE18M(II)Monocrystalline silicon211.6121%0.55%25
TSM-DE19Monocrystalline silicon214.3221%0.55%25
TSM-DE19RMonocrystalline silicon216.3922%0.55%25
TSM-DE20Monocrystalline silicon215.5422%0.55%25
TSM-DE21Monocrystalline silicon215.6922%0.55%25
TSM-DE09.08Monocrystalline silicon210.6821%0.55%25
TSM-DE09R.05Monocrystalline silicon212.7021%0.55%25
TSM-DE09R.08Monocrystalline silicon217.7122%0.55%25
TSM-DE09RMonocrystalline silicon217.7122%0.55%25
TSM-DEG9R.20Monocrystalline silicon217.7122%0.45%30
TSM-DEG9R.28Monocrystalline silicon217.7122%0.45%30
TSM-NEG9R.28Monocrystalline silicon222.7122%0.40%30
TSM-DE08MIIMonocrystalline silicon207.2521%0.55%25
TSM-DE17M(II)Monocrystalline silicon210.4221%0.55%25
SUNTECHSTPXXXS-D66WmhMonocrystalline silicon217.3022%0.55%25
STP410S_C54_UmhbMonocrystalline silicon209.9621%0.55%25
STP415S_C54_UmhmMonocrystalline silicon212.5221%0.55%25
STP560S_C72_VmhMonocrystalline silicon216.7822%0.55%25
STP430S_C54_NshbMonocrystalline silicon220.2022%0.40%25
STP440S_C54_NshmMonocrystalline silicon225.3223%0.40%25
STP425S_C54_Nshtb+Monocrystalline silicon217.6422%0.40%25
STP440S_C54_Nshkm+Monocrystalline silicon225.3223%0.40%25
CSITOPHiKu6-TOPCon_CS6R-TMonocrystalline silicon222.7622%0.40%30
TOPHiKu6-TOPCon_CS6W-TMonocrystalline silicon224.5223%0.40%30
CS-Datasheet-HiKu6_CS6R-MSMonocrystalline silicon215.0822%0.55%25
CS-Datasheet-HiKu6_CS6W-MSMonocrystalline silicon214.8522%0.55%25
HiKu7_CS7L-MSMonocrystalline silicon217.3122%0.55%25
HiKu7_CS7L-MS-RMonocrystalline silicon215.5422%0.55%25
HiKu7_CS7N-MSMonocrystalline silicon217.3022%0.55%25
JinKoJKM410-430N-54HL4-(V)-F4Monocrystalline silicon220.2022%0.40%30
JKM420-440N-54HL4R-B-F1.3Monocrystalline silicon220.2122%0.40%30
JKM425-445N-54HL4R-(V)-F1.3Monocrystalline silicon222.7122%0.40%30
JKM460-480N-60HL4-(V)-F4Monocrystalline silicon222.4322%0.40%30
JKM565-585N-72HL4-(V)-F6Monocrystalline silicon226.4623%0.40%30
JKM395-415M-54HL4-(V)Monocrystalline silicon212.5221%0.55%25
JKM450-470M-60HL4-(V)-F1.1Monocrystalline silicon217.7922%0.55%25
JKM540-560M-72HL4-(V)-F5Monocrystalline silicon216.7822%0.55%25
JKM355-375N-6TL3-B-F2,1Monocrystalline silicon215.3922%0.40%30
JKM360-380N-6TL3-(V)-F2.1Monocrystalline silicon218.2622%0.40%30
JKM460-480M-7RL3-(V)-F1Monocrystalline silicon213.7821%0.55%25
YINGLIYLM-J 3.0 PRO
390-415
Monocrystalline silicon212.5221%0.55%25
YLM-J 3.0 PRO
530-555
Monocrystalline silicon214.8521%0.55%25
YLM-J 3.0 PRO
580-605
Monocrystalline silicon213.7721%0.55%25
YLM-J 3.0 PRO
645-670
Monocrystalline silicon215.6922%0.55%25
PANDA 3.0PRO
405-430
Monocrystalline silicon220.2022%0.40%25
PANDA 3.0PRO
550-575
Monocrystalline silicon222.5922%0.40%25
PANDA 3.0PRO
600-625
Monocrystalline silicon223.5922%0.40%25
Value__Monocrystalline silicon217.2422%0.48%25

Appendix B

Table A2. Morphological parameters of the studied blocks.
TypologiesCase NameAverage Block Dimensions (m)FARBuilding DensityBuilding StoriesThree-Dimensional Morphological Model
Multi-Story Slab blocks Dongfeng Logistics Group Co., Ltd. (Wuhan, China)1591.4837%4FSustainability 17 09665 i047
Wuhan Zhudian Denshi Co., Ltd. (Wuhan, China)822.2437%6FSustainability 17 09665 i048
Tuochuang Technology Industrial Park (Wuhan, China)1752.2345%5FSustainability 17 09665 i049
Wuhan Kingfa Science and Technology Co., Ltd. (Wuhan, China)1711.3727%5FSustainability 17 09665 i050
Wuhan Tianyu Data Security Industrial Park (Wuhan, China)921.5034%5FSustainability 17 09665 i051
Optics Valley Headquarters International (Wuhan, China)1162.9529%5FSustainability 17 09665 i052
Century Eagle Industrial Park (Wuhan, China)1251.8838%5FSustainability 17 09665 i053
Wuhan Optics Valley Electronic Industrial Park (Wuhan, China)1861.5033%4FSustainability 17 09665 i054
Multi-Story Tower blocksFuqiao Industrial Park (Wuhan, China)1881.8831%6FSustainability 17 09665 i055
Wuhan Software New Town Phase 4.1 (Wuhan, China)2162.0434%6FSustainability 17 09665 i056
Optics Valley Wisdom Park (Wuhan, China)2531.0725%4FSustainability 17 09665 i057
Ouliting Headache Medical Research Institute (Wuhan, China)731.4830%5FSustainability 17 09665 i058
MAX Technology Park (Wuhan, China)741.3835%4FSustainability 17 09665 i059
Multi-Story Courtyard blocksChuang Lifang Industrial Park (Wuhan, China)1351.8230%6FSustainability 17 09665 i060
Panlong City Zall Headquarters (Wuhan, China)1071.5130%5FSustainability 17 09665 i061
Wuhan Banglun Pharmaceutical Technology Industrial Park (Wuhan, China)1151.2130%4FSustainability 17 09665 i062
Optics Valley Biolake (Wuhan, China)1131.6633%5FSustainability 17 09665 i063
International Enterprise Center (Wuhan, China)1901.7335%5FSustainability 17 09665 i064
Optics Valley Headquarters Space (Wuhan, China)901.6633%5FSustainability 17 09665 i065
Huifeng Enterprise World (Wuhan, China)1502.5036%5FSustainability 17 09665 i066
Huifeng Enterprise Headquarters 01 (Wuhan, China)1671.9332%6FSustainability 17 09665 i067
Huifeng Enterprise Headquarters 02 (Wuhan, China)1911.8431%6FSustainability 17 09665 i068
International Enterprise Center Phase 3 (Wuhan, China)1772.0735%6FSustainability 17 09665 i069
China Information and Communication Technology Group (Wuhan, China)2431.5130%5FSustainability 17 09665 i070
Multi-Story Perimeter blocksSquare Instrument Co., Ltd. (Wuhan, China)821.7234%5FSustainability 17 09665 i071
Xianning Offshore Science and Innovation Park (Wuhan, China)1851.3932%4FSustainability 17 09665 i072
Zhongyuan Digital Intelligence Park (Wuhan, China)1271.5726%6FSustainability 17 09665 i073
Saiying Technology Park (Wuhan, China)1471.6427%6FSustainability 17 09665 i074
Hubei International Economic and Technical Cooperation Co., Ltd. (Wuhan, China)2421.3623%6FSustainability 17 09665 i075
Optics Valley Financial Port Area a South Zone (Wuhan, China)2580.9117%5FSustainability 17 09665 i076
Geospatial Information Technology Co., Ltd. (Wuhan, China)1101.7930%6FSustainability 17 09665 i077
Wuhan Minde Bio-Technology Co., Ltd. R&D Center (Wuhan, China)1301.8838%5FSustainability 17 09665 i078
High-Rise Hybrid blocksChina National Pharmaceutical Group Building (Wuhan, China)1482.4228%2F, 16FSustainability 17 09665 i079
Hubei Jiuyang Infrared System Co., Ltd. (Wuhan, China)1403.7943%4F, 10FSustainability 17 09665 i080
Wuhan Future Sci-Tech City Area F (Wuhan, China)1453.0543%3F, 20FSustainability 17 09665 i081
Wuhan Future Sci-Tech City Area B (Wuhan, China)1332.0028%3F, 10FSustainability 17 09665 i082
Chuangxinghui Industrial Park (Wuhan, China)1733.9429%4F, 15F, 22FSustainability 17 09665 i083
Modern Optics Valley Dream Factory (Wuhan, China)1673.3528%2F, 8F, 18FSustainability 17 09665 i084
Pusheng New Energy Technology Co., Ltd. (Wuhan, China)1272.3739%2F, 6F, 12FSustainability 17 09665 i085
Wuhan New High Thinking Technology Co., Ltd. (Wuhan, China)1502.3224%2F, 16FSustainability 17 09665 i086
High-Rise Perimeter blocksWanke Ecological Technology & Landscape Design R&D Center (Wuhan, China)1272.4831%6F, 13FSustainability 17 09665 i087
China University of Geosciences Science Park (Wuhan, China)1271.6621%8FSustainability 17 09665 i088
Chuangxinghui Technology Park (Wuhan, China)1272.3626%8FSustainability 17 09665 i089
Wuhan Guide Infrared Co., Ltd. (Wuhan, China)2002.1230%6F, 24FSustainability 17 09665 i090
Wuhan Software New Town Phase 3 (Wuhan, China)1292.4620%4F, 11FSustainability 17 09665 i091
Yijiankang Technology Park (Wuhan, China)1172.1127%4F, 20FSustainability 17 09665 i092
Kelu Biotechnology (Wuhan, China)1442.7928%7F, 18FSustainability 17 09665 i093
Wuhan Optics Valley Enterprise World (Wuhan, China)1363.8532% Sustainability 17 09665 i094

Appendix C

Table A3. The energy-saving benefits derived from PV Shading.
TypeCode
Multi-Story Slab blocksSustainability 17 09665 i095
Sustainability 17 09665 i096
Sustainability 17 09665 i097
Sustainability 17 09665 i098
Sustainability 17 09665 i099
Multi-Story Tower blocksSustainability 17 09665 i100
Sustainability 17 09665 i101
Sustainability 17 09665 i102
Sustainability 17 09665 i103
Multi-Story Courtyard blocksSustainability 17 09665 i104
Sustainability 17 09665 i105
Sustainability 17 09665 i106
Sustainability 17 09665 i107
Multi-Story Perimeter blocksSustainability 17 09665 i108
Sustainability 17 09665 i109
Sustainability 17 09665 i110
Sustainability 17 09665 i111
Sustainability 17 09665 i112
Sustainability 17 09665 i113
High-Rise Hybrid blocksSustainability 17 09665 i114
Sustainability 17 09665 i115
Sustainability 17 09665 i116
High-Rise Perimeter blocksSustainability 17 09665 i117
Sustainability 17 09665 i118
Sustainability 17 09665 i119
Sustainability 17 09665 i120
Sustainability 17 09665 i121

References

  1. IEA. Energy Efficiency 2024. 2024. Available online: https://www.iea.org/reports/energy-efficiency-2024 (accessed on 25 May 2024).
  2. Wang, P.; Liu, Z.; Zhang, L. Sustainability of compact cities: A review of inter-building effect on building energy and solar energy use. Sustain. Cities Soc. 2021, 72, 103035. [Google Scholar] [CrossRef]
  3. Quan, S.J.; Li, C. Urban form and building energy use: A systematic review of measures, mechanisms, and methodologies. Renew. Sustain. Energy Rev. 2021, 139, 110662. [Google Scholar] [CrossRef]
  4. Xie, M.; Wang, M.; Zhong, H.; Li, X.; Li, B.; Mendis, T.; Xu, S. The impact of urban morphology on the building energy consumption and solar energy generation potential of university dormitory blocks. Sustain. Cities Soc. 2023, 96, 104644. [Google Scholar] [CrossRef]
  5. Ratti, C.; Baker, N.; Steemers, K. Energy consumption and urban texture. Energy Build. 2005, 37, 762–776. [Google Scholar] [CrossRef]
  6. Xu, S.; Sang, M.; Xie, M.; Xiong, F.; Mendis, T.; Xiang, X. Influence of urban morphological factors on building energy consumption combined with photovoltaic potential: A case study of residential blocks in central China. Build. Simul. 2023, 16, 1777–1792. [Google Scholar] [CrossRef]
  7. Wang, W.; Lin, Q.; Chen, J.; Li, X.; Sun, Y.; Xu, X. Urban building energy prediction at neighborhood scale. Energy Build. 2021, 251, 111307. [Google Scholar] [CrossRef]
  8. Ahmadian, E.; Sodagar, B.; Bingham, C.; Elnokaly, A.; Mills, G. Effect of urban built form and density on building energy performance in temperate climates. Energy Build. 2021, 236, 110762. [Google Scholar] [CrossRef]
  9. Natanian, J.; Aleksandrowicz, O.; Auer, T. A parametric approach to optimizing urban form, energy balance and environmental quality: The case of Mediterranean districts. Appl. Energy 2019, 254, 113637. [Google Scholar] [CrossRef]
  10. Pan, Y.; Pan, Y.; Yang, Y.; Liu, H. A Parametric Study on the Community Form and Its Influences on Energy Consumption of Office Buildings in Shanghai. Procedia Eng. 2017, 205, 548–555. [Google Scholar] [CrossRef]
  11. Lima, I.; Scalco, V.; Lamberts, R. Estimating the impact of urban densification on high-rise office building cooling loads in a hot and humid climate. Energy Build. 2019, 182, 30–44. [Google Scholar] [CrossRef]
  12. Tian, J.; Xu, S. A morphology-based evaluation on block-scale solar potential for residential area in central China. Sol. Energy 2021, 221, 332–347. [Google Scholar] [CrossRef]
  13. Liu, K.; Xu, X.; Zhang, R.; Kong, L.; Wang, W.; Deng, W. Impact of urban form on building energy consumption and solar energy potential: A case study of residential blocks in Jianhu, China. Energy Build. 2023, 280, 112727. [Google Scholar] [CrossRef]
  14. Xu, S.; Jiang, H.; Xiong, F.; Zhang, C.; Xie, M.; Li, Z. Evaluation for block-scale solar energy potential of industrial block and optimization of application strategies: A case study of Wuhan, China. Sustain. Cities Soc. 2021, 72, 103000. [Google Scholar] [CrossRef]
  15. Huang, Z.; Mendis, T.; Xu, S. Urban solar utilization potential mapping via deep learning technology: A case study of Wuhan, China. Appl. Energy 2019, 250, 283–291. [Google Scholar] [CrossRef]
  16. Lan, H.; Gou, Z.; Hou, C. Understanding the relationship between urban morphology and solar potential in mixed-use neighborhoods using machine learning algorithms. Sustain. Cities Soc. 2022, 87, 104225. [Google Scholar] [CrossRef]
  17. Zhang, J.; Xu, L.; Shabunko, V.; Tay, S.E.R.; Sun, H.; Lau, S.S.Y.; Reindl, T. Impact of urban block typology on building solar potential and energy use efficiency in tropical high-density city. Appl. Energy 2019, 240, 513–533. [Google Scholar] [CrossRef]
  18. Balaras, C.A.; Droutsa, K.; Argiriou, A.A.; Asimakopoulos, D.N. Potential for energy conservation in apartment buildings. Energy Build. 2000, 31, 143–154. [Google Scholar] [CrossRef]
  19. Zhang, W.; Lu, L.; Peng, J. Evaluation of potential benefits of solar photovoltaic shadings in Hong Kong. Energy 2017, 137, 1152–1158. [Google Scholar] [CrossRef]
  20. Skandalos, N.; Karamanis, D. An optimization approach to photovoltaic building integration towards low energy buildings in different climate zones. Appl. Energy 2021, 295, 117017. [Google Scholar] [CrossRef]
  21. Hwang, T.; Kang, S.; Kim, J.T. Optimization of the building integrated photovoltaic system in office buildings—Focus on the orientation, inclined angle and installed area. Energy Build. 2012, 46, 92–104. [Google Scholar] [CrossRef]
  22. Mandalaki, M.; Zervas, K.; Tsoutsos, T.; Vazakas, A. Assessment of fixed shading devices with integrated PV for efficient energy use. Sol. Energy 2012, 86, 2561–2575. [Google Scholar] [CrossRef]
  23. Custódio, I.; Quevedo, T.; Melo, A.P.; Rüther, R. A holistic approach for assessing architectural integration quality of solar photovoltaic rooftops and shading devices. Sol. Energy 2022, 237, 432–446. [Google Scholar] [CrossRef]
  24. Ito, R.; Lee, S. Performance enhancement of photovoltaic integrated shading devices with flexible solar panel using multi-objective optimization. Appl. Energy 2024, 373, 123866. [Google Scholar] [CrossRef]
  25. Sadatifar, S.; Johlin, E. Multi-Objective Optimization of Building Integrated Photovoltaic Solar Shades. Sol. Energy 2022, 242, 191–200. [Google Scholar] [CrossRef]
  26. Corti, P.; Bonomo, P.; Frontini, F.J.E. Paper Review of External Integrated Systems as Photovoltaic Shading Devices. Energies 2023, 16, 5542. [Google Scholar] [CrossRef]
  27. Liu, J.; Bi, G.; Gao, G.; Zhao, L. Optimal design method for photovoltaic shading devices (PVSDs) by combining geometric optimization and adaptive control model. J. Build. Eng. 2023, 69, 106101. [Google Scholar] [CrossRef]
  28. Li, X.; Peng, J.; Li, N.; Wang, M.; Wang, C. Study on Optimum Tilt Angles of Photovoltaic Shading Systems in Different Climatic Regions of China. Procedia Eng. 2017, 205, 1157–1164. [Google Scholar] [CrossRef]
  29. Akhter, M.; Al Mansur, A.; Islam, M.I.; Lipu, M.S.H.; Karim, T.F.; Abdolrasol, M.G.M.; Alghamdi, T.A.H. Sustainable Strategies for Crystalline Solar Cell Recycling: A Review on Recycling Techniques, Companies, and Environmental Impact Analysis. Sustainability 2024, 16, 5785. [Google Scholar] [CrossRef]
  30. Patil, G.B. An Evaluation of Solar Photovoltaic System Depreciation Using PVSOL. SSRN Electron. J. 2024, 3, 15–20. [Google Scholar] [CrossRef]
  31. Samarasinghalage, T.I.; Wijeratne, W.M.P.U.; Yang, R.; Wakefield, R. Optimisation of a Building Integrated Photovoltaic Façade for Conceptual Design Support. In Proceedings of the Australasian Building Simulation 2022 Conference, Brisbane, Australia, 20–21 July 2022. [Google Scholar]
  32. Liao, W.; Heo, Y.; Xu, S. Simplified vector-based model tailored for urban-scale prediction of solar irradiance. Sol. Energy 2019, 183, 566–586. [Google Scholar] [CrossRef]
  33. Compagnon, R. Solar and daylight availability in the urban fabric. Energy Build. 2004, 36, 321–328. [Google Scholar] [CrossRef]
  34. Romero, L.; Duminil, E.; Sánchez, J.; Eicker, U. Assessment of the photovoltaic potential at urban level based on 3D city models: A case study and new methodological approach. Sol. Energy 2017, 146, 264–275. [Google Scholar] [CrossRef]
  35. CPIA. China Photovoltaic Industry Annual Report 2022–2023. 2023. Available online: https://www.chinapv.org.cn/Industry/resource_1285.html (accessed on 8 December 2024).
  36. Zhao, R.; Dong, L.; Bai, L.; Zhang, Y.; Li, X.; Qiao, Q.; Xie, M.; Wang, W. Life cycle carbon emission inventory analysis of photovoltaic industry. China Environ. Sci. 2020, 40, 2751–2757. (In Chinese) [Google Scholar]
  37. Liu, B.; Huo, X. Prediction of Photovoltaic power generation and analyzing of carbon emission reduction capacity in China. Renew. Energy 2024, 222, 119967. [Google Scholar] [CrossRef]
  38. China Electricity Council. Annual Development Report of China’s Power Industry 2022. Available online: http://nyj.jining.gov.cn/art/2022/7/11/art_4091_2705398.html (accessed on 17 May 2024).
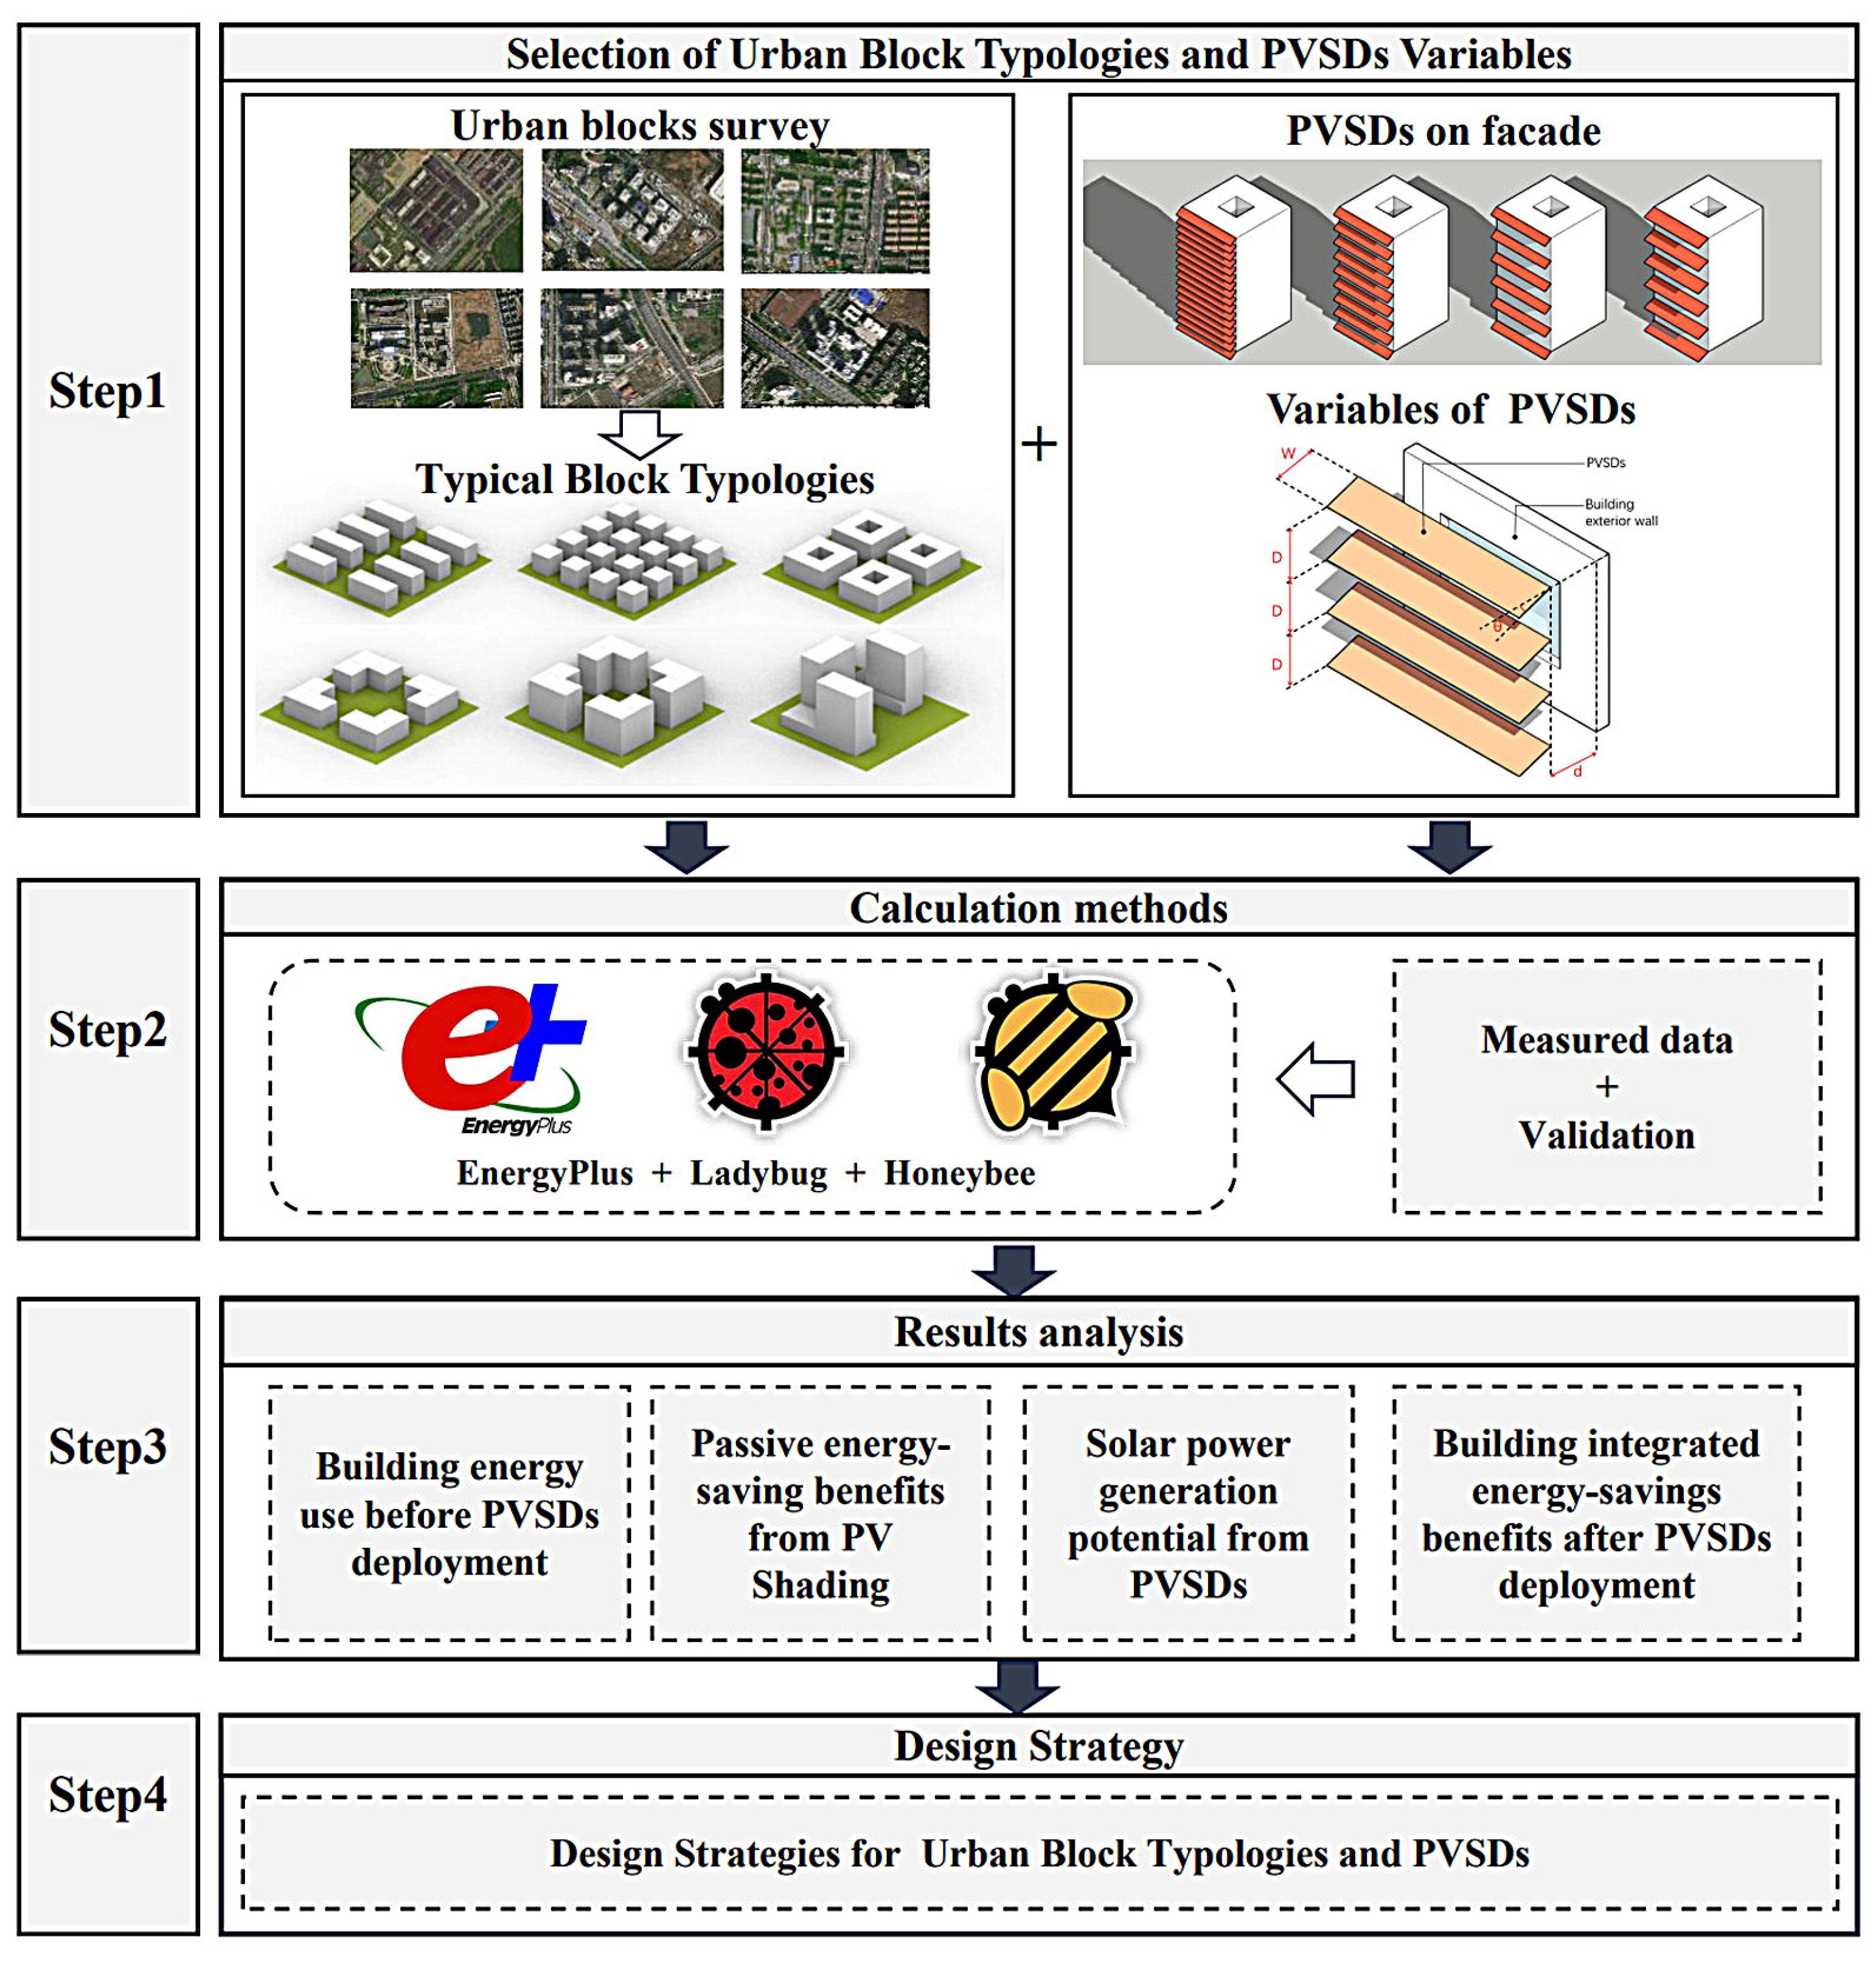
Figure 1. Four-step workflow.
Sustainability 17 09665 g001
Figure 2. PVSD simulation results by orientation.
Sustainability 17 09665 g002
Figure 3. Validation case of simulation models in Wuhan.
Sustainability 17 09665 g003
Figure 4. Comparison of simulated and measured energy use.
Sustainability 17 09665 g004
Figure 5. Total EUI of twenty-seven urban block cases.
Sustainability 17 09665 g005
Figure 6. The impact of block typology on energy-saving benefits from PV shading.
Sustainability 17 09665 g006
Figure 7. (a) The impact of 0.4 m PVSDs on PV power generation potential; (b) the impact of 0.8 m PVSDs on PV power generation potential; (c) the impact of 1.2 m PVSDs on PV power generation potential.
Sustainability 17 09665 g007
Figure 8. The impact of block typology on PV power generation potential.
Sustainability 17 09665 g008
Figure 9. (a)The impact of 0.4 m PVSDs on IESR; (b) the impact of 0.8 m PVSDs on IESR; (c) the impact of 1.2 m PVSDs on IESR.
Sustainability 17 09665 g009
Figure 10. The impact of block typology on IESR.
Sustainability 17 09665 g010
Figure 11. The impact of block typology on carbon reduction benefits.
Sustainability 17 09665 g011
Table 1. Standardized parameters of blocks.
TypologiesFloor-to-Floor HeightPlot SizeSite CoverageNo. of FloorsFAR
Multi-story typologies4 m150 × 150 m30%51.5
High-rise typologies4 m150 × 150 m30%103.0
Table 2. Six categories of 27 typologies of office blocks in Wuhan.
TypeCode
Multi-Story Slab blocksDH01DH02DH03
Sustainability 17 09665 i001Sustainability 17 09665 i002Sustainability 17 09665 i003
DH04DH05
Sustainability 17 09665 i004Sustainability 17 09665 i005
Multi-Story Tower blocksDD-01DD-02DD-03
Sustainability 17 09665 i006Sustainability 17 09665 i007Sustainability 17 09665 i008
DD-04
Sustainability 17 09665 i009
Multi-Story Courtyard blocksDW-01DW-02DW-03
Sustainability 17 09665 i010Sustainability 17 09665 i011Sustainability 17 09665 i012
DW-04
Sustainability 17 09665 i013
Multi-Story Perimeter blocksDT-01DT-02DT-03
Sustainability 17 09665 i014Sustainability 17 09665 i015Sustainability 17 09665 i016
DT-04DT-05DT-06
Sustainability 17 09665 i017Sustainability 17 09665 i018Sustainability 17 09665 i019
High-Rise hybrid blocksGW-01GW-02GW-03
Sustainability 17 09665 i020Sustainability 17 09665 i021Sustainability 17 09665 i022
High-Rise Perimeter blocksGT-01GT-02GT-03
Sustainability 17 09665 i023Sustainability 17 09665 i024Sustainability 17 09665 i025
GT-05GT-05
Sustainability 17 09665 i026Sustainability 17 09665 i027
Table 3. Classification of PVSD configurations (adapted from [26]).
PV Louver, VerticalPV Louver, HorizontalPV Window Blind, External
Sustainability 17 09665 i028Sustainability 17 09665 i029Sustainability 17 09665 i030
PV Window Blind, embeddedPV Panel, singlePV Panel, multiple
Sustainability 17 09665 i031Sustainability 17 09665 i032Sustainability 17 09665 i033
PV Fins, singlePV Fins, multiplePV Eggcrate
Sustainability 17 09665 i034Sustainability 17 09665 i035Sustainability 17 09665 i036
Other PV SystemPV Panel + LouverPV Eggcrate + Louver
Sustainability 17 09665 i037Sustainability 17 09665 i038Sustainability 17 09665 i039
Table 4. Setting of PVSD variables.
PVSDs DiagramVariablesUnitsValue RangeStep SizeValues Setting
Sustainability 17 09665 i040Widthmm400~1200400400, 800, 1200
Distance/Width ratio/0.5~3.00.50.5, 1.0, 1.5, 2.0, 2.5, 3.0
Tilt Angle of PVSDs (θ)°fixed value__30° for the south facade, 35° for the east facade, and 45° for the west facade
Distance from the wall (D)mmfixed value__800 mm
Table 5. Envelope settings for building model.
ParametersValues
Floor Height4 m
Window-to-Wall Ratio0.5
Windowsill Height0.9 m
Window Height2.1 m
Roof Thermal ParametersK = 0.5 W/(m2·K)
Exterior Wall Thermal ParametersK = 0.8 W/(m2·K)
Exterior Window Thermal ParametersK = 2.2 W/(m2·K); SHGC = 0.4
Table 6. Parameter settings of air conditioning.
ParametersValuesUnits
Heating set point20°C
Cooling set point26°C
COPC3.5_
COPH2.6_
Human thermal load 134W/person
Occupancy10m2/person
Lighting loads8W/m2
Equipment loads15W/m2
Fresh air volume per capita30m3/(h·person)
Table 7. The energy-saving benefits from PV Shading (for the complete dataset, see Appendix C).
TypeCode
Multi-Story Slab blocksSustainability 17 09665 i041
Multi-Story Tower blocksSustainability 17 09665 i042
Multi-Story Courtyard blocksSustainability 17 09665 i043
Multi-Story Perimeter blocksSustainability 17 09665 i044
High-Rise hybrid blocksSustainability 17 09665 i045
High-Rise Perimeter blocksSustainability 17 09665 i046
Disclaimer/Publisher’s Note: The statements, opinions and data contained in all publications are solely those of the individual author(s) and contributor(s) and not of MDPI and/or the editor(s). MDPI and/or the editor(s) disclaim responsibility for any injury to people or property resulting from any ideas, methods, instructions or products referred to in the content.