1. Introduction
As global environmental issues grow increasingly severe, water pollution control has become a critical topic for countries striving to achieve sustainable development. As a nation undergoing rapid industrialization with uneven water resource distribution, China faces particularly prominent impacts of industrial pollution on its water bodies, including rivers and lakes [
1,
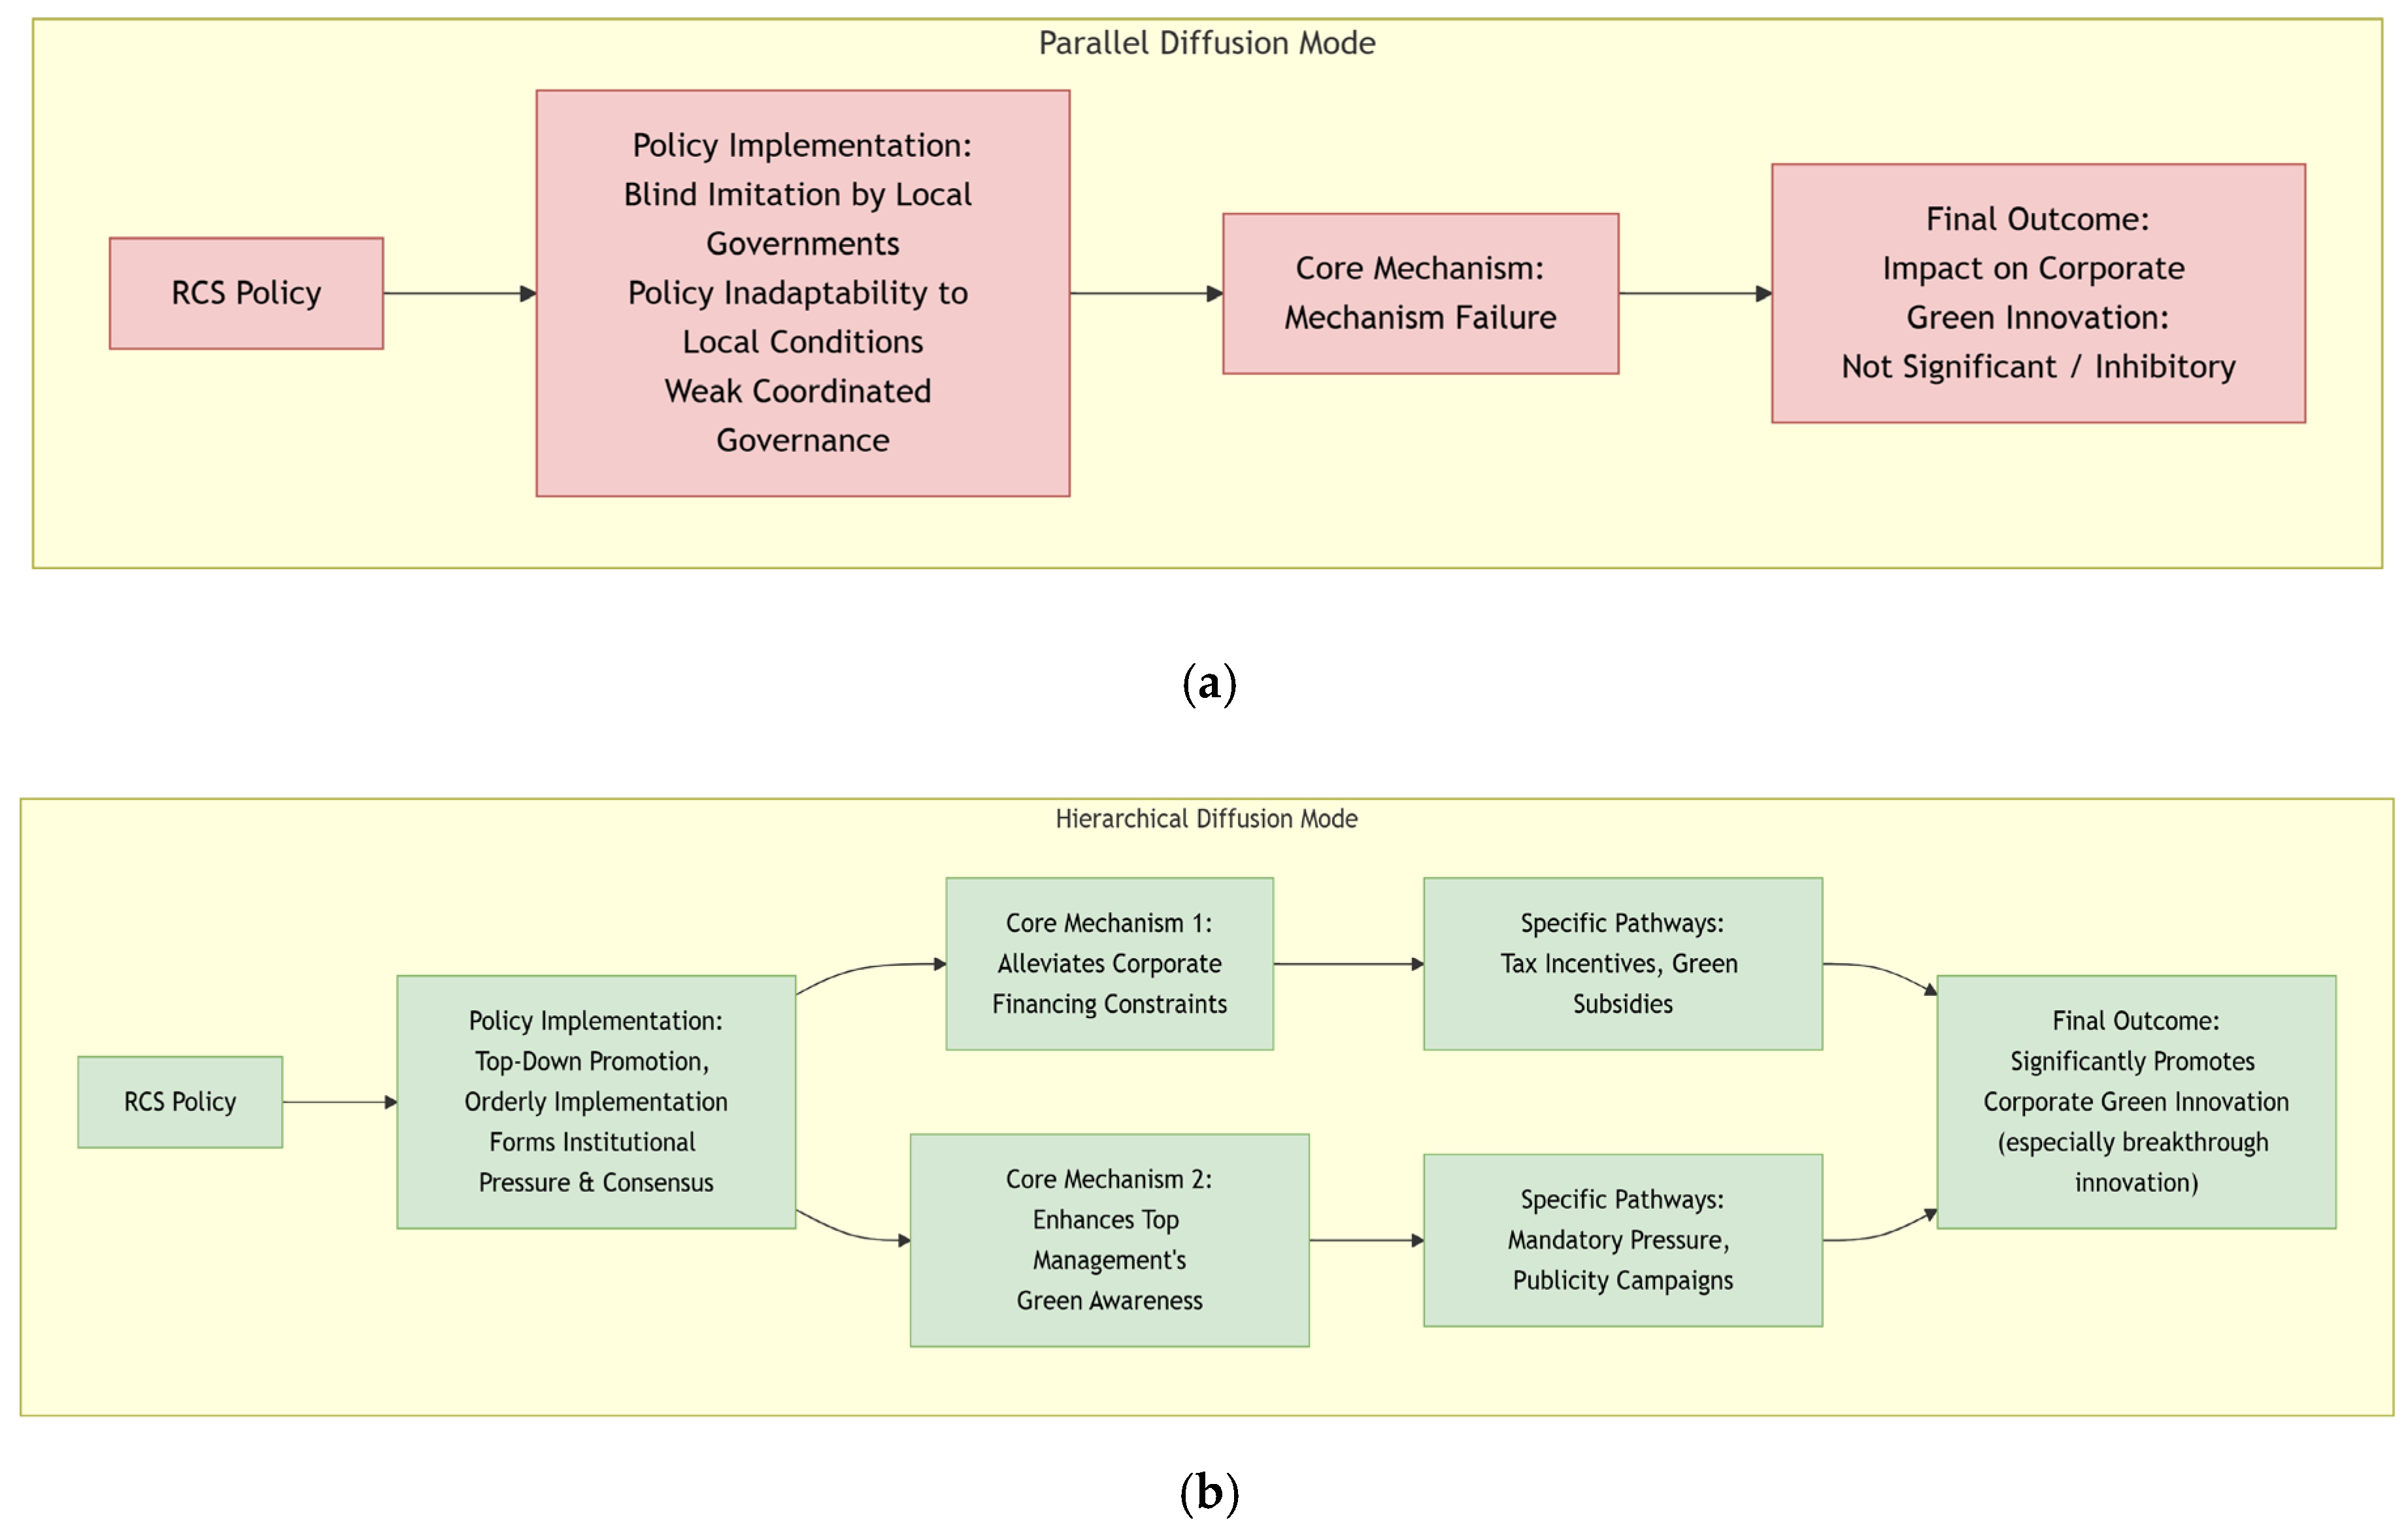
2]. To address this challenge, China innovatively established the River Chief System (RCS), a policy centered on the “river chiefs” mechanism designed to strengthen water pollution control and water resource protection. By clarifying the primary responsibility of local Party and government leaders in river and lake governance, this policy has built a hierarchical supervision system from the central government to local governments, covering major water areas across the country, which has effectively resolved many challenges in river ecosystem management and water resource utilization. The diffusion of the RCS has occurred through two primary modes, which shape its effectiveness: parallel diffusion, driven by inter-local government coordination and competition, and hierarchical diffusion, mandated through top-down administrative orders to ensure implementation consistency and enforceability [
3]. These mechanisms collectively encourage enterprises to engage in green innovation and drive the sustainable development of the green economy [
4].
The existing literature on RCS has primarily focused on its pollution control effects. While some studies report significant reductions in pollutant discharge at both regional and enterprise levels [
5,
6], others point to its limited impact on key pollutants [
7,
8], indicating mixed evidence and context-dependent outcomes. This predominant focus on macro-level impacts, however, has largely overlooked the incentive effects on enterprises’ micro-level innovation behaviors. Regarding policy diffusion, a body of research has theoretically elaborated on the mechanisms of parallel and hierarchical diffusion [
9]. However, systematic empirical evidence remains relatively limited concerning how these diffusion modes lead to divergent RCS policy effects, particularly in the domain of corporate green innovation, and current research still focuses primarily on theoretical construction with insufficient empirical support to identify differences in implementation efficiency across modes. Green innovation is widely recognized as a key pathway for aligning economic development with environmental sustainability [
10]. A small but growing number of studies have begun to explore the RCS–green innovation nexus. For instance, Wang identified executive compensation and media attention as relevant channels [
11]; Ding and Sun argued that government governance, official incentives, and social supervision can contribute to the enhancement of the RCS effect on green innovation [
12]. Nevertheless, few studies have systematically examined how different diffusion modes influence varied types of green innovation—such as breakthrough versus incremental innovation—or compared the underlying mechanisms, such as financing constraints and managerial cognition, across these modes, reflecting a general lack of differentiation between green innovation types. These shortcomings collectively limit a comprehensive understanding of the RCS policy effects. This study therefore seeks to build upon and extend the existing findings by offering a comparative and mechanism-based analysis in this under-explored area.
Therefore, against the policy backdrop of the RCS, this study utilizes panel data from A-share listed companies in Shanghai and Shenzhen from 2005 to 2022 as the research sample. Using a multi-period difference-in-differences (DID) method, this study moves beyond estimating the average policy effect to compare and analyze the differences in effects and internal operational mechanisms of the RCS policy on corporate green innovation (including breakthrough and incremental types) under the parallel diffusion mode and hierarchical diffusion mode. The aim is to enhance understanding of policy innovation diffusion and to inform improvements in the environmental policy system, contributing to a more sustainable future.
Compared with previous studies, the contributions of this paper are mainly reflected in the following aspects: At the theoretical level, it introduces a policy diffusion perspective to examine how RCS differently influences corporate green innovation under distinct implementation modes, thereby enriching the theoretical scope of environmental regulation research. While previous studies have mostly focused on the overall effects of environmental policies, few have systematically distinguished the heterogeneity of policy implementation mechanisms. Using a DID approach, this paper demonstrates that the hierarchical diffusion mode, with its enforceability and unified standards, significantly enhances green technology innovation in high-pollution firms. In contrast, the parallel diffusion mode shows limited effects due to fragmented regional implementation. This finding not only extends the application of intergovernmental relations theory in the context of environmental policy but also deepens the understanding of externality theory by revealing how policy implementation channels shape corporate innovation behavior. At the practical level, the research provides actionable insights for improving RCS implementation and fostering corporate green innovation. Given the stronger effect of hierarchical diffusion, we recommend enhancing cross-regional coordination and establishing unified supervision standards—such as introducing national technical guidelines and monitoring mechanisms. It is also suggested that high-pollution firms increase investment in green process R&D to better respond to policy requirements, while local governments should design supporting incentives, including green technology subsidies and tax benefits, to jointly promote environmental governance and high-quality development. These implications may also serve as a useful reference for other developing countries seeking to balance water pollution control with innovation incentives.
3. Research Design
3.1. Model Design
Given that the River Chief System (RCS) policy was implemented in phases between 2007 and 2017, the traditional difference-in-differences (DID) model fails to capture its dynamic effects. This study adopts the multi-period DID model [
36] to test H1a, H1b and H1c (Hypothesis 1), with Model (1) specified as follows:
In this model, it represents the level of green innovation of enterprise i in year t, including total green innovation (it), breakthrough green innovation (it), and incremental green innovation (it), it is a policy dummy variable, Postit is a time dummy variable, and it denotes control variables, , and control for firm, city, and year fixed effects, respectively, while is the random error term. By comparing the differences between the treatment group and the control group before and after the policy implementation, this model identifies the causal effect of the RCS.
To test the mechanism through which the RCS affects green innovation via financing constraints and top management’s green awareness, this study employs the two-step mediating effect test [
37], with Model (2) specified as follows:
Here, it refers to mediating variables, including financing constraints (FCit, SAit) and top management’s green awareness (GreConit).
3.2. Variable Definitions
3.2.1. Explained Variables
Corporate green innovation is measured by the number of green patents. Referring to the method of Zhang, this measurement is based on the green patent classification of the State Intellectual Property Office (SIPO) [
38]. The explained variables include three categories:
- (1)
Total Green Innovation (GrePat): The total number of independent green patent applications filed by an enterprise in a given year, reflecting the overall level of green innovation.
- (2)
Breakthrough Green Innovation (GreInPat): The number of green invention patents, representing high-tech, market-oriented innovation activities.
- (3)
Incremental Green Innovation (GreUtPat): The number of green utility model patents, reflecting low-tech compliance-oriented improvements.
For enhanced robustness, this study additionally introduces the average citation count of green patents as an indicator of patent quality to capture the depth of impact of green innovation. Data are sourced from the SIPO and the CSMAR Database to ensure accuracy and consistency.
3.2.2. Explanatory Variables
Compared with other industries, high-pollution industries are more substantially affected by the RCS and are thus more likely to engage in green innovation. Meanwhile, in accordance with the Action Plan for Water Pollution Prevention and Control and the Measures for the Management of the List of Key Polluting Units, these enterprises are classified as key regulated targets due to their high water consumption and high emissions [
39]. Therefore, with reference to the Catalogue for the Classification and Management of Environmental Protection Inspection of Listed Companies, the industry classification of the China Securities Regulatory Commission (CSRC), and local RCS policy documents, this study covers 16 industries including thermal power, electrolytic aluminum, iron and steel, and coal, etc. [
8]. Enterprises in these 16 industries are designated as the treatment group (Treat = 1), while enterprises in other industries form the control group (Treat = 0).
A time dummy variable POST is also set: Post = 1 indicates the year when the RCS was implemented in the prefecture-level city where the enterprise is located and all subsequent years; otherwise, Post = 0. For municipalities directly under the central government, 2014 is used as the cutoff point, as it marks the year when the Ministry of Water Resources initiated the nationwide promotion of the RCS. The explanatory variable design accounts for spatiotemporal heterogeneity in policy implementation, thereby strengthening the credibility of causal inference.
3.2.3. Mediating Variables
Financing Constraints: The KZ Index comprehensively assesses the degree of financing constraints based on financial indicators [
40]; the SA Index reduces endogeneity by using firm size and age [
41].
Top Management’s Green Awareness: Measured by the word frequency (GreCon) of 8 water pollution governance-related terms (such as “River Chief System”, “basin protection”, and “ecological restoration”) in corporate annual reports and social responsibility reports [
42].
3.2.4. Control Variables
To control for the potential impact of firm characteristics on green innovation, the following control variables are selected [
43]: ① Firm Size (Size): Natural logarithm of total assets, reflecting the resource endowment of the enterprise. ② Firm Age (Age): Take the logarithm of (current year–establishment year), measuring the maturity of the enterprise. ③ Asset-Liability Ratio (Lev): Total liabilities divided by total assets, reflecting financial risks. ④ Gross Profit Margin (GProfit): (Operating income–Operating costs) divided by operating income, measuring profitability. ⑤ Financial Leverage (FL): (Net profit + Income tax expense + Financial expenses) divided by (Net profit + Income tax expense), reflecting capital structure. ⑥ Board Size (Board): Natural logarithm of the number of board members, reflecting corporate governance structure. ⑦ Separation of Ownership and Control (Separate): the control right ratio–the ownership ratio of the actual controller, measuring the decentralization of corporate governance. ⑧ Book-to-Market Ratio (BM): Book value divided by total market value, reflecting market valuation.
3.3. Sample Selection and Data Sources
To conduct a comprehensive assessment of the heterogeneous impact of the River Chief System (RCS) policy on corporate green innovation, this study selects A-share listed companies in Shanghai and Shenzhen from 2005 to 2022 as the research sample. This time frame covers the full cycle of the RCS, from its pilot implementation in Wuxi, Jiangsu Province in 2007 to its nationwide promotion in 2017. The data processing steps are as follows: excluding samples with missing key variables; removing samples from the financial and insurance sectors; deleting samples labeled as ST, ST*, and those with abnormal asset-liability ratios (either greater than 1 or less than 0); excluding samples of companies listed after the RCS implementation (1482 observations); and performing 1% winsorization on continuous variables to reduce interference from extreme values. The final sample includes 33,176 observations from 2558 enterprises, with all data processing completed using STATA 16.0. To enhance robustness, data sources are integrated, including corporate annual reports, the CSMAR Database, and green patent data from the State Intellectual Property Office (SIPO), ensuring the accuracy and consistency of variable measurement.
Table A2 in the
Appendix A reports the descriptive statistics of the main variables in this paper.
5. Further Analysis
5.1. Mechanism Test
Table 5 reports the regression results examining the relationship between RCS, financing constraints, and top management’s green awareness. As shown in column (2), the coefficient of the interaction term Treat × Post with the financing constraint (FC) variable is −0.105 (
p < 0.05), which suggests that the implementation of the RCS has significantly alleviated financing constraints on firms. In the hierarchical implementation structure of the RCS, local governments face considerable pressure to control river basin pollution. To meet environmental targets set by higher authorities, they often introduce supportive policies—such as tax incentives and environmental subsidies—to help firms conduct green innovation activities. These measures lower the cost of obtaining R&D funding, thus reducing the financial burden of green innovation. Moreover, firms that actively respond to the RCS and voluntarily disclose environmental governance information send positive signals to capital markets, demonstrating their commitment to environmental responsibility. This helps enhance investor confidence, attract external financing, and further ease financing difficulties. Therefore, Hypothesis 2a is supported.
However, since the KZ index for financing constraints includes components such as dividend payments that could be influenced by firms’ internal decisions, potential endogeneity issues may arise. For instance, firms with higher levels of green innovation might inherently have better access to financing, leading to reverse causality. To address this, we use the one-period lagged financing constraint variable (L.FC) to mitigate feedback effects from current innovation activities. The result in column (3) shows a coefficient of −0.128 (p < 0.01). The larger absolute value compared to column (2) suggests that the alleviating effect of the RCS on financing constraints remains robust and even stronger after controlling for potential reverse causality. This supports the causal pathway of “policy implementation → improved financing conditions → enhanced green innovation,” rather than innovation driving financing improvements. Additionally, to ensure that the results are not sensitive to how financing constraints are measured, we employ the SA index as an alternative, more exogenous measure. As shown in column (4), the coefficient on Treat × Post is −0.014 (p < 0.01), confirming that the RCS significantly reduces financing constraints. These results indicate that the financing constraint mitigation effect is robust across different measurement approaches.
Column (5) presents the result for the interaction between the RCS policy variable (Treat × Post) and top management’s green awareness (GreCon). The coefficient is 1.085 (p < 0.01), indicating a notable improvement in managerial green awareness after the RCS was implemented. Under the RCS, ‘river chiefs’ enforce compliance through stricter penalties for violations, which heightens management’s sensitivity to environmental regulatory risks and reduces short-sighted behavior. At the same time, incentive policies linked to the RCS enhance management’s perception of potential benefits from green practices. Driven by both risk avoidance and benefit perception, management’s green awareness is significantly strengthened, thereby facilitating corporate green innovation. Thus, Hypothesis 2b is verified.
5.2. Heterogeneity Analysis
5.2.1. Heterogeneity Analysis by Industry Nature
To further investigate how the green innovation effect of the RCS policy varies across industries, we categorize the sample into three types—labor-intensive, technology-intensive, and capital-intensive—based on industrial characteristics, and conduct subgroup regression analyses under both the parallel and hierarchical diffusion modes. The results are presented in
Table 6.
In the full-sample regressions, the coefficient of Treat × Post is positive and significant at the 10% level in technology-intensive industries, indicating that the RCS policy significantly promotes green innovation in this category. By contrast, the coefficients for labor- and capital-intensive industries are not statistically significant. This suggests that the policy is more conducive to helping technology-intensive firms achieve both environmental compliance and competitive advantage through green innovation, while its incentive effect is limited in sectors dominated by labor or capital inputs.
Further analysis under the parallel diffusion mode reveals that only the coefficient for capital-intensive industries is significantly negative (p < 0.1), with no significant effects observed in the other two industry types. This implies that under the parallel diffusion path—where local governments voluntarily imitate and implement the policy—the RCS exerts a weak incentive effect on corporate green innovation, and may even inhibit innovation in capital-intensive industries. This outcome may be attributed to fragmented implementation and a lack of systematic supporting measures. In comparison, under the hierarchical diffusion mode, the coefficients of Treat × Post exhibit more distinct variation across industries: −0.488 in labor-intensive industries, 3.460 in technology-intensive industries, and an insignificant coefficient in capital-intensive industries. This pattern highlights the critical role of policy diffusion mechanisms in moderating industry heterogeneity. In technology-intensive industries, the policy effect under hierarchical diffusion is even stronger than in the full sample, indicating that top-down implementation—supported by administrative mandates and performance accountability—can significantly enhance strategic guidance and resource support for green innovation, sending a stronger incentive signal. In labor-intensive industries, although the coefficient remains negative, the inhibitory effect is more evident under the hierarchical mode. A plausible explanation is that the heightened intensity of environmental enforcement under this approach may compel firms with already narrow profit margins to prioritize survival-related expenditures over long-term investments such as green innovation.
Although the coefficient for capital-intensive industries remains statistically insignificant under the hierarchical mode, it turns positive—compared to the significantly negative estimate under the parallel mode. This shift suggests that stronger policy enforcement may help alleviate firms’ adaptation challenges and provide more room for buffering and support during green transition.
In summary, the empirical results in
Table 6 systematically reveal significant heterogeneity in the green innovation effects of the RCS policy across industries. Technology-intensive industries emerge as the primary beneficiaries, especially under the hierarchical diffusion mode, whereas labor- and capital-intensive industries face dual challenges of either “insufficient incentives” or “implementation overload” under different diffusion pathways.
5.2.2. Heterogeneity Analysis by Region
The effects of the RCS policy exhibit notable regional heterogeneity, influenced by disparities in economic development, technological capacity, and resource endowments across different areas. The full-sample regression results in
Table 7 show that the overall impact of the RCS on corporate green innovation varies substantially by region: it promotes green innovation in the eastern and western regions but appears to inhibit it in the central region.
A closer examination under the parallel diffusion mode reveals no statistically significant effects of the RCS on green innovation in any of the three regions—the coefficients of Treat × Post are −0.076 for the east, −0.209 for the central region, and 0.799 for the west, all insignificant. This pattern reflects the fragmented implementation typical of the parallel diffusion approach, where the absence of coordinated guidance and resource support prevents the policy from generating meaningful incentives. When local governments independently mimic policy measures from leading regions without adapting them to local basin characteristics or firms’ technical constraints, the result is often policy “maladaptation,” which fails to effectively stimulate corporate green innovation.
Under the hierarchical diffusion mode, by contrast, regional differences become more pronounced. The coefficient of Treat × Post is significantly positive in the eastern region (2.654, p < 0.1) and the western region (2.033, p < 0.1), but significantly negative in the central region (−1.713, p < 0.1). These results suggest that the RCS more effectively encourages green innovation in the economically developed eastern region and the resource-rich western region, whereas it has a limited or even adverse effect in the central region, where technological foundations are weaker and resource allocation is less adequate. The hierarchical diffusion mode enhances the rigidity and consistency of policy implementation through top-down planning and mandatory pressure. The eastern region, with its solid economic foundation, mature industrial system, and strong innovation capacity, is better positioned to leverage policy incentives such as tax benefits and green subsidies, thereby engaging in more breakthrough green innovation. Although the western region is less economically developed, its abundant natural resources and policy support—such as the Western Development Strategy—provide financial and market backing for green technology R&D, encouraging firms to pursue green innovation actively. In contrast, the central region, as a transitional zone undergoing economic restructuring, faces pressure to upgrade its industrial structure while constrained by limited technological R&D capability. In this context, firms may prioritize short-term regulatory compliance over long-term innovation, leading to suppressed motivation for substantive green innovation.
6. Conclusions and Policy Implications
6.1. Conclusions
Based on data from Shanghai and Shenzhen A-share listed companies spanning 2005 to 2022, this study employs a multi-period difference-in-differences (DID) approach to systematically examine the heterogeneous effects of the River Chief System (RCS) on corporate green innovation under parallel and hierarchical diffusion modes. The analysis further uncovers industrial and regional variations in policy effectiveness, as well as underlying mechanisms, thereby offering a theoretical and practical foundation for optimizing environmental policy design and advancing green economic development. The main findings are as follows: (1) Under the parallel diffusion mode, RCS does not significantly promote corporate green innovation, which lacks effect stems from local governments’ indiscriminate replication of the policy, resulting in poor local adaptation and a failure to build coordinated governance capacity. (2) In contrast, under the hierarchical diffusion mode, the RCS significantly enhances the level of corporate green innovation, particularly breakthrough green innovation, with a more pronounced effect than on incremental innovation. (3) Mechanism analysis indicates that the hierarchical diffusion mode facilitates green innovation mainly by alleviating corporate financing constraints and strengthening management’s green awareness. Specific pathways include policy support in the form of tax incentives and green subsidies, alongside mandatory pressure and publicity campaigns that elevate managerial environmental consciousness. (4) Heterogeneity analysis further reveals that under parallel diffusion, the policy not only exhibits an overall weak effect but also suppresses green innovation in capital-intensive industries. By comparison, under hierarchical diffusion, the policy promotes corporate green innovation in eastern and western regions, shows a stronger effect in technology-intensive industries, but inhibits innovation in labor-intensive industries and enterprises in central China.
6.2. Policy Implications
Based on the findings, this study proposes the following policy recommendations:
Given its stronger effect on spurring green innovation, the hierarchical diffusion mode should be prioritized to achieve sustainable environmental governance. The central government should strengthen top-level design by establishing unified implementation and evaluation standards, while providing clear guidance and oversight to ensure policy consistency and long-term sustainability, and local governments should adapt these guidelines to local ecological conditions, avoiding blind replication of policies from other regions to improve relevance and effectiveness.
- 2.
Provide Targeted Support for Sustainable Breakthrough Innovation
Breakthrough green innovation should receive specific policy support as it contributes significantly to sustainable economic transformation. Under the hierarchical diffusion framework, this can include establishing special sustainability funds, offering higher subsidies or tax incentives for R&D in green technologies, and creating innovation platforms to facilitate industry–university–research collaboration and accelerate the market application of sustainable technologies.
- 3.
Develop Sustainable Financing Mechanisms
To ease financing constraints that hinder corporate green innovation, the government should expand sustainable financial instruments such as green credit, green bonds, and environmental funds. Financial institutions should be encouraged to develop sustainable innovation-related products, thereby lowering financing costs and stimulating greater corporate investment in green R&D for long-term sustainable development.
- 4.
Strengthen Sustainable Awareness on Green Cognition Among Corporate Leadership
Top management’s environmental cognition plays a critical role in shaping sustainable business strategies. The government should organize sustainability training sessions and workshops to deepen executives’ understanding of green innovation, while enforcing stricter penalties for pollution violations to compel attention to environmental risks and encourage proactive sustainable planning.
- 5.
Formulate Policies Based on Industrial Nature and Regional Differences
Policy design should reflect industrial and regional heterogeneity to achieve balanced sustainable development: For technology-intensive industries should receive R&D subsidies and collaboration platforms to offset compliance costs while promoting sustainable technological advancement. For labor-intensive industries need low-cost green equipment and skill training to ensure a just transition to sustainable production. For capital-intensive firms may benefit from innovative tools such as green asset securitization and phased compliance schedules that consider sustainable transformation pathways; Regionally, the eastern region should leverage its strengths to pioneer sustainable innovation; the western region ought to enhance pollution control and policy enforcement; and the central region should foster interregional cooperation to adopt advanced technologies and sustainable governance experience.
- 6.
Establish Sustainable Implementation Mechanisms
To help the RCS transition from symbolic adoption to substantive impact, a long-term monitoring and evaluation mechanism should be established with sustainability indicators. Increasing public participation and awareness can build external supervision and strengthen corporate responsiveness to RCS requirements, ultimately supporting the sustainable development goals of both economic growth and environmental protection.
However, this study has certain limitations. Firstly, we do not explicitly account for the possibility that the impact of RCS in one region may extend to and influence green innovation in neighboring areas. Future research could quantitatively analyze these direct and indirect spillover effects to develop a more comprehensive understanding of the policy’s overall impact. Secondly, within the context of staggered policy implementation, our model may be subject to the potential influence of staggered treatment bias, which has not been fully ruled out in the current analysis. If data conditions permit, subsequent studies could employ more flexible estimators to further verify the robustness of the findings.
