Article

Multi-Field Coupled Numerical Simulation of Geothermal Extraction and Reinjection in the Sandstone Reservoir

1
Shandong Institute of Geological Survey, Jinan 250014, China
2
Institute of Marine Science and Technology, Shandong University, Qingdao 266237, China
3
Shandong Key Laboratory of Intelligent Marine Engineering Geology, Environment and Equipment, Qingdao 266237, China
4
Shandong Provincial Territorial Spatial Ecological Restoration Center, Jinan 250014, China
5
Shandong Provincial Geo-Mineral Engineering Exploration Institute, Jinan 250014, China
6
School of Civil and Hydraulic Engineering, Ningxia University, Yinchuan 750021, China
*
Author to whom correspondence should be addressed.
Sustainability 2025, 17(21), 9646; https://doi.org/10.3390/su17219646
Submission received: 26 September 2025 / Revised: 23 October 2025 / Accepted: 28 October 2025 / Published: 30 October 2025
(This article belongs to the Section Energy Sustainability)

Abstract

The sustainable exploitation of geothermal energy is often challenged by issues such as groundwater level decline and thermal attenuation. This study focuses on the sandstone thermal reservoir in Linqing City, Shandong Province. A three-dimensional thermo-hydro-mechanical (THM) multi-field coupling numerical model is developed to simulate the evolution of geothermal water levels and temperature fields under varying reinjection rates. The model was validated against observed water level and temperature data, showing maximum deviations of 1.62 m and 0.6 °C. Simulation results indicate that increasing the reinjection rate mitigates water-level decline but accelerates thermal breakthrough, expanding the low-temperature zone. At a 100% reinjection rate, the minimum temperature at the bottom of the thermal reservoir decreases to 63.6 °C, and the low-temperature area extends to 11.61 km2. Moderate reinjection rates help to slow thermal energy loss while maintaining reservoir pressure and stabilizing water levels. This study reveals the dual effects of reinjection rate on the balance of geothermal system and puts forward suggestions on optimizing well spacing according to the simulated advance rate of cold waterfront, so as to ensure sustainable thermal recovery. It provides theoretical basis and numerical simulation support for reinjection strategy optimization and well spacing design of similar geothermal fields in Linqing and North China Plain.

1. Introduction

Geothermal energy provides continuous baseload power independent of weather, giving it advantages over wind and solar [1]. In sedimentary basins such as the North China Plain, sandstone geothermal reservoirs supply large-scale district heating but experience reservoir pressure decline and thermal drawdown during prolonged extraction [2].
Multi-field coupling numerical models are widely used in geothermal system research [3,4,5]. Early geothermal simulations employed two-field thermo-hydro (TH) coupling (e.g., TOUGH2, FEFLOW) to analyze heat–fluid interaction [6,7]. Although TH models offer valuable insights, they often fail to explain the mechanical deformation of rock matrices caused by changes in pore pressure. In fact, geothermal operations involve complex interactions among heat transfer, fluid flow and rock mechanics [2,8]. Subsequent advances incorporated rock-matrix deformation through THM coupling using tools such as TOUGH-FLAC and OpenGeoSys, improving prediction of pressure-dependent permeability and subsidence [9,10]. Such coupled models are indispensable for predicting reservoir responses, particularly where fault networks govern fluid flow and stress redistribution. However, most existing THM studies focus on fractured or carbonate reservoirs, whereas sandstone systems remain under-represented.
Tailwater reinjection is a key measure for ensuring the sustainability of geothermal development [11,12]. Different reinjection rates exert markedly different impacts on flow and temperature fields. A low reinjection rate may cause a rapid decline in water level, whereas an excessively high reinjection rate accelerates cold-water and heat breakthrough [13]. In the absence of effective reinjection during long-term extraction, the water level of deep confined aquifers continues to decline [14,15]. However, an appropriate configuration of injection–production ratios and well placement can effectively mitigate this problem [16]. Reinjection sustains pressure but introduces a cold-water front that can shorten reservoir life if the thermal plume reaches production wells too quickly [17,18]. In the North China Plain and other regions with high-permeability sandstone reservoirs, a higher reinjection rate is usually adopted to alleviate the decline in water level. However, due to the rapid spread of cold water to the production area, it may cause local cooling effects, which also shortens the production life of the reservoir [2,19]. In contrast, in regions such as the United States or Europe, reservoir structures are more complex, and reinjection strategies often focus more on optimizing well locations and balancing reinjection rates to minimize thermal breakouts while maintaining pressure stability [20,21]. These systems benefit from more advanced monitoring and modeling technologies, enabling more precise control over the volume of reinjection and the design of injection wells.
Despite numerous reinjection simulations, two key gaps remain: (1) most models neglect coupled mechanical deformation, which limits the impact of permeability evolution on geothermal production and injection; and (2) long-term reinjection impacts in the sandstone reservoirs of northwestern Shandong are poorly quantified. To address these gaps, this study develops and validates a fully coupled 3D THM model for the Linqing geothermal field to evaluate water-level and temperature evolution under various reinjection rates.
Based on this, the study selects Linqing City, Shandong Province, as the research area. A three-dimensional (3D) THM coupling numerical model is established to simulate the evolution of reservoir water levels and temperature fields under different reinjection rates. The model’s reliability is validated against measured monitoring data, and the operation scenarios of the geothermal system over the next ten years are predicted. This study provides a scientific basis for the sustainable utilization of geothermal resources in Linqing City and serves as a reference case for numerical simulation and reinjection optimization in medium- and low-temperature geothermal fields across the North China Plain.
The main contributions of this study are summarized in three aspects. First, a 3D THM multi-field coupling numerical model is developed for the sandstone thermal reservoir in Linqing City, Shandong Province, and its reliability is validated against measured water level and temperature monitoring data, thereby enhancing prediction accuracy. Second, the study quantitatively reveals the long-term evolution of reservoir water levels and temperature fields under different reinjection rates, providing new evidence for evaluating the impacts of reinjection measures on reservoir sustainability. Finally, the study proposes an appropriate range of reinjection rates and management strategies, offering a reference for the optimal development and scientific management of medium and low-temperature geothermal fields in the North China Plain.

2. Background and Methods

2.1. Establishment of Numerical Model

2.1.1. Multi-Field Coupling Computing Theory

In this study, a THM model is employed to integrate heat transfer, groundwater flow, and rock-soil mass deformation. These governing equations are derived from Biot’s pore elasticity theory [22] for solid deformation and fluid flow, and the theory of convection in porous media [23] for heat transport. These theories were implemented computationally by solving the coupled partial differential equations (Equations (1)–(4)) using the finite element method within the COMSOL Multiphysics® 6.2 software environment. Similar coupling methods are widely applied in geotechnical engineering research [9,10,24].
(1)
Fluid flow equation
Based on Darcy’s law and the principle of conservation of mass, the fluid flow control equation is
t φ ρ f + × ρ f q = Q m
where φ denotes the porosity, ρ f the fluid density, q the Darcy velocity, and Q m the source–sink term.
(2)
Heat transfer equation
Considering heat conduction and convective heat transfer, the energy conservation equation is
ρ C p e f f T t + ρ f C p , f q · T = · λ e f f T + Q T
where T denotes the temperature, ρ C p e f f the effective heat capacity, λ e f f the effective thermal conductivity, C p , f the specific heat capacity of the fluid, and Q T the heat source term.
(3)
Solid deformation equation
Based on the Biot pore elasticity theory, the stress balance equation is
· σ + ρ g = 0
The principle of effective stress can be defined as follows:
σ = σ α p I
where σ denotes the total stress tensor, σ the effective stress, α the Biot coefficient, and I the unit tensor.

2.1.2. Model Geometry and Computational Parameters

A three-dimensional THM coupled numerical model of the study area is established, with Linqing City, Shandong Province, serving as the boundary of the simulation domain. The stratigraphic profile extends from the surface to a depth of 1900 m and is divided into four principal layers. The first and second layers are weakly permeable and consist of the Quaternary Q and the Pliocene N2, respectively. The third layer corresponds to the Miocene N1, which hosts the primary geothermal reservoir, while the fourth layer is the Oligocene E3, which also functions as a thermal reservoir [25]. The dominant heat sources include terrestrial heat conduction, frictional heat generated along the Linqing Fault and its subsidiary faults, and thermal flow related to mantle-derived magmatic activity [26].
Linqing City lies at the edge of the Guan County Depression. Geophysical exploration and previous studies indicate that the Linqing Fault and its secondary faults have been long-term active, extending into the Guantao Formation. These faults act as effective conduits for water and heat transfer, enabling the concentration of geothermal fluids and resulting in relatively high reservoir temperatures. The extraction layers of the geothermal system are the third and fourth layers. The geological profile of the study area is shown in Figure 1.
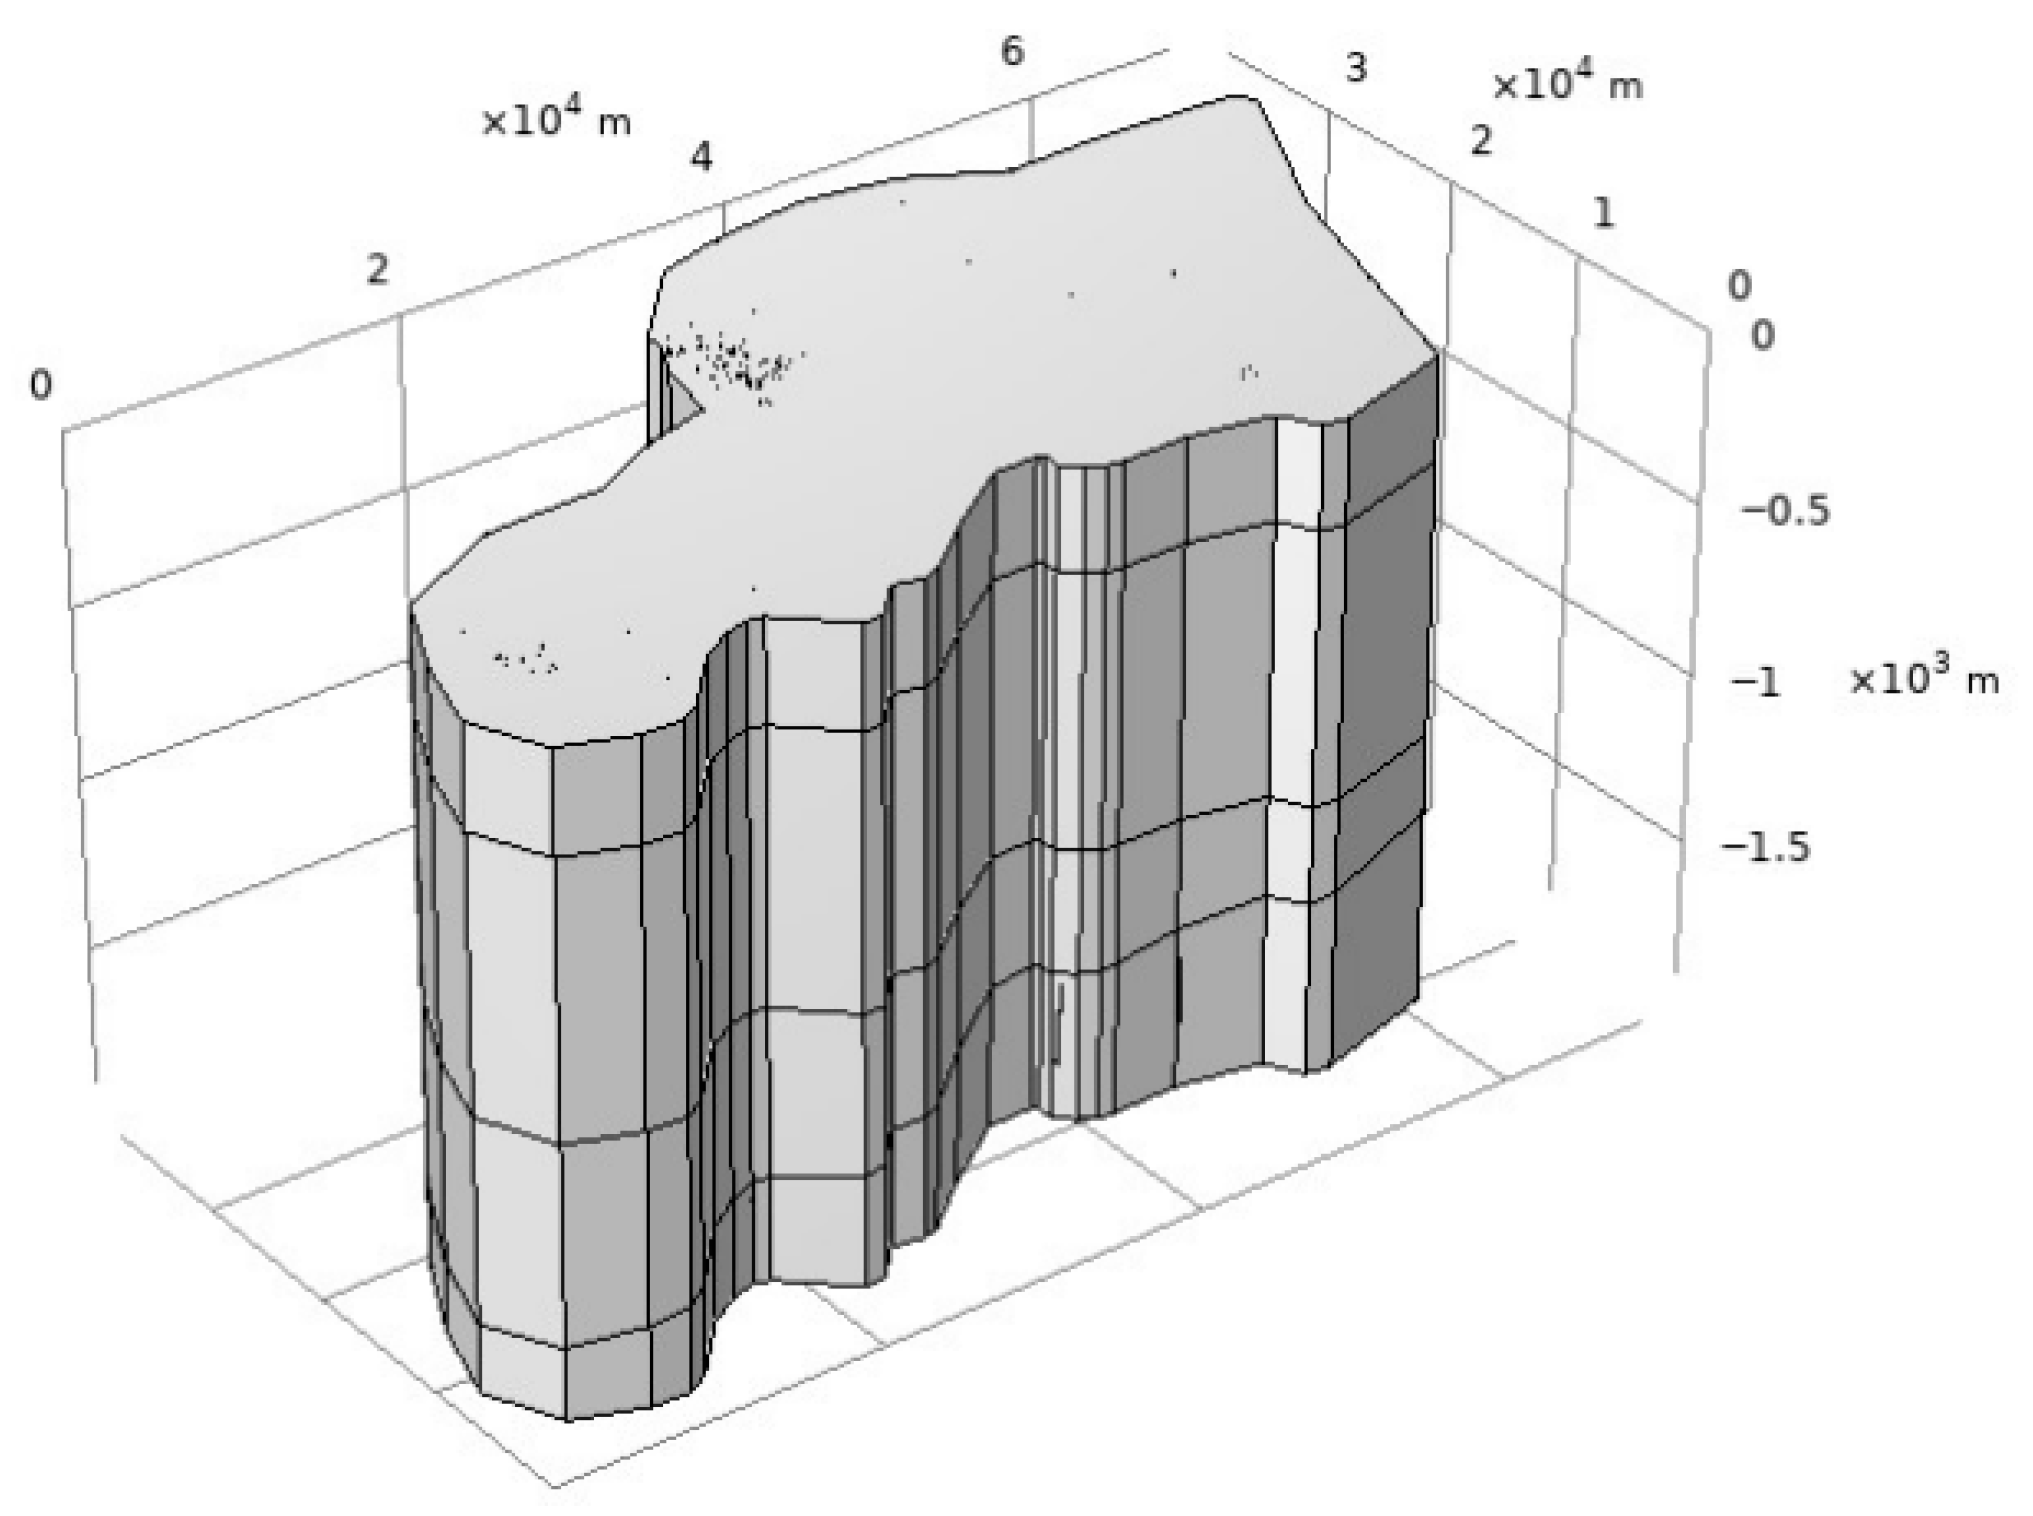
The model covers a planar area of 960 m2 with a depth of 1900 m. The THM coupling Numerical model of the study area is presented in Figure 2. The parameter values of each layer are shown in Table 1. Although the model assumes that the thermal conductivity and permeability of each stratum are uniform, this simplification is based on core tests and regional geological survey data, ensuring that the model reliably simulates the behavior of large-scale systems [27,28]. This assumption ensures the stability of the calculation and focuses on the macroscopic response of the reservoir, but it may eliminate local variations. Future research will introduce random parameter field or ground statistical models to better characterize small-scale heterogeneity.
In the numerical model, the initial water pressure in the thermal reservoir aquifer and geothermal well is defined as hydrostatic pressure. The flow field, derived through spatial interpolation of unified water level monitoring data, serves as the model’s initial flow field. Based on the local annual average temperature, the upper surface temperature is set at 26 °C. By analyzing the temperature monitoring borehole data from the geothermal survey in Linqing, the geothermal gradient is set at 0.023 °C/m.
The upper and lower surfaces of the model are defined as impermeable and thermally insulated boundaries, excluding any exchange of water or heat with the surroundings. The lateral boundaries are specified as heat exchange and flow boundaries. The boundary water level is calculated based on the dynamic evolution analysis of the groundwater flow field. A flow boundary is established between the production and reinjection wells, with the extraction volume determined from actual unified monitoring data. The deformation of the lower surface is not considered; horizontal movement is constrained, and only vertical displacement is allowed. The lateral boundaries are defined as constant-pressure boundaries, with pressure specified according to hydrostatic conditions.

2.1.3. Geothermal Extraction and Reinjection Conditions

The reinjection temperature of geothermal water is set to 20 °C, and the reinjection volume is defined as 70% of the extraction volume. When one extraction well corresponds to two reinjection wells, the reinjection volume is evenly distributed between them. Conversely, when one reinjection well corresponds to two production wells, the reinjection volume is set to twice the original value. The mass flow rates of some production and reinjection wells are presented in Table 2. Given the large number of geothermal wells in the study area (109 in total), only the mass flow rates of extraction wells with corresponding reinjection wells are listed. The reinjection positions of the reinjection wells are consistent with those of the corresponding extraction wells.
As shown in Table 2, only 20 production wells in the study area are currently equipped with reinjection wells. Geothermal extraction in the region is primarily used for heating and bathing. The production period extends from November 15 each year to March 15 of the following year. During the remaining months, both production and reinjection wells cease operation.

2.1.4. Model Discretization

The study area model is discretized using unstructured tetrahedral grids. To ensure the accuracy of the simulation results, the grids around the thermal reservoir and geothermal wells are locally refined. The THM coupling numerical model of Linqing City consists of 339,355 domain elements, 117,074 boundary elements, and 4341 edge elements.

2.1.5. Model Identification and Verification

(1)
Water level verification
The initial flow field, derived from geothermal water level monitoring data, is shown in Figure 3, and a one-year simulation of geothermal system operation is conducted. To verify the validity and accuracy of the model, the dynamic variations in the regional flow field and the geothermal water level at the monitoring points are examined.
The geothermal water level monitoring data are compared with the simulated values at the monitoring points to validate the accuracy of the numerical model. The comparison between simulated and observed water levels is presented in Figure 4.
As shown in Figure 4, the maximum error between the simulated and observed geothermal water levels is 0.90 m, the minimum error is 0.31 m, and the average error is 0.69 m. These calibration results confirm the reliability of the established numerical model and its parameters, supporting its application to predict geothermal water levels in the study area.
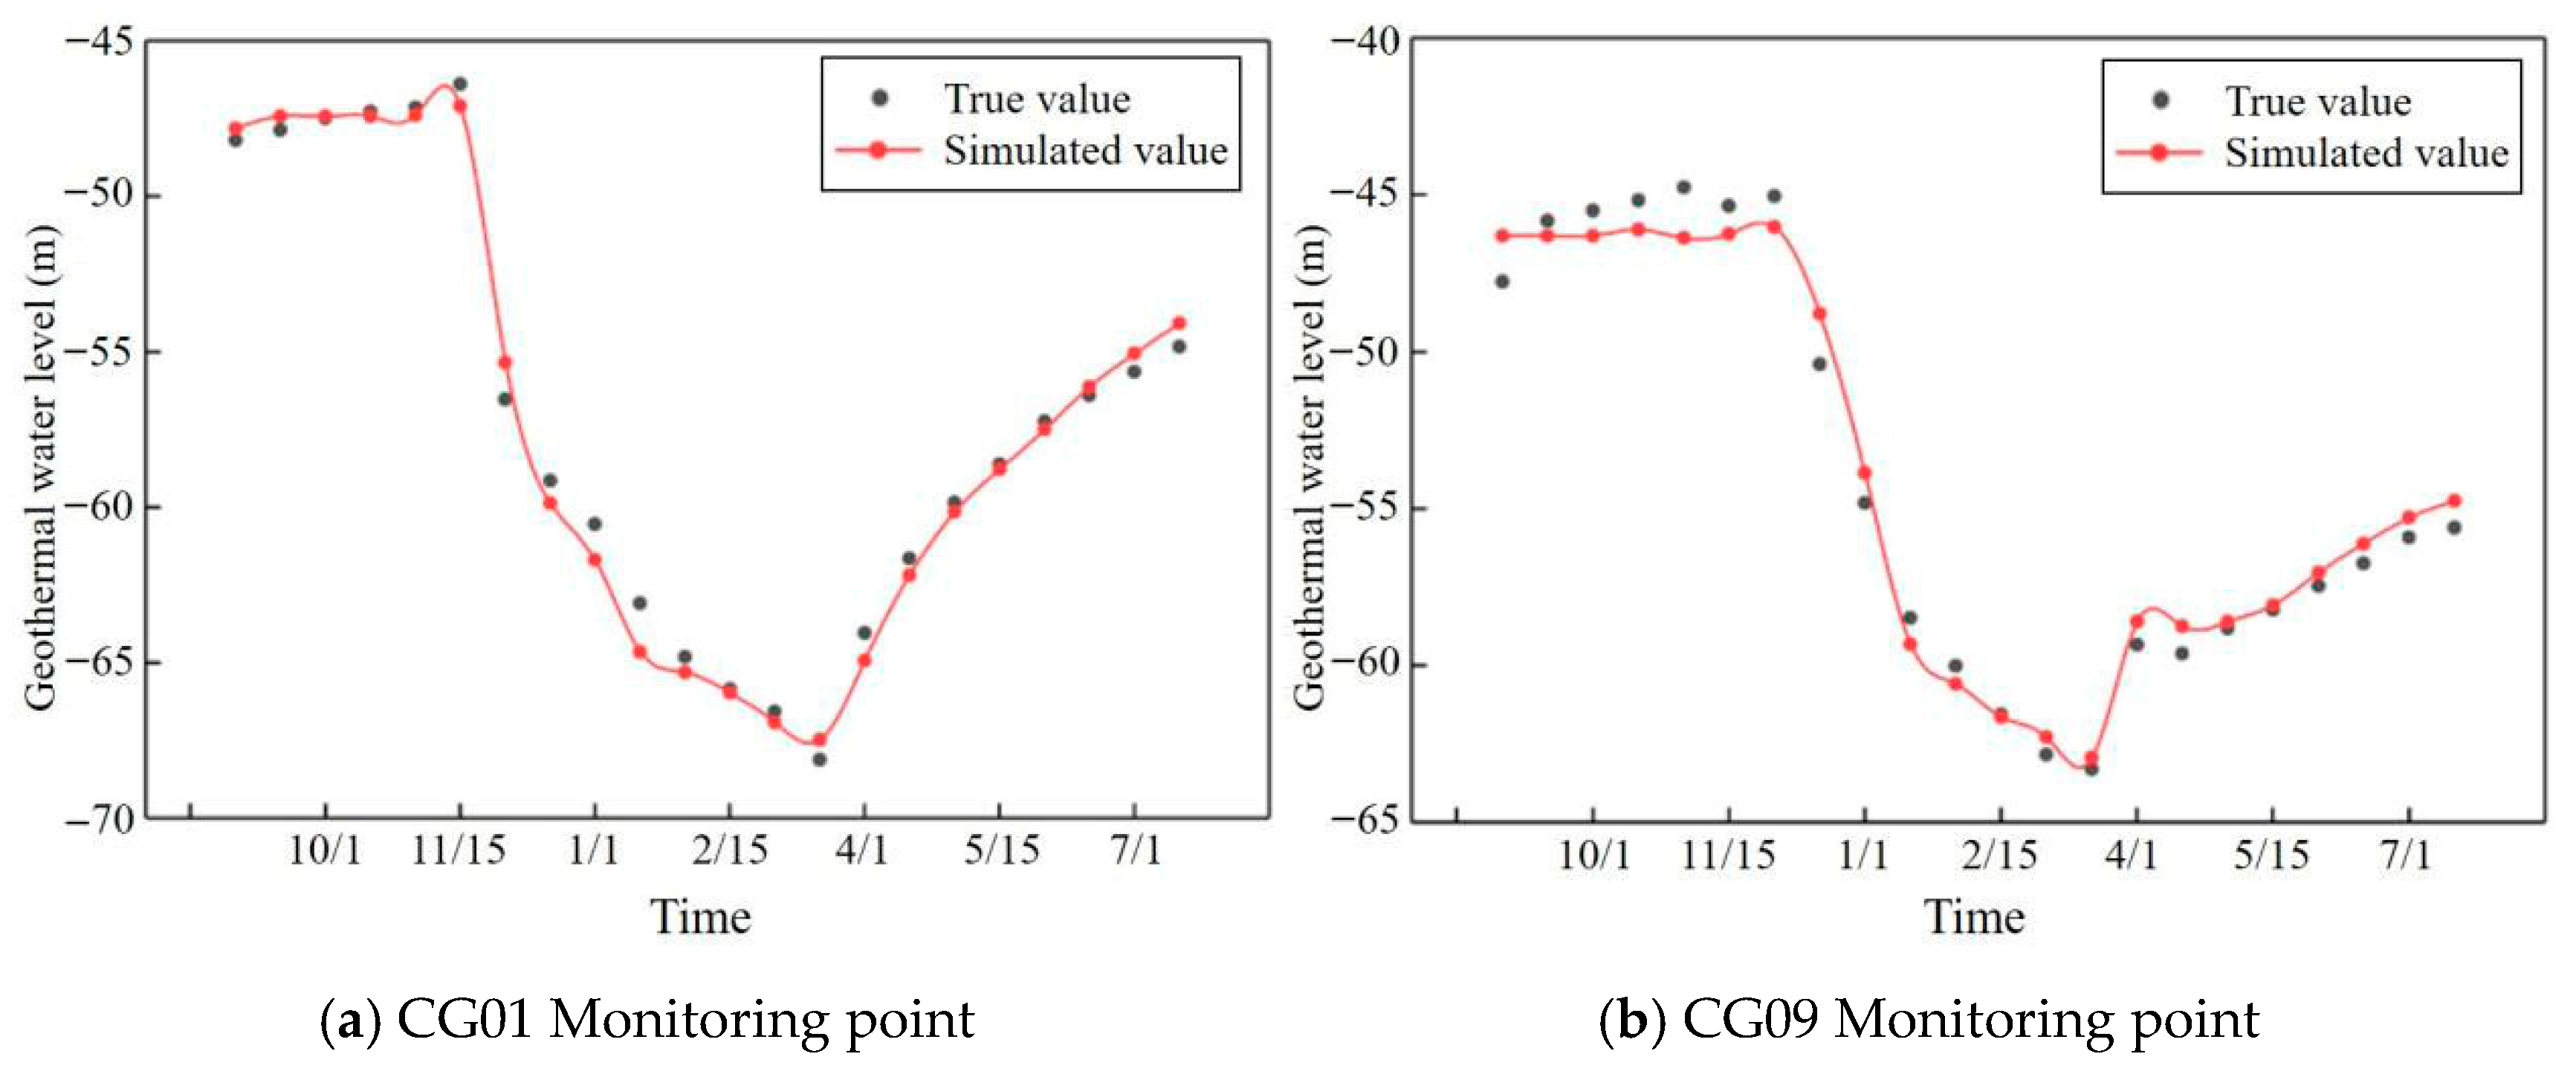
The accuracy of the numerical model is further verified using dynamic monitoring data of geothermal water levels at monitoring points CG01 and CG09. The observed and simulated geothermal water levels are presented in Figure 5. The temporal trends of the monitored and simulated water levels are generally consistent, and the overall differences are negligible. The variation in geothermal water level over the time series is 19.91 m, while the maximum error between the observed and simulated values is 1.62 m, which is within the allowable margin of approximately 2 m. Therefore, the simulated flow field effectively represents the actual state and temporal evolution of geothermal water flow, meeting the requirements for reliable simulation.
(2)
Temperature fitting
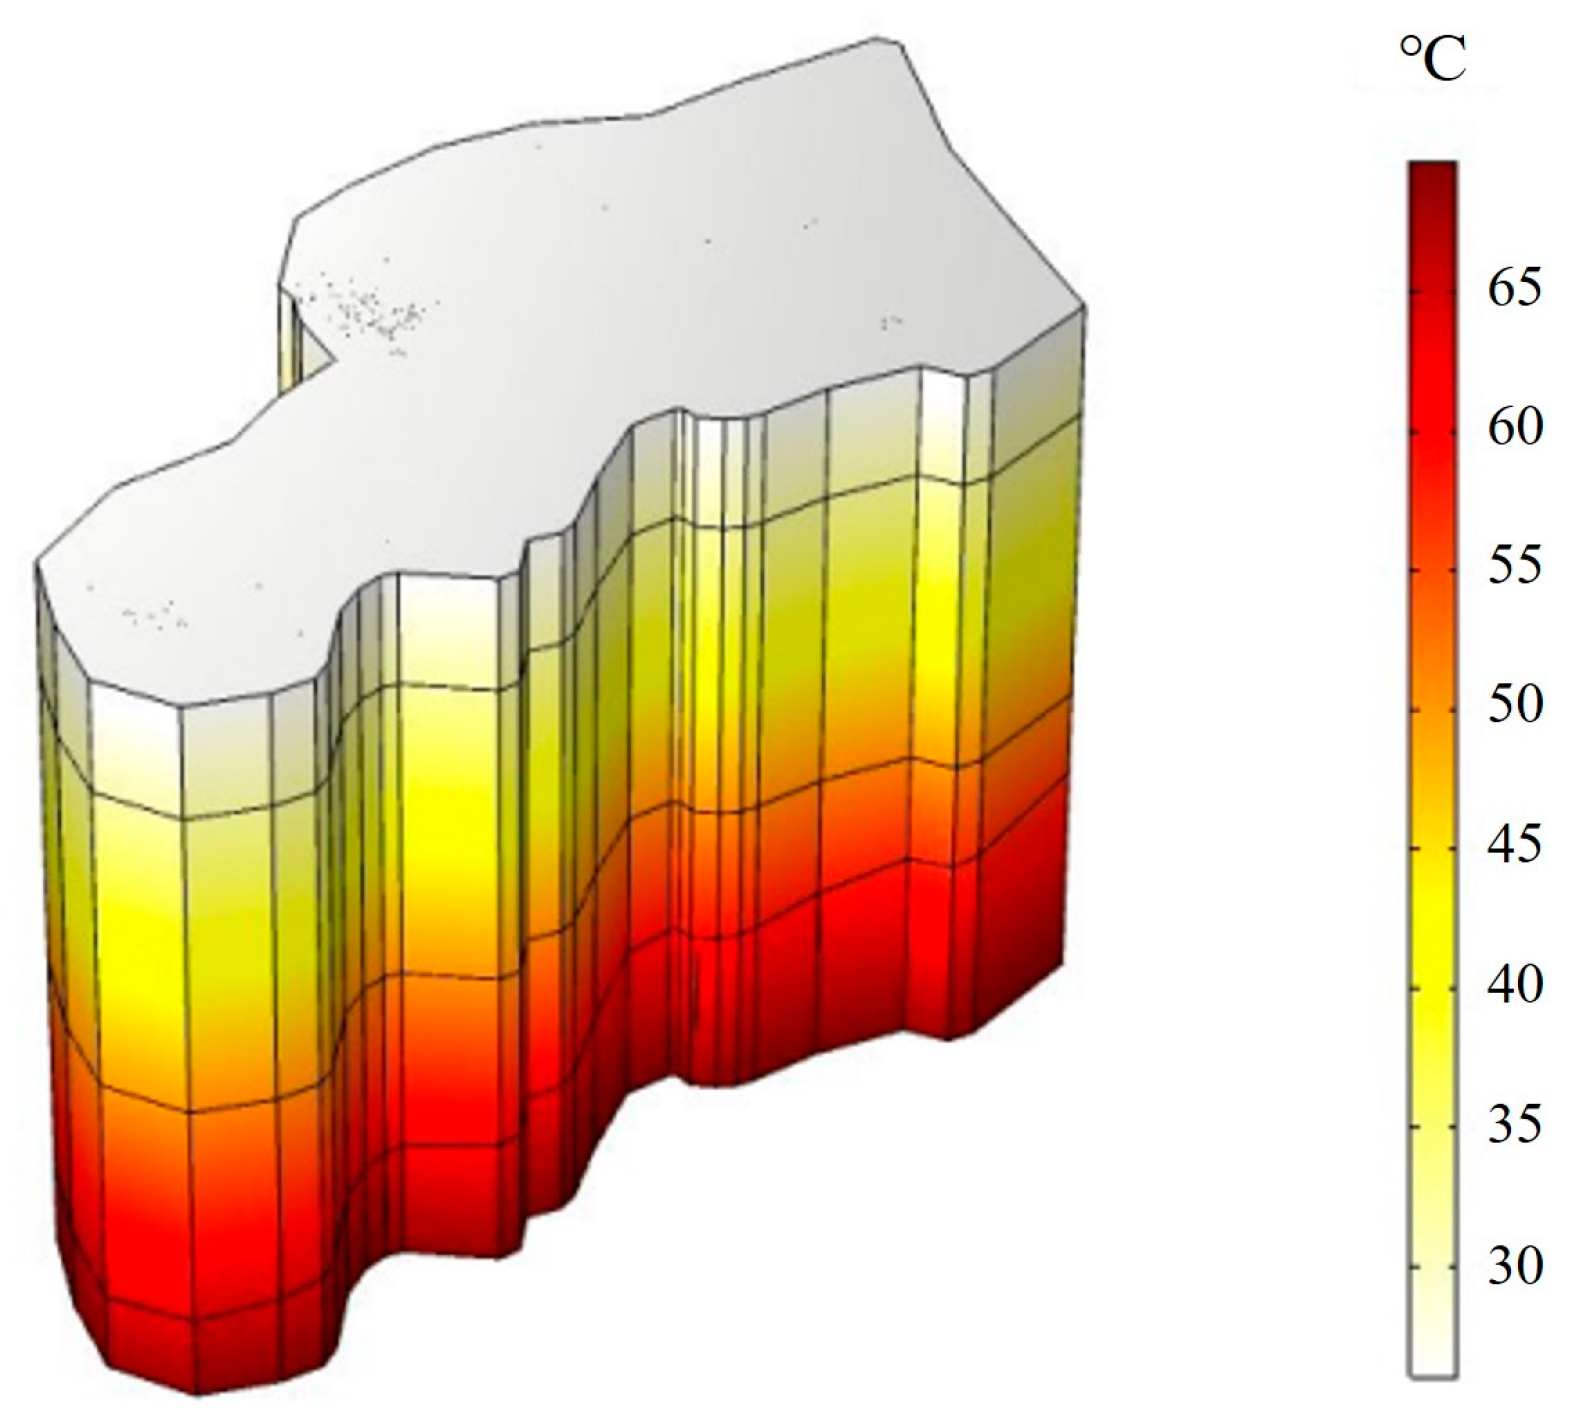
The initial temperature field of the numerical model, the upper surface temperature is set at 26 °C, and the geothermal gradient is defined as 0.023 °C/m, as shown in Figure 6. To verify the validity and accuracy of the model, a comparative analysis is performed between the simulated and observed values of regional mining temperature and the measured temperature profile of the geothermal well.
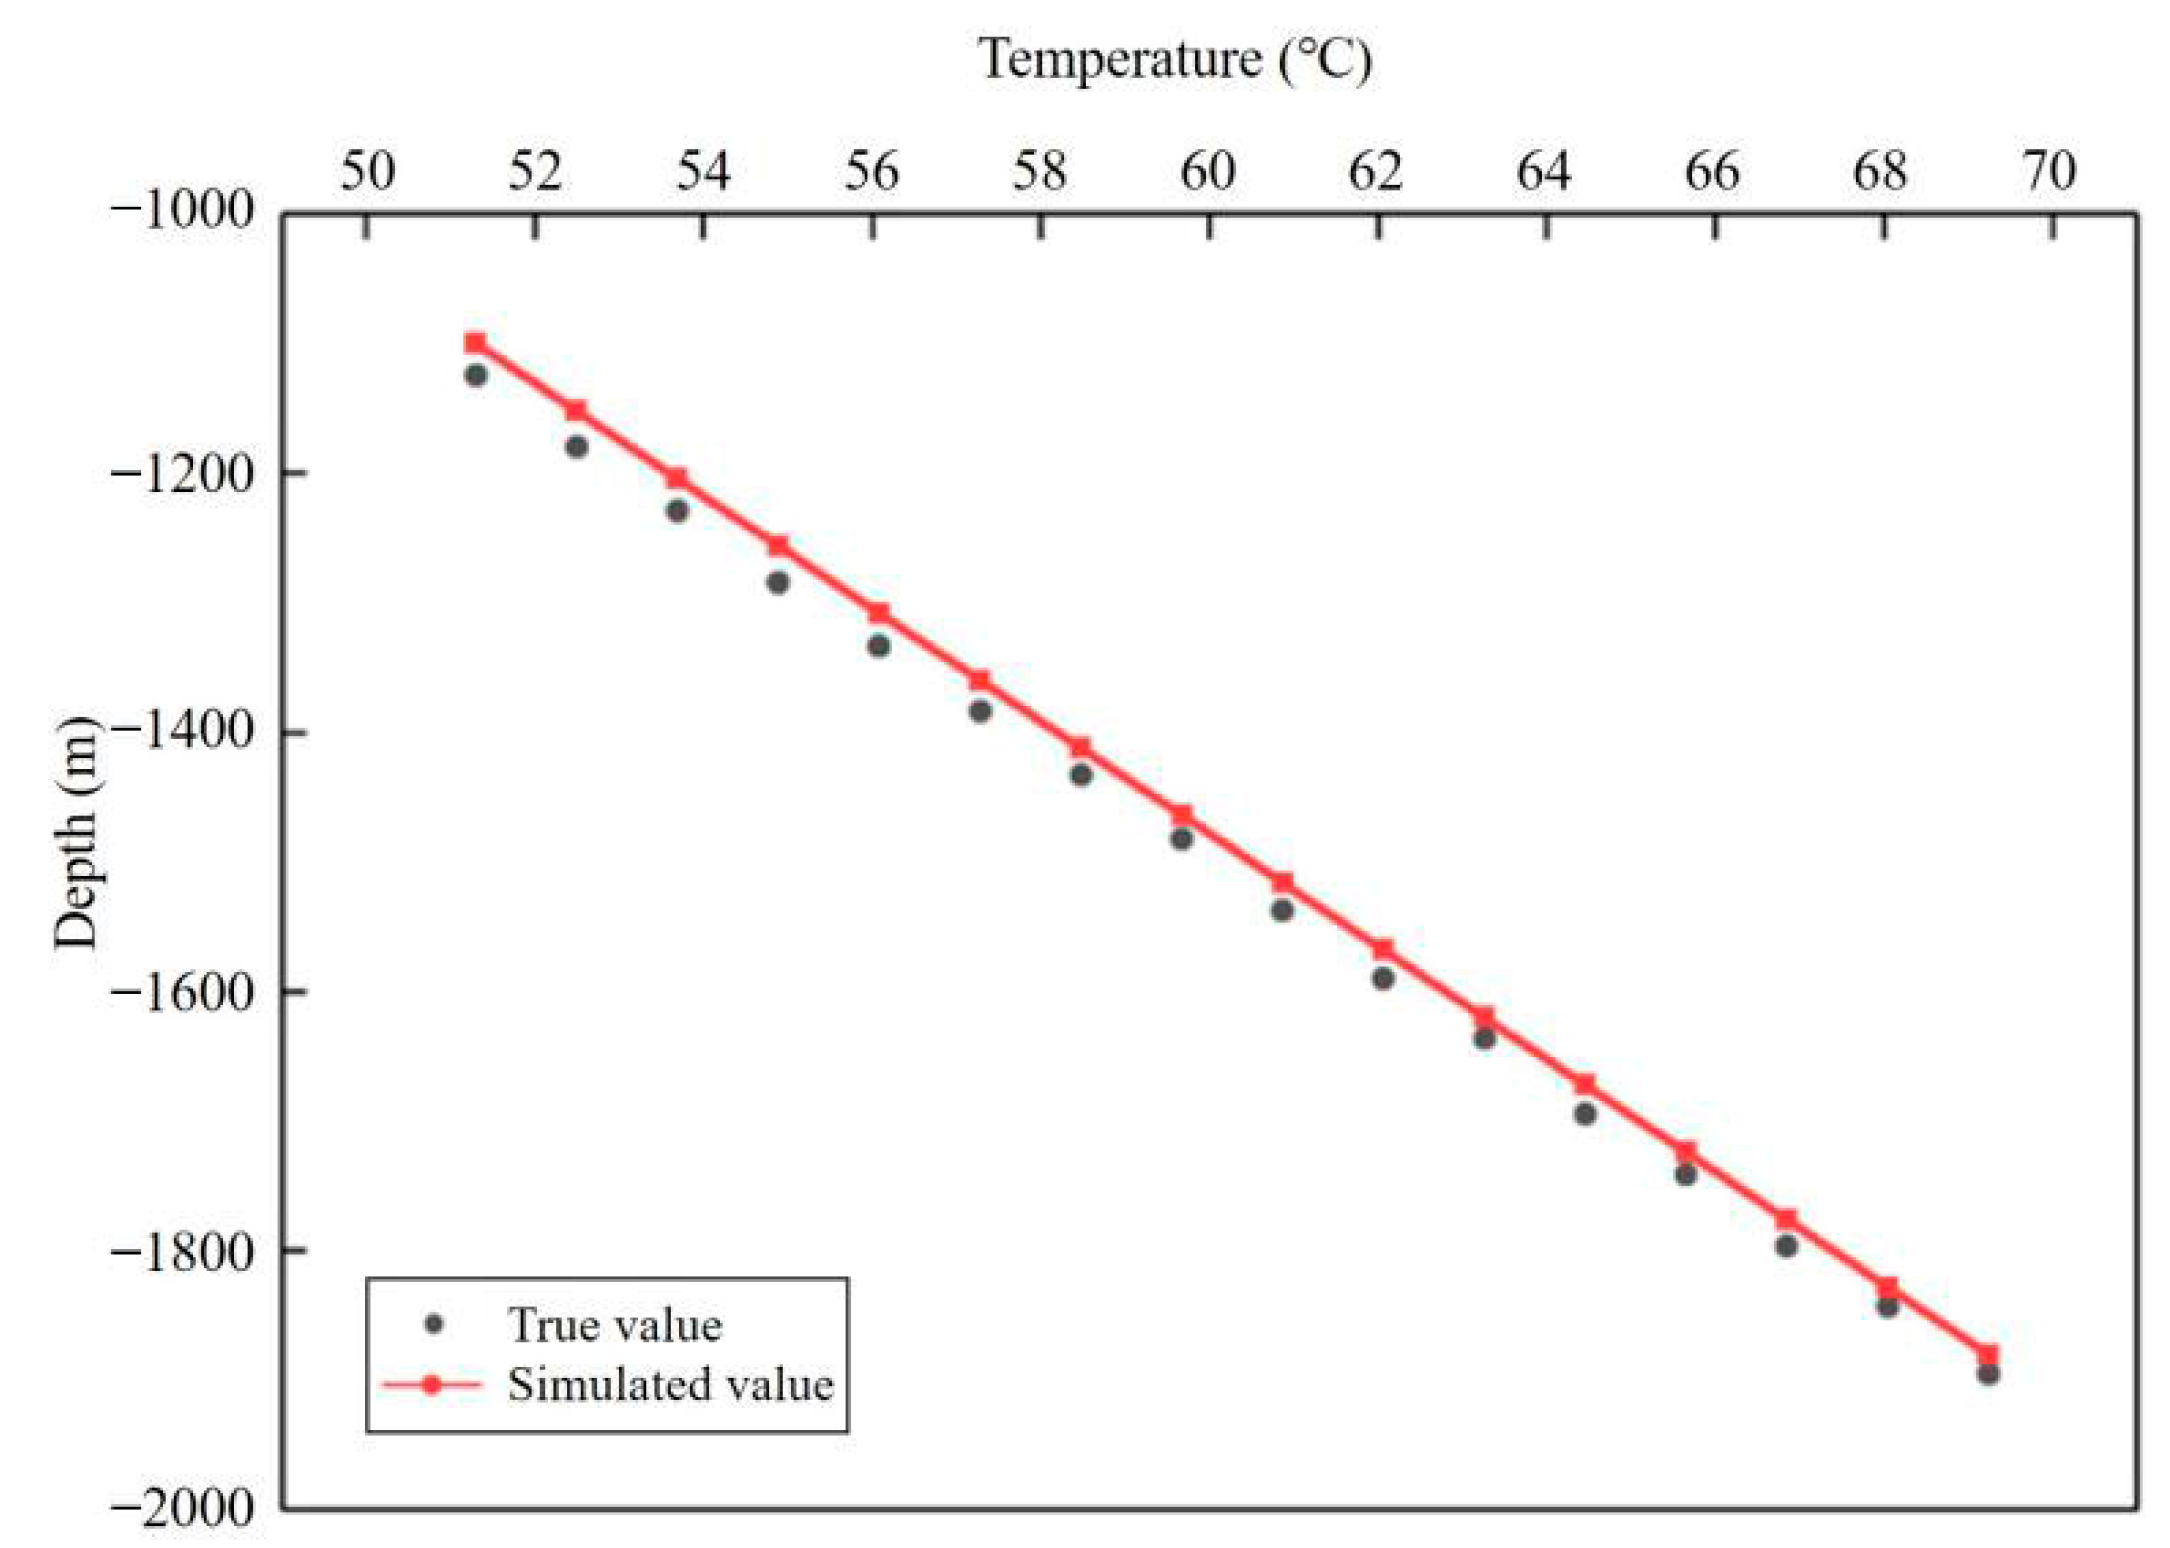
The temperature measurement data from the geothermal well are compared with the simulated temperature distribution of the corresponding thermal reservoir in the numerical model. By adjusting the model parameters, the simulated values are brought into close agreement with the observed values. The fitting results are shown in Figure 7. The results indicate that the simulated reservoir temperatures align well with the measured data and can therefore be used to predict the temperature field in the study area.
The accuracy of the model temperature field is further verified using monitoring data of geothermal water extraction temperature. The observed and simulated extraction temperatures are presented in Figure 8. The maximum error between the monitored and simulated temperatures is 0.6 °C, the minimum error is 0 °C, and the average error is 0.26 °C. These results demonstrate that the numerical model accurately represents the temperature field, satisfies the simulation requirements, and can be used to predict temperature variations in the study area.

3. Results

3.1. Reservoir Evolution Under Current Conditions

3.1.1. Flow Field Evolution

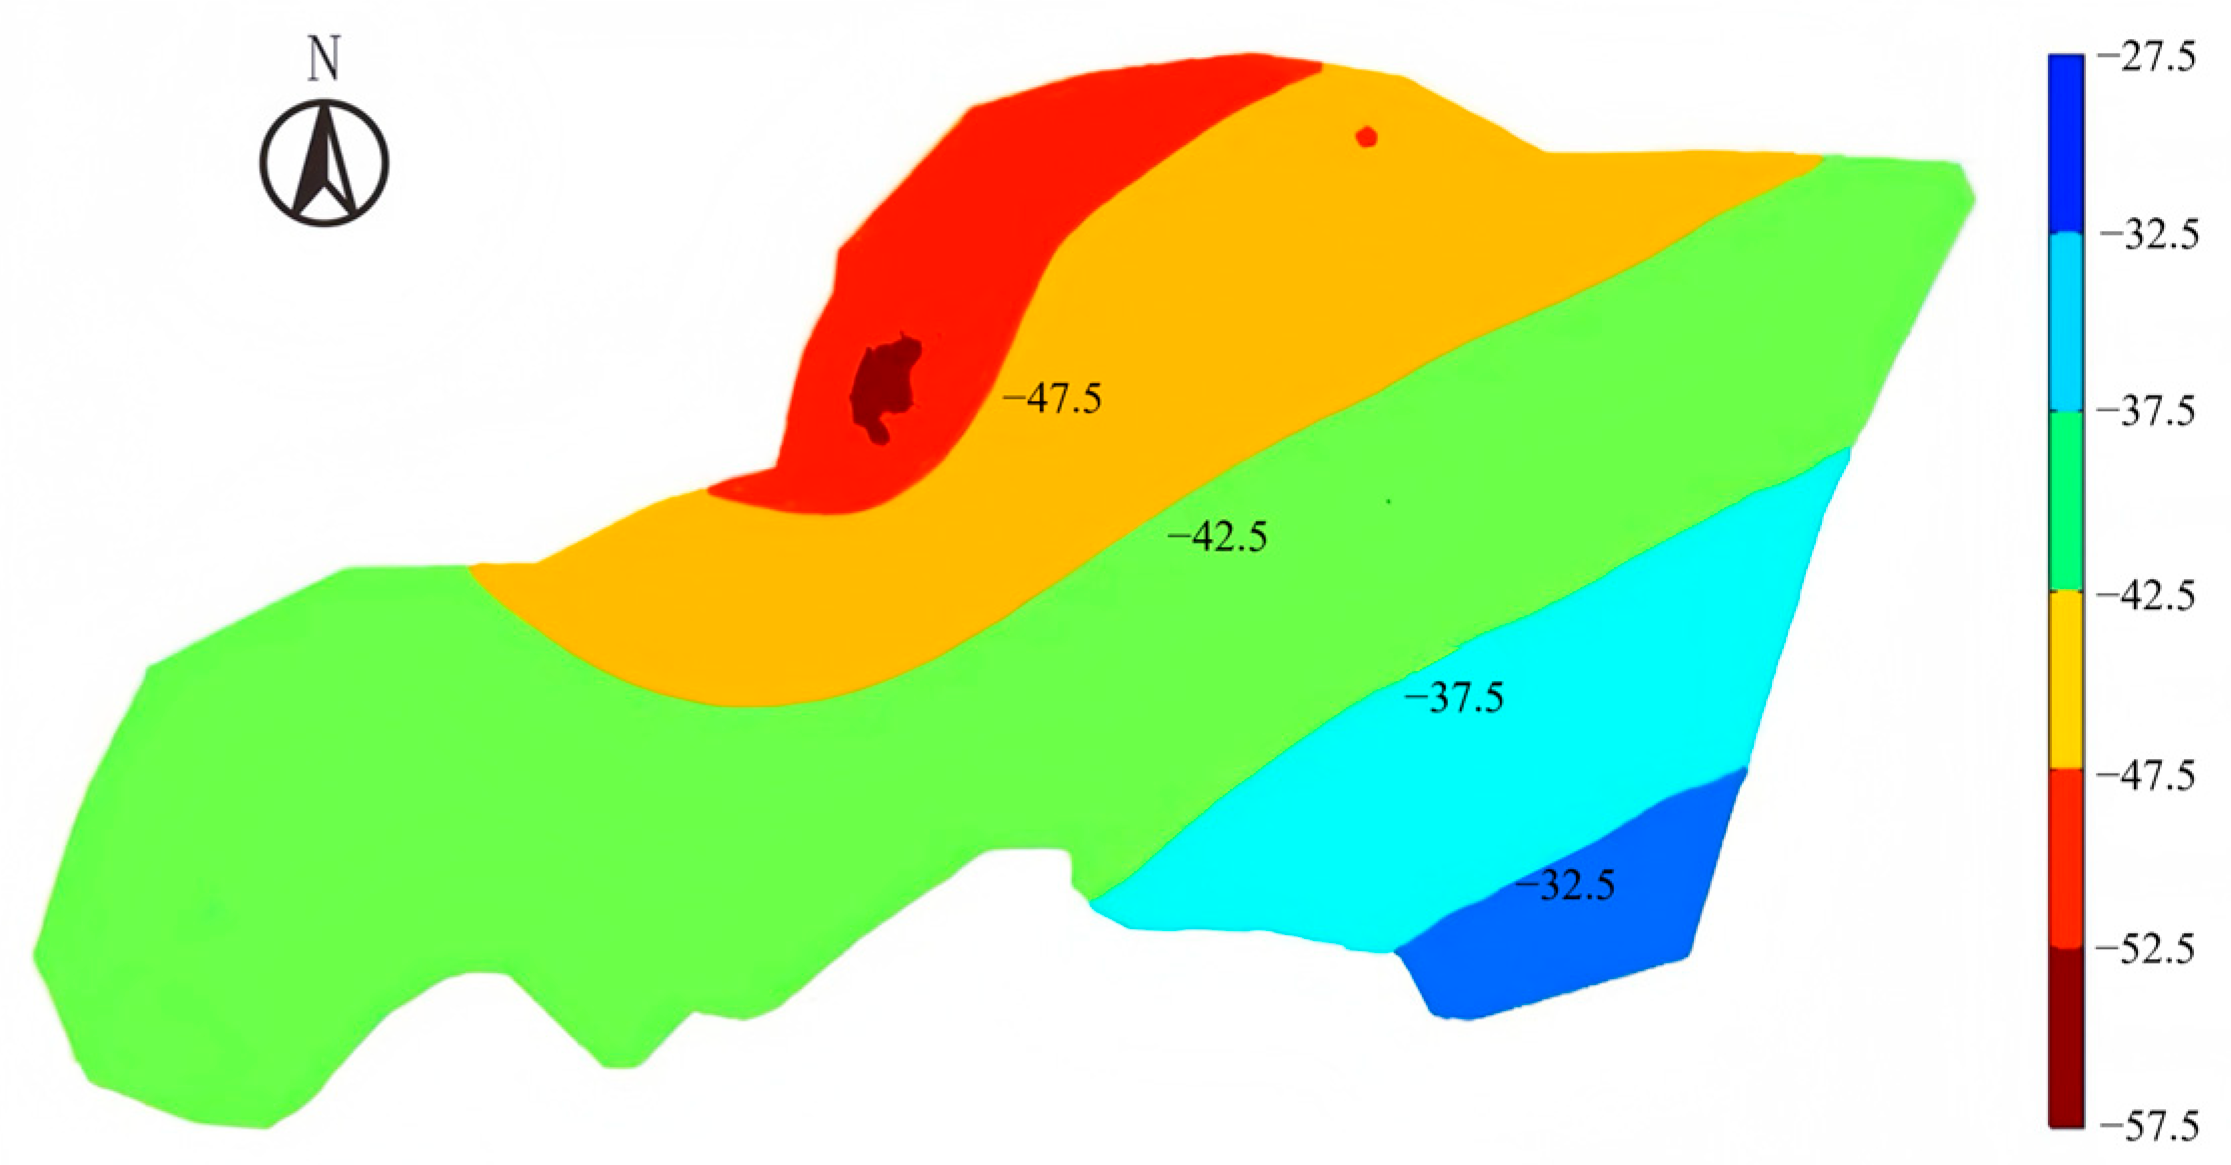
Under current extraction and reinjection conditions, which follow a seasonal operational pattern, changes in the geothermal water level after one year are simulated and analyzed, as shown in Figure 9. The results indicate that, due to large-scale extraction and the lack of reinjection wells for most geothermal wells, geothermal water in Linqing City remains in a state of imbalance between reinjection and extraction, leading to a continuous decline in water levels. This seasonal and intermittent exploitation leads to a cyclic pattern of pressure drawdown and partial recovery. However, the net effect is a continuous decline in water levels year over year, as the recovery during the off-operational months is incomplete. After one year, a large descending funnel forms, as shown in the deep red area in Figure 9. The water level at the center of the funnel drops by 7.4 m to 57.3 m.
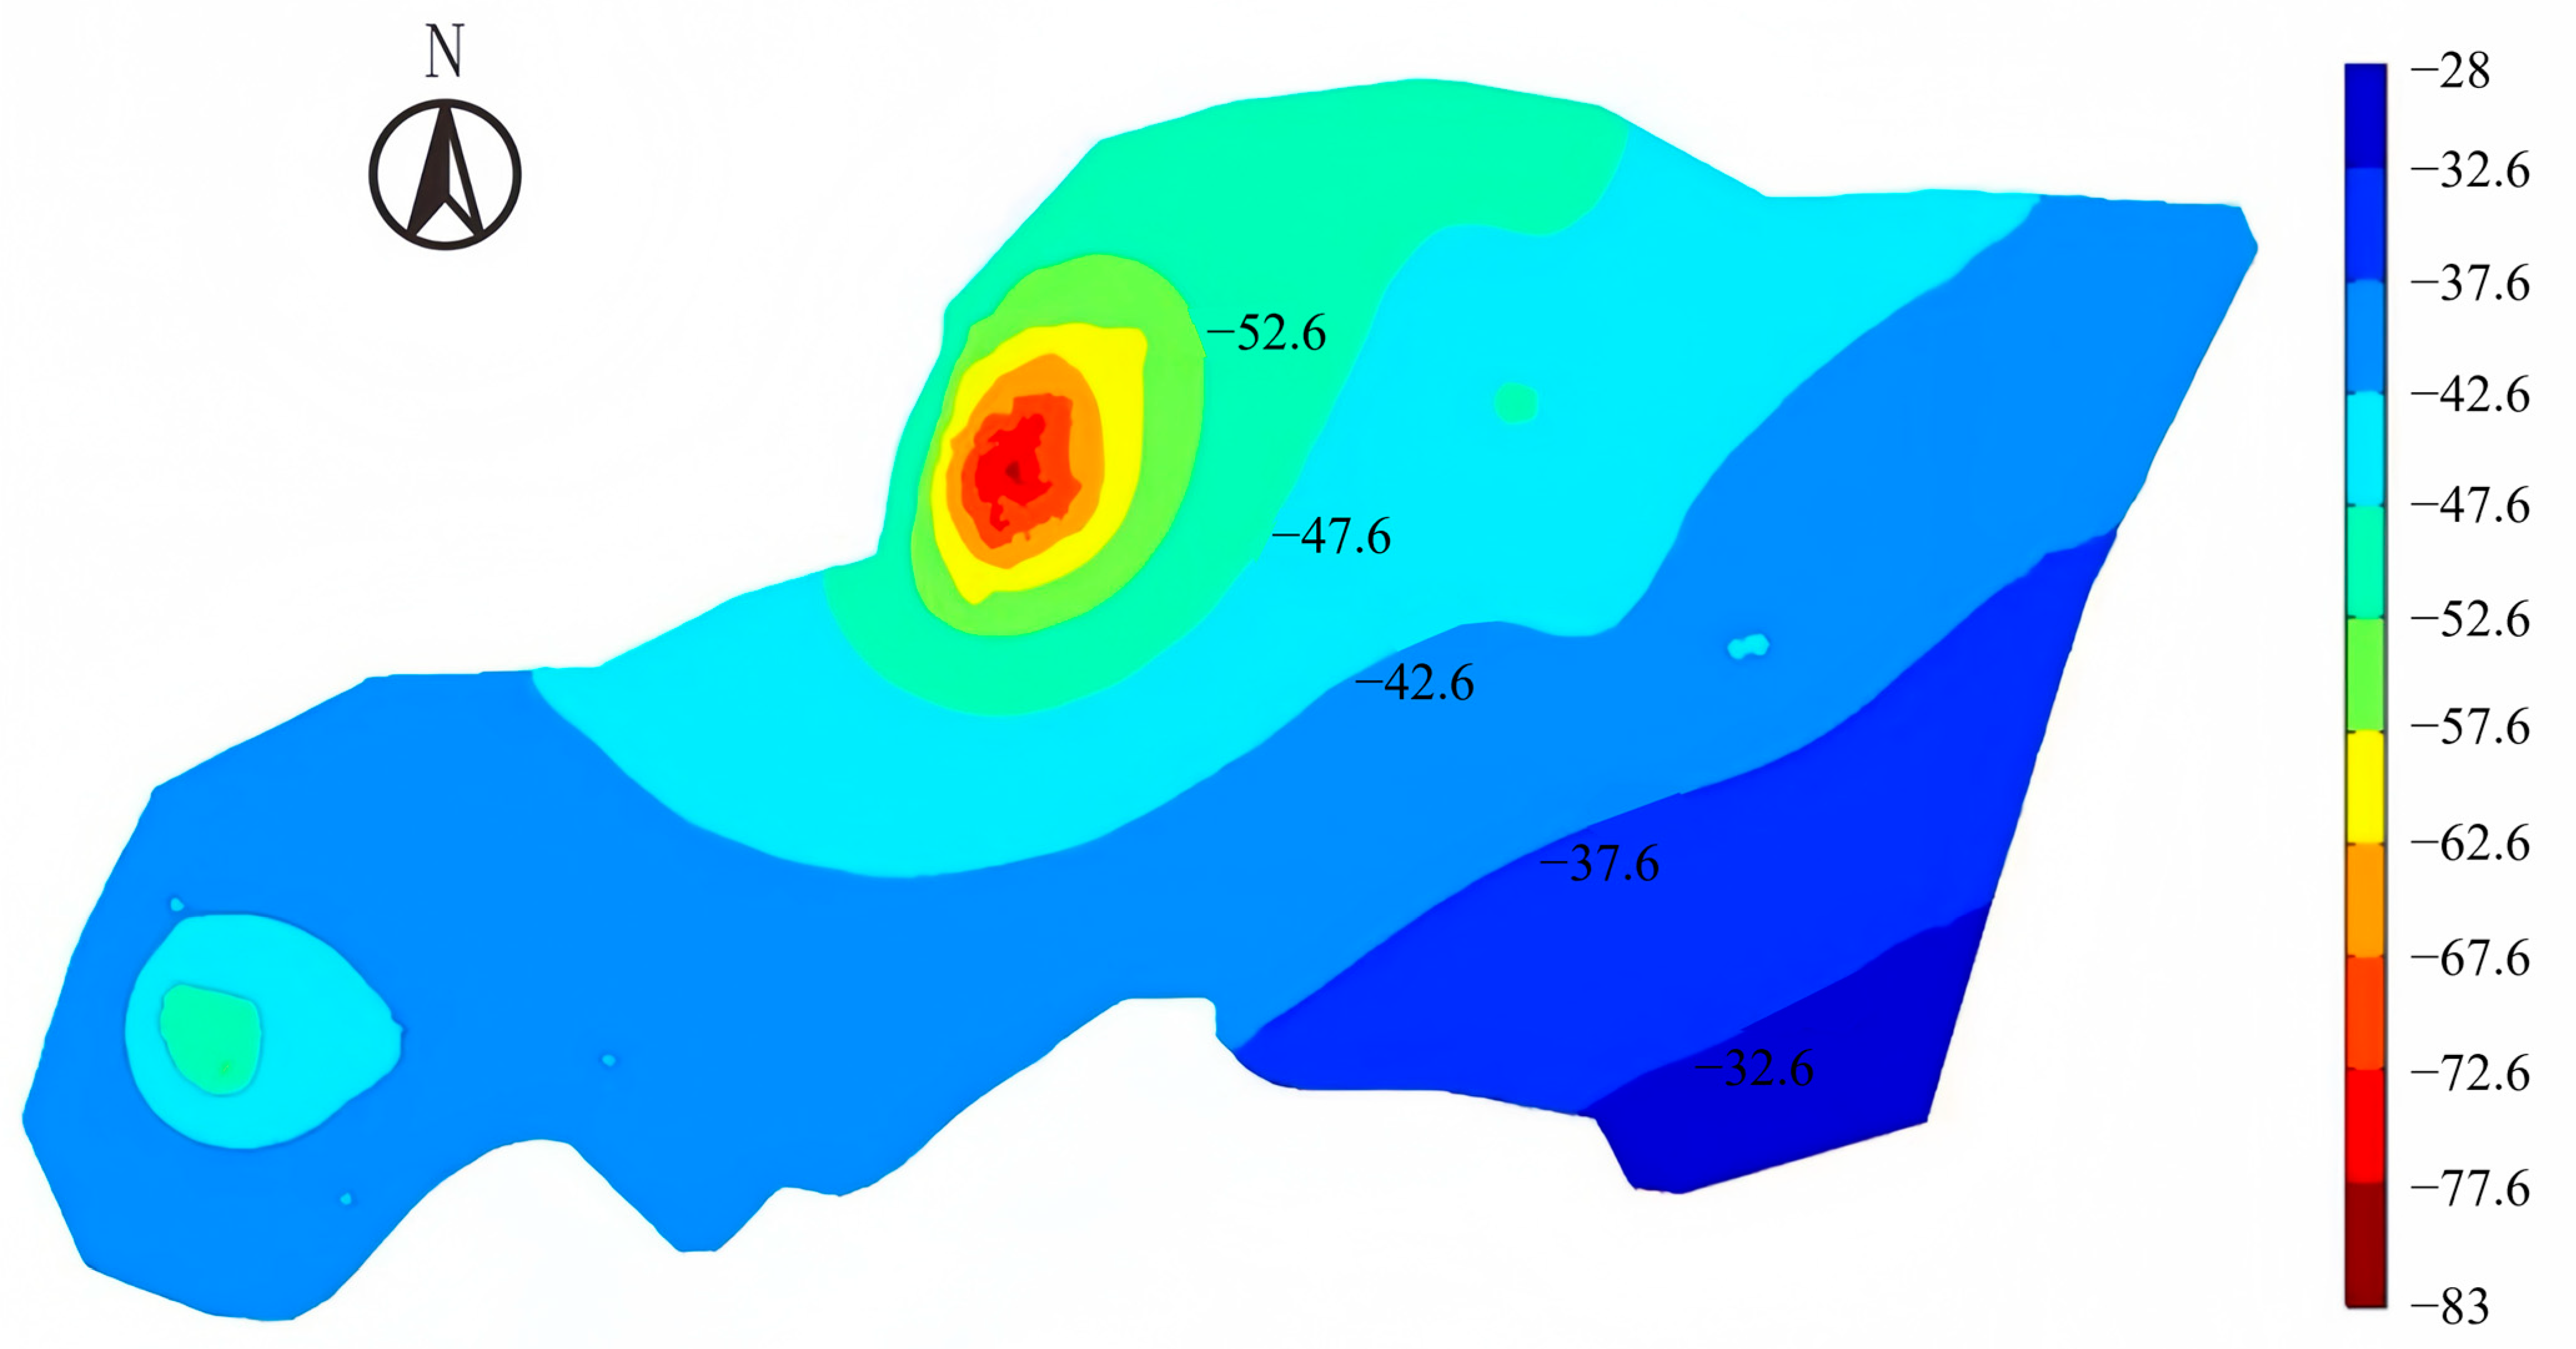
To comprehensively analyze the impact of geothermal water extraction and reinjection on the flow field of the thermal reservoir in the study area, the geothermal water flow field after ten years is predicted under current extraction and reinjection conditions, as shown in Figure 10.
Figure 10 shows that with continued geothermal water extraction and reinjection, the water level in the study area decreases year by year. The extent of the drawdown funnel in the urban area of Linqing also expands gradually, and the water level at its center continues to decline, reaching 82.6 m after ten years. In addition, new drawdown funnels form in Yandian Town and Panzhuang Town. This is mainly due to the dense distribution of production Wells in these areas and the insufficient local reinjection capacity. The geological structure is relatively homogeneous here, meaning the well distribution and extraction rates are the dominant controls on the pressure field, leading to localized over-exploitation and the formation of these secondary funnels. In contrast, the geothermal water level in the southeastern part of the study area shows little change, indicating that this area benefits from lateral reinjection from adjacent regions. This spatial imbalance suggests that future geothermal development should account for regional differences in reinjection conditions and optimize the layout of extraction and reinjection wells to mitigate the deepening of local funnels and promote overall water level stability.

3.1.2. Temperature Field Evolution

Under the condition of maintaining the current extraction and reinjection, the temperature variations in the thermal reservoir after one year are simulated and analyzed. Because reinjection wells are distributed only in the urban area of Linqing, the area shown in Figure 11 is selected for analysis. Figure 11 shows that with continued geothermal water extraction and reinjection, the low-temperature zone at the bottom of the thermal reservoir caused by reinjection tailwater gradually expands outward, and the minimum temperature decreases from 69.7 °C to 69.3 °C.
The temperature variation trends at the bottom of the thermal reservoir near the K38 and K5 production wells and their corresponding reinjection wells H14, H22 and H5 are shown in Figure 12. Although the bottom temperatures at wells K38 and K5 decrease, the magnitude of the decline is relatively small. After geothermal water extraction and reinjection begin, the bottom temperature of the thermal reservoir decreases by 5.91 °C at the H14 reinjection well, 7.66 °C at the H22 reinjection well, and 4.66 °C at the H5 reinjection well within one year. For well K5, the distance to well H5 is less than 100 m, but its reinjection volume is only 15.55 kg/s. The distance between well K38 and the nearest reinjection well is 190 m, and its reinjection volume is 28.00 kg/s. Compared with well H5, the temperatures at H14 and H22 decrease more rapidly, mainly because larger reinjection volumes of tailwater influence the bottom temperature of the thermal reservoir more significantly. This highlights that reinjection volume can be a more dominant factor in local thermal drawdown than well spacing alone in the short term.

3.2. Impacts of Reinjection Rate

3.2.1. Flow Field Response

In the numerical model, while keeping the extraction volume of geothermal wells unchanged, four reinjection schemes with reinjection rates of 0, 50%, 70%, and 100% are designed to predict the evolution of the geothermal water flow field after 10 years, as shown in Figure 13.
According to the numerical simulation results, when the geothermal water extraction volume remains constant, increasing the reinjection rate significantly reduces the rate of decline in the geothermal water level. Lower reinjection rates correspond to lower water levels, whereas higher reinjection rates gradually raise the overall water level in the study area. Under extraction volumes held constant and reinjection rates of 0, 50%, 70%, and 100%, the water level at the center of the drawdown funnel decreases by approximately 36.4 m, 27.9 m, 25.1 m, and 19.3 m, respectively, after ten years. These results indicate that increasing the reinjection rate effectively mitigates the decline of geothermal water levels in thermal reservoirs.
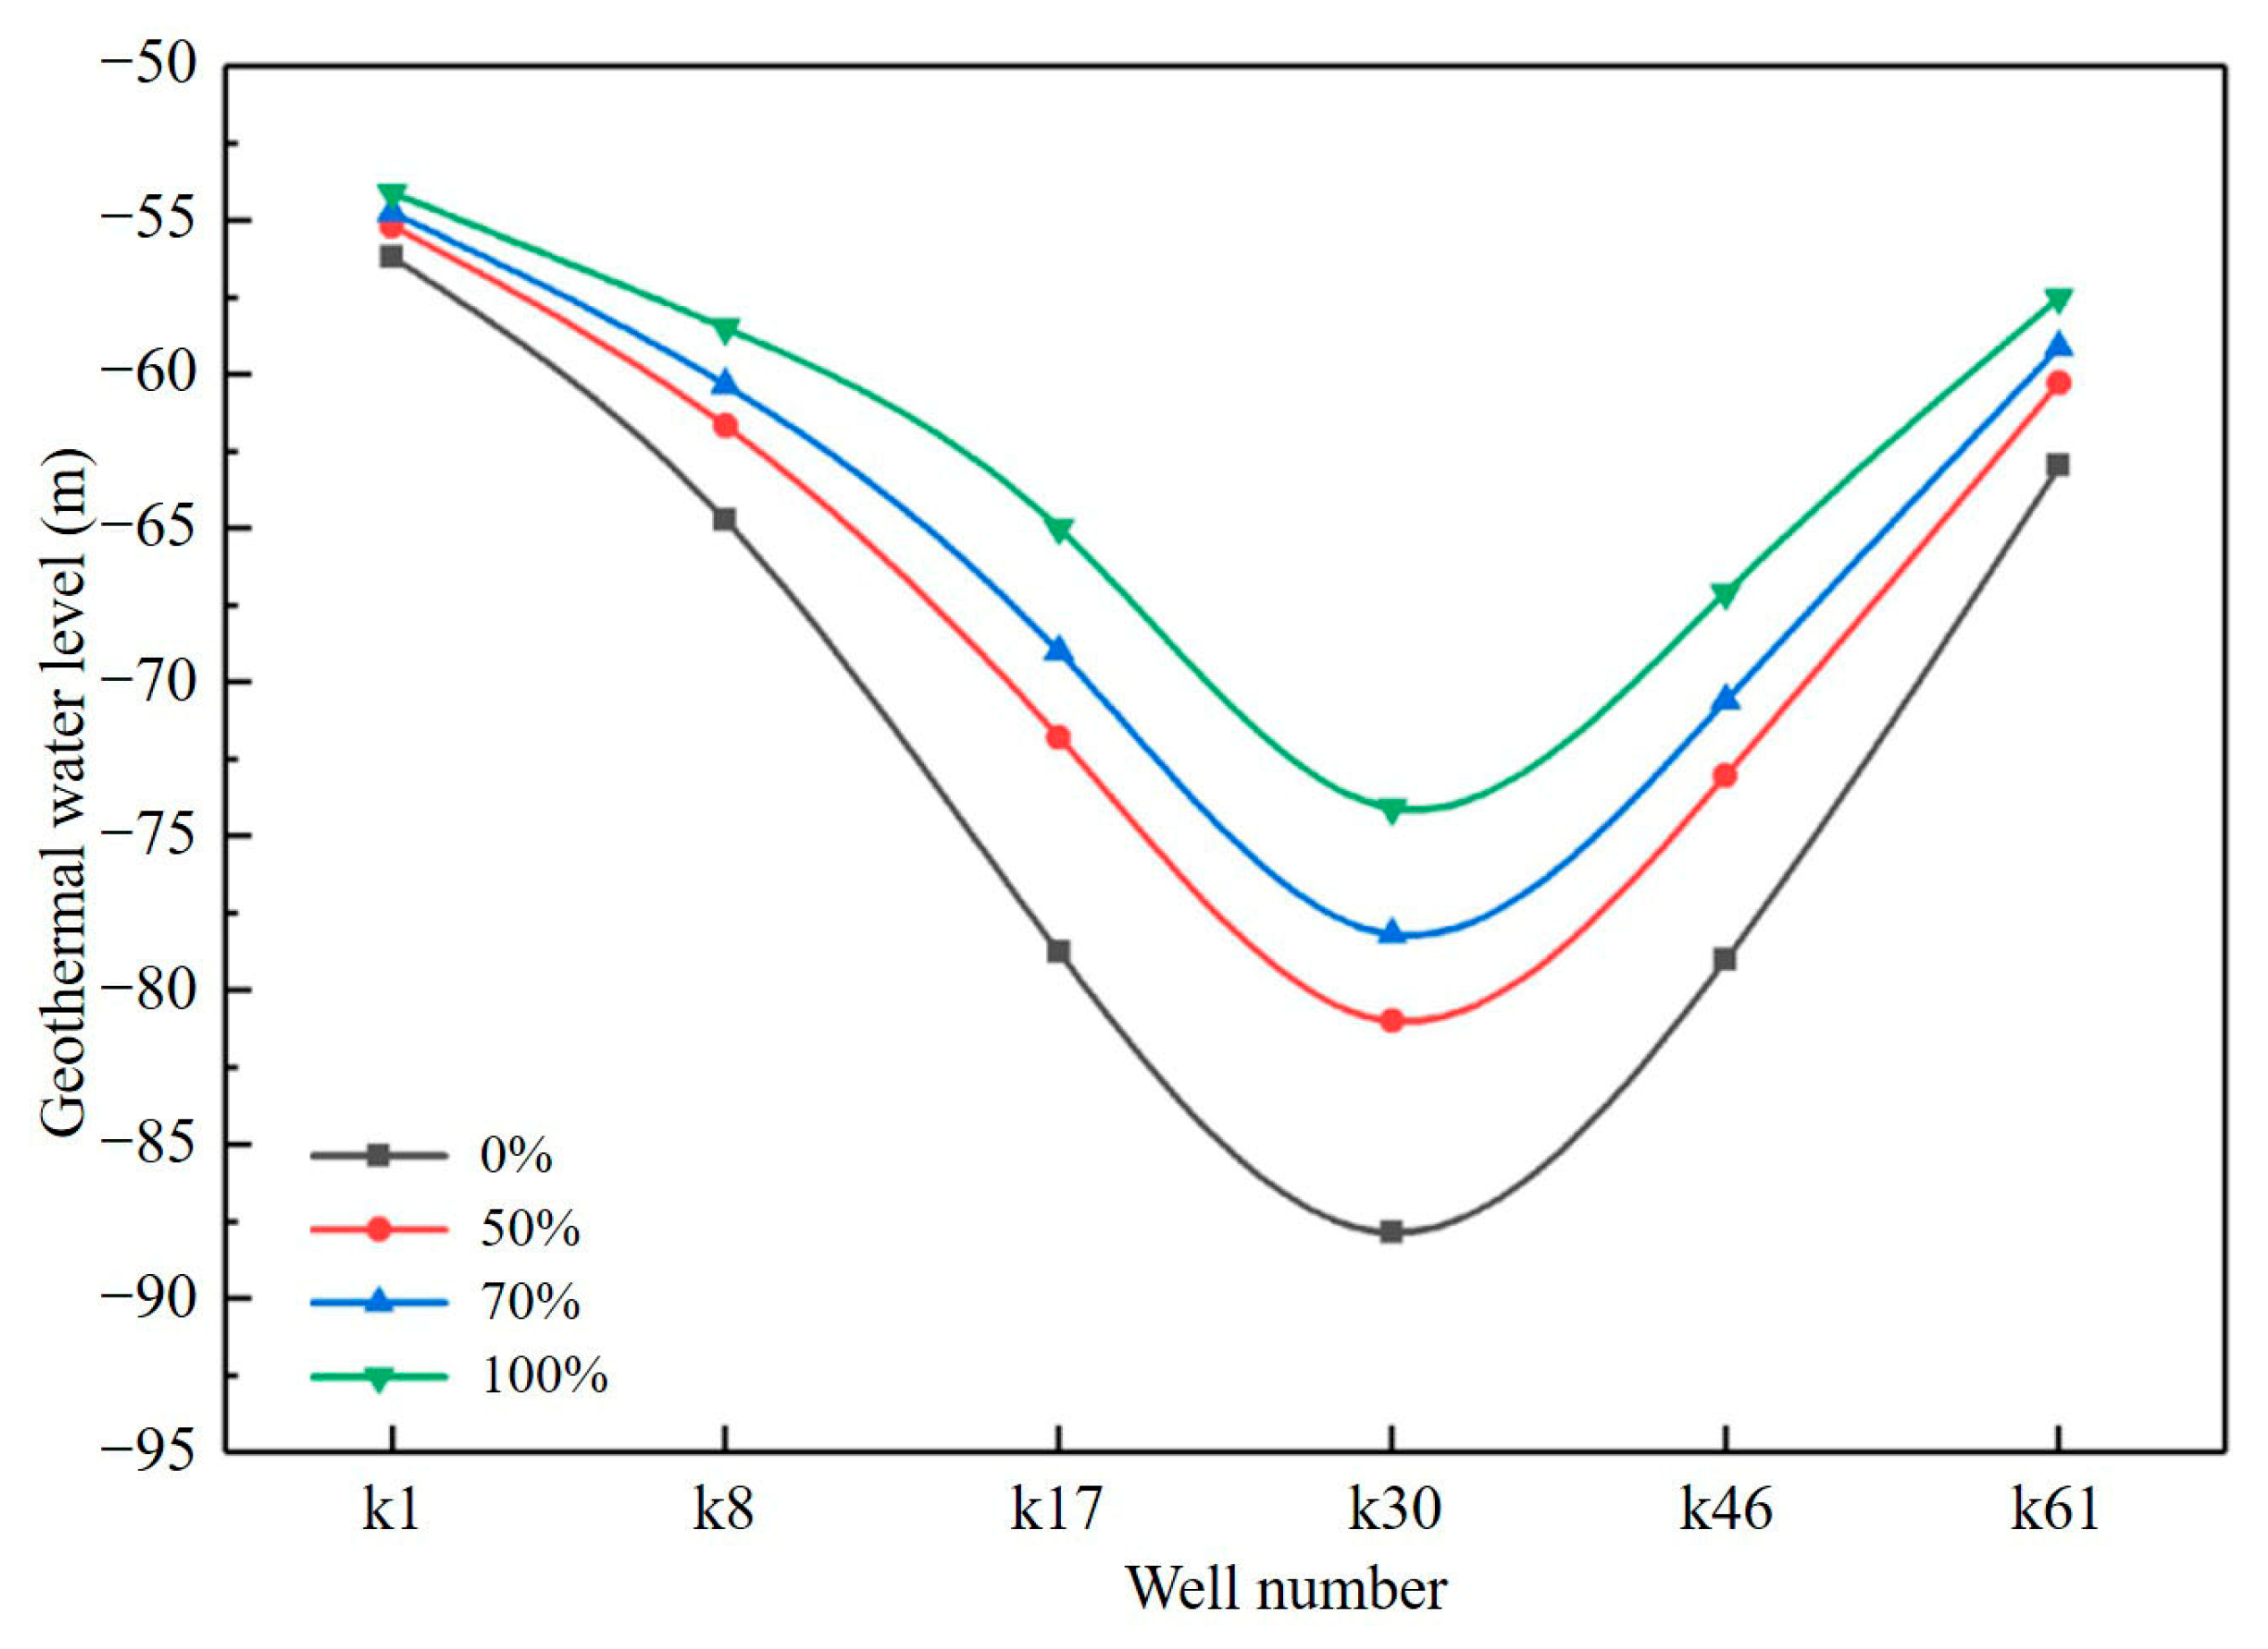
The geothermal water levels of six wells in the urban area of the study zone under different reinjection rates are shown in Figure 14. These wells are located along the A–A′ line illustrated in Figure 15. The results indicate that as the reinjection rate increases, the decline in geothermal water levels at extraction wells gradually decreases, with particularly significant effects observed at locations with initially lower water levels. When the reinjection rates are 0%, 50%, 70%, and 100%, the geothermal water levels at Well K1 are −56.16 m, −55.18 m, −54.75 m, and −54.10 m, respectively. At Well K30, the levels are −87.86 m, −80.99 m, −78.18 m, and −74.09 m, respectively.

3.2.2. Temperature Field Response

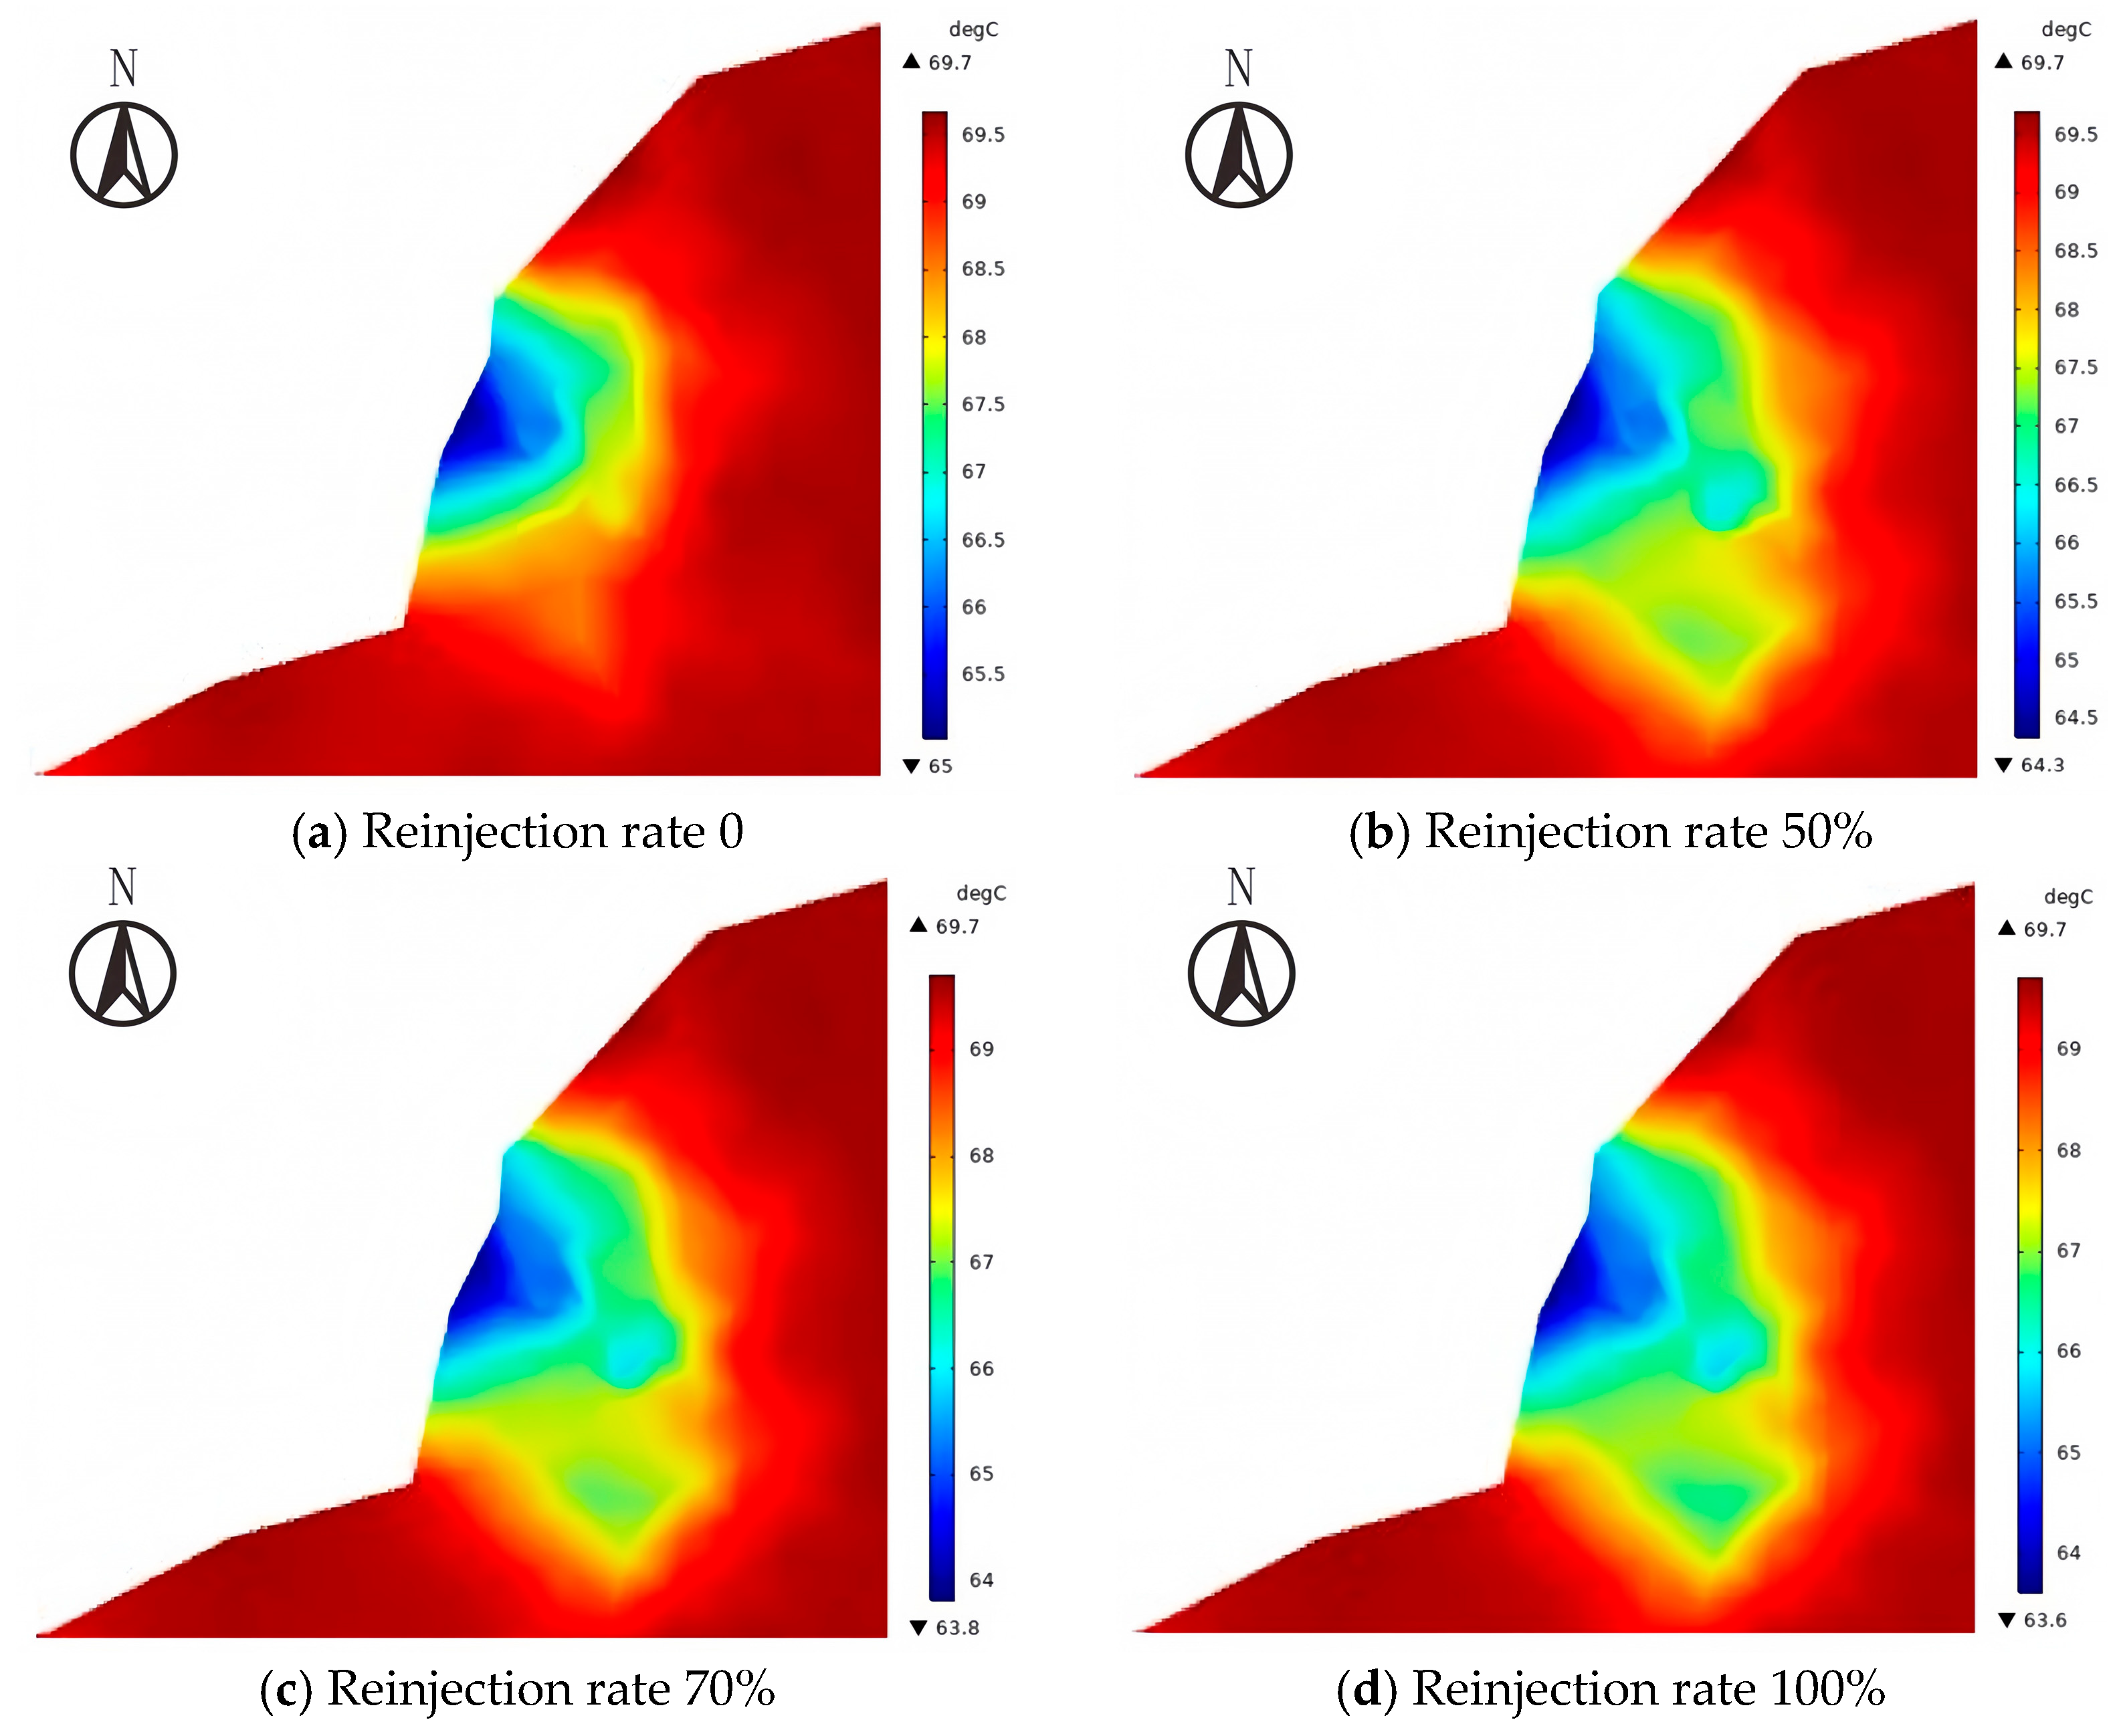
In the numerical model, the extraction volume of geothermal wells remains constant, while four reinjection schemes with rates of 0%, 50%, 70%, and 100% are established. The variation in the temperature field after 10 years is then simulated and analyzed, as shown in Figure 16.
According to the numerical simulation results, when the extraction volume of geothermal water remains constant, an increase in the reinjection rate of reinjection wells accelerates the rate of temperature decline at the bottom of the thermal reservoir. The higher the reinjection rate, the lower the minimum temperature. Under unchanged extraction conditions, when the reinjection rates are 0%, 50%, 70%, and 100%, the minimum temperatures at the bottom of the geothermal reservoir ten years later are 65.0 °C, 64.3 °C,63.8 °C, and 63.6 °C, respectively.
Based on statistical analysis of the simulation results, when the local geothermal water extraction volume remains constant and the reinjection rates are 0%, 50%, 70%, and 100%, the areas with temperatures below 66 °C are 2.24 km2, 6.72 km2, 9.02 km2, and 11.61 km2, respectively. The areas with temperatures below 68 °C are 24.36 km2, 45.91 km2, 48.23 km2, and 54.06 km2, respectively. These results indicate that as the reinjection rate increases, the extent of the temperature decline zone gradually expands.
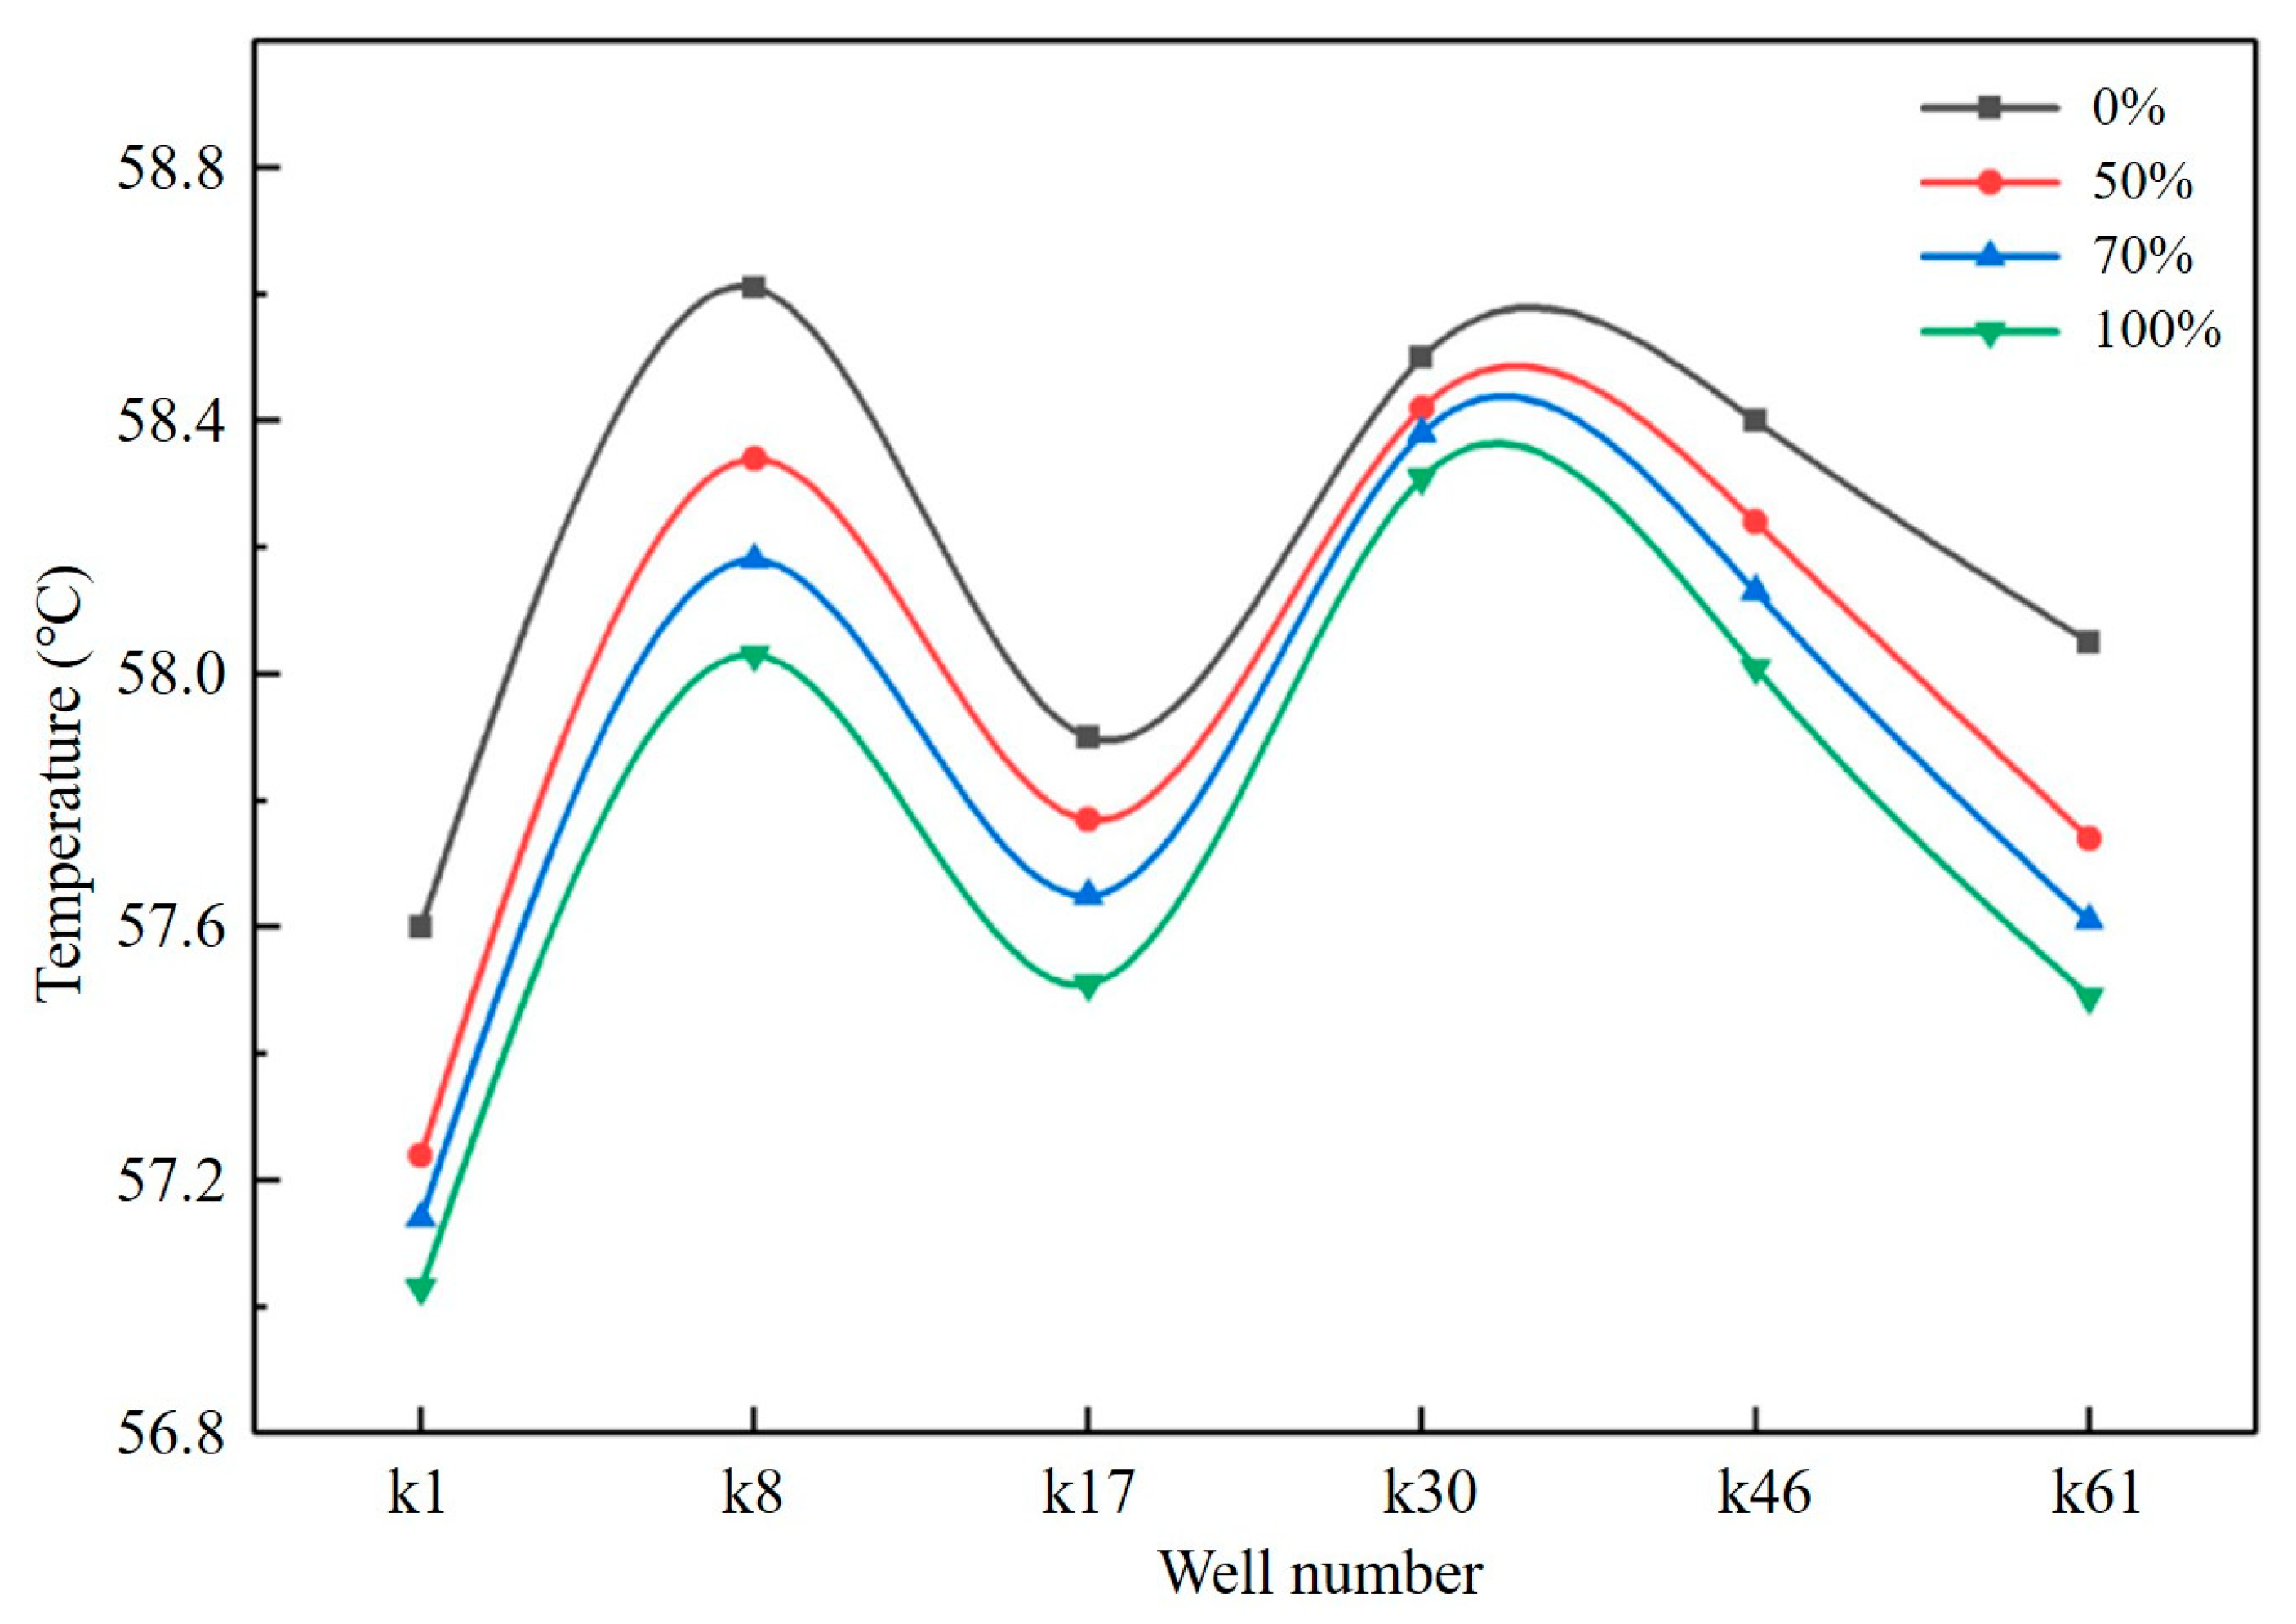
The changes in extraction temperatures of six geothermal wells (k1 to k61) in the urban area of the study zone under different reinjection rates are presented in Figure 17. As shown in the figure, the extraction temperature of geothermal water decreases progressively with higher reinjection rates. This is because a larger volume of cold reinjected water (20 °C) displaces the native hot reservoir fluid more rapidly, increasing the rate of conductive and advective cooling and reducing the effective residence time of the fluid within the reservoir. Consequently, the thermal equilibrium shifts towards lower temperatures. Due to the fact that some extraction wells are not equipped with reinjection wells, the temperature variation differs among wells under varying reinjection rates. When the reinjection rates are 0%, 50%, 70%, and 100%, the extraction temperatures at well k1 are 57.60 °C, 57.24 °C, 57.14 °C, and 57.03 °C, respectively. At well k17, the extraction temperatures are 57.90 °C, 57.77 °C, 57.65 °C, and 57.51 °C, respectively. Therefore, the 50–70% reinjection range is considered optimal because it provides a balance between maintaining reservoir pressure and minimizing thermal breakthrough. A lower reinjection rate may not sufficiently mitigate water level decline, while a higher rate accelerates cold-water intrusion, resulting in a significant temperature drop. This balance ensures that the geothermal system remains sustainable over the long term, with stable productivity.
In conclusion, the responses of the reservoir flow field and temperature field under different reinjection rates reveal a clear trade-off. A low reinjection rate fails to effectively mitigate the continuous decline in water level, whereas an excessively high reinjection rate markedly accelerates the advance of the cooling front, leading to premature attenuation of reservoir temperature. Considering both reservoir pressure stability and thermal energy utilization efficiency, the results indicate that moderate reinjection slows the expansion of the water-level depression cone while avoiding excessive temperature loss, and thus represents a more reasonable operational strategy.

4. Discussion

This study clarifies the mechanism that controls the long-term evolution of sandstone geothermal reservoirs under different reinjection rates. The simulation results verified based on on-site monitoring data reveal a key trade-off: although reinjection is essential for maintaining reservoir pressure and preventing excessive water level drop [29], it simultaneously introduces cold water fronts, which may lead to premature thermal breakouts [30]. Our research results quantitatively indicate that this trade-off is highly sensitive to the reinjection rate.
As analyzed in Section 3.2.1 and Section 3.2.2, increasing the reinjection rate from 0% to 100% within 10 years can significantly alleviate the decline in the water level at the center of the funnel. However, this enhanced the cooling of the reservoir, with the minimum temperature dropping from 65.0 °C to 63.6 °C, and the area with a temperature below 66 °C expanding from 2.24 km2 to 11.61 km2. A reinjection rate of 50–70% seems to be the optimal reinjection rate range for the Linqing system. While providing significant pressure support, the heat drop rate remains at a controllable level, which is consistent with the engineering principle of “pressure support—thermal equilibrium” advocated by other sedimentary basins.
From a spatial perspective, local subsidence funnels have emerged in areas such as Yandian Town and Panzhuang Town, which is the consequence of uneven distribution of production wells and insufficient local reinjection capacity. This model indicates that an evenly distributed layout of production wells, rather than local high-density production, is crucial for sustainable management. The water level variation in the southeast of the study area is limited, indicating favorable lateral recharge that can be utilized in future well site selection. Optimizing the spatial configuration of production wells and reinjection wells may promote lateral pressure support to the main production area by increasing reinjection in the peripheral areas, which may be an effective strategy to alleviate local overdevelopment [31].
Although this study has achieved some results, there are still some limitations. Firstly, this study does not take into account geochemical interactions such as mineral precipitation, scaling or dissolution, which might gradually alter the porosity and permeability of the reservoir. During long-term operation, these processes may reduce the injection rate or change the thermal conductivity, thereby underestimating the long-term thermal and hydraulic responses. Although this study focuses on THM coupling, future work should incorporate thermal-hydraulic-mechanical-chemical (THMC) coupling to better predict the long-term sustainability of the reservoir after reinjection. In addition, the introduction of non-uniform thermal conductivity and permeability model can significantly improve the accuracy of geothermal system simulation. A concurrent sensitivity analysis would be essential to identify which parameters, amidst this heterogeneity, exert the dominant control on system behavior. In the future, research should focus on addressing these limitations collectively to advance the predictive capability for geothermal reservoir management.

5. Conclusions

Based on the sandstone geothermal field in Linqing City, Shandong Province, this study establishes and validates a 3D TMH multi-field coupling numerical model and systematically analyzes the long-term evolution of geothermal water levels and temperature fields under different reinjection rates. The main conclusions are as follows:
(1)
Under current conditions, a pronounced geothermal water-level depression funnel has developed in the urban area of Linqing. The water level declines by approximately 7.4 m within one year and by 32.7 m at the center of the funnel within ten years, while the affected area gradually expands. Without effective reinjection, the reservoir experiences continuous pressure attenuation, which threatens the long-term stability of the system.
(2)
The reinjection rate exerts opposite effects on the flow field and the temperature field. When the reinjection rate increases from 0% to 100%, the water-level decline at the center of the depression funnel slows from 36.4 m to 19.3 m over a ten-year period. However, the minimum reservoir temperature decreases from 65.0 °C to 63.6 °C, and the extent of the low-temperature zone expands from 2.24 km2 to 11.61 km2.
(3)
Over a ten-year forecast period, moderate reinjection maintains reservoir pressure stability and delays water-level decline while preventing rapid thermal breakthrough, making it a relatively reasonable operational strategy.
Overall, this study underscores the importance of multi-field coupled simulations in revealing the long-term evolution of geothermal systems and in formulating effective management strategies, thereby providing a theoretical and technical foundation for the clean, efficient, and sustainable development of geothermal resources. The results can support local authorities in developing sustainable extraction and reinjection regulations, optimizing well spacing, and improving long-term geothermal resource utilization efficiency in Linqing and similar regions.

Author Contributions

Conceptualization, Z.L. and X.D.; methodology, Y.H. and P.Q.; software, H.L. and B.L.; validation, P.D.; resources, C.J.; formal analysis, Z.L. and H.L.; investigation, S.L.; data curation, X.D.; writing—original draft preparation, H.L.; writing—review and editing, C.J. and P.D.; project administration, S.L.; funding acquisition, P.D. All authors have read and agreed to the published version of the manuscript.

Funding

This research was funded by Geological exploration project of Department of Natural Resources of Shandong Province (Lu Kan Zi [2024] No. 12), Ningxia Natural Science Foundation of China (No. 2024AAC05027).

Institutional Review Board Statement

Not applicable.

Informed Consent Statement

Not applicable.

Data Availability Statement

The research data can be provided upon request to the corresponding author.

Conflicts of Interest

The authors declare no conflicts of interest.

References

  1. Anderson, A.; Rezaie, B. Geothermal Technology: Trends and Potential Role in a Sustainable Future. Appl. Energy 2019, 248, 18–34. [Google Scholar] [CrossRef]
  2. Zheng, T.; Axelsson, G.; Kang, F.; Zhao, J.; Zhang, P.; Bai, T.; Yang, X.; Zhou, Q.; Luo, Y. Sustainable Geothermal Yield through Effective Reinjection: Reservoir Engineering Case Study of the Dezhou Sandstone Geothermal Reservoir, North Shandong Plain, China. Geotherm. Energy 2025, 13, 36. [Google Scholar] [CrossRef]
  3. Li, X.; Chen, Z.; Huang, L.; Li, B.; Yan, J.; Zhang, P.; Liu, Z. Life Cycle Dynamic Formation Temperature Response and Thermal Energy Extraction of Mine Geothermal System Considering Groundwater Flow. Int. J. Min. Sci. Technol. 2025, 35, 1–17. [Google Scholar] [CrossRef]
  4. Wu, D.; Kong, L.; Kong, G.; Fang, J.; Wang, C.; Wang, Y. Thermo-Mechanical Behavior of an Energy Retaining Pile for Geothermal Extraction. Geomech. Energy Environ. 2024, 40, 100587. [Google Scholar] [CrossRef]
  5. Wu, X.; Li, Y.; Li, T.; Tang, C. Numerical Investigation of Heat Extraction Performance Affected by Stimulated Reservoir Volume and Permeability Evolution in the Enhanced Geothermal System. Appl. Therm. Eng. 2024, 250, 123515. [Google Scholar] [CrossRef]
  6. Pruess, K. The TOUGH Codes—A Family of Simulation Tools for Multiphase Flow and Transport Processes in Permeable Media. Vadose Zone J. 2004, 3, 738–746. [Google Scholar] [CrossRef]
  7. Xu, T.; Sonnenthal, E.; Spycher, N.; Pruess, K. TOUGHREACT—A Simulation Program for Non-Isothermal Multiphase Reactive Geochemical Transport in Variably Saturated Geologic Media: Applications to Geothermal Injectivity and CO2 Geological Sequestration. Comput. Geosci. 2006, 32, 145–165. [Google Scholar] [CrossRef]
  8. Liu, S.; Yan, Y.; Zhang, L.; Song, W.; Feng, Y.; Feng, G.; Chen, J. Study on Reasonable Well Spacing for Geothermal Development of Sandstone Geothermal Reservoir—A Case Study of Dezhou, Shandong Province, China. Energies 2025, 18, 4149. [Google Scholar] [CrossRef]
  9. Rutqvist, J. Status of the TOUGH-FLAC Simulator and Recent Applications Related to Coupled Fluid Flow and Crustal Deformations. Comput. Geosci. 2011, 37, 739–750. [Google Scholar] [CrossRef]
  10. Kolditz, O. Thermo-Hydro-Mechanical-Chemical Processes in Porous Media; Springer: Berlin/Heidelberg, Germany, 2012. [Google Scholar]
  11. Wang, B.; Zhao, Y.; Cai, Y.; Zhang, S.; Yang, B.; Liu, F. Feasibility Research on Surface Water Reinjection into the Sandstone Geothermal Reservoir of the Guantao Formation in Tianjin Based on Laboratory Experiments. Water 2024, 16, 2475. [Google Scholar] [CrossRef]
  12. Shi, H.; Wang, G.; Lu, C. Numerical Investigation on Delaying Thermal Breakthrough by Regulating Reinjection Fluid Path in Multi-Aquifer Geothermal System. Appl. Therm. Eng. 2022, 221, 119692. [Google Scholar] [CrossRef]
  13. Wang, Y.; Liu, Y.; Bian, K.; Zhang, H.; Wang, X.; Zhang, H.; Wang, W.; Qin, S. Influence of Low Temperature Tail Water Reinjection on Seepage and Heat Transfer of Carbonate Reservoirs. Energy Explor. Exploit. 2021, 39, 2062–2079. [Google Scholar] [CrossRef]
  14. Cao, Q.; Fang, C.; Li, Y.; Wang, H.; Fang, Q.; Shi, X. Development Status of Geothermal Reinjection at Home and Abroad and Its Enlightenment. Oil Drill. Prod. Technol. 2021, 43, 203–211. [Google Scholar] [CrossRef]
  15. Xia, Y.; Wang, B.; Zhang, F.; Jia, Z. Optimization and Transformation of Water Treatment Technology for Surface Water Reinjection into Geothermal Reservoir in Dongli Lake Area of Tianjin. Energy Rep. 2023, 9, 25–29. [Google Scholar] [CrossRef]
  16. Xu, Z.; Zhou, X.; Chen, R.; Shen, Y.; Shang, Z.; Hai, K. Numerical Simulation of Deep Thermal Groundwater Exploitation in the Beijing Plain Area. Water 2019, 11, 1494. [Google Scholar] [CrossRef]
  17. Ganguly, S.; Tan, L.; Date, A.; Kumar, M.S.M. Effect of Heat Loss in a Geothermal Reservoir. Energy Procedia 2017, 110, 77–82. [Google Scholar] [CrossRef]
  18. Sato, K.; Firoozabadi, A. Prediction of Thermal Front Movement in Geothermal Reservoirs Containing Distributed Natural Fractures. Geoenergy Sci. Eng. 2024, 236, 212763. [Google Scholar] [CrossRef]
  19. Zhao, W.; Liu, L.; Li, J.; Shi, Z.; Cheng, Z.; Jing, T.; Yin, Y.; Zhu, M. Reinjection Modeling in Sandstone Geothermal Reservoirs: A Case Study of Dezhou Geothermal Heating Demonstration Project. Nat. Gas Ind. B 2024, 11, 106–120. [Google Scholar] [CrossRef]
  20. Memon, A.R.; Makauskas, P.; Kaminskaitė-Baranauskienė, I.; Pal, M. Repurposing Depleted Hydrocarbon Reservoirs for Geothermal Energy: A Case Study of the Vilkyčiai Cambrian Sandstone in Lithuania. Energy Rep. 2025, 14, 243–253. [Google Scholar] [CrossRef]
  21. Axelsson, G. Sustainable Geothermal Utilization—Case Histories; Definitions; Research Issues and Modelling. Geothermics 2010, 39, 283–291. [Google Scholar] [CrossRef]
  22. Biot, M.A. General Theory of Three-Dimensional Consolidation. J. Appl. Phys. 1941, 12, 155–164. [Google Scholar] [CrossRef]
  23. Nield, D.A.; Bejan, A. Convection in Porous Media; Springer: Cham, Switzerland, 2017. [Google Scholar]
  24. Song, X.; Shi, Y.; Li, G.; Yang, R.; Wang, G.; Zheng, R.; Li, J.; Lyu, Z. Numerical Simulation of Heat Extraction Performance in Enhanced Geothermal System with Multilateral Wells. Appl. Energy 2018, 218, 325–337. [Google Scholar] [CrossRef]
  25. Liu, D.; Yang, X.; Han, L.; Jia, C.; Qi, S.; Wang, H.; Yang, S. Research on the Changes of Sandstone Thermal Storage RechargeCharacteristics Based on Time Series Parameters Analysis:A Case Studyof Linging City in Shandong Province. Geol. Explor. 2024, 60, 610–621. [Google Scholar]
  26. Wang, K.; Yang, D.; Song, X.; Liu, P.; Ma, X. Chemical Characteristics and Encrustment and Erosion of Geothermawater in the Guantao Formation in Linging. Hydrogeol. Eng. Geol. 2010, 37, 130–134. [Google Scholar]
  27. Yang, X.; Yao, Y.; Jia, C.; Yang, T. Spatiotemporal Prediction of Land Subsidence and Its Response Patterns to Different Aquifers in Coastal Areas. Ocean Coast. Manag. 2024, 253, 107148. [Google Scholar] [CrossRef]
  28. Dong, X.; Liu, H.; Wei, R.; Liu, L.; Jia, C.; Sun, H.; Chu, W. A Hybrid Physics-Constrained Interpretable Machine Learning Framework for Stability Assessment of Natural Gas Hydrate-Bearing Submarine Slopes. Eng. Anal. Bound. Elem. 2025, 179, 106371. [Google Scholar] [CrossRef]
  29. Lesmana, A.; Pratama, H.B.; Ashat, A.; Saptadji, N.M. Sustainability of Geothermal Development Strategy Using a Numerical Reservoir Modeling: A Case Study of Tompaso Geothermal Field. Geothermics 2021, 96, 102170. [Google Scholar] [CrossRef]
  30. Kaya, E.; Zarrouk, S.J.; O’Sullivan, M.J. Reinjection in Geothermal Fields: A Review of Worldwide Experience. Renew. Sustain. Energy Rev. 2011, 15, 47–68. [Google Scholar] [CrossRef]
  31. Zinsalo, J.M.; Lamarche, L.; Raymond, J. Design and Optimization of Multiple Wells Layout for Electricity Generation in a Multi-Fracture Enhanced Geothermal System. Sustain. Energy Technol. Assess. 2021, 47, 101365. [Google Scholar] [CrossRef]
Figure 1. Geological profile of the study area under longitudinal stretching.
Sustainability 17 09646 g001
Figure 2. THM coupling numerical model of the study area.
Sustainability 17 09646 g002
Figure 3. The initial flow field diagram obtained from the geothermal water level monitoring data.
Sustainability 17 09646 g003
Figure 4. Comparison of the fitting results of the simulated and monitored values of the geothermal water level.
Sustainability 17 09646 g004
Figure 5. Comparison of dynamic monitoring values and simulated values of geothermal water levels at CG01 and CG09 monitoring points.
Sustainability 17 09646 g005
Figure 6. Initial temperature field of the numerical model.
Sustainability 17 09646 g006
Figure 7. Comparison of the monitored temperature values of the geothermal well with the simulated values.
Sustainability 17 09646 g007
Figure 8. Error diagram of mining temperature at monitoring points.
Sustainability 17 09646 g008
Figure 9. Distribution map of geothermal water flow field after 1a (Unit: m).
Sustainability 17 09646 g009
Figure 10. Distribution map of geothermal water flow field after 10a (Unit: m).
Sustainability 17 09646 g010
Figure 11. Temperature variation diagram at the bottom of the thermal reservoir after 1a (°C). The dashed line represents the boundary of the area analyzed, and the arrow indicates the direction pointing to the simulation results.
Sustainability 17 09646 g011
Figure 12. Diagrams of temperature changes at the bottom of thermal reservoirs in different extraction wells during the 1a period.
Sustainability 17 09646 g012
Figure 13. Distribution maps of geothermal water flow fields after 10 years under reinjection rates of 0%, 50%, 70%, and 100% (Unit: m).
Sustainability 17 09646 g013aSustainability 17 09646 g013b
Figure 14. Geothermal water level variation diagrams of different wells under different reinjection rates.
Sustainability 17 09646 g014
Figure 15. Distribution map of geothermal well locations.
Sustainability 17 09646 g015
Figure 16. Distribution map of the temperature field of the hot reservoir after 10 years under different reinjection conditions.
Sustainability 17 09646 g016
Figure 17. Production temperature variation diagrams in different wells at different reinjection rates.
Sustainability 17 09646 g017
Table 1. Physical and mechanical parameters of layers.
StratumElastic Modulus
(MPa)
Density
(Kg/m3)
PoissonPorosityPermeability (m2)Thermal Conductivity (W/(M·k))Constant Pressure Heat Capacity (J/(Kg·K))Coefficient of Thermal Expansion (1/K)
Q801.97–2.020.22–0.250.28–0.374.79 × 10−15–1.61 × 10−141.03–1.35820–8701.0 × 10−5
N21801.99–2.200.31–0.400.114–0.2366.3 × 10−14–7.2 × 10−141.48–1.77820–9001.3 × 10−5
N13501.88–2.180.30–0.350.148–0.3502.3 × 10−14–4.53 × 10−131.74–1.91850–9488.5 × 10−6
E33702.03–2.220.30–0.330.132–0.3101.4 × 10−14–3.80 × 10−131.80–1.91850–9507.1 × 10−6
Note: The parameter ranges presented in this table are synthesized from regional geological survey reports and core sample laboratory tests.
Table 2. Geothermal well mass flow rate statistics table.
Serial NumberMining Well NumberMining Location (m)Production Volume (kg/s)Corresponding to the Number of the Reinjection WellReinjection Volume (kg/s)
1K4−1475~−171421.22h1815.55
2K5−1543~−189422.22h531.1
3K6−1477~−178922.22
4K12−1359~−180230.56h621.39
5K15−1480~−170030.56h121.39
6K17−1476~−178620.30h214.21
7K20−1450~−171033.33h723.33
8K21−1450~−171032.40h822.68
9K23−1490~−170821.67h3, h97.85
10K24−1465~−188023.15h10, h118.10
11K28−1517~−170930.56h1221.39
12K37−1469~−180023.15h1316.20
13K38−1407~−172040.00h14, h2214.00
14K39−1407~−170022.22h1515.56
15K41−1409~−171021.78h1619.44
16K45−1478~−172530.56h1721.39
17K51−1481~−171030.56h421.39
18K52−1481~−171019.44h1913.61
19K53−1481~−175126.39h2018.47
20K56−1481~−171016.67h2111.67
Disclaimer/Publisher’s Note: The statements, opinions and data contained in all publications are solely those of the individual author(s) and contributor(s) and not of MDPI and/or the editor(s). MDPI and/or the editor(s) disclaim responsibility for any injury to people or property resulting from any ideas, methods, instructions or products referred to in the content.