Article

Health Conditions of ‘Veteran Trees’ and Climate Change

1
Department of Urban Planning, Landscape Architecture, Dong-A University, Busan 49315, Republic of Korea
2
Eoulim Landscape Co., Ltd., Changwon-si 51177, Republic of Korea
3
Department of Landscape Architecture, Dong-A University, Busan 49315, Republic of Korea
*
Author to whom correspondence should be addressed.
Sustainability 2025, 17(21), 9636; https://doi.org/10.3390/su17219636
Submission received: 30 September 2025 / Revised: 20 October 2025 / Accepted: 24 October 2025 / Published: 29 October 2025

Abstract

This study explores the health status of veteran Zelkova serrata trees (average age 300 years) in the Pohang region in the context of long-term climatic trends and local environmental variability. Eleven nationally designated veteran trees were monitored using physiological indicators Soil Plant Analysis Development (SPAD) values and live crown ratio (LCR), internal structural assessment (sonic tomography-derived decay ratio), and environmental parameters including meteorological records and Landsat-derived Land Surface Temperature (LST) data from 2000 to 2025. While recent years showed localized heat-extreme events, most sites displayed spatially heterogeneous yet gradually increasing LST trends, with 2024 recording the highest values at more than half the locations. Tree vitality differences were more strongly associated with site specific microclimatic conditions than with uniform long-term climate shifts: trees in cooler or less urbanized zones showed higher SPAD values and lower decay levels, whereas those in warmer, edge-influenced sites exhibited signs of physiological stress. The results indicate that rising summer surface temperature—and their interaction with atmospheric drying—intensify water-stress impacts, but the actual tree responses are modulated by local land-cover and soil stability contexts. These findings underscore the need for integrated, multi-scale assessment of veteran tree health and suggest that conservation practices should incorporate microclimate-based intervention strategies.

1. Introduction

Globally, climate change is manifesting through rising temperatures, altered precipitation patterns, and increasing frequency of extreme weather events [1]. These shifts profoundly affect the ecological structure and function of plant communities, influencing growth rhythms, physiological stress responses, and distributional ranges [2,3]. In particular, trees are long-lived, sessile organisms that are directly exposed to rapidly changing environmental conditions and are therefore highly vulnerable to cumulative stresses induced by climate change [4].
Among these, veteran trees—often several centuries old—accumulate the long-term effects of climate and environmental fluctuations and are thus regarded as key climate sentinel species within ecosystems [4,5]. In Korea, trees of considerable age and of high ecological or landscape value are designated and managed as “protected trees” by local governments. As of 2023, approximately 11,000 such protected trees have been designated nationwide, predominantly comprising culturally significant species such as Zelkova serrata, Styphnolobium japonicum, and Ginkgo biloba [6]. Frequently located at village entrances, temple sites, and along roadsides, these protected trees serve as important biological resources, cultural landscape elements, and symbols of regional identity. However, because of their low physiological resilience and weakened structural stability, veteran trees are highly susceptible to climate-induced health decline and mortality, making them a critical target for intensive management [7,8,9].
Veteran trees distributed across urban and rural landscapes provide a wide range of ecosystem services, including biodiversity conservation, carbon sequestration, and preservation of cultural landscape heritage [10]. They are also closely linked to urban climate regulation [11]. Yet, many of these trees are exposed to complex environmental pressures such as urbanization, land-cover changes, urban heat island effects, and degradation of soil physical properties. These stressors manifest as crown dieback, loss of vigor, and the occurrence of internal cavities and decay [12,13].
To assess the growth and health status of veteran trees, a variety of physiological and physical indicators are commonly used, including visual tree assessments (VTA), Soil Plant Analysis Development (SPAD), sonic tomography (SoT), soil compaction and chemical analysis, stomatal conductance, and water-use efficiency [14,15,16]. Among these, SPAD serves as a physiological indicator reflecting chlorophyll content, nitrogen accumulation, and photosynthetic efficiency. Because of its high sensitivity to climate stress, it has recently gained prominence as a key tool for assessing tree vigor [17,18].
Research on the impacts of climate change on the growth and vitality of veteran trees has been expanding, with quantitative analyses applied across diverse species and ecological settings. For example, high-altitude Pinus longaeva, temperate Eucalyptus spp., and the giant Sequoia forests are representative taxa used to evaluate sensitivity to climate stress [19,20]. These studies have advanced beyond traditional dendrochronology toward multivariate assessment frameworks that incorporate indicators such as SPAD, stomatal conductance, sonic tomography for structural integrity, and land surface temperature (LST)-based heat stress indices [19,20,21].
Research on the conservation and vitality assessment of veteran trees in urban and rural areas is also becoming increasingly sophisticated. For instance, studies on large Zelkova serrata individual trees have examined how growth environments influence photosynthetic rate, stomatal conductance, and water-use efficiency [22], while another study has applied non-destructive sonic tomography and chlorophyll/chlorophyll fluorescence indices to evaluate internal defects and vitality levels of ancient trees [23].
However, comprehensive analyses that integrate growth indicators of veteran trees with climatic and environmental factors remain very limited. In particular, studies that cross-analyze long-term climate time-series data—such as air temperature, precipitation, and LST accumulated over the past decade or more—with individual physiological and structural indicators to diagnose the climate sensitivity or growth vulnerability of veteran trees are exceedingly rare. This gap in research weakens the scientific basis for conservation strategies aimed at mitigating the impacts of extreme climatic changes on these ancient trees.
To address this limitation, this study investigates the effects of climate change—specifically, extreme temperatures and the rise in land surface temperature—on the growth and health of eleven large, eleven veteran Zelkova serrata trees, with an average age of approximately 300 years located in the southern region of the Republic of Korea. The analysis covers the period from 1997–2024. We quantitatively assessed the trees’ physiological vigor using the SPAD index, their structural condition through decay ratios determined by sonic tomography, and their site environments. These metrics were then compared with climatic datasets to answer the following research questions:
  • What are the physiological vitality and structural integrity conditions of veteran Zelkova serrata trees under different site environments within the same region?
  • How are long-term climatic variables (e.g., land surface temperature, LST; vapor pressure deficit, VPD) associated with the physiological vitality (SPAD index) and structural integrity (SoT grade, live crown ratio) of veteran trees?
  • What implications do these findings have in evaluating the climate change vulnerability of veteran trees and developing effective conservation and management strategies?
This study aims to elucidate the mechanisms by which climate change influences veteran trees by integrating detailed growth diagnostics with long-term climate data. In particular, by employing quantitative vitality indicators—such as SPAD and decay ratios—we assess the relative vulnerability of these trees, thereby providing practical evidence for future urban green-space policy and climate-adaptive tree management. Furthermore, the results underscore the urgent need to conserve veteran trees as key components of ecosystems.

2. Materials and Methods

2.1. Study Scope and Area

This study focused on Zelkova serrata (Thunb.) Makino trees located in Pohang City, Gyeongsangbuk-do, Republic of Korea. Zelkova serrata represents the largest proportion (52.3%) of all legally designated protected trees in Korea and is widely planted as pavilion trees, park trees, and street trees. Owing to its high ecological and cultural significance, it is recognized as a valuable natural asset [7,24]. Among the 32 Zelkova serrata trees designated as protected in Pohang City, eleven large veteran individuals, each with an average age exceeding 300 years, were selected for a comparative analysis of their growth conditions, site environments, and the effects of climate change (Figure 1). The age of each tree was determined based on the age recorded at the time of its designation as a protected tree, and subsequently adjusted to 2025 by adding the elapsed years since the designation. Field investigations were conducted from September 2024 to July 2025.

2.2. Research Method

2.2.1. Research Framework

This study investigated the growth status of trees and the effects of climate change by focusing on eleven Zelkova serrata individuals in Pohang City, Gyeongsangbuk-do, Republic of Korea, each with an average age of over 300 years. The overall research framework is illustrated in Figure 2.
First, to evaluate the growth status of the trees, measurements and analyses were conducted across three dimensions: physiological vigor, structural stability, and the presence of internal defects such as cavities and decay.
Second, the growth environments of the trees were assessed by analyzing site and surrounding environmental conditions, land-use patterns, and the physical and chemical properties of soils.
Third, to identify the relationships between tree health and climatic factors, long-term trends in key climate variables from 1997 to 2024 and the spatial distribution characteristics of LST were comprehensively examined.
Finally, all analytical results were integrated to compare and evaluate the growth vulnerability and climate sensitivity of the veteran trees, thereby providing insights for the development of future conservation and management strategies.

2.2.2. Diagnosis of Tree Growth Status

(1)
Growth Status of Trees
The growth status of the surveyed trees was evaluated through measurements of basic growth parameters and an assessment of physiological vigor. Basic growth parameters included tree height, diameter at breast height (DBH), and crown width. Tree height was measured using a SUUNTO Height Meter and DBH was determined at 1.3 m above ground level. Crown width was calculated as the average of measurements taken along the east–west and north–south directions.
Physiological vigor was assessed by measuring the chlorophyll content index (SPAD). SPAD values were obtained using a SPAD-502Plus device (Konica Minolta). For each tree, ten readings were taken at two-thirds of the distance from the base to the top of the leaf blade, and the mean value was used for analysis. It should be noted that SPAD-502Plus measurements are in site and may vary with environmental and leaf conditions, providing relative rather than absolute estimates of chlorophyll content.
(2)
Visual Tree Assessment (VTA)
To diagnose the structural stability of the trees, a visual tree assessment (VTA) was applied. VTA is a visual inspection technique that analyzes the potential for structural defects based on observable growth responses and external morphology of trees. It evaluates physical elements that can be visually identified—such as branch attachment condition, stem decay, and trunk inclination—thereby providing an assessment of possible structural weaknesses [25].
In this study, the evaluation was conducted following the guidelines of the Risk Management Manual for Natural Monument Veteran Trees [26] (Table 1). This manual integrates international standards, including the American ANSI A300 (Supplemental Support Systems), the ISA Best Management Practices, and the British Standard BS 3998:2010 (Tree Work Recommendations), to provide an assessment framework specifically tailored for veteran trees.
The evaluation comprised five indicators: stem tapering, proportion of live crown, branch attachment strength, branch angle, and trunk inclination. For quantification, high-resolution photographs were taken while maintaining a horizontal reference using a staff positioned at a fixed distance of approximately 5 m from each tree. These photographs were subsequently analyzed to measure each indicator.
The main evaluation indicators are as follows:
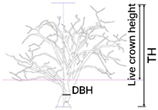
  • Tapering—The ratio of tree height to diameter at breast height (DBH); a value greater than 60 indicates a high level of structural instability [27].
  • Live Crown Ratio—The proportion of the live crown height to the total tree height; a ratio ≥ 0.6 is considered safe, whereas a ratio < 0.2 is evaluated as vulnerable.
  • Branch Attachment Strength—The ratio of branch diameter to stem diameter; a value ≥ 0.75 is regarded as having a high risk of structural failure.
  • Branch Crotch Angle—The angle between the branch and the stem; when the angle is <30°, the risk is considered high, and narrow V-shaped crotches are prone to splitting during strong winds of heavy snowfall.
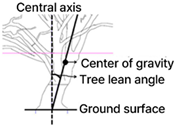
  • Stem Lean—The angle between the vertical ground line and the centerline of the trunk; a lean greater than 20° is considered to present a high risk [28,29].
(3)
Sonic Tomography (SoT)
Because Visual Tree Assessment (VTA) alone has limitations in diagnosing the structural stability of trees, non-destructive sonic tomography (SoT) was employed to detect internal decay and cavities within the stems. SoT is a technique that visualizes the distribution of sound velocity in a two-dimensional image based on the travel time of acoustic waves passing through the wood. The method relies on the principle that acoustic wave speed varies according to the modulus of elasticity and density of the wood [24]. Areas affected by decay of cavities typically exhibit lower density and elasticity, resulting in slower sound transmission. By generating cross-sectional images of the stem, this technique allows for intuitive identification of the location and extent of internal defects.
In this study, a PiCUS 3 Sonic Tomography (Argus Electronic GmbH, Rostock, Germany) was used. Sensors were evenly placed around the tree circumference to measure the transmission speed of acoustic waves (Figure 3). Based on the measured data, a two-dimensional sonic tomogram of sound velocity distribution was produced and interpreted to determine the presence and degree of internal defects.
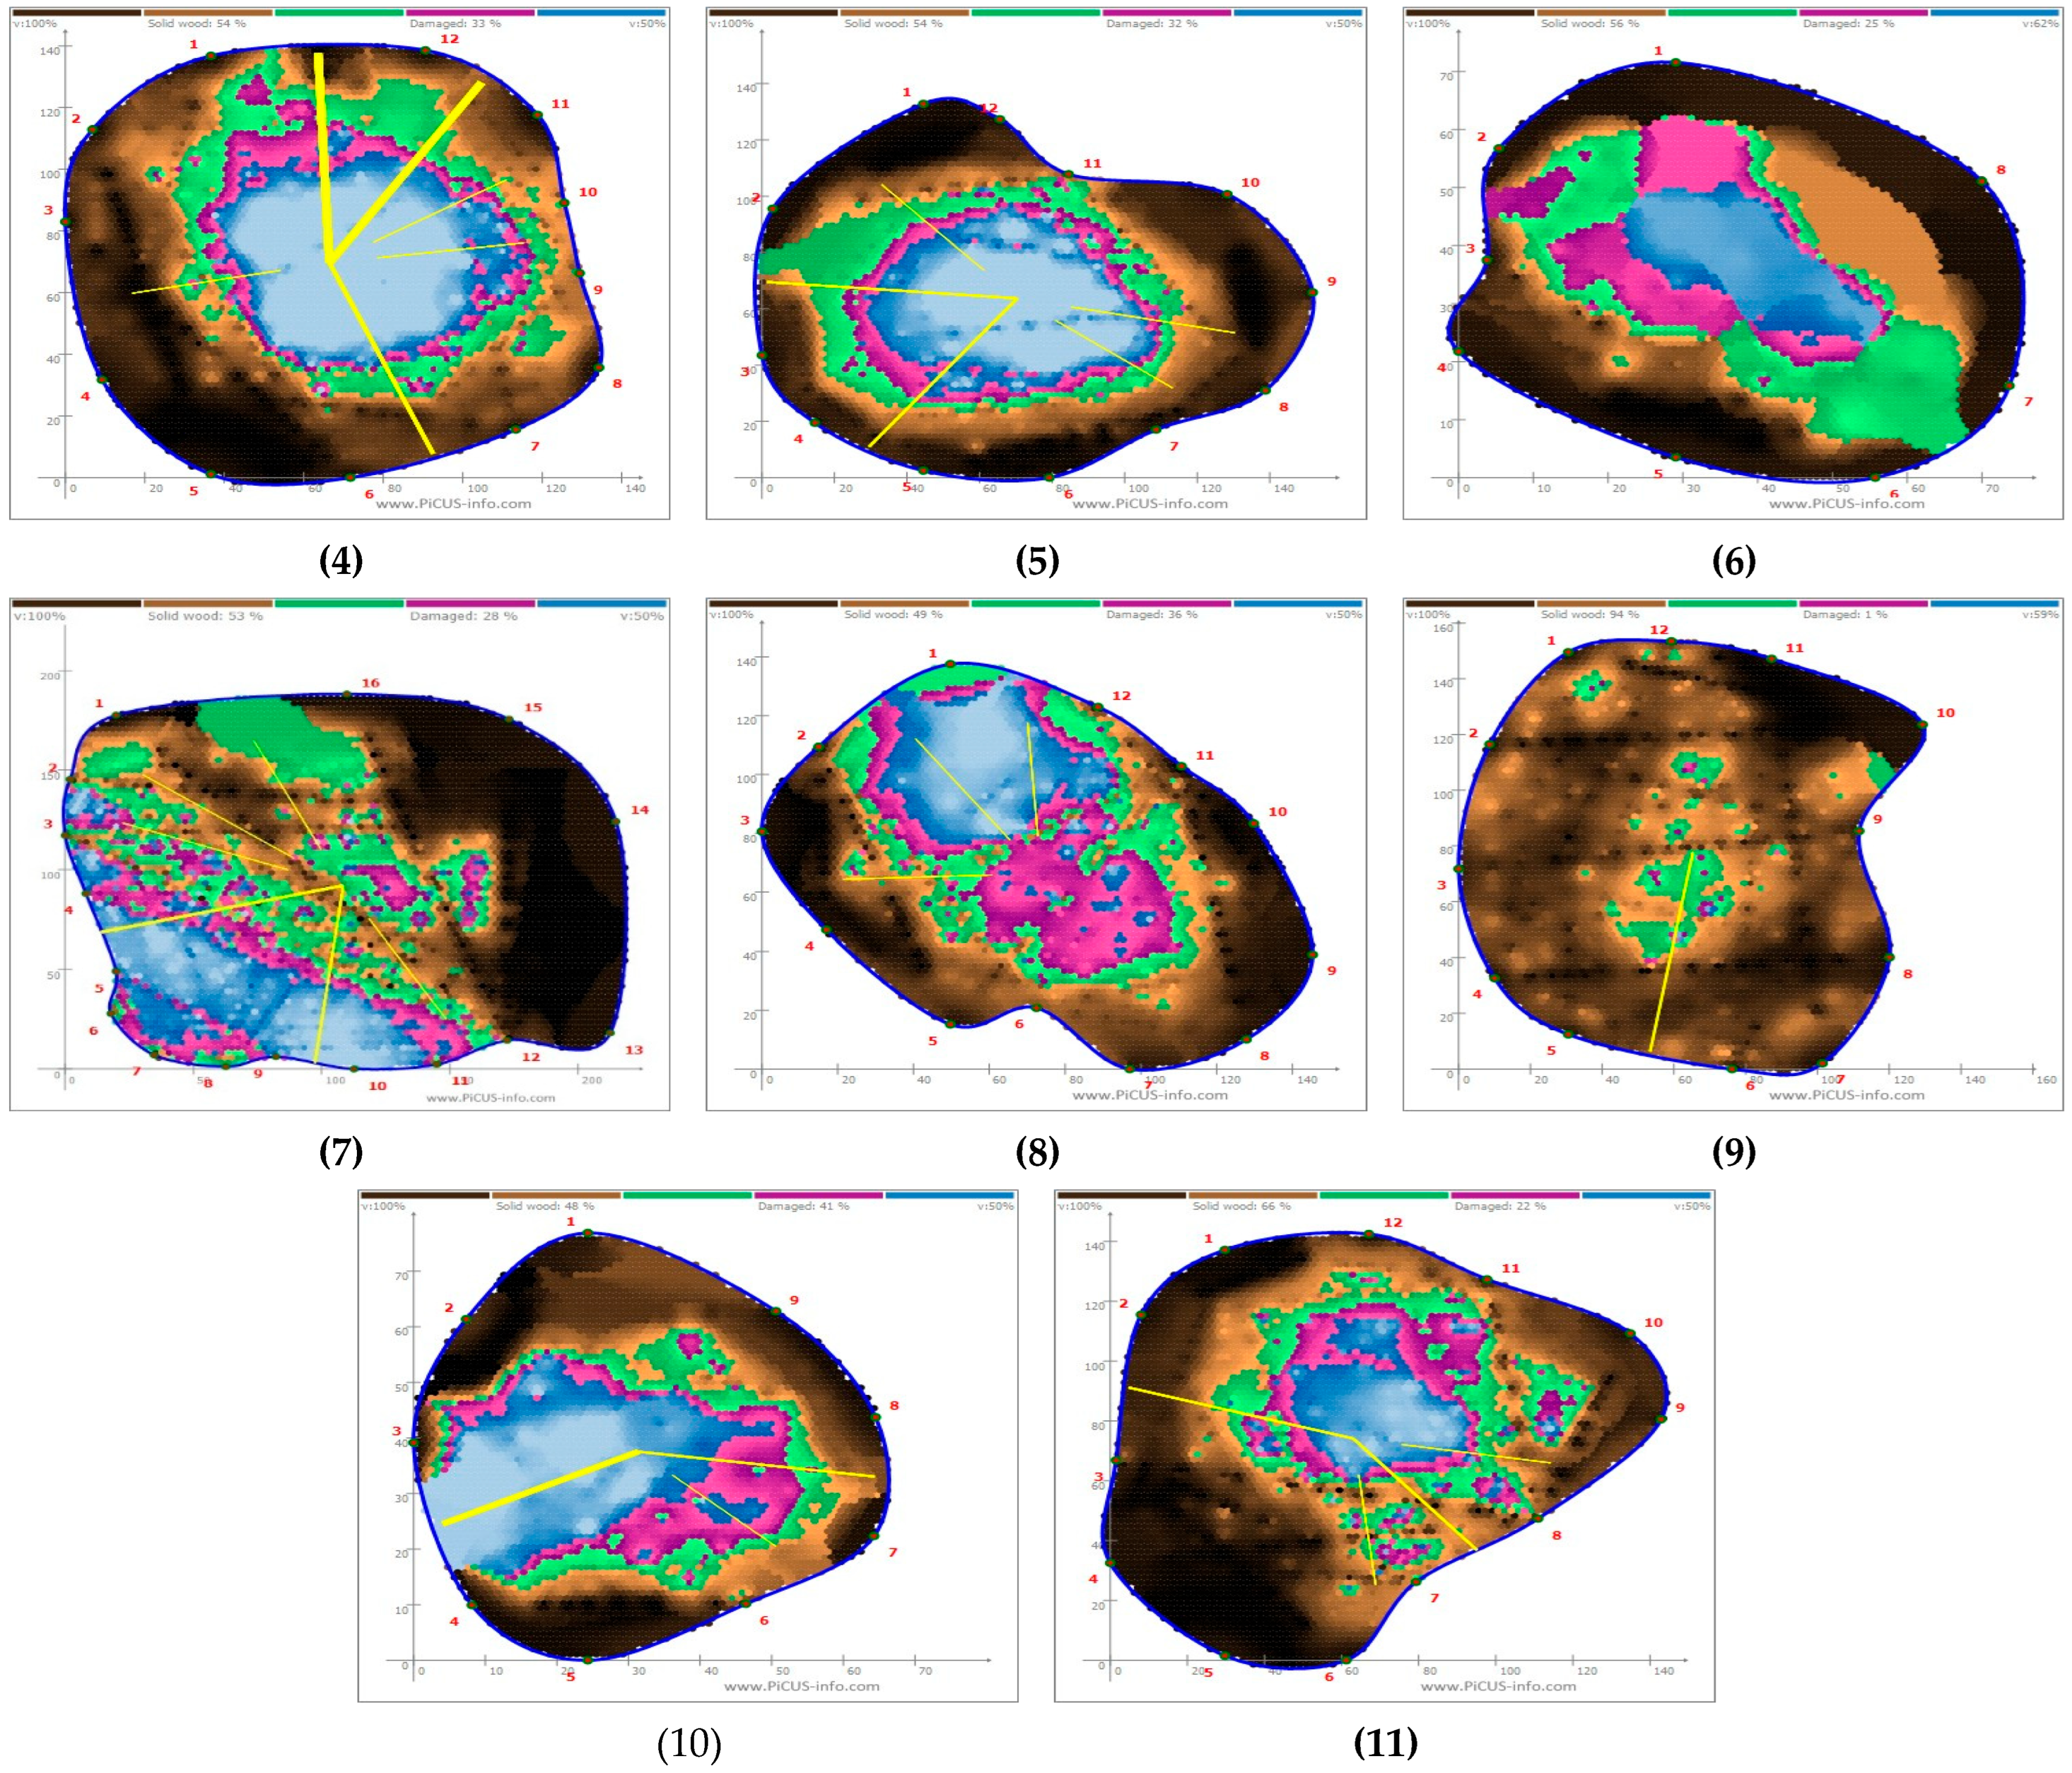
The velocity distribution within the tomogram is visualized through color differences: dark brown represents high-density, highly elastic, healthy wood; green indicates a transitional zone interpreted as initial decay; and red or blue indicates regions with low sound velocity, suggesting severe decay or potential cavities. The area of such defects was quantified by color-based image analysis using the ImageJ software 1.54p (NIH).

2.2.3. Analysis of Tree Growth Environment

To characterize the spatial and ecological environment in which the veteran trees are located, both satellite image-based assessments of surrounding environmental changes and analyses of the physical and chemical properties of soils were conducted.
  • Satellite Image-Based Assessment of Environmental Change
High-resolution satellite images provided by Google Earth (Image © 2025 Maxar Technologies, Map data © Google) were used to visually interpret environmental changes surrounding veteran trees. The imagery included time-series snapshots from 2005 to 2025, and scenes were selected to maximize seasonal consistency and cloud-free visibility. Although the exact satellite source (e.g., WorldView, QuickBird) and metadata were unavailable due to the proprietary nature of Google Earth composites, visual classification of land use categories was conducted based on distinguishable features such as vegetation cover (trees, grassland), impervious surfaces (buildings, pavements), vary soil, and roads.
Changes in land use were qualitatively assessed by comparing images across time, focusing on observable transitions such as vegetation clearance, urban expansion, road development, and soil exposure. These were cross-referenced with field photographs and local administrative land records where available. The aim was to provide contextual, qualitative support to the site-level assessment of environmental pressures potentially affecting tree health, rather than to perform pixel-based quantitative remote sensing analyses (e.g., NDVI, LST). This approach ensures a site-specific environmental interpretation aligned with tree vitality observations.
  • Soil Sampling and Analysis
Soil samples were collected from the rooting zones of all 11 veteran trees, within a 1.5 m radius from the trunk, at the topsoil layer (0–20 cm). For each tree, four subsamples were taken evenly from the four cardinal directions (north, south, east, and west) and composited to represent the average soil condition per tree. Physical properties assessed included soil texture, soil moisture content, and bulk density. Chemical properties analyzed included pH, volumetric density (g cm−3), organic matter content (%), total nitrogen (N), available phosphate (PO4-P), exchangeable cations (Ca2+, Mg2+, K+, Na+), and electrical conductivity (EC).
Soil analyses were performed following the standard soil survey methods recommended by the United States Department of Agriculture (USDA). Samples were dried at 105 °C for 24 h and subsequently ashed in a muffle furnace to quantify organic matter content, exchangeable cations, available phosphate, and ammonium nitrogen (NH4-N).
This sampling design aimed to characterize the immediate rooting environment of each veteran tree rather than to establish experimental controls. Therefore, no external reference plots were included. Each tree’s soil sample represented the averaged condition of three subsamples collected radially around the trunk at equal distances. While this approach allows comparative interpretation amount the trees under similar regional conditions, it does not enable a direct comparison with background or unaffected soils. The lack of control plots is recognized as a methodological limitation, and future studies should incorporate reference sites and spatial replication to better isolate the effects of tree age and microenvironmental variation on soil properties.

2.2.4. Analysis of Climatic and Environmental Changes

To examine the relationship between the growth health of veteran trees and climatic conditions, two complementary datasets were analyzed: (1) long-term ground-based meteorological observations and (2) satellite-derived land surface temperature.
  • Analysis of Climate Variable Trends
Meteorological data were obtained from the Korea Meteorological Administration (KMA) Automatic Weather System (AWS), including daily maximum, minimum, and mean air temperatures as well as daily precipitation. The analysis period was from 1997–2024. Based on the geographic coordinates of each tree, the nearest AWS station was identified using the haversine distance method. Several trees shared the same observation station: trees T1-T2 were matched with station 804, tree T3 with station 830, and trees T4-T11 with station 816.
In parallel, satellite-derived LST data were retrieved from Landsat 5, 7, and 8 thermal infrared datasets (Collection 2, Level-2 products) via the Google Earth Engine (GEE) platform, covering the period from 2000 to 2025. The selection of this range reflects the availability of high-quality thermal imagery suitable for LST retrieval across different Landsat missions. All LST values were calculated using the single-channel algorithm, incorporating radiometric calibration and atmospheric correction.
The discrepancy in the time span between the two datasets reflects their respective data availabilities and observational characteristics. While AWS data provided continuous long-term climatic trends, satellite-based LST enabled the spatial analysis of surface temperature at higher resolution and with broader landscape coverage. Rather than attempting to directly merge these fundamentally different data types, each dataset was used independently to assess both the temporal (AWS) and spatial (LST) dimensions of environmental variability relevant to tree health.
The selected climate indicators included:
  • Mean Vapor Pressure Deficit (VPD_mean) and mean Relative Humidity (RH_mean);
  • Moisture supply: total accumulated precipitation (precip_sum) and number of dry days (dry_days);
  • High temperature exposure: number of days with daily maximum temperature ≥ 30 °C (hot30_days).
VPD constraints the productivity and survival of woody plants by reducing stomatal conductance, decreasing photosynthesis, and increasing transpiration. Over recent decades, the systematic rise in VPD has emerged as a major driver of physiological stress [12]. For this reason, VPD and RH were set as key variables in the assessment of veteran tree health, and the combined exposure to high temperature and dryness was investigated.
A 30 °C threshold is widely used as an indicator of hot days in East Asian and Korean urban-climate studies [19] and provides interpretive value alongside the Korean heatwave warning system, which issues alerts at consecutive daily maximum temperature of ≥33/35 °C [19]. In this study, the number of ≥30 °C days was used as the primary index for interannual and inter-site comparisons, while the ≥33/35 °C thresholds were considered for supplementary analyses.
VPD was calculated using the standard Tetens (FAO-56) approximation, where the saturation vapor pressure e s T [kPa] is given by:
e s T = 0.6108 e x p 17.27 T T + 237.3   kPa  
Actual vapor pressure e a was calculated as e s ( T d ) , when dew point temperature   ( T d ) was available; otherwise, it was estimated as e s ( T ) × R H 100 . Daily VPD was then derived as e s T     e a and the mean over the study period was defined as VPD_mean. RH_mean represents the arithmetic mean of daily (or hourly) relative humidity.
Precip_sum was defined as the total daily precipitation accumulated over the study period (mm), and dry_days as the number of days with daily precipitation equal to 0.0 m. Hot30_days refers to the number of days with a daily maximum temperature T m a x 30   ° C . To examine the persistence of extreme heat events, the number of events, total duration (days), and the maximum length of consecutive hot days ( k = 2 ,   3 ,   or   5   d a y s ) were also calculated.
Trend analyses were conducted using the non-parametric Mann–Kendall (MK) test and Sens’s slope estimator. To reduce the risk of false detection caused by lag-1autocorrelation in the time series, the Trend-Free Pre-Whitening (TFPW-MK) procedure was applied. Specifically:
  • Provisional Sen’s slope was removed;
  • lag-1 autocorrelation in the residuals was eliminated;
  • MK test was performed after restoring the trend.
The reported statistics include Kendall’s τ, p-value, Sen’s slope (annual rate of change), and sample size (n), with a significance level of α = 0.05 [30,31].
(2) Spatial Analysis of Land Surface Temperature (LST)
LST analysis was performed using the Google Earth Engine (GEE) platform with Landsat 8 Collection 2 Tier 1 Level-2 reflectance and thermal imagery. The analysis covered the summer season (1 July–30 August) for the period 2000–2025.
The image preprocessing steps included:
  • Cloud and shadow masking using the QA_PIXEL band;
  • Extraction of radiance from the ST_B10, followed by atmospheric correction and application of conversion coefficients to derive brightness temperature [32];
  • Calculation of the Normalized Difference Vegetation Index (NDVI) using the SR_B5(NIR) and SR_B4(Red) bands.
Following established NDVI-emissivity methods [33,34], based on NDVI, vegetation fraction (Fv) and surface emissivity were estimated. Planck’s Law was then applied to calculate the final LST. The derived LST values were spatially aggregated into a 1 km × 1 km grid using the EPSG:4326 coordinate reference system, and the mean LST for each grid cell was computed using the reduce Regions function in GEE. Finally, the results were visualized by classifying color intervals within a range of 20 °C to 50 °C to assess the spatial patterns of surface temperature.
Accordingly, the satellite-derived LST was used qualitatively to identify broader thermal environments (e.g., urban heat exposure, surrounding land cover context), not to infer direct physiological effects at the tree scale. This complementary use of datasets allowed temporal trends to be interpreted together with spatial patterns, while acknowledging differences in resolution and data coverage.
The exported data were visualized in ArcGIS Pro. Each grid centroid was spatially joined with its corresponding LST value and interpolated to produce continuous surface maps using the inverse distance weighting (IDW) method. The resulting rasters were classified into five temperature ranges based on natural breaks (Jenks) and symbolized using a sequential red-yellow color scale.
To assess the temporal trends of surface temperature, the annual mean LST values derived from Landsat images for the period 2000–2025 were subjected to trend analysis. Prior to analysis, missing yearly values due to cloud contamination or data gaps were filled by linear interpolation between adjacent years to maintain temporal continuity.
For each veteran tree, a simple linear regression model was fitted as follows:
L S T t = β 0 + β 1 t + ε t
where L S T t is the annual mean land surface temperature (°C) at year t ,   β 0 is the intercept, and β 1 represents the linear rate of change (°C yr−1).
The significance of the slope ( β 1 ) was tested using a two-sided t-test at α = 0.05 . Model adequacy was evaluated using the coefficient of determination ( R 2 ), and residuals were examined for normality (Shapiro–Wilk test), homoscedasticity (Breusch-Pagan test), and serial independence (Durbin-Watson statistic).
In addition, alternative models (quadratic and segmented regression) were tested to evaluate possible nonlinearity in short-term temperature fluctuations, and model selection was guided by Akaike (AIC) and Bayesian (BIC) information criteria [35].
To enhance the analytical robustness, non-parametric correlation analyses (Spearman’s ρ) were performed to examine the relationships among physiological(SPAD), structural (LCR, SoT), and climatic (LST) indicators. Bootstrapped 95% confidence intervals (10,000 resamples) were calculated to account for the small sample size and assess the stability of the correlation estimates.

3. Results

3.1. Tree Growth Status

3.1.1. Current Growth Characteristics

The overall current growth characteristics of the eleven trees are presented in Table 2, Figure 4.
Measurements showed that the eleven Zelkova serrata (Thunb.) Makino individuals had an average age of 375 ± 113 years. DBH was 4.01 ± 1.19 m, while tree height ranged from 11.5 m to 30.0 m, with a mean of 18.85 ± 6.31 m. Crown width ranged from 5.0 m to 28.5 m, with a mean of 14.86 ± 6.64 m. Overall, there was considerable variation in growth characteristics among individuals, which appears to be attributable to differences in age and site conditions.
The mean SPAD value of all eleven trees was 37.42 ± 4.47 mg/g. The highest value was recorded in tree T1 (46.15 mg/g), while the lowest was observed in tree T3 (32.06 mg/g).
To assess the potential influence of leaf orientation on chlorophyll content, SPAD measurements were collected from four cardinal directions (east, west, south, and north) at mid-canopy height (approximately two-thirds of the leaf blade length). In each direction, five fully expanded and mature leaves were selected, and their mean SPAD value was used as the representative value. Measurements were conducted under uniform lighting conditions, and orientation was determined using a compass aligned with the trunk base.
The directional means were as follows: east 38.62 ± 5.14 mg/g, west 36.53 ± 4.28 mg/g, south 36.64 ± 6.40 mg/g, north 37.80 ± 7.37 mg/g, showing no distinct differences among directions (Table 3). Statistical analysis using one-way ANOVA followed by Dunn’s post hoc test revealed that most trees exhibited significant directional differences in SPAD values. However, only Trees 3,4, and 8 showed no statistically significant variation, indicating relatively uniform canopy conditions in those cases.
According to the criteria of Uddling et al. (2007) only trees T1, T2, and T10 fell within the range indicative of good vitality [34]. The remaining eight trees were classified within the borderline vitality range, suggesting that continuous management and monitoring are necessary for long-term health maintenance. Although no tree exhibited a SPAD value below 30 mg/g, which would indicate a level of reduced vitality, trees T3, T9, and T11 showed mean SPAD values in the low 30 s, warranting careful observation and management for potential pest or disease occurrence.

3.1.2. Visual Tree Assessment

The visual tree assessment (VTA) of the eleven Zelkova serrata individuals revealed distinct differences among trees in the key indicators of structural stability.
Tapering showed a mean value of 64.64 ± 14.50, except for T1 (39), T3 (46), T9 (59), and T10 (56). All trees exceeded a value of 60 and were thus classified as highly vulnerable. In particular, T4 (86), T5 (80), and T6 (81) exceeded the critical threshold of 80, indicating a very high level of structural risk. This suggests that these individuals exhibit relatively strong shoot-elongation tendencies and are structurally unstable [36].
Live Crown Ratio (LCR) averaged 0.34 ± 0.28. Except for T1 (0.8), T2 (0.8), T8 (0.24), and T10 (0.7), most individuals were evaluated below 0.2. This indicates that crown dieback is already advanced and implies that these trees are highly vulnerable to external stressors such as strong winds or heavy snow, which could easily break stems and branches. Moreover, the LCR showed a similar trend to the SPAD measurements: trees with lower SPAD values tended to have reduced vitality, which in turn increases branch mortality and leads to a shrinking live crown [37]. Branch Attachment Strength averaged 0.45 ± 0.18, with T4 (0.74), T7 (0.52), and T11 (0.80) all exceeding 0.5.
For the Branch Crotch Angle, angles below 30° indicate a high risk because branches or stems forming a narrow V-shaped crotch are more likely to split when there are strong winds or heavy snow. The mean angle was 61.95 ± 8.65°, and most trees fell within the ‘Moderate’ category (50–70°). T2, however, measured 49.5°, suggesting a relatively higher risk of cracking. The Stem Lean averaged 15.46 ± 9.22°, except for T1 (6°), T3 (9°), and T9 (9°). All the others were evaluated as being in a risky condition. In particular, T5 (23°), T6 (38°), and T7 (23°) exceeded 20°, and were therefore classified as very high risk [38,39].
Overall, except for T1 and T3, all trees recorded at least two indicators rated as High or Likely vulnerable in the structural stability assessment. In particular, T5, T6, T7, and T11 displayed high ratings in more than two indicators, and were therefore identified as high-risk individuals requiring immediate reinforcement measures and regular monitoring (Table 4).

3.1.3. Internal Structural Integrity Assessed by Sonic Tomography

SoT was used to evaluate the internal structural integrity and risk levels of the eleven Zelkova serrata trees. The results showed that 10 out of 11 trees—all except T9—exhibited suspected internal defects or potential structural risks.
The mean estimated damaged area ratio was 29.82 ± 15.68%, while the mean proportion of sound wood was 57.27 ± 15.61%. Based on the decay–cavity grading criteria from previous studies [35,36], the risk levels were distributed as follows: Grade A: 1 tree (9.1%), Grade B: 1 tree (9.1%), Grade C: 8 trees (72.7%), and Grade E: 1 tree (9.1%). Notably, approximately 73% of the trees were classified as Grade C, indicating that even trees appearing visually sound often contained internal cavities or were undergoing decay.
Tree T1, which appeared very healthy in the visual tree assessment, showed an estimated damaged area ratio of 63%, suggesting severe internal decay and cavity development. It was therefore classified in the highest risk category, Grade E, indicating a high likelihood of windthrow or stem failure. In contrast, tree T9, despite showing deficiencies in tapering and live crown ratio during the visual assessment, exhibited an estimated damaged area ratio of only 1% and a sound wood proportion of 94%, and was consequently classified as Grade A [40,41].
Trees T3, T4, T5, T6, T7, T8, T10, and T11, all classified as Grade C, did not display obvious external cracks or cavities; however, SoT revealed signs of decay or internal defects progressing in the central stem. In some cases, cracks appeared evenly distributed or cavities were suspected to extend into deeper wood layers, indicating that additional monitoring and management are required (Table 5; Appendix A).

3.2. Analysis of the Tree Growth Environment

3.2.1. Satellite Image-Based Assessment of Surrounding Environment Changes

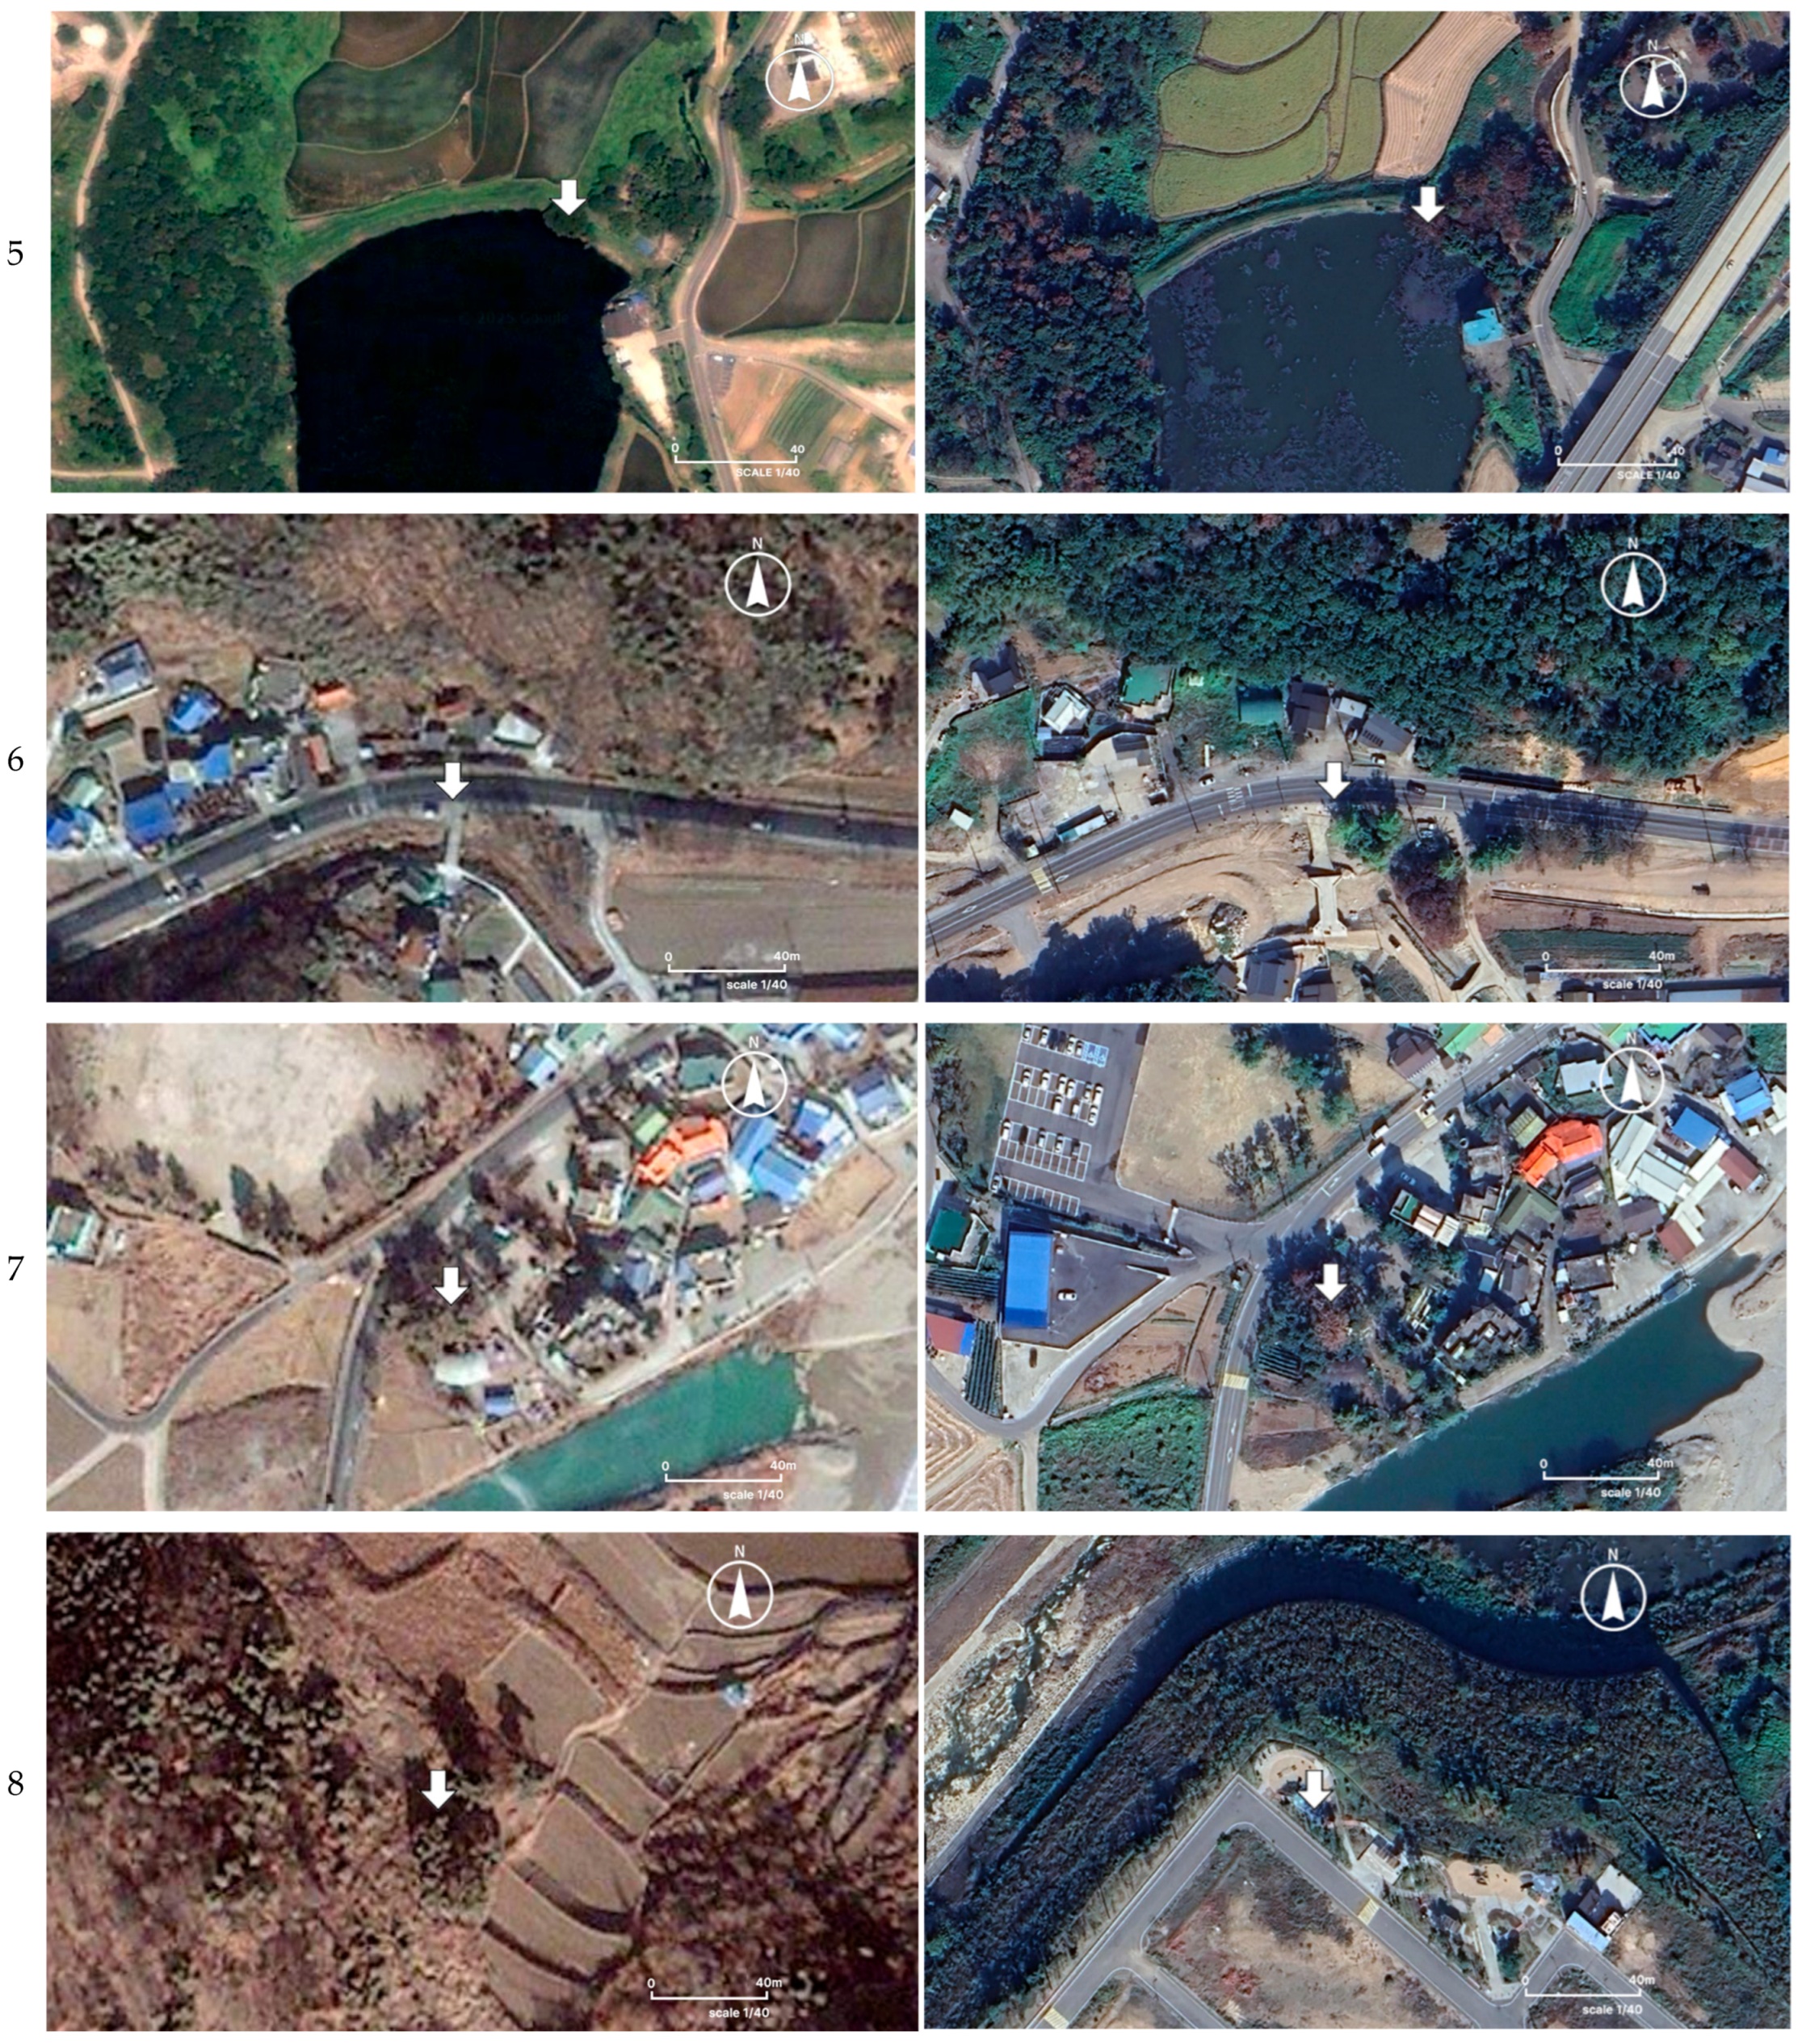
High-resolution satellite images from Google Earth were compared between the 1990s, early 2000s, and recent imagery. Most veteran trees were found to be located in peri-urban rural or forested areas where the impact of intensive land-use changes and large-scale disturbances has been minimal. Nevertheless, several individual trees showed signs that changes in the surrounding environment have degraded the functional properties of the soil within their rooting zones.
For example, T2 has recently been affected by the creation of a rest area, which has increased impervious surfaces and may intensify soil compaction. T4, situated adjacent to a senior community center, is exposed to high levels of soil compaction that threaten soil aeration and water-storage capacity. T5, located near the entrance of an embankment, experiences repeated pedestrian traffic and vehicle passage, which can damage soil structure and cause soil moisture imbalance.
Following typhoon flooding and a retaining wall collapse, T6 has been directly disturbed by subsequent road and wall construction, leading to serious restrictions on root respiration and drainage. T7, positioned adjacent to a roadway, exhibited notable pest and disease damage, which can be interpreted as a combined effect of traffic-related fine particulate matter, air pollution, and repeated soil compaction, all of which weaken physiological resistance.
In addition, T8 and T9 experienced extensive soil clearing and grading during recent construction activities, resulting in the loss of protective ground cover and exposure of the soil structure. This condition accelerates topsoil erosion and desiccation, and markedly reduces the soil’s water-retention capacity.
These site-specific environmental changes act as significant local risk factors that weaken root-zone aeration, infiltration-drainage balance, and nutrient availability, even though the fundamental physical and chemical properties of the soil are generally favorable (Appendix A.2).

3.2.2. Soil Environment

The soils in the study sites were generally evaluated as being in “favorable condition” across all physical and chemical indicators. Electrical conductivity (EC) remained within a non-saline range, pH values were within acceptable limits, bulk density was low, and porosity was high, providing a soil environment advantageous for both water storage and aeration.
However, at certain locations with relatively high pH, there is a potential risk of reduced micronutrient availability. In addition, localized physical degradation caused by soil compaction may occur, so continuous monitoring and management are recommended.

3.3. Climatic Changes and Tree Growth Status

3.3.1. Trends in Climate Variables

For this study, long-term trends of eight key climate indicators- Hot30_days, Hot35_days, PRCP_sum_mm, DryDays_n, CDD_max_days, VPD_p95_kPa, VPD_mean_kPa, and RH_mean_pct were analyzed for three meteorological stations in Pohang (stations 804, 816 and 830) over the period between 1997–2024.
The Mann–Kendall test and Sen’s slope estimator were used to detect and quantify trends, and the Trend-Free Pre_Whitening Mann–Kendall (TFPW-MK) method was applied to correct for potential autocorrelation in the time series (Table 6).
Significant increasing trends in the extreme heat indicators, Hot 30_days and Hot 35_days, were observed at both Stations 804 and 830. In contrast, Station 816 exhibited significant decreasing trends for both indicators, indicating that the long-term variability in extreme high-temperature frequency differs across the Pohang region. Notably, the veteran trees located near Station 804 and 830 (T1, T2, and T3) displayed SPAD values below the overall mean, and the VTA revealed pronounced reductions in LCR and clear evidence of crown dieback. These results suggest a chain effect in which rising air temperatures lead to a decline in chlorophyll content (lower SPAD), which in turn reduces physiological vigor, increases branch mortality, and ultimately decreases LCR.
Regarding annual precipitation, a significant decreasing trend was detected only at Station 816, which is located in the coastal area (Kendall’s τ < 0, p < 0.05; Sen’s slope ≈ −17.7 mm·yr−1). At the inland stations (804 and 830), negative trends were observed but were not statistically significant. The number of dry days (DryDays_n) and the maximum length of consecutive dry days (CDD_max_Days) showed both increasing and decreasing tendencies at certain stations; however, p-values exceeded 0.05 at all three stations, making it difficult to confirm a long-term trend in extreme drought persistence.
In general, precipitation deficits are closely linked to crown dieback and reductions in LCR. Although such climatic trends were not consistent across all stations in this study, the statistically significant decrease in precipitation at Station 816 -accompanied by a pronounced decline in LCR among local trees-suggests that reduced precipitation in coastal areas may further exacerbate crown dieback.
The mean VPD showed a significant decreasing trend at Station 816 (p < 0.05, Sen’s slope ≈ −0.0044 kPa·yr−1), whereas a significant increasing trend was observed at Station 830(p < 0.05, Sen’s slope ≈ +0.0049 kPa·yr−1). Mean relative humidity (RH_mean_pct) at Station 816 exhibited a significant increasing trend (Sen’s slope ≈ +0.2076%·yr−1), reflecting local differences in climate conditions.
An increase in VPD under hot and dry conditions strengthens atmospheric moisture demand and intensifies tree water stress. In fact, tree T3, located near Station 830, showed low mean SPAD values, and the SoT analysis indicated a high rate of internal damage. These findings suggest that rising VPD can not only negatively affect the physiological vigor of veteran trees but also affects their structural integrity. Conversely, at Station 816, where a decrease in VPD and an increase in RH were simultaneously observed, the local veteran trees (T4-T11) still exhibited low mean LCR and only limited variation in SPAD. This indicates that once long-term crown dieback is established, the alleviation of climatic stress does not readily lead to a marked recovery of tree vitality.
Although all indicators did not show a fully consistent pattern, decreasing precipitation was clearly observed in the coastal area, while increasing atmospheric dryness (declining Rh and rising VPD) was evident in the inland region. These results imply that drought signals across the Pohang region are being intensified by regionally distinct mechanisms. Moreover, this aligns with previous findings that taller trees are at greater risk of mortality during severe drought due to hydraulic limitations [37]. Therefore, as regional atmospheric drying progresses, large veteran trees may become increasingly vulnerable to water stress, underscoring the need to incorporate hydraulic vulnerability as a key factor in their conservation and management strategies.

3.3.2. Spatial Distribution of LST

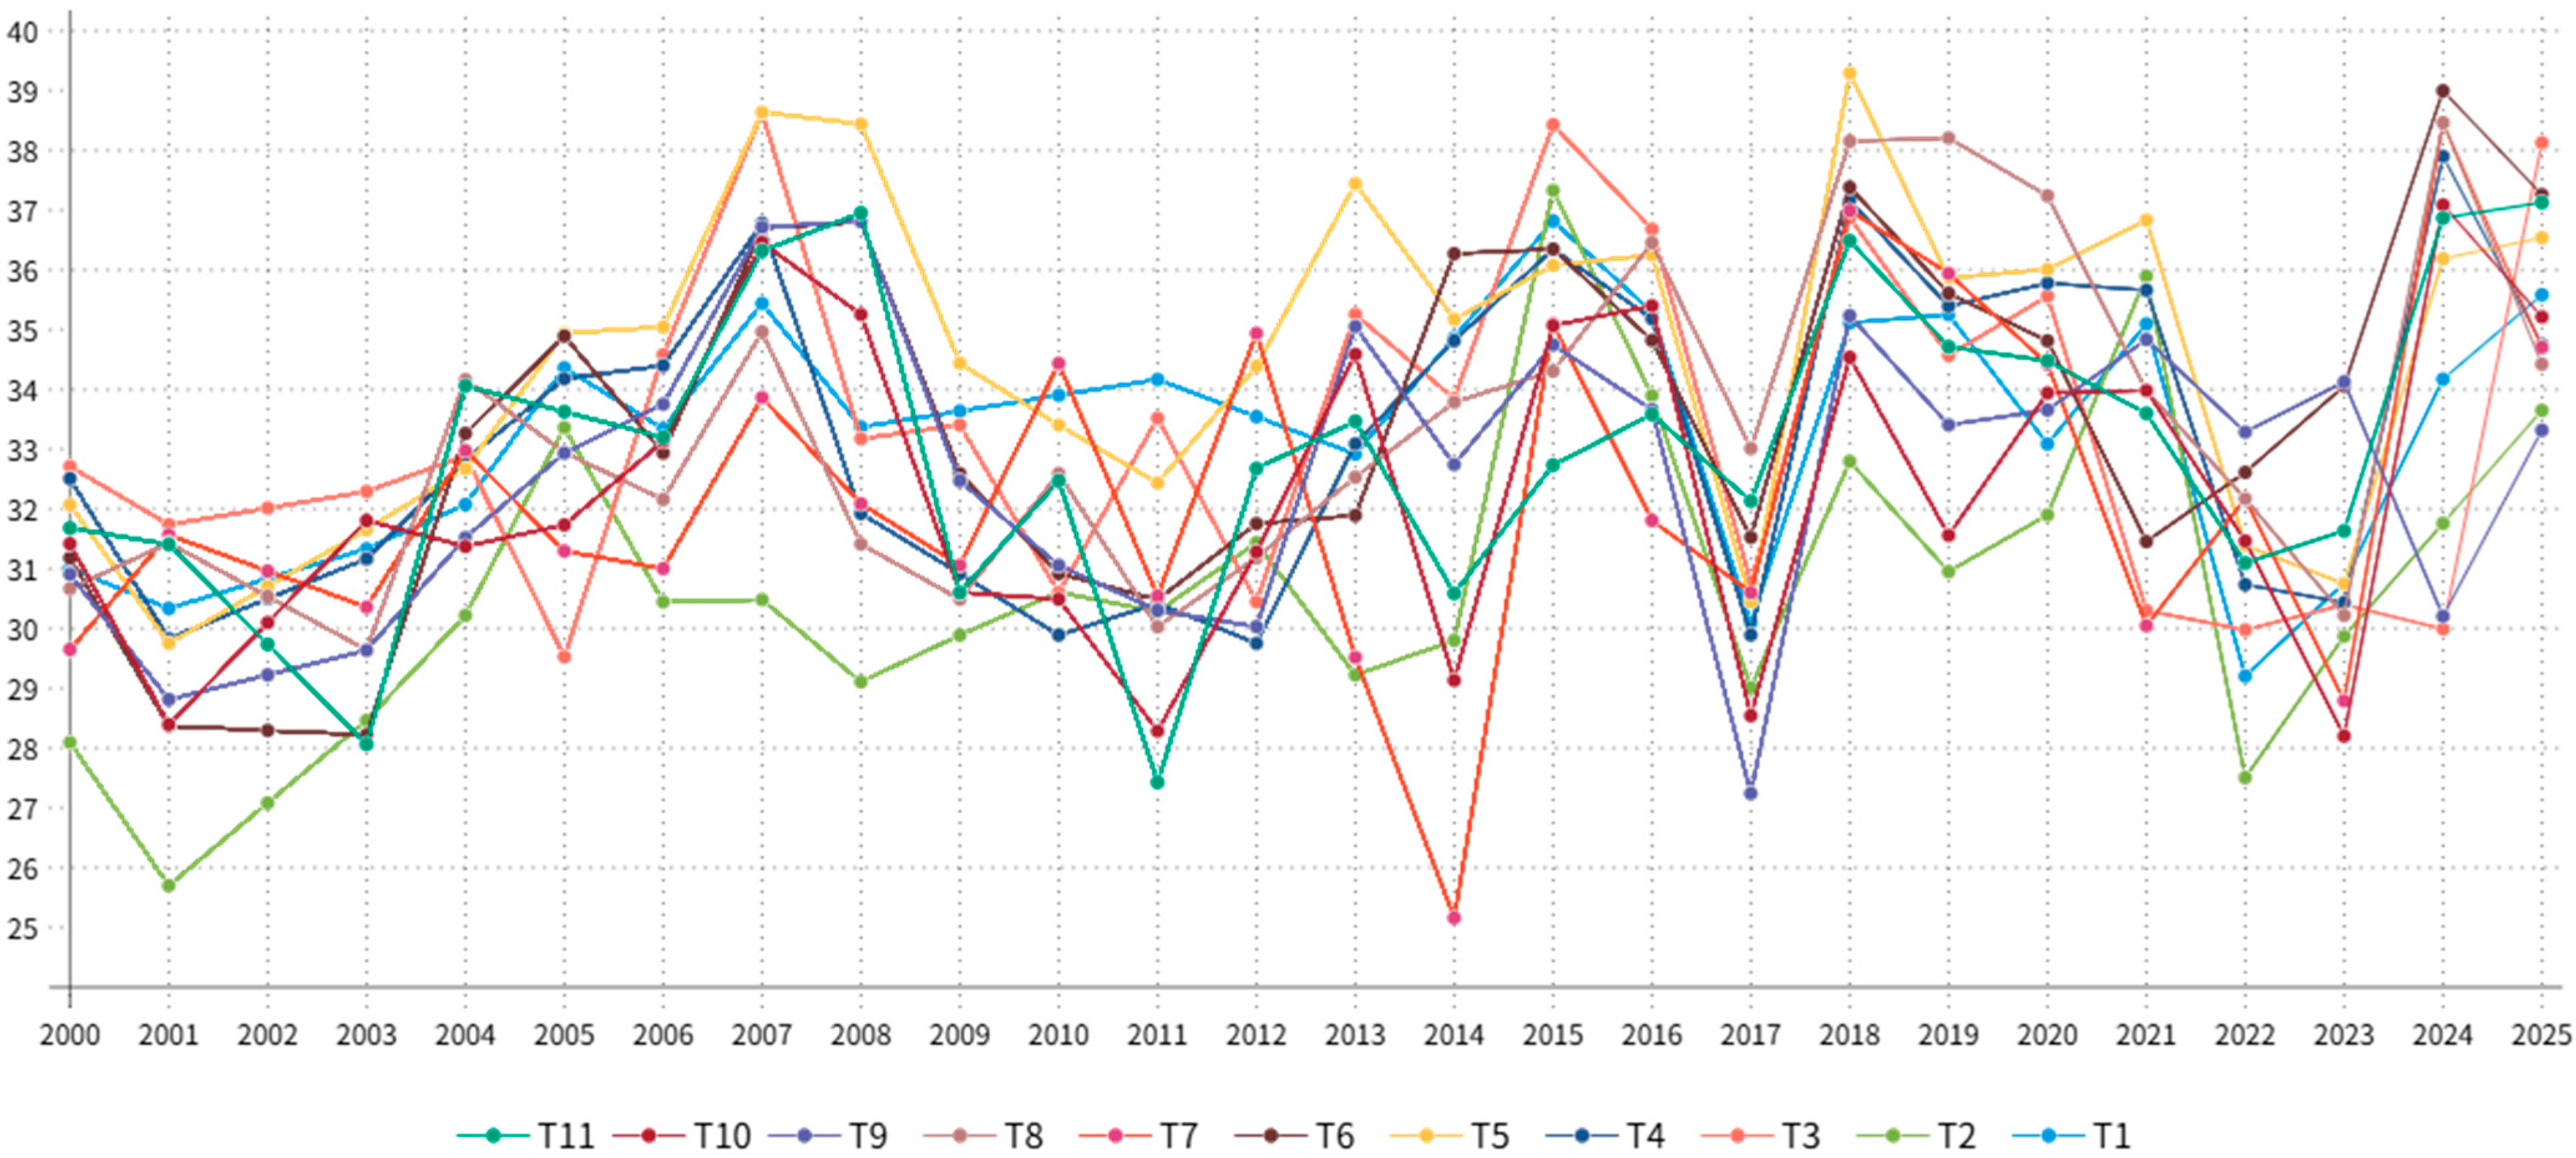
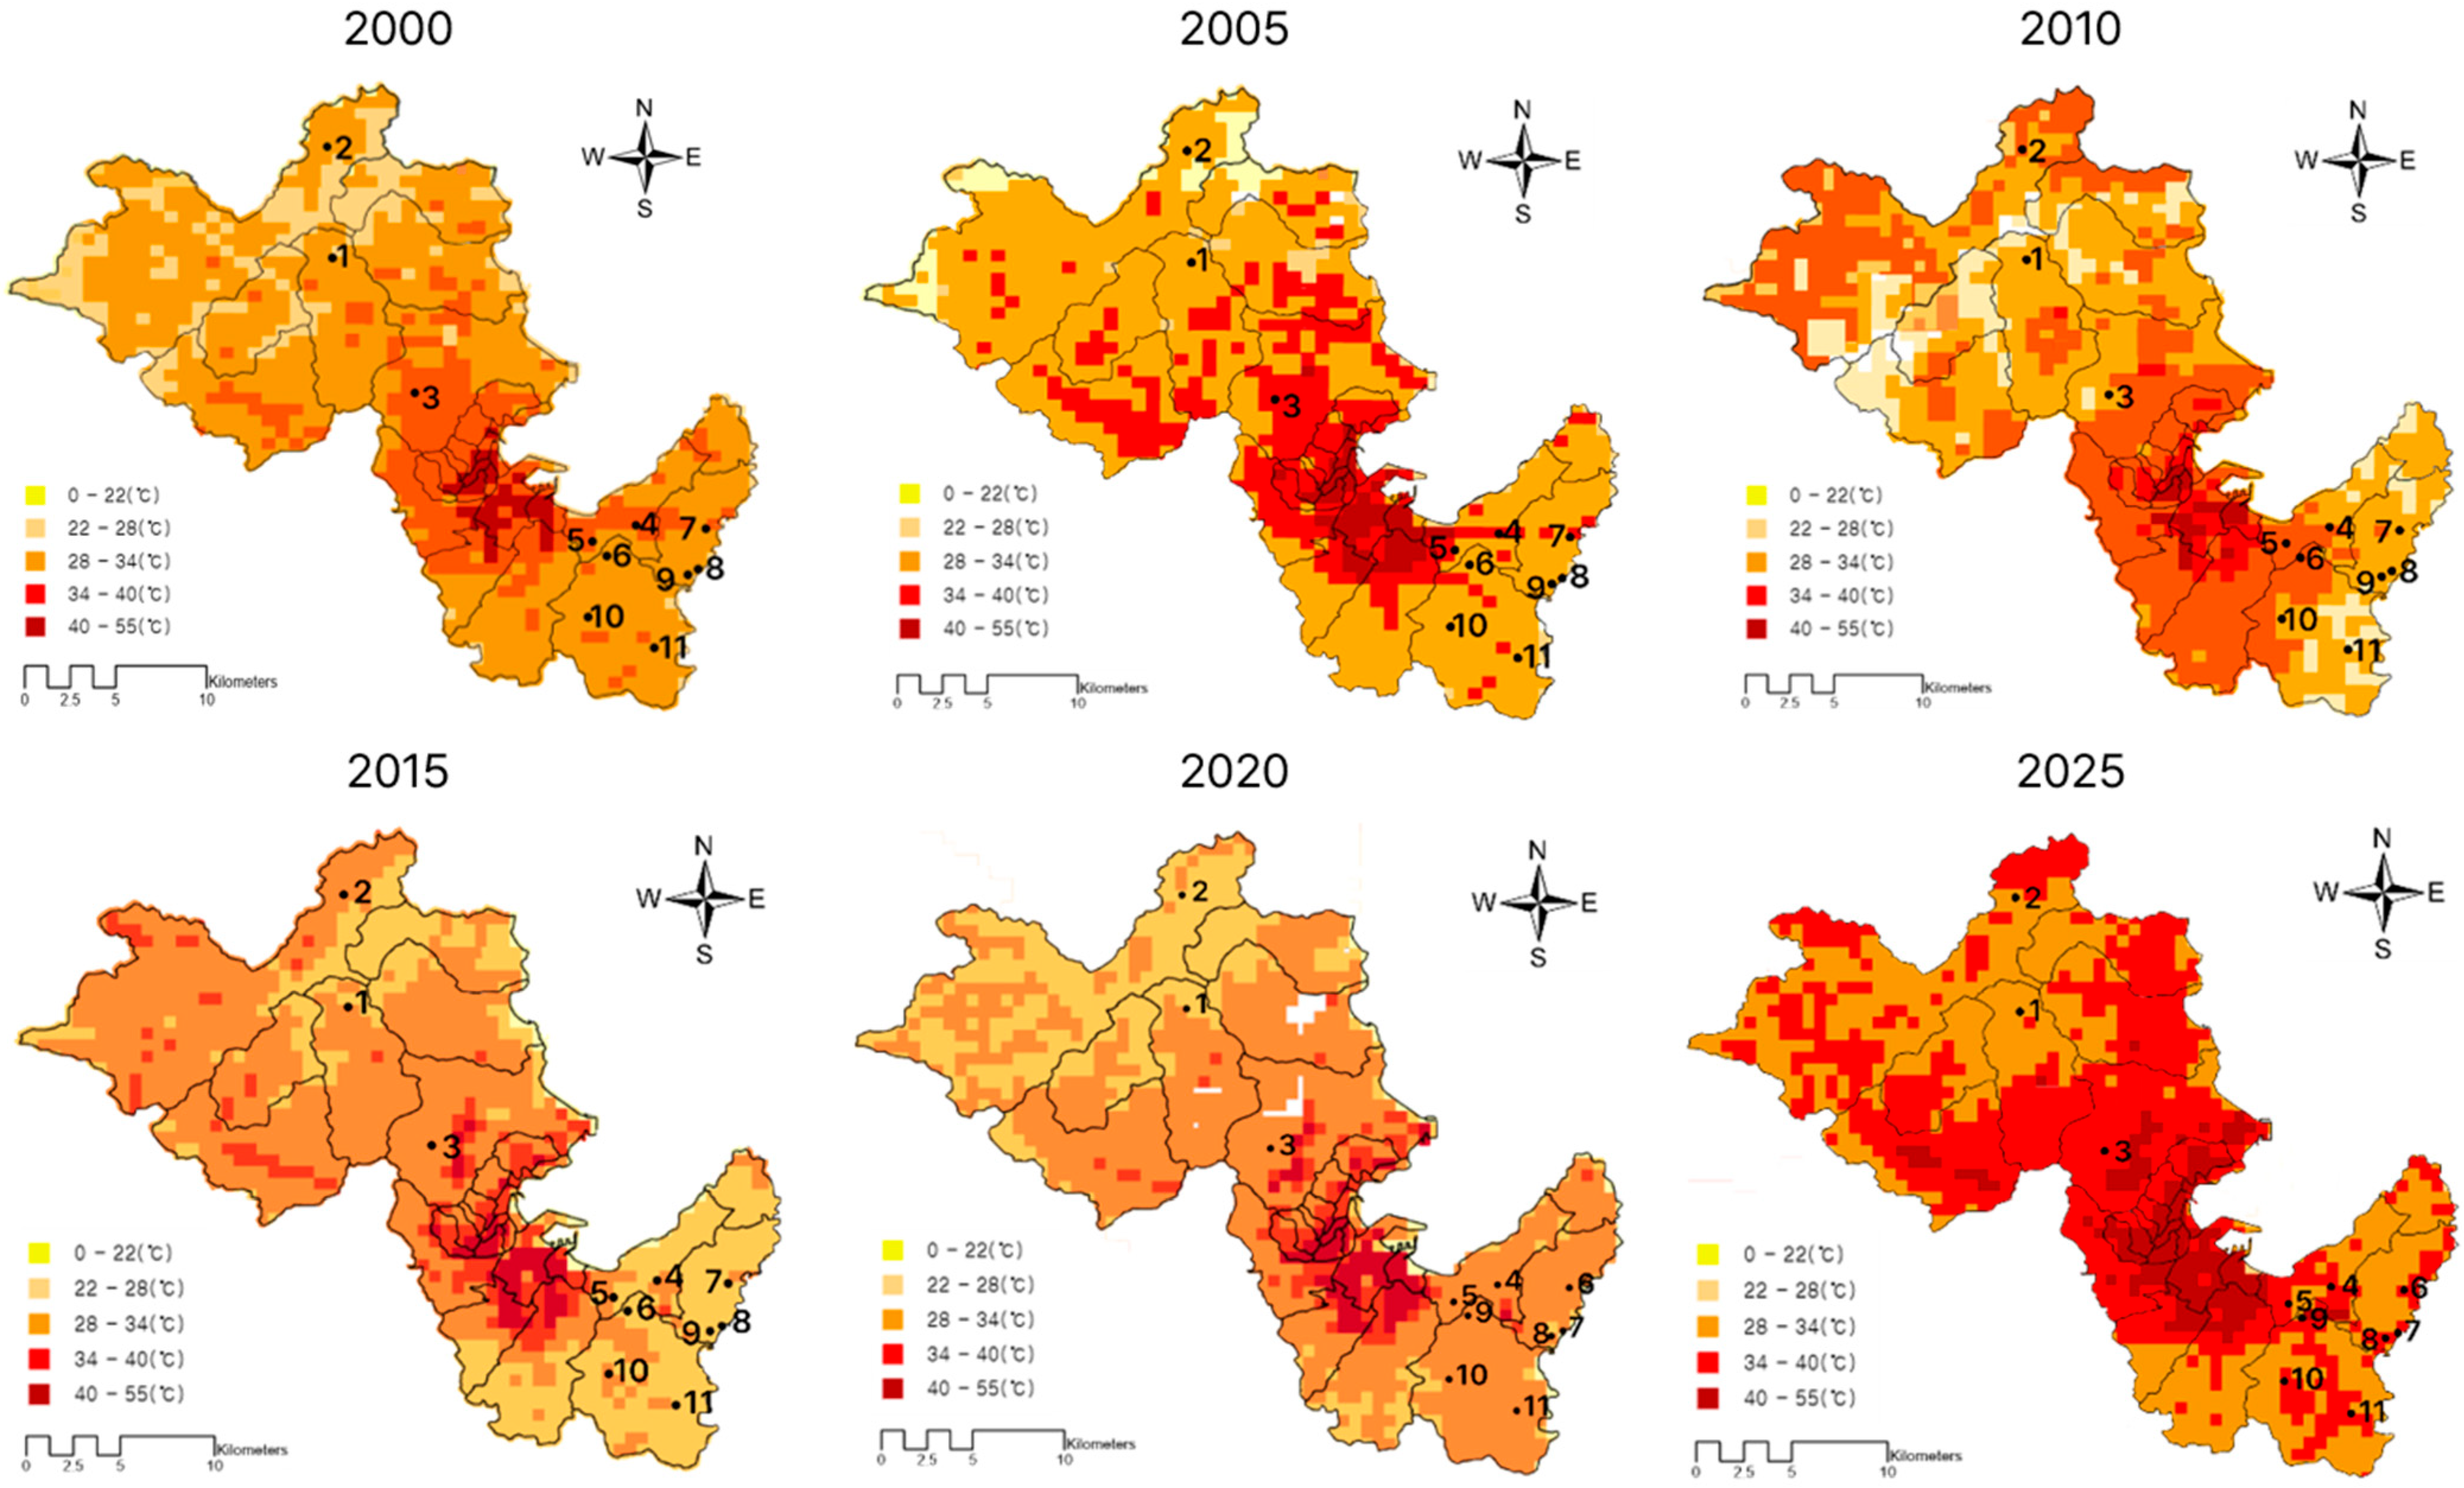
A comparison of mean LST across the eleven sites from 2000–2025 revealed an overall mean of 32.88 °C (±2.76 °C), with site-specific annual maximum values ranging from the early 2000s to recent years. Among the 11 sites, 2024 accounted for the greatest number of annual LST peaks (5 sites), followed by 2015 (2 sites), and 2007, 2008, and 2018 (1 site each). This indicates that 2024 was an exceptionally hot year, setting new thermal records at nearly half the monitored sites. In contrast, long-term interannual variations in mean LST exhibited a heterogeneous spatiotemporal pattern without a consistent warming or cooling signal across all sites (Figure 5 and Figure 6).
Among all sites, the lowest mean LST was recorded at T2, followed by T10 and T9, indicating comparatively cooler environments. Conversely, the highest mean LST values were observed at T8, T5, and T4 (Table 7), demonstrating clear differences in thermal environment among individual trees.
Notably, trees 2, 6, and 8 exhibited statistically significant increasing trends in mean summer LST (p < 0.05; MK_p < 0.05), which aligns with observed land-use changes such as nearby land clearing or ongoing urban development (Figure 6). In contrast, trees located in urban-forest transition zones (e.g., trees 4, 5, and 11) showed marginally significant trends (p ≈ 0.05–0.1), suggesting gradual thermal accumulation likely driven by edge effects and progressive urban heat island influence.
The long-term trends (slopes) in mean LST ranged from −0.65 ~ +0.46 °C/10 per decade. Some sites (T6, T10, T11) exhibited warming trends, while the others showed cooling trends. Notably, T3 exhibited a high LST_p95 exceeding 37.3 °C, yet showed a decreasing slope of −0.65 °C per decade. Despite this cooling trend, T3 maintained low SPAD values and high SoT damage rates, suggesting a legacy effect of past extreme heat exposure—long-lasting impacts of historical climate stress.
Furthermore, sites with high mean LST, such as T5 (34.9 °C) and T8 (35.0 °C) exhibited low mean SPAD values and pronounced declines in LCR, supporting the interpretation that exposure to elevated surface temperatures is directly linked to reduced tree vitality. By contrast, trees T1-T3, despite experiencing a recent decreasing trend in LST, still showed declines in SPAD and increased SoT damage rates following repeated extreme heat events in 2015, 2018, and 2024. This demonstrates that the effects of past climate stress can persist long-term, impacting both physiological vigor and structural integrity.
Among the sampled veteran trees, Tree 6, 8, and 2 showed statistically significant increasing trends in mean summer LST over 2000–2025 (Sen’s slope = 0.2159, 0.1811, and 0.1657 °C/year; p < 0.05; MK_p < 0.05). Notably, Tree 6, which had the highest Sen’s slope, also exhibited a SoT internal damage rate of 25%, suggesting that sustained high thermal exposure may be linked to structural degradation. Similarly, Tree 10 (41% damage) showed moderate LST increase (slope–0.1146), though it was not statistically significant.
Conversely, Trees 2 and 9 both classified as A/B grade with low SoT damage ratios recorded relatively low mean LSTs (30.72 °C and 32.53 °C, respectively), and only modest warming trends (slope = 0.1657 and 0.1182 °C/year). Their p-values (0.0138 and 0.1662) further support their classification as residing in thermally stable environments.
In contrast, trees assigned to the C-grade decay class (3, 4, 5, 6, 7, 8, 10, 11) had higher LST means (ranging from ~32.2 to ~34.5 °C) and were generally located in sites with evident warming trends. Tree 5, for instance, had the highest mean LST of 34.49 °C, and Tree 8 the highest slope among C-grade trees (0.1811 °C/year), both aligning with elevated structural risk categories.
Tree 1, graded E and with a SoT damage ratio > 60%, showed a moderate warming trend (slope = 0.1251, p = 0.1724), but its deterioration may be better explained by legacy effects of past extreme heat (e.g., 2015, 2024 peaks), rather than ongoing temperature rise.
Overall, higher Sen’s slope and LST_mean were consistently associated with increased structural damage and vitality decline. Although no strong correlation was observed between LST metrics and SPAD or SoT individually, there was a notable positive correlation between LCR and SPAD. Specifically, the three trees with the highest mean LSTs (T4, T5, T8) had average LCR = 0.213, and SPAD = 37.35, while the three with the lowest mean LSTs (T2, T9, T10) had average LCR = 0.543, and SPAD = 39.35, indicating that thermal stress likely contributes to both crown loss and reduced chlorophyll activity.
The correlation analysis showed that physiological and structural indicators (SPAD_mean, LCR) were positively related, whereas both tended to decrease under higher LST conditions. SoT_damage exhibited a moderate negative association with SPAD_mean, suggesting that physiological decline accompanies internal decay.

4. Discussion

This study integrated long-term climate records with physiological and structural indicators to investigate how sensitive the health of veteran Zelkova serrata trees—averaging 300 years of age in the Pohang region—is to climate change. The results clearly demonstrate that, in recent decades, summer mean air temperature, LST, VPD have collectively increased, while relative humidity has declined. These combined climatic pressures indicate that water stress in veteran trees has intensified in a long-term and cumulative manner. Such climatic stressors appear to have exerted a stronger influence on the decline in physiological vigor and the progression of internal decay than on changes in soil chemistry, suggesting that climate change is not merely a background factor for tree growth but a direct threat to the structural stability of veteran trees.
To quantitatively reinforce these findings, a non-parametric Spearman correlation analysis was performed among LST, SPAD, LCR, and SoT. The analysis revealed weak negative correlations between LST and both SPAD and LCR, and a weak positive correlation between LST and SoT. Notably, SPAD and LCR showed a strong positive relationship (ρ = 0.84, p < 0.01), indicating that trees with greater crown ratios maintained higher chlorophyll activity even under thermal and moisture stress. These results quantitatively support the close linkage between physiological vigor and structural soundness in veteran trees under climate-induced stress.
First, by employing precise indicators such as SPAD, LCR, and SoT, this study confirmed that hot and dry conditions are the primary drivers of vitality loss in veteran trees. Individuals with higher mean LST and VPD values exhibited a marked decline in SPAD and LCR, and also showed relatively higher decay damage rates in SoT analyses. These findings reveal that high temperature environments weaken chlorophyll activity, accelerate crown dieback, and ultimately lead to structural vulnerability [42]. This effect was particularly pronounced in large-diameter veteran trees. Greater tree height elongates the hydraulic pathways, increasing the likelihood of xylem cavitation under conditions of high vapor pressure deficit [43,44,45]. The observation in this study that trees located in sites with high LST showed concentrated internal decay and vitality loss is consistent with this mechanism and indicates that localized urban heat island effects and atmospheric drying are accelerating the hydraulic limitations of large veteran trees. Similar vulnerability patterns have recently been reported in monumental trees across Mediterranean and subtropical regions, highlighting that hydraulic constraints remain the dominant failure mechanism under warming and drying climates
The 1 km × 1 km grid resolution used for LST analysis may not fully capture microclimatic variation around individual trees. Therefore, the temperature patterns presented here should be interpreted as regional trends rather than exact local conditions [22,29].
Second, the health of veteran trees was found to be strongly influenced not only by recent climatic conditions but also by the legacy of past extreme events. Although trees T1-T3 have recently experienced a downward trend in LST, their SPAD values remain low and SoT damage rates high as a result of extreme heat events in 2015, 2018, and 2024. This “legacy effect” is consistent with other studies showing that drought-induced xylem dysfunction and canopy loss can persist for several years after stress exposure [6].
This supports the existence of a legacy effect, whereby climate stress transitions from a short-term physiological response to long-term structural damage. A decline in physiological vigor leads to increased branch mortality and crown reduction, and when accumulated over long periods, may result in the development of internal decay and cavities. These findings reaffirm earlier reports [46] that the aftereffects of climate stress can persist for extended periods, impacting tree health long after the initial event. Therefore, the history of climate stress must be carefully considered when evaluating the current condition of veteran trees and when formulating future conservation strategies
Third, climate change contributes to tree decline not only through intensified water stress but also by increasing the frequency and severity of pest and disease outbreaks [27]. Higher temperatures accelerate insect development rates and the number of generations, while drought weakens tree defense mechanisms, thereby facilitating the rapid spread of pests and pathogens [40,47]. In this study, the observed overlap between declines in SPAD and LCR and expansion of internal damage detected by SoT suggests that thermal and moisture stress may interact synergistically with pest and disease pressure. These interactions have also been observed in recent cross-continental analyses of old-growth tree decline [30], underscoring the importance of adaptive management strategies under compound climate stress.
Consequently, the conservation and management of large veteran trees must move beyond simply restoring vitality. An adaptive management approach is required, incorporating:
  • Mitigation of water and heat stress (e.g., soil moisture supplementation, crown relief pruning, and microclimate improvements);
  • Proactive reinforcement and risk management for structurally vulnerable individuals;
  • Integrated pest and disease monitoring.
Although this study was based on a limited sample size (n = 11) and a relatively short observation period, the combined climatic and physiological analysis provides a quantitative foundation for understanding how thermal and moisture stress jointly undermine the vitality and structural integrity of monumental trees. These insights offer a scientific basis for developing adaptive conservation strategies for veteran trees under intensifying climate change.

5. Conclusions

This study comprehensively analyzed soil environment, climate trends, and land surface temperature to identify the factors contributing to the decline in health of veteran Zelkova serrata trees in the Pohang region. The analysis of climatic variables revealed that in the coastal area, annual precipitation has been significantly decreasing. In the inland area, mean VPD has been increasing and relative humidity has been decreasing, indicating a strengthening trend of atmospheric dryness. These patterns suggest that both reduced precipitation supply and increased atmospheric moisture demand are acting simultaneously to intensify water stress.
The LST analysis further demonstrated spatial differences in the warming trends among individual trees, with peak high-temperature events repeatedly occurring in 2015, 2018, and 2024. These extreme heat episodes have had cumulative and long-lasting impacts on tree vitality. To quantitatively reinforce these findings, a non-parametric Spearman correlation analysis was conducted between climatic (LST) and physiological/structural indicators (SPAD_mean, LCR, and SoT). The analysis revealed that LST was weakly negatively correlated with SPAD and LCR, and weakly positively correlated with SoT, indicating that elevated surface temperature is associated with both physiological decline and internal structural deterioration. Notably, SPAD and LCR showed a strong positive correlation (ρ = 0.84, p < 0.01), suggesting that trees with larger crown ratios maintain higher chlorophyll activity even under thermal and moisture stress. These results quantitatively support the interdependence between tree vigor and structural stability under climate-induced stress.
In summary, while the soil conditions and overall site environments of the Pohang veteran trees generally provide favorable conditions for maintaining health, drought signals and heat stress driven by climate change are increasing the physiological burden, and these impacts are manifested differently across individual trees. Therefore, future conservation strategies must focus not only on soil management but also on adaptive measures for drought and high-temperature stress, including practices such as organic mulching, supplemental irrigation, and compaction reduction to enhance moisture retention and heat mitigation.
In particular, the introduction of an early warning system based on the Soil Ecological and Environmental Index (SEEI) could serve as a valuable management tool by regularly monitoring key indicators such as soil moisture, temperature, and organic matter status to detect early signs of vulnerability. Through such a system, when warning signals appear such as a drop in soil moisture below critical thresholds or a rapid increase in surface soil temperature proactive interventions such as irrigation, mulching, shading, or soil amendment can be promptly implemented. This type of early warning system can help minimize damage during extreme climatic events and contribute to the long-term maintenance of both physiological and structural health of veteran trees.
However, this study was based on a limited sample of eleven trees in the Pohang region, so caution is required when generalizing the findings to other species or regions. Moreover, the analysis relied on SPAD, VTA, and SoT measurements at a single time point, which limits the ability to capture seasonal and interannual variability. Therefore, long-term monitoring studies that consider temporal variations are needed.
Future research should integrate drone-based multispectral and thermal imaging, continuous soil moisture monitoring, and pest and disease incidence data to more precisely determine the causal relationships between climate stress and the health of veteran trees.

Author Contributions

Conceptualization, E.G. and G.-S.B.; Methodology, E.G., S.-N.C., I.C. and G.-S.B.; Investigation, E.G., S.-N.C. and I.C.; Writing—original draft preparation, E.G., S.-N.C. and G.-S.B.; Writing—review and editing, E.G. and G.-S.B. All authors have read and agreed to the published version of the manuscript.

Funding

This research was supported by Green Restoration Specialized Graduate Program through the Korea Environmental Industry & Technology Institute (KEITI) funded by the Ministry of Environment (MOE), and by the Dong-A University research fund.

Institutional Review Board Statement

Not applicable.

Informed Consent Statement

Not applicable.

Data Availability Statement

All data of this study are contained within the article.

Acknowledgments

The authors would like to thank to Editor, Reviewers for their contribution to make this article better for publication.

Conflicts of Interest

Author Inyoung Choy was employed by Eoulim Landscape Co., Ltd.. The remaining authors declare that the research was conducted in the absence of any commercial or financial relationships that could be construed as a potential conflict of interest.

Abbreviations

The following abbreviations are used in this manuscript:
VPDvapor pressure deficit
LSTLand surface temperature
SPADSoil plant analysis development
LCRLive crown ratio
VTAVisual tree assessments
SoTSonic tomography
DBHDiameter at breast height
THTree height
BDBranch diameter
SDStem diameter
ECElectrical conductivity
USDAUnited states department of agriculture
KMAKorea Meteorological administration
AWSAutomatic weather system
RHRelative humidity
MKMann–Kendall
TFPW-MKTrend-free-pre-whitening Mann–Kendall
GEEGoogle Earth Engine
FvFraction vegetation
NDVINormalized difference vegetation index
CDDConsecutive dry days
SEEISoil ecological and environmental index

Appendix A

Appendix A.1

Figure A1. Results of the sonic tomography assessment showing the internal decay (cavity and fungal-induced defects) of the 11 surveyed ancient Zelkova serrata trees. Panels (1)–(11) correspond to individual trees T1~T11, where the color scale represents the tomographic velocity used to visualize sound wood and decayed areas. Blue and purple indicate sound wood, whereas green to brown colors represent progressive stages of internal decay. Yellow lines denote the measurement axes of the tomographic sensors.
Sustainability 17 09636 g0a1aSustainability 17 09636 g0a1b

Appendix A.2

Figure A2. Historical (left) and recent (right) high-resolution satellite images illustrating land-cover and surrounding environmental changes at the locations of the surveyed ancient Zelkova serrata trees in Pohang, Korea. The arrows in each picture indicate the location of the tree.
Sustainability 17 09636 g0a2aSustainability 17 09636 g0a2bSustainability 17 09636 g0a2c
Panels (1)~(22) present paired images of each tree site: the left image corresponds to the historical scene and the right image to the present scene. White arrows indicate the precise location of each tree. Scale bars (40 m) and north arrows are provided for spatial reference. Basemap sources: ©Google Earth, Maxar Technologies.

References

  1. Ahn, S.; Dedekorkut-Howes, A. The Heat Is on: How Well Are Densely Populated Korean Cities Adapting to Increased Temperatures and Urban Heat Island Effect? Environments 2025, 12, 87. [Google Scholar] [CrossRef]
  2. Allen, C.D.; Breshears, D.D.; McDowell, N.G. On underestimation of global vulnerability to tree mortality and forest die-off from hotter drought in the Anthropocene. Ecosphere 2015, 6, 129. [Google Scholar] [CrossRef]
  3. Allen, C.D.; Macalady, A.K.; Chenchouni, H.; Bachelet, D.; McDowell, N.; Vennetier, M.; Kitzberger, T.; Rigling, A.; Breshears, D.D.; Hogg, E.H.; et al. A Global Overview of Drought and Heat Induced Tree Mortality Reveals Emerging Climate Change Risks for Forests. For. Ecol. Manag. 2010, 259, 660–684. [Google Scholar] [CrossRef]
  4. Anderegg, W.R.L.; Hicke, J.A.; Fisher, R.A.; Allen, C.D.; Aukema, J.; Bentz, B.; Hood, S.; Lichstein, J.W.; Macalady, A.K.; McDowell, N.; et al. Tree Mortality from Drought, Insects, and Their Interactions in a Changing Climate. New Phytol. 2015, 208, 674–683. [Google Scholar] [CrossRef]
  5. Atar, F.; Güney, D.; Bayraktar, A.; Yıldırım, N.; Turna, İ. Seasonal change of chlorophyll content (SPAD value) in some tree and shrub species. Turk. J. For. Sci. 2020, 4, 245–256. [Google Scholar] [CrossRef]
  6. Bennett, A.C.; McDowell, N.G.; Allen, C.D.; Anderson-Teixeira, K.J. Larger Trees Suffer Most During Drought in Forests Worldwide. Nat. Plants 2015, 1, 15139. [Google Scholar] [CrossRef] [PubMed]
  7. Climdex Project. ETCCDI/Climdex Definitions of Climate Extremes Indices. Available online: https://www.climdex.org/learn/indices/ (accessed on 17 September 2025).
  8. Donnelly, A.B.; Yu, R.; Rehberg, C.; Meyer, G.; Young, E.B. Leaf chlorophyll estimates of temperate deciduous shrubs during autumn senescence using a SPAD-502 meter and calibration with extracted chlorophyll. Ann. For. Sci. 2020, 77, 30. [Google Scholar] [CrossRef]
  9. Fay, N. Environmental arboriculture, tree ecology and veteran tree management. Arboric. J. 2002, 26, 213–238. [Google Scholar] [CrossRef]
  10. Gilbert, G.S.; Ballesteros, J.O.; Barrios-Rodriguez, C.A.; Bonadies, E.F.; Cedeño-Sánchez, M.L.; Fossatti-Caballero, N.J.; Trejos-Rodríguez, M.M.; Pérez-Suñiga, J.M.; Holub-Young, K.S.; Henn, L.A.W.; et al. Use of Sonic Tomography to Detect and Quantify Wood Decay in Living Trees. Appl Plant Sci 2016, 4, 1–13. [Google Scholar] [CrossRef] [PubMed]
  11. Gilman, E.F. An Illustrated Guide to Pruning, 3rd ed.; Delmar Cengage Learning: Boston, MA, USA, 2013; p. 352. [Google Scholar]
  12. Grossiord, C.; Buckley, T.N.; Cernusak, L.A.; Novick, K.A.; Poulter, B.; Siegwolf, R.T.W.; Sperry, J.S.; McDowell, N.G. Plant responses to rising vapor pressure deficit. New Phytol. 2020, 226, 1550–1566. [Google Scholar] [CrossRef]
  13. Hanum, S.F.; Darma, I.D.P.; Atmaja, M.B.; Oktavia, G.E.A. Tree Risk Assessment with Sonic Tomograph Method at Bali Botanical Garden. J. Manaj. Hutan Trop. 2020, 26, 233–243. [Google Scholar] [CrossRef]
  14. Hirons, A.D.; Thomas, P.A. Applied Tree Biology; Wiley-Blackwell: Hoboken, NJ, USA, 2018. [Google Scholar]
  15. IPCC. Climate Change 2023: Synthesis Report; Contribution of working groups I, II and III to the sixth assessment report of the Intergovernmental Panel on Climate Change; Lee, H., Romero, J., Eds.; Intergovernmental Panel on Climate Change: Geneva, Switzerland, 2023. [Google Scholar]
  16. Jim, C.Y.; Ng, E. Urban forestry as a climate mitigation strategy using tree canopy in compact cities. Landsc. Urban Plan. 2018, 169, 250–264. [Google Scholar] [CrossRef]
  17. Jung, J.S.; Lee, G.G.; Son, J.W.; Kim, C.W.; Ahn, Y.J. Photosynthetic responses of large old Zelkova serrata trees to different growth environments. Sci. Rep. 2023, 13, 20205. [Google Scholar] [CrossRef]
  18. Kim, H.J.; Yoon, Y.H.; Park, B.J.; Kim, W.T. A Study on the Growth Environment and Management of Protected Trees in Seoul- Focused on Zelkova serrata. J. Korean Inst. Tradit. Landsc. Archit. 2007, 25, 127–140. [Google Scholar]
  19. Korea Meteorological Administration (KMA). Impact-Based Heat Wave Forecasts (Industry Leaflet). Available online: https://www.weather.go.kr/wnuri_help/doc/heatwave_leaflet_eng.pdf (accessed on 19 October 2025).
  20. Lindenmayer, D.B.; Laurance, W.F.; Franklin, J.F. New insights into the value of large old trees. Trends Ecol. Evol. 2014, 29, 364–371. [Google Scholar]
  21. Kobayashi, H.; Kondo, R.; Yamaguchi, Y. Parameter Identification of a Stomatal Conductance Model for the Prediction of Evapotranspiration from Zelkova serrata Street Trees. J. Environ. Eng. 2021, 86, 377–387. [Google Scholar] [CrossRef]
  22. Mattheck, C.; Bethge, K.; Webber, K. The Body Language of Trees: Encyclopedia of Visual Tree Assessment; Karlsruhe Institute of Technology: Karlsruhe, Germany, 2015; p. 548. [Google Scholar]
  23. McDowell, N.; Pockman, W.T.; Allen, C.D. Mechanisms of Plant Survival and Mortality during Drought: Why Do Some Plants Survive While Others Succumb? New Phytol. 2008, 178, 719–739. [Google Scholar] [CrossRef]
  24. Monserud, R.A.; Sterba, H. Modeling individual tree mortality for Austrian forest species. For. Ecol. Manag. 1999, 113, 109–123. [Google Scholar] [CrossRef]
  25. Munné-Bosch, S. Limits to tree growth and longevity. Trends Plant Sci. 2018, 23, 985–993. [Google Scholar] [CrossRef]
  26. National Research Institute of Cultural Heritage. Manual for Risk Diagnosis of Natural Monument Veteran Trees; National Research Institute of Cultural Heritage: Daejeon, Republic of Korea, 2016; p. 53. (In Korean) [Google Scholar]
  27. Wonn, H.T.; O’Hara, K.L. Height:Diameter Ratios and Stability Relationships for Four Northern Rocky Mountain Tree Species. West. J. Appl. For. 2001, 16, 87–94. [Google Scholar] [CrossRef]
  28. Pearson, R.G.; Phillips, S.J.; Loranty, M.M.; Beck, P.S.A.; Damoulas, T.; Knight, S.J.; Goetz, S.J. Shifts in Arctic vegetation and associated feedbacks under climate change. Nat. Clim. Change 2013, 3, 673–677. [Google Scholar] [CrossRef]
  29. Quinteros-Gómez, Y.; Angulo, A.; Rojas-Briceño, N.B.; Medina-Sánchez, J.; Huamán-Delgado, M.; Sarmiento, L.; Balarezo, E.; Portocarrero, J.; Arce-Peña, N. Noninvasive Sonic Tomography for the Detection of Internal Defects in Relict Woodlands of Polylepis in Peru. Forests 2025, 16, 957. [Google Scholar] [CrossRef]
  30. Hamed, K.H. Trend Detection in Hydrologic Data: The Mann–Kendall Trend Test under the Scaling Hypothesis. J. Hydrol. 2008, 349, 350–363. [Google Scholar] [CrossRef]
  31. Sekertekin, A.; Bonafoni, S.; Bektas Balcik, F. Land Surface Temperature Retrieval from Landsat 5, 7, and 8 Over Rural Areas: Assessment of Accuracy and Comparison of Different Emissivity Models. Remote Sens. 2020, 12, 294. [Google Scholar] [CrossRef]
  32. Zhang, L.; Zhang, Y.; Qin, Q.; Li, W.; Chen, H. Retrieval and Validation of Land Surface Temperature from Landsat 8 TIRS Using Various Emissivity Models and Atmospheric Correction Algorithms. Remote Sens. 2022, 14, 2105. [Google Scholar] [CrossRef]
  33. Rao, S.; Allen, C.D.; Breshears, D.D.; Macalady, A.K. Climate-induced tree mortality in North America: A review of patterns and mechanisms. Forests 2020, 11, 797. [Google Scholar]
  34. Uddling, J.; Gelang-Alfredsson, J.; Piikki, K.; Pleijel, H. Evaluating the relationship between leaf chlorophyll concentration and SPAD-502 chlorophyll meter readings. Photosynth. Res. 2007, 91, 37–46. [Google Scholar] [CrossRef]
  35. Harris, R.W.; Clark, J.R.; Matheny, N.P. Arboriculture: Integrated Management of Landscape Trees, Shrubs, and Vines, 6th ed.; Bioscience Publishing: Richmond, BC, Canada, 2021; p. 417. [Google Scholar]
  36. Yue, S.; Wang, C.Y. The Mann–Kendall Test Modified by Effective Sample Size to Detect Trend in Serially Correlated Hydrological Series. Water Resour. Manag. 2004, 18, 201–218. [Google Scholar] [CrossRef]
  37. Burnham, K.P.; Anderson, D.R. Model Selection and Multimodel Inference: A Practical Information-Theoretic Approach, 2nd ed.; Springer: New York, NY, USA, 2002. [Google Scholar]
  38. Roman, L.A.; Battles, J.J.; McBride, J.R. Urban Tree Mortality: A Primer on Demographic Approaches; Technical Report NRS-158; U.S. Department of Agriculture, Forest Service, Northern Research Station: Newtown Square, PA, USA, 2016; p. 24. [Google Scholar]
  39. Ryan, M.G.; Yoder, B.J. Hydraulic Limits to Tree Height and Tree Growth. BioScience 1997, 47, 235–242. [Google Scholar] [CrossRef]
  40. Seidl, R.; Thom, D.; Kautz, M.; Martin-Benito, D.; Peltoniemi, M.; Vacchiano, G.; Wild, J.; Ascoli, D.; Petr, M.; Honkaniemi, J.; et al. Forest Disturbances under Climate Change. Nat. Clim. Change 2017, 7, 395–402. [Google Scholar] [CrossRef]
  41. Sepúlveda, P.; Johnstone, D.M. A novel way of assessing plant vitality in urban trees: Comparison between bark and leaf chlorophyll fluorescence and visual vitality index. Forests 2018, 10, 2. [Google Scholar] [CrossRef]
  42. Son, J.; Lee, G.; Shin, J. Reliability of noninvasive sonic tomography for the detection of internal defects in old, large trees of Abies holophylla Maxim. Forests 2021, 12, 1131. [Google Scholar] [CrossRef]
  43. Stephenson, N.L.; Das, A.J.; Condit, R.; Russo, S.E.; Baker, P.J.; Beckman, N.G.; Zavala, M.A. Rate of tree carbon accumulation increases continuously with tree size. Nature 2014, 507, 90–93. [Google Scholar] [CrossRef] [PubMed]
  44. Stevens-Rumann, C.S.; Kemp, K.B.; Higuera, P.E.; Harvey, B.J.; Rother, M.T.; Donato, D.C.; Morgan, P.; Veblen, T.T. Evidence for declining forest resilience to wildfires under climate change. Ecol. Lett. 2018, 21, 243–252. [Google Scholar] [CrossRef] [PubMed]
  45. Stovall, A.E.L.; Shugart, H.; Yang, X. Tree height explains mortality risk during an intense drought. Nat. Commun. 2019, 10, 4385. [Google Scholar] [CrossRef] [PubMed]
  46. Williams, A.P.; Allen, C.D.; Millar, C.I.; Swetnam, T.W.; Michaelsen, J.; Still, C.J.; Leavitt, S.W. Forest responses to increasing aridity and warmth in the southwestern United States. Proc. Natl. Acad. Sci. USA 2010, 107, 21289–21294. [Google Scholar] [CrossRef]
  47. Korea Forest Service. Status of Designated Protected Trees in Korea as of the End of December 2023; Forest Environment Protection Division, Korea Forest Service: Daejeon, Republic of Korea, 2024; Available online: https://www.forest.go.kr (accessed on 19 October 2025).
Figure 1. Location of the study sites of ancient Zelkova serrata (old large trees) in the Pohang region, southeastern Korea. The right panel presents the detailed distribution of the eleven investigated veteran trees (yellow numbered points) overlaid on a satellite basemap.
Sustainability 17 09636 g001
Figure 2. Research framework for 11 ancient Zelkova serrata trees in the Pohang region, showing the integrated process of growth condition assessment, environmental factor analysis, and climate change correlation leading to overall conclusions.
Sustainability 17 09636 g002
Figure 3. Process of sonic tomography using the PICUS 3 (Argus Electronic GmmbH) system. source: https://www.iml-electronic.com (accessed on 1 March 2025).
Sustainability 17 09636 g003
Figure 4. Photographs of the 11 investigated ancient Zelkova serrata trees in the Pohang region. Panels (ak) correspond to tree numbers T1–T11, respectively.
Sustainability 17 09636 g004
Figure 5. Temporal trends of Land Surface Temperature (LST) for each of the eleven sampled trees from 2000 to 2025. Each colored line represents a distinct tree, illustrating interannual variability and long-term thermal exposure patterns.
Sustainability 17 09636 g005
Figure 6. Spatial distribution of summer Land Surface Temperature (LST) in the Pohang region for selected years (2000, 2005, 2010, 2015, 2020 and 2025).
Sustainability 17 09636 g006
Table 1. Evaluation items and criteria for veteran-tree risk assessment, summarizing thresholds for crown dieback, live branch ratio, branch attachment strength, branch angle, and stem tilt (adapted from the Veteran Tree Risk Management Manual; National Research Institute of Cultural Heritage, 2016).
Evaluation IndicatorFormulaVulnerability Assessment CriteriaNotes
TaperingTree height (TH)/Diameter at breast height (DBH)<40: Low40~50: ModerateSustainability 17 09636 i001
50~60: Likely>60: High
Live Crown RatioHeight of live crown/ Total tree height>0.6: Low0.6~0.4: Moderate
0.4~0.2: Likely<0.2: High
Branch Attachment StrengthBranch diameter(BD)/Stem diameter(SD)<0.25: Low0.25~0.5: ModerateSustainability 17 09636 i002
0.5~0.75: Likely>0.75: High
Branch crotch AngleBranch angle (°)>70°: Low50~70°: ModerateSustainability 17 09636 i003
30~50°: Likely>30°: High
Stem LeanAngle between the vertical ground line and the trees center of gravity<10°: Low10~15°: ModerateSustainability 17 09636 i004
15~20°: Likely>20°: High
Source: Risk Management Manual for Natural Monument Veteran Trees [27].
Table 2. Current structural attribute of the 11 ancient Zelkova serrata trees in the Pohang region.
No.LocationAge
(Year)
DBH
(m)
Height
(m)
Canopy Spread (m)
LongitudeLatitude
1129.2458°36.19671°4086.23028.5
2129.2424°36.2845°3333.52319
3129.311°36.08906°5433.5528.523
4129.4868°35.98438°3334.412.29
5129.4527°35.97121°3434.516.213
6129.5423°35.98209°1832.516.913
7129.5375°35.94889°493512.510
8129.5284°35.94486°3934.611.512.5
9129.4638°35.96058°3434.82115
10129.4492°35.91171°3062.41512
11129.5016°35.88731°4432.72016
Mean ± SD-375 ± 1134.01 ± 1.1918.85 ± 6.3114.86 ± 6.64
Table 3. SPAD measurements of 11 ancient Zelkova serrata trees in the Pohang region, showing relative chlorophyll content (SPAD units) on the east, west, south, and north sides of the canopy and the overall mean ± SD.
No.East
(SPAD Units)
West
(SPAD Units)
South
(SPAD Units)
North
(SPAD Units)
Ave.
(SPAD Units)
Vigor Rating
149.61339.73847.15748.08846.149high
243.71237.47541.848.52542.878high
332.78331.45731.11732.88432.06moderate
435.96340.73836.71336.66337.519moderate
540.58830.6535.23839.36336.46moderate
634.78835.37537.33829.68834.297moderate
737.38839.6535.32528.93835.325moderate
836.41340.38837.37538.13838.079moderate
937.0538.31322.01336.16333.384moderate
1043.18839.11337.61347.2541.791high
1133.32528.88841.33830.1533.675moderate
Table 4. Results of the visual tree assessment (VTA) for 11 ancient Zelkova serrata trees, showing the measured values and risk ratings.
No.T (1)LCR (2)BAS (3)BCA (4)SL (5)
ValueRatingValueRatingValueRatingValueRatingValueRating
139Low0.8Low0.48Moderate64Moderate6Low
264High0.8Low0.3Moderate49.5Likely13.5Moderate
346Moderate0.2Moderate0.42Moderate56Moderate9Low
486High0.2Moderate0.74Likely59Moderate10.6Moderate
580High0.2Moderate0.3Moderate46Likely23High
681High0.1High0.34Moderate64Moderate38High
770High0.2High0.52Moderate69Moderate23High
864High0.24Likely0.4Moderate67Moderate13Moderate
959Likely0.13High0.4Moderate74Low9Low
1056Likely0.7Low0.21Low63Moderate11Moderate
1166High0.2Moderate0.8High70Moderate14Moderate
Mean ± SD64.64 ± 14.500.34 ± 0.280.45 ± 0.1861.95 ± 8.6515.46 ± 9.22
(1) Tapering, (2) Live Crown Ratio, (3) Branch Attachment Strength, (4) Branch Crotch Angle, (5) Stem Lean.
Table 5. Results of internal decay assessment of the 11 ancient Zelkova serrata trees using PICUS sonic tomography (SoT).
No.Measured Height
(GL + m)
Estimated Damaged Area (1)
(%)
Sound Wood Ratio (2)
(%)
Risk Grade (3)
11.00 m6337E
20.85 m1474B
30.80 m3347C
40.70 m3354C
50.55 m3254C
61.60 m2556C
71.00 m2851C
80.68 m3649C
91.00 m194A
100.70 m4148C
110.80 m2266C
Mean ± SD-29.82 ± 15.6857.27 ± 15.61-
(1) Estimated Damaged Area (%): Proportion of cross-sectional area affected by decay or cavities, estimated by SoT. (2) Sound Wood Ratio (%): Proportion of structurally sound tissue. (3) Risk Grade: Classified according to the risk assessment criteria (A: Safe ~E: Very High Risk).
Table 6. Results of trend analysis of Ey climate variables (1997–2024) at three Aws stations (804, 816, 830) in the Pohang region.
VariableStationKendall’s Taup-ValueSen’s SlopeTrend Direction
Hot 30_days8040.53900.00009512.92
816−0.45210.00106−1.4
8300.69740.0000007150.6
Hot 35_days8040.6970.0000007151.2
816−0.5230.000238−1.33
8300.6800.0000008340.544
PRCP_sum_mm804−0.18520.182138−11.4583-
816−0.28210.041053−17.6667
830−0.13960.316995−7.25-
VPD_mean_kPa8040.15090.2812950.0011-
816−0.42450.001573−0.0044
8300.61250.0000020.0049
VPD_p95 kPa804−0.10540.456649−0.0018-
816−0.51570.00009−0.0169
8300.55560.00002−0.0294
RH_mean_pct804−0.17950.198177−0.1962-
8160.51570.000090.2076
830−0.52710.000059−0.2306
Note. Station 804 corresponds to Trees T1~T2, Station 816 to Trees T4~T11, and Station 830 to Tree T3.
Table 7. Summary of summer Land Surface Temperature (LST) statistics and long-term trends (2000–2025) for each old-tree site in the Pohang region.
No.LST_MeanSlopeR2p-ValueMK_pSenSlopeAICBICDWDW_pShapiro_p
133.293733.25240.07620.17240.05800.1251113.069116.8431.4800.0560.213
230.722431.42700.22730.01380.01060.1657122.633126.4081.8480.2700.340
333.321033.84630.00720.68120.65930.0580132.094135.8681.7080.1630.129
433.163035.39380.14260.05720.05800.1490125.323129.0971.5780.0920.293
534.494936.00910.09680.12190.05240.1428128.467132.2411.4590.0490.351
633.441334.81340.29630.00400.02190.2159126.704130.4781.1860.0080.117
732.249333.78590.09790.11960.13390.1168130.849134.6232.2560.6720.687
833.276334.30790.29040.00450.00820.1811120.826124.6011.6440.1250.481
932.527133.65750.07830.16620.13390.1182123.579127.3531.5330.0740.780
1032.271733.94030.07830.16620.25170.1146127.816131.5912.0480.4620.919
1132.951833.58280.14390.05590.07070.1188124.089127.8631.5480.0800.987
Disclaimer/Publisher’s Note: The statements, opinions and data contained in all publications are solely those of the individual author(s) and contributor(s) and not of MDPI and/or the editor(s). MDPI and/or the editor(s) disclaim responsibility for any injury to people or property resulting from any ideas, methods, instructions or products referred to in the content.