Abstract
The ecological protection and high-quality development of the Yellow River Basin is a major national strategy in China. The Yellow River “Ji” Bay is an important part of the basin. This study evaluates the comprehensive risk of the water–energy–food–ecology–carbon (WEFEC) complex system within the “Ji” Bay. Using 2004–2023 panel data from nineteen regional cities, this study develops a 24-indicator WEFEC index system that assesses reliability, synergy, and resilience. A comprehensive evaluation method based on the game theory–cloud model is employed to determine the risk levels. The study results show the following: (1) the multi-year average comprehensive risk of the WEFEC complex system in the “Ji” Bay from 2004 to 2023 was at a high alert level; (2) the overall synergy of the “Ji” Bay was moderate; (3) spatially, the number of cities in extreme and high alert states decreased, whereas the number of cities in no alert and light alert states increased; and (4) indicators such as per capita water resources, water production modulus, and water area ratio are the main factors restricting the comprehensive risk of the WEFEC complex system. Based on these findings, this paper proposes policy recommendations using the following three aspects: criterion layers, risk factors, and different regions.
1. Introduction
There is a high degree of interdependence among water resources, energy, food, ecology, and carbon emissions [1,2,3]. Research focusing solely on one or two of these systems may result in resource depletion, environmental damage, and vicious competition among systems. Therefore, a comprehensive study of water, energy, food, ecology, and carbon emissions is essential. More than 90% of global freshwater resources are used for agricultural production [4], whereas energy extraction necessitates significant water consumption. Global demand for water, energy, and food is expected to rise by approximately 40%, 50%, and 35%, respectively, by 2030 [5], while the population is expected to reach 8.5 billion, resulting in severe resource shortages. By 2050, energy-related carbon dioxide emissions are expected to rise by 70% [6]. Food production and water resource development and utilization both consume energy and emit carbon dioxide, thereby affecting the ecological environment. Studies have shown that carbon emissions from urban water systems account for 12% of total emissions [7], while the Intergovernmental Panel on Climate Change (IPCC) reports that agricultural production accounts for approximately 13.5% of global carbon emissions [8]. According to the IPCC’s Sixth Assessment Report, global surface temperatures from 2011 to 2020 increased by 1.09 °C compared to the 1850–1900 period. The report further highlights that global warming caused by carbon emissions is irreversible on time scales of hundreds to thousands of years [9], which will pose a serious risk of global warming. Additionally, the annual report of the 2011 World Economic Forum (WEF) listed water, energy, and food, as resource risks; these issues are interrelated, and, specifically, core resource shortages can lead to more conflicts among relevant groups, countries, and industries [10]. In 2015, the United Nations proposed seventeen Sustainable Development Goals (SDGs) [11]; in particular, SDG 2 (End Hunger), SDG 7 (Affordable and Clean Energy), SDG 13 (Climate Action), and SDG 15 (Life on Land) are closely linked to water, energy, food, ecology, and carbon emissions. Thus, research on WEFEC complex system is urgently needed.
In recent years, system analysis frameworks, such as water–energy–food (WEF), water–energy–carbon (WEC), and water–energy–food–ecology (WEFE), have gradually gained prominence in the understanding of the interactions of complex resource systems. Following the Bonn Conference in 2011, numerous theoretical and practical studies on WEF relationships emerged internationally. With the escalation of ecological damage and global warming risks, research on relationships such as WEC, WEFE, and water–energy–food–carbon (WEFC) has emerged. de Amorim et al. argued that water, energy, and food are interdependent and critical resources, and that economic, political, and technological factors can all have an impact on these resources to varying degrees [12]. Zeng et al. used global climate models (GCMs) to simulate real life and found that reservoir operations and water resource allocation can effectively reduce risks in water and food systems [13]. Carbon emissions are clearly present in the energy industry, as well as in all stages of agricultural production, exacerbating climate change risks [14]. Feng et al. revealed the impact mechanism of land use change on the coupling relationship of WEC, and predicted through a system dynamics (SD) model that human settlements and mining/manufacturing land use consume large amounts of water and energy, whereas cultivated land shows high water consumption, low energy consumption, and carbon emissions [15]. Chamas et al. incorporated the carbon cycle into the optimization model of water, energy, and food, revealing the complexity and interconnection of these systems [16]. Liu et al. constructed a complex mega-system focusing on water, energy, food, ecology, and economic, social, and environmental aspects [17]. The framework emphasizes the interdependence of resource sub-systems and the importance of cross-sectoral collaborative management, offering a systematic approach to addressing resource scarcity risks and ecological protection contradictions.
The imbalance of the WEFEC system has resulted in severe resource crises and ecological degradation. In North China, the supply–demand relationship between water resources and food production is out of balance, with extensive groundwater extraction leading to ecological issues such as the shallow groundwater depth in the Taihang Mountain piedmont plain generally reaching 30–50 m, forming multiple groundwater funnels, and 23 out of 27 main rivers in the Haihe River Basin drying up or ceasing flow due to a significant reduction in groundwater recharge [18]. Existing risk studies focus on resource scarcity and supply–demand risks in the three systems of water, energy, and food. For example, Chen et al. used material flow analysis to study the food–energy–water interrelated risks on Jinmen Island, finding that associated risks mainly stem from resource consumption [19]; Cui et al. used a fuzzy comprehensive risk assessment model (FCRAM) to evaluate the sustainable development of water, energy, food, and carbon in agricultural irrigation and drainage systems [20]. Additionally, methods such as the copula function [21] and Bayesian networks [22] have been used to evaluate complex systems. However, the above studies only consider three or four distinct sub-systems. Failure to integrate the climate effects of carbon emissions with the regulatory functions of ecosystems and the provisioning functions of resource systems into a unified synergistic analysis framework makes it difficult to reflect the chain-like risk transmission mechanism of carbon constraints–ecological responses–resource supply and demand. Research on ecologically fragile regions (such as arid and semi-arid watersheds) often focuses on single resources or isolated ecological issues. It fails to establish integrated assessment frameworks for synergistic risks involving carbon, ecology, and resources that account for regional characteristics. Consequently, evaluation outcomes struggle to support coordinated governance decisions across departments and regions.
As the cradle of Chinese civilization and an important economic belt, the ecological protection and high-quality development of the Yellow River Basin have been elevated to a national strategic level [23]. The Yellow River “Ji” Bay region includes the following four provinces: Gansu, Ningxia, Inner Mongolia, and Shaanxi. It serves as both an ecological barrier in northern China but also an important hub for regional economic collaborative development. It faces multiple challenges, including water resource shortage, an imbalanced energy structure, and food security concerns. This region includes arid and semi-arid climate zones, the Loess Plateau soil erosion area, and grassland ecological fragile areas [24]. The stability of its WEFEC complex system and the sustainability of resource systems are inextricably linked to the overall risk level and economic development pattern of the Yellow River Basin and even the entire country.
Starting with “single-system endowment conditions, dual-system coordination status, and multi-system risk resistance capabilities,” this paper chooses reliability, synergy, and resilience as criterion layers and proposes a comprehensive risk-based analysis on WEFEC, specifically including resource shortage risks in water, energy, and food, ecological damage risks, and climate warming risks caused by excessive carbon emissions. By compiling and analyzing long-term serial data from 2004 to 2023 across 19 core cities in the Yellow River “Ji” Bay, and introducing a cloud model comprehensive evaluation method, risk levels were effectively characterized. Integration with a risk factor model enabled the precise identification of the system’s comprehensive risk determinants. This study not only fills the gap in the multi-dimensional collaborative assessment of the WEFEC system in the Yellow River “Ji” Bay but also provides a reproducible localized solution for the coordinated development of resources–ecology–economy in arid and semi-arid regions, offering important references for the sustainable management of similar ecologically fragile areas globally.
2. Study Area and Methods
2.1. WEFEC Research Framework
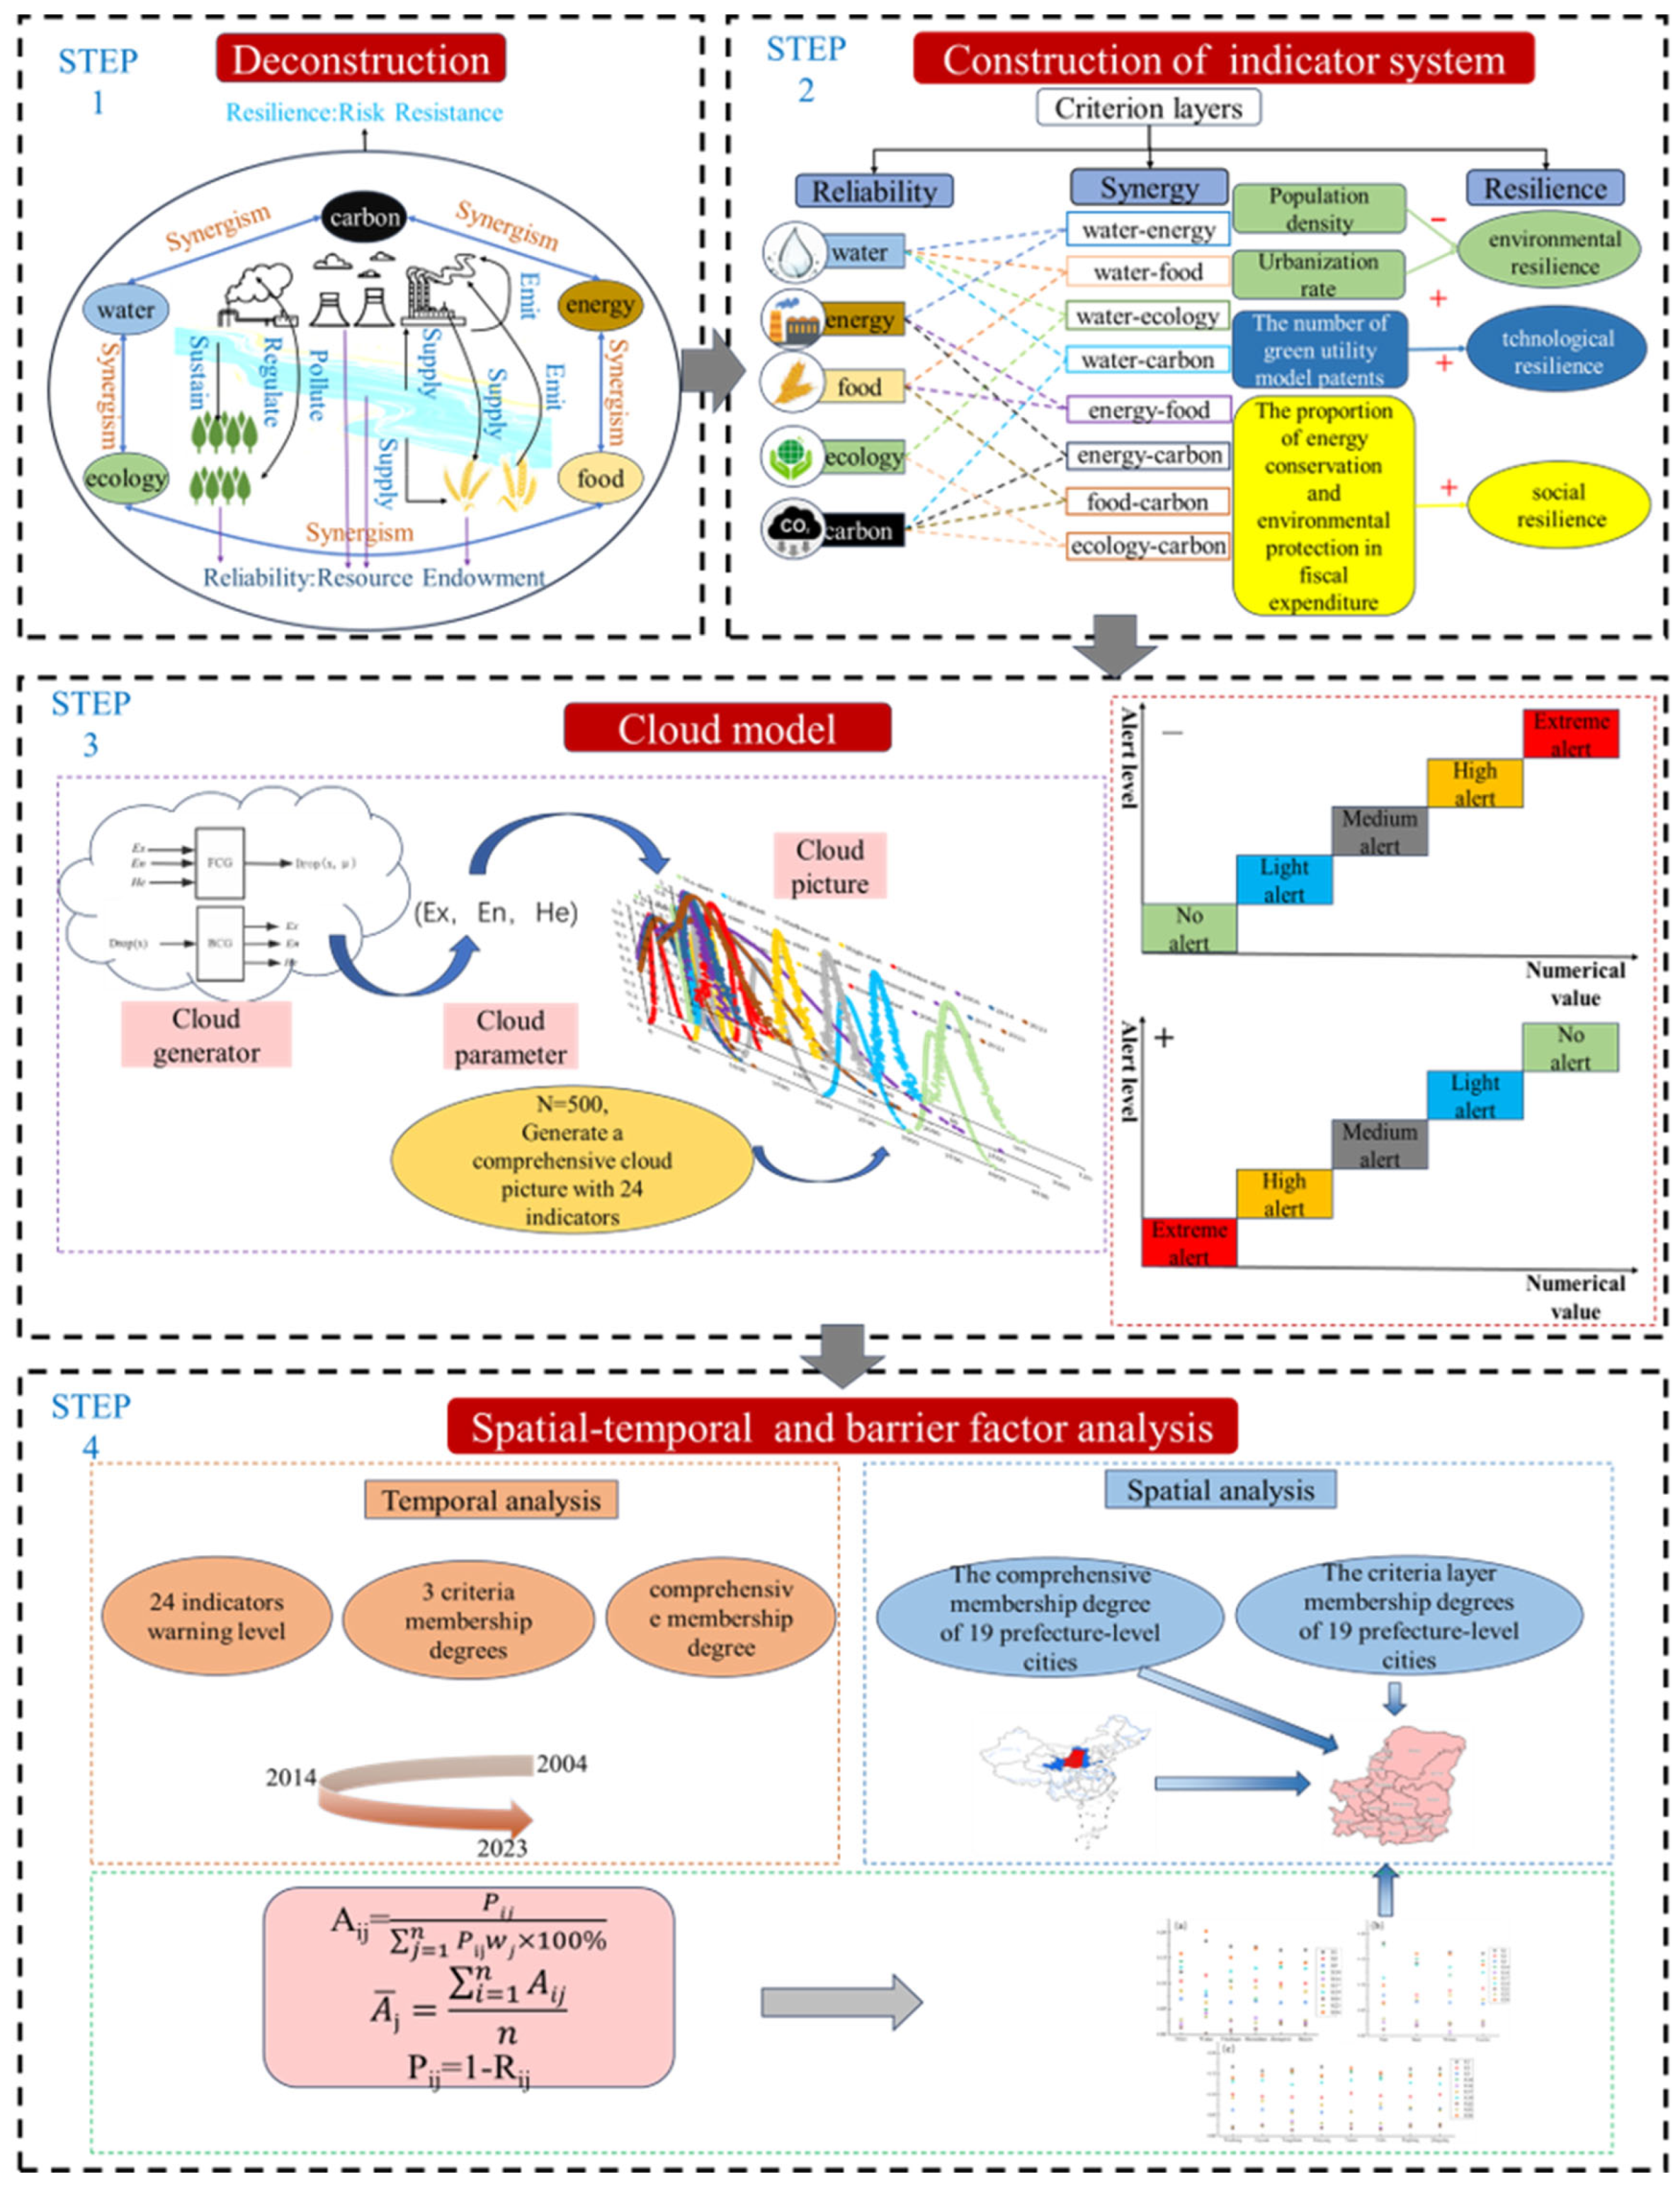
This study focuses on the interdependent relationships of the WEFEC complex system in the Yellow River “Ji” Bay. The first step entails disassembling the WEFEC complex system to analyze the interrelationships between the water, energy, food, ecology, and carbon sub-systems, and the reliability, synergy, and resilience criteria layers. The second step entails developing a risk evaluation index system for the “Ji” Bay WEFEC complex system, guided by the dimensions of reliability, synergy, and resilience. The third step is to use the cloud model to obtain cloud pictures, membership degrees, and risk level calculation results. The fourth step is to analyze the “Ji” Bay in temporal and spatial dimensions based on the cloud model calculation results, diagnose risk factors, and form a technical path of “deconstruction–modeling–assessment–diagnosis.” The research technical route of this paper is shown in Figure 1.
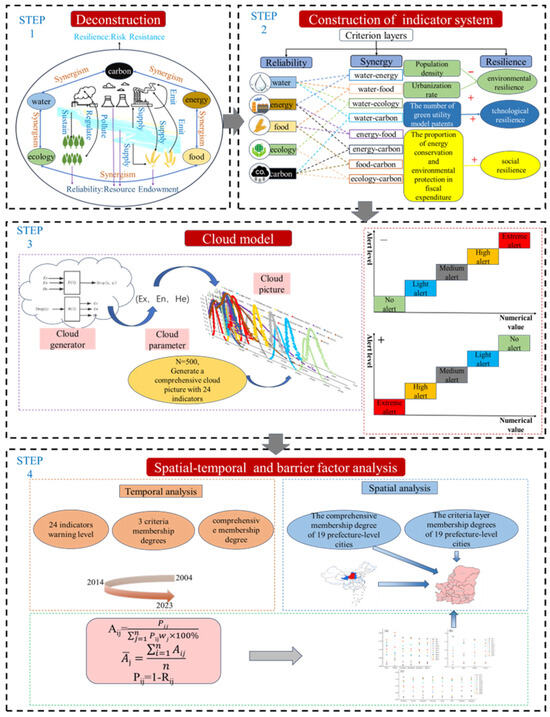
Figure 1.
Technical approach.
2.2. WEFEC Comprehensive Evaluation Indicator System Construction
An evaluation index system of the WEFEC system was developed using scientific, rational, and feasible principles. Starting with three aspects—reliability, synergy, and resilience—24 secondary indicators reflecting the characteristics of the Yellow River “Ji” Bay were chosen. Among them, reliability refers to the ability of the five sub-systems (water, energy, food, ecology, and carbon emissions) to maintain the normal operation of the entire complex system, as measured by each sub-system’s resource quantity status such as water resource level, energy consumption level, and food production level. Reliability indicators can directly reflect the constraints of resource baseline conditions on the system; the WEFEC sub-systems are interdependent. For example, agricultural production depletes water resources and emits carbon gases, and excessive groundwater extraction to ensure food production will exacerbate ecological degradation. Synergy is based on sub-systems’ interconnection and dependency, which reflect the system’s collaborative mechanism. Synergy indicators can quantify the degree of conflict and coordination between sub-systems. Resilience focuses not only on current risks but also on the system’s recovery potential through policy and technical interventions.
Based on the previous studies [25,26,27,28,29], each indicator was divided into the following five levels: no alert, light alert, medium alert, high alert, and extreme alert. For indicators lacking a unified classification standard, the methods in the references [30,31] were used for classification. The coordination degree evaluation index system for the WEFEC system, including the meanings, attribute types, units, and alert thresholds of each indicator, are shown in Table 1.

Table 1.
Risk evaluation index system for the complex system of WEFEC in the Yellow River “Ji” Bay.
2.3. Weight Calculation
This paper summarizes common weighting calculation methods used in fields such as ecological risk assessment and water resource carrying capacity evaluation, along with their advantages, shortcomings, and application scenarios, as shown in Table 2.

Table 2.
Summary of common weight calculation methods.
This paper involves a large volume of data, and the indicators exhibit feedback and interdependent relationships. Therefore, the analytic network process (ANP) is employed to calculate subjective weights, while the entropy weight method is used to determine objective weights. By combining these weights through game theory, the accuracy of weighting is enhanced.
2.3.1. Analytic Network Process (ANP)
In real-world decision-making problems, the “independence” of factors is often an idealized assumption, while “interdependence” is the norm. Compared to the traditional analytic hierarchy process (AHP), the analysis network process (ANP) achieves its greatest breakthrough by breaking away from AHP’s rigid assumptions of “hierarchical structure and element independence,” better aligning with the complex interdependent relationships among factors in practical scenarios. ANP constructs network relationships to characterize the associative properties among criteria, quantifies the ultimate impact levels across control layers, and generates a supermatrix for analysis. Weight calculations based on the ANP method can be implemented using Super Decision 3.2 software.
2.3.2. Entropy Weight Method
The basic idea behind the entropy weight method is to determine the weights of each indicator based on the degree of variation in each variable, then make adjustments to obtain relatively objective weights, the magnitude of which can reflect the extent to which the indicator plays a role in decision-making.
Suppose there are m survey objects and n evaluation indicators. The algorithm is as follows:
(1) Standardize the indicator values using the following formula:
Positive indicator:
Reverse indicator:
In the formula, denotes the j-th raw value of the i-th evaluation unit, while and represent the maximum and minimum values of the indicator, respectively.
(2) Calculate the characteristic proportion of the i-th evaluated object under the j-th indicator.
(3) Calculate the entropy value of the j-th indicator.
where k = 1/ln(n), ensuring that .
(4) Calculate the difference coefficient of the j-th indicator.
The significance of an indicator is reflected by its difference coefficient. The larger the coefficient, the more important the indicator, the more attention needs to be paid to its role, and the larger the corresponding weight of the indicator.
(5) Calculate the weight of the j-th indicator.
2.3.3. Combination Weighting Method
To improve the accuracy of combined weights based on multiple single weights and balancing various aspects, the weights obtained by the AHP method and the weights determined by the entropy weight method are used as the basic weights for calculation, and the final indicator weights are obtained using the combined weight calculation method. The algorithm is as follows:
where is the weight calculated by the AHP method, is the weight obtained by the entropy weight method, and n is the number of indicators.
2.4. Comprehensive Evaluation Method Based on Cloud Model
The cloud model transforms the description of uncertain linguistic values into quantitative expression while incorporating the fuzziness and randomness of uncertain linguistic values. The cloud model achieves this through the use of specific algorithms, the two major ones being the forward cloud generator (FCG) and backward cloud generator (BCG). The former quantifies the qualitative concepts, while the latter qualifies quantitative data, completing the evaluation of the evaluation target through these two algorithms. The overall quantitative expressions of the cloud model’s qualitative concept are expected value Ex, entropy En, and hyperentropy He. The cloud model mainly generates cloud drops and produces different cloud models according to the characteristics of Ex, En, and He.
The qualitative concept of positive cloud generators is converted into quantitative values, mainly through Ex, En, and He, to produce quantitative values. The algorithm steps are as follows: (1) generate a normal random number with En as the expected value and He2 as the variance; (2) generate a normal random number with Ex as the expected value and as the variance; (3) calculate ; (4) with a certainty degree of becoming a cloud drop in the universe of discourse; and (5) repeat steps (1)–(4) until the required number of cloud drops are generated. Contrary to the forward cloud generator, the backward cloud generator converts quantitative data into qualitative language, represented by the following three digital characteristics: En, Ex, and He [42]. The schematic diagram of the cloud generator is shown in Figure 2.

Figure 2.
Cloud generator.
The membership matrix reflects the mapping relationship of the evaluation set V on the evaluation factor set U. Using the weight matrix W and the membership matrix Z for the fuzzy transformation, the fuzzy subset B on the evaluation set V is calculated.
where B = (b1, b2, …, bm), representing the membership degrees corresponding to each level of the evaluation set.
B = W·Z
2.5. Risk Factor Model
The WEFEC is a complex system, and the influence degree of each sub-system on the total system varies slightly. A risk factor model is introduced to diagnose the risk factors of the WEFEC complex system. The method is as follows:
where and are the weights of the j-th indicator layer and criterion layer indicators; is the difference between the standardized value of each indicator and 100%; and is the obstacle degree of the j-th indicator in the indicator layer.
2.6. Study Area
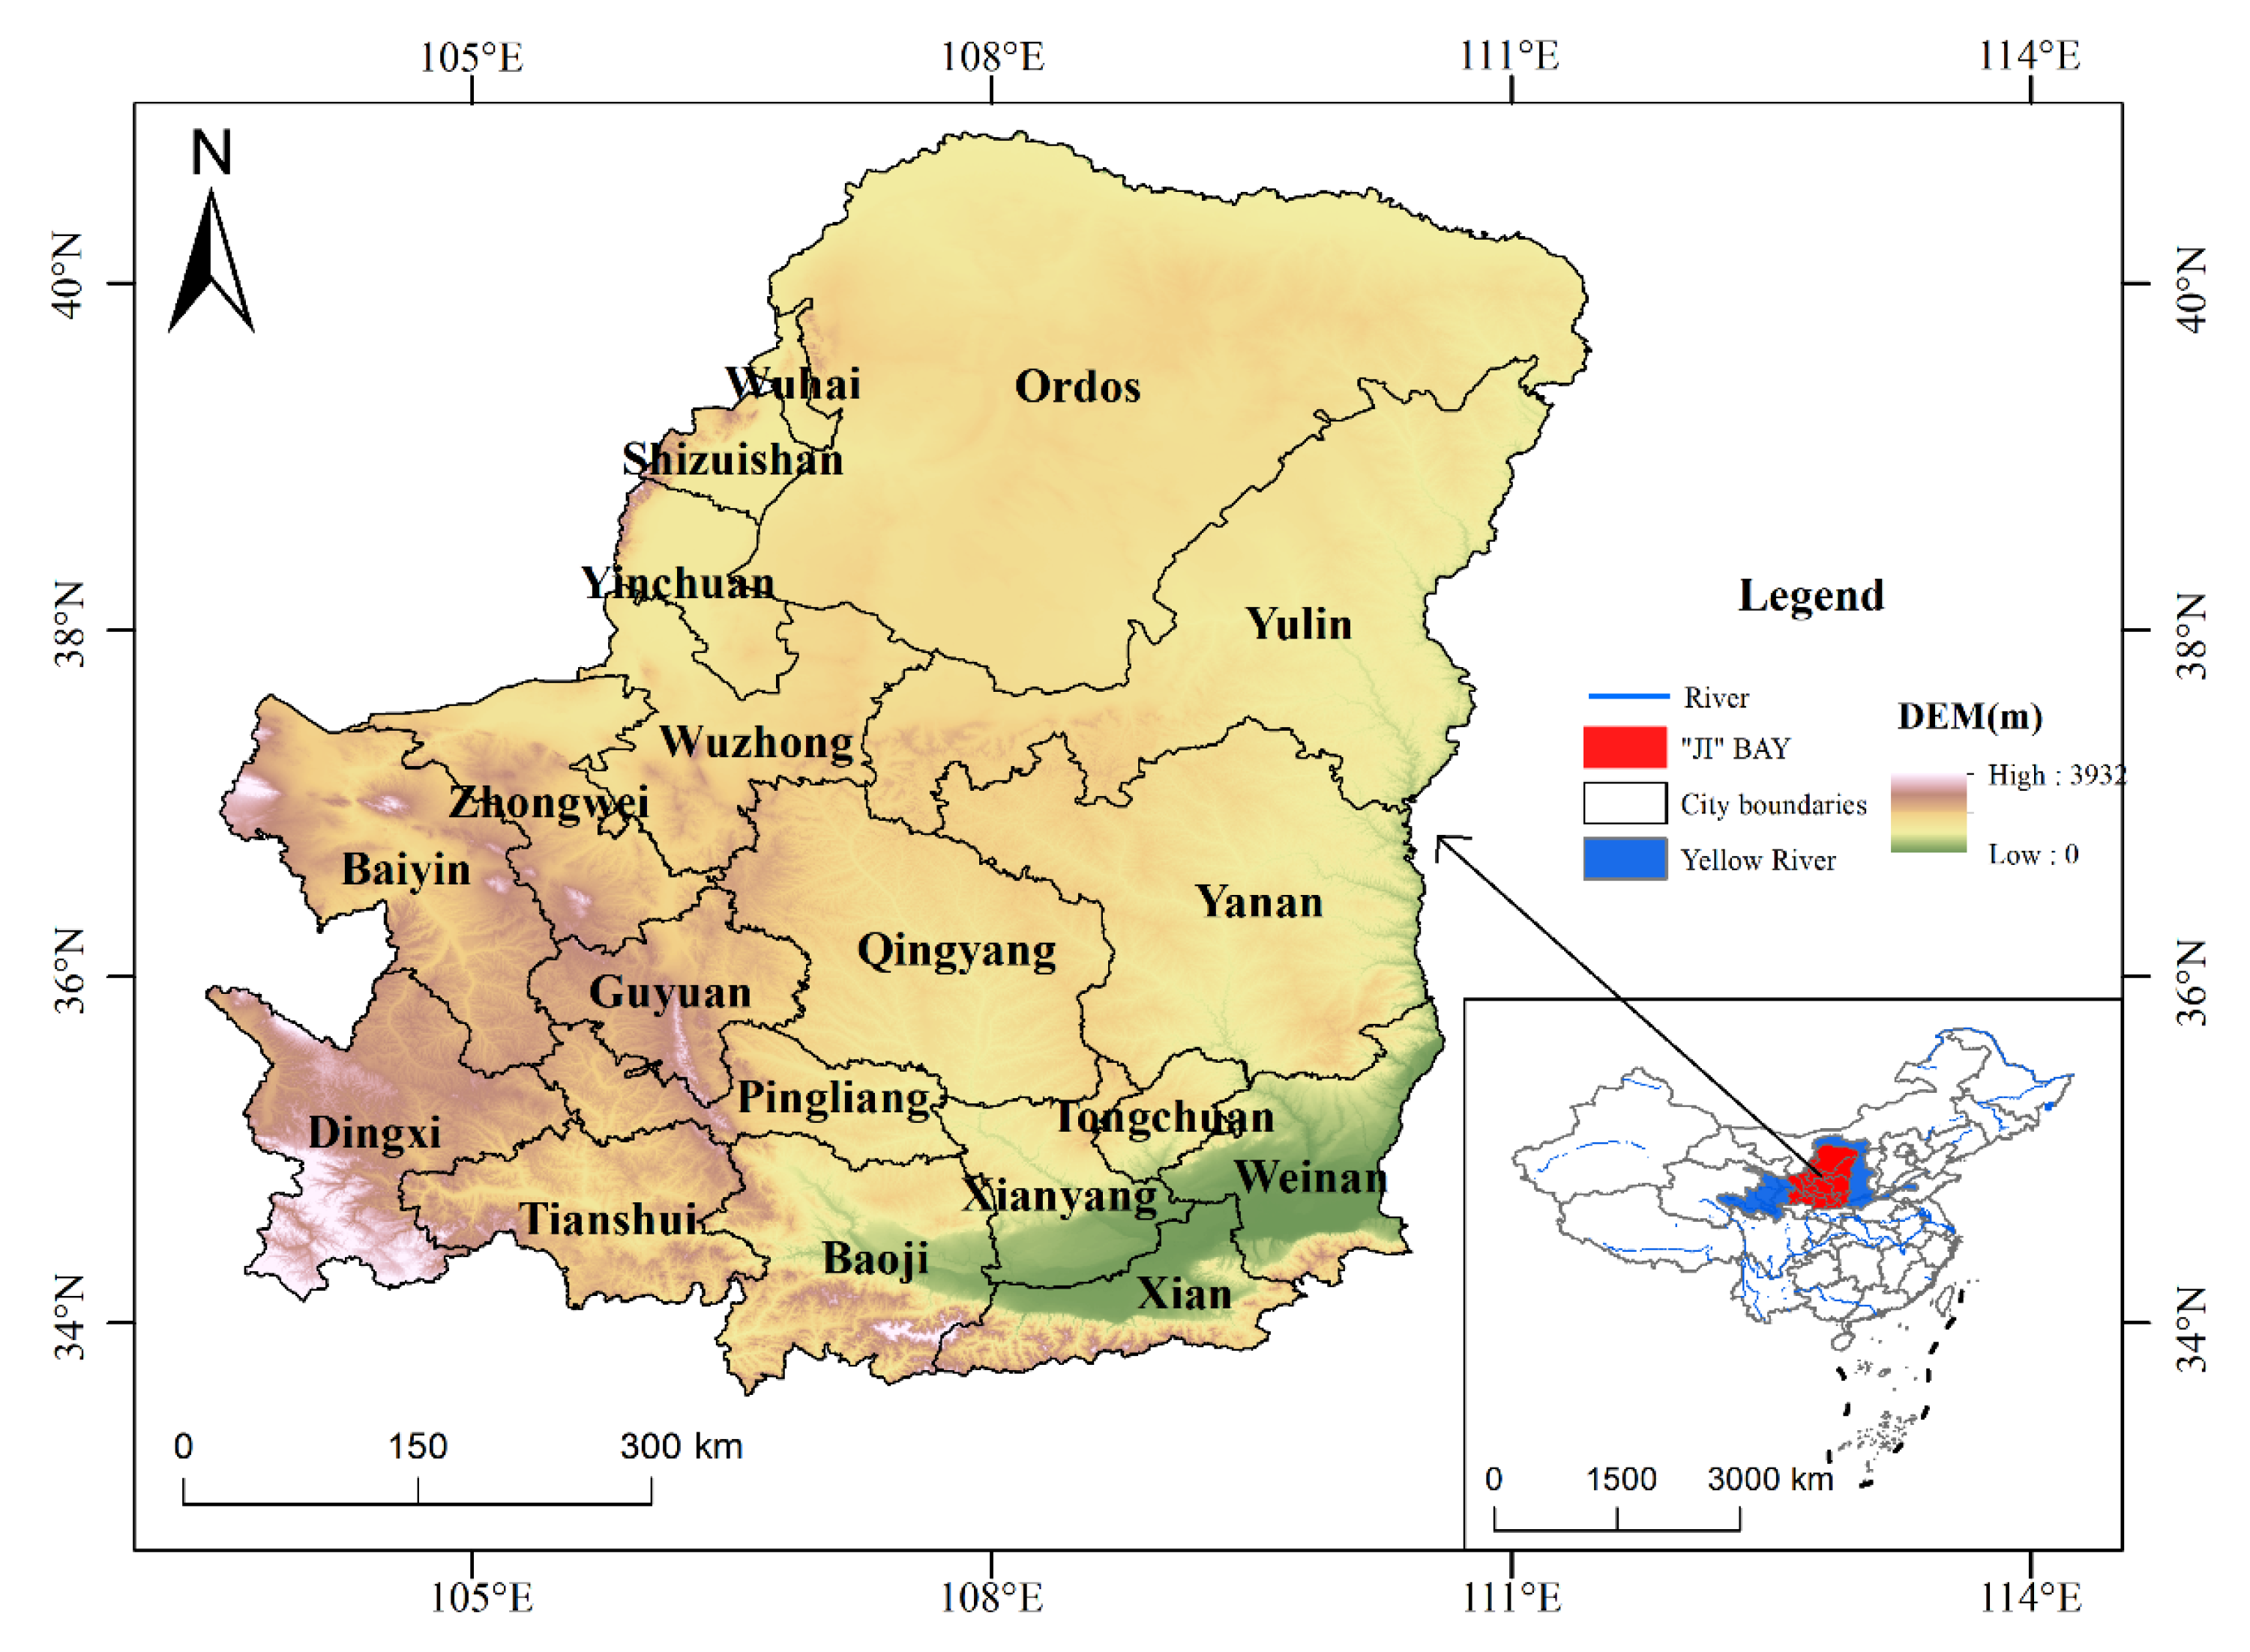
The “Ji” Bay in this study primarily refers to the inner area of the Yellow River “Ji” Bay. The Yellow River “Ji” Bay flows through four provinces: Shaanxi, Inner Mongolia, Ningxia, and Gansu, as well as 19 cities, including Xi’an, Ordos, Yinchuan, and Baiyin. The “Ji” Bay and the 19 cities from the study area are shown in Figure 3. The region covers approximately 380,000 km2 and had a population of 52.495 million in 2023. The “Ji” Bay is an important ecological barrier in northern China and is located at the border of agricultural and pastoral areas. To meet water demand, extensive groundwater extraction and the appropriation of river–lake ecological water have taken place. After years of high-intensity development, the prospect for its sustainable use has deteriorated. The proportion of agricultural water use in the “Ji” Bay is 78.6%, significantly higher than the national level of 62.3%, while the proportion of industrial water use is only 12.2%, far lower than the national level of 21.1% [43]. For a long time “water scarcity” has been a significant barrier to ecological protection and high-quality development of the Yellow River “Ji” Bay. The Yellow River “Ji” Bay is rich in natural resources and is also a national fossil energy enrichment area, with a secondary industry making a significant contribution to the economy. In 2019, the secondary industry in the “Ji” Bay accounted for 48.01% of the regional GDP, and the leading industries had a strong homogeneity [44]. Mining activities such as coal mining in the “Ji” Bay have increased the exploitation of natural resources, resulting in issues such as declining groundwater levels, soil erosion, land desertification, and wastewater/sludge pollution [45]. At present, the contradiction between energy development and ecological protection is still very visible, and land degradation and environmental pollution are severe.
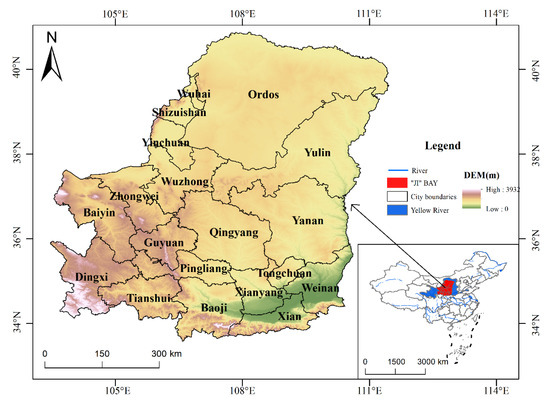
Figure 3.
Study area map.
2.7. Data Sources
The study period for this paper is 2004–2023, and the spatial scale is 19 cities in the Yellow River “Ji” Bay. Data on population, economy, and food are derived from the Statistical Yearbooks of Inner Mongolia Autonomous Region, Shaanxi Province, Gansu Province, and the Ningxia Hui Autonomous Region from 2004 to 2023, as well as the Water Resources Bulletins of these regions, which include water resource quantity, agricultural water use, industrial water use, and other water resource data. The data presented above are authentic and reliable, as reported by the National Bureau of Statistics and the Ministry of Water Resources.
3. Results Analysis
3.1. Weight Analysis
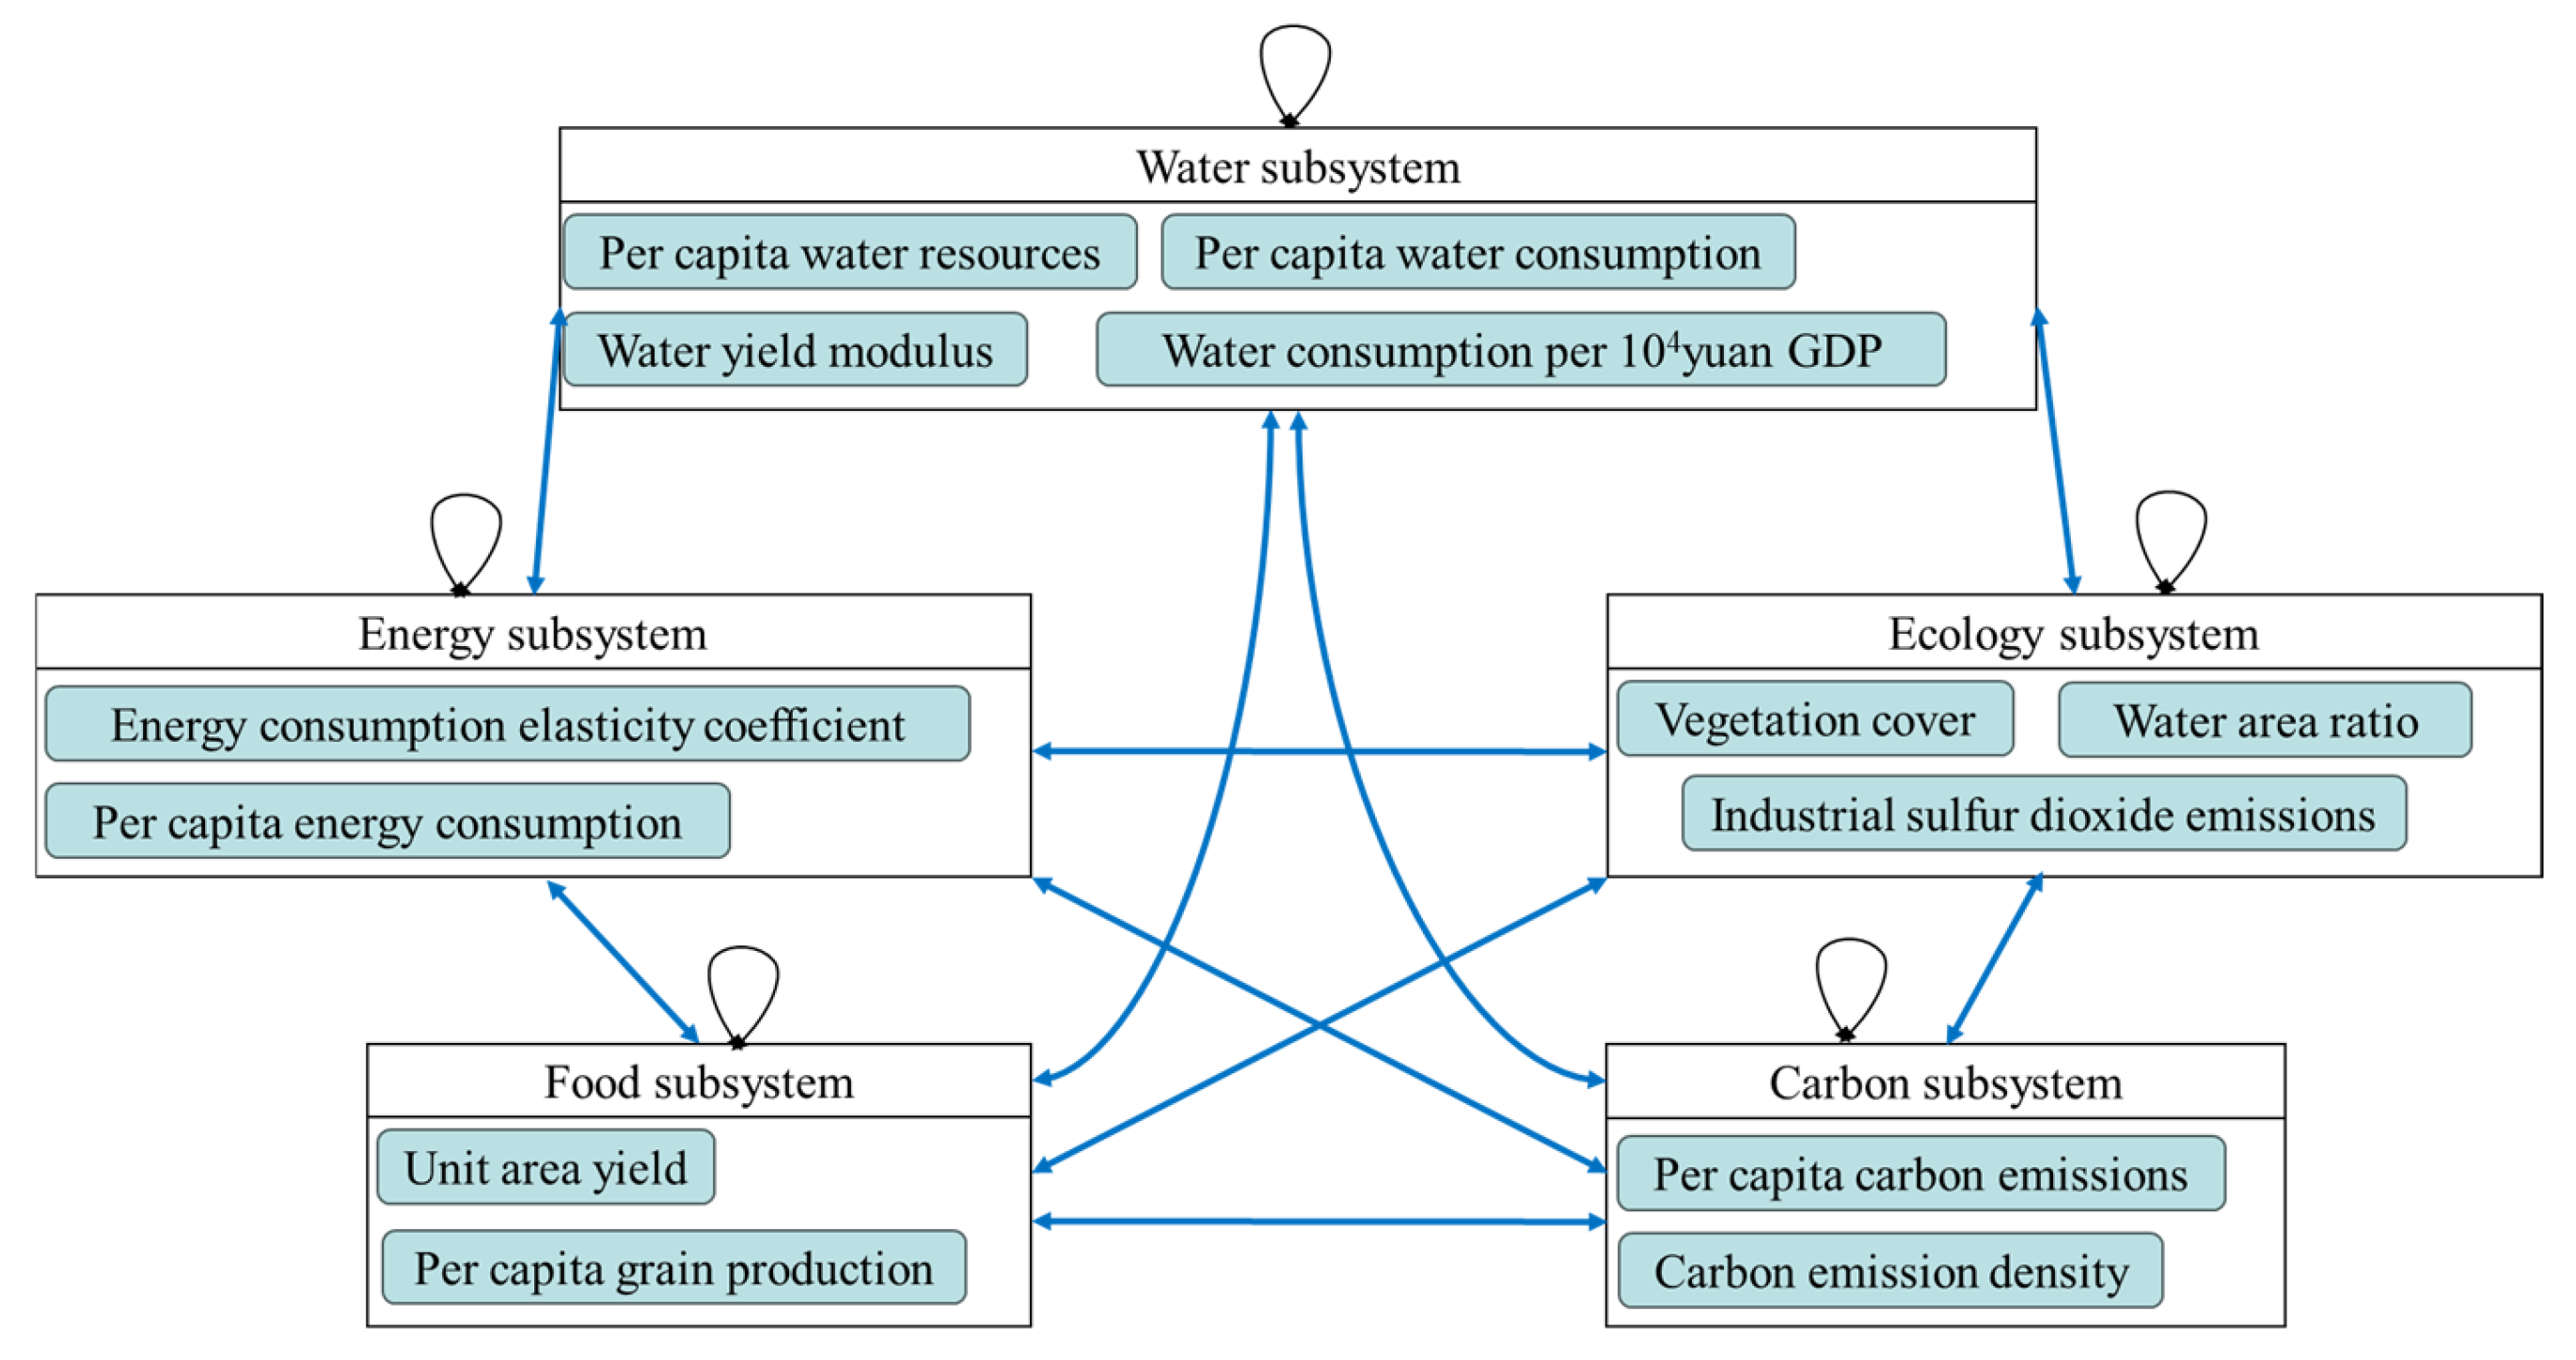
In this study, the ANP-entropy weight combination weighting method is employed to calculate the indicator weights. Based on the DEMATEL (Decision-Making Trial and Evaluation Laboratory), the ANP network structure of the three criterion layers and their sub-systems for the risk assessment of the WEFEC complex system is constructed. Taking reliability as an example, Figure 4 illustrates its ANP network architecture. The judgment matrices are established in accordance with the 1–9 evaluation scale table, and all judgment matrices have passed the consistency test after calculation. With the aid of the Super Decisions software, the supermatrix and limit matrix are computed to obtain the subjective weights.
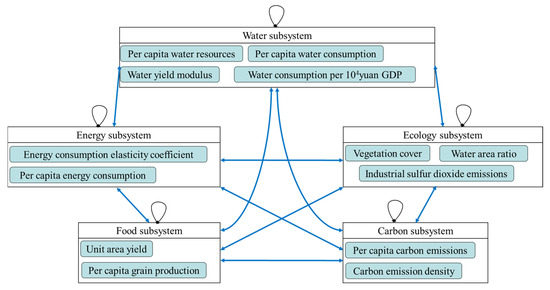
Figure 4.
The ANP network structure of reliability. (Double arrows indicate mutual influence between node indicators in two clusters. Circular arrows indicate mutual influence between node indicators within the same cluster).
The objective weights calculated using the entropy weight method and the subjective weights obtained via ANP are combined using the combination weighting method, aiming to improve the accuracy of the weights. The findings show that indicators such as ecological water use rate (X19), proportion of fiscal expenditure allocated to energy conservation and environmental protection (X23), and number of green utility model patents (X24) have higher comprehensive weights, reflecting the important impact of ecological water allocation, fiscal environmental protection investment, and low-carbon technological innovation on system risks. The weight analysis results are shown in Table 3.

Table 3.
Weight of risk evaluation indicators for WEFEC in the Yellow River “Ji” Bay.
3.2. Analysis of Temporal Evolution Characteristics
3.2.1. Temporal Evolution Characteristics of the Target Layer and Criterion Layer
The comprehensive evaluation results of the WEFEC complex system target layer were calculated by taking the average values of each indicator from 2004 to 2023. According to the weights of the evaluation indicators obtained by the ANP-entropy weight method, the fuzzy subset B on the evaluation set V was obtained through fuzzy transformation using the weight set W and the membership matrix Z. The results are shown in Table 4 (risk statuses marked with special colors represent risk assessment results. The same applies below). According to the maximum membership principle, this indicates that the risk level of the WEFEC complex system in the Yellow River “Ji” Bay from 2004 to 2023 was on high alert.

Table 4.
Risk assessment results.
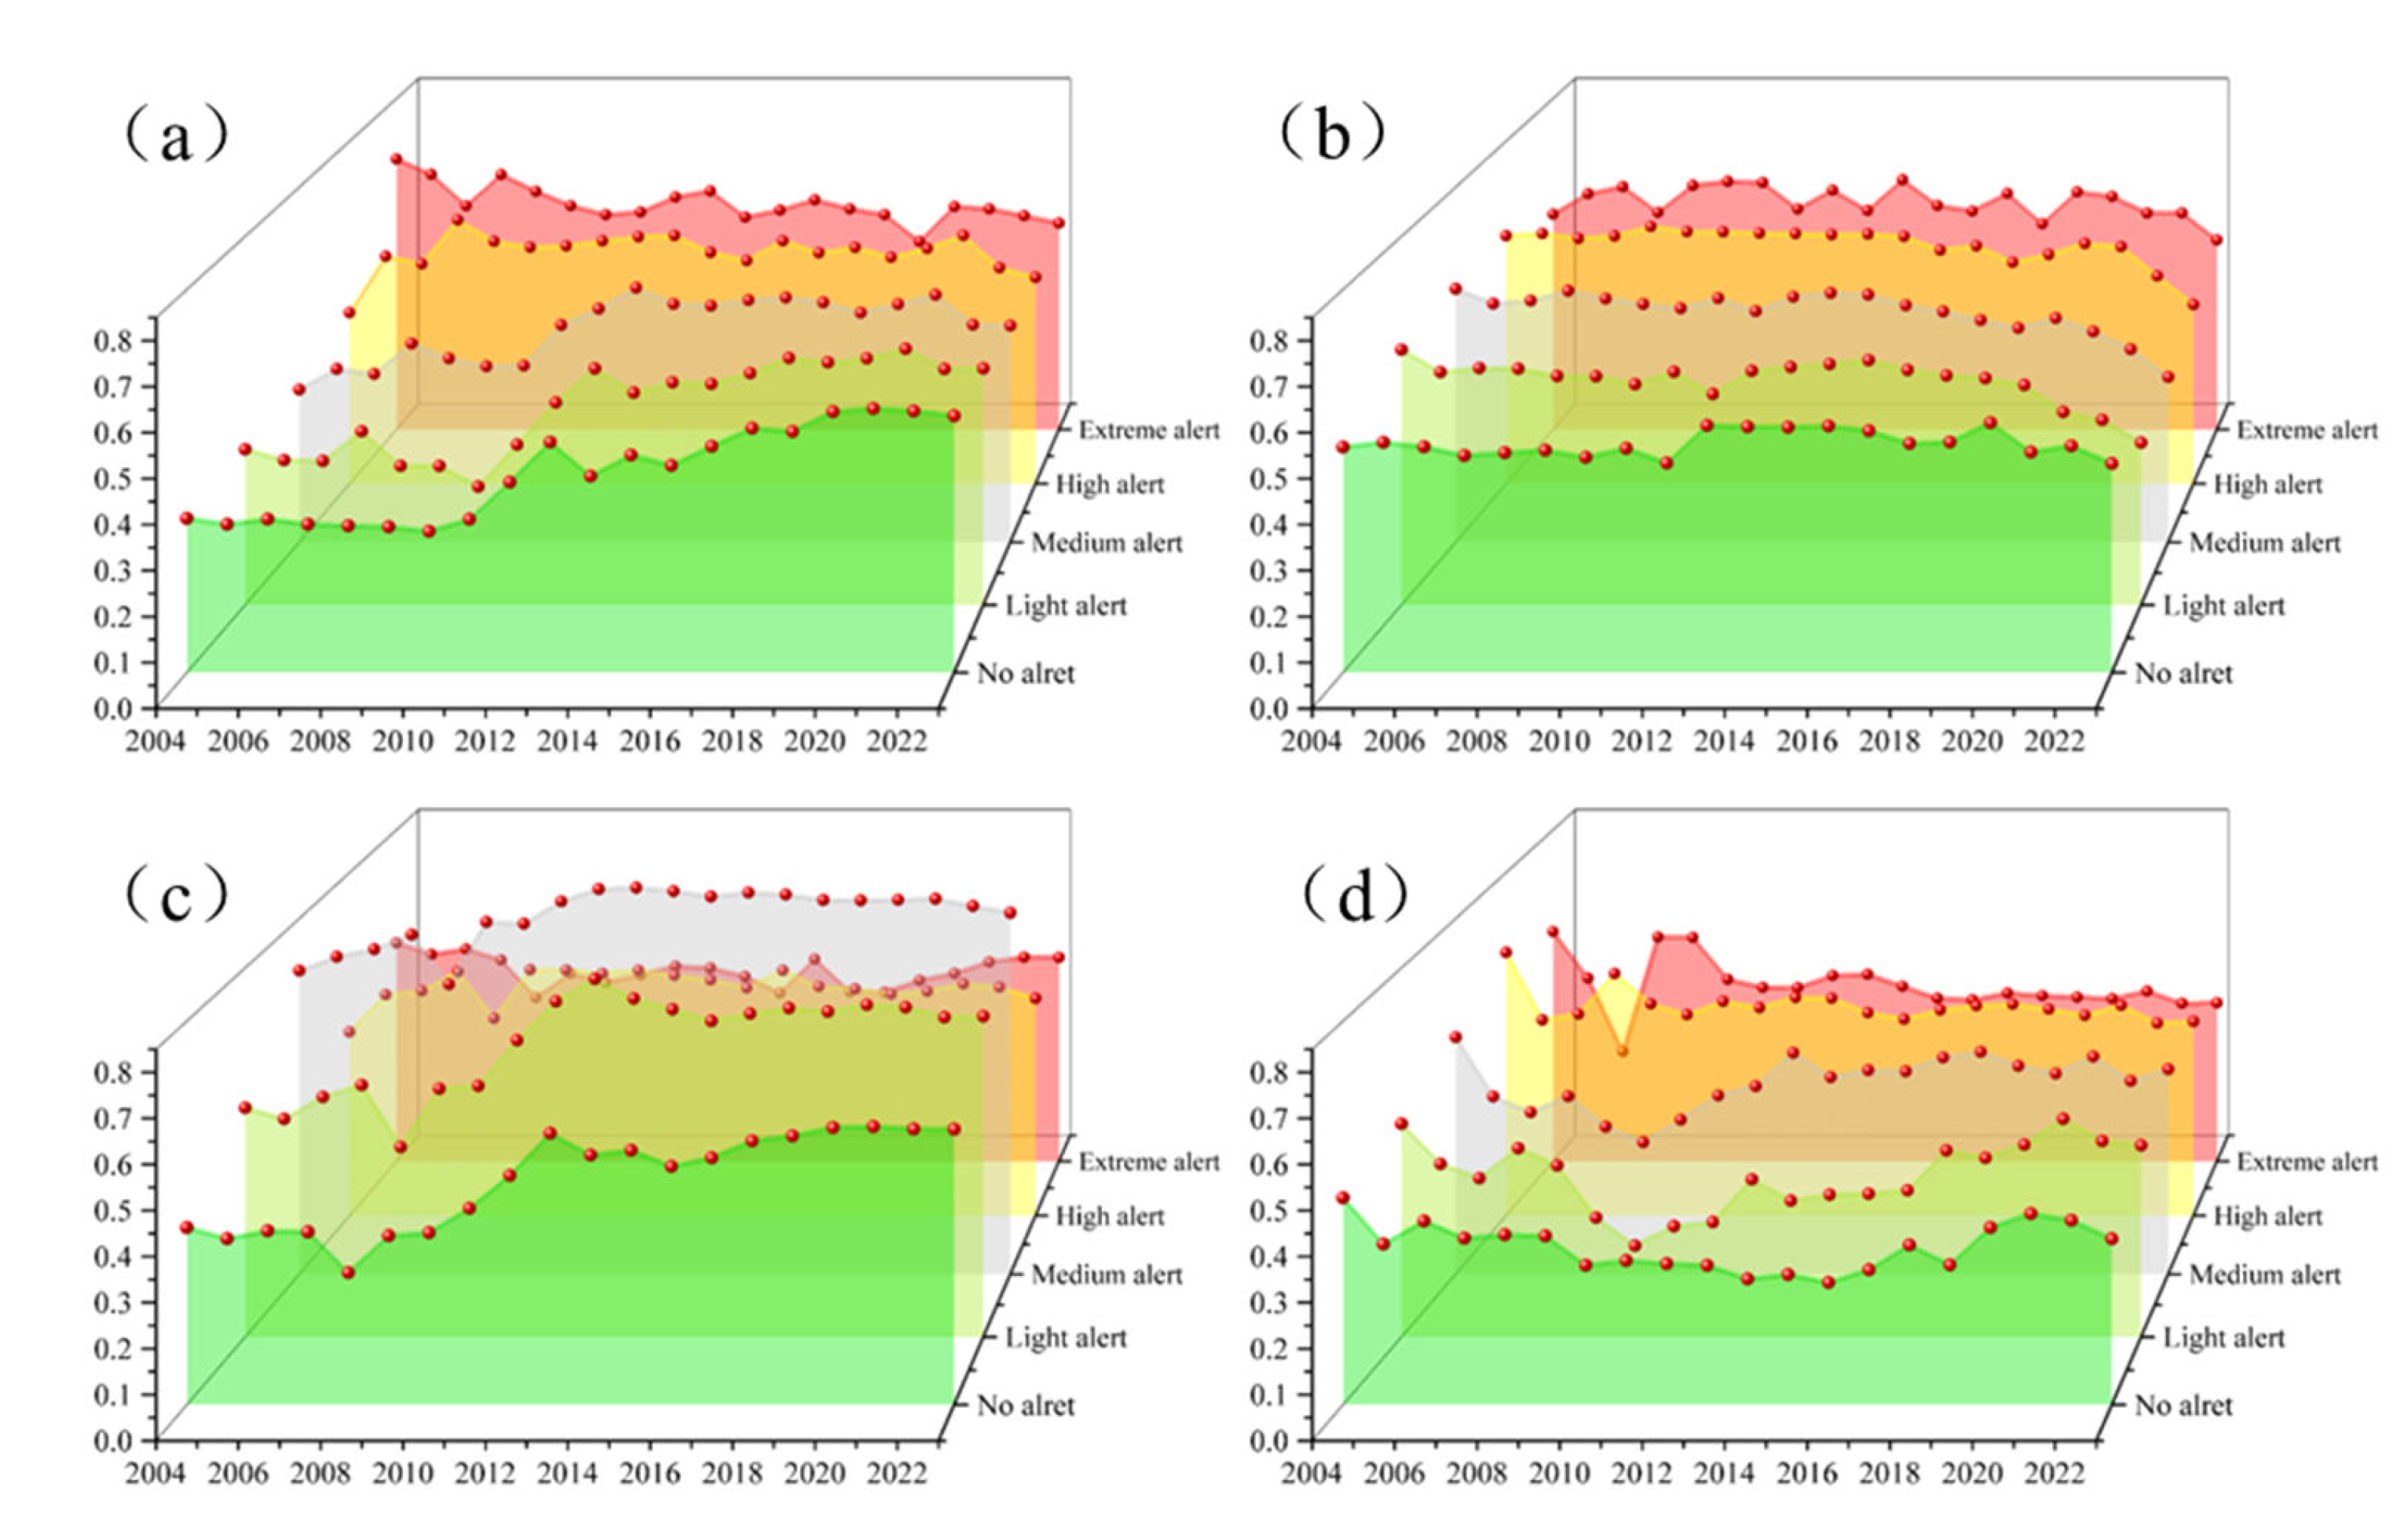
Figure 5 shows the changes in membership degrees across the target and criterion layers for the Yellow River’s complex system risk involving water, energy, food, and carbon. Taking 2023 as an example (Table 5), based on the maximum membership degree principle, the WEFEC complex system risk in 2023 exhibited the following states: no warning at the target layer, extreme warning at the reliability layer, moderate warning at the coordination layer, and moderate warning at the resilience layer.
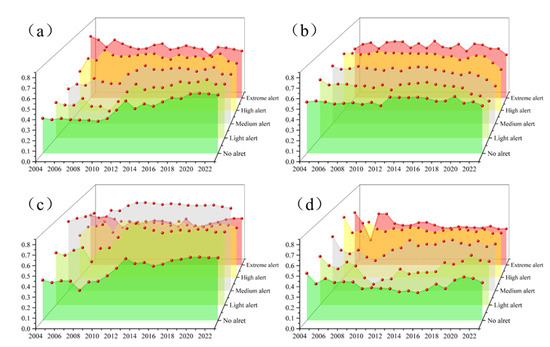
Figure 5.
Changes in (a) comprehensive membership of each risk level from 2004 to 2023, (b) membership degrees of reliability risk levels from 2004 to 2023, (c) membership degrees of synergy risk levels from 2004 to 2023, and (d) membership degrees of resilience risk levels from 2004 to 2023.

Table 5.
2023 risk assessment results.
At the target layer, the risks of the WEFEC complex system in the Yellow River “Ji” Bay showed extreme alert or high alert from 2004 to 2020, and no alert or light alert from 2021 to 2023 (Figure 5a). From 2004 to 2023, the comprehensive membership degrees of extreme alert and no alert in the “Ji” Bay showed obvious downward and upward trends. The comprehensive membership degree of no alert increased from 0.3423 in 2004 to 0.5700 in 2023, while the comprehensive membership degree of extreme alert decreased from 0.6947 in 2004 to 0.5301 in 2023, indicating that the risks of the WEFEC complex system in the “Ji” Bay are continuously decreasing. Risk assessment results for the target layer from 2004 to 2023 are shown in Table 6.

Table 6.
2004–2023 target layer risk assessment results.
From 2004 to 2023, the reliability risks of the “Ji” Bay only showed the following three states: extreme alert, extreme alert and high alert (Figure 5b). Among them, the membership degree of extreme alert showed a trend of first increasing and then decreasing, and after 2014, it was greater than the membership degrees of other warning states. The membership degree of no alert increased slightly, while the membership degree of high alert decreased significantly, from 0.6156 in 2004 to 0.4450 in 2023. This indicates that the membership degree of extreme alert for the reliability of the WEFEC complex system in the “Ji” Bay has always been high, with no obvious increase in the membership degree of light alert; the membership degree of light alert even decreased.
From 2004 to 2023, the synergy risks of the “Ji” Bay all showed a medium alert. The membership degrees of extreme alert and high alert remained relatively stable, while the membership degrees of no alert and light alert both showed an upward trend. Extreme alert first decreased and then increased, and high alert was basically flat (Figure 5c). The membership degree of medium alert was significantly higher than that of the other alert states. This suggests that the synergy between the two sub-systems of the WEFEC complex system in the “Ji” Bay was at a medium level during 2004–2023, with room for improvement.
From 2004 to 2023, the resilience risks of the “Ji” Bay showed high alert and extreme alert states for most of the time, and only showed a medium alert in 2023. The membership degrees of no alert and light alert began to decline in 2021, dropping from 0.4234 in 2021 to 0.3680 in 2023 (Figure 5d). This suggests that although the resilience of the WEFEC complex system in the “Ji” Bay is generally improving, there is a risk of shifting towards high alert.
3.2.2. Temporal Evolution Characteristics of the Indicator Layer
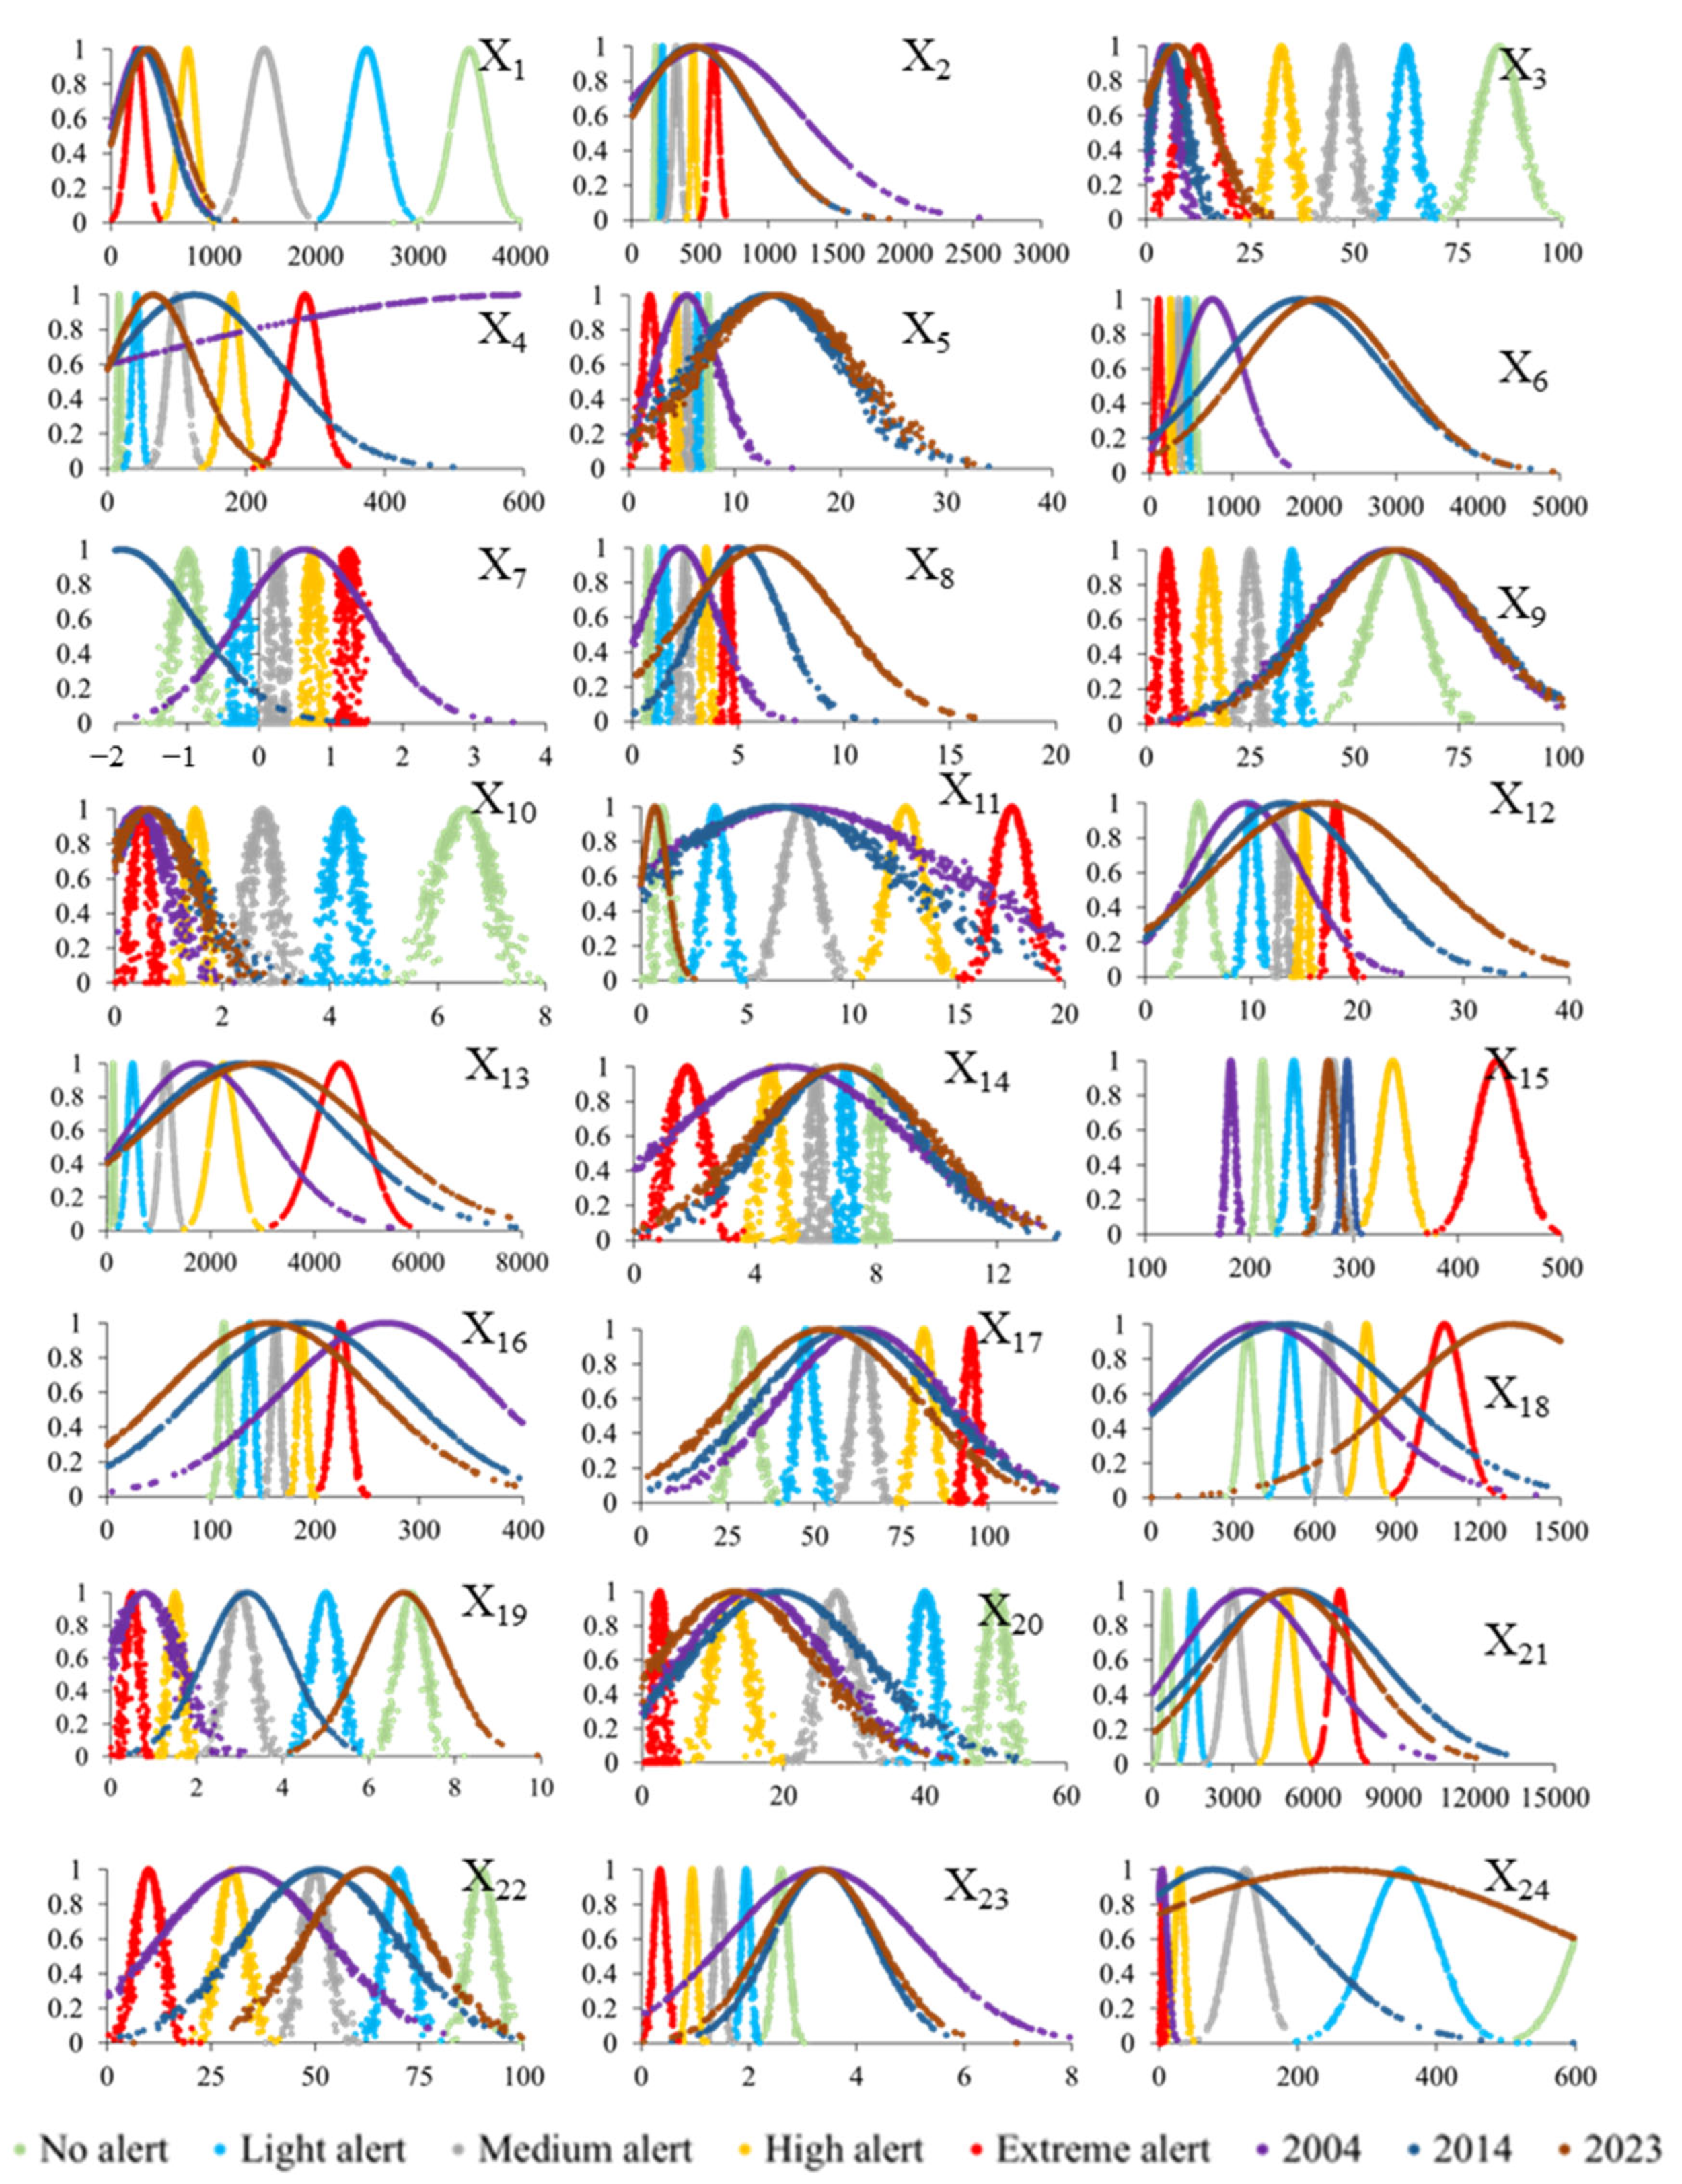
According to the established indicator system and alert thresholds for the Yellow River “Ji” Bay WEFEC, each indicator’s corresponding level was represented by cloud parameters using the formula. Assuming the number of cloud drops N = 500, based on the average values of each indicator in the Yellow River “Ji” Bay from 2004 to 2023, the membership matrix was calculated using the forward cloud generator, and the average membership degree of each indicator within different alert ranges is shown in Table 7. According to the maximum membership principle, during 2004–2023, the risk levels of X1 (per capita water resources), X2 (per capita water consumption), X3 (water yield modulus), X8 (per capita energy consumption), X10 (water area ratio), X16 (water consumption per mu), and X20 (proportion of industrial water use) were at the extreme alert level.

Table 7.
Average assessment values for indicators of cloud models.
Figure 6 shows the comprehensive cloud picture of the 24 evaluation indicators of the “Ji” Bay WEFEC complex system. According to the maximum membership principle, the change situations of indicator risk levels are divided into three categories. The first category is indicators showing an improving state (cloud drops shifting toward no alert), with approximately 46% of indicator risk level changes belonging to this category, such as X4 (water consumption per 104 yuan GDP), X5 (unit area yield), X7 (energy consumption elasticity coefficient), X11 (industrial sulfur dioxide emissions), X16 (water consumption per mu), etc. Taking X4 as an example, it showed extreme alert, medium alert, and light alert states in the three typical years of 2004, 2014, and 2023, respectively, demonstrating a trend of shifting from extreme alert to light alert, indicating that annual changes have reduced water consumption per 104 yuan GDP, improved water resource utilization efficiency, and significantly improved water-saving policies and management.
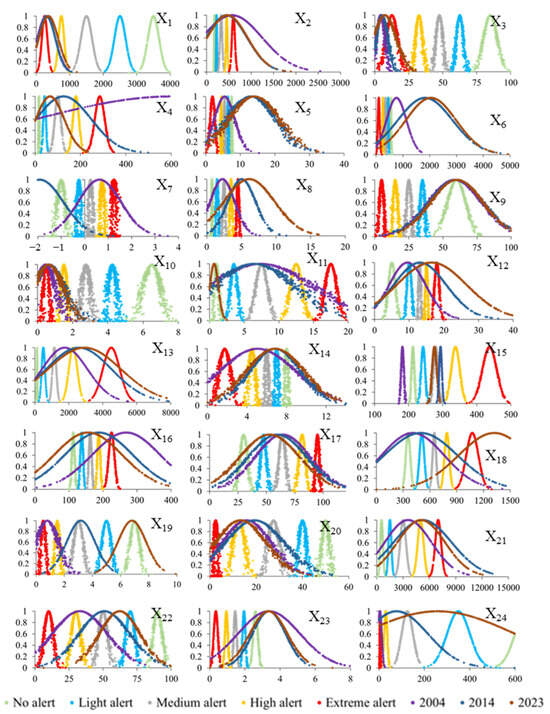
Figure 6.
Comprehensive cloud picture for typical years for each indicator.
The second category is indicators with enhanced risk levels (cloud drops shifting toward extreme alert), with 25% of indicator risk level changes belonging to this category. X12 (per capita carbon emissions), X13 (carbon emission density), and X18 (agricultural carbon emissions) showed a gradual increase in risk levels during 2004–2023, and 25% of indicator risk level changes belonged to this category. For example, X12 showed extreme light alert, medium alert, and high alert states in the three typical years of 2004, 2014, and 2023. Analysis shows that X12, X13, and X18 are all related to carbon emissions, indicating that carbon emissions in the Yellow River “Ji” Bay have been severely excessive, restricting the sustainable development of the “Ji” Bay.
The third category is indicators with unchanged risk levels. During 2004–2023, 29% of indicator risk level changes belonged to this category. The cloud drops of X1 (per capita water resources), X2 (per capita water consumption), X3 (water yield modulus), X10 (water area ratio), and X20 (proportion of industrial water use) showed no significant changes and always remained around the extreme alert and high alert standard cloud drops. Analysis shows that indicators around high alert and extreme alert are all related to water resources, indicating that water resource shortage and allocation have always been significant risks to resource–economy–ecology coordination in the Yellow River “Ji” Bay. X23 (proportion of fiscal expenditure allocated to energy conservation and environmental protection) was not on alert in the three typical years.
3.3. Spatial Differentiation Pattern
3.3.1. Spatial Differentiation Characteristics of the Target Layer
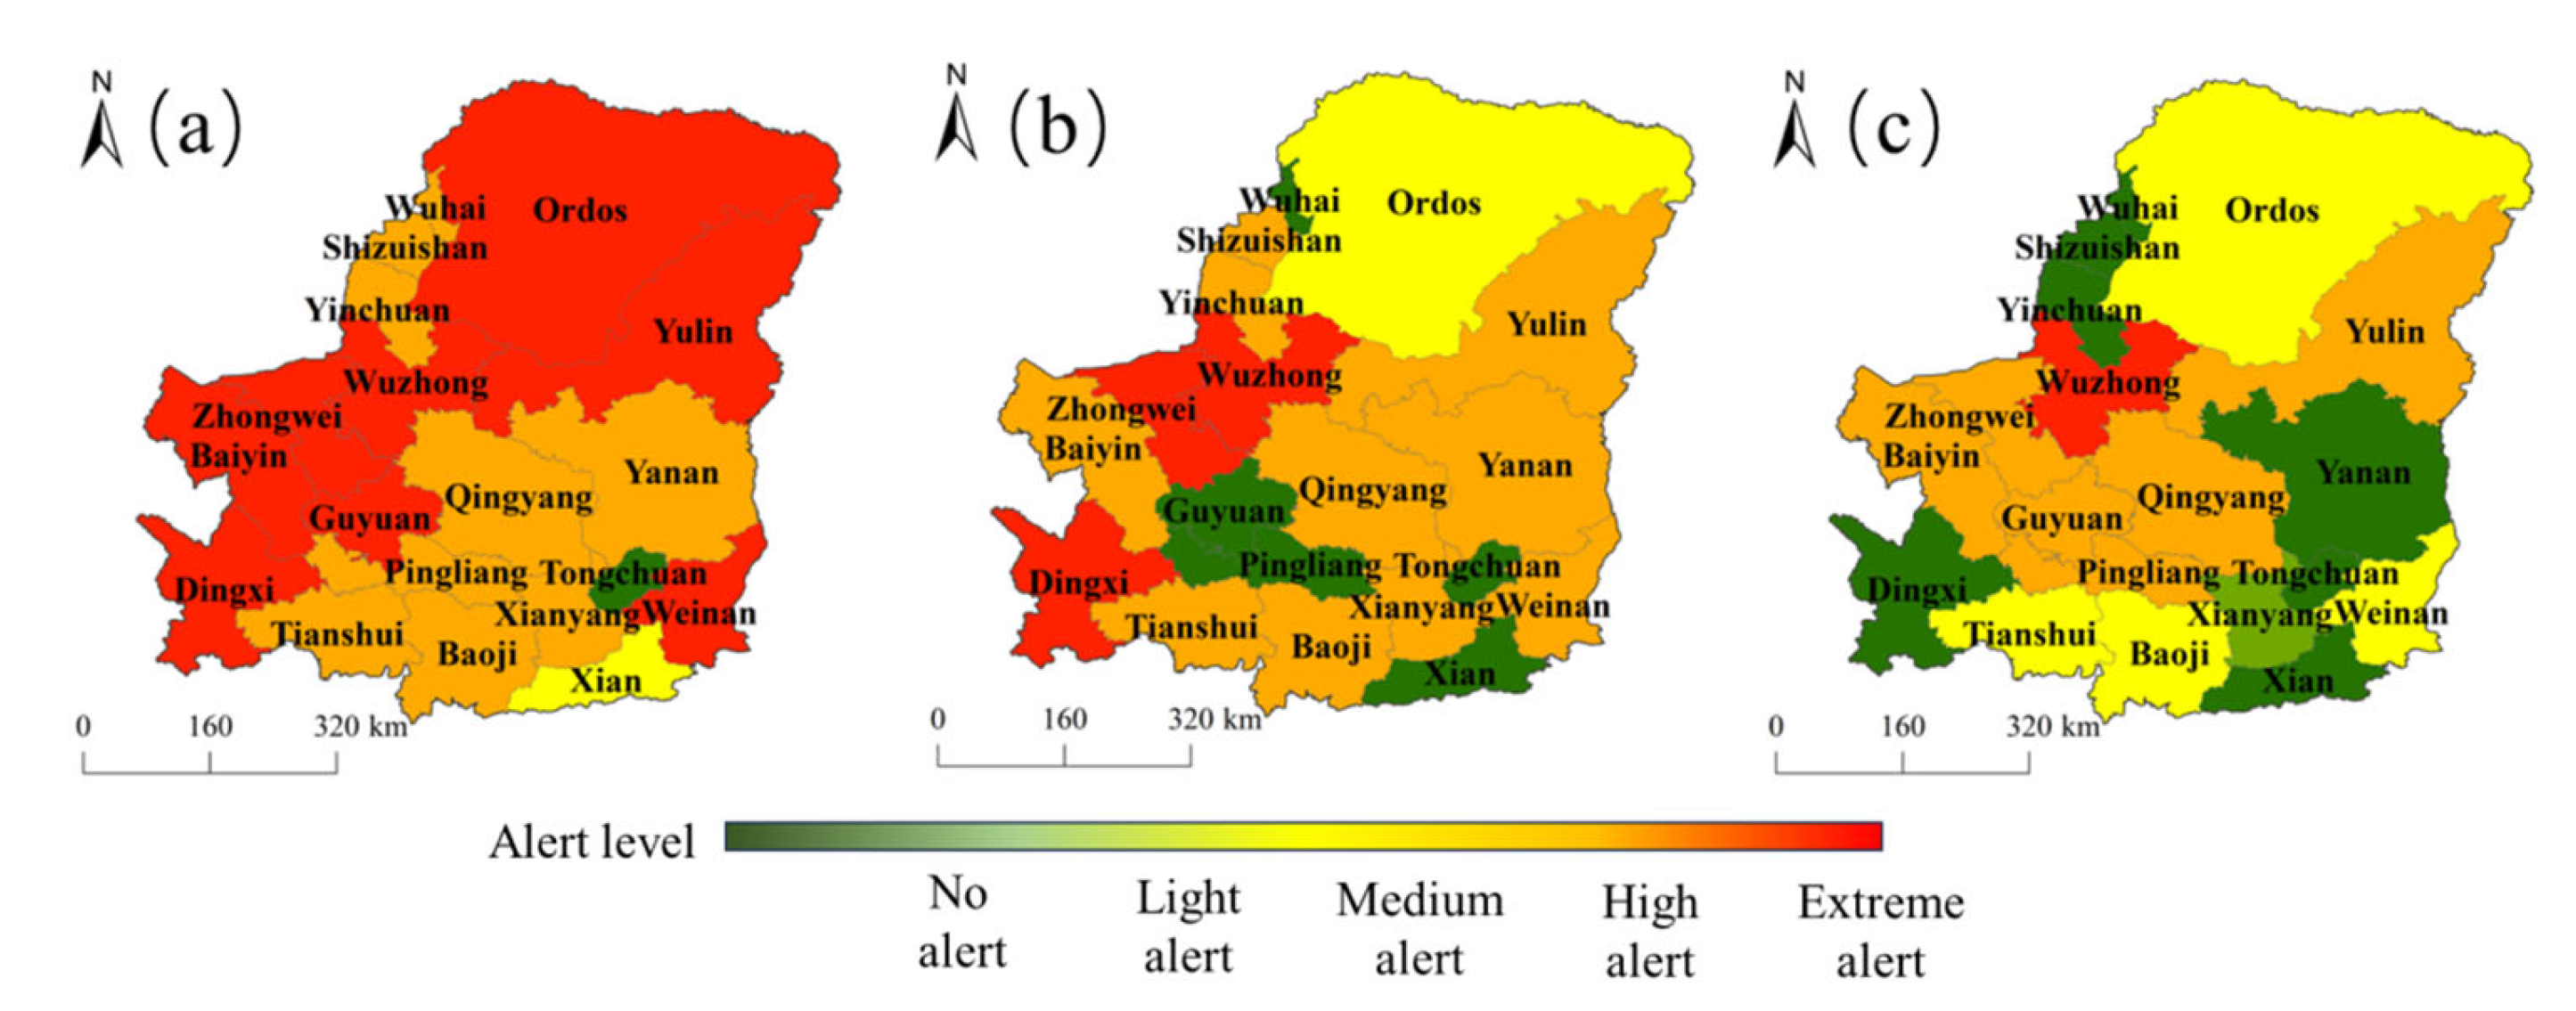
To better analyze the risk status of the WEFEC complex system in the Yellow River “Ji” Bay spatially, this paper divided 2004–2023 into three time periods on average (2004–2010, 2011–2016, and 2017–2023). Figure 6 shows the spatial changes in the Yellow River “Ji” Bay during the three time periods. Overall, in the three periods, red (extreme alert) was mostly located in the northwest of the “Ji” Bay, and dark green (no alert) showed a point-like distribution; according to the calculation results, the number of cities in extreme alert decreased from 8 in the first period (Figure 7a) to 3 in the second period (Figure 7b) and 1 in the third period (Figure 7c); the number of cities in no alert state also increased from 1 in the first period (Figure 7a) to 4 in the second period (Figure 7b) and 5 in the third period (Figure 7c). Among them, the number of cities in high alert and light alert states also decreased and increased accordingly. Wuzhong maintained an extreme alert status from 2004 to 2023. According to the analysis, this city has extremely limited water resources, with a per capita water resource amount of 82.54 m3, accounting for only 1/4 of the per capita water resources in the “Ji” Bay. The agricultural water use is 93.6%, with a water consumption per mu of 389 m3, exceeding the average of 214 m3 in the “Ji” Bay. The city has a high energy consumption coefficient, and its economic activities are heavily reliant on energy, which could be attributed to a large proportion of highly energy-consuming industries, and outdated technology and equipment. The spatial characteristics of the target layer are consistent with the findings of Tong Lei et al. [46]. Each city’s class for each period is shown in Table 8.
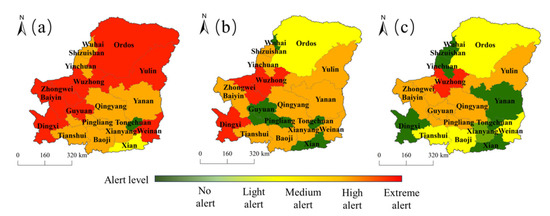
Figure 7.
Spatial distribution of WEFEC complex system risk levels in “Ji” Bay from 2004 to 2023 (a–c).

Table 8.
City’s class for each period.
3.3.2. Spatial Differentiation Pattern of the Criterion Layer
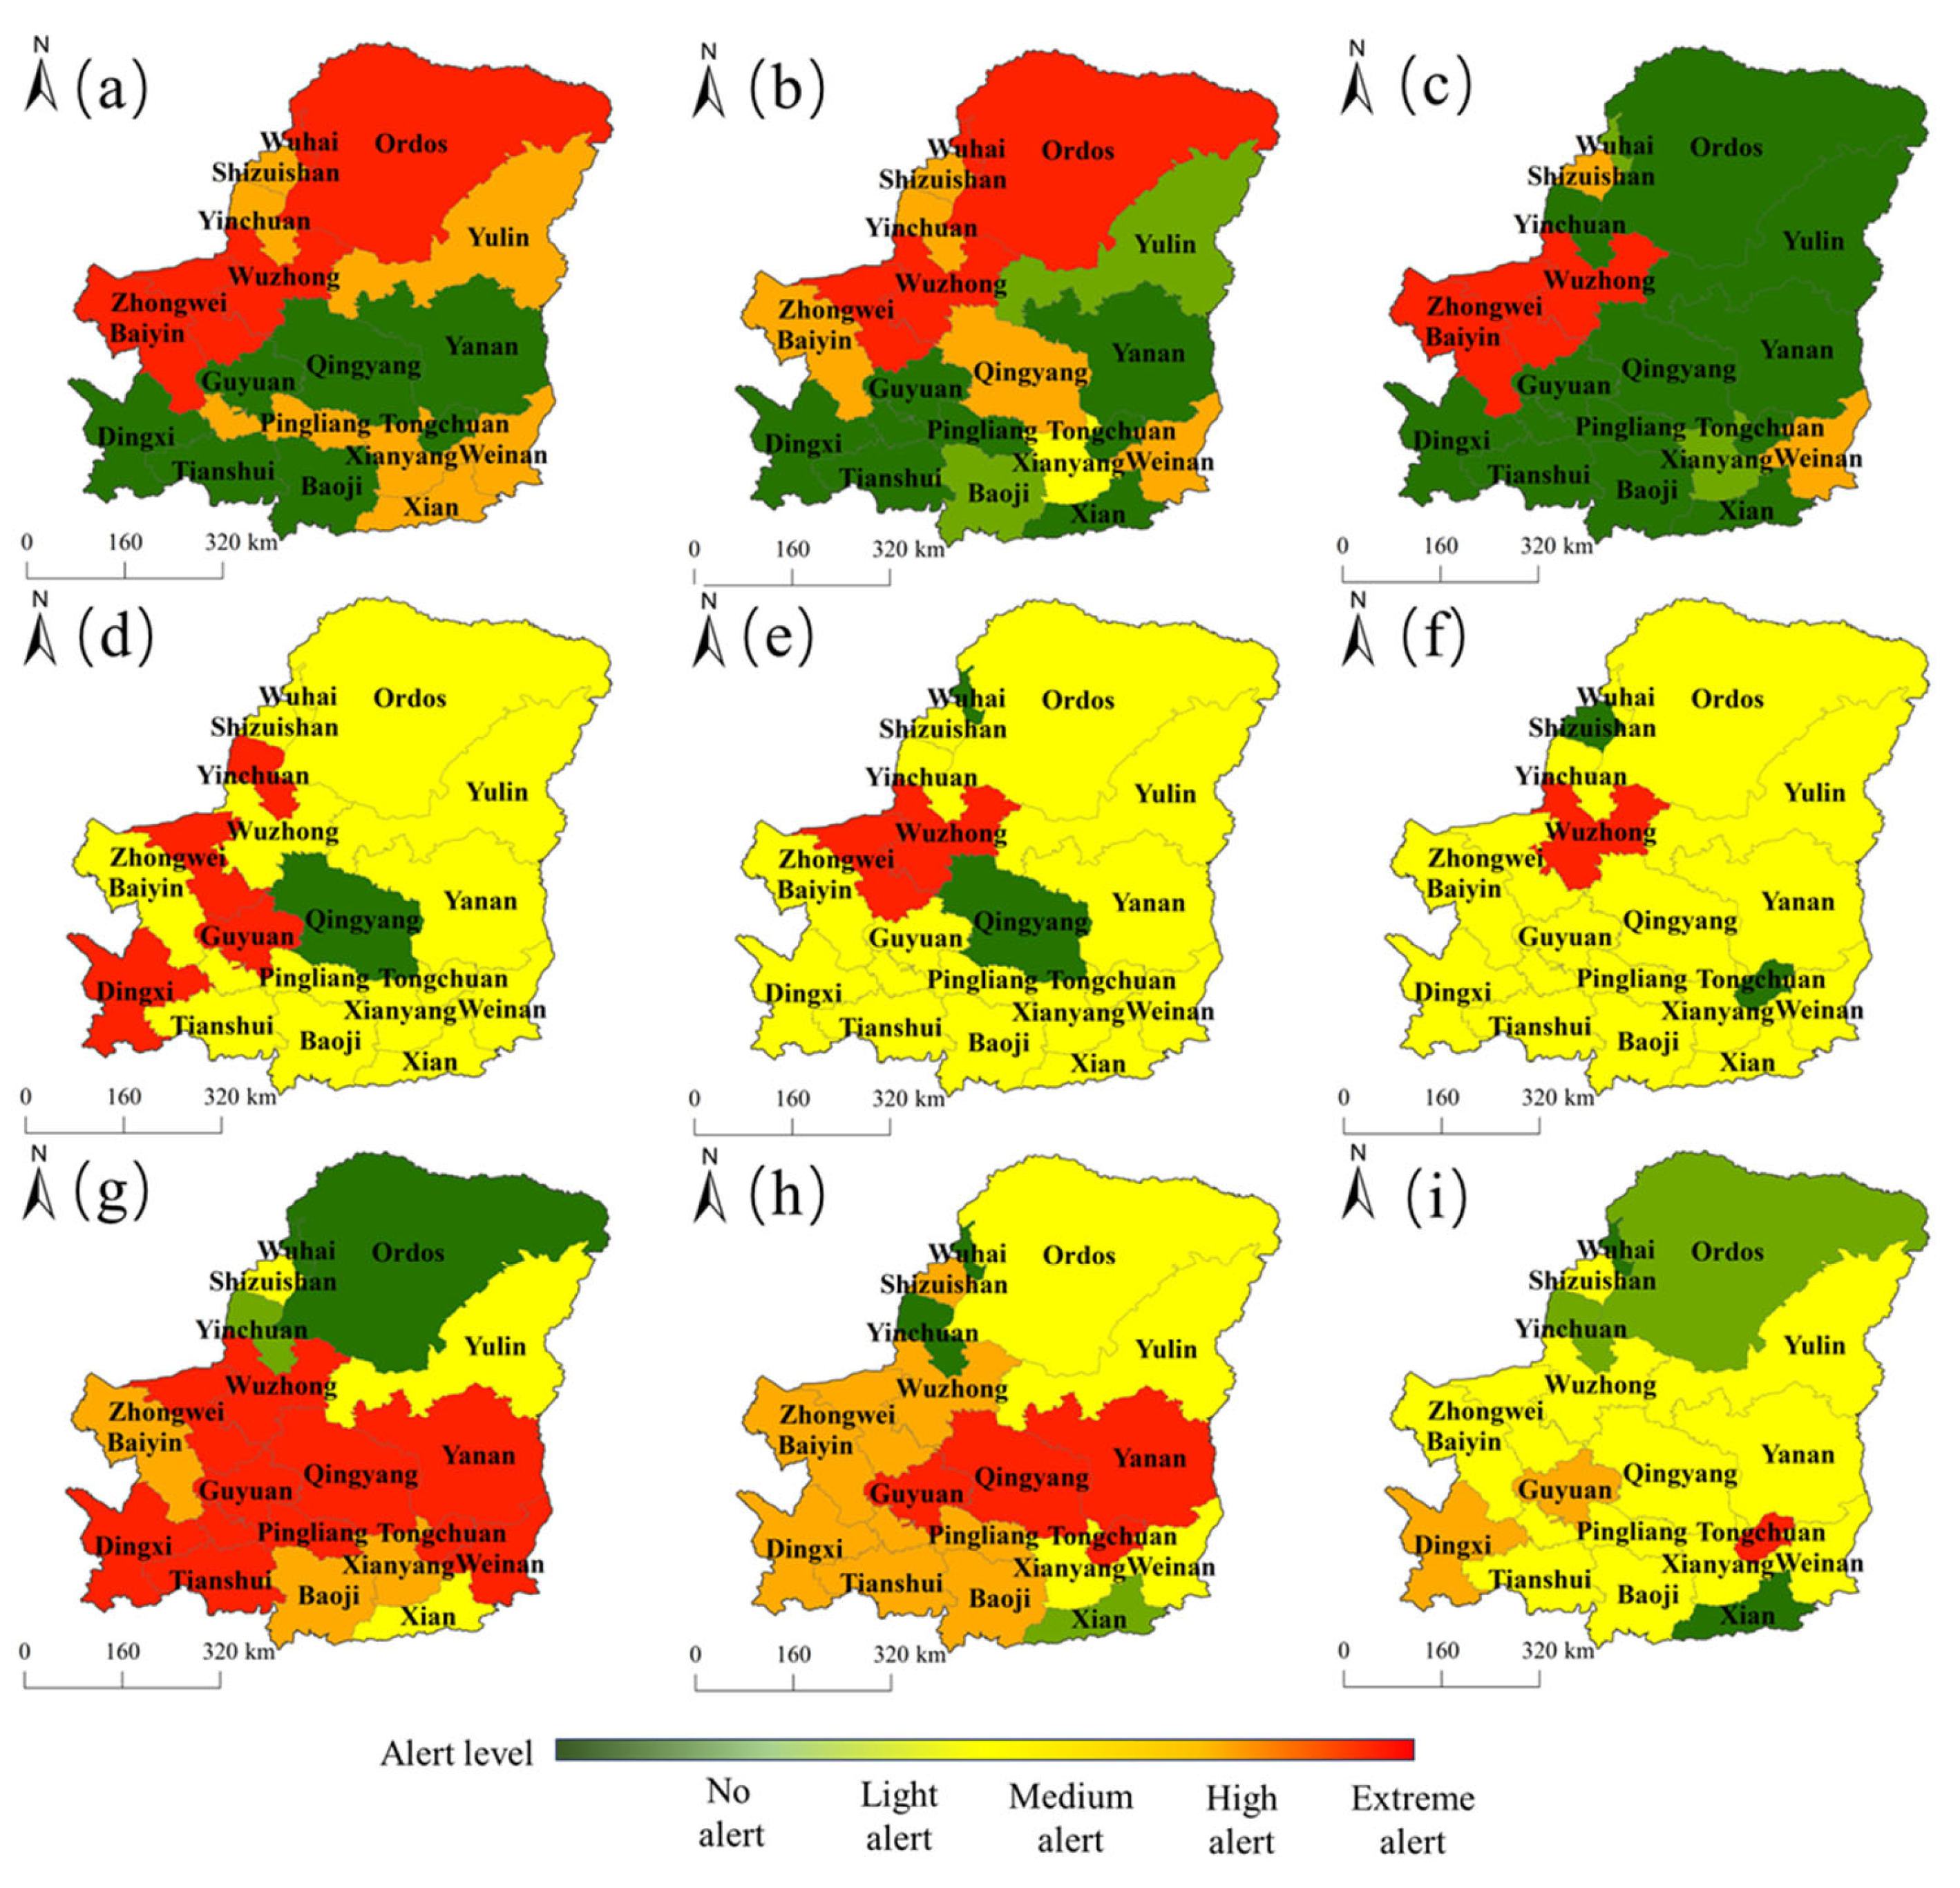
In terms of reliability, the WEFEC complex system in the “Ji” Bay has been relieved of extreme and high alert status in most cities, according to the different criterion layers. The number of cities in extreme alert status decreased from 4 in the first period (Figure 8a) to 3 in the third period (Figure 8c), while the number of cities in no alert status increased from 6 in the first to 12 in the third period. However, as evidenced by the temporal evolution characteristics of the criterion layer, the reliability of the “Ji” Bay has always been in a high alert or extreme alert state, implying that the reliability level of cities such as Baiyin, Shizuishan, Weinan, Wuzhong, and Zhongwei is relatively severe.
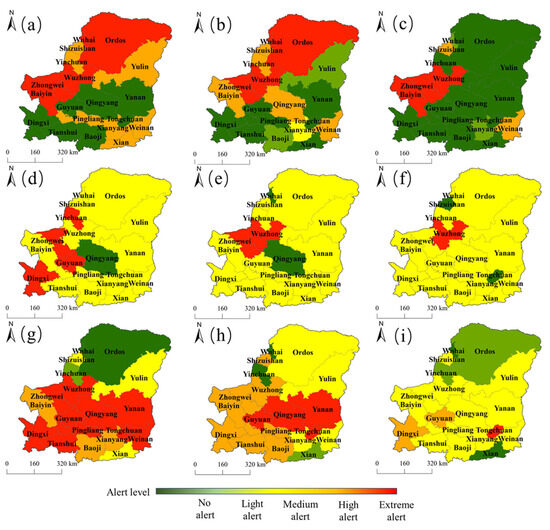
Figure 8.
Spatial distribution of reliability risk levels in “Ji” Bay from 2004 to 2023 (a–c), spatial distribution of synergy risk levels in “Ji” Bay from 2004 to 2023 (d–f), and spatial distribution of resilience risk levels in “Ji” Bay from 2004 to 2023 (g–i).
In terms of synergy, most cities were on medium alert. During the first period, only Yinchuan, Zhongwei, Guyuan, and Dingxi were in extreme alert status (Figure 8d). They all progressed to medium alert status in the third period (Figure 8f). Wuzhong changed from medium to extreme alert in the second period, and Qingyang changed from no alert to medium alert in the third period. The synergy is deteriorating, and attention must be paid to the collaborative relationship between their sub-systems.
In terms of resilience, the majority of cities in extreme alert and high alert status in the first and second periods were mostly in the central region of the “Ji” Bay. In the third period, the number of extreme alert and high alert cities decreased to 3, namely Tongchuan, Guyuan, and Dingxi. Although most cities’ resilience levels have been reduced from extreme alert to high alert, only Ordos, Wuhai, and Xi’an are now in no alert or light alert status, and other cities continue to face resilience risks.
3.4. Diagnosis of Key Risk Factors
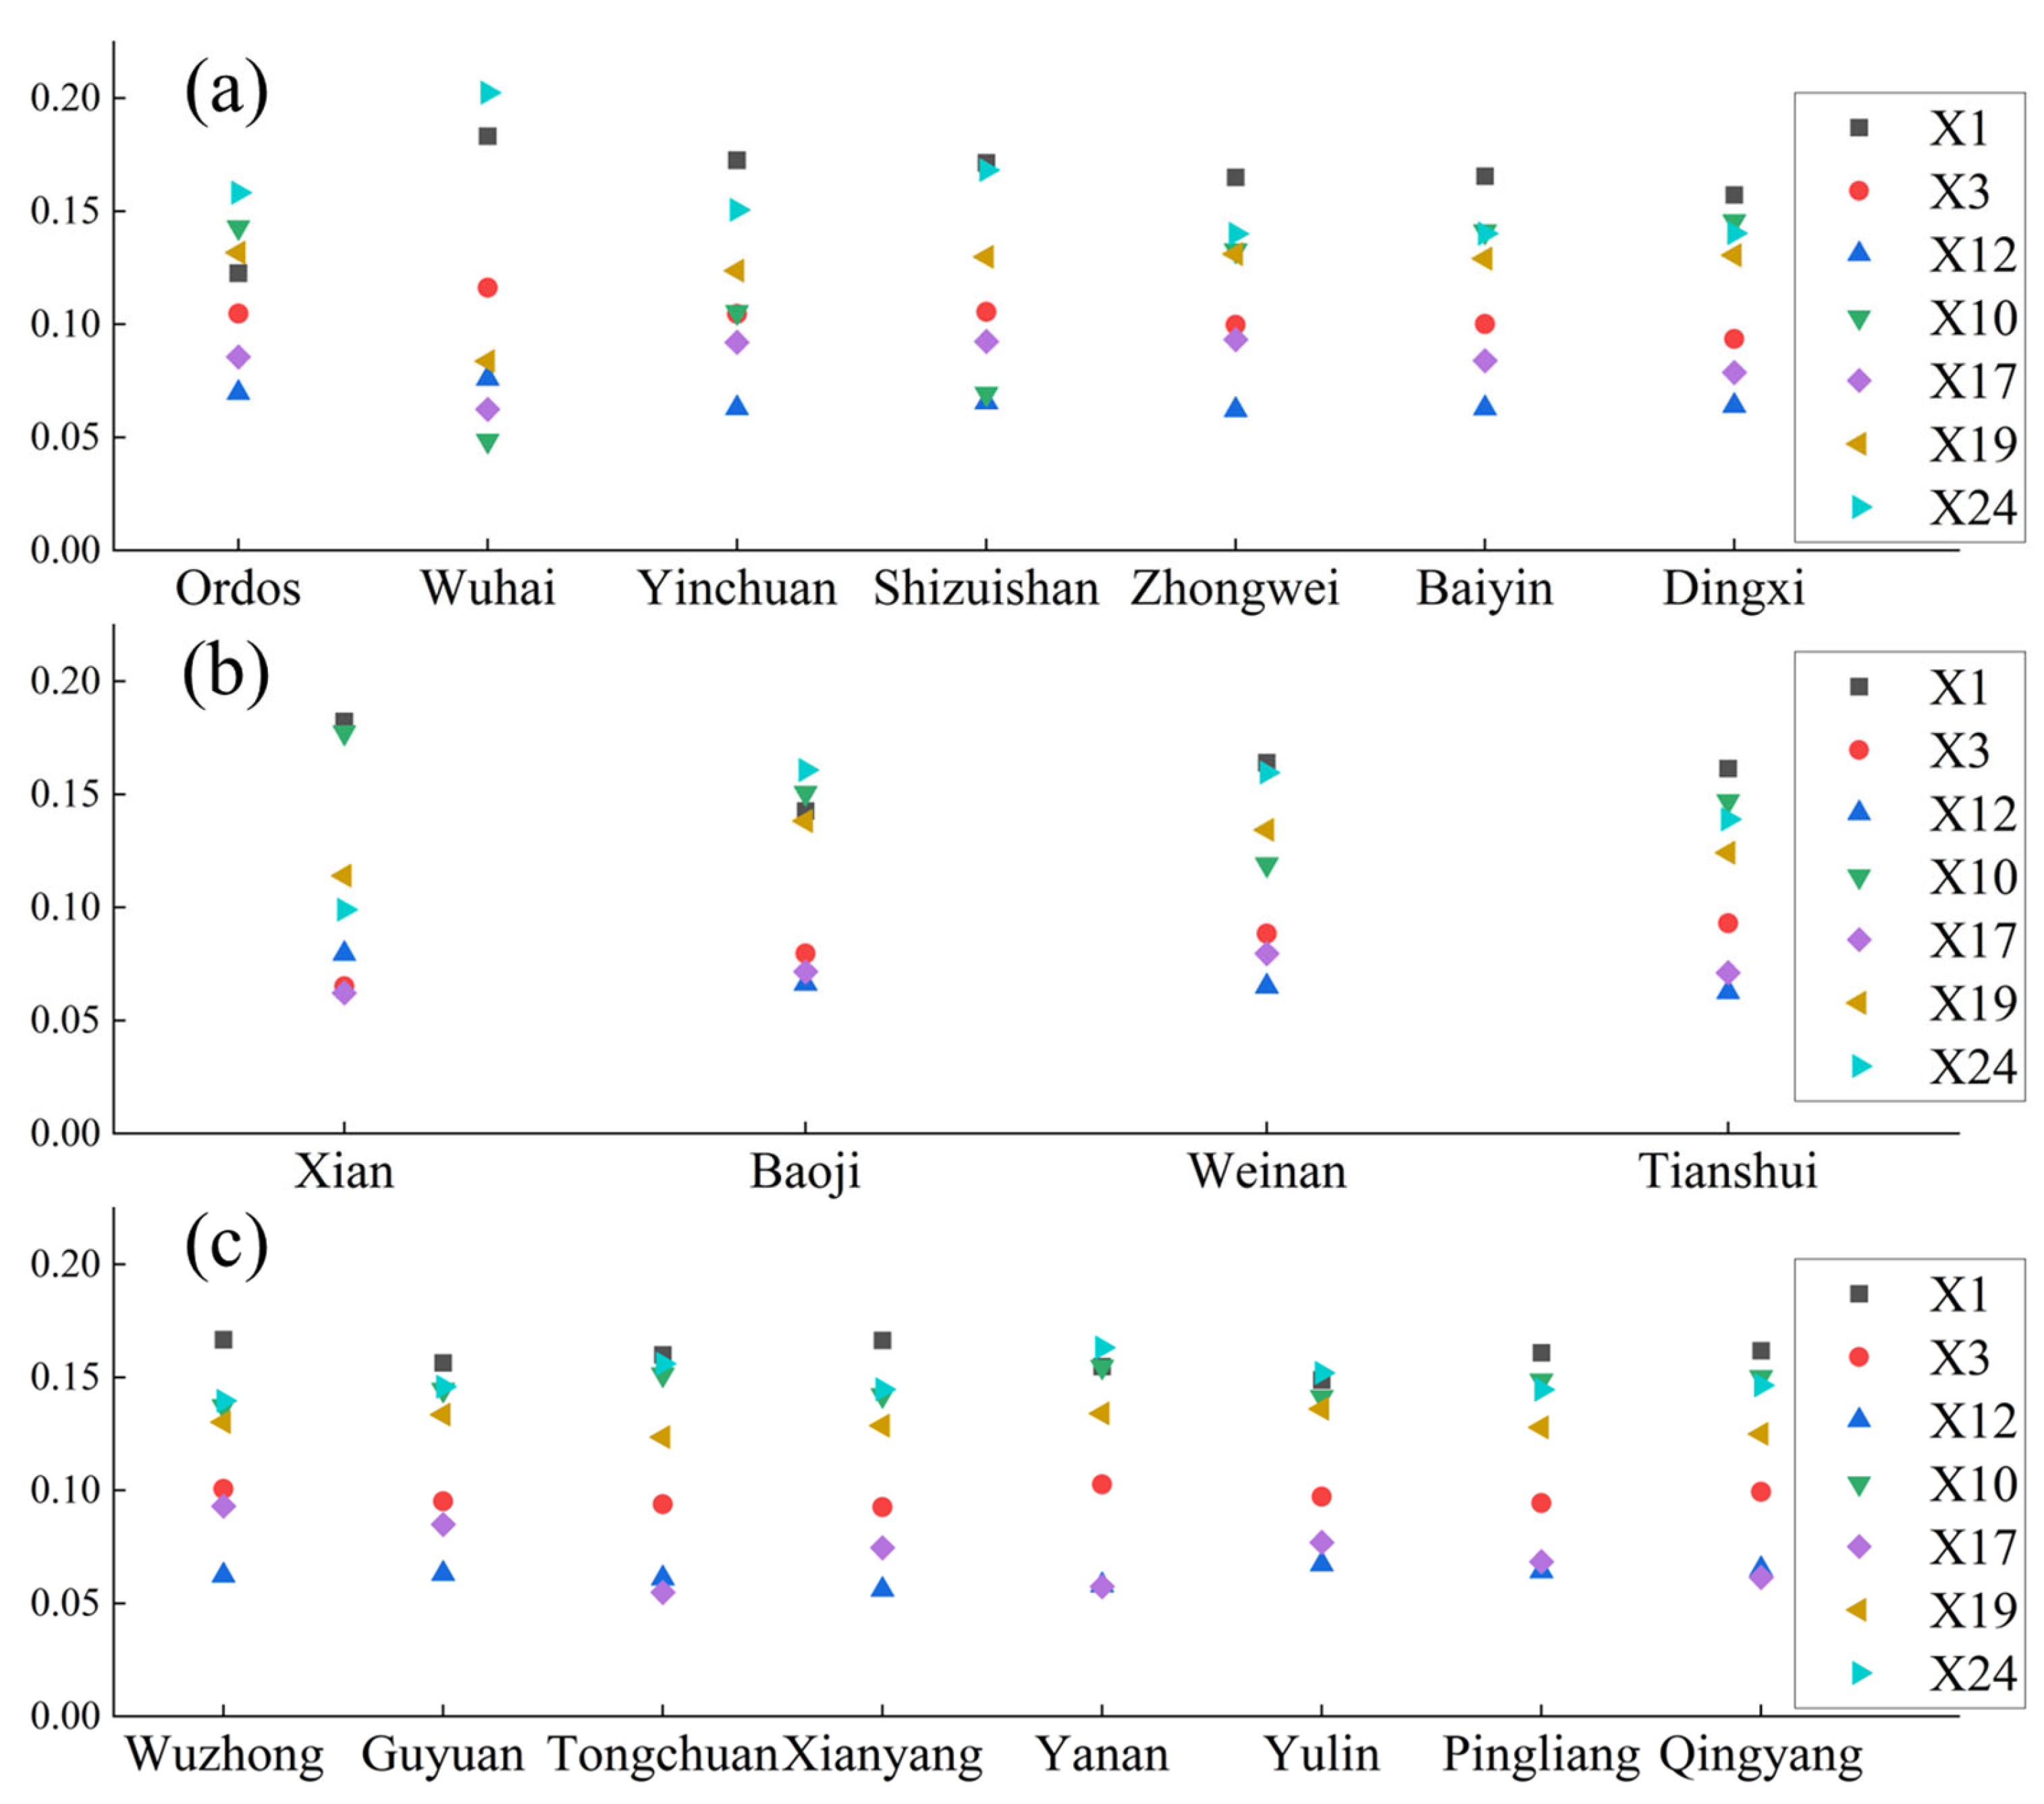
Based on the spatiotemporal analysis, the indicator weights were calculated using the entropy weight method described earlier. This paper used the risk factor model to calculate the obstacle degrees of the 24 indicators and diagnose the risk factors of the WEFEC complex system in the “Ji” Bay. Due to the large number of years and indicators involved, the average values of each risk factor were analyzed, and indicators with an obstacle degree greater than 0.05 were chosen as the primary risk factors. According to the spatial analysis results, the “Ji” Bay was divided into the northwest, central, and southern regions for analysis.
Specifically, as shown in Figure 9, the per capita water resources (X1), water area ratio (X10), and water yield modulus (X3) are the main risk factors restricting the WEFEC complex system in the “Ji” Bay, indicating that the water resource endowment in the “Ji” Bay is poor, and water resources have become the most important factor affecting the regional economy and ecological development. The number of green utility model patents (X24) also has a high obstacle degree. Since it can reflect the regional low-carbon technology R&D capability and sustainable development level, attention must be paid to innovation in green technology fields during urban development. Per capita carbon emissions (X12) become a main risk factor, possibly because the “Ji” Bay is an important energy industry base, leading to excessive carbon emissions. The main reasons why the proportion of agricultural water use and the proportion of ecological water use become major risk factors could be due to uneven water resource allocation and excessively high proportion of agricultural water use.
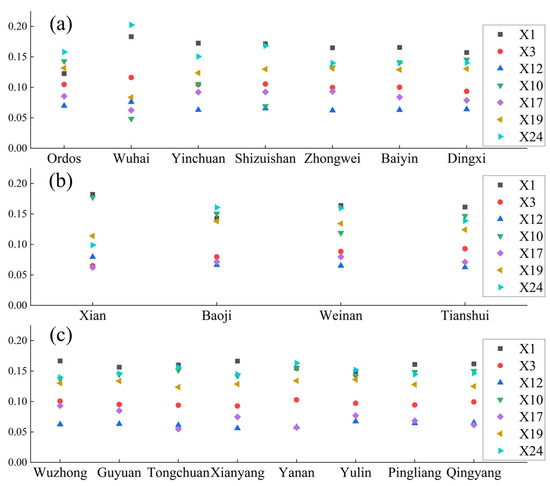
Figure 9.
Risk factor analysis of cities in the (a) northwest region, (b) southern region, and (c) central region of the “Ji” Bay.
Overall, the risk factors of each city are similar, but the magnitude of obstacle degrees varies by region. The obstacle degree of the number of green utility model patents (X24) in Wuhai is relatively large, whereas the Ecological water use rate (X19) is relatively low. The obstacle degrees of per capita water resources (X1) and water area ratio (X10) in Xi’an are relatively large. From the regional analysis, the obstacle degree of the number of green utility model patents (X24) in the northwest region is relatively higher than that in the other two regions, indicating that the technological innovation level in the northwest region of the “Ji” Bay needs to be improved. The risk factors of per capita water resources and water production modulus in the northwest region are greater than those in the central and southern regions, indicating that water resource problems in the upstream region of the “Ji” Bay are more serious, which is consistent with the findings of [46].
4. Discussion
4.1. Analysis of Evolution Mechanisms
From 2004 to 2023, the comprehensive risk of the WEFEC complex system in the Yellow River “Ji” Bay gradually shifted from extreme alert to high alert and then to medium alert. The number of cities in extreme alert and high alert states decreased, while the number of cities in no alert and light alert states increased. Extreme alert cities have shrunk from the northwest to a few areas, with the number of extreme alert cities in the northwest decreasing from 8 in the first period (2004–2010) to 1 in the third period (2017–2023), while the number of no alert cities increasing from 1 to 5. The risk in the central region (such as Wuzhong) remained high. The main reason is that policies, such as Yellow River Basin Ecological Protection and High-Quality Development Plan Outline, the Yellow River Protection Law of the People’s Republic of China, and the Guiding Opinions of the Four Ministries and Commissions on Deeply Promoting the Green Development of Industries in the Yellow River Basin, have significantly improved water, food, energy, ecology, and carbon emissions issues. Poor reliability is exemplified by a significant water resource shortage and excessive carbon emissions. The introduction of policies, such as the Shaanxi Province Water Conservation Regulations and Inner Mongolia Autonomous Region Carbon Peaking Implementation Plan, has improved reliability. For example, X4 (water consumption per 104 yuan GDP) has decreased to 1/9 of its value in 2004 in 2023, and X5 (unit area yield) has increased by nearly 2.5 times in 20 years. Synergy is at a medium level with significant room for improvement; due to the proposal of the Science and Technology Innovation Implementation Plan for Ecological Protection and High-Quality Development of the Yellow River Basin and the construction of major scientific and technological projects and platforms, the economy and technology in the “Ji” Bay have developed rapidly. The resilience indicators X22 (urbanization rate) increased from 32% in 2004 to 62% in 2023, and X24 (number of green utility model patents) achieved explosive growth.
4.2. Policy Recommendations
From the perspective of different criterion layers, addressing water scarcity and high carbon emissions at the reliability level requires a dynamic, cross-regional water rights trading mechanism that allows for the conversion of agricultural water savings into industrial water indicators. Simultaneously, enforcing dual control measures on total energy consumption and intensity, and applying a carbon quota management for highly energy-consuming industries is required. To improve synergy, integrate water-saving irrigation and low-carbon fertilization techniques into agriculture, aiming to reduce water consumption per mu and agricultural carbon emissions. For stronger resilience, optimize the economic structure of ecologically fragile areas, foster scientific and technological innovation, and include fiscal spending on environmental protection as a key metric in evaluating local governments performance, ensuring the continuous advancement in sustainability investment.
From the perspective of risk factors, for water-related risk factors such as per capita water resources and water yield modulus, and rigid water resource management and control should be implemented; for carbon-related factors such as per capita carbon emissions and carbon emission density, carbon capture demonstration projects could be constructed in energy bases such as Ordos; and to improve ecological indicators such as water area ratio and ecological water use rate, red lines for river–lake ecological protection should be demarcated, and the project of returning farmland to lakes should be implemented in cities along the Yellow River.
From each region’s perspective, the northwest region (such as Wuzhong and Zhongwei) must focus on resolving water resource issues and technical bottlenecks. It is important to construct cross-regional water diversion projects to supplement ecological water; the central energy-rich areas (such as Ordos and Yulin) should promote green industrial transformation and mandate a water cycle utilization transformation for coal chemical enterprises.
4.3. Limitations and Future Research Directions
This study conducted a comprehensive risk assessment of the WEFEC giant system, aiming to broaden the research perspective on the interconnections between the five sub-systems. However, this paper does have some limitations. This paper fails to verify whether the risks of the WEFEC complex system align with the EKC theory by integrating economic indicators such as regional per capita GDP growth and industrial structure upgrading. Additionally, due to data constraints, only carbon emission indicators were chosen for the “food–carbon” interconnection; however, in agricultural production, sowing food crops is also a carbon sink behavior, which may affect the synergy between “food and carbon.” Secondly, the existing risk factor analysis is based on historical data and does not combine the regional development transformation (such as new energy base construction and industrial upgrading) under policy guidance, such as the “double carbon” goal and the Yellow River Basin ecological protection plan, and, therefore, it lacks the dynamic prediction of future risk evolution. In the future, a scenario analysis model (such as the system dynamics model) will be constructed, fully considering other influencing factors, setting different scenarios, and quantitatively analyzing the risk mitigation effects of industrial structure adjustment and low-carbon technology popularization (such as carbon capture and utilization) on the WEFEC system to provide a scientific basis for medium- and long-term planning.
5. Conclusions
Based on the panel data of 19 cities in the Yellow River “Ji” Bay from 2004 to 2023, this study developed a risk assessment system for the WEFEC complex system and used the game theory–cloud model and risk factor model to analyze and determine the following: The multi-year average risk in this region is at a high alert level. Reliability is poor due to water resource shortage and excessive carbon emissions. Synergy is moderate, with considerable room for improvement. Resilience is generally improving, but there is a risk of shifting toward high alert in the later period; spatially, the number of cities in extreme alert decreased from eight in 2004–2010 to one in 2017–2023, while the number of cities in no alert increased from one in 2004–2010 to five in 2017–2023. Risks in the upstream region are more prominent, Wuzhong has always been in an extreme alert state, and per capita water resources, water production modulus, water area ratio, per capita carbon emissions, number of green utility model patents, etc., are the main risk factors. Based on this, the study proposes policy recommendations such as strengthening water rights management and trading, encouraging water-saving, energy-saving, and emission-reduction measures, optimizing economic structure, and improving ecological restoration capabilities.
Author Contributions
M.L.: Funding acquisition, Methodology, Formal analysis, and Supervision. T.K.: Methodology, Conceptualization, and Writing—original draft. W.L.: Methodology, Conceptualization, and Writing—review and editing. Y.L.: Funding acquisition, Conceptualization, Formal analysis, and Supervision. X.X.: Writing—review. X.G.: Methodology, Conceptualization, and Supervision. G.L.: Writing—review. S.S.: Writing—review. C.G.: Writing—review. J.D.: Writing—review. All authors have read and agreed to the published version of the manuscript.
Funding
This work was supported by the National Key Research and Development Program of China (2023YFC3206505) and (2024YFC3211303).
Institutional Review Board Statement
Not applicable.
Informed Consent Statement
Not applicable.
Data Availability Statement
The data that support the findings of this study are available from the corresponding author upon reasonable request.
Acknowledgments
We sincerely appreciate the editor and all anonymous reviewers for their constructive comments, which greatly improved the quality of the manuscript. We also appreciate the organizations that provided valuable data for this study.
Conflicts of Interest
The authors declare that they have no known competing financial interests or personal relationships that could have appeared to influence the work reported in this paper.
References
- Purwanto, A.; Sušnik, J.; Suryadi, F.X.; de Fraiture, C. Water-Energy-Food Nexus: Critical Review, Practical Applications, and Prospects for Future Research. Sustainability 2021, 13, 1919. [Google Scholar] [CrossRef]
- Alresheedi, M.T.; Haider, H.; Shafiquzzaman, M.; AlSaleem, S.S.; Alinizzi, M. Water–Energy–Carbon Nexus Analysis for Water Supply Systems with Brackish Groundwater Sources in Arid Regions. Sustainability 2022, 14, 5106. [Google Scholar] [CrossRef]
- Liu, S.; Wang, L.; Lin, J.; Wang, H.; Li, X.; Ao, T. Evaluation of Water-Energy-Food-Ecology System Development in Beijing-Tianjin-Hebei Region from a Symbiotic Perspective and Analysis of Influencing Factors. Sustainability 2023, 15, 5138. [Google Scholar] [CrossRef]
- Mekonnen, M.M.; Hoekstra, A.Y. The green, blue and grey water footprint of crops and derived crop products. Hydrol. Earth Syst. Sci. 2011, 15, 1577–1600. [Google Scholar] [CrossRef]
- Van Vuuren, D.P.; Bijl, D.L.; Bogaart, P.; Stehfest, E.; Biemans, H.; Dekker, S.C.; Doelman, J.C.; Gernaat, D.E.H.J.; Harmsen, M. Integrated scenarios to support analysis of the food-energy-water nexus. Nat. Sustain. 2019, 2, 1132–1141. [Google Scholar] [CrossRef]
- Wang, H.; Li, X.; Zhang, L.; Wang, L.; Jiang, X. Research progress and the prospect of a complex relationship between water-energy-carbon emission. South North Water Transf. Water Sci. Technol. 2023, 21, 13–21. [Google Scholar] [CrossRef]
- Zhao, R.; Yu, J.; Xiao, L.; Sun, J.; Luo, H.; Yang, W.; Chuai, X.; Jiao, S. Carbon emissions of urban water system based on water-energy-carbon nexus. Acta Geogr. Sin. 2021, 76, 3119–3134. [Google Scholar] [CrossRef]
- Li, N.; Yang, J.; Qiao, Z.; Wang, Y.; Miao, S. Urban Thermal Characteristics of Local Climate Zones and Their Mitigation Measures across Cities in Different Climate Zones of China. Remote Sens. 2021, 13, 1468. [Google Scholar] [CrossRef]
- Zhou, T.; Chen, Z.; Chen, X.; Zuo, M.; Jiang, J.; Hu, S. Interpreting IPCC AR6: Future global climate based on projection under scenarios and on near-term information. Progress. Inquisitiones Mutat. Clim. 2021, 17, 652–663. [Google Scholar]
- Allan, T.; Keulertz, M.; Woertz, E. The water-food-energy nexus: An introduction to nexus concepts and some conceptual and operational problems. Int. J. Water Resour. Dev. 2015, 31, 301–311. [Google Scholar] [CrossRef]
- Băbăț, A.-F.; Mazilu, M.; Niță, A.; Drăguleasa, I.-A.; Grigore, M. Tourism and Travel Competitiveness Index: From Theoretical Definition to Practical Analysis in Romania. Sustainability 2023, 15, 10157. [Google Scholar] [CrossRef]
- de Amorim, W.S.; Valduga, I.B.; Ribeiro, J.M.P.; Guazzelli Williamson, V.; Krauser, G.E.; Magtoto, M.K.; Guerra, J.B.S.O.D. The nexus between water, energy, and food in the context of the global risks: An analysis of the interactions between food, water, and energy security. Environ. Impact Assess. Rev. 2018, 72, 1–11. [Google Scholar] [CrossRef]
- Zeng, Y.; Liu, D.; Guo, S.; Xiong, L.; Liu, P.; Chen, J.; Chen, H.; Yin, J.; Wu, Z.; Zhou, W. Assessment of the impacts of water resources allocation on the reliability, resilience and vulnerability of the water-energy-food-society (WEFS) nexus system. Agric. Water Manag. 2024, 295, 108780. [Google Scholar] [CrossRef]
- Yue, Q.; Guo, P. Managing agricultural water-energy-food-environment nexus considering water footprint and carbon footprint under uncertainty. Agric. Water Manag. 2021, 252, 106899. [Google Scholar] [CrossRef]
- Feng, M.; Zhao, R.; Huang, H.; Xiao, L.; Xie, Z.; Zhang, L.; Sun, J.; Chuai, X. Water-energy-carbon nexus of different land use types: The case of Zhengzhou, China. Ecol. Indic. 2022, 141, 109073. [Google Scholar] [CrossRef]
- Chamas, Z.; Abou Najm, M.; Al-Hindi, M.; Yassine, A.; Khattar, R. Sustainable resource optimization under water-energy-food-carbon nexus. J. Clean. Prod. 2020, 278, 123894. [Google Scholar] [CrossRef]
- Liu, L.; Wang, C.; Chen, J. Simulation of regional green development policies under the nexus of water-energy-food-ecology: A case study of the Yangtze River economic Belt. Ecol. Indic. 2025, 173, 113364. [Google Scholar] [CrossRef]
- Ding, Y.; Chen, F.; Li, Y.; Tang, S.; Yu, L.; Yang, Y. Compiling background and ideas of The Action Plan for Comprehensive Treatment of Groundwater Overexploitation in North China. China Water Resour. 2020, 13, 22–25. [Google Scholar]
- Chen, I.; Wang, Y.; Lin, W.; Ma, H. Assessing the risk of the food-energy-water nexus of urban metabolism: A case study of Kinmen Island, Taiwan. Ecol. Indic. 2020, 110, 105861. [Google Scholar] [CrossRef]
- Cui, S.; Zhang, J.; Wang, X.; Wu, M.; Cao, X. Fuzzy composite risk assessment of water-energy-food-carbon nexus in the dispark pumped irrigation system. J. Hydrol. 2023, 624, 129879. [Google Scholar] [CrossRef]
- Li, W.; Jiang, S.; Zhao, Y.; Li, H.; Zhu, Y.; He, G.; Xu, Y.; Shang, Y. A copula-based security risk evaluation and probability calculation for water-energy-food nexus. Sci. Total Environ. 2022, 856, 159236. [Google Scholar] [CrossRef] [PubMed]
- Wang, Y.; Zhao, Y.; Wang, Y.; Ma, X.; Bo, H.; Luo, J. Supply-demand risk assessment and multi-scenario simulation of regional water-energy-food nexus: A case study of the Beijing-Tianjin-Hebei region. Resour. Conserv. Recycl. 2021, 174, 105799. [Google Scholar] [CrossRef]
- Yu, F.; Fang, L. Issues Regarding the Ecological Protection and High-quality Development of Yellow River Basin. China Soft Sci. 2020, 6, 85–95. [Google Scholar]
- Li, Z.; Deng, M.; Li, P.; Jia, L. Studies on integrated development of water-energy-food-ecosystem in soil erosion areas of the Ω Bend of the Yellow River. China Water Resour. 2025, 11, 20–27. [Google Scholar]
- Zhang, N.; Li, X.; Zhou, Y.; Niu, J. Water resources carrying capacity evaluation of the Yellow River Basin based on EFAST weight algorithm. J. Nat. Resour. 2019, 34, 1759–1770. [Google Scholar] [CrossRef]
- Zhang, Z.; Chen, F.; Long, A.; He, X.; He, C. Assessment of water resource security in an arid area based on an extension cloud model: A case study of Shihezi District. Arid Zone Res. 2020, 37, 847–856. [Google Scholar] [CrossRef]
- Zhang, L.; Kang, Y.; Su, X. Water Resources Carrying Capacity Evaluation of Yellow River Basin Based on Normal Cloud Model. Water Sav. Irrig. 2019, 1, 76–83. [Google Scholar]
- Yu, L.; Guo, J.; Wang, H. Harmony evaluation of regional water-energy-food coupling system. South North Water Transf. Water Sci. Technol. 2021, 31, 301–311. [Google Scholar] [CrossRef]
- Xu, L. Study on Synergy Security of Water-Energy-Food Correlation System in Yangtze River Economic Belt. Master’s Thesis, Nanjing Forestry University, Nanjing, China, 2022. [Google Scholar] [CrossRef]
- Jiang, R.; Gu, S. Evaluation of water safety in Yunnan Province based onwater poverty index and MSCS-SVM model. J. Econ. Water Resour. 2018, 36, 7–12+69+75. [Google Scholar]
- Wang, J.; Liu, Y.; Li, Z.; Liang, X. Probabilistic neural network for water security assessment based on normalized indicators. J. Hydroelectr. Eng. 2015, 33, 78–83+110. [Google Scholar]
- Zhang, P.; Zhou, Y.; Xie, Y.; Wang, Y.; Yang, Z.; Cai, Y. Spatial transmission mechanism of the water, energy and food nexus risks for the Guangdong-Hong Kong-Macao region of China. J. Clean. Prod. 2023, 405, 136906. [Google Scholar] [CrossRef]
- Papadopoulou, C.A.; Kourtis, I.M.; Laspidou, C.; Tsihrintzis, V.A.; Papadopoulou, M.P. An integrated methodology for systematic stakeholder engagement in environmental decision-making under the Water-Energy-Food-Ecosystems nexus framework. Environ. Dev. 2025, 56, 101268. [Google Scholar] [CrossRef]
- Zhang, Z.; Li, Y.; Wang, X.; Zhu, L.; Li, H.; Liu, Y.; Tang, N.; Xu, Y.; Hu, Q. Investigating river health and potential risks using a novel hybrid decision-making framework with multi-source data fusion in the Qinghai-Tibet Plateau. Environ. Impact Assess. Rev. 2022, 96, 106849. [Google Scholar] [CrossRef]
- Xiao, Y.; Rao, X.; Chang, M.; Chen, L.; Huang, H. Assessment of urban flood resilience and obstacle factors identification: A case study of three major urban agglomerations in China. Ecol. Indic. 2025, 176, 113659. [Google Scholar] [CrossRef]
- Jin, J.; Liu, D.; Zhou, R.; Zhang, L.; Cui, Y.; Wu, C. Evaluation model of water resources carrying capacity based on projection pursuit weight optimization. Water Resour. Prot. 2021, 37, 1–6. [Google Scholar] [CrossRef]
- Gu, Q.; Zhang, L.; Zhao, X.; Wang, H.; Dong, Y. Evaluation of regional water environment carrying capacity based on ANP-Normal cloud model. J. China Inst. Water Resour. Hydropower Res. 2021, 19, 506–515. [Google Scholar] [CrossRef]
- Wang, F.; Hou, X.; Wang, Y.; Qiu, J. Evaluation of Regional Water Resources Carrying Capacity Based on EFAST-Cloud Model. J. North China Univ. Water Resour. Electr. Power Nat. Sci. Ed. 2022, 43, 28–35. [Google Scholar] [CrossRef]
- Chen, H.; Li, X.; Li, C. Resilience Evaluation of Water Resource System Based on Coefficient of Variation-Entropy Weight Method: A Case Study of Water Resources in Heilongjiang Province. Ecol. Econ. 2021, 37, 179–184. [Google Scholar]
- Zhang, P.; Han, H.; Sang, Y.; Xia, T.; Cai, Y.; Shen, Y.; Qiu, R. Risk quantification of saltwater intrusion in Modaomen Estuary of the Pearl river Delta, South China. J. Hydrol. 2025, 661, 133755. [Google Scholar] [CrossRef]
- Jia, Y.; Yang, H.; Su, X.; Chu, J.; Xu, J. Evaluation of Water Resources Carrying Capacity and Investigation of Driving Factors in the Shiyang River Basin. Water Resour. Prot. 2024, 40, 86–94+157. [Google Scholar]
- Wang, X.; Yang, W.; Xu, Z.; Hu, J.; Xue, Y.; Lin, P. A Normal Cloud Model-Based Method for Water Quality Assessment of Springs and Its Application in Jinan. Sustainability 2019, 11, 2248. [Google Scholar] [CrossRef]
- Gao, X.; Shi, H.; Dang, X. Characteristics of water use in the “Jiziwan” urban agglomeration of the Yellow River Watershed and key areas of water-saving based on input and output model. Acta Ecol. Sin. 2023, 42, 10150–10163. [Google Scholar] [CrossRef]
- An, S.; Zhang, S. On the High–Quality Development of the Bend Area of the Yellow River. J. Shanxi Univ. Philos. Soc. Sci. 2021, 44, 134–144. [Google Scholar]
- Shen, Y.; Yang, B.; Wang, S.; Kou, H.; Chen, X.; Xu, Y.; Han, S. Typical characteristics of geological hazards and ecological environment of coal base in the bends area of the Yellow River. Coal Geol. Explor. 2022, 50, 104–117. [Google Scholar] [CrossRef]
- Tong, L.; Luo, M. Spatiotemporal Evolution Characteristics and Driving Factors of Water-Energy-Food-Carbon System Vulnerability: A Case Study of the Yellow River Basin, China. Sustainability 2024, 16, 1002. [Google Scholar] [CrossRef]
Disclaimer/Publisher’s Note: The statements, opinions and data contained in all publications are solely those of the individual author(s) and contributor(s) and not of MDPI and/or the editor(s). MDPI and/or the editor(s) disclaim responsibility for any injury to people or property resulting from any ideas, methods, instructions or products referred to in the content. |
© 2025 by the authors. Licensee MDPI, Basel, Switzerland. This article is an open access article distributed under the terms and conditions of the Creative Commons Attribution (CC BY) license (https://creativecommons.org/licenses/by/4.0/).

