Abstract
The rising cost of traditional energy sources is forcing us to seek alternatives that enable energy self-sufficiency. At the Madrid Zoo Aquarium (Spain), the production of biomethane through the anaerobic digestion of organic waste is being considered, improving environmental management and achieving a competitive advantage in the energy management process. This opportunity also carries with it the possibility of explosions, fires or polluting environments, which requires the establishment of preventive measures to minimize these risks. To respond to this type of contingency, this study develops both empirical equation and charts that allow the establishment of dangerous distances that must be considered due to the presence of flammable gases escaping into the atmosphere and the duration of the danger, taking into account the influence of environmental conditions and dilution. Different risk situations are considered, both during the operation of the facility and during the cleaning and maintenance of tanks and equipment, as well as in the management of waste generated at the end of treatment.
1. Introduction
Biogas is a sustainable energy resource that comes from the anaerobic digestion of agricultural waste such as manure, slurry, fruit, and other industries such as paper and organic sludge generated during wastewater treatment [1,2,3]. Although it does not currently have the prominence and widespread use of other clean energies such as wind, solar, or hydroelectric power [4], its production is being encouraged and promoted by the European Commission in the context of the Sustainable Development Goals [5,6,7,8].
The Madrid Zoo Aquarium (Spain) is home to more than 300 different species of animals from different continents, including reptiles, fish, birds, and mammals, among which are large mammals such as elephants, rhinos, and hippos. It also has a varied collection of plant species to recreate the natural habitats of each animal species.
Maintaining the animal population requires not only the logistics of supplying large quantities of a wide variety of food, but also the management of the enormous amount of organic waste generated, which is a major challenge for the Madrid Zoo Aquarium. Furthermore, the Madrid Zoo Aquarium facilities as a whole also require significant amounts of energy for their operation and maintenance, making it necessary to have sufficient energy resources, especially electrical energy.
The possibility of recovering nutrients and energy from organic animal waste [9,10], and reducing greenhouse gas emissions, such as carbon dioxide or methane itself [11,12,13], has led the Madrid Zoo Aquarium to analyze the possibilities of generating biogas from the anaerobic digestion of pruning waste from plant species and manure generated by animals. This enables the autonomous production of electrical energy from biogas, which contributes to reducing the external energy dependence of the facilities, including the air conditioning of their own enclosures, through autonomous production from a renewable energy source with great growth potential [14,15,16,17].
Scientific literature has extensively studied the energy potential of domestic animal manure in biomethane generation, based on waste generated by domestic animals such as cows, pigs, chickens, sheep, goats, and ducks [18,19,20,21,22], but in no case from wildlife. In all cases, methane production is determined based on the percentage of volatile solids (organic matter) present in the manure.
In general, it is assumed that the yield of biomethane from animal manure is linked to its nutritional composition and the microorganisms present, ranging from 157 to 500 mL/gVS [19,20], considering an average efficiency of 36.0 L of biogas per kg of animal manure [23], or between 15 and 30 L in the case of cattle waste [24].
Similarly, lignocellulosic biomass is also considered to be the most abundant natural resource with high biomethane potential [1,25]. The significant presence of lignin in wood waste from the Madrid Zoo Aquarium (Spain) negatively affects biogas production, with 100 g/kgVS considered the value above which it would not be considered suitable for anaerobic digestion [26]. However, this situation can be mitigated by incorporating a pretreatment, including microbial pretreatment, which, depending on the bacterial strain applied, allows for production increases of between 88.9% and 70.2% [27].
The efficiency of the process is influenced by multiple factors that allow for its optimization [28]. For example, there is the possibility of improving production through the feeding of the animals themselves [29], the incorporation of other waste, co-digestion with microalgae [30], wheat straw, and even the prior storage time of the substrate [31] and its pre-treatment [20]. The constant incorporation of new technologies into the digestion process is making it possible to increase its performance [19,31].
However, due to their nature, these types of facilities generate significant risks that need to be assessed in order to operate safely, with the danger of explosion being one of the most important [32]. To avoid these risks, it is important to identify areas that are hazardous due to the risk of fire and explosion [33,34], since neither the design standards for biomethane generation plants nor the scientific literature take into account the dangerous distances generated, with a particular lack of awareness regarding the waiting times required after opening the bioreactors, making it impossible to correctly select and locate equipment [35] and adapt it to the continuous improvement of the organic matter treatment process for obtaining biogas [1,36,37].
2. Case Study
The research work is carried out at the Madrid Zoo Aquarium (Spain), a leisure center that displays different types of animal species in natural environments similar to those of their areas of origin.
2.1. Initial Data
Based on historical data on organic waste generation and energy consumption at the Madrid Zoo Aquarium for the operation and maintenance of its facilities (Table 1), estimates have been made of biomethane production and the possibilities for its use in self-sufficient energy supply (Table 1).

Table 1.
Historical data on waste generation and energy consumption at Madrid Zoo Aquarium.
The estimated production of biomethane from animal manure waste and biomass residues is shown in Table 2.
Table 2.
Estimated annual biomethane generation at the Madrid Zoo Aquarium. Source: [23,26].
Based on the data collected, it should be noted that the maximum estimated values that can be reached are five times higher than the minimum values considered [19,20,23,24]. Based on the calorific values of combustible gases under normal conditions [38] (Table 3), the energy generated solely from manure is estimated, due to the technical difficulty of digesting the lignin present in shrub pruning waste [26].
Table 3.
Heat capacity of combustible gases. Source: [39].
Based on estimated calculations, it can be stated that, with the volume of manure treated, it would be possible to generate 70.0% more of the energy needed to operate the facility, which would make it possible to supply gas to the Zoo’s facilities, which currently use Liquefied Petroleum Gas (LPG) as fuel, such as the buildings used for restaurants and offices. This energy could also be used to heat and cool the animals’ enclosures, thus helping to reduce operating costs in a circular waste economy [40,41].
2.2. Description of the Installation
The methane production facility at Madrid Zoo Aquarium consists of simple treatments that, when integrated, transform animal waste into methane gas and solids that can be recovered as organic fertilizer or soil conditioner [42,43] (Figure 1).
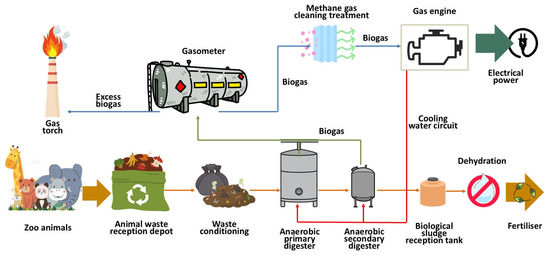
Figure 1.
Diagram of the process for producing methane gas from animal waste.
Organic animal waste is sent to the treatment plant for conditioning, with the aim of achieving a uniform texture and size suitable for the anaerobic digestion process [44,45]. To this end, the size is standardized and any inorganic foreign bodies in the waste are removed. Subsequently, it is pumped into the digesters using progressive cavity pumps to begin the process of transforming the organic matter through anaerobic processes.
The transformation of volatile solids present in organic waste into gas occurs in anaerobic digesters at a temperature of approximately 30.0 °C, with the aim of enabling the proliferation of mesophilic bacteria, thus obtaining significant methane production under reasonable and easily achievable operating conditions [46,47]. To facilitate the uniformity of the sludge inside the digesters, a system of compressors is used to inject the gas itself into the sludge under pressure, facilitating its uniform heating [48,49].
It should be noted that the waste is heated by means of a water circuit that is heated in boilers with burners that can use either gas or diesel fuel. Diesel fuel is used during the start-up process of the anaerobic digester. Once the sludge is heated and mesophilic anaerobic bacteria proliferate, methane gas is produced, so the burners switch fuels, running on the biogas generated in the process [50].
The working pressure inside the digesters is around 20 mbar, calibrated to a maximum pressure of 25.0 mbar, which is ensured by the automatic opening of safety valves installed on the digester cover. The gas is collected in the dome of the digesters and redirected to membrane gasometers for storage. In the event of excess gas production, a flare is available.
The biogas produced is a dirty fuel, which must be conditioned before being fed into the engines for electricity generation. To do this, it is purified with metal salts, such as ferric chloride (FeCl3), to remove hydrogen sulfide (H2S), a highly corrosive compound that causes significant damage to the liners of the combustion chambers of the motor generators. Treatment with activated carbon reduces the concentrations of volatile organic compounds and siloxanes. Moisture, which can affect engine performance, must also be removed by automatically purging the water accumulated in the condensate traps located at the low points of the pipes [51,52].
High-efficiency internal combustion engines (150 kW–985 kW) are used to produce electrical energy, using biogas to drive a rotary alternator that transforms mechanical energy into electrical energy, all regulated by an automatic PLC control system to optimize process management. The engine cooling system allows thermal energy to be obtained, which can be redirected to the heating circuit of the aerobic digesters, with the aim of helping to maintain an average temperature of 30 °C for stable production of mesophilic anaerobic bacteria [53].
3. Methodology
The facility described above is highly complex and requires exhaustive control of all processes, from the conditioning of animal waste prior to treatment, its digestion in anaerobic bioreactors, the formation of mesophilic bacteria, and, as a result, the generation of biogas through the degradation of volatile components of organic matter [35]. The waste that is not converted into gas is removed and dehydrated by centrifugation for use as an agricultural soil conditioner, providing organic matter and nutrients.
The entire process described is easy to manage, but at different stages of the process there are significant risks related to the presence of methane (CH4) and carbon dioxide (CO2), as well as smaller amounts of oxygen (O2), hydrogen sulfide (H2S), hydrogen (H2), nitrogen (N2), and water vapor [54,55]. The concentration of flammable gas in digesters, pipes, gasometers, and surrounding areas can pose a significant risk to people. Leaks in safety valves, pipe joints (flanges), or digester domes also require special attention to prevent explosions or fires [56,57].
The main parameters to be taken into account when characterizing a flammable gas leak in the installation are the Lower Flammability Limit (LIE for its acronym in Spanish), which defines its hazardousness, the molecular weight that determines its behavior (Table 4, Table 5 and Table 6), and the pressure of the containment system [33,34].
Table 4.
Composition, molecular weight and lower flammability limit of natural gas.
Table 5.
Composition, molecular weight and lower flammability limit of biomethane.
Table 6.
Composition, molecular weight and lower flammability limit of biogas.
All leaks that occur in facilities and pipelines carrying flammable gases used in buildings occur in a single phase, and their modeling depends on the pressure at which the gas escapes from the containment system: high-pressure leaks are called sonic or throttled, while low-pressure leaks are defined as subsonic, i.e., their emission speed is lower than that of sound [33,34,58,59].
The flow rate of the leak depends not only on the pressure of the gas escaping through the orifice, but also on the behavior of the flammable cloud that is subsequently generated. Those produced at high pressure always behave initially like heavy gases, due to the rapid cooling that occurs during their expansion. The gas is emitted in the form of a jet, which causes the turbulent movement of its components and mixing with the air. On the other hand, those produced at low pressure generate a plume whose initial behavior depends on the relative density of the leaked gas. If it is less dense than air, it will rise, and if it is denser, it will descend until, due to the turbulence of the atmosphere itself, it behaves neutrally [33,34].
The model of the escaped gas regime, sonic or subsonic, is established by comparing the internal pressure of the system where it is contained with the critical pressure of the gas [33,34].
The critical pressure values for the most common combustible gases are as follows (Table 7):
Table 7.
Critical pressures of the gases present in the installation.
The safety valves located on the digestor covers are calibrated to a safety pressure of 25.0 mbar. This will be the reference pressure for the calculation for all the elements present in the gas installation. Under these conditions, any leak will occur in a single subsonic phase in laminar flow, which, due to the turbulence of the atmosphere itself, will ultimately behave neutrally [33].
Once the behavior of the leak has been established, the emission rate is determined using the calculation models proposed in the IEC EN 60079-10-1:22 standards [33].
The size of the holes or cracks in the installation components where the failure may occur will depend on multiple factors, such as the quality of the components, their maintenance, and the speed of intervention by the team of technicians responsible for repairs. The failure usually begins with the appearance of a small hole which, if no preventive action is taken, expands until it reaches critical dimensions for gas leakage [33,34].
The estimated opening for small joints and connections installed in small-diameter pipes (up to 50.0 mm) is 0.1 mm2. However, if compressed fiber joints are considered, which result in larger pores, the hole can vary between 0.6 mm and 3.0 mm in thickness. A serious joint failure can result in an orifice 0.05 mm thick over a length of 10.0 mm, meaning that the affected area can reach 0.5 mm2 [33,34].
In general-purpose valves mounted on pipes with a diameter of 150.0 mm or less, leakage through the stem is considered, estimating the orifice area at 0.25 mm2 [43,44]. In safety valves, with a very low containment system pressure, a 1.0 mm2 orifice is considered [33,34].
Manual condensate pot drains typically have diameters of 15.0 mm, 25.0 mm, 40.0 mm, and 50.0 mm, while sample ports have a diameter of 20.0 mm. However, for leaks, one-tenth of these values are considered [33,34].
The amount of gas emitted into the atmosphere as a result of a leak is called the Emission Rate, and is determined by the following equation [33]:
where
Wg: Escape rate of the flammable substance (kg/s)
Cd: Discharge coefficient (dimensionless)
S: Opening section, orifice through which the escape occurs (m2)
Z: Compressibility factor of gases
γ: Polytropic index: coefficient defined as the ratio between specific heats at constant pressure and constant volume (J/kg·K) n = Cp/Cv
T: Fluid temperature (K)
M: Molecular weight (g/mol)
Pa: Atmospheric pressure (Pa)
P: Absolute pressure of the containment system (Pa)
As this is a low-pressure installation, the compressibility factor is considered to be unity and a characteristic discharge coefficient for rounded openings of 0.95. This introduces a conservative approximation into the results.
In piping installations located in areas with little traffic, it is expected that an opening will expand until it fails seriously. In these circumstances, the typical value expected in a small-caliber connection (up to 50.0 mm) is 0.5 mm2 [33]. Considering that the pipe where the leak occurs is used to feed a biomethane receiving device (20.0 mbar), will emit 2.36 × 10⁻⁵ kg/s of gas into the atmosphere.
The dilution capacity of the hazardous atmosphere is determined by the leak flow model and the available ventilation, always considered in turbulent conditions as a result of the changes in direction it undergoes [45]. On the other hand, the outside air velocity fluctuates and depends on the height of the gas pipe, taking the terrain on which it is located as a reference [45]. Due to this circumstance, it is necessary to consider the most unfavorable reference values provided by the scientific literature [60,61].
The scientific literature establishes standard speeds based on the behavior of the gas under study and the height of the well or fissure where the gas emission is generated [32] (Table 8).
Table 8.
Standardized outdoor air velocities. Source: [33,34,61].
If the gas pipe is located in a poorly ventilated space, the normal air velocity to be considered is 0.05 m/s [34].
The analysis methodology used to obtain hazardous distance is based on the characterization of the gas, relating the flow rate to its density and its Lower Flammability Limit: [34].
where
Wg: Escape rate of the flammable substance (kg/s)
LIE (vol/vol): Lower explosive limit by volume (vol./vol.)
K: Safety factor attributed to the LIE, typically between 0.5 and 1 (dimensionless)
ρg: Gas density (kg/m3)
To determine the characterization of the leak during normal operation of the biogas production plant, the Safety Factor is considered to be unity, since this is a secondary leak, occurring infrequently and for short periods of time [33]. An emission into the atmosphere of 2.36 × 10⁻⁵ kg/s of biomethane implies an exhaust feature of 1.52 × 10⁻³ m3/s.
Considering that biomethane has a density of 0.70 kg/m3, the hazardous distance generated by diffuse leaks, following a subsonic model, cannot be correctly assessed with the latest versions of the IEC EN UNE-EN 60079-10-1 standard if its characterization is less than 0.006 m3/s [33], and it is necessary to resort to numerical models from previous versions, using the following equation for open environments [34]:
where
dz: Hazardous distance (m)
Wg: Escape rate of the flammable substance (kg/s)
f: Ventilation efficiency factor (dimensionless). It takes the value of 1 in efficient mixtures of escapes into the surrounding atmosphere, 1.5 in slightly inefficient mixtures, and 5 for very inefficient mixtures
M: Molecular weight (grams/mol)
w: Air velocity (m/s)
LIE (%vol): Lower flammability limit by volume (%vol.)
For a pipe height between 2.0 and 5.0 m and a pressure of 20.0 mbar, the dangerous distance for biomethane is 11.2 cm.
The time required for the average concentration to decrease from an initial value Xo to k times the LIE after the leak has ended is called the residence time, obtained using the following expression [33,34]
where
X0: Is the initial concentration of flammable substance expressed in the same units as the LIE
C: is the number of fresh air changes per unit of time (s−1)
f: Factor due to the mixture not being perfect (dimensionless)
LIE (%vol): Lower flammability limit by volume (%vol.)
k: Safety factor applied to the LEL (dimensionless)
Natural ventilation inside the bioreactor is due to air suction induced by buoyancy, which occurs due to the difference in air density resulting from the temperature contrast between the inside and outside. Mathematical models are available to determine the Natural Ventilation Rate using zenith openings [33,34]:
where
Qw: Volumetric air flow (m3/s)
Cd: Dimensionless discharge coefficient that takes turbulence and viscosity into account, typically between 0.5 and 0.7
Ae: Equivalent ventilation area (m2)
ΔT: Difference between outside and inside temperature (K)
Tout: Outdoor temperature (K)
Tin: Indoor temperature (K)
g: Acceleration due to gravity (9.81 m/s2)
H: Vertical distance between the lower and upper opening points (m)
The effective area is obtained using the following formula [33,34]:
where
Ae: Effective area of the openings (m2)
A1: Area of the upper opening (m2)
A2: Area of the lower opening (m2)
Considering an outside temperature of 20.0 °C and an inside temperature of 35.0 °C, with a manhole opening of 60.0 cm in diameter in the dome located at a height of 5.0 m above ground level, together with a lower side opening of 1.0 m2, the ventilation flow rate is 2.7 m/s.
The hourly air changes in the bioreactor can also be used as a control parameter [33,34]:
where
C: Number of air changes per unit of time (s−1)
Qw: Fresh air flow rate through space considered (m3/s)
V: Bioreactor volume (m3)
The number of air renewals that occur in a bioreactor for a volume of 5000.0 m3 is 1.9 h−1.
4. Results and Discussion
The effective air velocity in the dilution of gas emitted into the atmosphere, until reaching a concentration below its Lower Flammability Limit, is determined by the relative density of the gas, the height above ground level at which the element causing the leak is located (Table 8), and any impediments to air circulation in the area.
Most biogas facilities and pipelines are located outdoors, which facilitates the dilution of leaked gas in the atmosphere, with the exception of manual purges of condensate pots located in low-lying areas.
The atmosphere’s capacity to dilute leaked gas determines the safe distance that must be maintained from elements present in the pipes, and is conditioned both by the speed of the surrounding air and by the buoyancy of the flammable gas, a parameter which, in turn, depends on the relative density of the gas and the laminar flow regime of the leak, which generates a diffusive emission into the atmosphere [33].
The dangerous distances that must be considered in a biomethane pipeline at 20.0 mbar pressure, depending on the height of the element generating the leak, can be seen in (Figure 2).
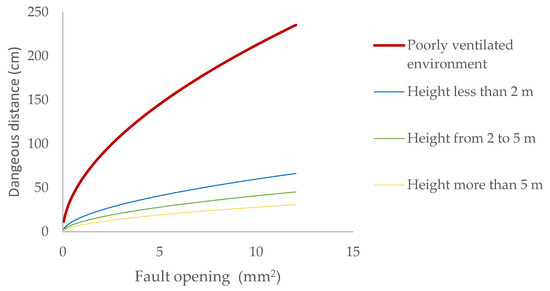
Figure 2.
Dangerous distance due to leaks of biomethane contained at 20 mbar depending on the opening.
As we rise above the ground, the atmosphere’s ability to dilute gas emissions increases. For a general-purpose valve, the maximum expected escape orifice due to a leak in the stem is 2.5 mm2. If it is located at the bottom of the installation, below two metres above ground level, only a safety distance of 28 cm must be observed. This distance would increase to one metre if it were located in an area with significant restrictions on air flow, such as a pit. The location of the installation outdoors allows for effective risk control, without the need to implement forced ventilation systems, which must have the specific IECEx ATEX marking.
The hazard distance is also calculated based on the flow regime of the gas emission into the atmosphere [33], in addition to the effective wind speed in the area where the emission occurs [34], (Figure 3):
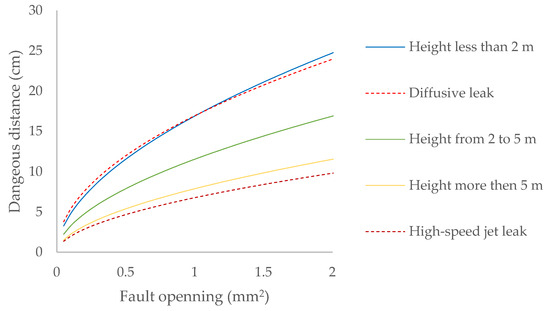
Figure 3.
Dangerous distance due to biomethane leaks contained at 20 mbar at different heights for leaks in joints and valves.
Any leak that occurs in the installation under study will be diffusive, since the pressure of the containment system is always lower than the critical pressure of the gases it contains (Table 7). Only in minor leaks, when the leak occurs less than two meters above the ground, does the dangerous distance correspond to that expected for its flow regime, while in the case of elements located in the domes of bioreactors, the dangerous distance would correspond to a high-speed jet leak (Figure 3).
A key parameter to consider in leak conditions is the internal pressure of the flammable gas containment system, as an increase in pressure leads to greater hazardous distances (Figure 4).
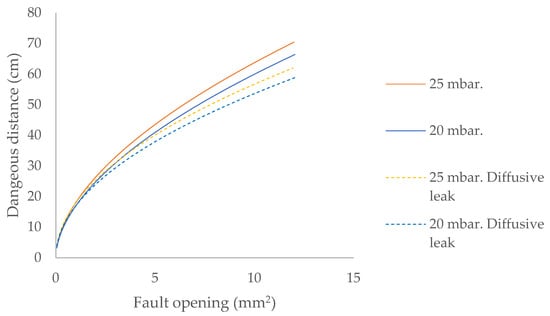
Figure 4.
Dangerous distance for biomethane leaks located outdoors up to two metres high and contained at 20/25 mbar.
Considering only the escape model in determining hazardous distances leads to establishing lower safety distances, which is contrary to the objective of maximum safety with regard to fire and explosion risk.
Another fundamental aspect to take into account is the dependence of the hazardous distance on the ambient temperature, given its high variability throughout the year in outdoor environments. To facilitate analysis, the variation in the hazardous distance is shown for a natural gas pipeline located between two and five meters above ground level (Figure 5).
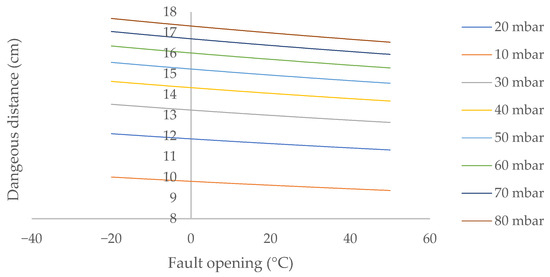
Figure 5.
Dangerous distance from ambient temperature in outdoor environments for a biomethane leak in laminar flow located between 2 and 5 m above ground level.
The dangerous distance decreases slightly as the temperature increases, by 2.8% when the ambient temperature rises from 0 to 30.0 °C. This decrease increases almost imperceptibly as the internal pressure of the system increases, from 2.83% at 10 mbar to 2.82% at 70 mbar. However, this decrease in the danger distance attenuates as the ambient temperature increases.
The hazardous distance generated by the different gases present in the installation: biomethane and biogas, compared to natural gas, whose composition is similar to the biomethane generated, at a calibrated pressure of 25.0 mbar, are as follows (Table 9).
Table 9.
Hazardous distance for gas leaks contained at 25.0 mbar, in outdoor installations.
The behavior of biomethane is similar to that of natural gas, its main component, methane.
Predictable failures in the components of the biogas generation plant generate conical danger zones because the flammable gases present in biogas have very low relative densities. However, in the case of connections and valves, as it is not possible to define the exact point where the equipment may fail, the entire ring must be considered, which determines a spherical shape.
The gases contained in the digester must be captured by means of membrane separation or evaporation processes, as it keeps biogas inside and its gases emanate according to their relative density. While hydrogen and hydrogen sulfide do not pose a problem in themselves, as their concentration is below their respective lower flammability limits, methane generates a flammable volume for which the time required for dilution must be known.
The residence time of methane, when the digester is in an open environment with no impediments and free air circulation, is obtained using the following expression [33,34].
Time that coincides when considering biomethane as a whole:
Five types of possible outdoor storage facilities are defined (Figure 6).
- A.
- Surface storage facilities or facilities equipped with vents.
- B.
- Storage facilities with open or partially closed structures or locations with shallow depressions in the ground.
- C.
- Storage facilities with open or partially enclosed structures when the ratio between their height and the dikes or walls is slightly elevated, or depressions of medium depth in the ground.
- D.
- Storage facilities with open or partially closed structures when the ratio between the height of the facility and the dikes or walls is moderately high, or deep depressions in the ground, but not yet considered pits.
- E.
- Storage in a deep pit, where there are real restrictions on air flow and therefore generally considered a closed environment.

Figure 6.
Time required for the average concentration to fall below the LIE.
Figure 6.
Time required for the average concentration to fall below the LIE.

Despite being stored outdoors, impediments to ventilation efficiency can increase the residence time of the flammable atmosphere by 80.0%.
In the case of batch processing, opening the bioreactor involves a series of steps to ensure the process is safe. The digestate must remain in the bioreactor until its biogas content is below 6.8%, which is its lower flammability limit. This ensures that handling does not pose a significant risk of fire or explosion.
Bioreactors have manholes in their domes and lower openings that allow access to their interior. The mixture of flammable gases contained in biogas, mainly methane and hydrogen, is much lighter than air, so it is essential to open the manholes located in the domes for their elimination. However, for the process to be more effective, air must be allowed to pass through the lower openings.
When the openings are made in the dome of the bioreactor, the hazardous area generated has the following dimensions (Figure 7).
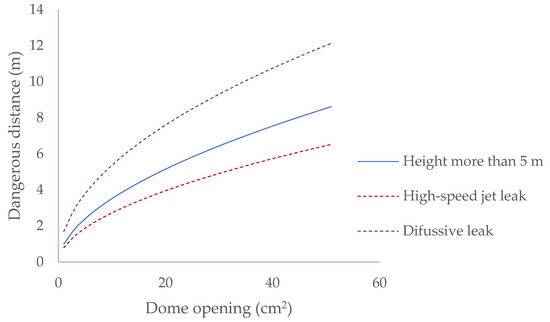
Figure 7.
Dangerous distance generated after an opening in the dome.
When the reactor is opened, biogas is released until the internal pressure of the bioreactor equals atmospheric pressure. A 20 cm2 opening in the reactor dome requires a safety distance of 7 m to be established, even though the gas flow regime at the outlet is initially turbulent and favours its dilution in the atmosphere, allowing it to be reduced to 4 m in its initial phase.
Subsequently, the manhole located in the dome is opened, along with a door near the floor, so that, taking advantage of its internal temperature, flotation ventilation is established to remove residual biogas.
During anaerobic digestion, the mesophilic regime is around 37.0 °C, operating between 35 and 40 °C, while the thermophilic regime reaches 55.0 °C. For the air in the bioreactor to be renewed, its internal temperature must be higher than the external temperature, and the greater the difference, the greater the ventilation capacity. Therefore, the calculations consider the lowest operating temperature, which is around 35.0 °C [62].
Considering the opening of a manhole with a diameter of 60.0 cm in the dome, located at a height of 5.0 m above ground level, together with a lower side opening of 1.0 m2, the waiting time for the concentration of flammable gases inside to fall below the lower flammability limit, and therefore be safe, is as follows (Figure 8):
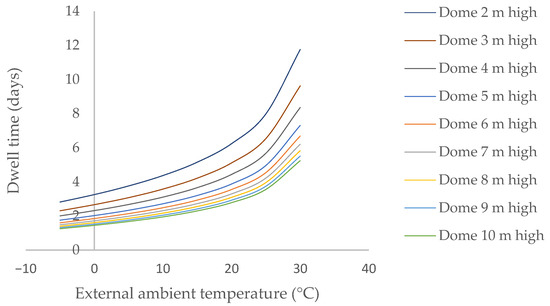
Figure 8.
Waiting time for buoyancy ventilation to secure the interior of the bioreactor.
Induced natural ventilation is caused by the difference in air density between the interior and exterior and is independent of the exterior air velocity associated with height. As the temperature difference between the inside of the bioreactor and the environment decreases, the ventilation capacity inside the enclosure also decreases, which means that the time required for the digestate to become safe increases, intensifying as temperatures equalize.
With large temperature differences, even with low domes, good ventilation is induced. The following shows the necessary increase in the number of days that the digestate must remain inside the bioreactor when the ambient temperature has risen from −5.0 °C to 30 °C (Figure 9).
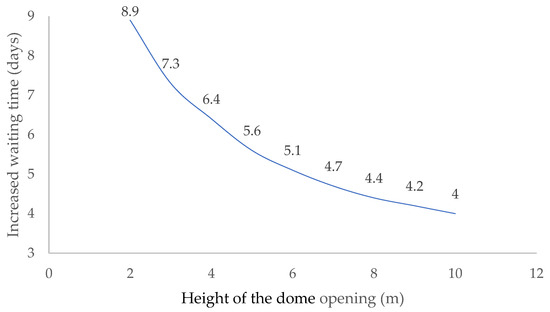
Figure 9.
Increase in waiting time for buoyancy ventilation to secure the interior of the bioreactor.
The influence of ambient temperature on the buoyancy ventilation process decreases as the distance between the lower and upper openings increases. Ventilation in a dome located at a height of 10.0 m is half as effective as if it were located only two meters above the ground.
The increase in the dangerous distance with the expansion of the hole that generates the leak follows the same pattern for all gases:
where
dz: Hazardous distance (m)
M: Molecular weight in (g/mol)
Considering the foreseeable size of the holes that may occur in the different components of the installation [32,33], the hazardous dimensions that must be taken into account are as follows:
- (a)
- In open areas, a compressed fiber flange for which larger openings due to failure are expected, even if it is located above five meters in height. In this case, a dangerous volume of 50.0 cm radius should be considered.
- (b)
- Valves located below five meters generate a dangerous area around them with a radius of 40.0 cm. However, if they are located above two meters in height, the radius to be considered will be 60.0 cm in diameter.
- (c)
- In manual purges of condensate pots, the hazardous area is cone-shaped with a length of 2.0 m and a radius of 1.0 m.
5. Conclusions
In order to mitigate the risk of fire and explosion associated with biomethane production, safety distances and recommended waiting times are established to ensure safe operation, providing an empirical equation that relates the increase in the danger distance to the expansion of the hole that causes the gas leak and graphs that allow the results to be applied directly.
With natural ventilation as an ally, foreseeable failures in the piping elements and gas emissions generated during normal plant operations have been taken into account, including the critical moment of opening the bioreactor, for which a four-day waiting period has been established to ensure its interior safety.
The main limitation of this study is that the hazardous distances have been determined theoretically from two different versions of calculation standards for areas classified by fire and explosion risk, based on different aspects and leading to disparate results. In addition, the variability of outdoor environmental conditions is decisive in the dilution capacity of the atmosphere.
The results of the study should be improved by taking samples at different points along the gas pipeline and in the surrounding atmosphere, as the results have been obtained based on restrictive air speeds. To this end, atmospheric simulation and prediction models can be easily implemented.
Author Contributions
J.M.B.-Á.: conceptualisation, writing—original draft, data curation, methodology, and software. Á.R.-B.: writing—original draft preparation, investigation, writing—review and editing, and project administration. B.M.V.-E.: visualization, supervision, methodology, formal analysis and resources. Á.R.-S.: visualisation, supervision, data curation, validation and resources. All authors have read and agreed to the published version of the manuscript.
Funding
This research received no external funding.
Institutional Review Board Statement
Not applicable.
Informed Consent Statement
Not applicable.
Data Availability Statement
The original contributions presented in the study are included in the article, further inquiries can be directed to the corresponding author.
Acknowledgments
The authors gratefully acknowledge the support of the Madrid Zoo Aquarium (Spain) for supplying the data used in this study under the agreed terms, without which this research could not have been possible.
Conflicts of Interest
The authors declare no conflicts of interest.
References
- Li, W.; Khalid, H.; Zhu, Z.; Zhang, R.; Liu, G.; Chen, C.; Thorin, E. Methane production through anaerobic digestion: Participation and digestion characteristics of cellulose, hemicellulose and lignin. Appl. Energy 2018, 226, 1219–1228. [Google Scholar] [CrossRef]
- Edwiges, T.; Frare, L.; Mayer, B.; Lins, L.; Triolo, J.M.; Flotats, X.; de Mendonça, M.S.S. Influence of chemical composition on biochemical methane potential of fruit and vegetable waste. Waste Manag. 2018, 71, 618–625. [Google Scholar] [CrossRef] [PubMed]
- Steffen, F.; Requejo, A.; Ewald, C.; Janzon, R.; Saake, B. Anaerobic digestion of fines from recovered paper processing–Influence of fiber source, lignin and ash content on biogas potential. Bioresour. Technol. 2016, 200, 506–513. [Google Scholar] [CrossRef] [PubMed]
- Edwards, J.; Othman, M.; Burn, S. A review of policy drivers and barriers for the use of anaerobic digestion in Europe, the United States and Australia. Renew. Sustain. Energy Rev. 2015, 52, 815–828. [Google Scholar] [CrossRef]
- Massaro, V.; Digiesi, S.; Mossa, G.; Ranieri, L. The sustainability of anaerobic digestion plants: A win–win strategy for public and private bodies. J. Clean. Prod. 2015, 104, 445–459. [Google Scholar] [CrossRef]
- Hadidi, L.A.; Omer, M.M. A financial feasibility model of gasification and anaerobic digestion waste-to-energy (WTE) plants in Saudi Arabia. Waste Manag. 2017, 59, 90–101. [Google Scholar] [CrossRef]
- Di Maria, F.; Sisani, F.; Contini, S. Are EU waste-to-energy technologies effective for exploiting the energy in bio-waste? Appl. Energy 2018, 230, 1557–1572. [Google Scholar] [CrossRef]
- Li, Y.; Park, S.Y.; Zhu, J. Solid-state anaerobic digestion for methane production from organic waste. Renew. Sustain. Energy Rev. 2011, 15, 821–826. [Google Scholar] [CrossRef]
- Coelho, J.J.; Prieto, M.L.; Dowling, S.; Hennessy, A.; Casey, I.; Woodcock, T.; Kennedy, N. Physical-chemical traits, phytotoxicity and pathogen detection in liquid anaerobic digestates. Waste Manag. 2018, 78, 8–15. [Google Scholar] [CrossRef]
- Iglesias, R.; Muñoz, R.; Polanco, M.; Díaz, I.; Susmozas, A.; Moreno, A.D.; Guirado, M.; Carreras, N.; Ballesteros, M. Biogas from anaerobic digestion as an energy vector: Current upgrading development. Energies 2021, 14, 2742. [Google Scholar] [CrossRef]
- Zang, Y.; Li, Y.; Wang, C.; Zhang, W.; Xiong, W. Towards more accurate life cycle assessment of biological wastewater treatment plants: A review. J. Clean. Prod. 2015, 107, 676–692. [Google Scholar] [CrossRef]
- Corominas, L.; Byrne, D.M.; Guest, J.S.; Hospido, A.; Roux, P.; Shaw, A.; Short, M.D. The application of life cycle assessment (LCA) to wastewater treatment: A best practice guide and critical review. Water Res. 2020, 184, 116058. [Google Scholar] [CrossRef]
- Faragò, M.; Damgaard, A.; Madsen, J.A.; Andersen, J.K.; Thornberg, D.; Andersen, M.H.; Rygaard, M. From wastewater treatment to water resource recovery: Environmental and economic impacts of full-scale implementation. Water Res. 2021, 204, 117554. [Google Scholar] [CrossRef] [PubMed]
- Directive 1999/31/EC of the European Parliament and of the Council of 26 April 1999 on the Landfill of Waste. The Council of the European Union. Directorate-General for Environment, Official Journal l 182, 16 July 1999; pp. 1–19. Available online: http://data.europa.eu/eli/dir/1999/31/oj (accessed on 24 September 2025).
- Directive 2024/1157 of the European Parliament and of the Council of 11 April 2024 on Shipments of Waste, Amending Regulations (EU) No 1257/2013 and (EU) 2020/1056 and Repealing Regulation (EC) No 1013/2006. Parliament, Council of the European Union. OJ L, 2024/1157. Available online: http://data.europa.eu/eli/reg/2024/1157/oj (accessed on 24 September 2025).
- Acuerdo de París 2050. Conferencia de las Naciones Unidas sobre el Cambio Climático (COP21). Paris, France. Available online: https://www.un.org/es/climatechange/paris-agreement (accessed on 24 September 2025).
- Directive 2009/28/EC of the European Parliament and of the Council of 23 April 2009 on the Promotion of the Use of Energy from Renewable Sources and Amending and Subsequently Repealing Directives 2001/77/EC and 2003/30/EC. Parliament, Council of the European Union OJ L 140 5.6.2009; p. 16. Available online: http://data.europa.eu/eli/dir/2009/28/2015-10-05 (accessed on 24 September 2025).
- Konieczna, A.; Borek, K.; Hołaj-Krzak, J.T.; Dybek, B.; Anders, D.; Szymenderski, J.; Klimek, K.; Kapłan, M.; Jarosz, Z.; Syrotyuk, S.; et al. The Potential of Utilizing Cattle (Cow) Manure for Biomethane Production: An Experiment for Photo fermentation. Energies 2024, 17, 6119. [Google Scholar] [CrossRef]
- Recebli, Z.; Selimli, S.; Ozkaymak, M.; Gonc, O. Biogas Production From Animal Manure. J. Eng. Sci. Technol. 2015, 10, 722–729. [Google Scholar]
- Nwokolo, N.; Mukumba, P.; Obileke, K.; Enebe, M. Waste to Energy: A Focus on the Impact of Substrate Type in Biogas Production. Processes 2020, 8, 1224. [Google Scholar] [CrossRef]
- Møller, H.B.; Sommer, S.G.; Ahring, B.K. Methane productivity of manure, straw and solid fractions of manure. Biomass Bioenergy 2004, 26, 485–495. [Google Scholar] [CrossRef]
- Kusmiyati, K.; Wijaya, D.K.; Hartono, B.R.; Shidik, G.F.; Fudholi, A. Harnessing the power of cow dung: Exploring the environmental, energy, and economic potential of biogas production in Indonesia. Results Eng. 2023, 20, 101431. [Google Scholar] [CrossRef]
- Nleya, Y.; Young, B.; Nooraee, E.; Baroutian, S. Anaerobic digestion of dairy cow and goat manure: Comparative assessment of biodegradability and greenhouse gas mitigation. Fuel 2025, 381, 133458. [Google Scholar] [CrossRef]
- Liu, X.; Bayard, R.; Benbelkacem, H.; Buffière, P.; Gourdon, R. Evaluation of the correlations between biodegradability of lignocellulosic feedstocks in anaerobic digestion process and their biochemical characteristics. Biomass Bioenergy 2015, 81, 534–543. [Google Scholar] [CrossRef]
- Triolo, J.M.; Pedersen, L.; Qu, H.; Sommer, S.G. Biochemical methane potential and anaerobic biodegradability of non-herbaceous and herbaceous phytomass in biogas production. Bioresour. Technol. 2012, 125, 226–232. [Google Scholar] [CrossRef]
- Gao, Z.; Cui, T.; Qian, H.; Sapsford, D.J.; Cleall, P.J.; Harbottle, M.J. Can wood waste be a feedstock for anaerobic digestion? A machine learning assisted meta-analysis. Chem. Eng. J. 2024, 487, 150496. [Google Scholar] [CrossRef]
- Baghbanzadeh, M.; Savage, J.; Balde, H.; Sartaj, M.; VanderZaag, A.C.; Abdehagh, N.; Strehler, B. Enhancing hydrolysis and bio-methane generation of extruded lignocellulosic wood waste using microbial pre-treatment. Renew. Energy 2021, 170, 438–448. [Google Scholar] [CrossRef]
- Han, Y.; Agyeman, F.; Green, H.; Tao, W. Stable, high-rate anaerobic digestion through vacuum stripping of digestate. Bioresour. Technol. 2022, 343, 126133. [Google Scholar] [CrossRef] [PubMed]
- Li, Y.; Liu, H.; Li, G.; Luo, W.; Sun, Y. Manure digestate storage under different conditions: Chemical characteristics and contaminant residuals. Sci. Total Environ. 2018, 639, 19–25. [Google Scholar] [CrossRef] [PubMed]
- EN 16798-3:2018; Energy Performance of Buildings—Ventilation for Buildings—Part 3: For Non-Residential Buildings—Performance Requirements for Ventilation and Room-Conditioning Systems (Modules M5-1, M5-4). European Committee for Standardization (CEN): Brussels, Belgium, 2018.
- Sher, F.; Smječanin, N.; Hrnjić, H.; Karadža, A.; Omanović, R.; Šehović, E.; Sulejmanović, J. Emerging technologies for biogas production: A critical review on recent progress, challenges and future perspectives. Process. Saf. Environ. Prot. 2024, 188, 834–859. [Google Scholar] [CrossRef]
- EN 12255-10:2023; Wastewater Treatment Plants—Part 10: Safety Principles. European Committee for Standardization (CEN): Brussels, Belgium, 2023.
- N 60079-10-1:2022; Explosive Atmospheres—Part 10-1: Classification of Areas—Explosive Gas Atmospheres. European Committee for Standardization (CEN): Brussels, Belgium, 2022.
- EN 202007:2006; IN Application Guide of EN 60079-10. Electrical Apparatus for Explosive Gas Atmospheres. Classification of Hazardous Areas. European Committee for Standardization (CEN): Brussels, Belgium, 2006.
- EN ISO 20675:2022; Biogas Production, Conditioning, Upgrading and Utilization—Terms, Definitions and Classification Scheme. European Committee for Standardization (CEN): Brussels, Belgium, 2022.
- Wolin, E.A.; Wolin, M.; Wolfe, R.S. Formation of methane by bacterial extracts. J. Biol. Chem. 1963, 238, 2882–2886. [Google Scholar] [CrossRef]
- Pfluger, A.; Coontz, J.; Zhiteneva, V.; Gulliver, T.; Cherry, L.; Cavanaugh, L.; Figueroa, L. Anaerobic digestion and biogas beneficial use at municipal wastewater treatment facilities in Colorado: A case study examining barriers to widespread implementation. J. Clean. Prod. 2019, 206, 97–107. [Google Scholar] [CrossRef]
- EN-ISO 13443; Natural Gas. Standard Reference Conditions. European Committee for Standardization (CEN): Brussels, Belgium, 2017.
- EN-ISO 6976:2017; Natural Gas. Calculation of Calorific Values, Density, Relative Density and Wobbe Indices from Composition. European Committee for Standardization (CEN): Brussels, Belgium, 2017.
- Ellacuriaga, M.; García, J.; Gómez, X. Biogas production from organic wastes: Integrating concepts of circular economy. Fuels 2021, 2, 144–167. [Google Scholar] [CrossRef]
- Kodba, A.; Pukšec, T.; Duić, N. Analysis of specific greenhouse gas emissions savings from biogas production based on agricultural residues and industrial by-products. Energies 2023, 16, 3721. [Google Scholar] [CrossRef]
- Metcalf, E. Ingeniería de Aguas Residuales: Tratamiento, Vertido y Reutilización, 3rd ed.; McGraw Hill: Madrid, Spain, 2000. [Google Scholar]
- Niemiec, M.; Sikora, J.; Szeląg-Sikora, A.; Gródek-Szostak, Z.; Komorowska, M. ssessment of the possibilities for the use of selected waste in terms of biogas yield and further use of its digestate in agriculture. Materials 2022, 15, 988. [Google Scholar] [CrossRef] [PubMed]
- Ariunbaatar, J.; Panico, A.; Esposito, G.; Pirozzi, F.; Lens, P.N. Pretreatment methods to enhance anaerobic digestion of organic solid waste. Appl. Energy 2014, 123, 143–156. [Google Scholar] [CrossRef]
- Orlando, M.Q.; Borja, V.M. Pretreatment of animal manure biomass to improve biogas production: A review. Energies 2020, 13, 3573. [Google Scholar] [CrossRef]
- Karim, K.; Klasson, K.T.; Hoffmann, R.; Drescher, S.R.; DePaoli, D.W.; Al-Dahhan, M.H. Anaerobic digestion of animal waste: Effect of mixing. Bioresour. Technol. 2005, 96, 1607–1612. [Google Scholar] [CrossRef]
- Zhang, J.; Chen, J.; Ma, R.; Kumar, V.; Tong, Y.W.; He, Y.; Mao, F. Mesophilic and thermophilic anaerobic digestion of animal manure: Integrated insights from biogas productivity, microbial viability and enzymatic activity. Fuel 2022, 320, 123990. [Google Scholar] [CrossRef]
- Bishnoi, P. Effects of Thermal Hydrolysis Pre-Treatment on Anaerobic Digestion of Sludge. Master’s Thesis, Faculty of the Virginia Polytechnic Institute, Blacksburg, VA, USA, 2012. Available online: https://vtechworks.lib.vt.edu/items/2de5888e-ac6e-4bda-84e4-ac06a42b26c5 (accessed on 24 September 2025).
- Moreno-Gutiérrez, R. Bioprocesses for Wastewater Treatment: Integration of Bioelectrochemical Systems and Other Technologies. Ph.D. Thesis, Instituto de Medio Ambiente, Recursos Naturales Y Biodiversidad. Grupo de Ingeniería Química, Ambiental y Bioprocesos, Universidad de León, León, España, 2016. [Google Scholar] [CrossRef]
- Makamure, F.; Mukumba, P.; Makaka, G. An analysis of bio-digester substrate heating methods: A review. Renew. Sustain. Energy Rev. 2021, 137, 110432. [Google Scholar] [CrossRef]
- Zhao, Q.; Leonhardt, E.; MacConnell, C.; Frear, C.; Chen, S. Purification technologies for biogas generated by anaerobic digestion. Compressed Biomethane. CSANR 2010, 1, 24. [Google Scholar]
- Awe, O.W.; Zhao, Y.; Nzihou, A.; Minh, D.P.; Lyczko, N. A review of biogas utilisation, purification and upgrading technologies. Waste Biomass Valorization 2017, 8, 267–283. [Google Scholar] [CrossRef]
- Kabeyi, M.J.B.; Olanrewaju, O.A. Technologies for biogas to electricity conversion. Energy Rep. 2022, 8, 774–786. [Google Scholar] [CrossRef]
- Atelge, M.R.; Senol, H.; Djaafri, M.; Hansu, T.A.; Krisa, D.; Atabani, A.; Eskicioglu, C.; Muratçobanoglu, H.; Kallom, S.S.; Azbar, N.; et al. A critical overview of the state-of-the-art methods for biogas purification and utilization processes. Sustainability 2021, 13, 11515. [Google Scholar] [CrossRef]
- Werkneh, A.A. Biogas impurities: Environmental and health implications, removal technologies and future perspectives. Heliyon 2022, 8, e10929. [Google Scholar] [CrossRef] [PubMed]
- Stolecka, K.; Rusin, A. Potential hazards posed by biogas plants. Renew. Sustain. Energy Rev. 2021, 135, 110225. [Google Scholar] [CrossRef]
- Marrazzo, R.; Mazzini, C. Safety Considerations and Major Accidents Prevention in the Biogas Production. Chem. Eng. Trans. 2024, 109, 451–456. [Google Scholar] [CrossRef]
- Jin, T.; Liu, Y.; Wei, J.; Zhang, D.; Wang, X.; Lei, G.; Wang, T.; Lan, Y.; Chen, H. Numerical investigation on the dispersion of hydrogen vapor cloud with atmospheric inversion layer. Int. J. Hydrogen Energy 2019, 44, 23513–23521. [Google Scholar] [CrossRef]
- Hanna, S.R.; Chang, J.C. Use of the Kit Fox field data to analyze dense gas dispersion modelling issues. Atmos. Environ. 2001, 35, 2231–2242. [Google Scholar] [CrossRef]
- EN 437:2003+A1:2009; Test Gases—Test Pressures—Appliance Categories. UNE-European Committee for Standardization (CEN): Brussels, Belgium, 2009.
- Romero, Á.; Ballesteros, J.M.; Villena, B.M.; Rodríguez, Á.; González, C. Occupancy and Air Quality Model for Outdoor Events: A Strategy for Preventing Disease Transmission at Mass Events. Buildings 2025, 15, 677. [Google Scholar] [CrossRef]
- Gavala, H.N.; Yenal, U.; Skiadas, I.V.; Westermann, P.; Ahring, B.K. Mesophilic and thermophilic anaerobic digestion of primary and secondary sludge. Effect of pre-treatment at elevated temperature. Water Res. 2003, 37, 4561–4572. [Google Scholar] [CrossRef]


Disclaimer/Publisher’s Note: The statements, opinions and data contained in all publications are solely those of the individual author(s) and contributor(s) and not of MDPI and/or the editor(s). MDPI and/or the editor(s) disclaim responsibility for any injury to people or property resulting from any ideas, methods, instructions or products referred to in the content. |
© 2025 by the authors. Licensee MDPI, Basel, Switzerland. This article is an open access article distributed under the terms and conditions of the Creative Commons Attribution (CC BY) license (https://creativecommons.org/licenses/by/4.0/).