Article

Subsidence Monitoring and Driving-Factor Analysis of China’s Coastal Belt Based on SBAS-InSAR

1
Yantai Center of Coastal Zone Geological Survey, China Geological Survey, Yantai 264000, China
2
Ministry of Natural Resources Observation and Research Station of Land-Sea Interaction Field in the Yellow River Estuary, Yantai 264000, China
3
School of Earth Sciences, China University of Geosciences, Wuhan 430000, China
4
Yantai Maritime Safety Administration, Yantai 264000, China
*
Author to whom correspondence should be addressed.
Sustainability 2025, 17(21), 9592; https://doi.org/10.3390/su17219592
Submission received: 30 September 2025 / Revised: 22 October 2025 / Accepted: 24 October 2025 / Published: 28 October 2025

Abstract

China’s sinuous coastline is increasingly threatened by land subsidence driven by complex geological conditions and intensive human activity. Using year-round Sentinel-1A acquisitions for 2023 and SBAS-InSAR processing, we generated the first millimetre-resolution subsidence velocity field covering the 50 km coastal buffer of mainland China. We elucidated subsidence patterns and their drivers and quantified the associated socio-economic risks by integrating 1 km GDP and population data. Our analysis shows that ~55.77% of the coastal zone is subsiding, exposing 97.42 million residents and CNY 16.41 billion of GDP. Four hotspots—Laizhou Bay, northern Jiangsu, the Yangtze River Delta (YRD) and the Pearl River Delta (PRD)—exhibit the most pronounced deformation. Over-extraction of groundwater is identified as the primary driver. The 15 m resolution subsidence product provides an up-to-date, high-precision dataset that effectively supports sustainable development research in coastal hazard prevention, territorial spatial planning, and sea-level rise studies.

1. Introduction

The coastal zone is a dynamic and intricate land–sea transition belt at the Earth’s surface. Possessing distinctive terrestrial and marine attributes, it serves as a critical axis for socio-economic development and as an ecologically fragile zone. In 2020, nearly 11% of the world’s population—about 898 million people—lived in low-elevation coastal areas [1]. China’s coastal belt occupies only approximately 14% of the country’s land area, yet it hosts more than 42% of the national population and generates over 60% of its GDP [2]. However, intense land–sea interactions, frequent natural hazards, and intensive human exploitation have rendered land subsidence an increasingly critical issue along the mainland coast. Against the backdrop of global sea-level rise, persistent subsidence amplifies the risks of shoreline retreat, flooding, storm surges and relative sea-level rise, posing substantial economic losses and threats to human life [3]. For instance, during the summer of 2023, typhoons impacting Fujian Province brought extreme rainfall and storm surges to several cities, triggering severe waterlogging. In some areas, maximum inundation depths exceeded two meters, resulting in direct economic losses totaling tens of billions of CNY, along with casualties and disruptions to socioeconomic activities. The destructive power of such compound disasters is significantly amplified by land subsidence, which is widely observed in coastal regions. Therefore, accurately mapping present-day subsidence patterns and quantifying the relative contributions of natural versus anthropogenic drivers can supply key indicators for defining and measuring coastal sustainability, support coordinated decision-making on resource exploitation, ecological protection and disaster mitigation, and help China’s coastal zones address challenges related to sustainable development.
Land subsidence refers to the lowering of ground surface elevation caused by natural processes or anthropogenic activities. Traditional monitoring techniques—such as borehole extensometers, Global Navigation Satellite Systems (GNSS) and levelling—offer high accuracy but are constrained by limited spatial coverage, high cost and poor timeliness, making it difficult to obtain continuous deformation information over large areas. By contrast, Differential Interferometric Synthetic Aperture Radar (D-InSAR), and, in particular, multi-temporal InSAR (MT-InSAR) techniques developed in recent years, have demonstrated clear advantages across many disciplines. Persistent Scatterer InSAR (PS-InSAR) [4] and the Small Baseline Subset approach (SBAS-InSAR) [5] are the two most widely used MT-InSAR methods, and have been successfully applied to urban subsidence and building deformation monitoring [6,7,8], landslide detection [9] and mining-induced deformation [10].
As a key engine of national economic growth and a densely populated region, the coastal belt of mainland China has long attracted scholarly attention to its subsidence problems. Previous studies have shown that extensive subsidence is occurring in most cities of the YRD, Yellow River Delta (YtRD) and PRD, the Songliao Plain, the Bohai Rim and the coastal plains of southeast China [11]. At present, coastal subsidence research in China tends to focus on economically dynamic cities such as Tianjin, Shanghai, Zhuhai and Guangzhou, or to examine regional subsidence rates at the urban-cluster scale, e.g., the Bohai Rim [12], YtRD [13,14], YRD [15] and PRD [16] urban agglomerations. These investigations have elucidated deformation characteristics of key areas and proposed targeted countermeasures, but their limited spatial extent precludes a synoptic view of subsidence across the entire coastal zone. Consequently, several scholars have attempted broader-scale analyses at national or global levels. Zurui Ao et al. [17] systematically assessed subsidence in 82 major Chinese cities between 2015 and 2022, and—using subsidence rates from 26 priority coastal cities—projected coastal-inundation risks for 2120. Jiayi Fang et al. [18] compiled maximum cumulative anthropogenic subsidence values for 36 major Chinese coastal cities during the late 20th and early 21st centuries, revealing the effectiveness of China’s subsidence-control policies in reducing future coastal-flood risk. Their results indicate that anthropogenic subsidence has amplified relative sea-level rise along nearly 20% of China’s coastline, affecting ~70% of the coastal population. Mead Allison et al. [19] emphasised that coastal subsidence is a critical driver of global sea-level rise and flooding, with natural and anthropogenic shallow subsidence rates potentially one to two orders of magnitude higher than climate-driven sea-level rise projected for the remainder of the twenty-first century. Manoochehr Shirzaei et al. [20] reviewed current methods for measuring, modelling and forecasting coastal subsidence, clarifying the key physical processes governing vertical land motion in coastal regions.
Previous studies have greatly advanced our understanding of land subsidence patterns along China’s coast. However, their timeliness is limited: the results blend multi-year signals and stop before 2023, so they cannot capture the most recent deformation pulse. In addition, their spatial continuity is poor: national or large-scale analyses are interrupted by city-by-city sampling, leaving vast stretches of rural land, reclaimed areas, and conservation zones data-deficient and precluding assessment of high-risk subsidence outside urban cores.
To fill this gap, we present the first 15 m-resolution, seamless subsidence-rate map covering all mainland coastal provinces for the single year 2023. Using SBAS-InSAR, we derive 2023 shoreline deformation rates, analyse their spatial patterns, risk levels, and driving mechanisms, and identify the most critical subsidence hotspots. By quantifying population and economic exposure and disentangling natural versus anthropogenic factors, the study provides an immediate, actionable evidence base for national sea-level rise risk assessment, territorial spatial planning, and coastal disaster mitigation.

2. Study Area and Data

2.1. Study Area

Located on the eastern fringe of the Eurasian continent and the western edge of the North Pacific, China’s mainland coastal zone spans tropical, subtropical and temperate climate belts. Mean annual temperature decreases from south to north, falling from about 21 °C along the South China coast to 8.5 °C in the northeastern coastal region. Annual precipitation decreases from both south and north toward the central sector; the South China coast receives the highest rainfall (992–2630 mm), while the North China coastal region receives the least (288–716 mm) [21]. the coastal belt spans 32° of longitude and 44° of latitude [22], and its pronounced monsoon climate brings an average of 6–8 land-falling tropical cyclones each year. The resulting storm surges interact with land subsidence to significantly intensify coastal flood risk. North of the Yangtze the region is dominated by the alluvial North China Plain, the Shandong Hills and the Liaodong Peninsula, underlain by 30–200 m of Quaternary unconsolidated deposits prone to consolidation-driven settlement. Decades of groundwater over-extraction have already triggered severe subsidence in this region [23,24]. South of the Yangtze, the YRD and PRD contain >60 m of Holocene mud, silt and peat, whereas the Fujian-Zhejiang coast is characterised by rolling hills with narrow coastal plains underlain by soft marine clays. Extensive soft-soil deposits make this a classic soft-ground subsidence zone [11].
China’s combined mainland and island coastline is roughly 32,000 km long, of which the 18,000 km mainland shore extends from the Yalu River estuary in Liaoning to the Beilun estuary in Guangxi [25]. Although the eleven coastal provinces, municipalities and autonomous regions occupy only ~13% of the national land area, they concentrate more than 50% of large cities, 40% of medium- and small-sized cities, 42% of the national population and over 60% of GDP [26]. Using the mainland coastline of China as the baseline, we generated a 50-km inland buffer zone as the study area (excluding Hainan Island, Hong Kong, Macao and Taiwan). From north to south this transect spans ten provinces/municipalities: Liaoning, Hebei, Tianjin, Shandong, Jiangsu, Shanghai, Zhejiang, Fujian, Guangdong and Guangxi. Geographically, the domain extends from 107°55′29″ to 124°13′28″ E and 20°12′51″ to 41°20′45″ N (Figure 1), covering a total area of 252,000 km2.

2.2. Data

Through the Alaska Satellite Facility (ASF) Distributed Active Archive Center (https://search.asf.alaska.edu/ (accessed on 23 October 2025)), we acquired the complete set of Sentinel-1A SAR images covering the mainland coastal zone of China from January to December 2023 (Table 1). After screening, 666 scenes distributed across 25 frames were retained. The raw data volume amounted to 3.16 TB. All images were acquired in Interferometric Wide-swath (IW) mode with VV polarisation. Precise orbit ephemerides (AUX_POEORB) were employed for orbital error correction, while 30 m SRTM-1 DEM data were used to simulate and remove topographic phase contributions. Residual atmospheric phase delays were mitigated using the Generic Atmospheric Correction Online Service for InSAR (GACOS) [27,28,29].
To quantify the impacts of land subsidence on coastal populations and economic output across mainland China’s coastal zone, we spatially integrated the subsidence results with population-density and GDP datasets. These ancillary layers were obtained through the PIE-Engine geospatial cloud platform: 2019 urban population-density data and 2019 1-km gridded GDP data for China. Population-density data were derived from the WorldPop China dataset [30] (ID: WorldPop/Global_100m_UNadj), while GDP data were obtained from the CHINA_GDP dataset (ID: RESDC/CHINA_GDP) released by the National Earth System Science Data Center, which portrays the spatial distribution of gross domestic product across China.
Salt production is well developed along the eastern coast of China, and the prevailing method—pumping subsurface brine for solar evaporation—means that the spatial distribution of salt pans can serve as a reliable proxy for brine extraction activity. Because groundwater withdrawal is a primary driver of land subsidence, we incorporated the 1:1,000,000 public-domain national fundamental geographic dataset (2021) into our analysis. This dataset, which includes a dedicated “salt-pan” land-cover class, is freely available from the National Catalogue Service for Geographic Information Resources (https://www.webmap.cn/commres.do?method=result100W (accessed on 23 October 2025)).

3. Methods

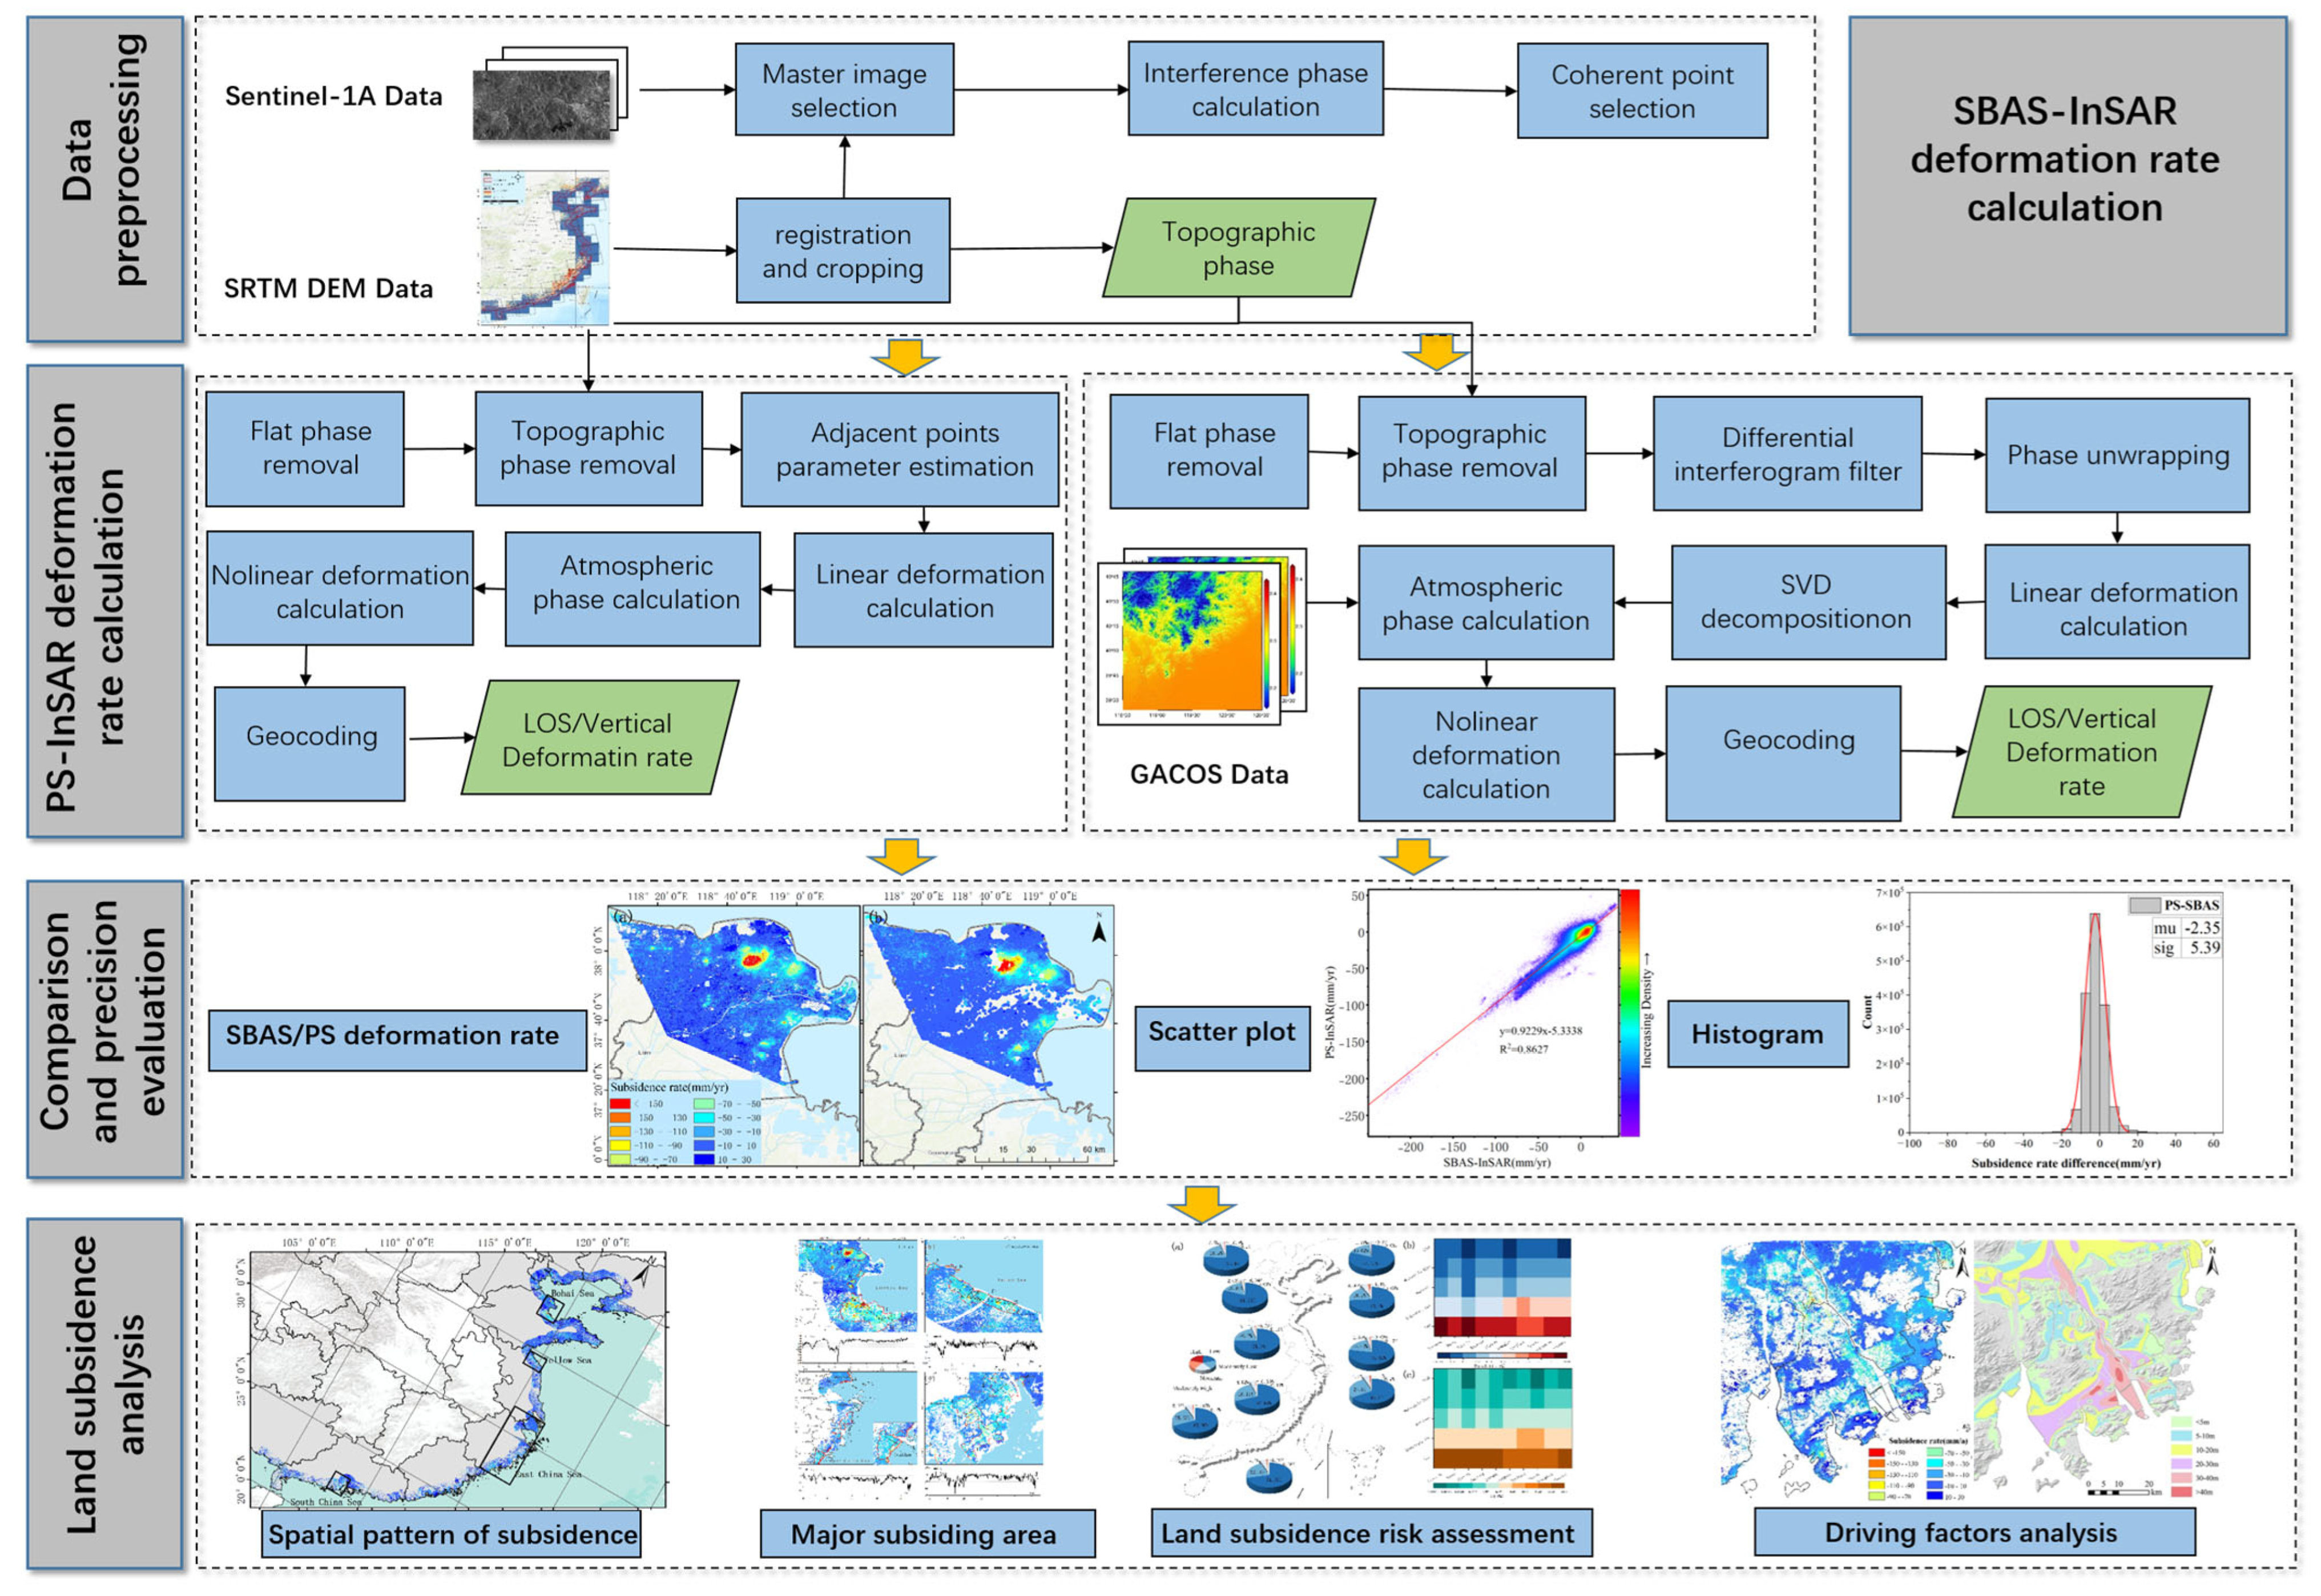
The flowchart of this study is presented in Figure 2. Initially, the SBAS-InSAR technique was employed to map land-subsidence rates across China’s mainland coastal zone in 2023. Subsequently, PS-InSAR was applied to retrieve subsidence rates for a typical subsidence area in the Yellow River Delta. Spatial patterns of subsidence, correlation of rates at homonymous monitoring points, and histograms of rate differences were compared to validate accuracy. Finally, the subsidence framework, key subsiding centers, associated risks, and driving factors of the study area were analyzed.

3.1. SBAS-InSAR

SBAS-InSAR employs a multi-master, small-baseline stacking strategy that markedly increases the utilization efficiency of available SAR acquisitions. By imposing strict temporal- and spatial-baseline thresholds, the technique constructs a set of small-baseline interferograms; it then solves the unwrapped differential phase series under a minimum-norm constraint on deformation velocity using least-squares inversion combined with singular value decomposition (SVD). The SBAS-InSAR processing flow is illustrated in Figure 2.
For SAR images acquired at times t 0 , t 1 ,…, t k (total K + 1 scenes), N interferometric pairs are generated after interferometric processing. Assuming that an interferogram i is generated from images acquired at times t m and t s , the phase ϕ i in the i-th differential interferogram can be expressed using Equation (1), and the deformation phase can be obtained after removing the other phases.
ϕ i = ϕ t m ϕ t s 4 π λ d t m d t s + ϕ t o p o i + ϕ a t m i + ϕ n i
where λ is the radar wavelength, ϕ t o p o i is residual topographic phase, ϕ a t m i is atmospheric delay phase, ϕ n i is noise phase and d t m and d t s represent the cumulative deformation along the radar LOS direction at times t m and t s relative to t 0 , respectively.
Taking the cumulative deformation phase of a single pixel as ϕ and the unwrapped differential interferometric phase as ϕ , the observation equation can be constructed based on cumulative deformation phase and differential interferometric phase:
ϕ N × 1 = A N × K ϕ K × 1
By performing SVD, the minimum-norm least-squares solution can be obtained, and integration in the time domain yields the time-series deformation. A detailed description of the SBAS-InSAR is given in these papers [5,31].

3.2. Mosaicking of Adjacent-Path SBAS-InSAR Results

Using this SBAS-InSAR, we retrieved the 2023 line-of-sight (LOS) subsidence rates over the entire mainland coastal zone of China. Adjacent frames were merged in two steps. For images from the same relative orbit, raw single-look complex (SLC) data were first concatenated prior to SBAS processing. For neighbouring orbits, we selected the YtRD area—characterised by dense artificial scatterers, a central geographic location and prior accuracy validation—as the reference track, aligned the deformation fields to this benchmark; the mean bias in the overlapping area was quantified and applied as a constant offset to homogenise the multi-orbit results. The calculated mean offset in the overlapping area of adjacent paths is presented in Table 2.

3.3. PS-InSAR

PS-InSAR exploits sparsely distributed Persistent Scatterers points to build a coherent network, from which reliable phase information is extracted to retrieve surface deformation with high accuracy. The first step in PS-InSAR processing is to select a master image; all remaining images are then co-registered and interfered with this master to generate interferograms. PS pixels are subsequently identified using the phase-standard-deviation method, which exploits the principle that, under high signal-to-noise ratio conditions, the amplitude-dispersion index approximates the phase standard deviation σ v [32], thereby enabling reliable PS points selection.
σ v σ A m A = D A
where σ v is the phase standard deviation; σ A is the amplitude standard deviation; m A is the amplitude mean difference; D A is the amplitude dispersion index.
An external DEM is used to remove the topographic phase, and low-pass and high-pass filters are applied in the temporal and spatial domains, respectively, to estimate the atmospheric delay phase. A Delaunay triangular network is then constructed from adjacent PS points, allowing the deformation phase of each PS point in the LOS direction to be obtained. A detailed description of the PS-InSAR is given in this paper [4].
The precision of the deformation estimates strongly depends on the density and quality of PS targets. Delta regions are densely packed with artificial structures, offering a wealth of stable scatterers that preserve high coherence and signal-to-noise ratios over long observation intervals; numerous studies have verified the reliability and suitability of PS-InSAR in such environments [33]. Therefore, we employed PS-InSAR to derive subsidence rates in the YtRD, a typical subsidence hotspot along China’s mainland coast, and used these results to cross-validate the SBAS-InSAR estimates. Both SBAS-InSAR and PS-InSAR processing were implemented in the SARscape 5.6 software package.

4. Results

4.1. Precision Evaluation

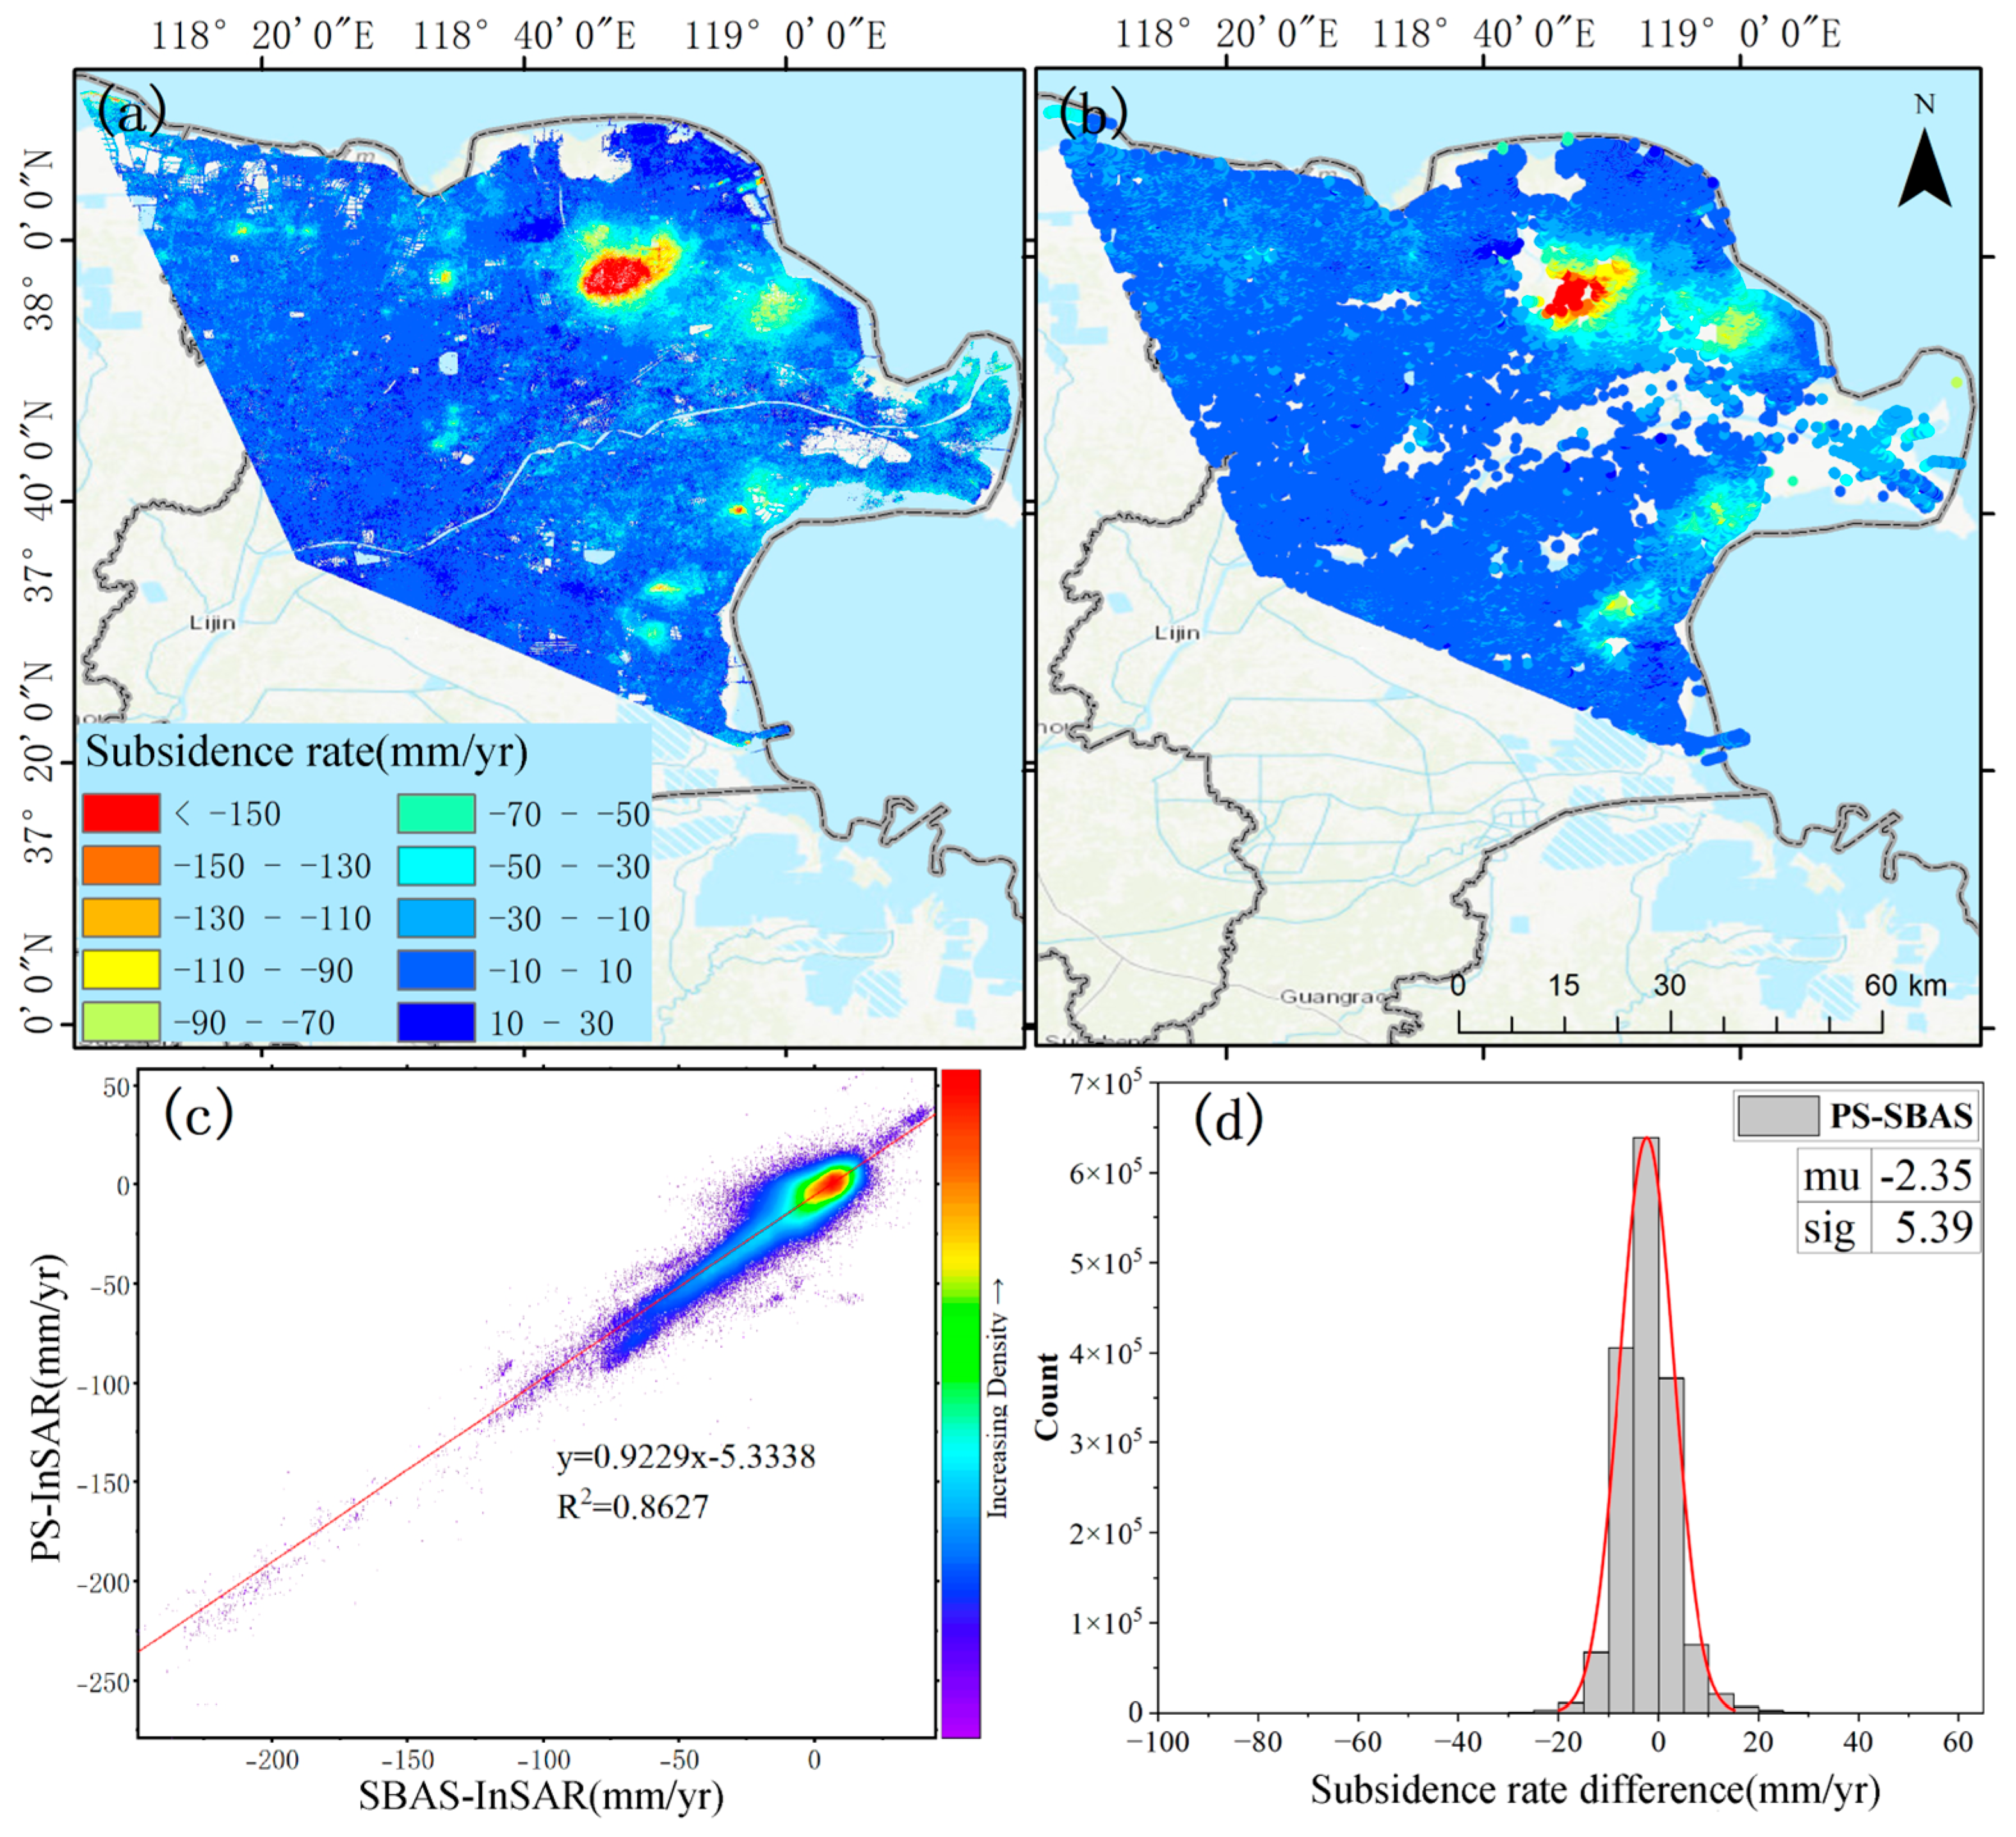
Due to the absence of levelling benchmarks for this campaign, accuracy was assessed by applying both PS-InSAR and SBAS-InSAR independently to the YtRD, a hotspot of severe subsidence, and comparing the annual rates at collocated pixels. PS-SBAS scatter plots and difference maps were generated (Figure 3).
The two techniques exhibit strong spatial agreement. Using the high-coherence PS points as reference, we extracted 1 605 149 corresponding SBAS-InSAR annual subsidence rates. Linear regression yields y = 0.9229x − 5.3338 with R2 = 0.8627. With the PS-SBAS discrepancies following an approximately normal distribution, 1,490,707 common pixels (92.87%) lie within ±10 mm/yr, yielding a typical 1σ uncertainty of ±5 mm/yr for the 2023 annual subsidence rates. This high level of consistency confirms the reliability of the annual subsidence rates derived from the time-series InSAR analysis.

4.2. Subsidence Patterns and Key Subsidence Areas

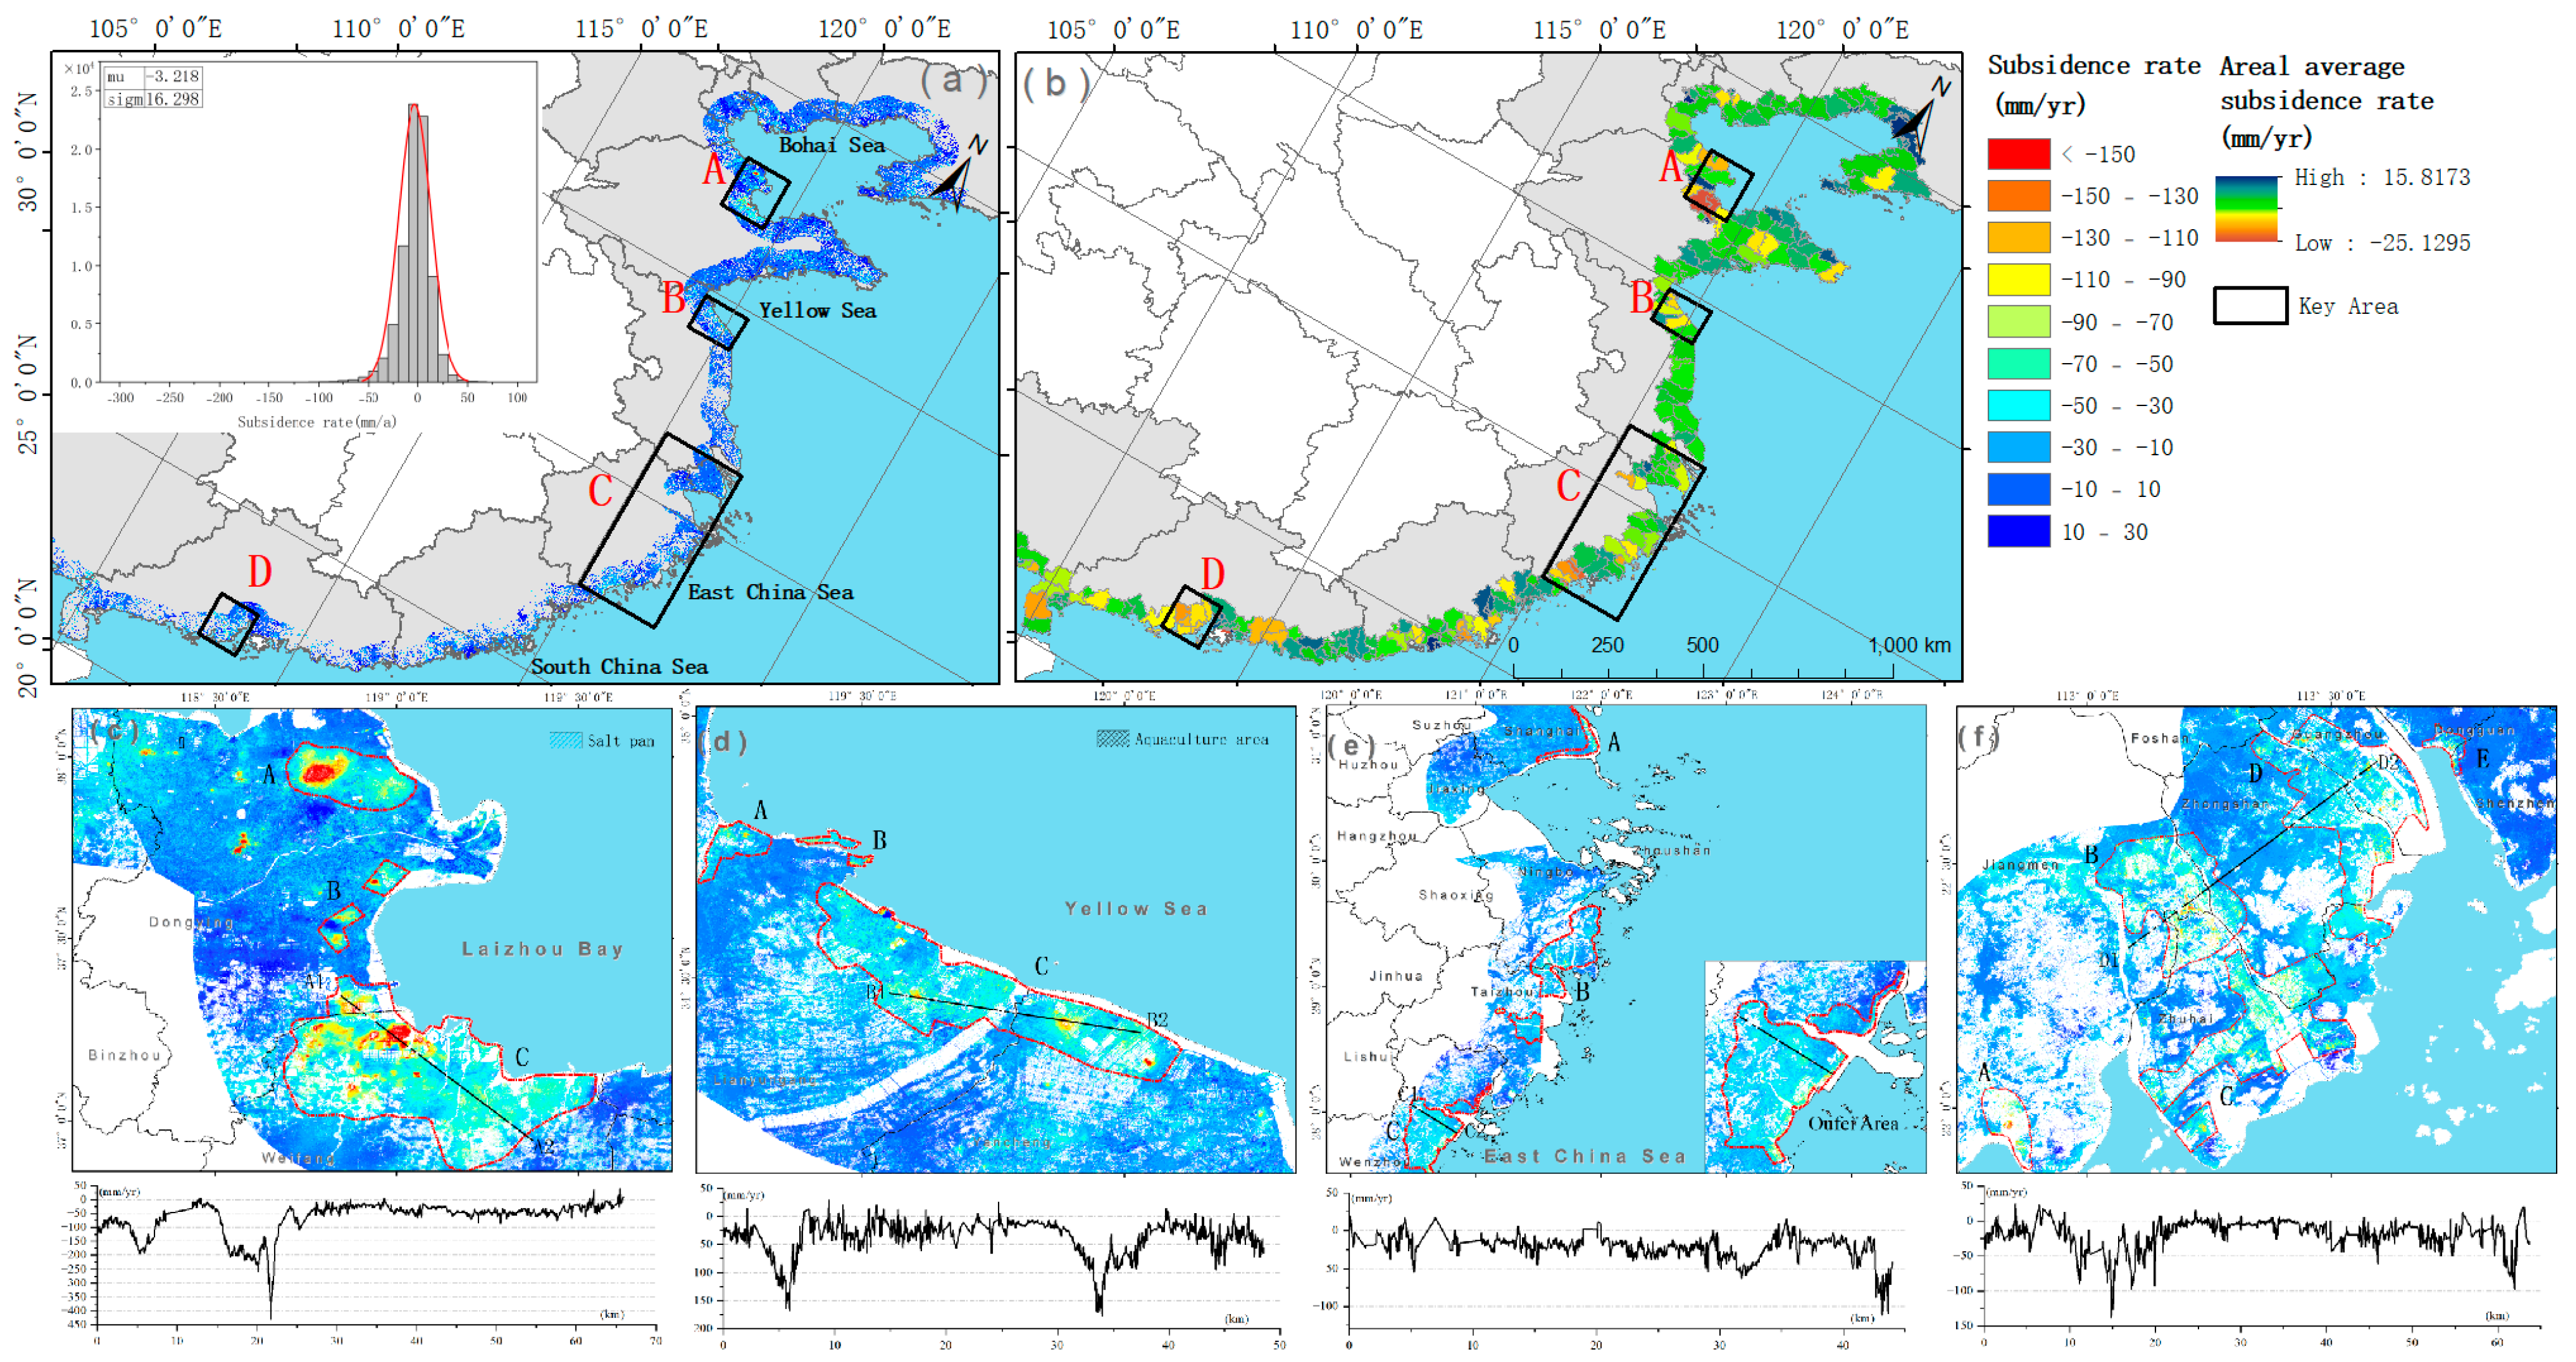
Using SBAS-InSAR assisted by GACOS and 2023 Sentinel-1A imagery, we obtained 15 m-resolution surface deformation data for the entire eastern coastal belt of mainland China (Figure 4a). The results reveal that land subsidence is widespread and highly non-uniform. Taking the Shanghai area as the dividing line, the northern coast is generally stable in broad terms, yet pronounced localized subsidence is evident. Distinct subsidence cones have developed along the Bohai and Laizhou Bays as well as in northern Jiangsu, with rates markedly higher than their surroundings. Cities such as Tianjin, Tangshan and Cangzhou (Hebei), Binzhou, Dongying and Weifang (Shandong), and Lianyungang, Yancheng and Nantong (Jiangsu) now rank among the most rapidly subsiding areas, where ground settlement has become a key constraint on economic development.
In contrast, the southern coast exhibits subsidence over a much broader area. Shanghai, Ningbo, Taizhou and Wenzhou (Zhejiang), Fuzhou and Zhangzhou (Fujian), and the PRD cities of Shenzhen, Dongguan, Guangzhou, Zhuhai and Jiangmen all show measurable deformation. Quantitatively, however, subsidence rates south of Shanghai are modest except in the PRD. Along the southeastern coast of Zhejiang and Fujian, rates typically range from −20 to –30 mm/yr—substantially lower than those recorded in the northern subsidence hotspots.
We further calculated the mean subsidence rates for 257 coastal districts and counties (Figure 4b) and evaluated their spatial autocorrelation using the global Moran’s I. The index reached 0.38 with a z-score of 11.63, indicating strong and statistically significant positive spatial clustering of land subsidence along the coastal belt. Guided by the spatial pattern of annual mean subsidence, we delineated four primary subsidence regions (A–D) from north to south: the Laizhou Bay, northern Jiangsu, YRD, and PRD subsidence zones. Their average subsidence rates are −13.31 mm/yr, −7.35 mm/yr, −5.19 mm/yr, and −9.95 mm/yr, respectively.
From a geological perspective, all four subsidence zones lie on soft, compressible alluvial or marine-deposited plains, providing the fundamental geotechnical conditions for subsidence. Moreover, these regions are economically advanced and intensively developed; anthropogenic activities have therefore become a critical trigger that exacerbates differential settlement. In Laizhou Bay, zones A (Hekou), B (Kenli) and C (northern Weifang) host abundant subsurface brine [34]; decades of over-exploitation have driven the A1–A2 transect to an average rate of −50 mm/yr and local maxima exceeding −400 mm /yr, the fastest coastal subsidence recorded nationwide. In northern Jiangsu, greenhouse-style mariculture between Guanyun and Xiangshui requires frequent groundwater exchange [35]; the B1–B2 profile therefore subsides at −10 to −60 mm/yr with two funnel centres peaking near −150 mm/yr where rapid pumping couples with thick soft soils. The YRD has a long history of settlement [36,37], but while old centres have been stabilised by injection and abstraction controls [38,39], newly reclaimed tracts such as Nanhui East Beach and Oufei still exceed −100 mm/yr (C1–C2) and downtown Wenzhou continues to sink at −20 to −40 mm/yr. In the Pearl River Delta, widespread soft soils, brackish-water aquaculture pumping [40] and heavy static/dynamic loading combine to produce rates up to −120 mm/yr along the D1–D2 transect, with the largest settlement occurring in Muzhou Town, Xinhui. Detailed statistics for the four core subsidence zones are summarised in Table 3.

5. Discussion

5.1. Driving Factors of Land Subsidence

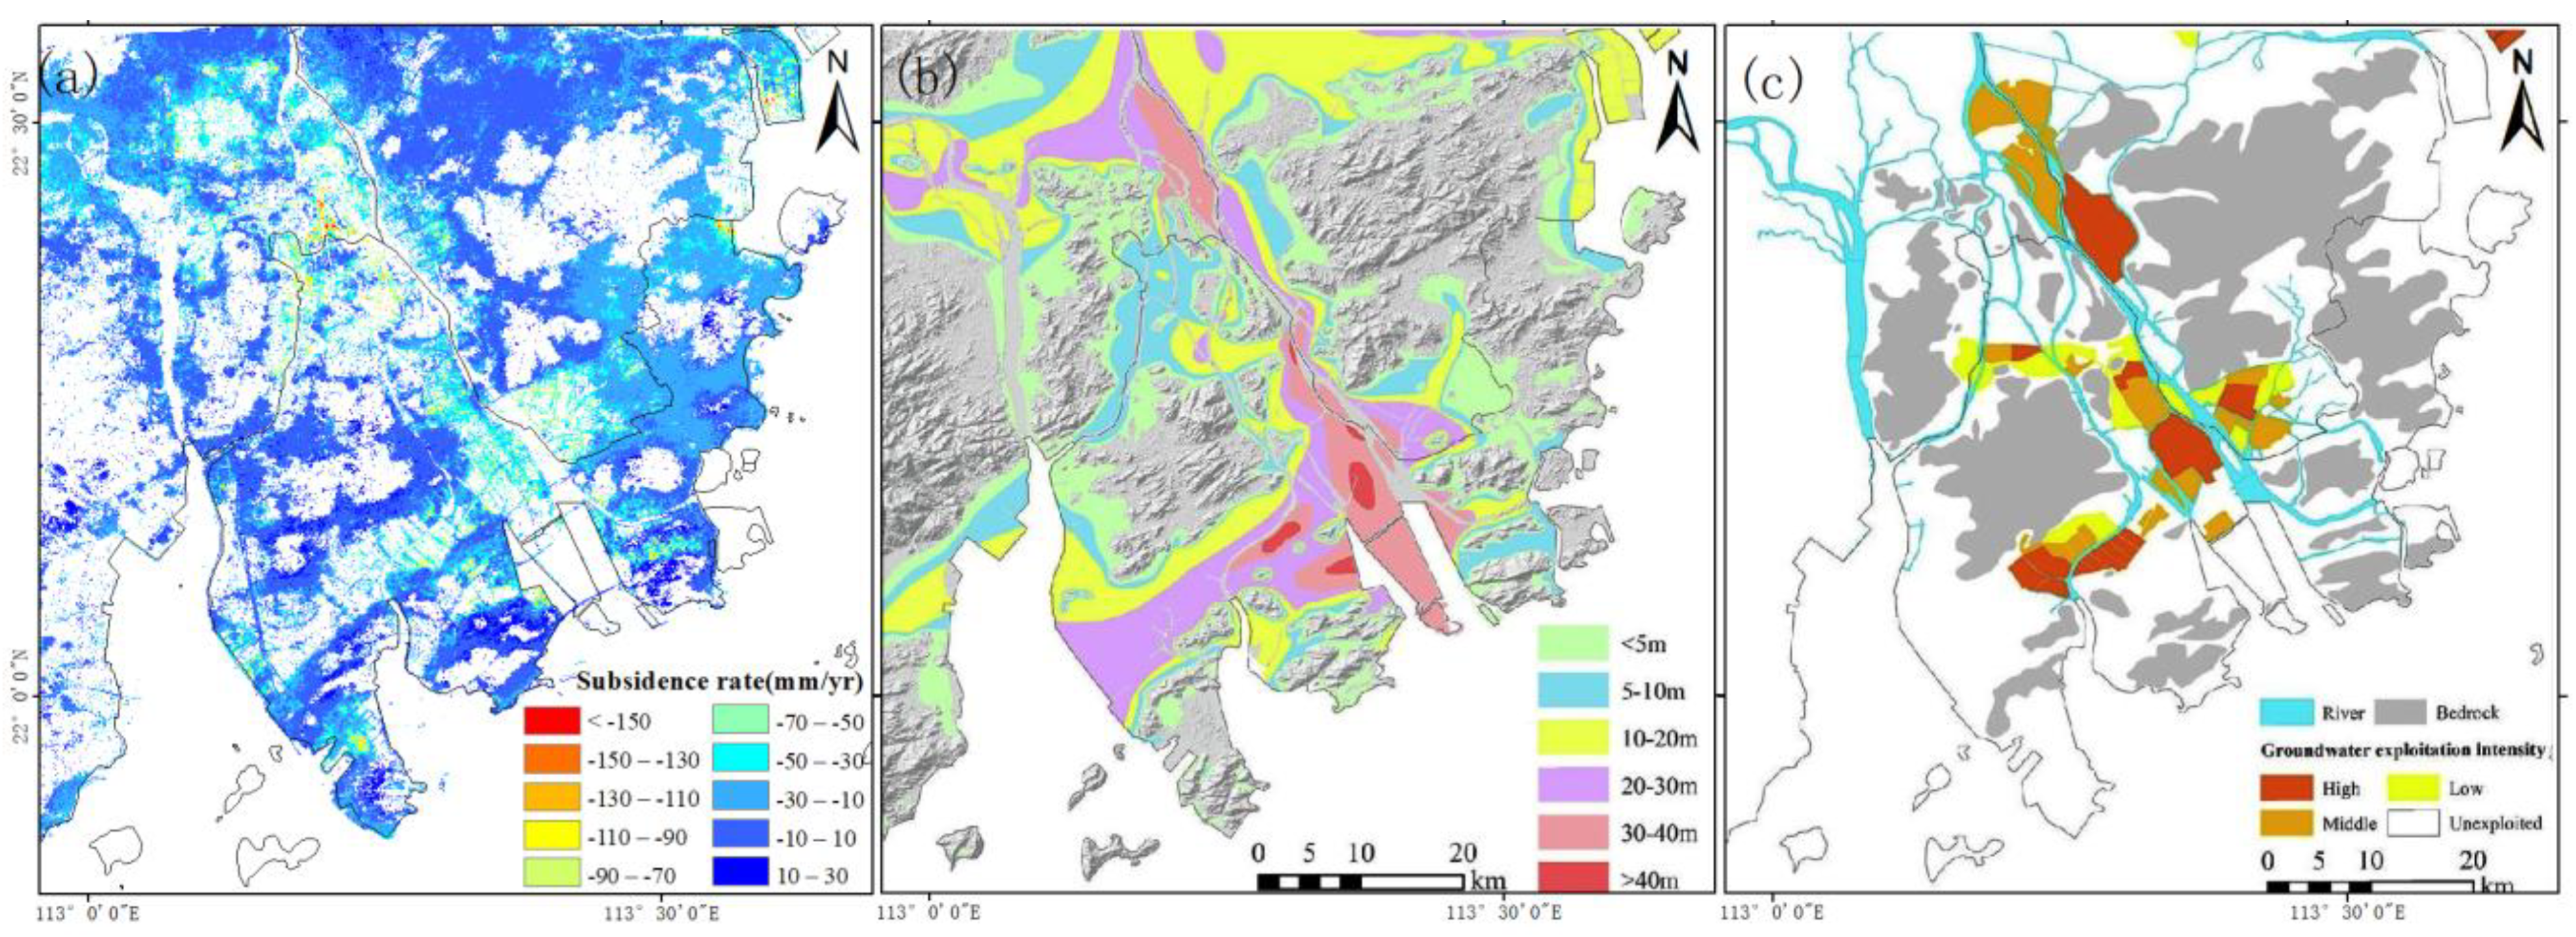
Land-subsidence drivers fall into natural and anthropogenic categories. The natural component is governed by the coastal geological setting. Many Chinese coastal cities are built on soft alluvial plains [17]; the PRD is a textbook case of consolidation-driven subsidence. Thick, laterally extensive soft soils are also found along the coasts of Jiangsu, Zhejiang [41], and Fujian. Because consolidation rate increases with layer thickness, these regions exhibit broad, continuous settlement zones that mirror the spatial distribution of soft-soil thickness.
Human-induced land subsidence along the coast is chiefly driven by groundwater over-extraction, mineral-resource mining, large-scale reclamation, and static/dynamic loading; groundwater withdrawal is the dominant cause [42]. China’s long, sinuous shoreline hosts widespread brine aquifers whose over-exploitation is worsening; the saltworks concentrated in Dongying and Weifang along Laizhou Bay are emblematic of brine-related subsidence. Rapid economic expansion has sent municipal and industrial water demand soaring. Extensive mariculture belts in coastal Jiangsu, Zhejiang and the PRD have further intensified groundwater pumping. Ziyue Liu et al. identified three prominent subsidence bowls in the Pearl River Delta, located in the junction zone of Zhongshan and Jiangmen, the border area between Zhuhai and Zhongshan, and the Gaolan Island area of Zhuhai, with vertical deformation velocities ranging from −70 to 10 mm/year [6]. The spatial distribution of these three subsidence zones corresponds to areas B, C_up, and C_down in Figure 4f of the present study, respectively. Moreover, the measured subsidence rates align closely with the deformation velocity profiles shown in Figure 4f, demonstrating strong consistency between their findings and the spatial patterns identified in our research. Subsidence linked to groundwater overdraft is tightly coupled to falling water tables and typically evolves into broad, regional subsidence bowls that coincide with groundwater depression cones (Figure 5).
Extraction of mineral resources such as oil and coal is another major driver of land subsidence. Oil-related settlement is usually confined to the footprint of individual oilfields—for example, the Liaohe field near Panjin and the Shengli field near Dongying—producing localized, well-centered cones of depression whose spatial extent remains limited. By contrast, coal mining generates smaller overall subsiding areas but produces much larger vertical displacements at the mine center. In the Fengnan and Fengrun districts of Tangshan, numerous workings such as the Qianjiaying and Donghuantuo mines have created extensive coal-mining collapse zones, severely damaging surface structures and the surrounding environment.
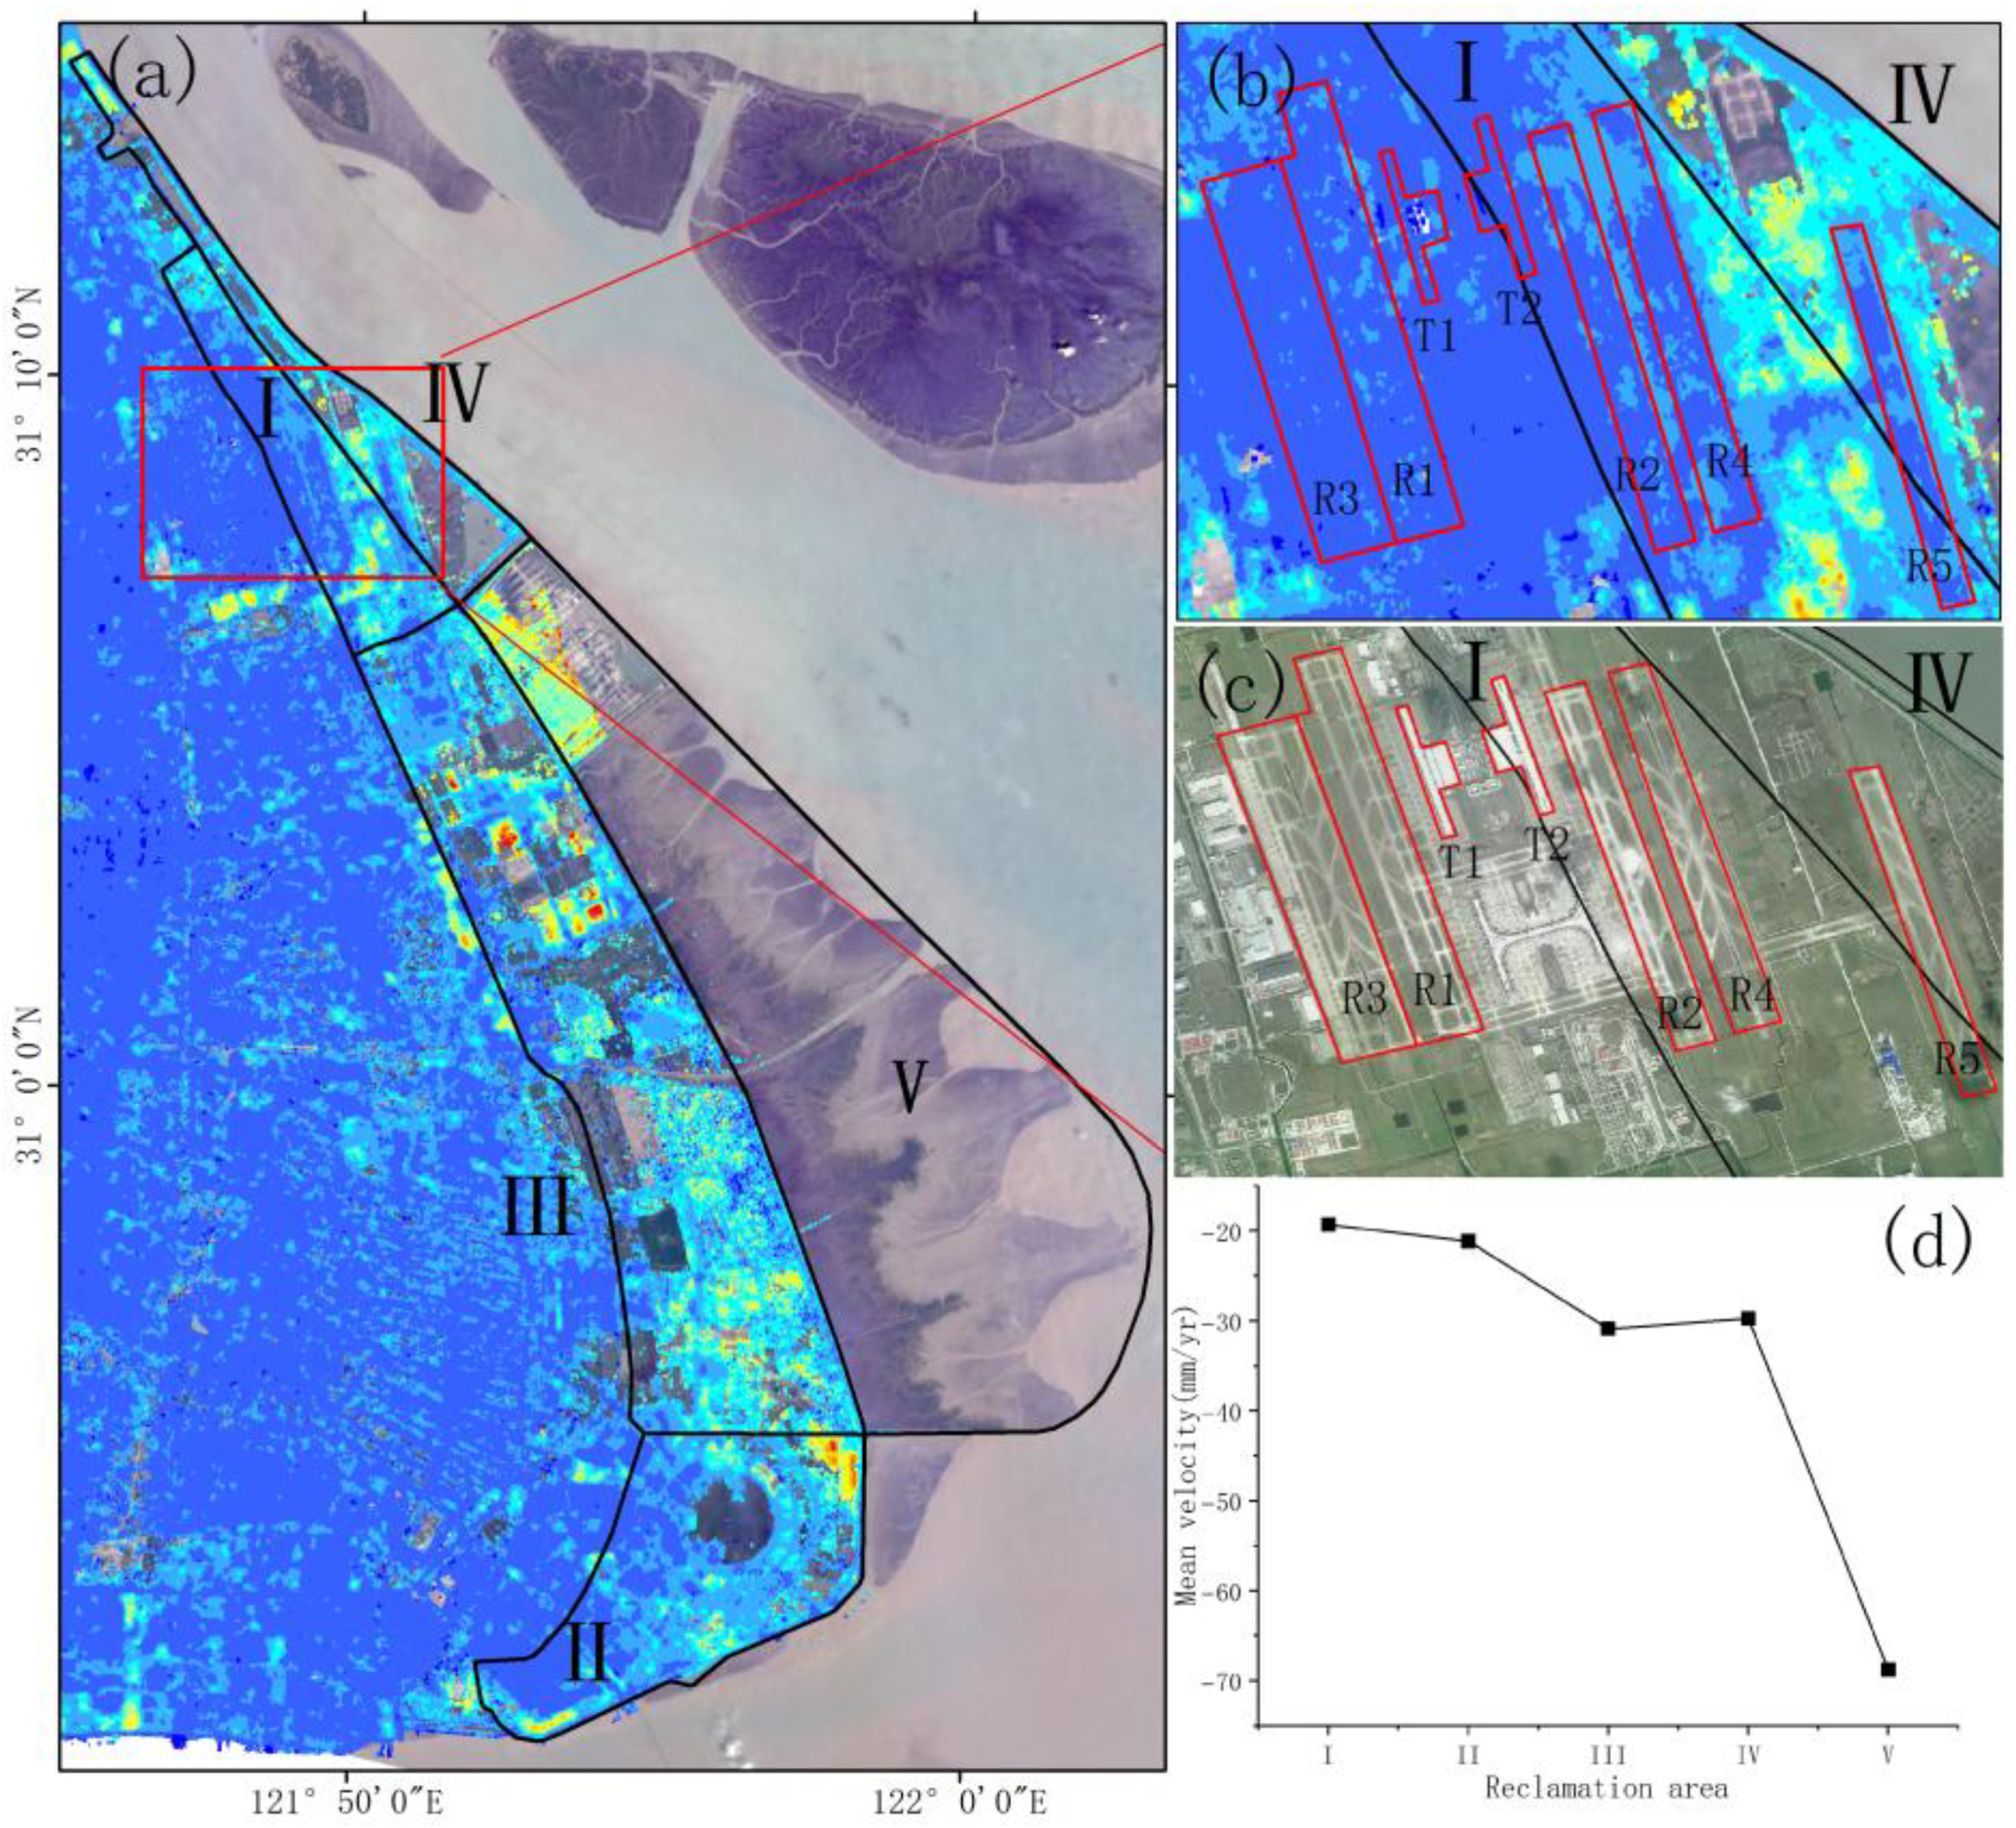
Reclaimed land is also prone to subsidence. With coastal land resources increasingly scarce, large-scale land reclamation has intensified in recent years [43]. While these projects deliver substantial economic benefits, they simultaneously aggravate geological hazards such as ground subsidence [44]. Reclaimed areas are built by hydraulic filling, and subsequent self-weight consolidation of the young, poorly compacted fill inevitably produces large, widespread settlement [45]. Studies show that China’s coastal reclamation exhibits a “strong-north, weak-south” pattern [46]. Most projects cluster in the soft-mud coasts of the Bohai Rim and the Yangtze and PRD economic zones. Statistical results (Figure 6d) indicate that the degree of subsidence in reclaimed areas is closely related to the timing of land formation: the later the land was created, the more intense the ongoing settlement.
Dynamic and static loading is another key driver of land subsidence. China’s eastern coastal belt is the country’s economic core. Large-scale backfilling of soft soils, clusters of high-rise buildings, and the operation of rail and metro networks all add dynamic and static loads to the ground, accelerating consolidation of compressible strata and undermining surface stability. Such subsidence is usually concentrated in densely built-up urban districts and along highways, railways, and bridges. Previous studies have also reported that ground deformation along railway lines is significantly influenced by operational dynamic loads, with the cross-section showing a “concave” pattern between the track centre and the shoulders [48]. Wang et al. [49] investigation of subsidence along the Tianjin and Qingdao metro lines demonstrated that the settlement rate in the track centre is 2–3 mm/yr higher than that on either side, confirming the pronounced amplification effect of dynamic loading.
Overall, excessive groundwater extraction remains the dominant cause of coastal subsidence in China. Yet, viewed spatially, the driving factors differ markedly between the northern and southern coasts. The northern coastal zone—Bohai Bay, Laizhou Bay, and northern Jiangsu—experiences pronounced regional subsidence driven by a diverse set of factors. These include groundwater overdraft for municipal-industrial supply, brine abstraction, irrigation, extraction of petroleum and coal, and extensive land reclamation. Subsidence rates and dominant drivers vary markedly from one area to another; Laizhou Bay records the highest rates and the broadest impact, representing the most severe subsidence hazard in the country. In contrast, the southern coast is characterized by large, continuous subsidence belts. The YRD, the PRD, and the economically developed coastal zones of Zhejiang and Fujian all exhibit widespread settlement. A recent study [11] shows that subsidence in this region coincides almost perfectly with the distribution of soft-soil foundations. Given dense populations and intensive groundwater extraction for domestic, industrial, and mariculture use, the combination of extensive soft-soil coverage and persistent overdraft controls the broad, contiguous pattern of subsidence along the southern coast—markedly different from the clustered, localized subsidence observed in the north.

5.2. Land Subsidence Risk Assessment

To deliver a quantitative assessment of land subsidence and its associated risk levels along China’s mainland coast, this study adopted the severity classification specified in the “Technical Specification for InSAR-based Land Subsidence Data Processing” (DD2014-11) issued by the China Geological Survey (Table 4). The coastal zone was divided into five hazard classes—low, moderately low, moderate, moderately high, and high risk—and the area and percentage of each class were calculated. These hazard zones were then overlaid with 2019 population-density data and 2019 GDP spatial-distribution data to examine the impacts of subsidence on coastal populations and economic output. In this way, the study quantifies the degree to which land subsidence threatens both people and GDP in the coastal region.
Statistical results show (Table 5) that land subsidence is widely developed in key coastal zones of China. Approximately 55.77% of the land is experiencing varying degrees of subsidence (<0 mm/yr), affecting about 97.42 million people, with a total GDP of CNY 16.41 billion. The vast majority (76.21%) of the coastal zones are low-risk areas (>−10 mm/yr), covering an area of about 153,295.61 km2, with a population of approximately 168.16 million and a total GDP of CNY 28.28 billion. Areas with moderately low risk (−30 mm/yr to −10 mm/yr) and medium risk (−50~−30 mm/yr) account for 18.72% and 3.83% of the total area, respectively. The corresponding population numbers are 31.09 million and 3.03 million, with total GDPs of CNY 5.30 billion and 618.32 million, respectively. Although the areas of moderately high-risk (−80~−50 mm/yr) and high-risk (<−80 mm/yr) zones are small, accounting for only 0.95% and 0.29% of the total area, respectively, they are generally located in economically developed and densely populated coastal regions, so their potential impact cannot be ignored. It is evident that land subsidence has become one of the geological disasters that cannot be ignored in the eastern coastal areas of China.
We calculated the area, population, and GDP within each subsidence-risk zone for the ten coastal provinces of mainland China, and plotted the normalized shares of area, population, and GDP across risk levels (Figure 7 and Appendix A Table A1, Table A2 and Table A3) to eliminate the influence of varying coastal-zone areas among provinces. In absolute terms, Shandong has the largest subsiding area: its “moderately high-risk” and “high-risk” zones cover 8.29 million km2 (1.48%) and 3.69 million km2 (0.66%) of the province’s coastal belt, respectively. Guangdong ranks second, with 3.42 million km2 (1.29%) and 0.70 million km2 (0.26%) in the same risk classes. The severe subsidence stems from two key factors: their extensive coastlines and broad coastal plains provide ample space for settlement, while their positions on major deltaic lowlands—the YtRD in Shandong and the PRD in Guangdong—combine widespread soft soils with intensive human activity to accelerate land subsidence.
When the human and economic exposure is considered, Shandong again stands out. Within its moderately high-risk and high-risk zones there are 114.5 thousand people (0.46%) and 28.7 thousand people (0.11%), together accounting for CNY 381.8 million (0.65%) and CNY 206.3 million (0.35%) of GDP. Guangdong follows in absolute numbers, yet Hebei shows slightly higher proportional exposure (population and GDP shares); this indicates that Hebei’s population and economic assets are more concentrated in the worst-subsiding areas. Overall, among the ten coastal provinces, Shandong exhibits both the largest subsiding area and the greatest exposure of population and GDP to subsidence, making it the most severely affected region.

6. Conclusions

Based on the SBAS-InSAR technology, this study constructed a millimeter-level, continuous, large-scale land subsidence dataset for the coastal zones of mainland China in 2023. It quantitatively evaluated the impact of land subsidence on population distribution and regional economic levels in different subsidence risk areas and further analyzed the main driving factors of land subsidence. On this basis, several conclusions have been drawn.
(1)
Land subsidence is widespread along China’s mainland coast: more than half of the land is sinking at varying rates (<0 mm/yr), affecting 97.42 million people and putting an aggregate GDP of CNY 16.41 billion at risk. Roughly one-quarter of the coastal zone is classified at or above the “moderately low risk” level (<−10 mm/yr), while the combined area of “moderately high risk” (−50 to −80 mm/yr) and “high risk” (<−80 mm/yr) zones accounts for 1.24%. Among the ten coastal provinces, Shandong has the largest subsiding area and the greatest share of population and GDP within the high-risk category, making it the most severely affected region.
(2)
The coastal zone is marked by severe uneven subsidence, with four major subsidence areas—the Laizhou Bay, northern Jiangsu, YRD, and PRD—all situated on densely populated alluvial-marine plains. Among them, the Laizhou Bay subsidence area exhibits the highest average subsidence rate, primarily driven by the excessive extraction of subsurface brine.
(3)
Land subsidence along China’s mainland coast is driven by five primary factors: soft-soil self-consolidation, groundwater over-extraction, mineral-resource mining, large-scale land reclamation, and static or dynamic loading—among which groundwater over-extraction is the most critical trigger. Spatially, subsidence exhibits pronounced north–south contrasts. Along the northern coast, regional subsidence is severe and driven by a diverse combination of factors, including groundwater over-extraction, mineral-resource exploitation, and extensive land reclamation. In contrast, the southern coast shows a broad, continuous subsidence pattern; here, widespread groundwater over-extraction coupled with the extensive distribution of soft soils is the key cause of the large-area settlement.
The 15 m-resolution, nationwide and up-to-date subsidence dataset generated in this study provides robust data support for tackling sustainable-development challenges along China’s coast. Nevertheless, although the InSAR results are internally consistent, the reported deformation rates have not been verified against ground truth because detailed in situ validation and field-survey data are lacking; this important limitation should be addressed in future work through targeted GNSS, levelling or UAV photogrammetric campaigns. Furthermore, the delivered subsidence layer can be coupled with sea-level rise and storm-surge scenarios to systematically assess compound-hazard risk in coastal zones, thereby supporting the siting of major coastal infrastructure, informing spatial-planning decisions, and underpinning sustainable development toward China’s “dual-carbon” goals.

Author Contributions

Conceptualization, W.F. and H.W.; methodology, W.F.; validation, W.F. and W.L.; formal analysis, W.F.; resources, W.F. and W.L.; writing—original draft preparation, W.F.; writing—review and editing, W.F. and H.C.; visualization, W.F.; project administration, H.C. and Y.W.; funding acquisition, H.W. and H.C. All authors have read and agreed to the published version of the manuscript.

Funding

This work was supported by the China Geological Survey Project (Grant No. DD20240021, No. DD20220990, No. DD20243124),and the Science and Technology Innovation Foundation of Comprehensive Survey & Command Center for Natural Resources (Grant No. KC20240016).

Institutional Review Board Statement

Not applicable.

Informed Consent Statement

Not applicable.

Data Availability Statement

The data presented in this study are available on request from the corresponding author.

Conflicts of Interest

The authors declare no conflicts of interest.

Appendix A

Table A1. Area and Proportion of Different Subsidence Risk Zones in Ten Coastal Provinces.
LowModerately LowModerateModerately HighHigh
Area (×104 km2)
Liaoning24,712.90405046.6393540.753861.62448.6004
Hebei12,838.43973438.7094592.7738129.349126.7037
Tianjin5419.36351064.0565135.300640.96552.7515
Shandong41,295.382710,760.13072779.8266828.5834368.8670
Jiangsu15,851.79144357.9631652.0217151.023638.6708
Shanghai5050.28411192.1319173.988544.638211.0266
Zhejiang11,595.37464863.5642822.2531179.304331.9075
Fujian11,043.14154181.0312642.9116106.082816.8318
Guangdong18,998.05936004.89321198.3633342.064869.5268
Guangxi2346.5612891.5726173.685636.07973.5253
Area proportion/%
Liaoning81.3716.621.780.200.03
Hebei75.4120.203.480.760.16
Tianjin81.3415.972.030.610.04
Shandong73.7019.204.961.480.66
Jiangsu75.3020.703.100.720.18
Shanghai78.0318.422.690.690.17
Zhejiang66.2927.804.701.030.18
Fujian69.0626.154.020.660.11
Guangdong71.3922.564.501.290.26
Guangxi67.9925.835.031.050.10
Table A2. Population and Proportion of Different Subsidence Risk Zones in Ten Coastal Provinces.
LowModerately LowModerateModerately HighHigh
Population (×104)
Liaoning1124.345682.07476.07410.56170.1818
Hebei515.535866.564810.20141.49000.5617
Tianjin743.030125.27150.92090.23870.0355
Shandong2181.9470256.868049.625111.45432.8731
Jiangsu1045.6402156.744513.76012.40520.4381
Shanghai2593.1179425.254717.25612.99450.2272
Zhejiang1546.4954805.805174.679411.26350.9038
Fujian1573.1786452.022336.08004.74470.4147
Guangdong4965.3923804.088390.125416.68591.7764
Guangxi171.672234.42004.69471.13000.0070
population proportion/%
Liaoning92.676.760.500.050.01
Hebei86.7411.201.720.250.09
Tianjin96.563.280.120.030.00
Shandong87.1810.261.980.460.11
Jiangsu85.7812.861.130.200.04
Shanghai85.3313.990.570.100.01
Zhejiang63.4033.043.060.460.04
Fujian76.1321.871.750.230.02
Guangdong84.4713.681.530.280.03
Guangxi81.0116.242.220.530.00
Table A3. GDP and Proportion of Different Subsidence Risk Zones in Ten Coastal Provinces.
LowModerately LowModerateModerately HighHigh
GDP (×106 CNY)
Liaoning2461.3664145.313910.32141.59260.9050
Hebei1255.3435190.322537.655712.50563.2513
Tianjin1941.3948156.08458.30070.80930.0141
Shandong5119.3947573.4961118.590738.175920.6297
Jiangsu2601.5683471.413639.86685.13561.0724
Shanghai2993.3895602.326059.44269.98470.8722
Zhejiang2519.38301024.7053109.161115.36011.6137
Fujian2463.9387793.594955.96824.98940.0560
Guangdong6680.56281304.8545173.518246.40046.4785
Guangxi248.217941.69355.40170.97090.0141
GDP proportion/%
Liaoning93.965.550.390.060.03
Hebei83.7412.702.510.830.22
Tianjin92.167.410.390.040.00
Shandong87.219.772.020.650.35
Jiangsu83.4115.111.280.160.03
Shanghai81.6516.431.620.270.02
Zhejiang68.6427.922.970.420.04
Fujian74.2523.911.690.150.00
Guangdong81.3515.892.110.570.08
Guangxi83.7714.071.820.330.00

References

  1. Reimann, L.; Vafeidis, A.T.; Honsel, L.E. Population development as a driver of coastal risk: Current trends and future pathways. Camb. Prism. Coast. Futures 2023, 1, e14. [Google Scholar] [CrossRef]
  2. Cai, R.S.; Liu, K.X.; Tan, H.J. Impacts and risks of climate change on China’s coastal zones and seas and related adaptation. China Popul. Resour. Environ. 2020, 30, 1–8. [Google Scholar]
  3. Sun, H.; Peng, H.; Zeng, M.; Wang, S.; Pan, Y.; Pi, P.; Xue, Z.; Zhao, X.; Zhang, A.; Liu, F. Land Subsidence in a Coastal City Based on SBAS-InSAR Monitoring: A Case Study of Zhuhai, China. Remote Sens. 2023, 15, 2424. [Google Scholar] [CrossRef]
  4. Ferretti, A.; Prati, C.; Rocca, F. Nonlinear subsidence rate estimation using permanent scatterers in differential SAR interferometry. IEEE Trans. Geosci. Remote Sens. 2000, 38, 2202–2212. [Google Scholar] [CrossRef]
  5. Berardino, P.; Fornaro, G.; Lanari, R.; Sansosti, E. A new algorithm for surface deformation monitoring based on small baseline differential SAR interferograms. IEEE Trans. Geosci. Remote Sens. 2002, 40, 2375–2383. [Google Scholar] [CrossRef]
  6. Liu, Z.; Ng, A.H.; Wang, H.; Chen, J.; Du, Z.; Ge, L. Land subsidence modeling and assessment in the West Pearl River Delta from combined InSAR time series, land use and geological data. Int. J. Appl. Earth Obs. Geoinf. 2023, 118, 103228. [Google Scholar] [CrossRef]
  7. Mohamadi, B.; Balz, T.; Younes, A. Towards a PS-InSAR Based Prediction Model for Building Collapse: Spatiotemporal Patterns of Vertical Surface Motion in Collapsed Building Areas—Case Study of Alexandria, Egypt. Remote Sens. 2020, 12, 3307. [Google Scholar] [CrossRef]
  8. Mohamadi, B.; Balz, T.; Younes, A. A Model for Complex Subsidence Causality Interpretation Based on PS-InSAR Cross-Heading Orbits Analysis. Remote Sens. 2019, 11, 2014. [Google Scholar] [CrossRef]
  9. Ahmad, H.; Zhang, Y.; Rehman, H.; Alam, M.; Ullah, Z.; Shahid, M.A.; Khan, M.; Siddique, A. A Hybrid Spatio-Temporal Graph Attention (ST D-GAT Framework) for Imputing Missing SBAS-InSAR Deformation Values to Strengthen Landslide Monitoring. Remote Sens. 2025, 17, 2613. [Google Scholar] [CrossRef]
  10. Guillaume, M.; Cécile, D.; Frédéric, M. Time evolution of mining-related residual subsidence monitored over a 24-year period using InSAR in southern Alsace, France. Int. J. Appl. Earth Obs. Geoinf. 2021, 102, 102392. [Google Scholar]
  11. Xu, N.Z.; Jiang, Y.H.; Wang, J.D.; Liu, H.Y.; Jia, J.Y. The Types and Characteristics of the Ground Subsidencein Southeastern China Coastal Region. J. Catastrophol. 2005, 20, 67–72. [Google Scholar]
  12. Lu, C.; Zhu, L.; Li, X.; Gong, H.; Du, D.; Wang, H.; Teatini, P. Land Subsidence Evolution and Simulation in the Western Coastal Area of Bohai Bay, China. J. Mar. Sci. Eng. 2022, 10, 1549. [Google Scholar] [CrossRef]
  13. Tang, Z.; Ning, R.; Wang, D.; Tian, X.; Bi, X.; Ning, J.; Zhou, Z.; Luo, F. Projections of land use/cover change and habitat quality in the model area of Yellow River delta by coupling land subsidence and sea level rise. Ecol. Indic. 2024, 158, 111394. [Google Scholar] [CrossRef]
  14. Wang, Z.; Liu, X.; Zhang, S.; Meng, X.; Zhang, H.; Guo, X. Multi-Scenario Land Use and Carbon Storage Assessment in the Yellow River Delta Under Climate Change and Resource Development. Remote Sens. 2025, 17, 1603. [Google Scholar] [CrossRef]
  15. Wang, F.; Miao, L.; Lu, W. Sand creep as a factor in land subsidence during groundwater level recovery in the southern Yangtze River delta, China. B Eng. Geol. Environ. 2013, 72, 273–283. [Google Scholar] [CrossRef]
  16. Ren, T.; Gong, W.; Gao, L.; Zhao, F. Understanding land subsidence in the Pearl River Delta region of China based on InSAR observations. Eng. Geol. 2024, 339, 107646. [Google Scholar] [CrossRef]
  17. Ao, Z.; Hu, X.; Tao, S.; Hu, X.; Wang, G.; Li, M.; Wang, F.; Hu, L.; Liang, X.; Xiao, J.; et al. A national-scale assessment of land subsidence in China’s major cities. Science 2024, 384, 301–306. [Google Scholar] [CrossRef]
  18. Fang, J.; Nicholls, R.J.; Brown, S.; Lincke, D.; Hinkel, J.; Vafeidis, A.T.; Du, S.; Zhao, Q.; Liu, M.; Shi, P. Benefits of subsidence control for coastal flooding in China. Nat. Commun. 2022, 13, 6946. [Google Scholar] [CrossRef] [PubMed]
  19. Allison, M.; Yuill, B.; Törnqvist, T.; Amelung, F.; Dixon, T.; Erkens, G.; Stuurman, R.; Jones, C.; Milne, G.; Steckler, M.; et al. Global risks and research priorities for coastal subsidence. Eos Trans. Am. Geophys. Union 2016, 97, 22–27. [Google Scholar] [CrossRef]
  20. Shirzaei, M.; Freymueller, J.; Törnqvist, T.E.; Galloway, D.L.; Dura, T.; Minderhoud, P.S. Measuring, modelling and projecting coastal land subsidence. Nat. Rev. Earth Environ. 2020, 2, 40–58. [Google Scholar] [CrossRef]
  21. Li, X.; Chen, Y.; Chen, Z.; Zhang, G.; Tang, M. Analysis of Spatio-temporal Changes and Driving Vegetation NDVI in Coastal Areas of China. Ecol. Environ. Sci. 2024, 33, 180–191. [Google Scholar]
  22. Yang, H.S. Conception and Approach on New Model of Ecological Farm and Ranch Constructions in Coastal Zone—A Case of the Yellow River Delta, China. Bull. Chin. Acad. Sci. 2017, 32, 1111–1117. [Google Scholar]
  23. Fei, Y.H.; Miao, J.X.; Zhang, Z.J.; Chen, Z.Y.; Song, H.B.; Yang, M. Analysis on Evolution of Groundwater Depression Cones and Its Leading Factors in North China Plain. Resour. Sci. 2009, 31, 394–399. [Google Scholar]
  24. Yang, Y.Y.; Li, Q.; Gu, Y.C. Analysis of surface vertical load deformation in the North China Plain from 2002 to 2023 using GRACE and GPS. Sci. Surv. Mapp. 2024, 49, 9–21. [Google Scholar]
  25. Ning, L.; Feng, W.; Yu, L.; Wei, Z.; Hu, Y.F. Coastal mudflat resources in China: Spatial-temporal evolution, utilization efficiency, and development strategies. J. Plant Nutr. Fertil. 2025, 31, 1440–1454. [Google Scholar]
  26. Luo, Y.M. Sustainability Associated Coastal Eco-environmental Problems and Coastal Science Development in China. Bull. Chin. Acad. Sci. 2016, 31, 1133–1142. [Google Scholar]
  27. Yu, C.; Penna, N.T.; Li, Z. Generation of real-time mode high-resolution water vapor fields from GPS observations. J. Geophys. Res. Atmos. 2017, 122, 2008–2025. [Google Scholar] [CrossRef]
  28. Yu, C.; Li, Z.; Penna, N.T.; Crippa, P. Generic Atmospheric Correction Model for Interferometric Synthetic Aperture Radar Observations. J. Geophys. Res. Solid Earth 2018, 123, 9202–9222. [Google Scholar] [CrossRef]
  29. Yu, C.; Li, Z.; Penna, N.T. Interferometric synthetic aperture radar atmospheric correction using a GPS-based iterative tropospheric decomposition model. Remote Sens. Environ. 2018, 204, 109–121. [Google Scholar] [CrossRef]
  30. Gaughan, A.; Stevens, F.; Linard, C.; Jia, P.; Tatem, A. High Resolution Population Distribution Maps for Southeast Asia in 2010 and 2015. PLoS ONE 2013, 8, e55882. [Google Scholar] [CrossRef] [PubMed]
  31. Pepe, A.; Lanari, R. On the Extension of the Minimum Cost Flow Algorithm for Phase Unwrapping of Multitemporal Differential SAR Interferograms. IEEE Trans. Geosci. Remote Sens. 2006, 44, 2374–2383. [Google Scholar] [CrossRef]
  32. Chai, L.; Xie, X.; Wang, C.; Tang, G.; Song, Z. Ground subsidence risk assessment method using PS-InSAR and LightGBM: A case study of Shanghai metro network. Int. J. Digit. Earth 2024, 17, 2297842. [Google Scholar] [CrossRef]
  33. Zhang, Y.; Si, Z.; Lin, X.; Zhang, Z.; Chu, H.; Cao, C.; Liu, Y.; Huang, H.; Huang, B.; Bai, Z.; et al. Time-series InSAR reveals new insights into land subsidence in the Yellow River Delta, China. Mar. Georesour. Geotechnol. 2025, 43, 396–405. [Google Scholar] [CrossRef]
  34. Wang, J.; Zhang, J.Q.; Ren, H.H.; Li, Y.M.; Guo, Y. Current Situation and Genesis of Environmental Geology in the Coastal Region of Southern Laizhou Bay. Adv. Mar. Sci. 2020, 38, 336–347. [Google Scholar]
  35. Zhan, Y.T.; Zhu, Y.F.; Wang, Y.J.; Song, K. Land subsidence monitoring of Jiangsu coastal areas with high resolution time series InSAR. Sci. Surv. Mapp. 2022, 47, 69–76. [Google Scholar]
  36. Hu, R.L.; Yue, Z.Q.; Wang, L.C.; Wang, S.J. Review on current status and challenging issues of land subsidence in China. Eng. Geol. 2004, 76, 65–77. [Google Scholar] [CrossRef]
  37. Cui, Z.D.; Tang, Y.Q. Domestic and International Recent Situation and Research of Land Subsidence Disasters. China Earthq. Eng. J. 2007, 9, 275–278. [Google Scholar]
  38. He, X.; Yang, T.; Shen, S.; Xu, Y.; Arulrajah, A. Land Subsidence Control Zone and Policy for the Environmental Protection of Shanghai. Int. J. Environ. Res. Public Health 2019, 16, 2729. [Google Scholar] [CrossRef]
  39. Ye, S.; Xue, Y.; Wu, J.; Yan, X.; Yu, J. Progression and mitigation of land subsidence in China. Hydrogeol. J. 2016, 24, 685–693. [Google Scholar] [CrossRef]
  40. Wang, S.; Yan, X.X.; Jie, J.; Yang, T.L.; Wu, J.Z.; Wang, H.S. Analysis on factors affecting ground settlement in plain area of Pearl River Delta. Chin. J. Geol. Hazard Control. 2019, 30, 98–104. [Google Scholar]
  41. Cao, G.; Han, D.; Moser, J. Groundwater exploitation management under land subsidence constraint: Empirical evidence from the Hangzhou-Jiaxing-Huzhou Plain, China. Environ. Manag. 2013, 51, 1109–1125. [Google Scholar] [CrossRef] [PubMed]
  42. Hauer, M.E.; Fussell, E.; Mueller, V.; Burkett, M.; Call, M.; Abel, K.; McLeman, R.; Wrathall, D. Sea-level rise and human migration. Nat. Rev. Earth Environ. 2020, 1, 28–39. [Google Scholar] [CrossRef]
  43. Zhu, G.R.; Xu, X.G. Annual Processes of Land Reclamation from the Sea Along the Northwest Coast of Bohai Bay During 1974 to 2010. Geogr. Sci. 2012, 32, 1006–1012. [Google Scholar]
  44. Zhao, X.R.; Wang, L.Y.; Ma, Y.; Wang, J.; Yang, X.T.; Zhang, F.; Xing, Z.; Jin, B.W. Monitoring and analysis of surface deformation inland reclamation area based on SBAS-InSAR technology—Take Tianjin port for example. Mar. Sci. Bull. 2022, 24, 17–30. [Google Scholar]
  45. Gong, S.L.; Li, C.; Yang, S.L. The microscopic characteristics of Shanghai soft clay and its effect on soil body deformation and land subsidence. Environ. Geol. 2008, 56, 1051–1056. [Google Scholar] [CrossRef]
  46. Wu, W.T.; Tian, B.; Zhou, Y.X.; Shu, M.Y.; Qi, X.Y.; Xu, W. The trends of coastal reclamation in China in the past three decades. Acta Ecol. Sin. 2016, 36, 5007–5016. [Google Scholar]
  47. Li, D.; Li, B.; Zhang, Y.; Fan, C.; Xu, H.; Hou, X. Spatial and temporal characteristics analysis for land subsidence in Shanghai coastal reclamation area using PS-InSAR method. Front. Mar. Sci. 2022, 9, 1000523. [Google Scholar] [CrossRef]
  48. Duan, G.; Liu, H.; Gong, H.; Chen, B. Evolution Characteristics of Uneven Land Subsidence Along Beijing-Tianjin Inter-City Railway. Geomat. Inf. Sci. Wuhan Univ. 2017, 42, 1847–1853. [Google Scholar]
  49. Wang, S.; Chen, Z.; Zhang, G.; Xu, Z.; Liu, Y.; Yuan, Y. Overview and Analysis of Ground Subsidence along China’s Urban Subway Network Based on Synthetic Aperture Radar Interferometry. Remote Sens. 2024, 16, 1548. [Google Scholar] [CrossRef]
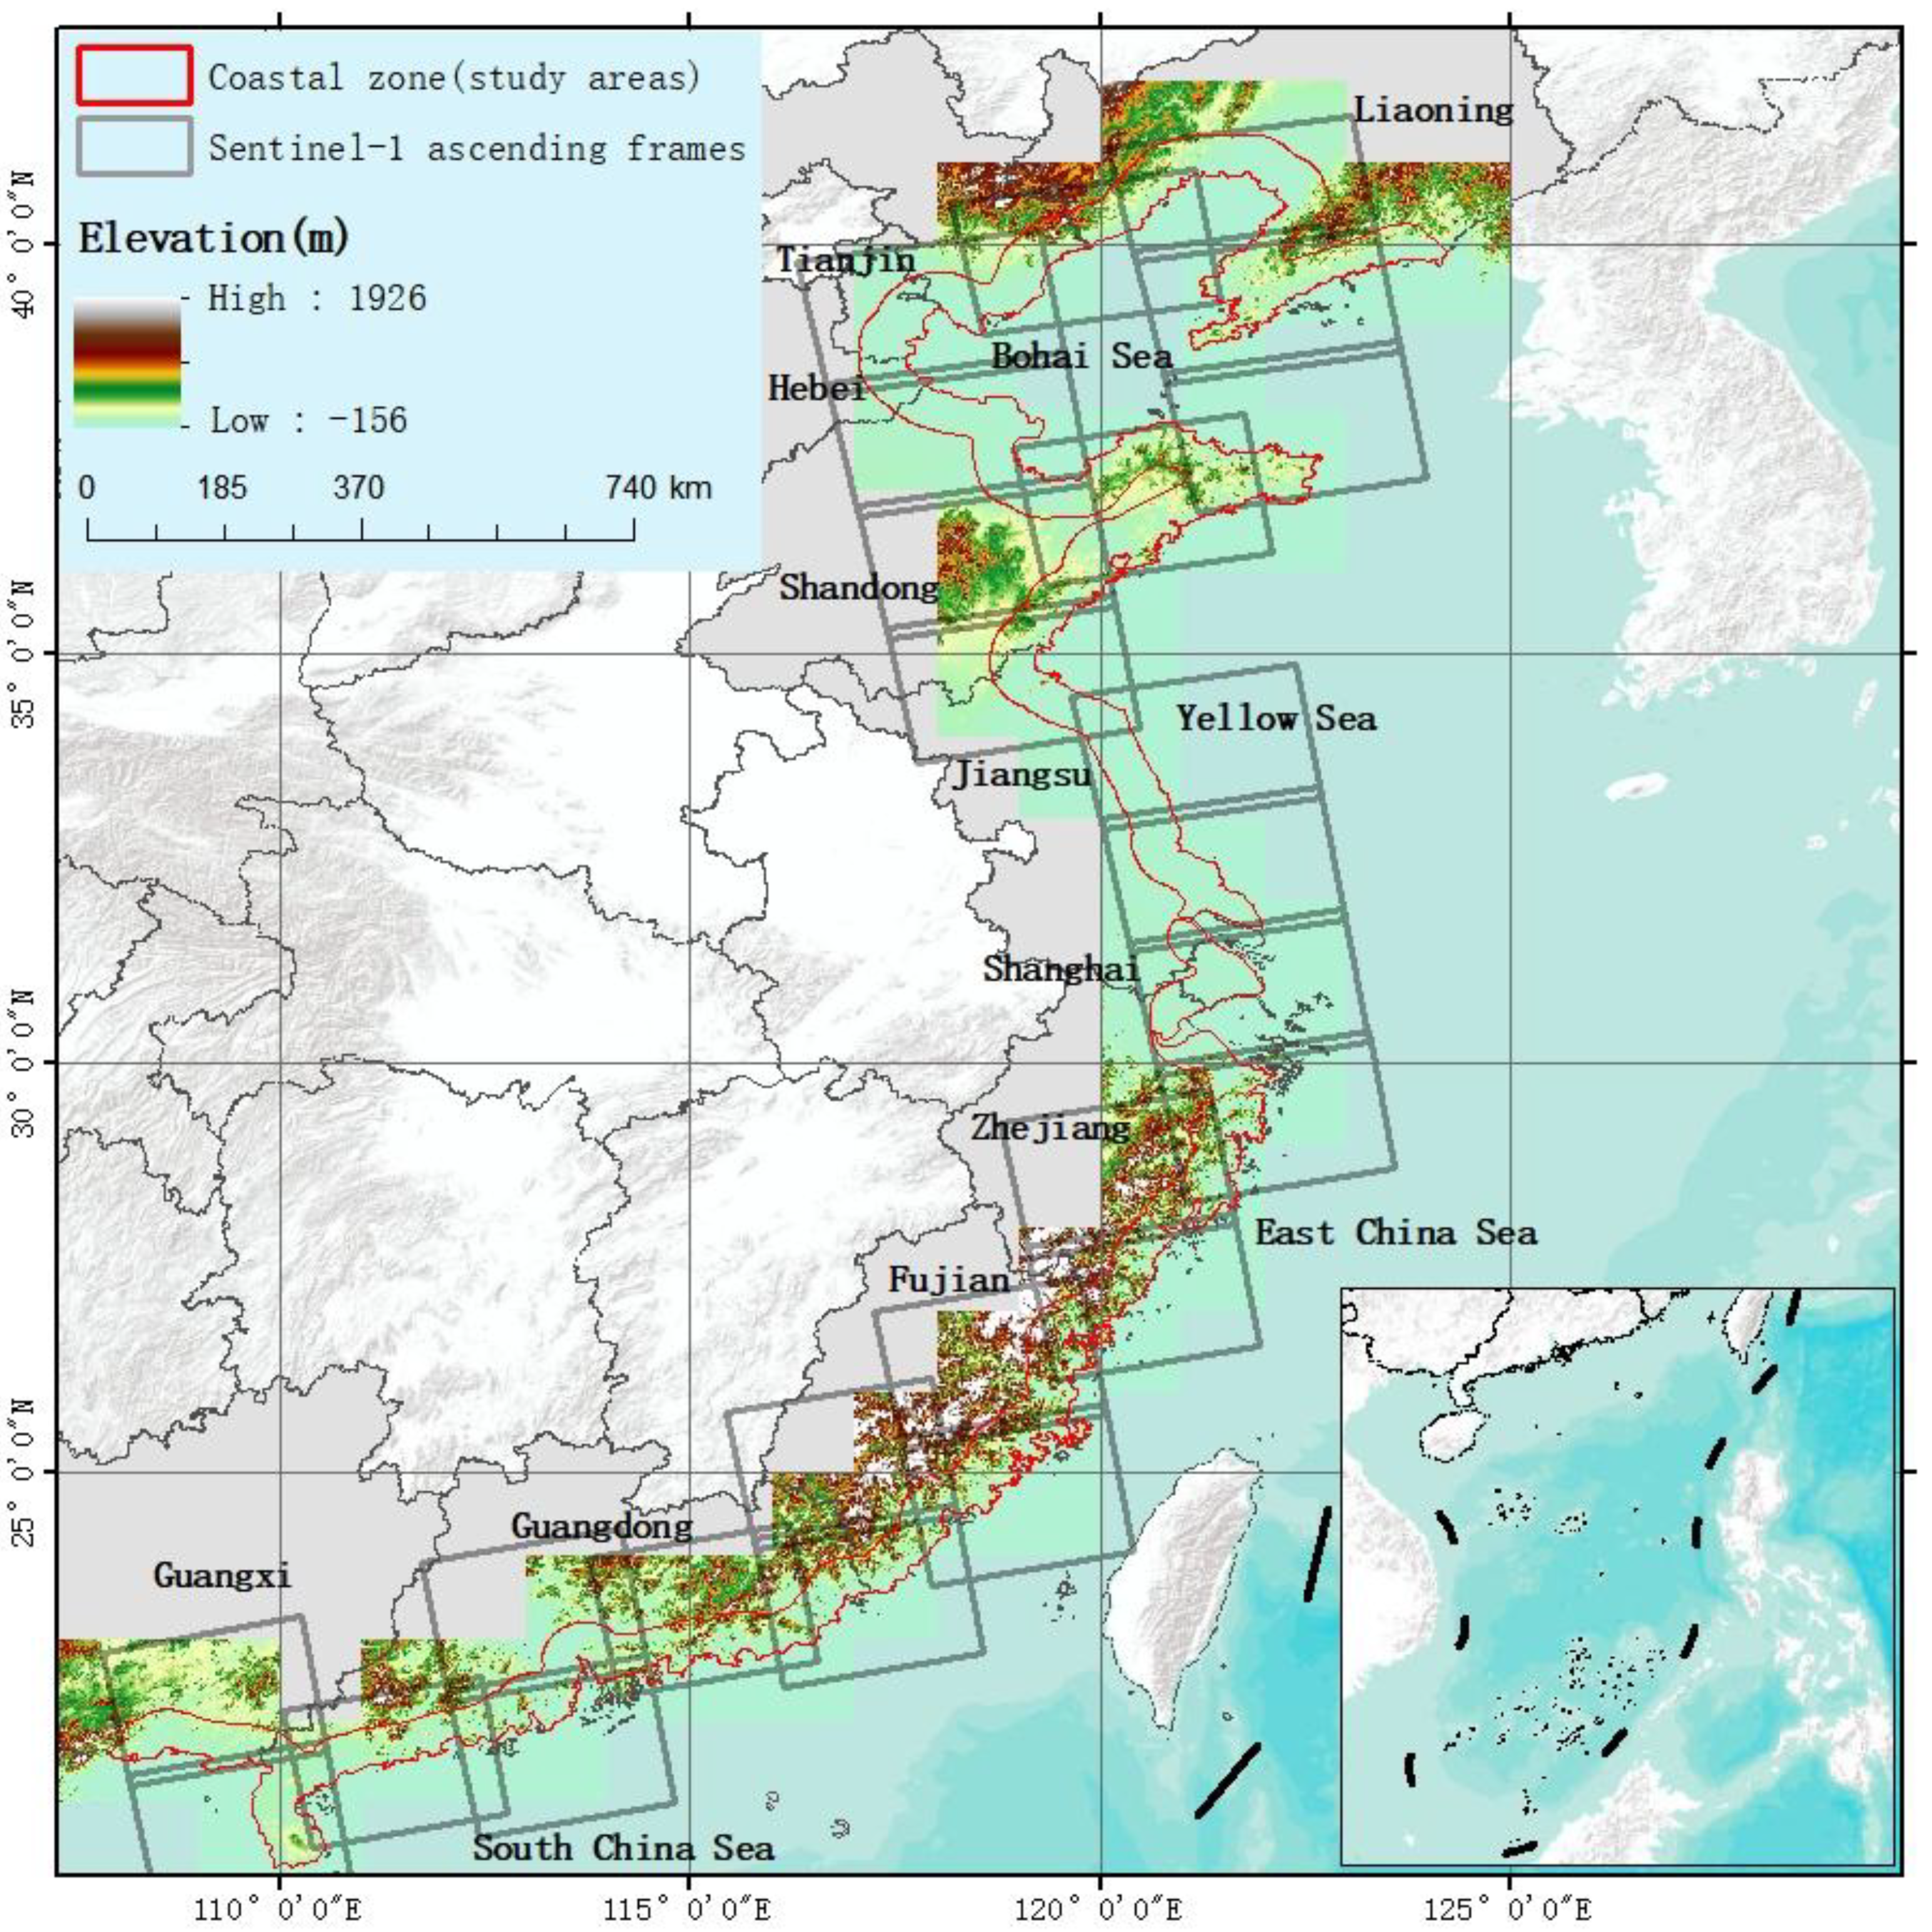
Figure 1. Study area and datasets. The red area indicates the study region; the grey rectangle depicts the Sentinel-1A frame; elevation data are from the SRTM-1 DEM.
Sustainability 17 09592 g001
Figure 2. Overall technical methodology flow.
Sustainability 17 09592 g002
Figure 3. Cross-validation results of subsidence rates derived from PS-InSAR and SBAS-InSAR. (a) SBAS-InSAR subsidence rate; (b) PS-InSAR subsidence rate; (c) Scatter plot of subsidence rates for homonymous monitoring points of PS-SBAS; (d) Histogram of deformation rate.
Sustainability 17 09592 g003
Figure 4. Land subsidence patterns and key subsidence areas along the mainland coastal zone of China in 2023. (a) Annual mean subsidence rate and histogram, A–D correspond to the Laizhou Bay, northern Jiangsu, YRD and PRD subsidence zones, respectively; (b) Mean subsidence rate for coastal districts and counties; (c) Laizhou Bay subsidence zone; (d) Northern Jiangsu subsidence zone; (e) YRD subsidence zone; (f) PRD subsidence zone.
Sustainability 17 09592 g004
Figure 5. Relationship between land subsidence and both soft-soil thickness and groundwater extraction intensity in the PRD. (a) Subsidence rate; (b) distribution of soft-soil thickness [6]; (c) groundwater extraction intensity [6].
Sustainability 17 09592 g005
Figure 6. Relationship between land reclamation and land subsidence in Shanghai. (a) Subsidence rate in Shanghai in 2023; (b) Subsidence rate of Pudong International Airport. R1–R5: runways 1–5; T1–T2: terminals 1–2; (c) Satellite image of Pudong International Airport; (d) Mean velocity of I–V reclamation area. Phases I–V denote Shanghai’s land-reclamation projects from1995 to 2020 [47]: Phase I—Pudong Airport reclamation (1995–2001); Phase II—Lingang New City reclamation (1999–2004); Phase III—Offshore expansion of Pudong Airport (1999–2006); Phase IV—Nanhui East Shoal reclamation (2007–2009); Phase V—Second-stage Nanhui East Shoal reclamation (2016–2020).
Sustainability 17 09592 g006
Figure 7. Proportions of area, population, and GDP within different subsidence-risk zones for the ten coastal provinces of mainland China. (a) Area proportion by risk level for each province; (b) Population proportion by risk level for each province; (c) GDP pro-portion by risk level for each province.
Sustainability 17 09592 g007
Table 1. Sentinel-1A Data Parameters.
ParameterValue
Acquisition periodJanuary 2023–December 2023
Number of scenes666
Number of frames25
Raw data volume3.16 TB
BandC
Wavelength5.6 cm
PolarizationVV
Spatial resolution (range × azimuth)5 m × 20 m
Repeat cycle12 days
Imaging modeIW
Orbit directionAscending
Swath width250 km
Table 2. Mean offset in the overlapping area of adjacent paths.
Reference PathAdjustment Path-FrameMean Offset (mm/yr)
69117–126−0.87
17198–1294.54
69171–116−2.20
17198–119−0.53
69171–106−8.87
17169–898.75
69142–81−4.74
14240–77−6.50
40113–712.05
11311–713.89
1184–65−2.71
84157–625.32
Table 3. Subsidence Rates and Driving Factors in Key Subsidence Areas.
Key Subsidence AreasMean Subsidence RatesDriving FactorsCities
Laizhou Bay−13.31 mm/yrbrine extractionDongying, Weifang
Northern Jiangsu−7.35 mm/yragricultural-water extraction, soft-soil consolidationLianyungang, Yancheng
YRD−5.19 mm/yrdomestic-water extraction, land reclamationShanghai, Taizhou, Wenzhou
PRD−9.95 mm/yrAgricultural and domestic water extraction, soft-soil consolidation, land reclamation, dynamic and static loadZhuhai, Guangzhou, Zhongshan, Jiangmen
Table 4. Classification of Land-Subsidence Severity.
IndicatorLowModerately LowModerateModerately HighHigh
Subsidence rate (mm/yr)>−10−10~−30−30~−50−50~−80<−80
Table 5. Risk Classification Statistics of Land Subsidence in the Coastal Zone of Mainland China.
Risk LevelSubsidence Rate (mm/yr)Area
(km2)
Area ProportionPopulation (×104)GDP (Million CNY)
Low>−10153,295.6176.21%16,815.5928,284.56
Moderately low−10~−3037,658.3018.72%3109.115303.81
Moderate−30~−507712.003.83%303.42618.23
Moderately high−50~−801919.920.95%52.97135.92
High<−80578.530.29%7.4234.91
Disclaimer/Publisher’s Note: The statements, opinions and data contained in all publications are solely those of the individual author(s) and contributor(s) and not of MDPI and/or the editor(s). MDPI and/or the editor(s) disclaim responsibility for any injury to people or property resulting from any ideas, methods, instructions or products referred to in the content.