Abstract
Electric vehicles (EVs) are widely recognized as a critical component of strategies for a more sustainable transportation sector. However, adoption remains uneven across communities, in part due to the concern that limited charging availability and long commutes discourage EV use. This paper evaluates the following two hypotheses: (H1) census tracts with longer average commute durations exhibit lower levels of EV adoption, and (H2) greater availability of local charging infrastructure is associated with higher levels of adoption. Using a cross-sectional dataset of 2024 EV registrations in Washington State merged with census tract demographic characteristics, we estimate ordinary least squares models of per capita adoption. The results show that longer average commutes are negatively associated with adoption, while greater charger density is positively associated with adoption. Demographic factors such as income, education, and race also shape adoption patterns. While the cross-sectional design does not permit causal inference, the analysis highlights how behavioral constraints related to range anxiety and infrastructural provision jointly influence EV uptake, providing evidence to guide more equitable and effective EV policies for sustainable transportation.
1. Introduction
The transportation sector is the largest contributor to greenhouse gas (GHG) emissions in the United States, responsible for 28% of national emissions, with the majority generated by light-duty, mass-market vehicles. Because over 93% of transportation fuel consumption is still petroleum-based, primarily gasoline and diesel, decarbonizing this sector is central to achieving net-zero emissions targets by mid-century [1]. Despite advances in efficiency, transportation-related emissions rose steadily between 1990 and 2019, briefly declining during the COVID-19 pandemic before rebounding to pre-pandemic levels [2]. Expanding the adoption of electric vehicles (EVs) is therefore critical to a more sustainable transportation sector, yet uptake has been uneven across communities, raising questions about the behavioral and infrastructural barriers that shape adoption patterns. This study addresses a key question in this transition: how do commuting time and access to charging infrastructure affect EV adoption? While several states have enacted incentive programs, important uncertainties persist regarding the behavioral and infrastructural barriers that shape who adopts EVs and where adoption occurs.
Electric vehicles (EVs) encompass two primary technologies: battery electric vehicles (BEVs), which operate exclusively on electricity, and plug-in hybrid electric vehicles (PHEVs), which pair a rechargeable battery with an internal combustion engine. BEVs rely entirely on the electric grid for power, while PHEVs can switch to gasoline for longer trips. This study analyzes both markets separately and jointly, allowing for comparisons across technologies. Our analysis draws on data from the Washington State Department of Licensing, which provides detailed records of BEV and PHEV registrations that can be aggregated to the census tract level. These data offer a unique opportunity to examine the geographic and demographic patterns of adoption at a fine-grained spatial scale.
To date, EV adoption has been concentrated among wealthier, highly educated, and urban households [3,4,5,6,7,8,9]. In 2017, for example, more than 70% of BEV sales were made to households earning over $100,000 annually. This skewed distribution raises important equity considerations: while lower-income households spend a larger share of their income on transportation, tend to drive older, higher-polluting vehicles, and stand to benefit the most from reduced operating costs and improved air quality, they remain underrepresented among adopters [3,9,10]. Understanding the drivers of these disparities is essential for designing policies that can expand access to EVs and ensure that the benefits of electrification are more equitably distributed.
A central behavioral barrier to EV adoption is range anxiety, the concern that a vehicle’s battery will be depleted before reaching a charging point. Research identifies a wide set of factors that shape range anxiety, ranging from psychological characteristics and prior familiarity with BEVs to technical features such as battery management systems, charging infrastructure, and vehicle interface design [11,12,13,14,15,16,17,18,19]. Survey-based studies further show that range anxiety increases during long-distance journeys and in congested traffic, conditions that heighten uncertainty about battery depletion and charging access [20,21]. Although modern BEVs now exceed 200 miles of range, drivers’ perceptions of range continue to shape adoption decisions. Range anxiety persists even when actual range is ample because it reflects uncertainty and perceived risk. In this sense, range anxiety presents a behavioral risk perception barrier, not an engineering one. People base decisions on how secure they feel about completing their routine trips, not on the objective capabilities of the vehicle [11,12,13,14,20,21].
In sum, research consistently finds that range anxiety is closely tied to the vehicle’s remaining state of charge, particularly when the remaining charge is perceived as insufficient to complete a planned trip [11,22,23,24,25]. Because lower charge levels effectively limit driving distance, range anxiety is inherently linked to trip length. Longer commutes, in particular, are more likely to push vehicles toward these lower charge levels and amplify concerns about battery depletion. This study builds on that insight by using average commute time as a proxy for range anxiety at the census tract level. If adoption rates are lower in blocks with longer commutes, holding other factors constant, this would indicate that range anxiety is an important factor shaping consumer decisions to purchase an EV.
The relationship between EV adoption and charging infrastructure is complex. In some cases, infrastructure expands primarily in response to increased adoption, creating a “chicken-and-egg” problem in which consumers hesitate to adopt EVs due to insufficient charging options, while investors and utilities delay deployment until adoption rises [9,26]. Other studies, however, demonstrate that charging availability itself can play a decisive role in accelerating adoption. Li et al. [27] find that subsidies for public charging stations may be more effective at stimulating EV uptake than direct purchase incentives, underscoring the importance of infrastructure in lowering perceived barriers to entry. At the same time, evidence suggests that deployment has often been inefficient; some charging stations remain underused, while others experience consistently high demand and insufficient capacity [28]. These patterns highlight the need to not only expand charging networks but also to optimize their placement to align with driving patterns and mitigate RA.
Equity concerns further complicate efforts to accelerate EV adoption. Higher-income households have disproportionately captured subsidies: in 2016, nearly four-fifths of federal tax credits went to households earning over $100,000, while in California, rebates were concentrated in the wealthiest census tracts [29]. Yet, lower-income households spend more of their income on transportation, rely on older and higher-polluting vehicles, and would benefit most from fuel savings and improved air quality [3,9,10]. Despite these stakes, they remain underrepresented among EV adopters.
This study advances the literature in two distinct ways. First, it introduces a novel conceptual approach by using average commute time as a proxy for range anxiety, linking behavioral constraints to observable, community-level outcomes. Second, it leverages detailed census-tract registration data from Washington State to examine the joint association of length of commute and charging infrastructure availability with adoption patterns. Based on this framework, the paper evaluates two hypotheses: (H1) census tracts with longer average commute durations exhibit lower levels of EV adoption, and (H2) greater availability of local charging infrastructure is associated with higher levels of EV adoption. In doing so, the paper highlights not only the role of infrastructure and policy in shaping markets, but also the behavioral constraints that must be addressed to ensure a more equitable transition to sustainable transportation.
2. Materials and Methods
2.1. Data and Units of Observation
We assemble a cross-sectional dataset for 2024 at the census-block level in Washington State. Vehicle registration data come from administrative EV registration records provided by the Washington State Department of Licensing. These data are merged with tract-level demographic and commuting information from the American Community Survey (ACS 5-year estimates). Data on public charging infrastructure were sourced from the U.S. Department of Energy’s Alternative Fuels Data Center, which provides information on station opening dates, geographic coordinates, and charging capacity. The unit of observation is census tract i.
Census tracts are small, relatively permanent statistical subdivisions of a county defined by the U.S. Census Bureau. They typically contain between 2500 and 8000 residents and are designed to be relatively homogeneous in terms of population characteristics, economic status, and living conditions. Their geographic resolution makes them especially valuable for this study, as they allow analysts to capture localized variation in demographics, socioeconomic conditions, and commuting patterns that would be obscured in county- or state-level data. By working at the tract level, this study can more precisely identify how local community characteristics shape electric vehicle adoption.
2.2. Key Explanatory Variables
The primary explanatory variables are average commute duration and charging infrastructure availability. Average one-way commute time at the tract level is taken from the ACS 5-year estimates. Charging infrastructure is measured as the number of publicly available charging points per 1000 residents.
2.3. Covariates
To account for demographic and built-environment factors that influence EV adoption, we include a set of tract-level controls commonly used in prior cross-sectional studies [8,30,31,32]. These covariates include median household income, the share of adults with a bachelor’s degree or higher, population density, renter share (as a proxy for access to off-street or home charging), median age, and racial makeup.
Summary statistics of the variables used in the analysis are presented in Table 1. The table reports means, standard deviations, and ranges for all census tract–level variables.

Table 1.
Summary statistics for cross-sectional 2024 data at the census-tract level in Washington State.
The purpose of our analysis is to evaluate two hypotheses: (H1) census tracts with longer average commute durations exhibit lower levels of EV adoption, and (H2) greater availability of local charging infrastructure is associated with higher levels of EV adoption. To assess whether commuting distance and charging infrastructure are associated with electric vehicle adoption, we estimate a series of OLS regressions using 2024 registration data at the census tract level. The dependent variable is EV density, defined as registrations per 1000 residents, and measured three ways: (1) battery electric vehicle (BEV) density (BEVs per 1000 residents), (2) plug-in hybrid (PHEV) density (PHEVs per 1000 residents), and (3) combined EV density (BEVs + PHEVs per 1000 residents).
2.4. Empirical Strategy
The baseline model specification for the cross-sectional analysis is given by Equation (1):
EV Densityi = β0 + β1(Avg Commute Timei) + β2(Charger Densityi)
+ β3(NewChargers2023,i) + β4 log(Incomei)
+ β5Xi + εi
+ β3(NewChargers2023,i) + β4 log(Incomei)
+ β5Xi + εi
In Equation (1), EV Densityi denotes the number of electric vehicle registrations per 1000 residents in census tract i. Avg Commute Timei measures the average commute time in hours, while Charger Densityi captures the number of public charging points per 1000 residents. NewChargers2023, i refers to the number of new public chargers installed during 2023. The variable log(Incomei) is the natural logarithm of median household income, and the vector Xi represents additional demographic controls, including education levels, population density, and racial composition. Finally, εi is the error term capturing unobserved tract-level variation.
The coefficients of interest correspond directly to the stated hypotheses. For Hypothesis 1, the key parameter is β1, which measures the association between commute time and EV adoption. The null hypothesis (H0) is that commute time is unrelated to EV adoption (β1 = 0). For Hypothesis 2, the key parameter is β2, which measures the association between charger density and EV adoption. The null hypothesis (H0) is that charger density is unrelated to EV adoption (β2 = 0). Rejecting either null provides support for the corresponding hypothesis (H1 or H2).
This specification enables an assessment of how commuting behavior, infrastructure availability, and local socioeconomic characteristics are related to EV uptake at the census- tract level. While the design does not permit causal inference, it provides detailed evidence on the correlates of EV adoption, highlighting both behavioral and infrastructural factors that shape ownership patterns.
EV density, charging density, and commute times in 2024 display marked spatial heterogeneity across Washington census tracts, as illustrated in the heat maps below. In each figure, darker shading reflects higher tract-level values of the respective variable. While all tracts exhibit a positive level of EV density, public charging infrastructure is absent in a nontrivial share of the sample. Commute durations also vary substantially, with a statewide average of 0.436 h (approximately 26 min) and tract-level means ranging from as little as 4 min to nearly an hour (Table 1).
Figure 1 illustrates the geographic distribution of EV adoption across Washington State and in the Seatac region, with darker tracts indicating higher registrations per 1000 residents. Figure 2 shows the density of publicly available charging stations, highlighting that while some areas have dense infrastructure, others—particularly rural tracts—have few or no chargers. Finally, Figure 3 presents average commute times, which vary across tracts and provide a proxy for range-related concerns. Together, these maps underscore the spatial heterogeneity in adoption, infrastructure, and commuting behavior that motivates the tract-level analysis.
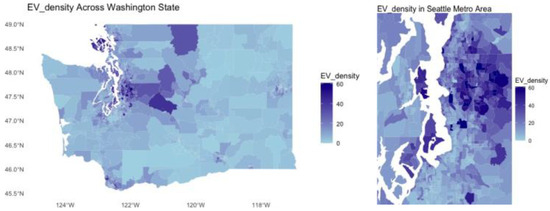
Figure 1.
EV density across Washington State (left) and zoomed in on the Seatac area (right). Darker shading indicates higher tract-level EV registrations per 1000 residents. Data sourced from the Washington State Department of Licensing.
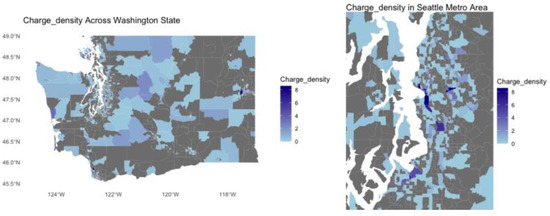
Figure 2.
Public charging density across Washington State (left) and Seatac area (right). Darker shading indicates higher numbers of public chargers per 1000 residents. Data sourced from the U.S. DOE Alternative Fuels Data Center.
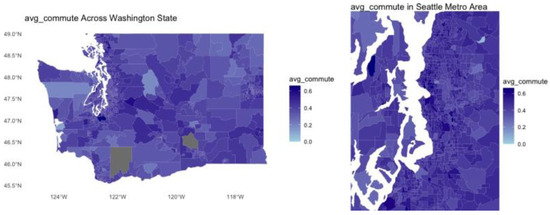
Figure 3.
Average commute time across Washington State (left) and Seatac area (right). Darker shading indicates longer average commute times (hours). Data sourced from the 2020 ACS5.
This spatial heterogeneity provides the empirical leverage for the cross-sectional analysis. Differences in commute duration, charging availability, and EV density across tracts form the basis for identifying associations between behavioral and infrastructural factors and EV adoption. By exploiting within-state variation at the tract level, the analysis offers a fine-grained assessment of how commuting patterns, infrastructure robustness, and local socioeconomic characteristics are associated with EV adoption patterns.
Cross-sectional analysis has been widely used in the EV adoption literature, under- scoring its value despite inherent limitations. Studies at the country level [30,33,34,35], state level [8,31], and city level [32,36,37] have all relied on single-year, cross-sectional data to examine demographic, geographic, and infrastructural influences on EV demand. While such approaches cannot disentangle causal pathways, they remain an important tool for identifying systematic patterns in adoption and for generating hypotheses to be tested with longitudinal or quasi-experimental methods in future research.
All statistical analyses and visualizations were conducted in R. Model estimation employed ordinary least squares (OLS) regressions implemented with the lm() function, and all data cleaning and manipulation were performed using the tidyverse suite of packages. Spatial data processing and mapping were carried out using the sf and ggplot2 packages. These tools ensure full reproducibility of the results and figures presented in this study.
3. Results
Table 2 reports our cross-sectional regression estimates of BEV density, PHEV density, and combined EV density at the census tract level for Washington State in 2024. Table 3 presents the same specifications estimated with robust standard errors to account for heteroskedasticity.
Table 2.
Baseline OLS Results (Census Tract, Washington 2024).
Table 3.
OLS Results with Robust Standard Errors (Census Tract, Washington 2024).
3.1. Baseline Results
The baseline estimates are reported in Table 2. In all estimations, the null hypothesis (β1 = 0) associated with H1 is rejected, as is the null hypothesis (β2 = 0) associated with H2. Consistent with H1, census tracts with longer average commutes exhibit significantly lower EV adoption, indicating that range-related concerns remain a barrier to widespread uptake. In line with H2, charger density is positively associated with EV adoption, underscoring the importance of an established local charging network. By contrast, recently installed chargers show a significant and negative association with BEV adoption, but the effect is minimal, suggesting that infrastructure expansion may take time to influence local adoption. Charger density is positively associated with all three dependent variables, but the magnitude of the effect is greatest for BEVs, consistent with the expectation that charging availability is more relevant for households reliant on all-electric vehicles. Average commute time is strongly negative and significant for BEVs, but the coefficient is smaller and not robustly significant for PHEVs, reinforcing the interpretation that range-related concerns primarily influence BEV adoption.
Among the demographic covariates, income, education, and median age are each positively associated with EV density, with effects concentrated in the BEV market. The coefficient on log(income) is 11.50 for BEV density, compared to 1.96 for PHEV density, indicating that income plays a substantially larger role in predicting BEV adoption. Similarly, the share of adults with education beyond high school is strongly associated with increased BEV adoption and less so with PHEV adoption.
A Breusch–Pagan test was conducted to test whether heteroskedasticity affects the results. For all three models (BEV, PHEV, and combined EV density), the null hypothesis of homoskedasticity is rejected at the 1 percent level, indicating the presence of heteroskedasticity in the residuals. This result suggests that baseline OLS estimates may have underestimated the true variability of the coefficients, motivating the use of robust standard errors.
3.2. Robust Standard Errors
The results with robust standard errors are presented in Table 3. The main findings remain consistent: income, education, and charger density are strongly positively correlated with EV adoption, while average commute time is significantly negative for BEVs and combined EVs. The precision of some estimates, however, is reduced. For example, the coefficient on charger density remains positive and significant across specifications; though the standard errors are larger, particularly for BEVs and combined EVs. The negative coefficient on commute time for BEVs remains highly significant, strengthening the conclusion that longer commutes are associated with lower BEV adoption. In contrast, commute time loses significance in the PHEV model, reinforcing the expectation that range-related concerns are less relevant for hybrid drivers with gasoline backup engines. Finally, the negative coefficient on new chargers in 2023 persists for BEVs and combined EVs, though the effect remains small, indicating that it may take time for new chargers to influence local adoption.
4. Robustness Checks
To assess the stability of our baseline estimates, we conduct two main robustness checks. First, we re-estimate the models after trimming the sample by dropping the top and bottom 5 percent of tracts for each dependent variable. This procedure reduces the influence of extreme values, which could otherwise disproportionately drive coefficient estimates. Second, we exclude all census tracts in King County, Washington. As the state’s most populous and economically unique county, King County could bias statewide estimates if its EV adoption patterns are not representative of the rest of the state. Together, these checks ensure that our findings are not artifacts of outliers or a single influential county.
Results of both robustness checks are presented in Table 4. The table reports estimates from the truncated regressions, which exclude the top and bottom 5% of tracts by the dependent variable, alongside results from models estimated without tracts located in King County.
Table 4.
Robustness Checks: Truncated sample vs. Excluding King County (Census Tract, Washington 2024).
The results, reported with robust standard errors, confirm the robustness of our main findings. Across both specifications, the signs and statistical significance of key covariates, including income, commute time, and charger density, remain consistent with the baseline regressions. Higher income, older median age, higher education, and greater charger density are all positively associated with BEV adoption, while longer commute times continue to show a negative relationship. The only notable departure concerns the coefficient on newly installed chargers, which loses significance under the robustness checks. This suggests that the short-run effect of charger deployment is less stable than the longer-run relationship between overall charger density and adoption. Overall, these results provide strong evidence that our baseline conclusions are not driven by outliers or by King County specifically. (As an additional robustness check, we performed a nonparametric bootstrap of our main regression. The results are similar to the OLS estimates with the bootstrap confidence intervals closely matching the robust standard errors, and the key coefficients remain consistent in sign and significance across BEV and EV models. These regression results are available upon request).
These robustness exercises underscore the stability of the main behavioral and infrastructural relationships identified in the study. The consistency of results across specifications strengthens confidence in the interpretation that range-related concerns, captured by commute duration, remain a meaningful barrier to BEV adoption, while established local charging networks continue to support broader diffusion.
5. Discussion
The results of the cross-sectional analysis provide evidence that average commuting time is an important factor in local EV adoption. Census tracts with longer average commutes exhibit significantly lower rates of BEV adoption, even after accounting for income, education, and other demographic factors. This finding suggests that households with longer travel requirements may perceive EVs as less reliable substitutes for internal combustion vehicles, either because of concerns about limited range or unfamiliarity with the technology. These results are consistent with previous studies showing that range anxiety increases with both time and distance traveled [22,24]. Our analysis demonstrates that range anxiety remains a barrier to adoption, particularly for BEVs, despite the fact that current models typically offer ranges well above the average daily commute.
The role of charging infrastructure is also important, though nuanced. The existing local stock of public chargers is consistently and positively associated with higher EV adoption, with stronger effects observed for BEVs than for PHEVs. This finding aligns with the expectation that visible and accessible charging infrastructure reduces perceived risks of battery depletion and supports wider adoption, particularly for drivers entirely reliant on electric motors. However, the effect of recently added chargers is less clear. Adoption responses may lag as households become more familiar with the expanded network, or chargers may serve a broader geographic catchment area not captured in tract-level measures.
We also tested the robustness of our results using two alternative specifications: a truncated regression that excluded the top and bottom 5 percent of tracts by EV adoption, and a re-estimation of the models with King County removed from the sample. Across both exercises, the relationships between income, average commute time, and charger density remained stable and statistically significant in the same directions as in the baseline models. This reinforces our conclusion that longer commute times are associated with lower EV adoption while higher income and greater charger density are associated with higher levels of adoption. The main departure from the baseline concerns the variable for newly installed chargers, which loses significance under both robustness checks. This suggests that the immediate impact of charger additions is less robust than the broader effect of accumulated charger density. Taken together, these findings underscore that the core results are not sensitive to outliers or to King County’s influence, and they highlight that the benefits of charger expansion may materialize only over longer time horizons.
To further assess the stability of the results, we performed a nonparametric bootstrap with 1000 replications for each specification, resampling tracts and re-estimating the models. The bootstrapped confidence intervals were nearly identical to the robust standard errors, and the signs and magnitudes of the key coefficients remained largely unchanged. These results confirm that the findings are not sensitive to sampling variability or model noise. Full bootstrap results are available upon request.
Socioeconomic characteristics further shape EV adoption. Across specifications, higher income and greater educational attainment are consistently associated with higher EV density, echoing findings in prior research [3,5,8,38,39]. This concentration raises important equity concerns, particularly if longer commutes are disproportionately correlated with communities already facing barriers to EV adoption. Policy interventions could help close these gaps by targeting incentives toward lower-income households, such as expanding point-of-sale rebates, subsidizing used EV markets, or supporting financing mechanisms that reduce upfront costs.
Taken together, these findings underscore the persistence of both behavioral and infrastructural barriers in EV markets. While established charging infrastructure supports adoption, consumers facing longer commutes or living in areas without visible and reliable charging options remain less likely to adopt BEVs. This suggests that policies aimed solely at rapid charger deployment may not yield immediate localized impacts. Instead, infrastructure expansion should be complemented by measures that directly address behavioral barriers, such as public information campaigns, programs that emphasize the reliability of modern EV ranges, and initiatives that increase the visibility of charging networks in everyday settings (e.g., retail centers, workplaces). Strategic siting that prioritizes both high-traffic corridors and underserved neighborhoods may also help reduce perceived range risks more effectively than diffuse deployment alone.
Future research can build on these findings by exploring several dimensions of EV adoption not captured in this analysis. First, spillover effects deserve greater attention, as new chargers are likely to benefit drivers beyond the census tract in which they are installed. Second, behavioral responses to the visibility and reliability of charging stations remain critical to optimal infrastructure planning. Third, the equity implications of commuting distance warrant further study, particularly if longer commutes are correlated with disadvantaged communities. Finally, future work should incorporate measures of home charging access, since the availability of private charging at single-family homes likely reduces reliance on public infrastructure, while renters and residents of multi-family housing may remain more dependent on public charging networks. While we attempted to control for this by including renter share in our analysis, more detailed analysis is necessary to fully understand the impact of at-home charging access.
Limitations
Several limitations of this analysis warrant discussion. First, the study is based on cross-sectional data from a single year, which restricts the ability to draw causal inferences. The relationships we document between EV density, commute time, and charging infrastructure should therefore be interpreted as static relationships rather than causal effects. This design also raises the possibility of omitted variable bias, as unobserved factors such as local policy efforts, cultural attitudes toward technology, or differences in utility rate structures may influence both EV adoption and infrastructure deployment. While the inclusion of socioeconomic and demographic covariates helps mitigate this concern, it cannot be ruled out entirely.
Second, a cross-sectional design does not capture temporal dynamics in adoption or infrastructure rollout. EV uptake is an inherently dynamic process, influenced by evolving technology, changing consumer preferences, and shifting policy incentives. Our analysis cannot fully account for lagged responses to charger deployment, path dependence in adoption, or learning effects that accumulate with greater exposure to EVs. In addition, the analysis is limited to Washington State, which restricts the generalizability of the findings to regions with different policy environments, energy markets, or geographic constraints. Finally, the tract-level measures used here cannot fully capture within-tract heterogeneity in access to chargers or differences in household travel behavior. These limitations underscore the need for future work, using longitudinal or quasi-experimental designs to better identify causal mechanisms and to assess how behavioral and infrastructural factors interact over time to shape EV adoption. Finally, while the results have implications for equity in EV adoption, they should not be interpreted as direct measures of distributional outcomes. The associations between income, charging access, commute time, and education indicate potential disparities in access, but the analysis is not designed to assign causation to them. Future work should build on this by incorporating subgroup regressions, inequality indices, or quantile approaches to explicitly examine how EV adoption varies across demographic and economic strata.
6. Conclusions
This study examined how commuting time and access to charging infrastructure influence electric vehicle adoption at the census-tract level in Washington State. Using cross-sectional data from 2024, we find that longer average commute times are associated with lower rates of BEV adoption, consistent with the idea that range-related concerns remain a barrier to uptake. Conversely, charger density is positively correlated with adoption, suggesting that established local charging networks support diffusion, while the short-run impact of newly installed chargers appears more limited. Demographic characteristics such as income and education further shape adoption patterns, with the strongest effects observed in the BEV market.
These findings underscore the importance of addressing both behavioral and infrastructural barriers in the transition to sustainable transportation. Policies that expand equitable access to charging infrastructure, reduce concerns about vehicle range and reliability, and target communities with longer commute times may help accelerate adoption. Although the analysis is limited to a single year, it provides new, geographically granular evidence on characteristics that can inform policy design. Future research should investigate the longer-term impacts of charger deployment, potential spillover effects across communities, and the role of home charging availability. Together, such efforts can provide a clearer roadmap for policies that make EV adoption both faster and more equitable, strengthening the contribution of EVs to sustainable transportation.
Author Contributions
Conceptualization, T.G. and E.B.B.; methodology, T.G. and E.B.B.; formal analysis, T.G.; resources, T.G. and E.B.B.; data curation, T.G.; writing—original draft preparation, T.G.; writing—review and editing, E.B.B.; visualization, T.G. and E.B.B.; supervision, E.B.B. All authors have read and agreed to the published version of the manuscript.
Funding
This research received no external funding.
Institutional Review Board Statement
Not applicable.
Informed Consent Statement
Not applicable.
Data Availability Statement
Data available upon request.
Conflicts of Interest
The authors declare no conflicts of interest.
References
- U.S. Environmental Protection Agency. Carbon Pollution from Transportation. Optional additional information. Available online: https://www.epa.gov/transportation-air-pollution-and-climate-change/carbon-pollution-transportation (accessed on 27 August 2025).
- U.S. Department of Energy. FOTW #1250, August 8, 2022: U.S. 12-Month Vehicle Travel for March 2022 Matched the December 2019 Total, 2022. Optional Additional Information. Available online: https://www.energy.gov/eere/vehicles/articles/fotw-1250-august-8-2022-us-12-month-vehicle-travel-march-2022-matched (accessed on 20 August 2025).
- Sheldon, T.L.; Dua, R. Assessing the effectiveness of California’s “Replace Your Ride”. Energy Policy 2019, 132, 318–323. [Google Scholar] [CrossRef]
- Archsmith, J.; Kendall, A.; Rapson, D. From Cradle to Junkyard: Assessing the Life Cycle Greenhouse Gas Benefits of Electric Vehicles. Res. Transp. Econ. 2015, 52, 72–90. [Google Scholar] [CrossRef]
- Roberson, L.; Helveston, J.P. Not all subsidies are equal: Measuring preferences for electric vehicle financial incentives. Environ. Res. Lett. 2022, 17, 084003. [Google Scholar] [CrossRef]
- Singh, V.; Singh, V.; Vaibhav, S. A review and simple meta-analysis of factors influencing adoption of electric vehicles. Transp. Res. Part D Transp. Environ. 2020, 86, 102436. [Google Scholar] [CrossRef]
- Varghese, A.M.; Menon, N.; Ermagun, A. Equitable distribution of electric vehicle charging infrastructure: A systematic review. Renew. Sustain. Energy Rev. 2024, 206, 114825. [Google Scholar] [CrossRef]
- Archsmith, J.; Muehlegger, E.; Rapson, D.S. Future paths of electric vehicle adoption in the United States: Predictable determinants, obstacles, and opportunities. Environ. Energy Policy Econ. 2022, 3, 71–110. [Google Scholar] [CrossRef]
- Sheldon, T.L. Evaluating electric vehicle policy effectiveness and equity. Annu. Rev. Resour. Econ. 2022, 14, 669–688. [Google Scholar] [CrossRef]
- Bauer, G.; Hsu, C.W.; Lutsey, N. When might lower-income drivers benefit from electric vehicles? Quantifying the economic equity implications of electric vehicle adoption. Work. Pap. 2021, 6, 1–21. [Google Scholar]
- Franke, T.; Neumann, I.; Bühler, F.; Cocron, P.; Krems, J.F. Experiencing range in an electric vehicle: Understanding psychological barriers. Appl. Psychol. 2012, 61, 368–391. [Google Scholar] [CrossRef]
- Melliger, M.A.; van Vliet, O.P.; Liimatainen, H. Anxiety vs. reality–Sufficiency of battery electric vehicle range in Switzerland and Finland. Transp. Res. Part D Transp. Environ. 2018, 65, 101–115. [Google Scholar] [CrossRef]
- Noel, L.; De Rubens, G.Z.; Sovacool, B.K.; Kester, J. Fear and loathing of electric vehicles: The reactionary rhetoric of range anxiety. Energy Res. Soc. Sci. 2019, 48, 96–107. [Google Scholar] [CrossRef]
- Rainieri, G.; Buizza, C.; Ghilardi, A. The psychological, human factors and socio-technical contribution: A systematic review towards range anxiety of battery electric vehicles’ drivers. Transp. Res. Part F Traffic Psychol. Behav. 2023, 99, 52–70. [Google Scholar] [CrossRef]
- Bedogni, L.; Bononi, L.; D’Elia, A.; Di Felice, M.; Di Nicola, M.; Cinotti, T.S. Driving without anxiety: A route planner service with range prediction for the electric vehicles. In Proceedings of the 2014 International Conference on Connected Vehicles and Expo (ICCVE), Vienna, Austria, 3–7 November 2014; pp. 199–206. [Google Scholar]
- Rauh, N.; Franke, T.; Krems, J.F. Understanding the impact of electric vehicle driving experience on range anxiety. Hum. Factors 2015, 57, 177–187. [Google Scholar] [CrossRef]
- Rauh, N.; Günther, M.; Krems, J.F. Positive influence of practical electric vehicle driving experience and range related knowledge on drivers’ experienced range stress. Transp. Res. Part F Traffic Psychol. Behav. 2020, 71, 182–197. [Google Scholar] [CrossRef]
- Bonges III, H.A.; Lusk, A.C. Addressing electric vehicle (EV) sales and range anxiety through parking layout, policy and regulation. Transp. Res. Part A Policy Pract. 2016, 83, 63–73. [Google Scholar] [CrossRef]
- Kester, J.; Sovacool, B.K.; Noel, L.; de Rubens, G.Z. Between hope, hype, and hell: Electric mobility and the interplay of fear and desire in sustainability transitions. Environ. Innov. Soc. Transit. 2020, 35, 88–102. [Google Scholar] [CrossRef]
- Zatsarnaja, J.; Reiter, K.; Mehdizadeh, M.; Nayum, A.; Nordfjaern, T. Charged up with peace in mind: Unraveling the factors of range anxiety among norwegian electric vehicle drivers. Transp. Res. Part F Traffic Psychol. Behav. 2025, 110, 15–28. [Google Scholar] [CrossRef]
- Wang, J.; Huang, C.; He, D.; Tu, R. Range anxiety among battery electric vehicle users: Both distance and waiting time matter. In Proceedings of the Human Factors and Ergonomics Society Annual Meeting, Washington, DC, USA, 23–27 October 2023; SAGE Publications Sage CA: Los Angeles, CA, USA, 2023; Volume 67, pp. 1309–1315. [Google Scholar]
- Liu, H.; Li, Y.; Zhang, C.; Li, J.; Li, X.; Zhao, Y. Electric vehicle charging station location model considering charging choice behavior and range anxiety. Sustainability 2022, 14, 4213. [Google Scholar] [CrossRef]
- Xu, M.; Meng, Q.; Liu, K.; Yamamoto, T. Joint charging mode and location choice model for battery electric vehicle users. Transp. Res. Part B Methodol. 2017, 103, 68–86. [Google Scholar] [CrossRef]
- Xu, M.; Yang, H.; Wang, S. Mitigate the range anxiety: Siting battery charging stations for electric vehicle drivers. Transp. Res. Part C Emerg. Technol. 2020, 114, 164–188. [Google Scholar] [CrossRef]
- Yang, Y.; Yao, E.; Yang, Z.; Zhang, R. Modeling the charging and route choice behavior of BEV drivers. Transp. Res. Part C Emerg. Technol. 2016, 65, 190–204. [Google Scholar] [CrossRef]
- Hardman, S. Understanding the impact of reoccurring and non-financial incentives on plug-in electric vehicle adoption—A review. Transp. Res. Part A Policy Pract. 2019, 119, 1–14. [Google Scholar] [CrossRef]
- Li, S.; Tong, L.; Xing, J.; Zhou, Y. The Market for Electric Vehicles: Indirect Network Effects and Policy Design. J. Assoc. Environ. Resour. Econ. 2017, 4, 89–133. [Google Scholar] [CrossRef]
- Smart, J.G.; Salisbury, S.D. Plugged in: How Americans Charge Their Electric Vehicles; Technical Report; Idaho National Lab. (INL): Idaho Falls, ID, USA, 2015. [Google Scholar]
- Guo, S.; Kontou, E. Disparities and equity issues in electric vehicles rebate allocation. Energy Policy 2021, 154, 112291. [Google Scholar] [CrossRef]
- Sierzchula, W.; Bakker, S.; Maat, K.; Van Wee, B. The influence of financial incentives and other socio-economic factors on electric vehicle adoption. Energy Policy 2014, 68, 183–194. [Google Scholar] [CrossRef]
- Vergis, S.; Chen, B. Comparison of plug-in electric vehicle adoption in the United States: A state by state approach. Res. Transp. Econ. 2015, 52, 56–64. [Google Scholar] [CrossRef]
- Hall, D.; Lutsey, N. Global assessment of charging infrastructure deployment. In Proceedings of the EVS30 Symposium. International Battery, Hybrid and Fuel Cell Electric Vehicle Symposium, Stuttgart, Germany, 9–11 October 2017. [Google Scholar]
- Plötz, P.; Gnann, T.; Sprei, F. Can policy measures foster plug-in electric vehicle market diffusion. World Electr. Veh. J. 2016, 8, 789–797. [Google Scholar] [CrossRef]
- Plötz, P.; Gnann, T.; Sprei, F. What are the effects of incentives on plug-in electric vehicle sales in Europe. ECEEE Summer Study Proc. 2017, 799–805. Available online: https://www.eceee.org/library/conference_proceedings/eceee_Summer_Studies/2017/4-mobility-transport-and-smart-and-sustainable-cities/what-are-the-effects-of-incentives-on-plug-in-electric-vehicle-sales-in-europe/ (accessed on 20 August 2025).
- Lieven, T. Policy measures to promote electric mobility–A global perspective. Transp. Res. Part A Policy Pract. 2015, 82, 78–93. [Google Scholar] [CrossRef]
- Wang, N.; Pan, H.; Zheng, W. Assessment of the incentives on electric vehicle promotion in China. Transp. Res. Part A Policy Pract. 2017, 101, 177–189. [Google Scholar] [CrossRef]
- Slowik, P.; Lutsey, N. What is driving the US electric vehicle market. In Proceedings of the EVS30 Symposium. International Battery, Hybrid and Fuel Cell Electric Vehicle Symposium, Stuttgart, Germany, 9–11 October 2017. [Google Scholar]
- DeShazo, J.R.; Sheldon, T.L.; Carson, R.T. Designing policy incentives for cleaner technologies: Lessons from California’s plug-in electric vehicle rebate program. J. Environ. Econ. Manag. 2017, 84, 18–43. [Google Scholar] [CrossRef]
- Münzel, C.; Plötz, P.; Sprei, F.; Gnann, T. How large is the effect of financial incentives on electric vehicle sales?–A global review and European analysis. Energy Econ. 2019, 84, 104493. [Google Scholar] [CrossRef]


Disclaimer/Publisher’s Note: The statements, opinions and data contained in all publications are solely those of the individual author(s) and contributor(s) and not of MDPI and/or the editor(s). MDPI and/or the editor(s) disclaim responsibility for any injury to people or property resulting from any ideas, methods, instructions or products referred to in the content. |
© 2025 by the authors. Licensee MDPI, Basel, Switzerland. This article is an open access article distributed under the terms and conditions of the Creative Commons Attribution (CC BY) license (https://creativecommons.org/licenses/by/4.0/).