Article

Sustainable Optimal Capacity Allocation for Grid-Connected Microgrids Incorporating Carbon Capture and Storage Retrofitting in Multi-Market Contexts: A Case Study in Southern China

1
China Energy Engineering Group Guangdong Electric Power Design Institute Co., Ltd., Guangzhou 510663, China
2
Institute of Energy, Environment and Economy, Tsinghua University, Beijing 100084, China
3
Management Science Research Institute of Guangdong Power Grid Corporation, Guangzhou 510308, China
4
School of Economics and Management, North China Electric Power University, Beijing 102206, China
*
Author to whom correspondence should be addressed.
Sustainability 2025, 17(21), 9588; https://doi.org/10.3390/su17219588 (registering DOI)
Submission received: 11 September 2025 / Revised: 14 October 2025 / Accepted: 24 October 2025 / Published: 28 October 2025

Abstract

With the goal of achieving carbon neutrality, promoting the clean and low-carbon transformation of energy assets, as exemplified by existing thermal power units, has emerged as a pivotal challenge in addressing climate change and achieving sustainable development. Arrangements and technologies such as the electricity–carbon–certificate multi-market, microgrids with direct green power connections, and carbon capture and storage (CCS) retrofitting provide favorable conditions for facing the aforementioned challenge. Based on an analysis of how liquid-storage CCS retrofitting affects the flexibility of thermal power units, this manuscript proposes a bi-level optimization model and solution method for capacity allocation for grid-connected microgrids, while considering CCS retrofits under multi-markets. This approach overcomes two key deficiencies in the existing research: first, neglecting the relationship between electricity–carbon coupling characteristics and unit flexibility and its potential impacts, and second, the significant deviation of scenarios constructed from real policy and market environments, which limits its ability to provide timely and relevant references. A case study in southern China demonstrates that first, multi-market implementation significantly boosts microgrids’ investment in and absolute consumption of renewable energy. However, its effect on reducing carbon emissions is limited, and renewable power curtailment may surge, potentially deviating from the original intent of carbon neutrality policies. In this case study, renewable energy installed capacity and consumption rose by 17.09% and 22.64%, respectively, while net carbon emissions decreased by only 3.32%, and curtailed power nearly doubled. Second, introducing liquid-storage CCS, which decouples the CO2 absorption and desorption processes, into the capacity allocation significantly enhances microgrid flexibility, markedly reduces the risk of overcapacity in renewable energy units, and enhances investment efficiency. In this case study, following CCS retrofits, renewable energy unit installed capacity decreased by 24%, while consumption dropped by only 7.28%, utilization hours increased by 22%, and the curtailment declined by 78.05%. Third, although CCS retrofitting can significantly reduce microgrid carbon emissions, factors such as current carbon prices, technological efficiency, and economic characteristics hinder large-scale adoption. In this case study, under multi-markets, CCS retrofitting reduced net carbon emissions by 86.16%, but the annualized total cost rose by 3.68%. Finally, based on the aforementioned findings, this manuscript discusses implications for microgrid development decision making, CCS industrialization, and market mechanisms from the perspectives of research directions, policy formulation, and practical work.

1. Introduction

As China advances toward its carbon neutrality strategic goals, despite the rising share of renewable energy units—represented by wind and solar power—in the electricity system, data released by China’s National Energy Administration (NEA) in July 2025 reveal that thermal power installations still account for over 40% of the country’s total installed electricity generation capacity, thereby retaining a dominant position [1]. Given that thermal power constitutes a major source of carbon emissions in the energy sector while playing a critical role in ensuring the secure and stable operation of the new power system with high renewable energy penetration [2,3], promoting the steady transformation and sustainable development of energy sectors such as thermal power has emerged as one of the key challenges in addressing climate change.
To accelerate clean and low-carbon energy sustainable development, rectify negative externalities associated with energy activities, and internalize the environmental value of green energy, the Chinese government has implemented institutional arrangements—represented by the Renewable Portfolio Standard (RPS) and Carbon Allowance (CA) mechanisms—to foster the development of electricity–carbon–certificate multi-markets.
Additionally, policy instruments have been introduced to promote the “green power direct connection” model. This model explicitly allows existing thermal power units to construct grid-connected microgrids through complementary investments in renewable energy generation facilities, load aggregation, and other pathways [4].
These measures have created favorable market conditions, policy frameworks, and viable business models for facilitating the clean and low-carbon transformation of thermal power units. Given this context, conducting research on capacity allocation method for a grid-connected microgrid that considers CCS retrofitting under the electricity–carbon–certificate market environments has significant implications for thermal power unit transformation decision making and sustainable energy development.
  • CCS modeling
To effectively curb the carbon emissions per unit output of thermal power units, the industry has, over recent years, introduced a series of innovative hybrid low-carbon technologies in sequence. These include generalized energy storage coupling operation retrofitting [5,6], fuel co-firing modification [7], and integrated energy production with cascading utilization [8]. Notably, CCS retrofitting has garnered considerable attention due to its direct capability to capture, sequester, or utilize the carbon dioxide generated during power generation [9].
From a functional perspective, CCS retrofitting for thermal power units (or carbon capture power plants, CCPPs) has long been recognized as a critical technical pathway. Its primary role is to reconcile three key objectives: maintaining power system security through reliable thermal generation; unlocking the asset value of existing thermal power units; and facilitating the low-carbon transition of the energy sector [10,11].
Despite the continuous improvement in the economic viability of CCS retrofitting, its application remains predominantly limited to demonstration projects. Significant challenges still hinder its large-scale and commercial deployment [12,13].
Regarding operational methodologies, Wu et al. [14], Ma et al. [15], and Zou et al. [16] developed mathematical models for carbon capture output in thermal units, analyzed internal flows of energy and carbon within CCPPs, and demonstrated a positive correlation between unit output and carbon capture capacity. Zhu et al. [17] proposed adjusting steam extraction rates from turbines according to load profiles to achieve flexible modulation of capture efficiency and enhance unit energy performance within specific ranges. Wang et al. [18] introduced four operational modes for CCPPs aimed at improving renewable energy accommodation in microgrids and subsequently analyzed their regulatory capabilities.
Further considering the electricity–carbon coupling characteristics of CCPPs, Li et al. [19], Xuan et al. [20], Chen et al. [21], and Liu et al. [22] proposed that implementing CCS retrofitting on thermal power units can significantly enhance the low-carbon economic performance of dispatch strategies in scenarios such as virtual power plant operation, coal-to-hydrogen conversion, and generalized energy storage applications. This enhancement is achieved through coordinated interaction with demand response mechanisms and energy storage devices.
  • Microgrid capacity allocation
Scholars typically establish optimization objectives by either minimizing construction and operational costs or maximizing comprehensive benefits over the entire lifecycle [23]. In terms of microgrid capacity allocation models, current research focuses on modeling and analyzing capacity allocation problems under typical scenarios and elements, including integrated energy systems [24], shared energy storage [25], carbon trading [26], transportation–energy integration systems represented by coordinated electric vehicle charging/discharging [27,28], and island energy systems [29].
Furthermore, concerning specific challenges or risks in capacity allocation processes, to address uncertainties such as the stochastic nature of renewable energy and load demand, as well as natural disaster risks, Situ et al. [30], Bakhtiari et al. [31], and Wang et al. [32] proposed enhancing the robustness of solution strategies by transforming uncertainty factors into deterministic bounds using Distributionally Robust Optimization-CVaR; constructing typical scenarios of uncertainty factor combinations through Hidden Markov Models (HMMs), or improved clustering algorithms. These uncertainty modeling methods, grounded in historical data mining or stochastic programming principles, demonstrate varying degrees of effectiveness in improving microgrid resilience against uncertainty risks [33].
Li et al. [34] and Zou et al. [35] addressed equipment performance degradation issues by developing multi-stage distributionally robust optimization models incorporating Wasserstein metrics to simulate the impact of equipment aging on capacity allocation decisions.
For market risks such as price fluctuations and bidding behaviors, Lu et al. [36] and Wang et al. [37] employed game-theoretic models to simulate bargaining, cooperative–competitive interactions between microgrids and loads, aiming to improve microgrids’ resilience against market uncertainties.
Additionally, given the ongoing construction and reform of China’s multi-market systems, including electricity and carbon markets, scholars have conducted extensive research on market mechanisms such as coupling models and price transmission across markets [38,39]. Correspondingly, Wu et al. [40] and Xiao et al. [41] explored scenarios where microgrids participate simultaneously in both electricity and carbon markets. Their studies analyzed the impacts of carbon trading and proposed optimized bidding and dispatch strategies for such multi-market environments.
In the aforementioned studies, while scholars have conducted relatively extensive research on CCS retrofitting and microgrid capacity allocation issues, significant limitations remain.
First, most studies focus on the correspondence between carbon capture intensity and CCPP output themselves, with few examining them as typical elements within microgrid capacity allocation problems. This neglects the relationships between electro–carbon coupling characteristics and unit flexibility, as well as potential associated impacts.
Second, with the establishment of the electricity–carbon–certificate multi-markets, along with institutional arrangements such as direct green power connections, market and policy scenarios under carbon neutrality goals have become more diversified. However, most studies remain confined to electricity and carbon trading markets only, deviating significantly from real policy and market environments. Consequently, they struggle to provide timely and adaptive references for microgrid capacity allocation decisions in these emerging scenarios.
In response to the aforementioned shortcomings, this manuscript proposes a bi-level optimization model for capacity allocation for grid-connected microgrids, which integrates CCS retrofitting in multi-market contexts. Building upon existing research, this study’s main contributions are as follows.
  • From the perspective of CCS modeling, this study incorporates monoethanolamine (MEA) absorption characteristics, along with constraints on absorption/desorption rates, compression efficiency, and initial/final liquid tank levels, to construct a liquid-storage CCS/CCPP model. The proposed framework explicitly describes the decoupling processes between carbon capture/release/compression dynamics and between carbon capture intensity and unit output. This approach addresses the limitations of prior research that neglected relationships between CCS electro–carbon coupling characteristics and unit flexibility, thereby failing to fully exploit the temporal optimization potential of CCPPs in coordinating renewable energy, power generation capacity, and carbon capture capability.
  • From the perspective of microgrid capacity allocation, this manuscript incorporates the impact of institutional arrangements (including RPS, CA, and direct green power connections) on the investment and operational decisions of profit-driven microgrid operators. A bi-level optimization framework is developed to characterize how multi-market interactions influence microgrid capacity allocation and operation, addressing the limitations of prior research that suffered from unrealistic policy assumptions and poor temporal adaptability. This manuscript provides practical guidance for microgrid cost structure optimization, investment decision making, energy sustainable development, and energy policy effectiveness assessment.
The rest of this paper is organized as follows. Section 2 constructs a model for liquid-storage CCPPs, analyzes their operational flexibility, and proposes a framework to optimize capacity allocation for grid-connected microgrids, considering CCS retrofitting in a multi-market context. In Section 3, a bi-level optimization model is developed, along with corresponding solution methods. In Section 4, a case study from southern China is selected for solution and analysis. Finally, conclusions are outlined in Section 5.

2. A Grid-Connected Microgrid Capacity Allocation Framework in Multi-Markets

2.1. CCS Retrofitting and Flexibility Analysis of CCPPs

According to the distinct points of CO2 separation in the power generation process, CCS can be classified into three categories: pre-combustion capture, post-combustion capture, and oxy-fuel combustion.
Among these, post-combustion capture technology is considered to have significant potential for widespread application, owing to its superior performance in two key aspects: capture efficiency and technical–economic characteristics [42,43,44].
The typical operational modes of post-combustion capture mainly include conventional, split-flow, and liquid-storage types [18,45], as illustrated in Figure 1. Liquid-storage CCS, by incorporating liquid storage tanks, enables decoupling of the carbon absorption and desorption processes within a certain range. This decoupling provides more flexible and resilient decision making space for the operation and scheduling of CCPPs and microgrids [46,47]. This paper will focus on the analysis and modeling of CCPPs retrofitted with liquid-storage CCS.
Please note that for ease of understanding and verification of the symbols in the equations within the manuscript, relevant information is provided in Table 1.
As illustrated in Figure 1, during the operation of the CCPP, the flue gas is divided into two streams: a portion is directly vented to the atmosphere via a flue gas bypass system; the remaining portion flows into the absorption tower. Inside the absorption tower, the flue gas reacts with MEA, thereby capturing the majority of CO2 and forming the rich solution.
Driven by pumps, the rich solution enters the regeneration tower, where CO2 is desorbed and separated, yielding the lean solution. This lean solution is then recirculated back to the absorption tower for further CO2 capture, while the separated CO2 undergoes compression and storage via compressors, completing the entire carbon capture process.
It is evident that the operational elasticity and flexibility of the CCPP can be effectively enhanced in both temporal and output range dimensions by adjusting the following parameters: capture intensity and operating periods of the absorption tower and the regeneration tower, and the exchange rate and cycle between the rich and lean solution tanks.
This adjustment simultaneously modulates carbon capture intensity, thereby optimizing system performance under varying operational conditions.
The CCPP’s total power output P t , CCPP is decomposed into three contributions:
P t , CCPP = P t , net + P f + P t , o P t , o = μ A E t , A + μ C E t , C + μ D E t , D
The quantities of CO2 absorbed, desorbed, and compressed during the carbon capture process are subject to the following constraints:
0 E t , A α A , max E t , CCS 0 E t , D α D , max α A , max E t , CCS E t , D = E t , C
The amount of carbon emissions diverted from the CCPP to the carbon capture system are given by the following equations:
E t , CCS = β flow E t , total
E t , total = e P t , CCPP
Combining the previous analysis, factors such as the carbon capture operation mode and energy consumption characteristics will influence the net power output range and ramping capability of the CCPP, as demonstrated by the following equations:
P net , min P t , net P net , max P net , max = P CCPP , max P f P net , min = P CCPP , min P o , max P f P o , max = α A , max β e max · μ A + α D , max ( μ C + μ D ) · P CCPP , max
R t , up = min ( R up , CCPP , P CCPP , max P t , o P f P t , net ) R t , down = min ( R down , CCPP , P t , net P CCPP , min + P t , f + P o , max )

2.2. Capacity Allocation Framework

2.2.1. Market Context and Institutional Arrangements

To enhance the utilization of renewable energy, over the past few decades, Chinese government departments—including the NDRC and the Ministry of Ecology and Environment (MEE)—have successively implemented a series of institutional arrangements, such as RPS, CA, and direct green power connections, to facilitate the development of the multi-market system.
In the context of the electricity market, it has been clarified that renewable energy electricity (green electricity) can be traded through two models: “certificate–electricity separation trading” and “certificate–electricity-integrated trading”. Furthermore, it has been confirmed that the actual consumption of renewable energy, renewable energy electricity trading (certificate–electricity-integrated trading), and Green Energy Certificate (GEC) trading constitute vital pathways for relevant entities to meet their RPS compliance obligations. This mechanism has, to a substantial degree, clarified the interrelationships among renewable energy electricity, GECs, and green environmental value, thereby mitigating the risk of double counting.
In the certificate market, a GEC issuance mechanism covering all types of renewable energy generation technologies has been established, with GECs officially recognized as a critical basis for assessing compliance progress under RPS. Furthermore, renewable energy projects applying for GECs are prohibited from concurrent Chinese Certified Emission Reduction (CCER) applications, thereby mitigating risks of double counting environmental value to a significant extent.
In the carbon market, a CA allocation and trading mechanism has been established based on Tradable Performance Standard (TPS). Under this system, the government will issue corresponding CAs to market participants free of charge, based on their production activity levels and industry-average emission benchmarks. At the compliance deadline, market entities must either purchase additional CAs to cover any deficits or sell surplus CAs, depending on the difference between their allocated CAs and actual emissions. This provides a critical pathway for addressing the negative externalities associated with the production and operational activities of relevant entities.
Furthermore, in the context of direct green power connection, existing thermal power units can establish grid-connected microgrids through integrated approaches, such as making complementary investments in renewable energy units and aggregating loads. These microgrids may participate in the multi-market transactions as unified entities. It is important to note that, to prevent uncontrolled expansion of renewable energy capacity, policies impose certain requirements on the renewable energy power consumption capacity of grid-connected microgrids, with potential economic penalties for excessive curtailment.
Additionally, to compensate grid operators for stability maintenance costs, grid-connected microgrids are required to annually declare their maximum net load profiles and pay capacity charges based on their declarations.
The aforementioned institutional arrangements and corresponding analyses provide critical policy foundations and real-world scenarios for research on capacity allocation of grid-connected microgrids with CCS retrofitting under electricity–carbon–certificate multi-markets.

2.2.2. Microgrid Capacity Allocation Assumptions

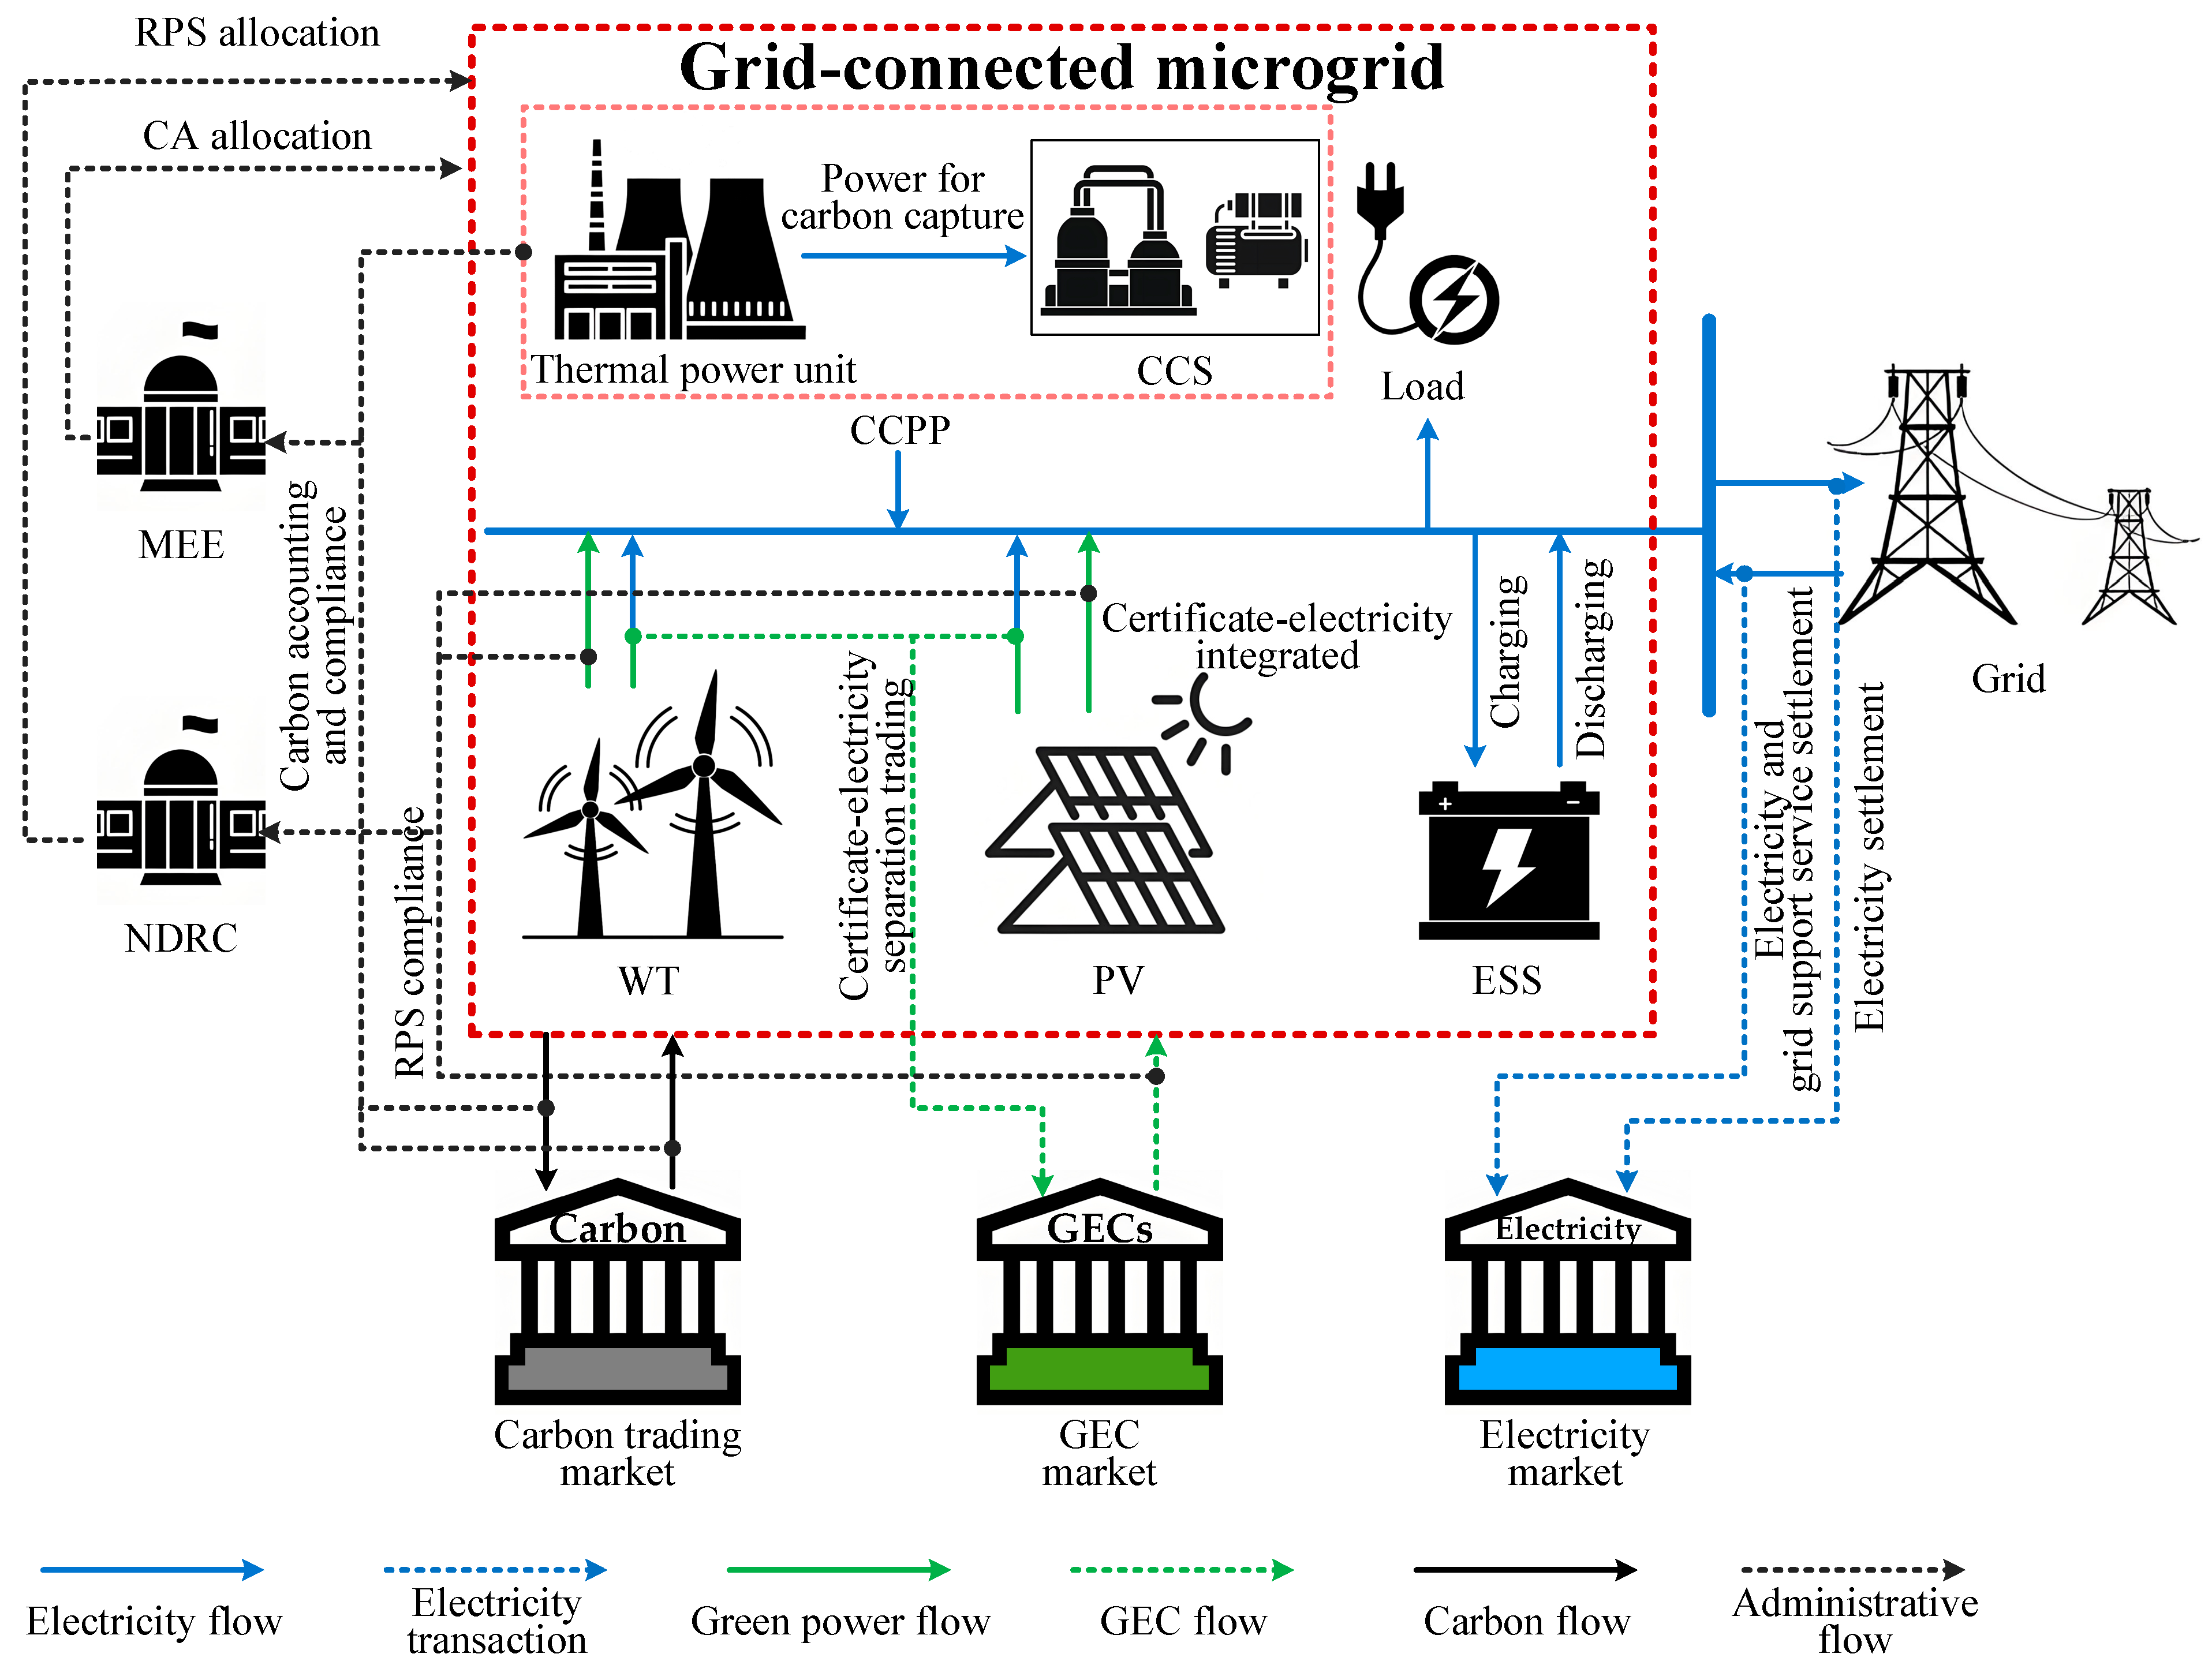
Based on Section 2.2.1, as typical entities in the multi-market, grid-connected microgrids must comply with regulatory requirements such as RPS and CA while supplying power to loads. This requires grid-connected microgrids to optimize the allocation of renewable generation capacity, the scope of CCS retrofits for thermal power units, energy storage system (ESS) capacity, and the volume of grid support service declarations under multi-market conditions. Such optimization provides favorable conditions for formulating operational strategies—including equipment dispatch, GEC trading, and carbon trading—during the operational phase, ultimately achieving lifecycle cost minimization.
This paper establishes the following research assumptions and proposes a microgrid capacity allocation optimization framework, as illustrated in Figure 2.
(1) The grid-connected microgrid is constructed on the basis of an existing thermal power unit and aggregated loads, through CCS retrofitting and investing in the installation of WT, PV, and ESS. Influenced by technological solutions, policy regulations, and market dynamics, the lifespan of equipment typically exhibits significant variability rather than fixed durations. Based on engineering project experience, design specifications, and relevant research, the operational lifespans of microgrids, WT and CCS generally range from 15 to 20+ years, while ESSs demonstrate shorter lifespans of 8–10 years. To balance model complexity and computational efficiency, this manuscript adopts standardized lifespan assumptions of 20 years for primary equipment and 10 years for EES [48,49,50].
(2) The electrical loads are mainly satisfied by the output of the generation equipment within the microgrid, with power exchange with the grid serving as a supplement. It should be noted that, in accordance with the direct green power connection policy, to ensure system stability, the microgrid is permitted to purchase electricity from the grid at the locally announced peak–valley electricity prices to ensure system stability. Additionally, surplus power can be sold to the grid at the generation-side price spot market. However, the power exchange with the grid must remain below the declared capacity for grid support services. For the portion exceeding the declared capacity, a penalty will be imposed in addition to the settlement of charges for the exchanged power.
(3) The grid-connected microgrid is a boundedly rational agent that aims to minimize both investment costs and comprehensive operational costs over the project lifespan. Here, the comprehensive operational costs cover equipment-variable costs as well as costs arising from certificate trading, carbon trading, and possible penalty fees, etc.
(4) In terms of GEC trading, the grid-connected microgrid can engage in transactions through two models: “certificate–electricity separation trading” and “certificate–electricity integrated trading.” This means that when the microgrid’s renewable energy consumption exceeds its RPS target, it can separate GECs from the renewable energy and profit by selling these certificates. Conversely, if its renewable energy consumption falls short of the target, it will need to purchase GECs to meet the requirement; otherwise, it will face penalties.
(5) In terms of carbon trading, from a physical perspective, the carbon emissions during the operation of the grid-connected microgrid primarily originate from thermal power units and electricity purchases from the grid. However, from the essence of economic activities, the root cause of carbon emissions lies in its profit-driven energy supply behavior toward aggregated loads. Considering the functional role of CA and carbon trading as mechanisms for correcting economic externalities, as described in Section 2.2.1, this paper assumes that the microgrid’s CA is calculated based on its load level. The microgrid can fulfill its compliance obligations or generate revenue through carbon capture and carbon trading, with carbon trading prices being formed according to a tiered carbon pricing mechanism.

3. Capacity Allocation Modeling and Solution

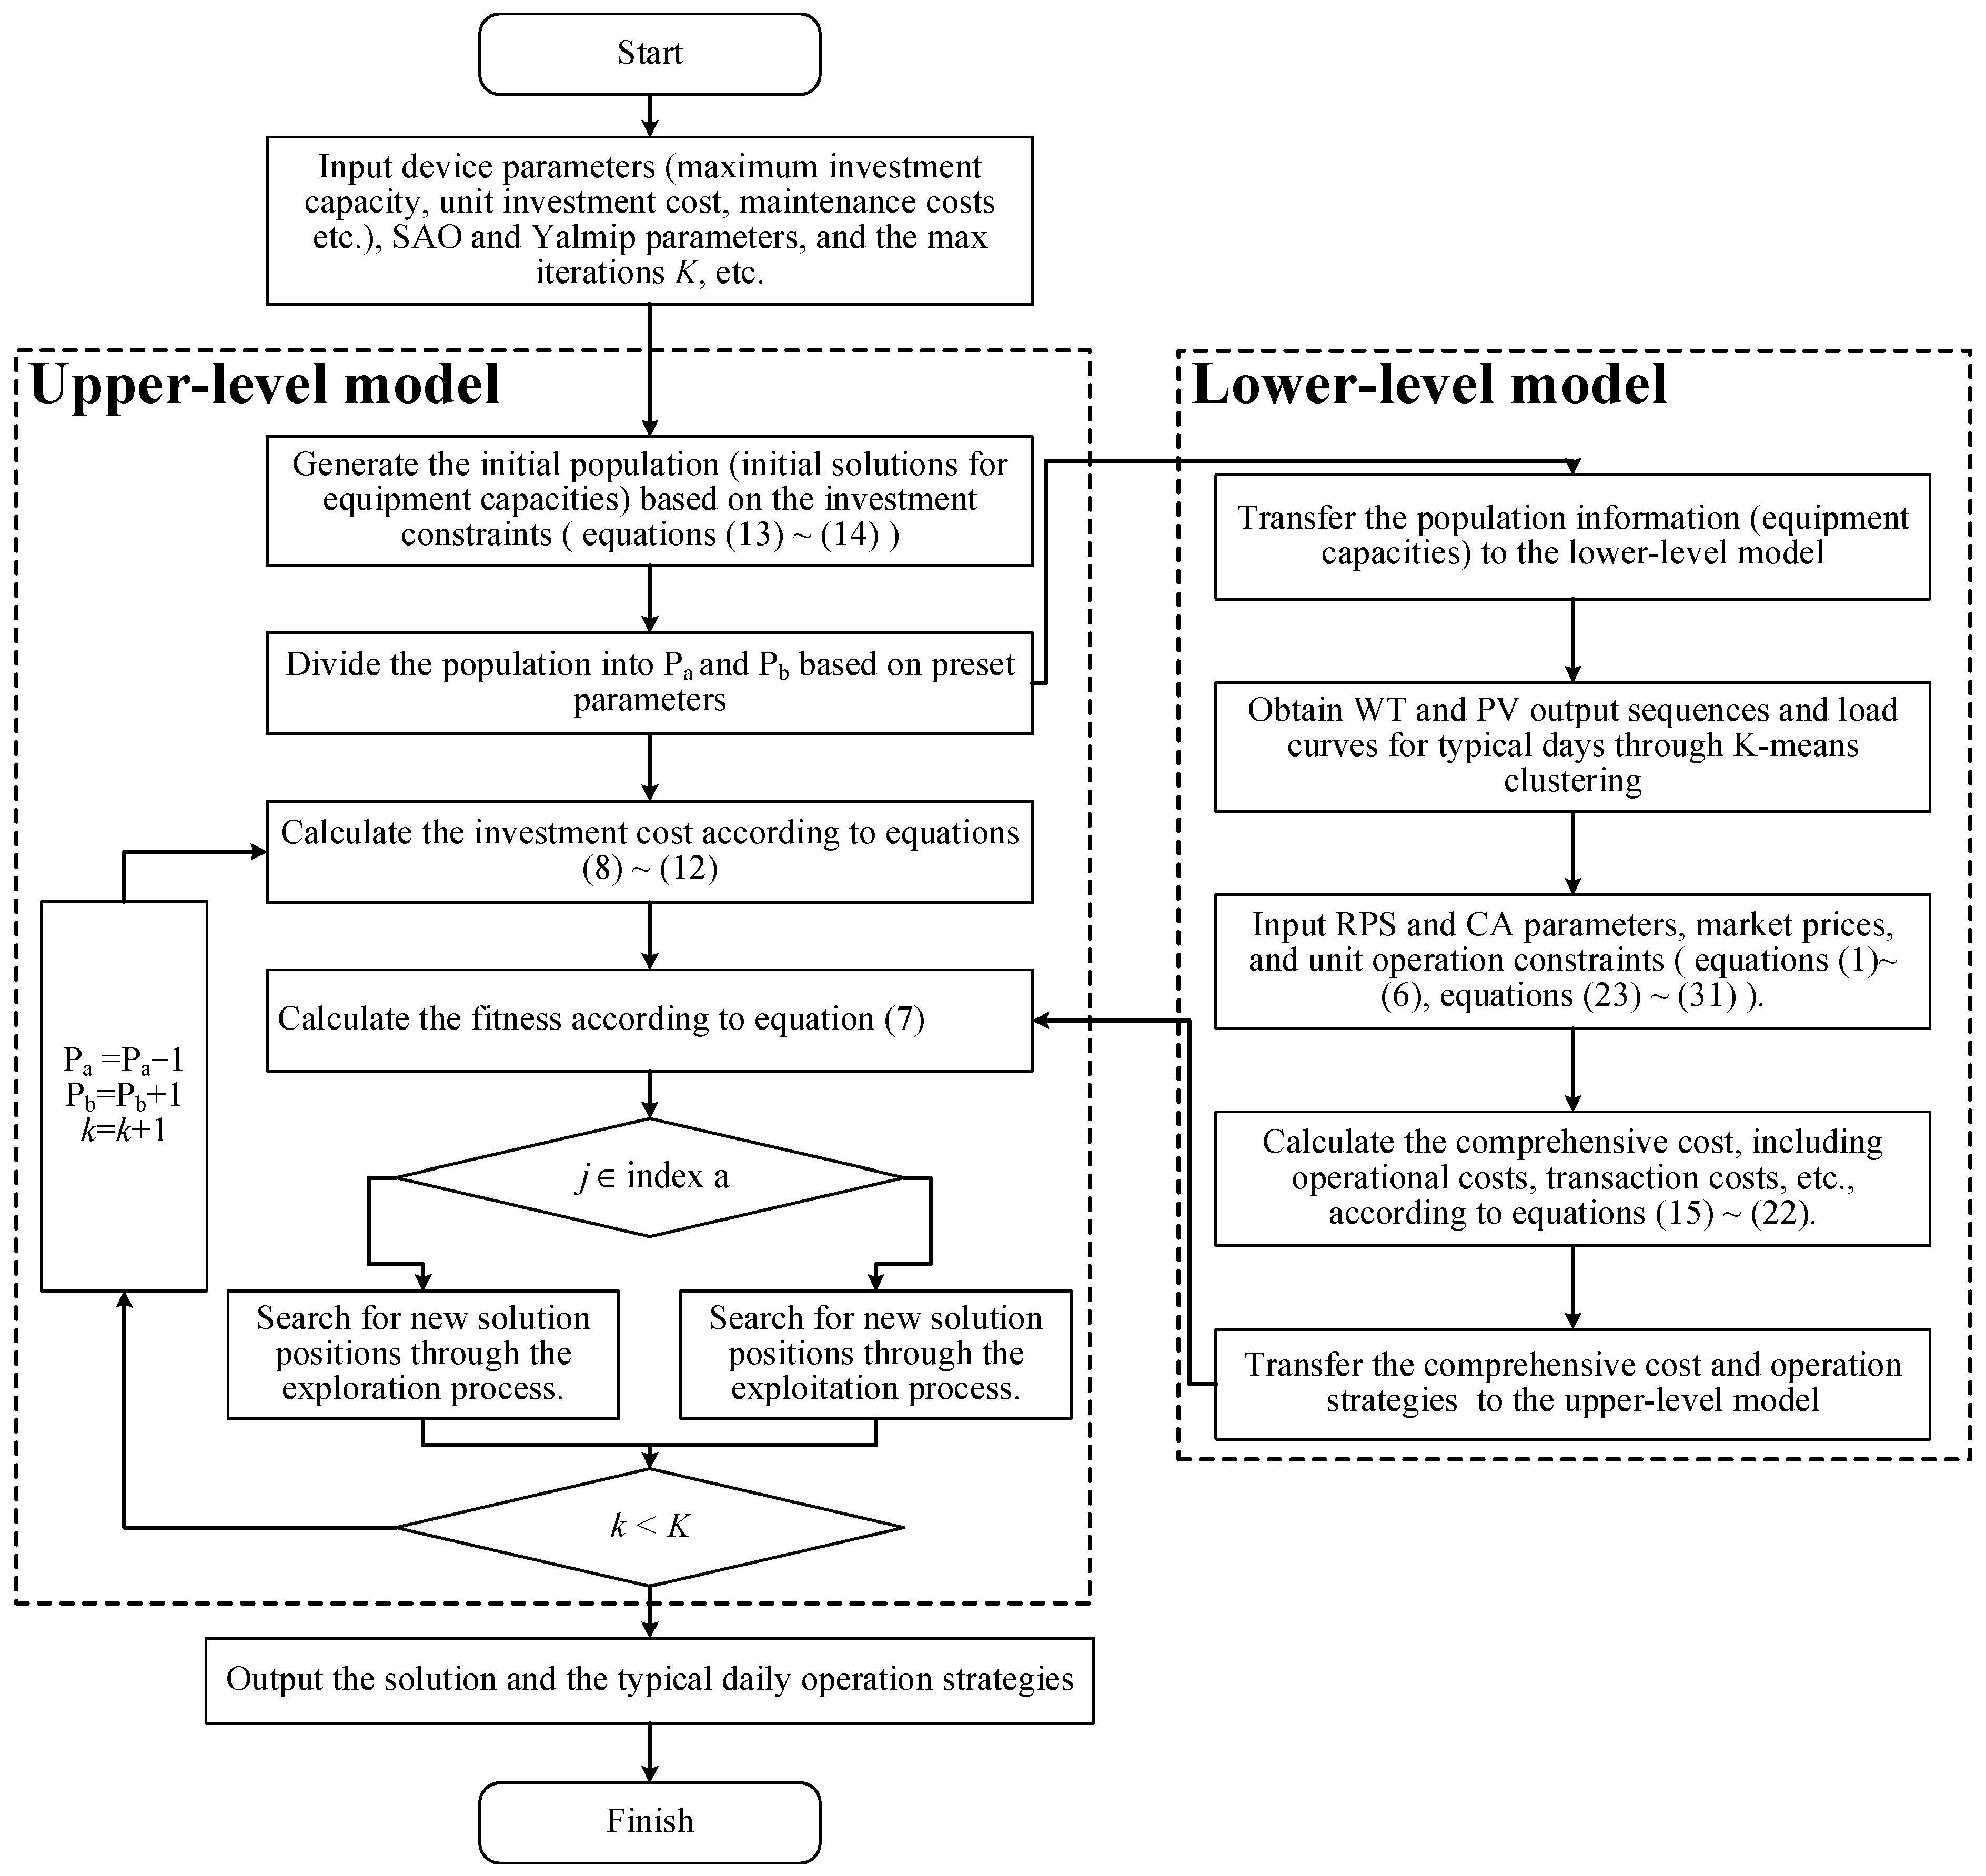
Based on Section 2, this paper constructs a bi-level optimization model for capacity allocation for a grid-connected microgrid in multi-market conditions, as shown in Figure 3.
Specifically, the upper-level model acts as a planning model primarily aimed at determining the investment capacities of various types of equipment and subsequently transmitting the capacity allocation results to the lower-level model.
The lower-level model serves as an operational optimization model. Given the capacity allocation from the upper-level model, it primarily derives the optimal operation strategy for the grid-connected microgrid during typical days and then returns the calculated comprehensive operational cost back to the upper-level model.
Through iterative interactions between the two levels, the optimal capacity allocation scheme for the grid-connected microgrid is ultimately obtained.
It should be noted that, for the sake of facilitating comprehension of the model, detailed descriptions of the equations along with their corresponding serial numbers are provided in Table 2.

3.1. Upper Planning Model

3.1.1. Objective Function

The decision variables for the upper-level model primarily encompass the CCS retrofitting scale (mainly including the capacities of rich solution tanks, lean solution tanks, etc.), WT capacity, PV capacity, ESS capacity, and the declared capacity for grid support services. Its objective function is to minimize the annualized total cost, as presented in the following equation.
min F upper = C inv + C main + C rep + C inter I salvage + F lower
Each cost term in Equation (7) can be obtained via the following approaches.
  • Investment cost and maintenance cost
C inv = ( 1 + r ) Y i · r ( 1 + r ) Y i 1 i I c inv , i · E i + C inv , CCS C main = i I c main , i · E i I WT ,   PV ,   ESS ,   CCS
Specifically, for CCS retrofitting, the investment costs can be divided into one-time technical retrofitting costs and storage tank investment costs, as expressed by the following equation. From a lifecycle perspective, in accordance with the design and engineering construction standards of the power industry and chemical industry, the typical service life of CCS retrofitting projects generally ranges from 15 to 20 years. Given that this manuscript focuses on analyzing CCS as an integral component within grid-connected microgrids, the lifespan of CCS retrofitting is set at 20 years to reasonably reduce model complexity and enhance computational efficiency.
C inv , CCS = ( 1 + r ) Y CCS · r ( 1 + r ) Y CCS 1 C retro + c tank · E tank
  • Replacement cost
Based on engineering case studies, the operational lifespan of microgrid projects, as well as WT, PV, and CCPP, is typically around 20 years. In contrast, the lifecycle of the EES is approximately 10 years. Therefore, a single replacement of EES must be accounted for within the microgrid lifecycle, with the associated cost calculated as follows:
C rep = c inv , ESS E ESS · ( 1 + r ) Y · r · R ( 1 + r ) Y 1 R = 1 ( 1 + r ) Y ESS
  • Grid support services cost
C inter = p inter P inter
  • Residual value income
The residual value income realized at the end of the microgrid project’s lifespan is detailed as follows:
I salvage = i I r ( 1 + r ) Y i 1 · λ i C i , inv

3.1.2. Constraints

  • Equipment investment capacity constraint
I salvage = i I r ( 1 + r ) Y i 1 · λ i C i , inv
For grid support service, the microgrid’s declared maximum net load shall adhere to the following constraint:
0 P inter P inter , max

3.2. Lower Operational Model

3.2.1. Objective Function

The decision variables of the lower-level model primarily consist of the output schedules and operational strategies for each equipment within a typical day, with the objective function aiming to minimize the annual comprehensive operational cost, as expressed by the following equation:
min F lower = C o + C waste + C CO2 + C GEC + C grid
Each cost component in Equation (15) can be further determined through the following methods.
  • Variable operating cost of equipment
Based on practical engineering experience, the variable operating costs of WT and PV are extremely low and can largely be considered negligible. Additionally, as analyzed in Section 2.1, both the energy consumption cost of the CCS and the net output cost of the thermal power units are included in the variable operating costs of the CCPP. Here, the cost of CCS C o , ESS primarily consists of the MEA consumption cost C MEA and the carbon sequestration cost C s , both of which are functions of the total amount of captured CO2 [14].
C o = C o , CCPP + C o , WT + C o , PV + C o , CCS C o , CCPP = d Ω D t = 1 T N D , d · ( a CCPP P t , CCPP 2 + b CCPP P t , CCPP + c CCPP ) C o , WT = d Ω D t = 1 T N D , d c o , WT P t , WT C o , PV = d Ω D t = 1 T N D , d c o , PV P t , PV C o , ESS = d Ω D t = 1 T N D , d c o , ESS · ( P t , ESS dis + P t , ESS ch ) C o , CCS = C MEA + C s C MEA = d Ω D t = 1 T N D , d c MEA φ v MEA ρ MEA E t , A C s = d Ω D t = 1 T N D , d c ss E t , A
  • WT/PV curtailment cost
This portion of costs primarily arises from the arrangements outlined in Section 2.2.1 regarding the direct green power connection policy, which imposes economic penalties on microgrids for renewable power curtailment.
C waste = d Ω D t = 1 T N D , d c waste · ( P t , re max P t , re ) P t , re max = P t , PV max + P t , WT max P t , re = P t , PV + P t , WT
  • Carbon trading cost
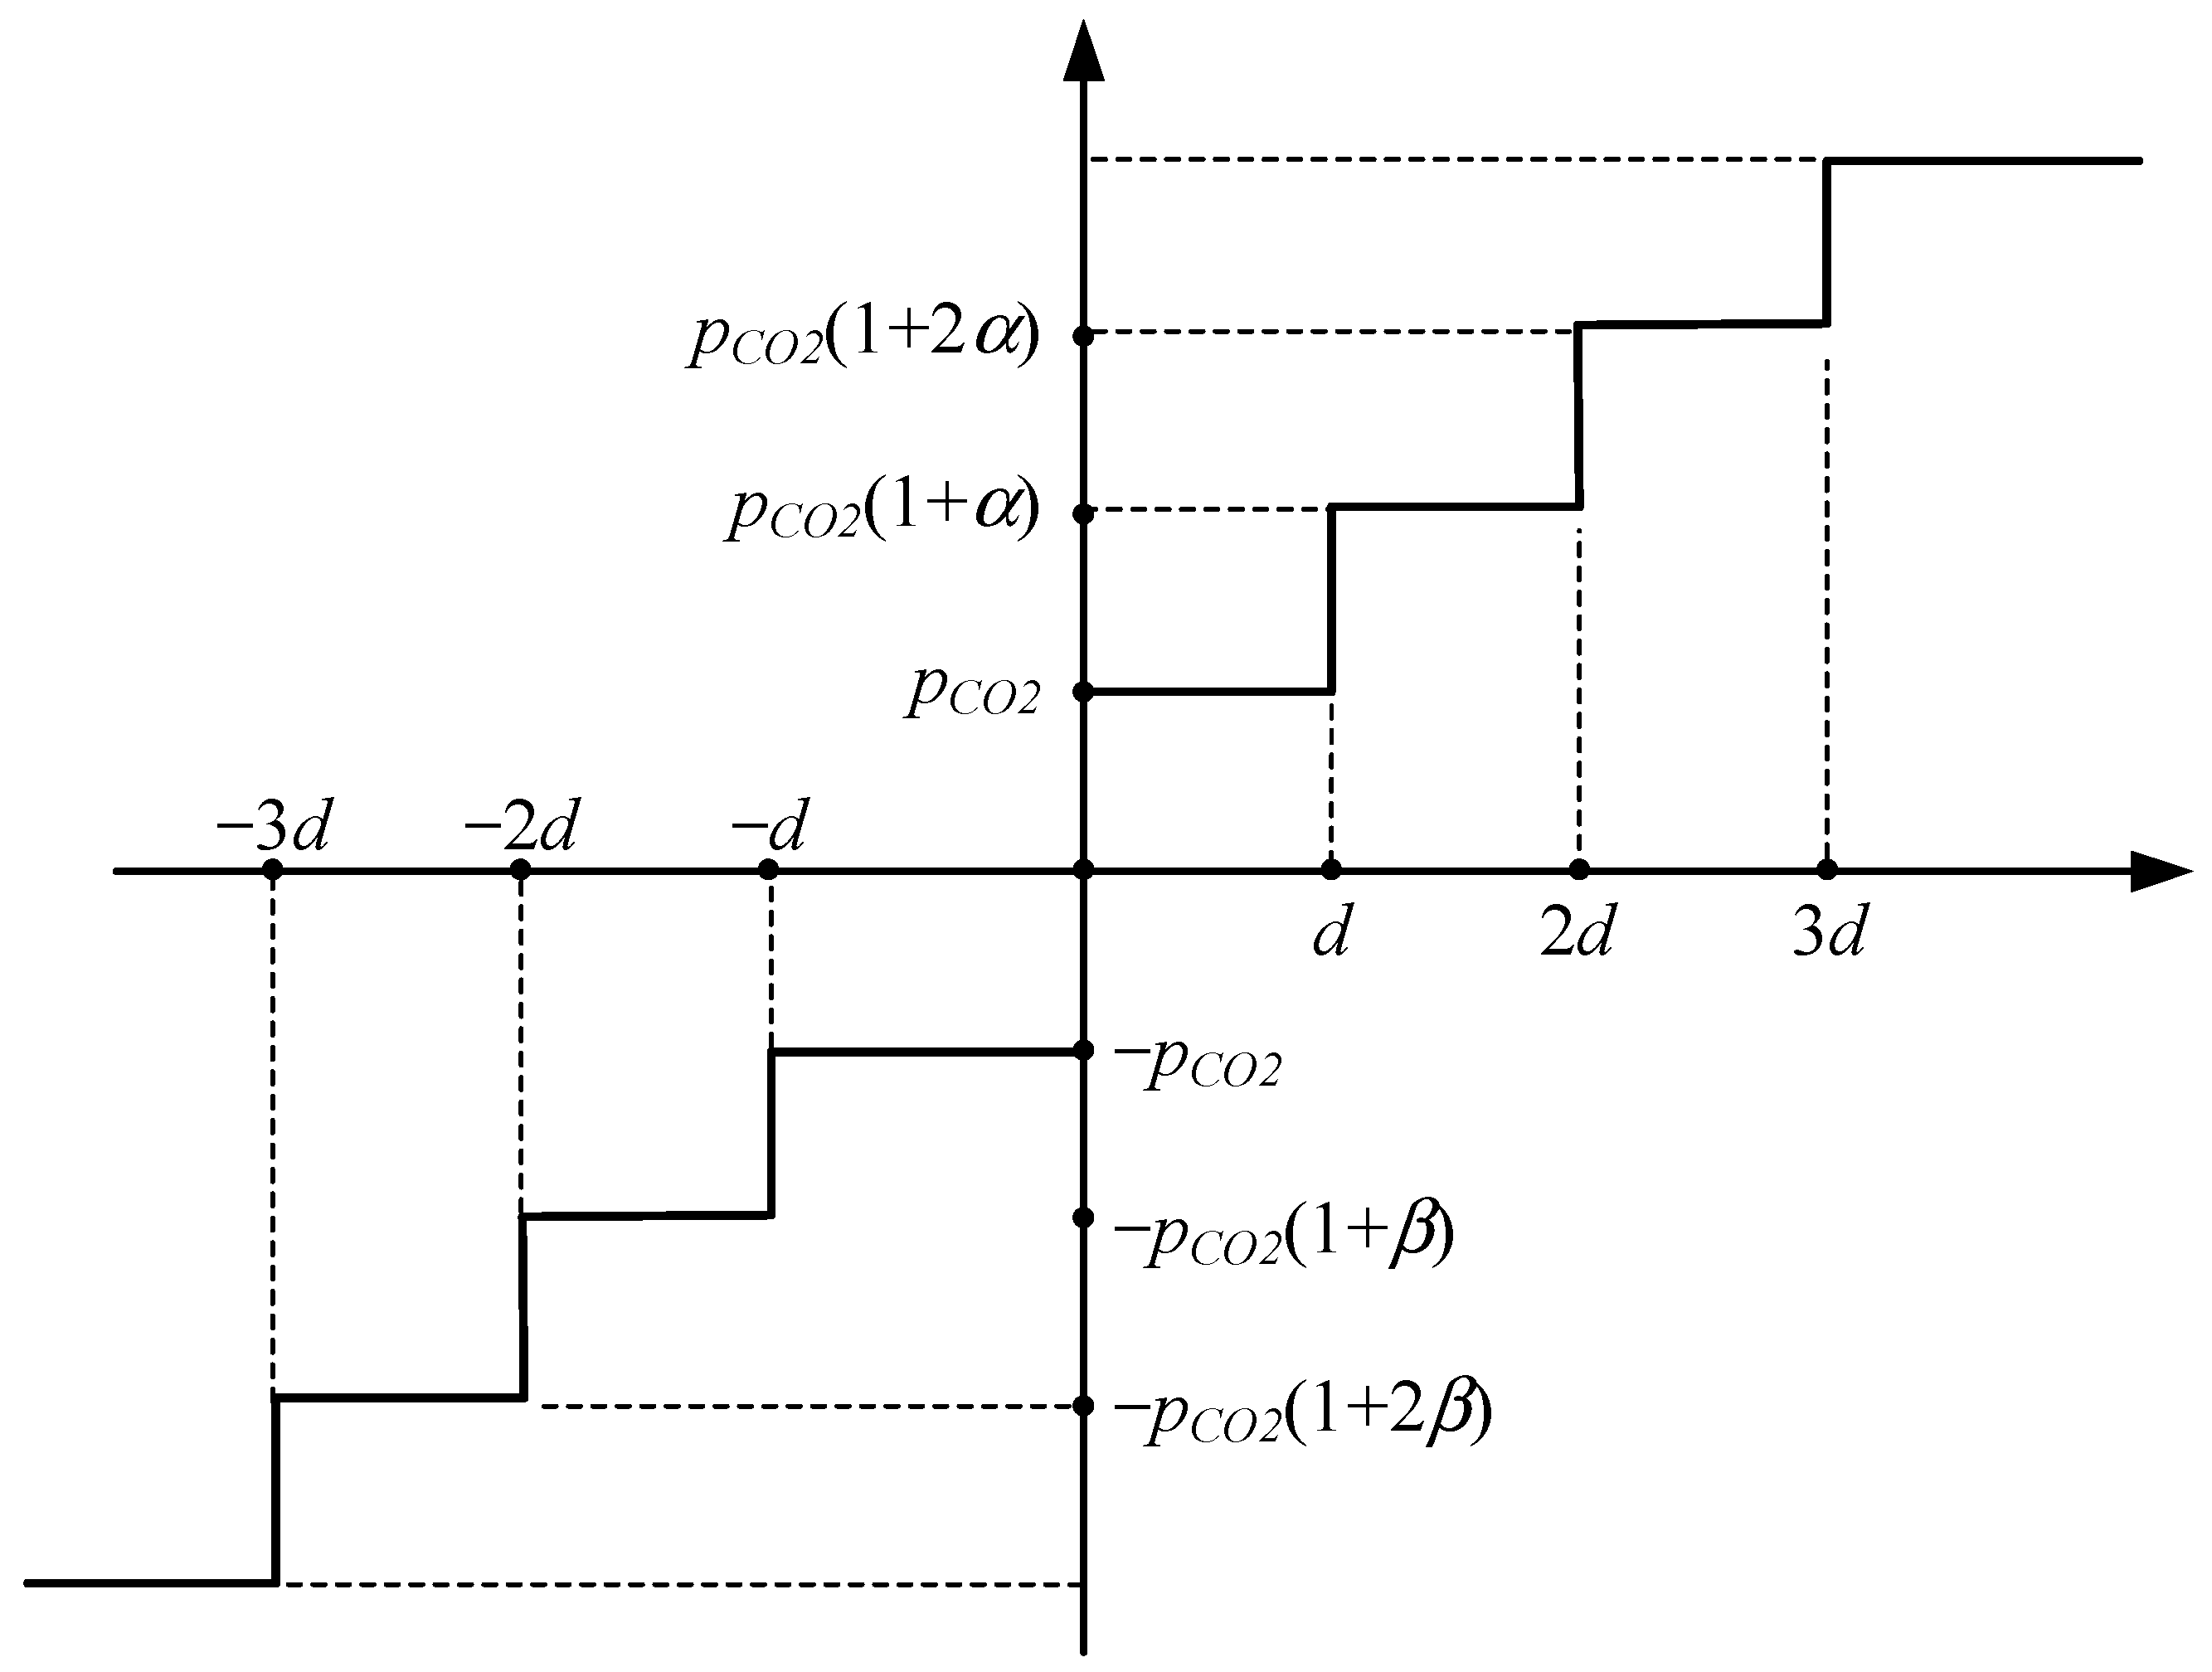
Under the CA and tiered carbon pricing mechanism, as illustrated in Figure 4, the imbalance between the microgrid’s actual carbon emissions and its CA can be addressed through carbon trading: when actual emissions exceed the CA (a positive gap), the microgrid purchases allowances to meet regulatory requirements; when emissions are below the CA (a negative gap), it sells surplus allowances to generate additional income.
It should be noted that while methodologies like the GHG Protocol include multiple greenhouse gases (e.g., CO2, N2O, SF6) in their accounting frameworks, China’s current policies only mandate CO2 quota management and carbon trading for the power sector. Furthermore, actual emissions data from centrally dispatched units in South China show that CO2 emission intensity averages approximately 800 g/kWh, whereas SO2 and NOx emissions are both below 1 g/kWh. This highlights the overwhelming dominance of CO2 in power sector greenhouse gas emissions. Considering these factors, this study focuses exclusively on CO2 emissions in its analysis.
C CO2 = p CO2 · ( 2 + α ) · d + p CO2 ( 1 + 2 α ) · ( Q CO2   2 d )                       2 d Q CO2   < 3 d p CO2 · d + p CO2 ( 1 + α ) · ( Q CO2   d )                                                             d Q CO2   < 2 d p CO2 · Q CO2                                                                                                                                               0 Q CO2   < d p CO2 · Q CO2                                                                                                                                       d Q CO2   < 0 p CO2 · d p CO2 ( 1 + β ) · ( Q CO2   d )                                                   2 d Q CO2   < d p CO2 · ( 2 + β ) · d p CO2 ( 1 + 2 β ) · ( Q CO2   2 d )             3 d Q CO2   < 2 d
Furthermore, based on the research assumptions that microgrid carbon emissions primarily result from meeting aggregated electricity loads, the excess carbon emissions can be expressed as follows:
Q CO2   = Q CO2 , mic Q CO2 , CA Q CO2 , mic = d Ω D t = 1 T E t , total E t , A + ω grid P t , grid Q CO2 , CA = d Ω D t = 1 T L t ω CO2
  • GEC trading cost
C GEC = Q RPS p GEC   0 Q RPS Q RPS p penalty , GEC Q RPS < 0
Q RPS = ω RPS · d Ω D t = 1 T L t d Ω D t = 1 T P t , re
  • Grid power exchange cost
According to the research assumptions, the grid power exchange cost is as shown in Equation (22). When the exchange power between the microgrid and the grid is less than the declared annual maximum net load, the cost is settled based on the locally announced peak–valley electricity prices. Meanwhile, the income from selling electricity to the grid is calculated based on the spot price on the generation side for that day. When the exchange power exceeds the declared annual maximum net load, in addition to paying the electricity charges, a corresponding penalty also needs to be paid.
C grid = d Ω D t = 1 T P t , grid p t , grid P t , grid P inter d Ω D t = 1 T P t , grid p t , grid + P t , grid P inter p penalty , grid     P inter < P t , grid P inter , max

3.2.2. Constraints

  • Supply–demand balance constraint of the microgrid
The grid-connected microgrid should satisfy the following power supply–demand balance constraints.
  P t , CCPP + P t , WT + P t , PV + P t , ESS dis + P t , grid = P t , f + P t , o + P t , ESS ch + L t
  • Constraints on CCPP
The total output and ramping of CCPP must meet the following constraints. Additionally, the net output constraint of CCPP is shown in Equation (5).
P CCPP , min P t , CCPP P CCPP , max R t , down P t , CCPP P t 1 , CCPP R t , up
Specifically, for the liquid-storage carbon capture process in the CCPP, the amounts of CO2 absorbed, desorbed, and compressed must satisfy the constraints outlined in Equation (2). Furthermore, the relationship between the CO2 capture intensity and the liquid levels in the rich and lean solution tanks is indicated in Equation (25).
V t , rich = V t 1 , rich + v MEA ( E t , A E t , C ) V t , lean = V t 1 , lean + v MEA ( E t , C E t , A ) v MEA = M MEA M CO2 ρ MEA c con , MEA ξ MEA
Specifically, the liquid levels in the storage tanks are subject to two constraints: the liquid level must remain identical at the beginning and end of the scheduling period, and the maximum storage capacity of the tanks must not be exceeded. These constraints are expressed by Equations (26) and (27), respectively.
V 0 , rich = V 24 , rich V 0 , lean = V 24 , lean
0 V t , rich E tank , rich 0 V t , lean E tank , lean
  • Renewable energy unit output constraints
0 P t , WT P t , WT max 0 P t , PV P t , PV max
  • ESS constraints
The charge and discharge power constraints of ESS are as follows [51]:
0 P t , ESS ch P ch , max 0 P t , ESS dis P dis , max P ch , max = k ch E ESS P dis , max = k dis E ESS
The SOC of the ESS at time t is characterized by the following equations:
S O C t = ( 1 η ESS ) S O C t 1 + P t , ESS ch E ESS η ch θ S O C t = ( 1 η ESS ) S O C t 1 P t , ESS dis E ESS η dis ( 1 θ ) θ = { 0 ,   1 } S O C min S O C t S O C max S O C 0 = S O C 24 S O C min = 0.2 , S O C max = 0.9
  • Grid power exchange constraints
Based on the assumptions, even when paying additional penalties, the microgrid’s power exchange with the grid can exceed its declared maximum net load. However, the exchange power is constrained by the physical constraint of the tie-line capacity, as shown in the following equation:
P t , grid P inter , max

3.3. Solution

The constructed capacity allocation optimization model for grid-connected microgrids with CCS retrofitting under multi-market represents a typical high-dimensional, bi-level mixed-integer programming problem. In classical mathematical methods, bi-level models are conventionally transformed into a fully integrated single-level model. The transformation is carried out using techniques like Karush–Kuhn–Tucker (KKT) conditions and duality theory. However, this approach may entail issues such as high model conversion complexity, stringent strong duality requirements, and potential exponential growth in computational complexity.
Given these challenges, this study adopts a hybrid solution methodology. It combines intelligent algorithms with mathematical programming techniques. Specifically, the upper-level problem is solved and encoded using the Snow Ablation Optimizer (SAO), while the lower-level problem is addressed through Yalmip.
Specifically, the number of iterations for the bi-level model is set to 30, the population size in the SAO is 50, YALMIP employs the CPLEX solver with a tolerance parameter of 1 × 10⁻⁶, and the number of dispatch time slots for typical days is 24.
Although this approach may involve certain trade-offs in global optimality, it significantly reduces computational complexity and enhances solution efficiency. In addition, it provides critical engineering references for practical implementation.
The solution process is illustrated in Figure 5.
As an emerging heuristic algorithm, the core idea of SAO lies in dividing an initial set of solutions into an exploitation population and an exploration population. The two populations achieve local and global optimization through simulating the processes of snow melting and sublimation, respectively. To a certain extent, it can effectively balance the relationship between solution efficiency and solution effectiveness, demonstrating good adaptability for solving high-dimensional problems, such as the bi-level model for grid-connected microgrid capacity allocation presented in this paper [52,53].
The main steps of SAO consist of initial solution generation, exploitation, and exploration.
  • Initial solution generation
Based on relevant constraints, which include equipment investment capacity, CCS retrofitting scale, and grid support services, the feasible regions for each decision variable in the upper-level model are determined.
After that, the initial solutions of the decision variables are generated according to the following equation. These solutions are then divided into an exploitation population Pa and an exploration population Pb.
E = L + λ ( U L ) = E 1 , 1 E 1 , 2 E 1 , D E 2 , 1 E 2 , 2 E 2 , D E N , 1 E N , 2 E N , D N × D
  • Exploitation
During the exploitation process, particles simulate the snow-ablation process by utilizing the degree-day method to search for new solutions with higher fitness around the current optimal solution. The particle search positions are updated as follows.
E j ( k + 1 ) = M × Z ( k ) + s j ( k ) θ a × ( Z ( k ) E j ( k ) ) + ( 1 θ a ) × ( E ¯ ( k ) E j ( k ) ) M = ( 0.35 + 0.25 × 1 e K 1 e 1 ) × e k K j index   a
  • Exploration
During the exploration process, the SAO simulates the irregular and dispersed motion process of snow sublimation or post-melting evaporation to achieve a wide-range search within the solution space. The equation for updating particle positions is as follows.
E j ( k + 1 ) = G ( k ) + s j ( k ) θ b × ( Z ( k ) E j ( k ) ) + ( 1 θ b ) × ( E ¯ ( k ) E j ( k ) ) G ( k ) Z ( k ) , Z second ( k ) , Z third ( k ) , E ¯ j 50 % ( k ) j index   b

4. Results and Discussion

4.1. Case Introduction and Basic Data

This manuscript selects a microgrid project in southern China as the case study. It is based on an existing 200 MW thermal power unit; the microgrid proposes to construct WT, PV, and ESS; implement CCS retrofits; and aggregate loads to develop a grid-connected microgrid, with the objective of facilitating power asset restructuring.
The existing 200 MW thermal power unit is a condensing-type generator without heat supply duties, originally designed for a 30-year operational lifespan. For this case study, the unit’s lifespan is recalculated as 20 years from the points of grid connection and CCS retrofitting (accounting for lifespan extension) [49,50].
Key parameters including the thermal unit’s efficiency coefficients, emission characteristics, and carbon capture performance, along with physical parameters of WT and ESS, are detailed in Table 3 [14,49]. Technical–economic parameters are presented in Table 4 [18,54]. Additionally, considering the impact of cyclic charging/discharging on lifespan, the maximum daily cycling limit for the ESS in this case is set to three.
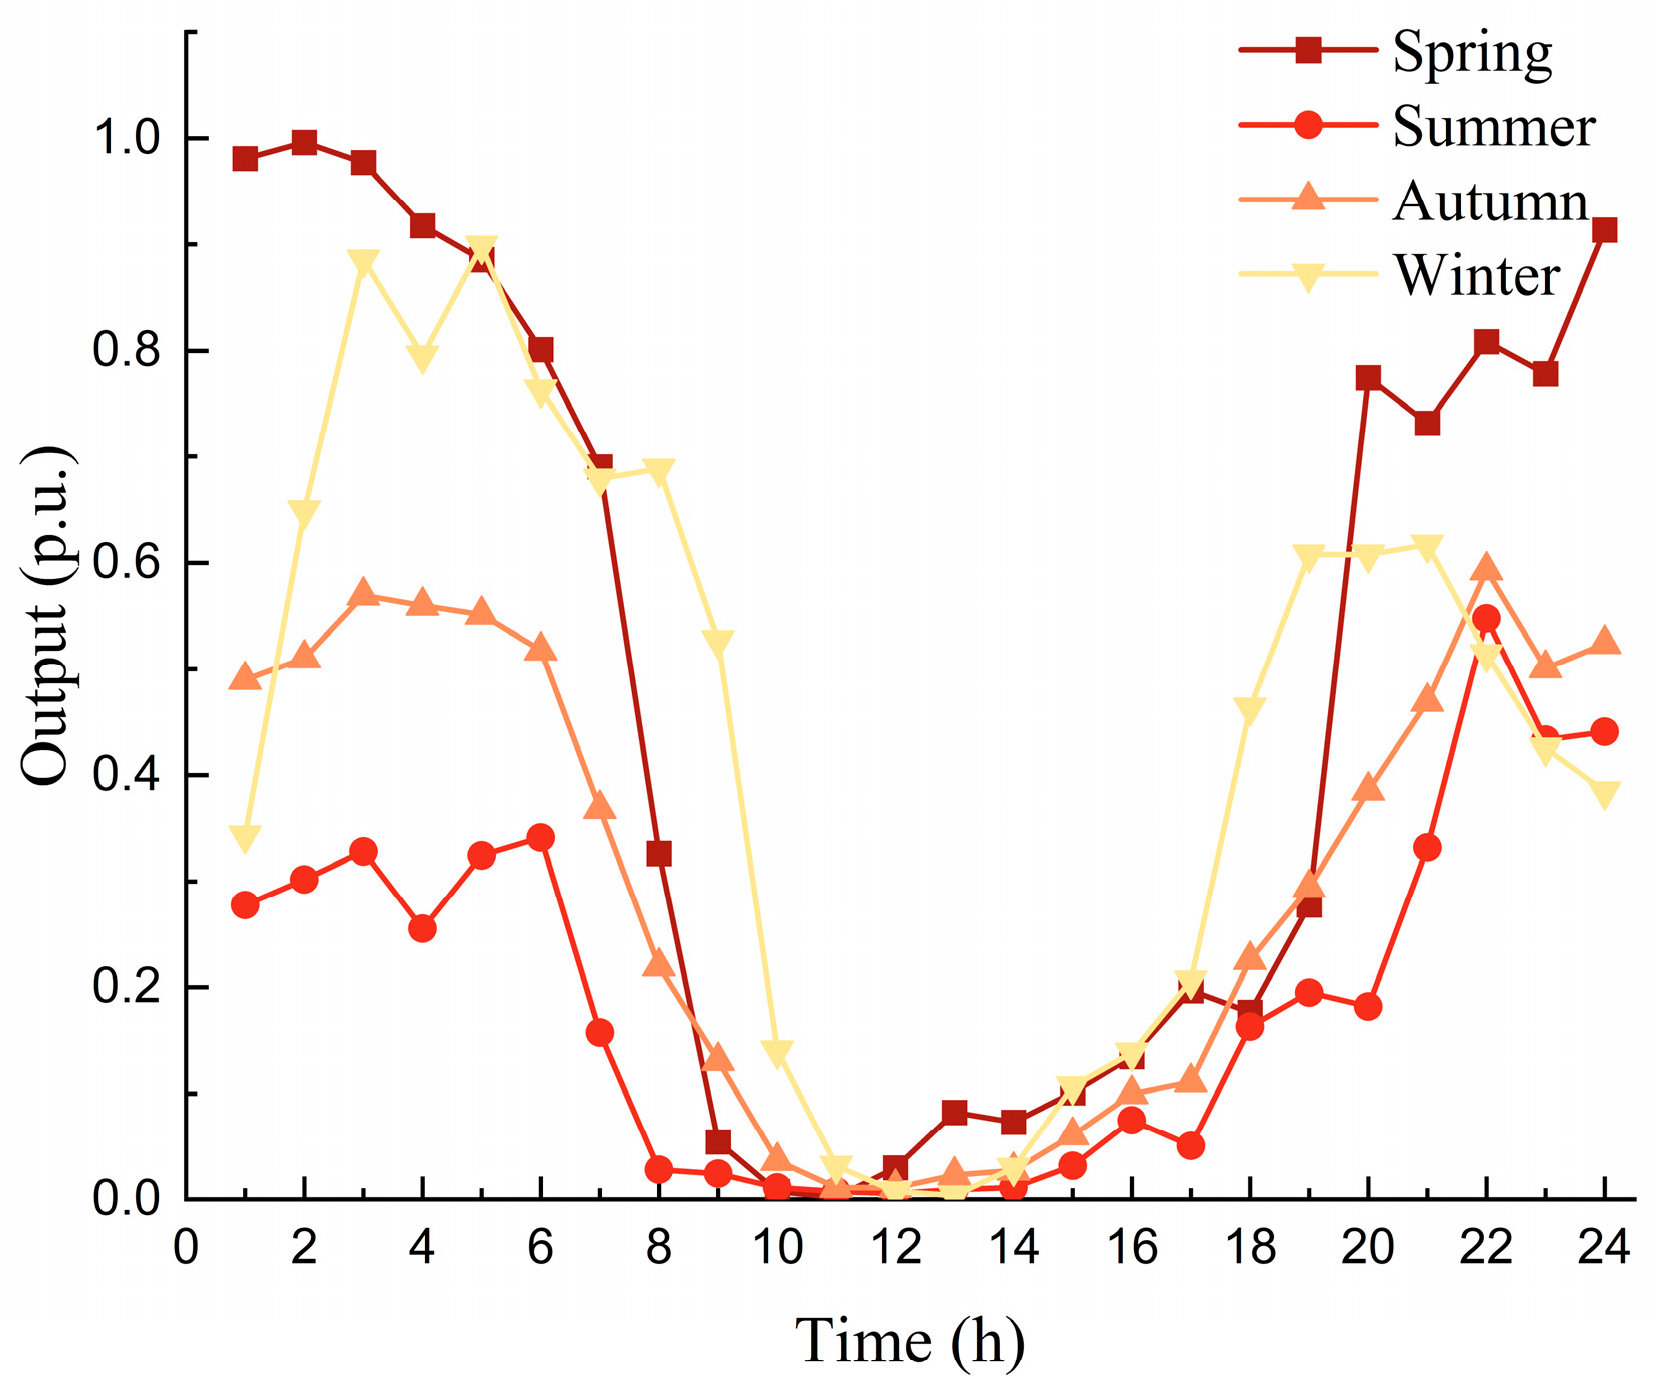
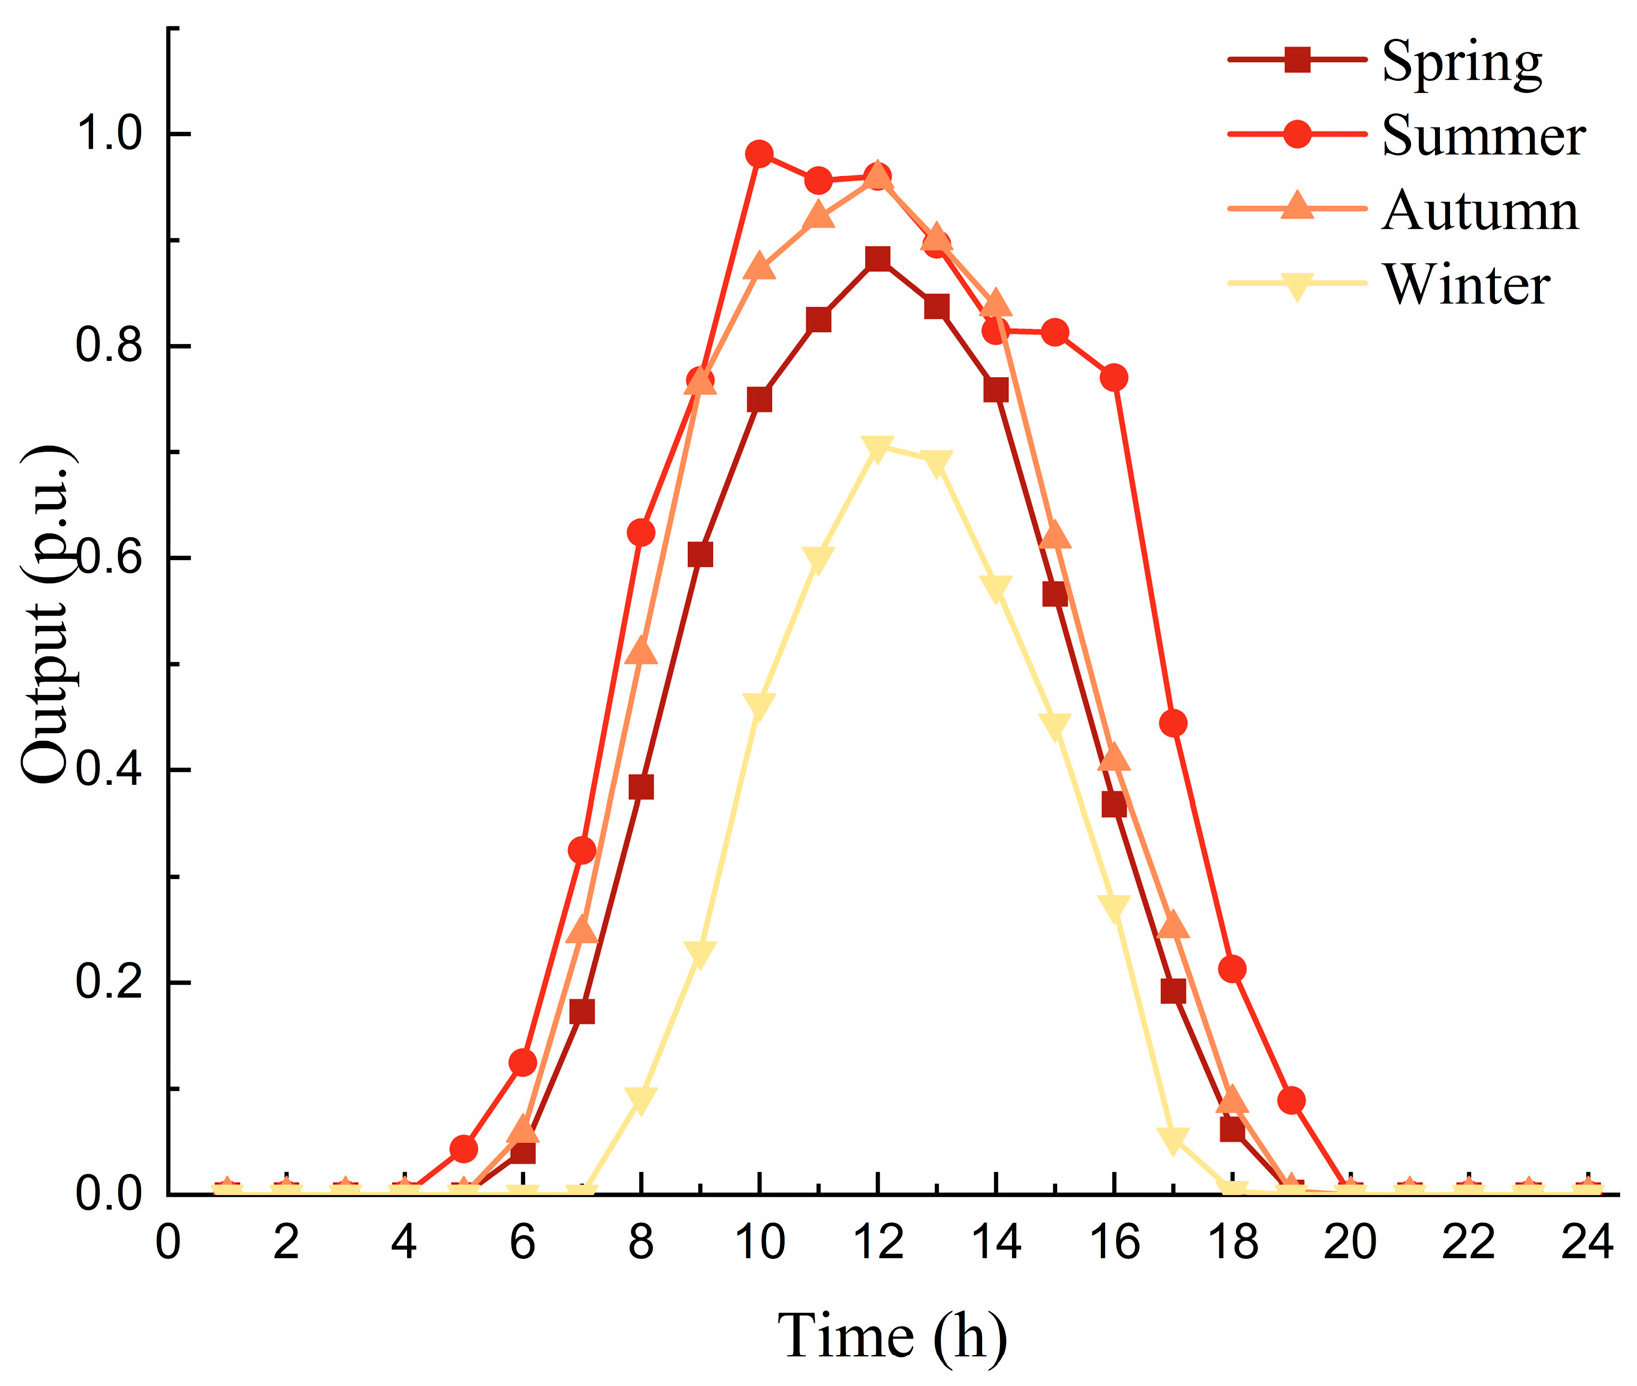
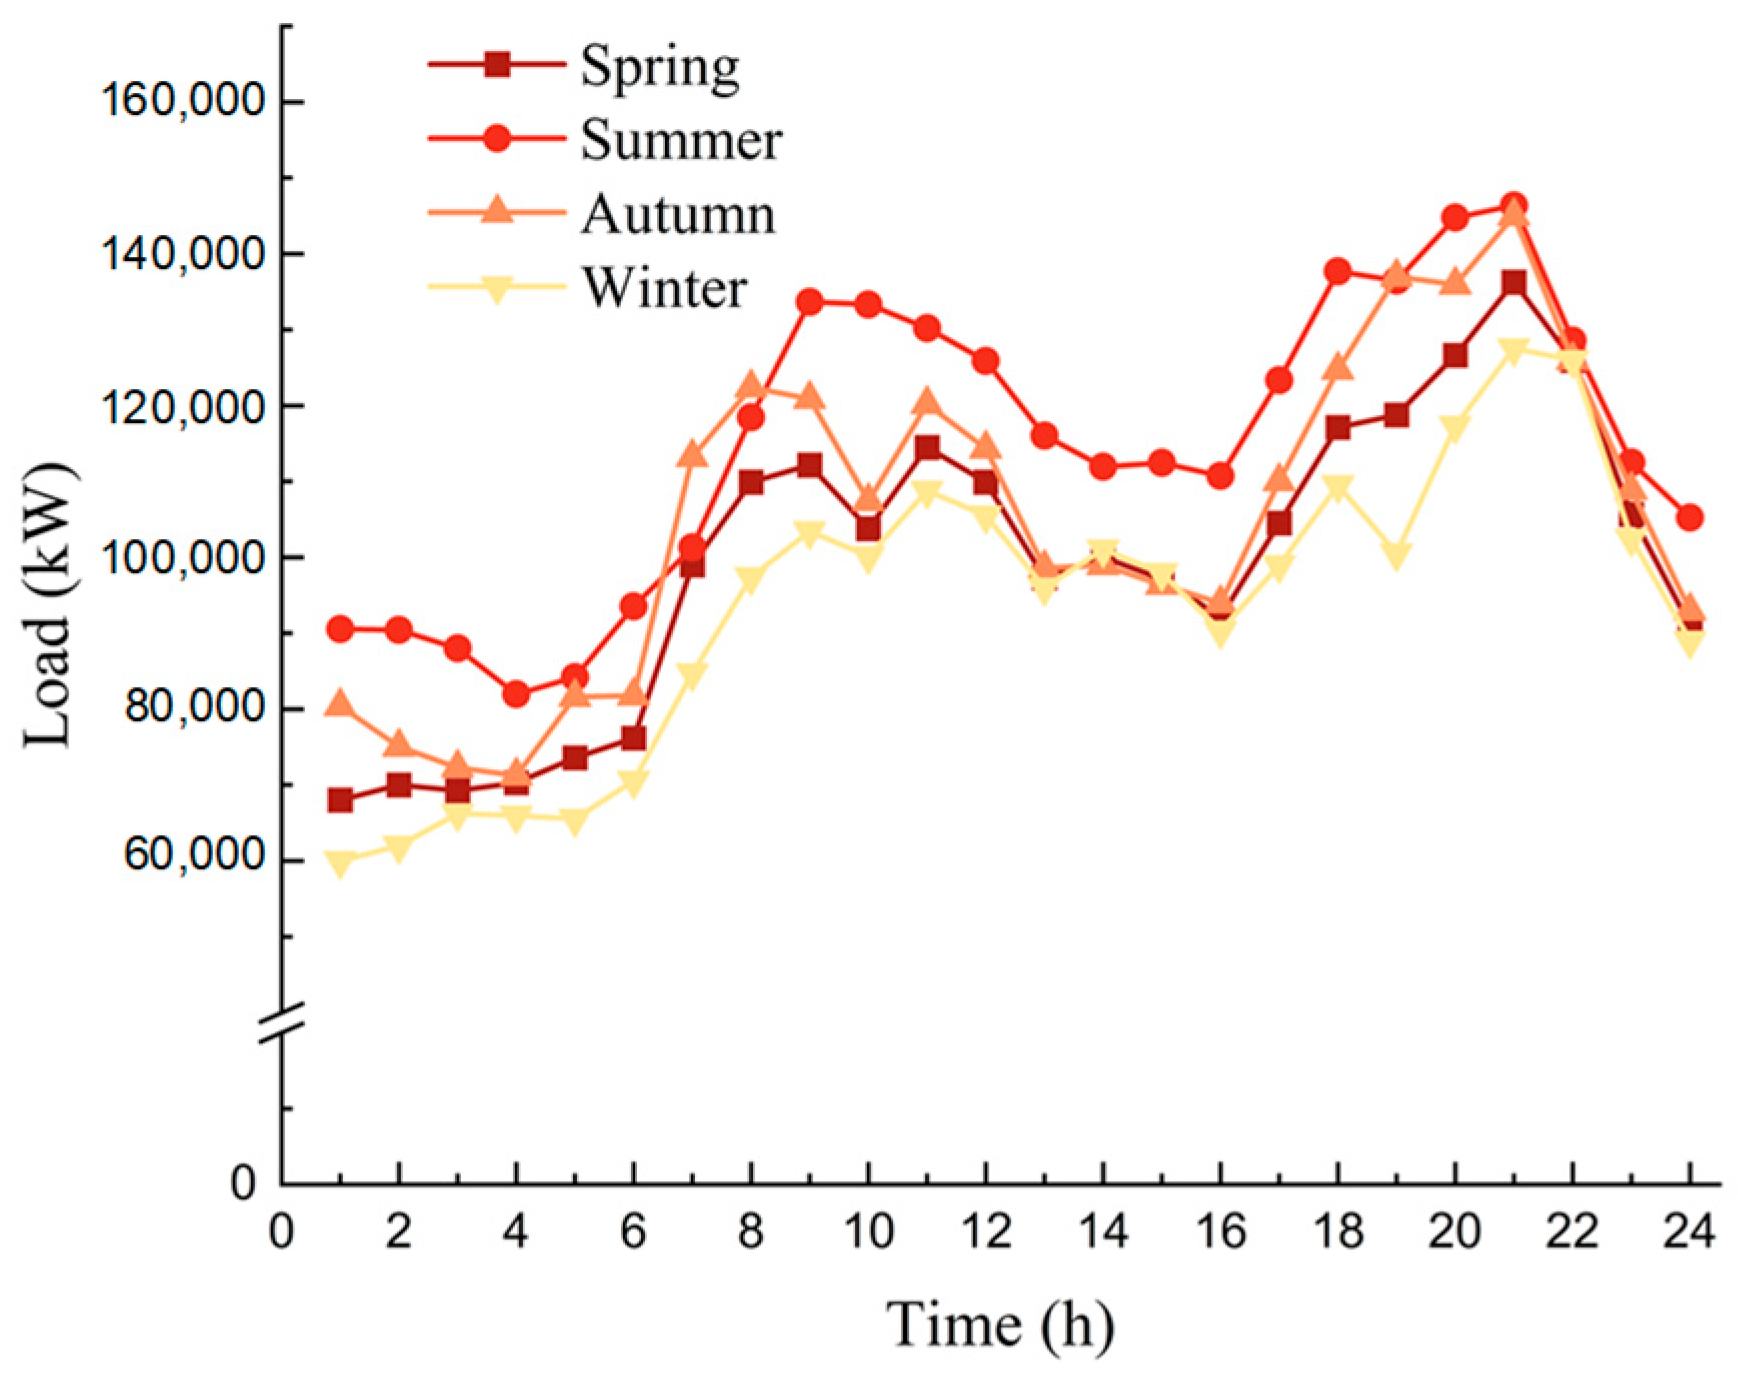
Further, this manuscript employs K-means clustering to derive the normalized WT and PV output profiles, along with corresponding load curves, for typical days in spring, summer, autumn, and winter. These are illustrated in Figure 6, Figure 7 and Figure 8.
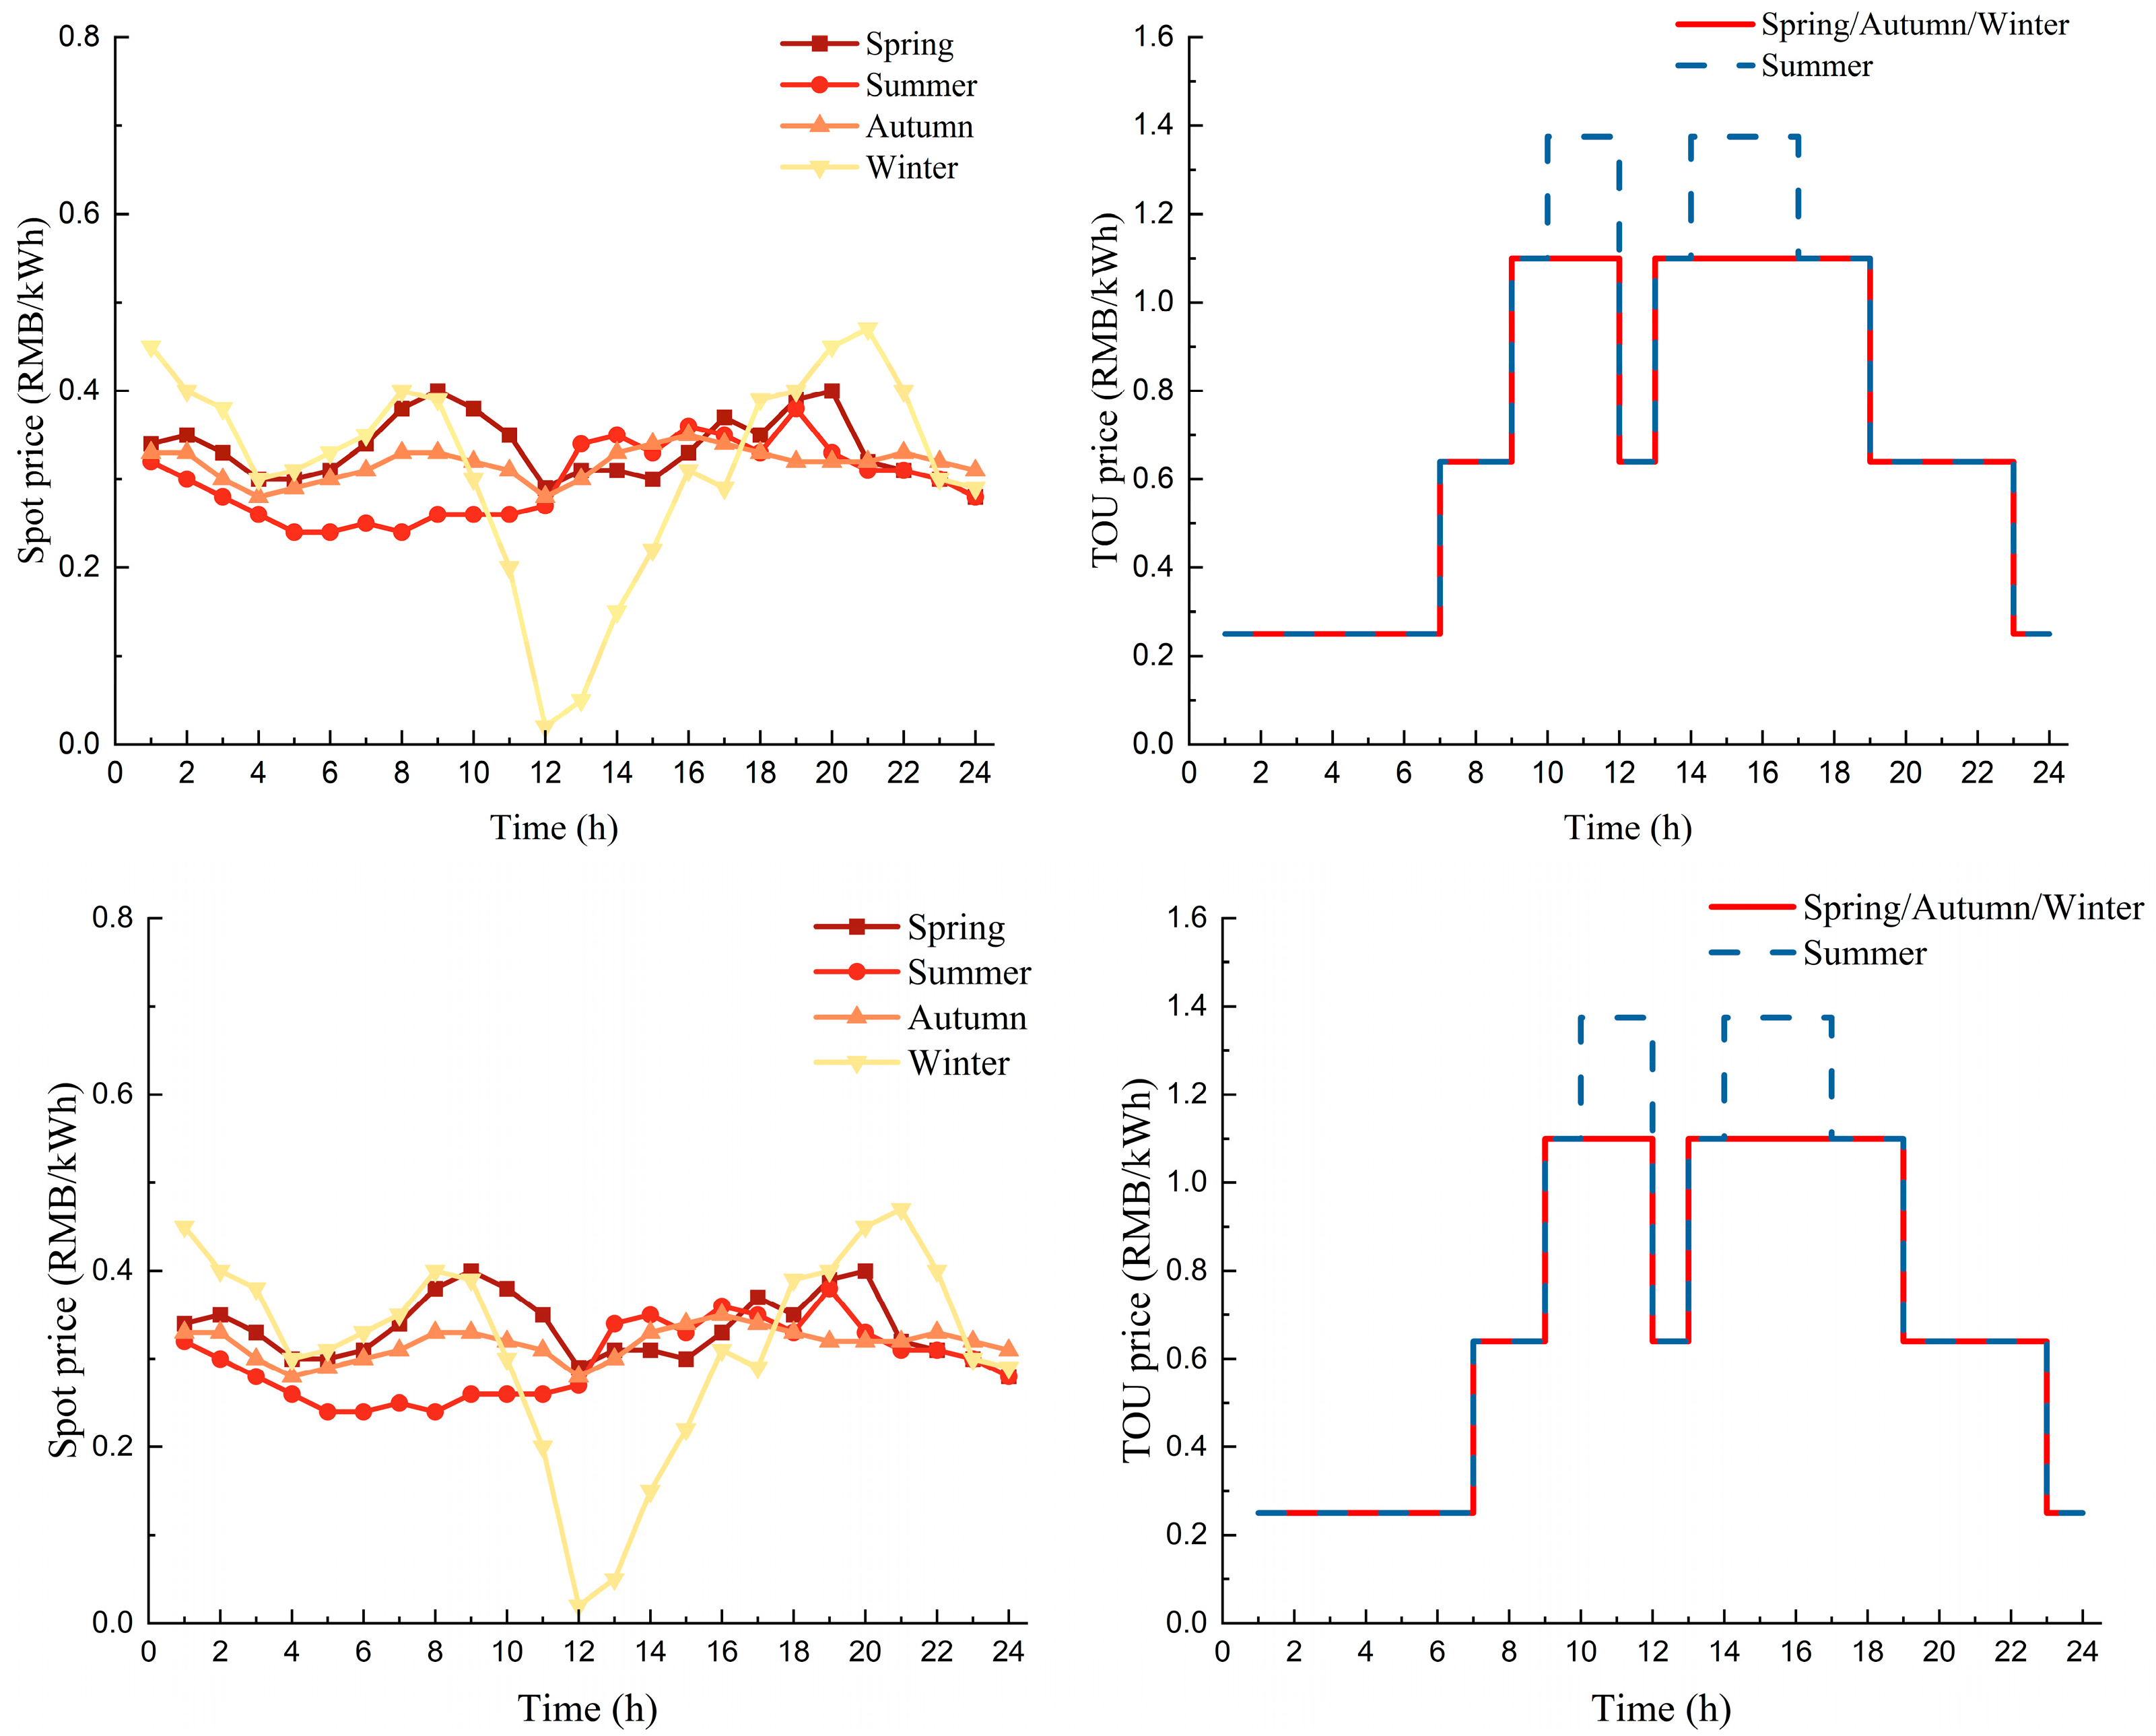
The parameter information related to the multi-market is shown in Table 5 [55,56]. Among them, for the electricity trading, the price at which the microgrid purchases electricity from the grid is determined based on the local government-published peak–valley electricity tariffs. The settlement for surplus electricity fed into the grid will follow the generation-side prices in the spot market, as illustrated in Figure 9.
Regarding GEC trading and carbon trading, considering that these two markets are not continuous markets and their settlement models significantly differ from those of the electricity market, the design of relevant parameters was carried out by referencing statistical information and policy documents from official platforms such as China’s Green Certificate Trading Platform (https://www.greenenergy.org.cn/) (accessed on 11 August 2025) and the Shanghai Environment and Energy Exchange (https://www.cneeex.com/) (accessed on 11 August 2025).

4.2. Scenarios and Results

To analyze the impacts of multi-markets and CCS retrofitting on the capacity allocation of grid-connected microgrids, this manuscript sets up the following three scenarios.
S1: Traditional microgrid capacity allocation scenario without CCS retrofitting and in the absence of multi-markets.
S2: Microgrid capacity allocation scenario that implements multi-markets but does not include CCS retrofitting.
S3: Microgrid capacity allocation scenario considering CCS retrofitting under the multi-market conditions.
Based on the models and the solution outlined in Section 4, the microgrid capacity allocation problem is solved in the aforementioned three scenarios. The computational environment is equipped with an Intel® Core™ Ultra 9 185H processor operating at 2.30 GHz. The corresponding solution results are presented in Table 6.
Additionally, to evaluate the performance of the SAO, classical Particle Swarm Optimization (PSO) was selected as a benchmark method (with an identical population size and iteration count to SAO). Ten independent runs were conducted for S1 through S3. Performance metrics, including average convergence value, average computation time, average iteration count at convergence, and coefficient of variation (CV) of solution results across 10 runs (indicating algorithmic robustness), are summarized in Table 7.
When evaluating algorithmic performance under simple scenarios and models (S1), the SAO algorithm demonstrates only marginal superiority over PSO in terms of convergence value and computational time. There is no statistically significant performance gap observed between the two methods.
However, as scenario complexity and model intricacy increase, SAO’s performance advantages become progressively pronounced. Taking S3 as an example, PSO achieves an average convergence iteration count of 29 with a CV of 9.45%. This indicates that premature convergence or incomplete convergence occurred in some test runs, thus demonstrating relatively poor accuracy and robustness.
In contrast, SAO converges at an average of 20 iterations, achieving a 9.66% reduction in computational time, a 9.52% improvement in convergence value (objective function), and a 69.10% reduction in CV compared to PSO. These results validate SAO’s superiority in accuracy, robustness, and computational efficiency.

4.3. Discussions

4.3.1. Economic Characteristics of Allocation Schemes

As shown in Table 6, overall, when ranking the annualized total costs of the allocation schemes for the three scenarios from highest to lowest, the order is S3, S2, and S1. Compared with S1, the annualized total costs of S2 and S3 increase by approximately 5.06% and 8.93%, respectively.
This suggests that for the grid-connected microgrid in the case in which thermal power units constitute the majority of the generation mix, the implementation of multi-markets and CCS retrofitting is likely to raise the costs related to microgrid construction and operation to some extent. Detailed analysis and underlying reasons will be elaborated upon later in the manuscript.
Based on the objective function in Section 3.1, the economic analysis of the capacity allocation scheme for the grid-connected microgrid can be mainly conducted in two stages: investment and operation.
Among them, the economic performance of investment can be represented by the annualized investment cost. According to the objective function of the model, the annualized investment cost primarily consists of capital expenditures (CAPEX), which include the investment costs of various equipment and CCS retrofitting costs along with maintenance costs.
Meanwhile, according to the objective function of the lower-level model, the economic performance is characterized by operational expenditures (OPEX) incurred during equipment operation, as well as multi-market costs/revenues.
(1) Investment-stage economic characteristics
Classified by equipment types and CCS retrofitting, the annualized investment cost structures for the three scenarios are illustrated in Figure 10.
From an overall trend perspective, investment costs related to renewable energy equipment constitute the major portion of annualized investment costs, accounting for over 60% in all scenarios. Additionally, in S3, the share of CCS retrofitting costs is notably higher than that of PV, as well as the combined costs of ESS and grid support services, accounting for nearly a quarter of the total. Further detailed analysis is presented as follows.
Combining the data from Table 6 and Figure 10, compared to S1, the installed capacity of renewable generation units in S2 increases from 52,960 kW to 62,010 kW, representing an approximate 17.22% rise. Moreover, S2 demonstrates a stronger preference for investing in WT rather than PV. Specifically, WT capacity expands by 21,890 kW compared to S1, with its cost share rising by 25.80% and the scale of CAPEX increasing by 8.91 million RMB. Conversely, PV capacity decreases by 12,840 kW, with the share in annualized investment costs dropping by 25.92% and the scale of CAPEX decreasing by 4.57 million RMB.
The primary reasons are as follows. On one hand, the implementation of the multi-markets requires the microgrid to comply with RPS and CA regulations to avoid economic penalties. Consequently, this will incentivize the microgrid to increase the investment in renewable generation units, which in turn leads to a rise in the total investment costs. On the other hand, despite the higher unit investment cost of WT compared to PV, Figure 6 and Figure 7 indicate that the wind energy resources in this case significantly outperform solar resources. Taking the duration during which the generating units’ per-unit output exceeds 0.5 as an example, WTs operate for approximately 7 more hours than PVs, thus demonstrating greater potential for renewable energy generation.
Additionally, in S2, the investment capacity for ESS increased by 3430 kW, whereas that for grid support services decreased by 326 kW. Consequently, the corresponding CAPEX increased by 0.53 million RMB and decreased by 0.53 million RMB, respectively. In other words, the increases and decreases in CAPEX for these two aspects largely offset each other. This is because ESS enhances the microgrid’s capability to allocate generating unit output resources across different time scales, thereby reducing its reliance on grid support services to a certain extent. Ultimately, this enables the microgrid to more effectively improve its capacity for renewable energy consumption and carbon emission reduction, meeting the requirements of RPS and CA.
In S3, the annualized investment cost for CCS retrofitting and other related expenses reached 5.29 million RMB, accounting for approximately 18.42% of the total. Among them, the annualized CAPEX stands at 2.04 million RMB. Notably, compared to S1 and S2, the installed capacity of renewable generation units in S3 declined to 40,250 kW, representing reduction rates of 23.99% and 35.09%, respectively. Consequently, the proportion of renewable energy-related costs contracted to 64.92%, and the annualized CAPEX decreased by 8.25 million RMB and 4.21 million RMB, respectively.
To a certain extent, this phenomenon suggests that in China’s current market environment—which is characterized by continuously rising carbon trading prices and persistently low GEC prices—the revenue potential from carbon trading significantly surpasses that from GEC trading, RPS penalties, and curtailment costs.
Therefore, under the constraints of limited investment scale and stable load scale, S3 tends to allocate more financial resources to CCS retrofitting. By reducing investments in renewable energy units, it seeks to enhance revenue-generating capabilities in the carbon market. However, considering the currently high costs associated with CCS retrofitting, this strategy also increases the microgrid’s costs during the investment stage to a certain extent.
Additionally, compared to S1 and S2, the investment capacities for ESS and grid support services in S3 are 2254 kW and 2580 kW, respectively. Notably, the capacity of grid support services sees a significant increase, with corresponding CAPEX rising by 0.37 million RMB and 0.425 million RMB, respectively. Beyond the reduced capacity allocation to renewable generation units, the operational constraints induced by the CCS impose additional limitations on the net output capability of the CCPP. Consequently, the cumulative effect of these factors results in a decline in the microgrid’s power supply capacity during peak load periods in S3, thereby requiring increased power support from the grid to maintain system supply–demand balance.
(2) Operation stage economic characteristics
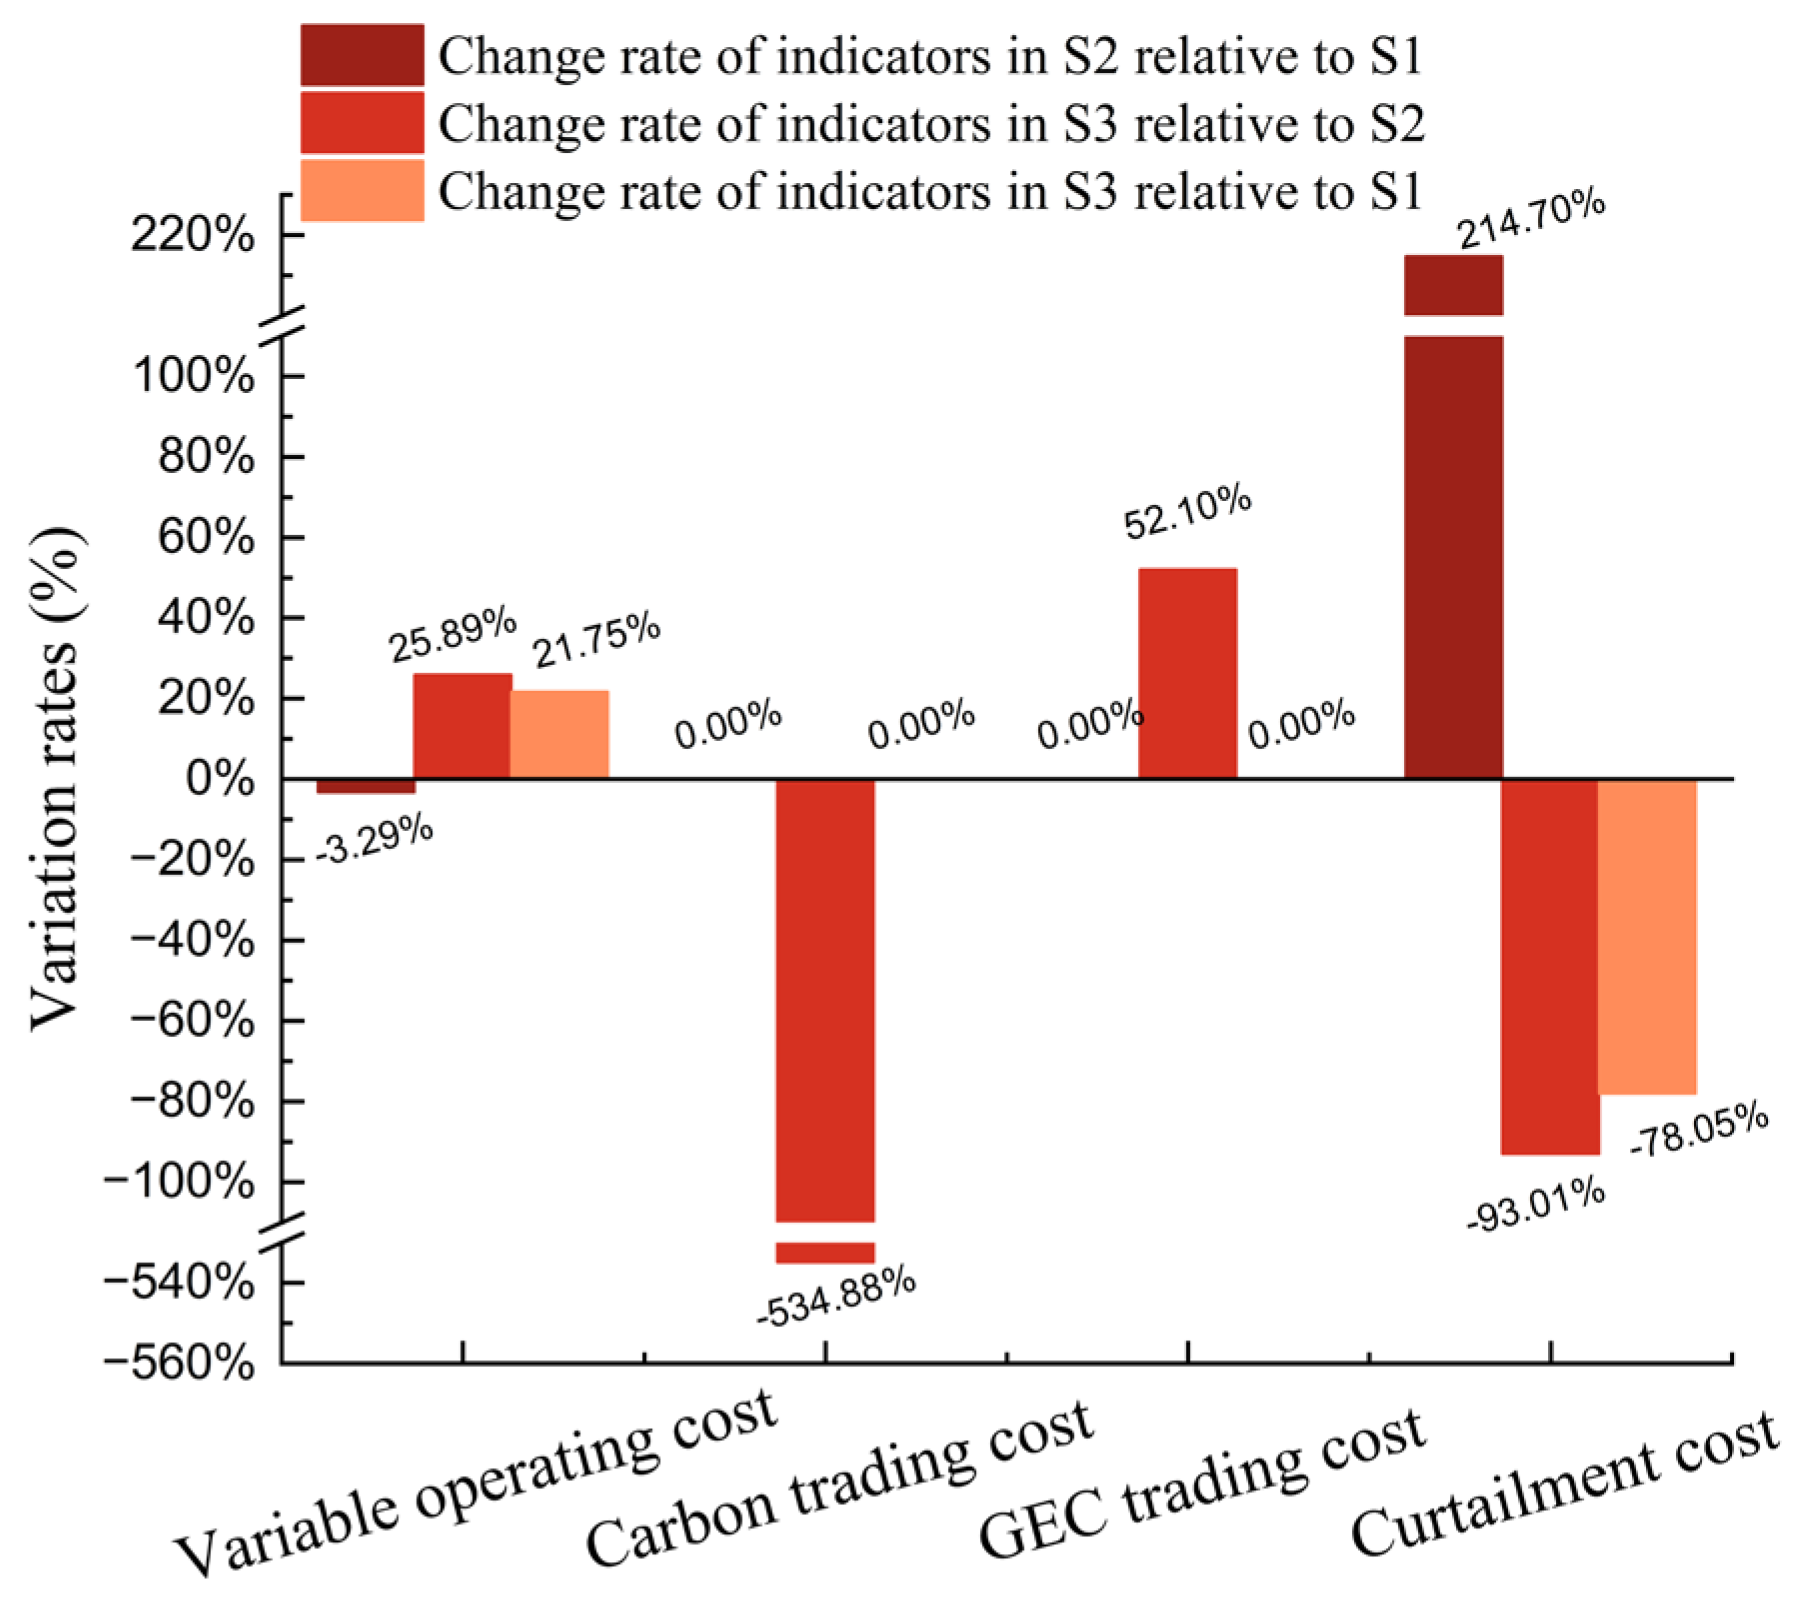
The variation rates of typical operational cost components across three scenarios are illustrated in Figure 11. Among them, variable operating costs can represent OPEX, primarily encompassing unit fuel costs, charging and discharging costs, and MEA degradation costs. Meanwhile, carbon trading costs, GEC trading costs, and curtailment costs reflect market revenues or penalties related to compliance policies.
Compared to S1, S2 exhibits a 3.29% reduction in variable operating costs and a 214.07% surge in curtailment costs. This means a reduction in OPEX of 6.95 million RMB, while penalties for curtailment increased by 1.64 million RMB. Additionally, due to the presence of multi-markets, new costs emerged, including 7.31 million RMB in carbon trading costs and 3.61 million RMB in GEC trading costs. This disparity primarily originates from S2’s significant expansion of renewable generation capacity under compliance arrangements, particularly WT installations. The primary causes are as follows.
First, the displacement of thermal power output by renewable generation effectively decreases variable operating costs for microgrid equipment while concurrently mitigating potential costs associated with GEC trading and carbon trading.
Second, given the constraints on load scale and the limited flexibility of the thermal power unit, a significant increase in the capacity of renewable energy units—particularly WTs, which exhibit certain inverse correlation characteristics with load demand—will inevitably lead to a rise in curtailment and the associated costs. Since the current costs of GEC trading and carbon trading are substantially higher than the curtailment cost, S2 prioritizes controlling variable operating costs and potential GEC/carbon trading costs, even at the expense of accepting higher curtailment costs.
For S3, compared with S1, the variable costs increased by 21.75%, while curtailment costs decreased by 78.05%. This resulted in an increase in OPEX of 45.94 million RMB, while penalties for curtailment decreased by 0.6 million RMB; compared with S2, variable costs and GEC trading costs rose by 25.89% and 52.10% respectively, whereas carbon trading costs and curtailment costs declined by 534.88% and 93.01% correspondingly. This led to an increase in OPEX of 52.89 million RMB and an increase in market transaction revenues of 37.29 million RMB. These phenomena indicate the following implications.
From a multi-market transaction perspective, the application of CCS can significantly reduce carbon trading costs. In the case study, while S2 incurred annual carbon trading expenses of 7.31 million RMB, S3 generated 31.79 million RMB in carbon trading revenue—sufficient to fully offset additional costs from GEC trading and other expenditures caused by reduced installation of renewable energy capacity.
From the perspective of equipment operation, as analyzed in Section 2.1, the application of CCS significantly enhances the operational flexibility of the microgrid, thereby improving renewable energy accommodation capacity and reducing curtailment costs. However, CCS deployment also substantially increases equipment variable costs, attributable to the current high costs and limited efficiencies in absorption/desorption processes, compression processes, and MEA solvent performance. This phenomenon, coupled with the CCS retrofitting capital costs mentioned in (1), collectively elevates the total costs in S3. Suboptimal techno-economic performance has become a critical barrier to large-scale implementation of CCS retrofit projects in practical engineering applications, which aligns with findings from existing studies on CCS and CCPP [12,13].

4.3.2. Environmental Characteristics of Allocation Schemes

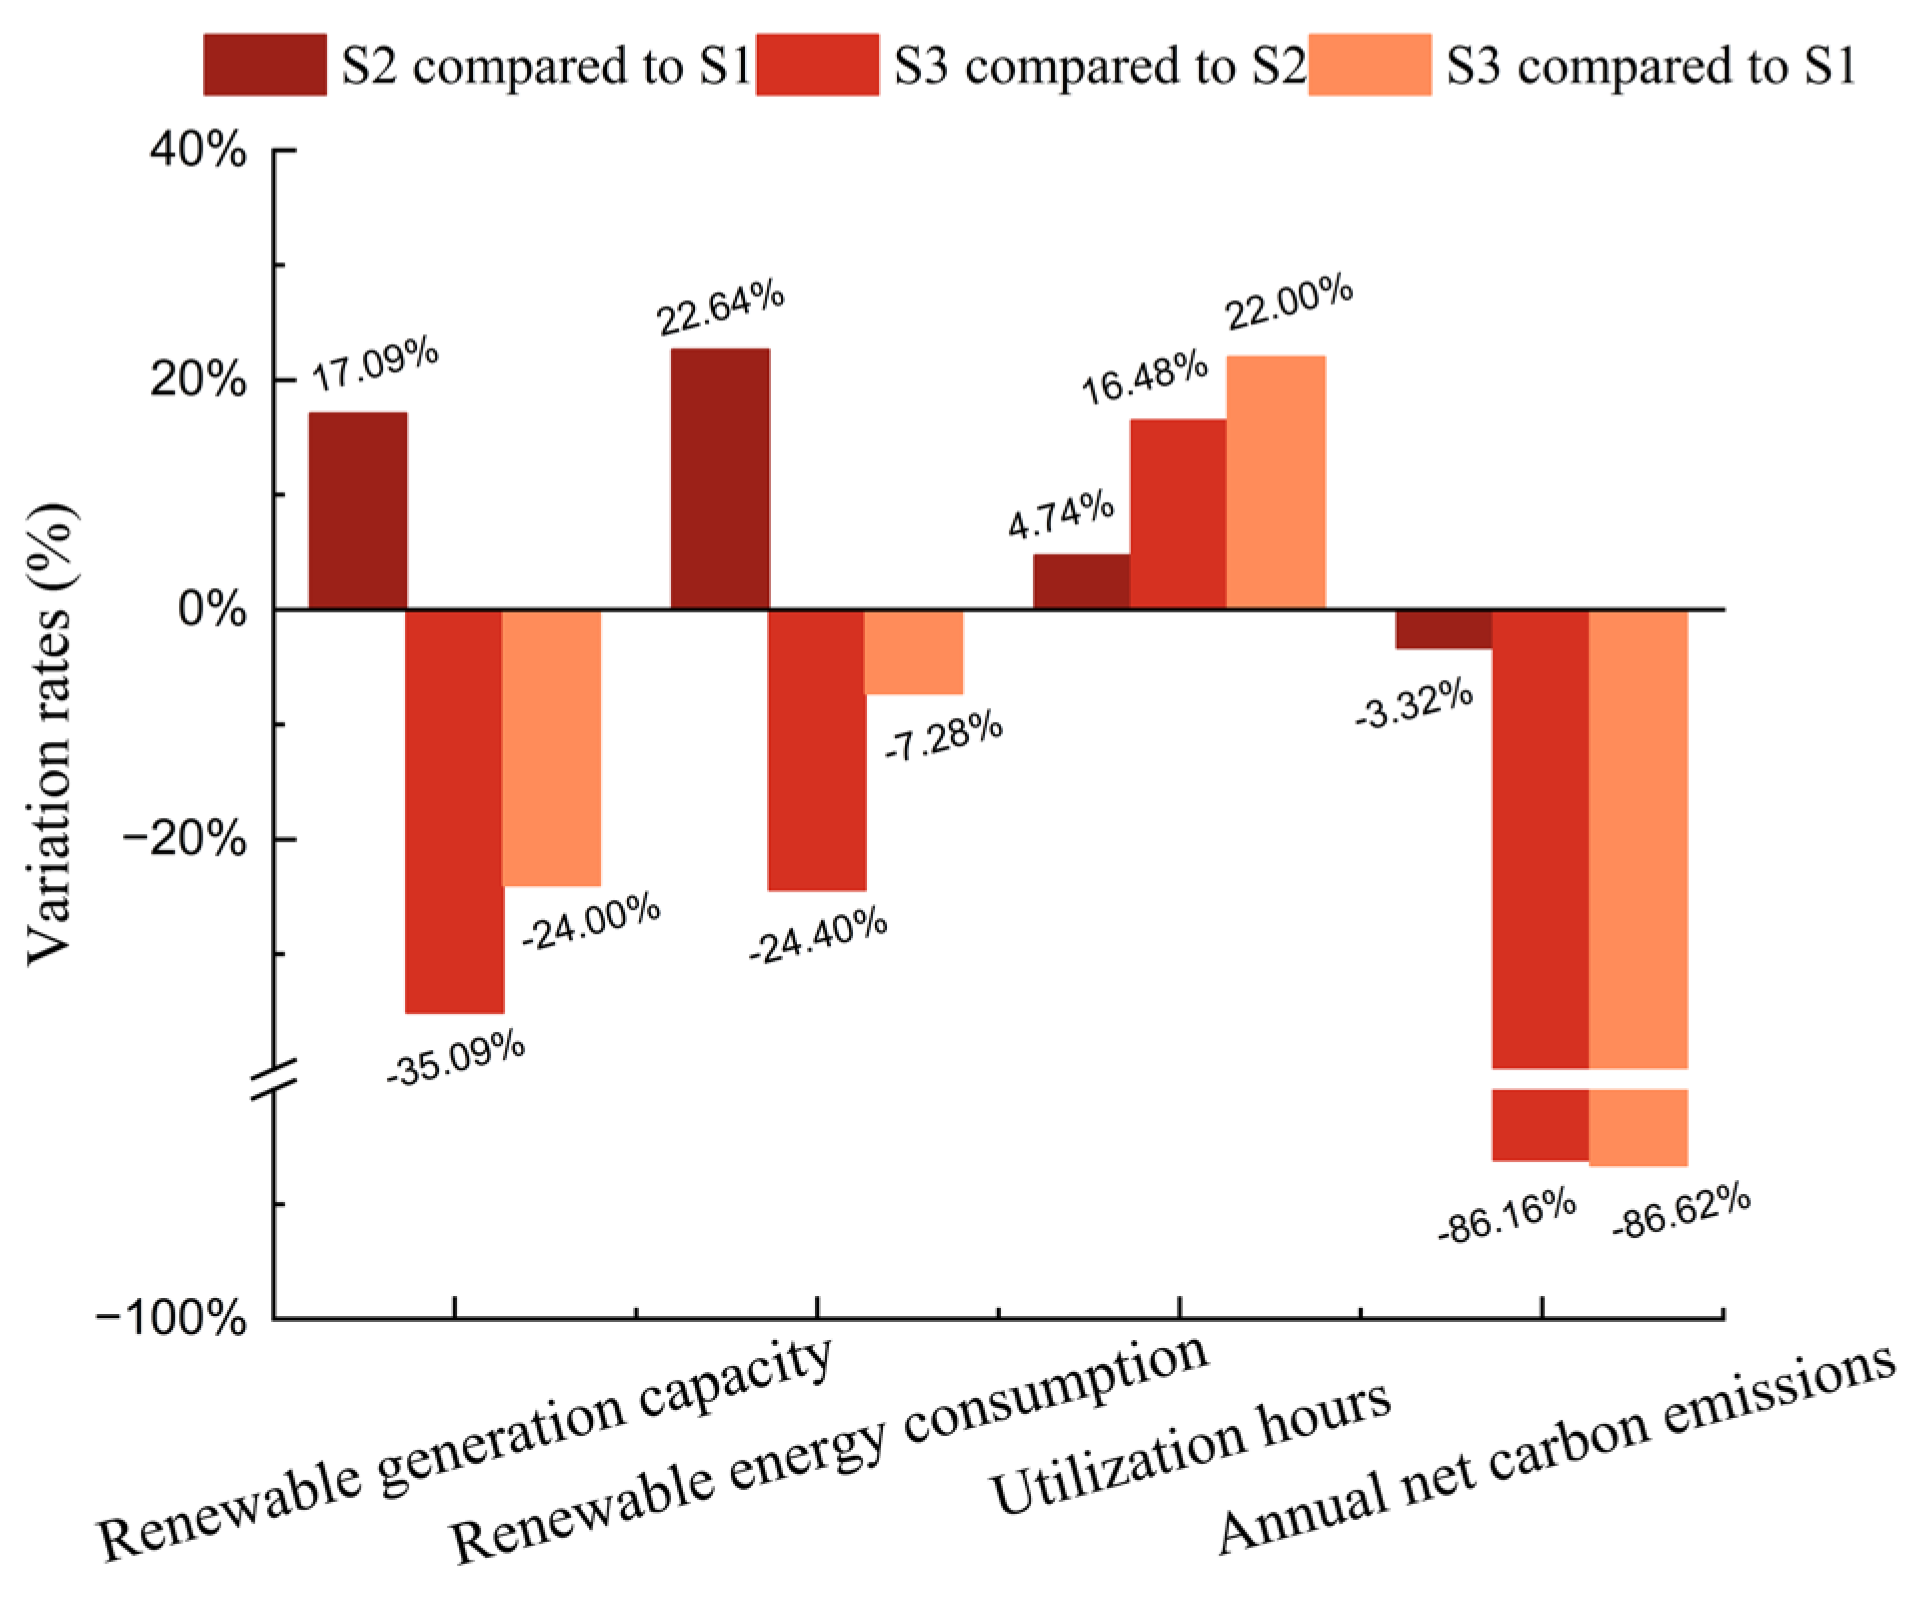
The typical environmental characteristic indicators and their variation rates in three scenarios are presented in Figure 12 and Figure 13.
In S2, the total installed capacity, consumption volume, and utilization hours of renewable energy reached 62,010 kW, 154.21 GWh, and 2486.80 h, respectively, representing increases of 17.09%, 22.64%, and 4.74% compared to S1. Additionally, the net carbon emissions amounted to 543.68 kilotons (kt), showing a 3.32% reduction from S1. These findings indicate that the implementation of the multi-markets and corresponding compliance arrangements effectively enhances microgrid utilization of renewable energy while reducing net carbon emissions, though the carbon mitigation effect remains limited.
In S3, when compared to S1 and S2, the installed renewable generation capacity decreased (Table 6), resulting in approximately 7.28% and 24.40% reductions in renewable energy consumption, respectively. However, the utilization hours of renewable generation units reached 2896.59 h, representing increases of 22.01% and 16.48% over S1 and S2. Moreover, the annual net carbon emissions in S3 amounted to 72.76 kt, showing significant reductions of 86.62% and 86.16% compared to S1 and S2.
These findings demonstrate that the application of CCS in microgrids effectively enhances the development and utilization efficiency of renewable energy resources, thereby reaffirming the conclusion in Section 4.3.1. Furthermore, S3 achieves over 86% carbon emission reduction with an annualized cost increase no greater than 10% (Section 4.3.1). This situation further substantiates the significant efficacy of CCS retrofits in improving environmental performance and reducing net emissions of grid-connected microgrids.

4.3.3. Operational Characteristics

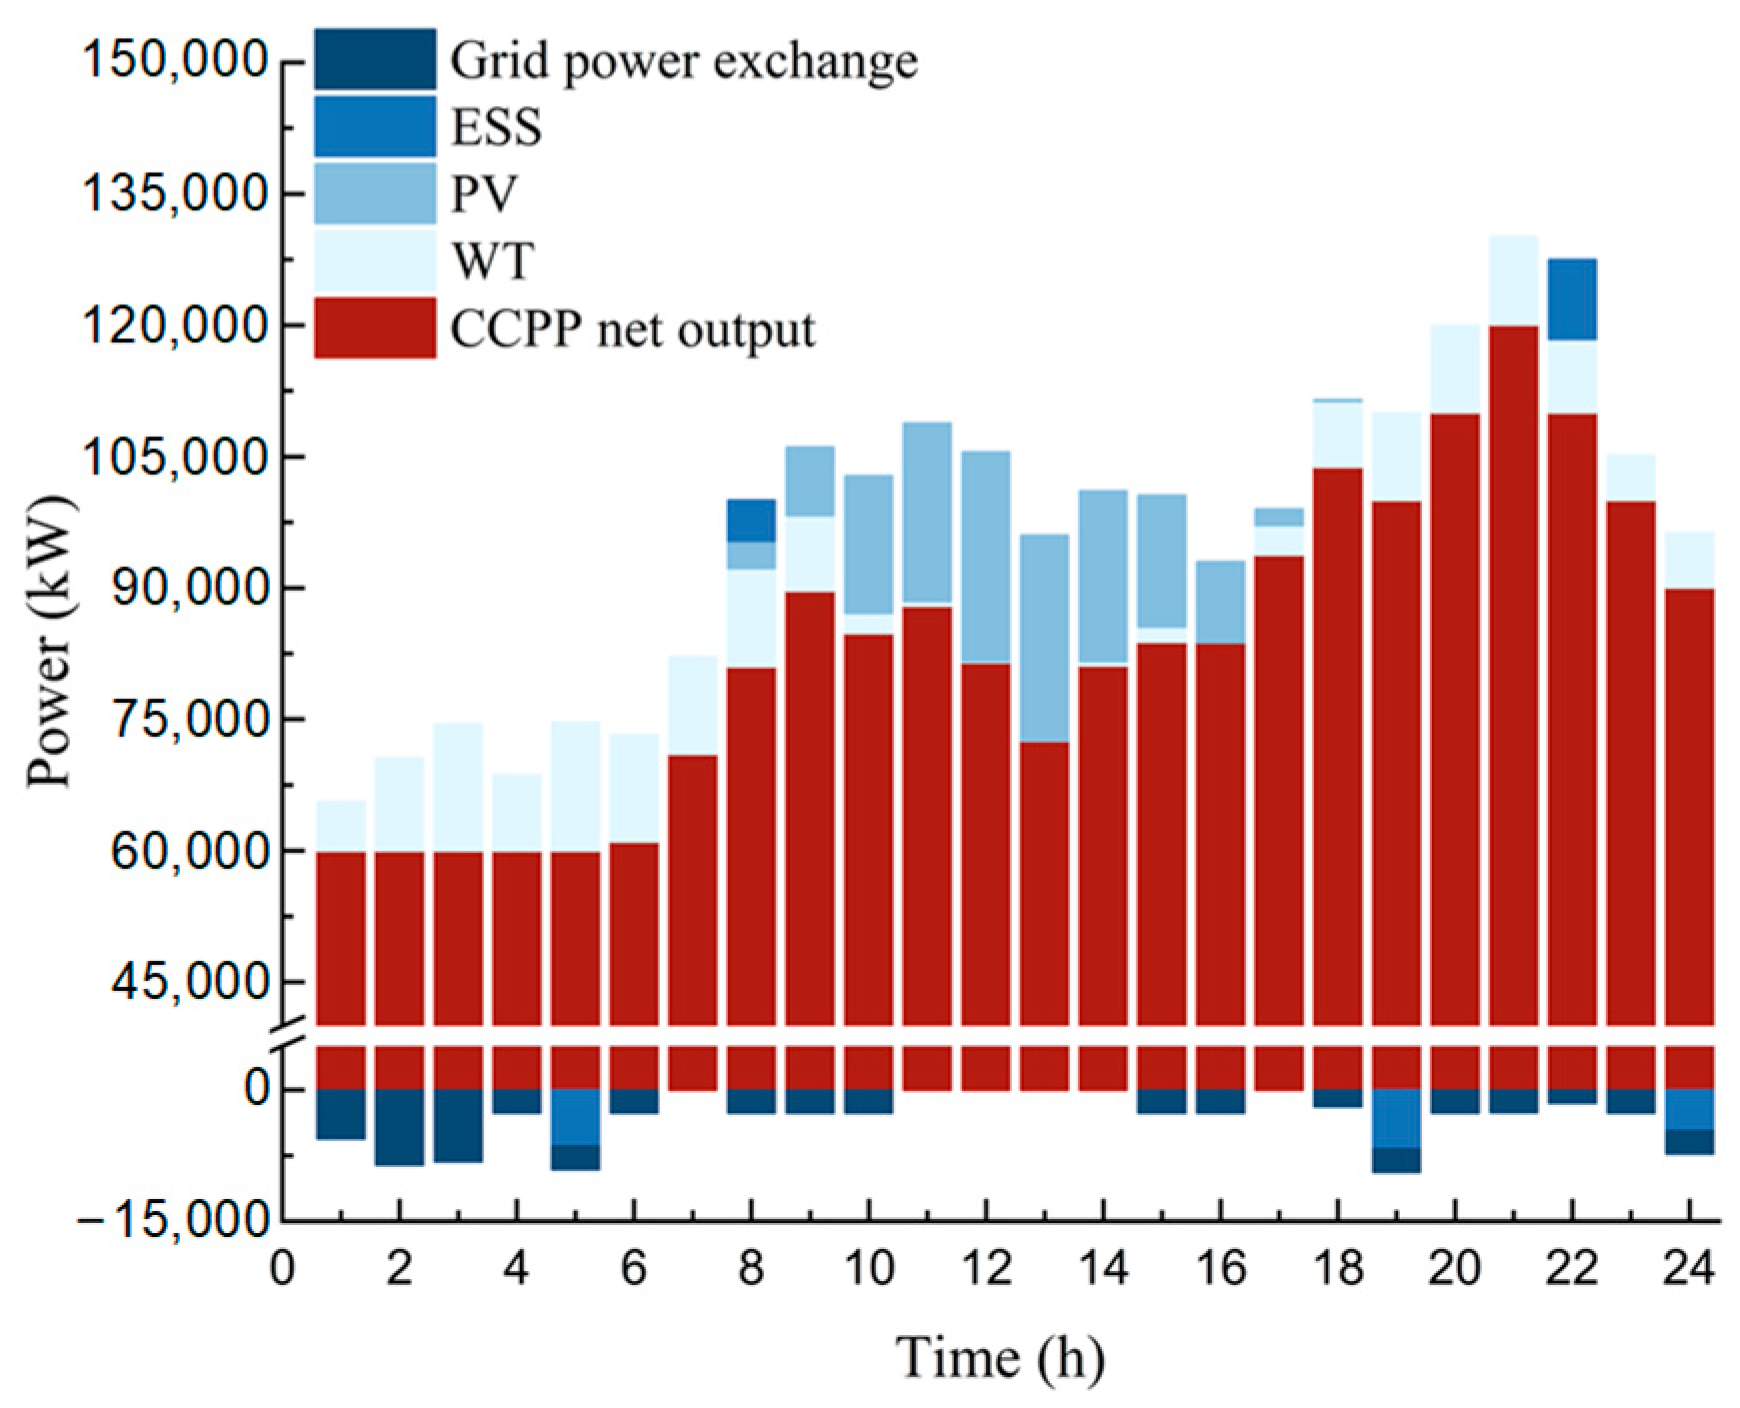
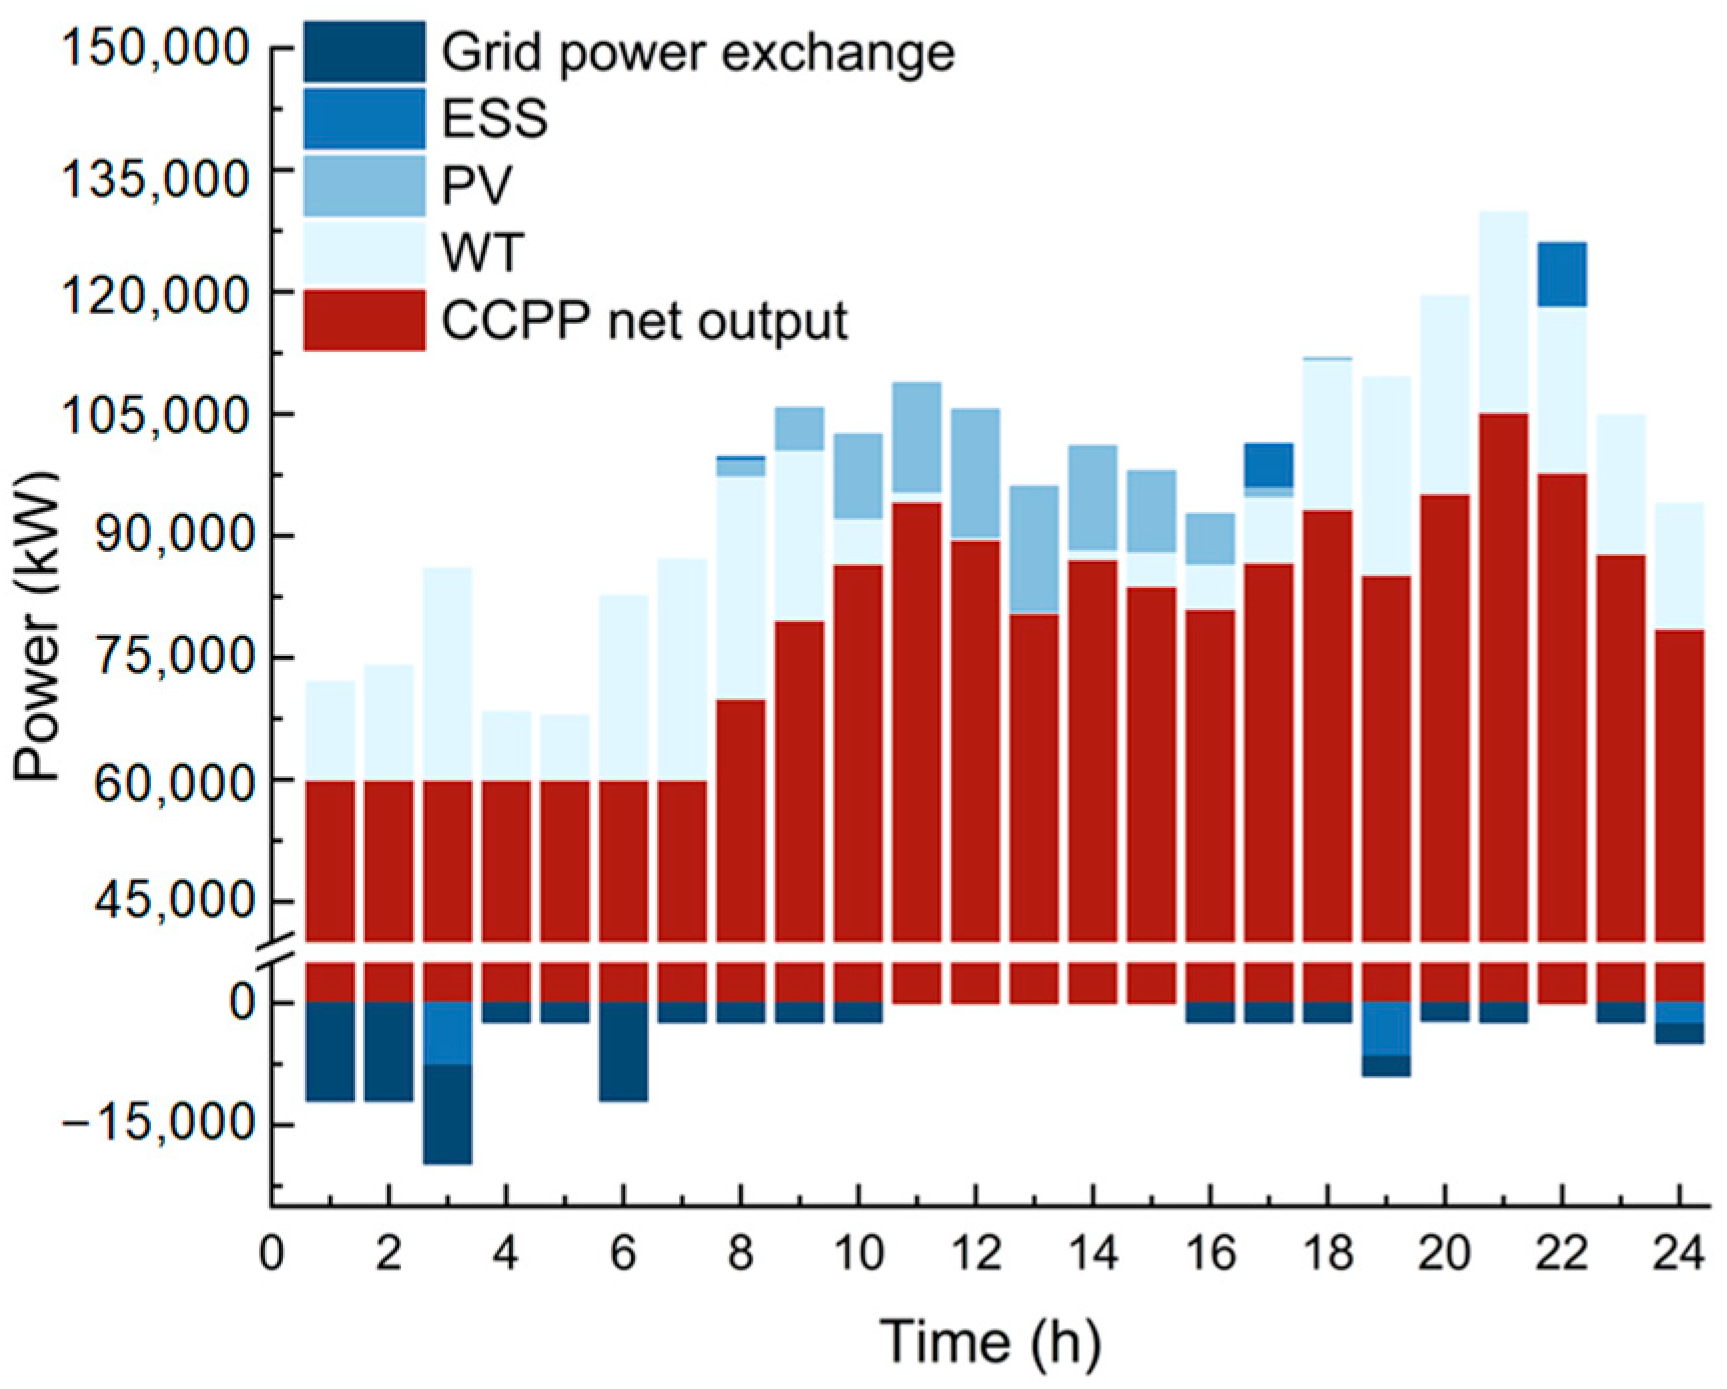
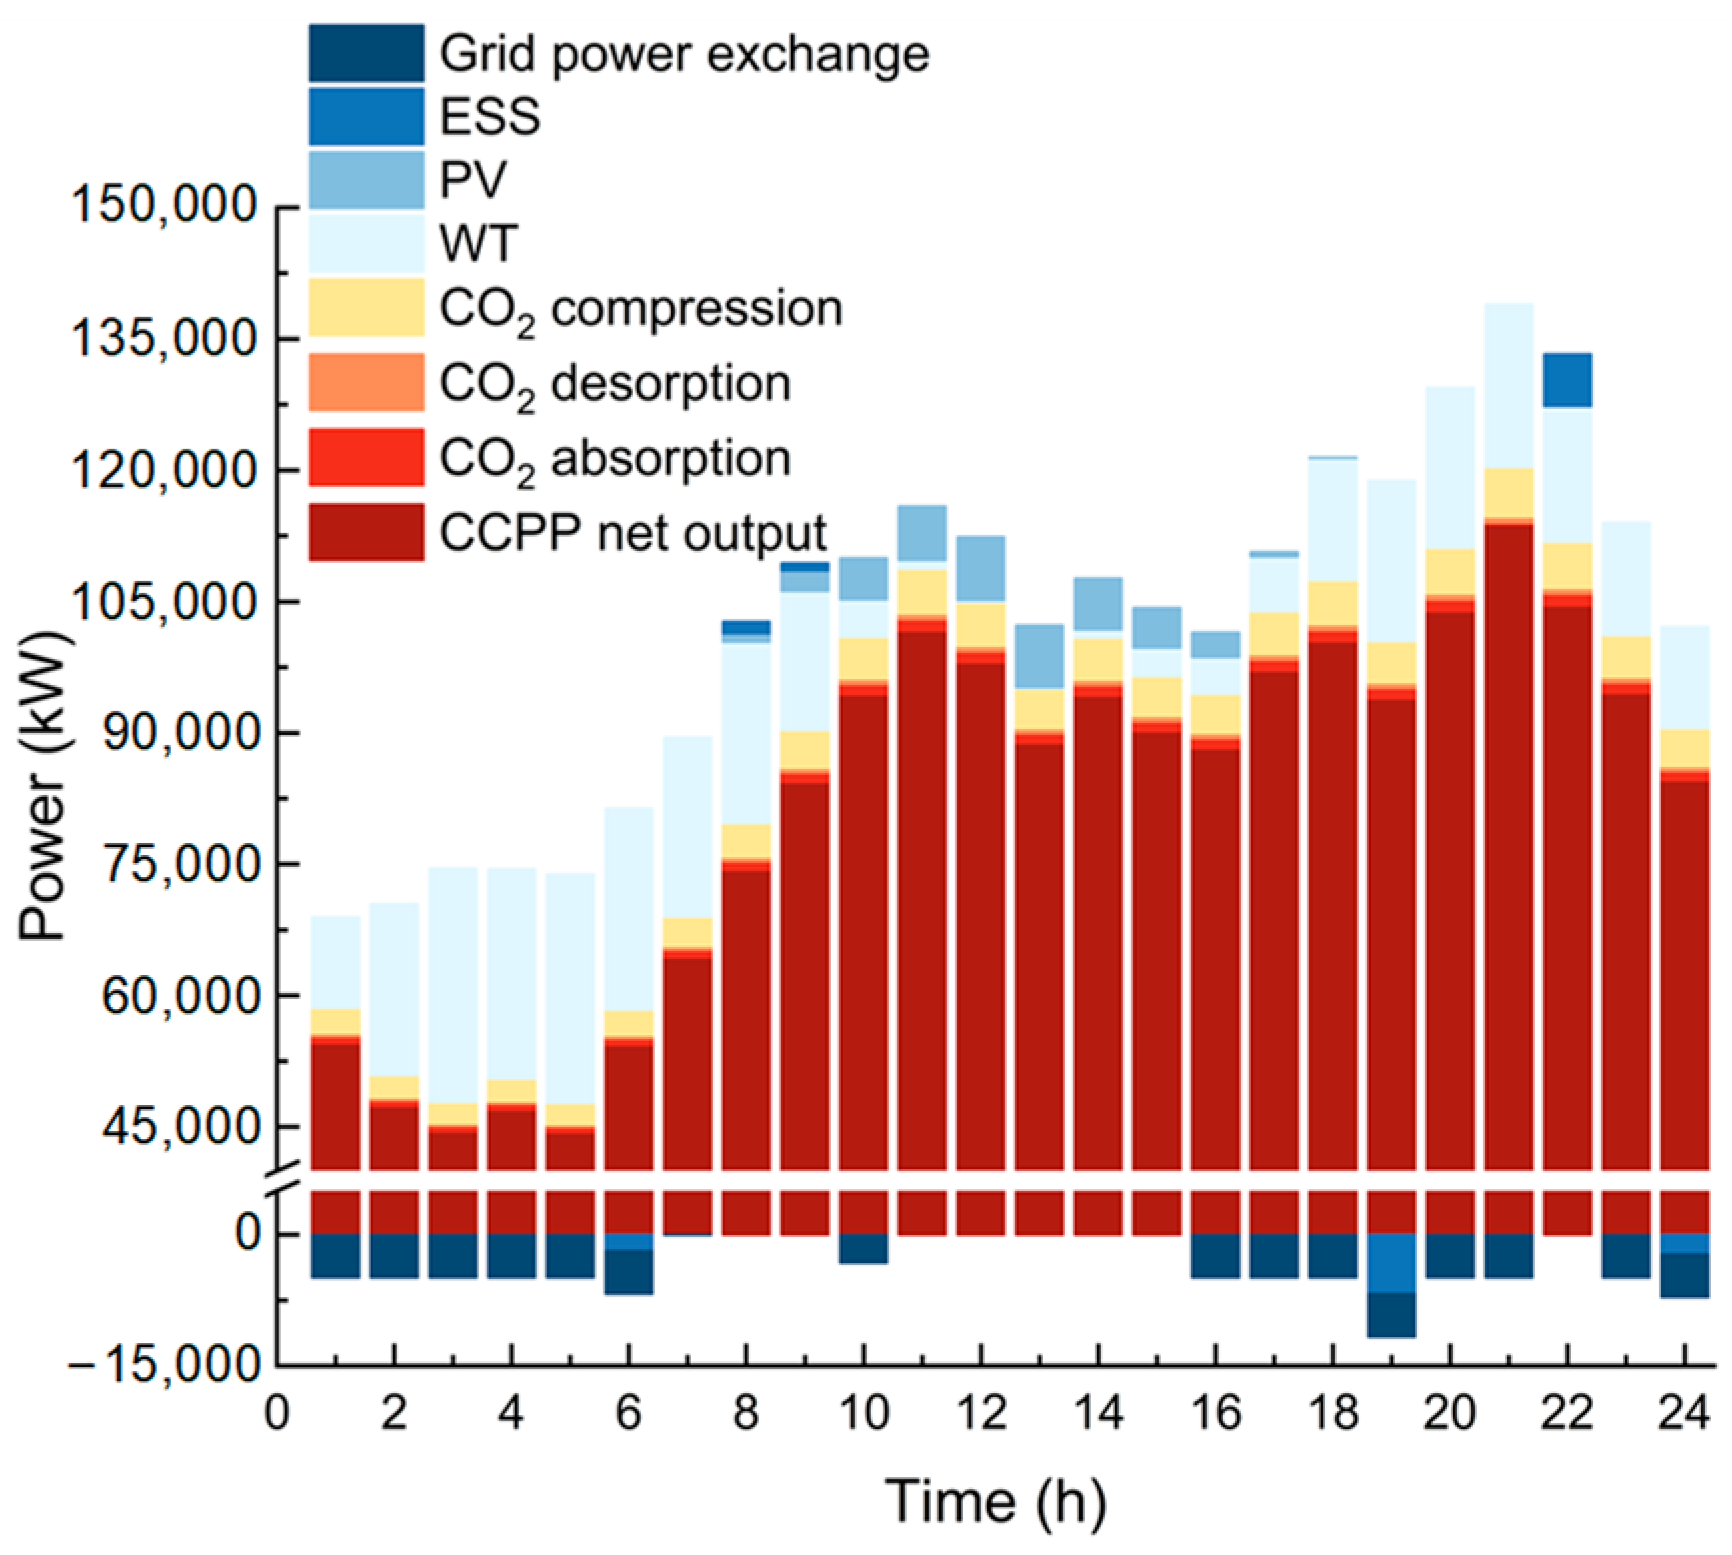
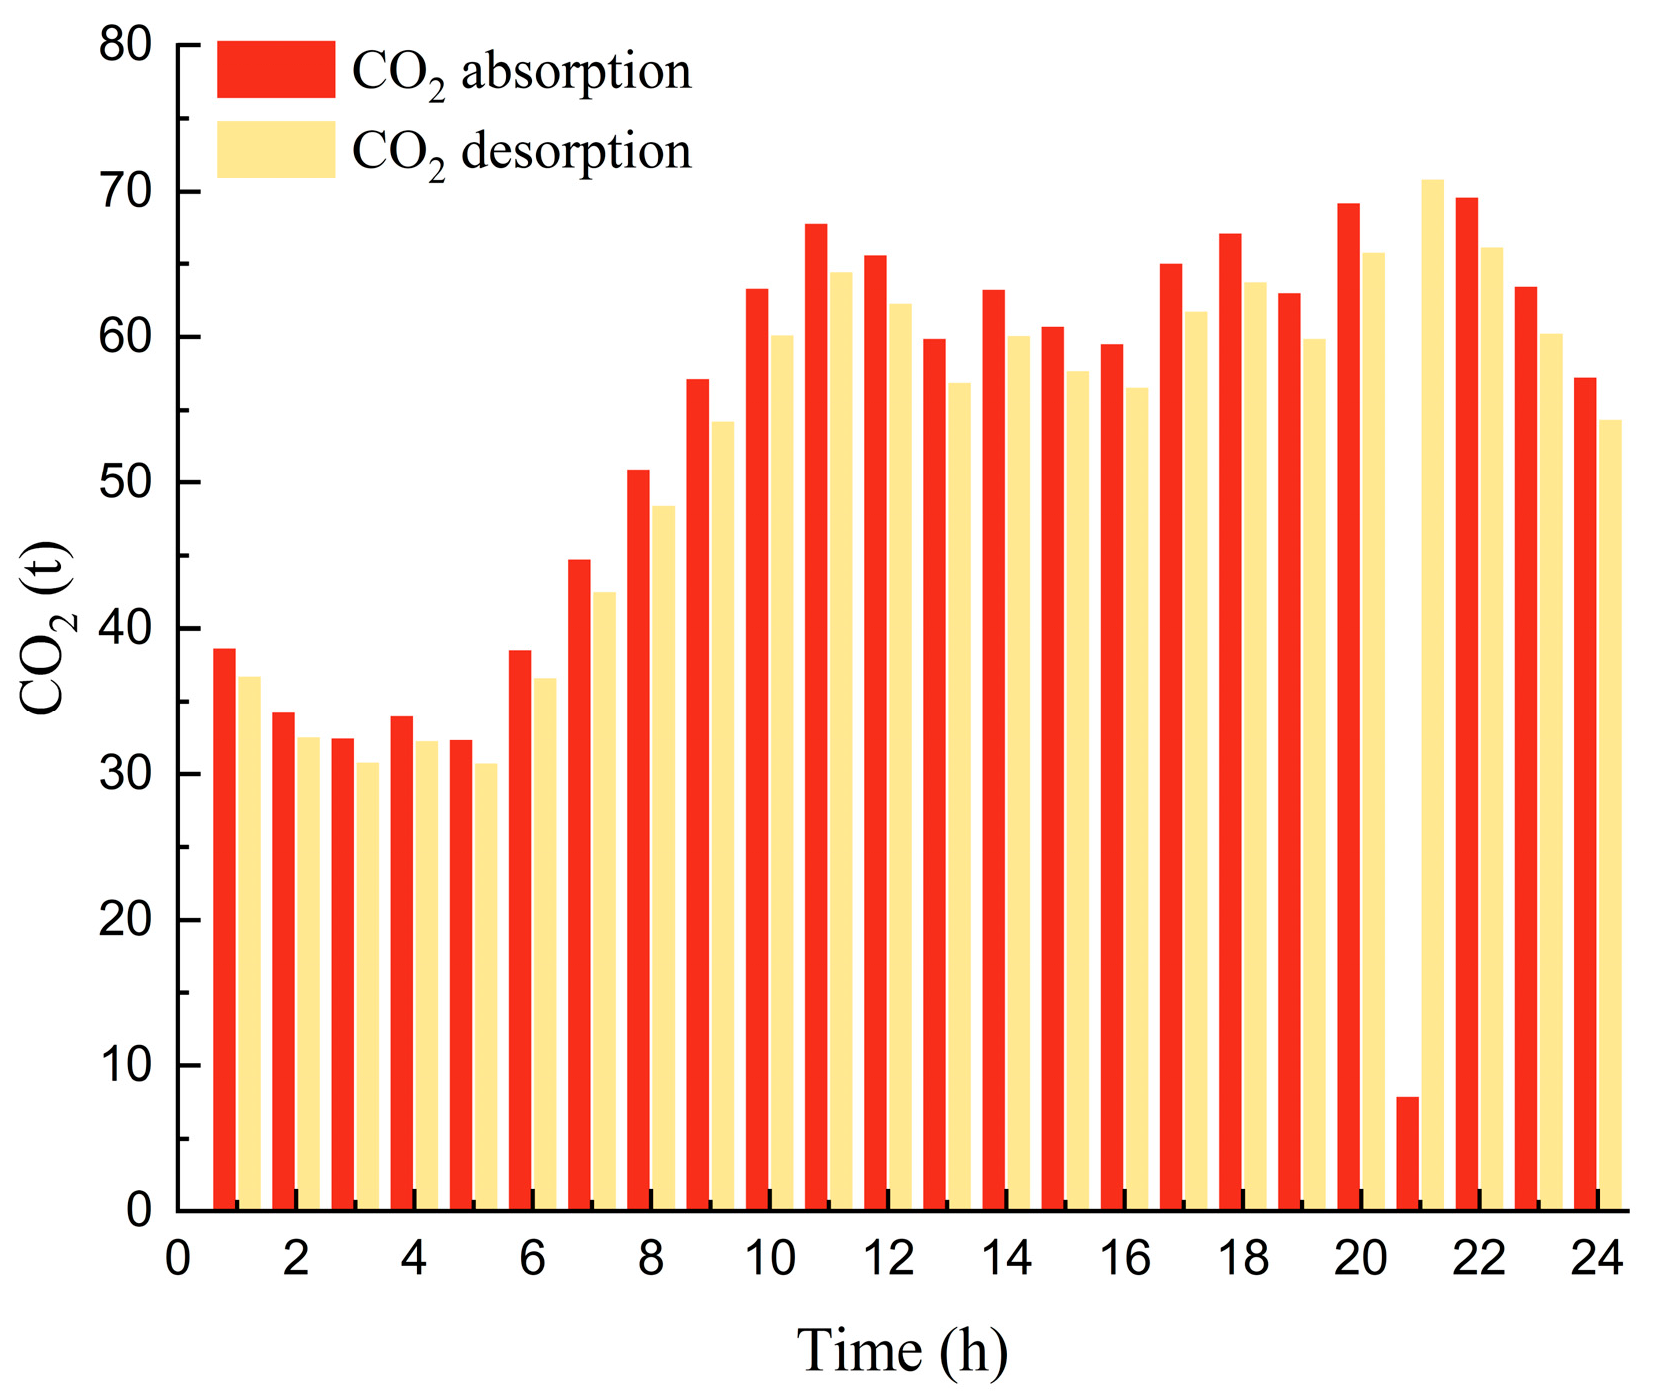
To further analyze the impact of CCS retrofitting on the operational characteristics of microgrid, taking the typical winter day as the example. Specifically, Figure 14, Figure 15, and Figure 16, respectively, illustrate the equipment scheduling as well as the wind and solar power curtailment situations in S1, S2, and S3. Figure 17 demonstrates the absorption and desorption conditions of CCS in S3.
From an overall trend perspective, thermal power units/CCPP serve as the primary energy-supplying equipment across all three scenarios, with their energy output accounting for over 60% of the total energy supplied by all equipment. Additionally, due to output range constraints, the minimum load rate of thermal power units/CCPP is 30%, primarily occurring between 1:00 and 7:00. During this period, the load is relatively low, while WT output is high, necessitating the thermal power units/CCPP to minimize output to accommodate renewable energy consumption. Conversely, the maximum load rate of thermal power units/CCPP can reach approximately 60%, typically occurring around 21:00. This is because it represents the peak load period, during which PV is unable to generate power, and WT output has not yet reached its peak, requiring thermal power units/CCPP to undertake peak-shaving responsibilities.
During the period from 1:00 to 6:00, the output of the thermal power unit in S1 and S2 is almost identical. Moreover, both scenarios experience wind power curtailment, with the amount of curtailed wind power in S2 being significantly higher than that in S1. In contrast, the net output of the CCPP in S3 is markedly lower than that in S1 and S2, and there is no wind power curtailment.
This is because this period represents a low-load period and a peak output period for WT. Despite the penalties for curtailment, the downward regulation capability of the thermal power unit is constrained by the minimum output limits. This forces S1 and S2 to curtail wind power to ensure the safe operation of the microgird. Additionally, due to the existence of multi-markets and compliance constraints in S2, the installed capacity of WT is relatively large (refer to Section 4.3.1 for relevant analysis), which further exacerbates the wind power curtailment phenomenon.
In S3, the CCS retrofitting significantly enhances the flexibility of the thermal power unit in two aspects: output range and ramping capability. Compared to S1 and S2, this enhancement allows for a further reduction in the net output of the thermal power unit/CCPP. As a result, it frees up capacity to accommodate WT output, improving unit utilization efficiency and effectively mitigating power curtailment. This improvement in power curtailment is also observed to a certain extent during other periods with high renewable energy output, such as 15:00–16:00 and 23:00.
In addition, it is noteworthy that at 21:00, there is a sharp decline in CO2 absorption and a continuous increase in desorption in S3. In this case, the CO2 absorption and desorption processes exhibit a highly distinct “decoupled” state. The main reason is that 21:00 represents a peak load period on the typical day, while the output capacity of renewable energy units is relatively limited at this time. The CCPP makes full use of the buffer space in the storage tank. By appropriately increasing the desorption amount, it significantly reduces the CO2 absorption and the corresponding power. This way, it provides a greater upward ramping space for the net output of the CCPP and effectively ensures the supply–demand balance of the microgrid system. Meanwhile, it also provides sufficient lean solvent resources for subsequent scheduling processes to capture and absorb CO2.

5. Conclusions and Implications

5.1. Conclusions

This manuscript analyzes how liquid-storage CCS retrofitting technology enhances thermal power unit flexibility. By integrating relevant arrangements, a bi-level optimization model is developed for grid-connected microgrids’ capacity allocation considering CCS retrofitting under multi-market conditions. A case study in southern China is conducted to analyze sustainable development characteristics, including economic and environmental performance. Relevant conclusions are then drawn from this analysis.
  • Under the guidance of China’s carbon neutrality goals and the application of multi-markets, grid-connected microgrids will increase the investment in renewable energy generator units and ESSs. Although this leads to a significant improvement in renewable energy consumption, the reduction achieved in carbon emissions is limited. Additionally, owing to the combined effects of low curtailment penalties and constrained adjustment ranges/ramping capabilities of thermal power units, the amount of curtailed electricity may rise noticeably. Consequently, this results in a decline in investment and development efficiency. In the case study, compared to the traditional microgrid capacity allocation scenario, the installed capacity of renewable energy increased by 17.09%, renewable energy consumption rose by 22.64%, and net carbon emissions decreased by only 3.32%. However, the amount of curtailed electricity nearly doubled. This situation, to a certain extent, deviates from the original intentions of policies such as carbon neutrality and renewable energy incentives and is not conducive to sustainable energy development. It also represents a potential risk that has been largely overlooked in most existing studies.
  • Incorporating CCS retrofitting does not necessarily result in an increased investment scale in renewable energy generation units but can significantly enhance the utilization hours of renewable energy units and reduce curtailment and correspondingly costs. In the case study, compared to the traditional scenario, the installed capacity of renewable energy units in the scheme incorporating CCS retrofitting decreased by 24.00%. However, renewable energy consumption only declined by 7.28%. Moreover, the utilization hours increased by 22.00%, and the amount of curtailed power dropped by 78.05%. The application of liquid-storage CCS markedly improved the asset utilization efficiency of renewable energy unit and reduced the risk of redundant capacity configuration. This provides a technical pathway reference for the transformation and sustainable development of the energy sector and also offers crucial support for the realization of China’s carbon neutrality goals.
  • CCS retrofitting can significantly reduce the net carbon emissions and carbon trading costs but may lead to a certain degree of increase in the overall cost of the scheme. In the case study, compared to the traditional scenario and the multi-market scenario without considering CCS retrofitting, the application of CCS could reduce net carbon emissions by over 86%. Nevertheless, the equivalent annual worth of the comprehensive cost increased by 8.93% and 3.68%, respectively. Constrained by factors such as the currently limited scale of carbon trading revenues and the suboptimal techno-economic performance of CCS, there arises a conflict between balancing environmental protection and economic efficiency. This poses significant challenges for the large-scale promotion of CCS in practical engineering projects.

5.2. Implications

To a certain extent, the research in this manuscript has elucidated the impacts of multi-markets and CCS retrofitting on the economic efficiency and environmental performance of capacity allocation for grid-connected microgrids. In future research, policy-making processes, and practical work, the following aspects warrant particular attention.
  • In terms of research directions, this manuscript exhibits certain limitations in risk factors and scenario design. In the future, as multi-market operations normalize and CCS technology advances, research on capacity allocation can be conducted with respect to the following scenarios: uncertain risk factors related to cross-market pricing systems and demand-side management; competitive–cooperative game trading among microgrids; phased CCS retrofitting integrated with multi-objective optimization; and scenarios considering grid infrastructure constraints.
  • In terms of policy formulation, working towards the carbon neutrality goal, despite the varying focuses of different renewable energy policies (RPS emphasizes incentivizing the demand side to consume renewable energy, while penalties for curtailment focus on guiding the supply side to enhance utilization efficiency), the emergence of multi-market entities with dual producer–consumer roles, represented by grid-connected microgrids, may lead to redundant assessments among different renewable energy policy tools. Moreover, the current average price in China’s carbon market is approximately 95 RMB/t, which still lags behind that of the EU carbon market (around 80 USD/t, equivalent to approximately 570 RMB/t) and the California carbon market in the United States (about 45 USD/t, equivalent to approximately 320 RMB/t). Despite China’s proactive efforts to integrate into the global carbon trading market system, mechanisms regarding carbon pricing remain unclear, posing arbitrage risks. In summary, future attention should be focused on environmental value allocation, information sharing and value conversion/calculation/offset/cancellation among different markets/mechanisms, setting limits on transaction price fluctuations, as well as aligning mechanisms for quota allocation. Research and formulation of policies that meet the demands of a cross-market, cross-policy system, and even a cross-international market mechanism, will be key.
  • In terms of practical work, the government can target entities such as public utility companies and other entities and expedite the iterative process between the research, development, and application of CCS by formulating reasonable subsidy and financing mechanisms, flexibly adopting diverse business models represented by Public–Private Partnerships (PPPs), and establishing CCS–microgrid pilot demonstration projects. These measures will drive advancements in the technical and economic characteristics of related industries, providing vital technological support for the realization of carbon neutrality. For market entities represented by microgrids, given that China’s carbon market is in its nascent stage with relatively low price levels, the corresponding transaction costs account for less than 10% of a microgrid’s annual total costs. However, as China gradually integrates into the international trading system, market supply, trading mechanisms, and price levels may encounter significant uncertainties and disruptions. Market entities need to actively monitor relevant policy trends, take into account the maturity and technical–economic characteristics of zero-carbon and negative-carbon technologies, and formulate reasonable equipment/system construction plans and business expansion strategies to enhance their resilience against operational risks.

Author Contributions

Conceptualization, Y.X., Y.L., S.L. and M.Z.; methodology, Y.X., J.M. and M.Z.; software, Y.X. and J.M.; validation, Y.X., Y.L. and S.K.; formal analysis, Y.X., Y.L. and S.K.; data curation, Y.X., Y.L. and S.K.; writing—original draft preparation, Y.X. and J.M.; writing—review and editing, Y.X., J.M. and S.L.; funding acquisition, Y.X. All authors have read and agreed to the published version of the manuscript.

Funding

This research was supported by the China Postdoctoral Science Foundation. Grant Number 2024M753545.

Institutional Review Board Statement

Not applicable.

Informed Consent Statement

Not applicable.

Data Availability Statement

The data presented in this study are available on request from the corresponding author.

Conflicts of Interest

Authors Yanbin Xu, Yi Liao, Shifang Kuang and Shasha Luo were employed by the company China Energy Engineering Group Guangdong Electric Power Design Institute Co., Ltd. The remaining authors declare that the research was conducted in the absence of any commercial or financial relationships that could be construed as a potential conflict of interest.

References

  1. National Energy Administration. National Electric Power Industry Statistical Data from January to June 2025. Available online: https://www.nea.gov.cn/20250723/d7a5d6cc916e40bcb04c7d7e74d03213/c.html (accessed on 21 August 2025).
  2. Li, G.; Liu, X.; Xin, Y.; Jiang, T.; Yan, K.; Wang, T. Research on frequency stability of power system with high penetration renewable energy: A review. High Volt. Eng. 2024, 50, 1165–1181. [Google Scholar]
  3. Wu, Q.; Bose, A.; Singh, C.; Chow, J.H.; Mu, G.; Sun, Y.; Liu, Z.; Li, Z.; Liu, Y. Control and stability of large-scale power system with highly distributed renewable energy generation: Viewpoints from six aspects. CSEE J. Power Energy Syst. 2023, 9, 8–14. [Google Scholar] [CrossRef]
  4. National Energy Administration. Notification on Matters Concerning the Orderly Promotion of Direct Green Power Connection Development. Available online: https://www.ndrc.gov.cn/xxgk/zcfb/tz/202505/t20250530_1398138.html (accessed on 21 August 2025).
  5. Liu, T.; Shu, Y.; Shu, T.; Liu, N.; Zhao, L.; Huang, H.; Zhao, Y. Optimization configuration method of hybrid energy storage for desert-gobi-wasteland new energy base considering retrofit of molten salt heat storage coupled with thermal power unit. Proc. CSEE 2025, 1–15. [Google Scholar] [CrossRef]
  6. Yuan, T.; Wang, K.; Teng, Y.; Deng, Z. Review and prospect of hydrogen energy to enhance the flexibility of thermal power generating units. High Volt. Eng. 2025, 51, 2061–2077. [Google Scholar] [CrossRef]
  7. Chu, Z.; Yuan, J. Optimization and scheduling of comprehensive energy systems considering ammonia refrigeration and ammonia blending in thermal power plants. Electr. Power Constr. 2025, 46, 92–104. [Google Scholar]
  8. Cui, Y.; Jiang, S.; Fu, X.; Tong, X.; Xu, Y. Optimal scheduling strategy of integrated energy system considering low carbon energy transfer under carbon market incentive. Power Syst. Technol. 2025, 49, 3324–3333. [Google Scholar]
  9. Wang, R.; Zhao, X.; Ma, X.; Huang, Y.; Yang, Y.; Zhao, X. Progress of research on heat integration of coal-fired power plants with carbon dioxide capture. Therm. Power Gener. 2025, 54, 168–177. [Google Scholar]
  10. Cheng, W.; Jiang, H.; Xiong, Z.; Zhao, Y.; Chen, G.; Hu, Y.; Zhang, H.; Zhang, J. Analysis of the development path for efficiency and carbon reduction in coal-fired power plants. Coal Convers. 2025, 1–25. Available online: https://link.cnki.net/urlid/14.1163.TQ.20250821.1355.002 (accessed on 4 October 2025).
  11. Yang, L.; Lv, H.; Li, Y.; Zhang, X. Dynamic optimization of carbon capture technology deployment targeting carbon neutrality, cost efficiency and water stress: Evidence from China’s electric power sector. Energy Econ. 2023, 125, 106871. [Google Scholar] [CrossRef]
  12. Li, X.; Wang, R.; Liu, J.; Huang, X.; Jing, R.; Li, Q.; Zhang, P. Progress on Carbon Capture, Utilization and Storage Technology Application in China’s Power Industries. Low-Carbon Chem. Chem. Eng. 2025, 1–13. Available online: https://link.cnki.net/urlid/51.1807.TQ.20250813.1826.007 (accessed on 29 August 2025).
  13. Gu, B. Current Status and Prospects of Carbon Capture, Utilization and Storage Technology in the Context of International Carbon Neutrality Strategic Goals; EDP Sciences: Les Ulis, France, 2023. [Google Scholar]
  14. Wu, K.; Shan, L.; Bo, L.; Ceng, X.; Liu, X. Optimization methodology for carbon capture reformation schemes in thermal power plants considering the power flexible ramping demand. Electr. Power Constr. 2025, 46, 27–41. [Google Scholar]
  15. Ma, Y.; Wang, M.; Xin, T.; Xu, C. Wide-load operation regulation and economic assessment of a carbon capture coal-fired power plant integrated with a heat pump and solvent storage process. Proc. CSEE 2025, 1–13. [Google Scholar] [CrossRef]
  16. Zou, S.; Cao, Y.; Zhang, H.; Xiao, J.; Hou, J.; Zhao, X. Joint grid-storage planning considering operational flexibility of carbon capture power plant. High Volt. Eng. 2024, 50, 5164–5173. [Google Scholar]
  17. Zhu, M.; Liu, Y.; Wu, X.; Shen, J. Dynamic modeling and comprehensive analysis of direct air-cooling coal-fired power plant integrated with carbon capture for reliable, economic and flexible operation. Energy 2023, 263, 125490. [Google Scholar] [CrossRef]
  18. Wang, Q.; Yi, C.H.; Zhang, X.; Xue, D. Optimization of energy storage capacity sizing considering carbon capture intensity and renewable energy consumption. Proc. CSEE 2023, 45, 8295–8309. [Google Scholar]
  19. Li, J.; Zhang, S.; Shao, X. Low carbon economic dispatch of virtual power plants considering dual response and carbon capture. J. Univ. Shanghai Sci. Technol. 2025, 47, 79–88. [Google Scholar]
  20. Xuan, A.; Liu, J.; Peng, W.; Shen, X.; Shen, H. Planning method and carbon footprint assessment for retrofitting coal-based hydrogen power plant with carbon capture, utilization and storage. Proc. CSEE 2025, 45, 5431–5443. [Google Scholar]
  21. Chen, J.; Ye, P.; Liu, Y.; Chen, S.; Guan, F. Optimization dispatch of virtual power plant with carbon capture and high-energy-consumption loads based on stepped carbon trading. Power Syst. Technol. 2025, 1–17. [Google Scholar] [CrossRef]
  22. Liu, D.; Lin, H. Optimal operation of thermoelectric system considering generalized energy storage and carbon capture thermal power plant. Electr. Meas. Instrum. 2025, 62, 11–20. [Google Scholar]
  23. Hu, J.; Shan, Y.; Yang, Y.; Parisio, A.; Li, Y.; Amjady, N.; Rodríguez, J. Economic model predictive control for microgrid optimization: A review. IEEE Trans. Smart Grid 2023, 15, 472–484. [Google Scholar] [CrossRef]
  24. Zhou, S.; Han, Y.; Mahmoud, K.; Darwish, M.M.; Lehtonen, M.; Yang, P.; Zalhaf, A.S. A novel unified planning model for distributed generation and electric vehicle charging station considering multi-uncertainties and battery degradation. Appl. Energy 2023, 348, 121566. [Google Scholar] [CrossRef]
  25. Song, X.; Zhang, H.; Fan, L.; Zhang, Z.; Peña-Mora, F. Planning shared energy storage systems for the spatiotemporal coordination of multi-site renewable energy sources on the power generation side. Energy 2023, 282, 128976. [Google Scholar] [CrossRef]
  26. Long, Y.; Li, Y.; Wang, Y.; Cao, Y.; Jiang, L.; Zhou, Y.; Deng, Y.; Nakanishi, Y. Low-carbon economic dispatch considering integrated demand response and multistep carbon trading for multi-energy microgrid. Sci. Rep. 2022, 12, 6218. [Google Scholar] [CrossRef]
  27. Torabi, R.; Gomes, Á.; Morgado-Dias, F. Electricity, transportation, and water provision of 100%renewable energy for remote areas. Energies 2023, 16, 4146. [Google Scholar] [CrossRef]
  28. Liao, G.; Yang, X.; Lou, S.; Qin, W.; Liu, J.; Hong, X. Multi-objective capacity planning for expressway microgrid considering photovoltaic panel dust removal maintenance. J. Phys. Conf. Ser. 2023, 2588, 12003. [Google Scholar] [CrossRef]
  29. Chen, H.; Li, X.; Wang, Y. Optimal capacity configuration of island photovoltaic storage microgrid system with electric ship charging station. Smart Power 2024, 52, 48–54. [Google Scholar]
  30. Situ, Y.; Zhou, L.; Chen, F.; Li, M.; Zhao, A.; Zeng, M. Research on configuration of multi-energy microgrid in smart park based on typical scenarios. Acta Energiae Solaris Sin. 2022, 43, 515–526. [Google Scholar]
  31. Bakhtiari, H.; Zhong, J.; Alvarez, M. Uncertainty modeling methods for risk-averse planning and operation of standalone renewable energy-based microgrids. Renew. Energy 2022, 199, 866–880. [Google Scholar] [CrossRef]
  32. Wang, Z.; Hou, H.; Wei, R.; Li, Z. A distributed market-aided restoration approach of multi-energy distribution systems considering comprehensive uncertainties from typhoon disaster. IEEE Trans. Smart Grid 2025, 16, 3743–3757. [Google Scholar] [CrossRef]
  33. Wang, Z.; Hui, H.; Bo, Z.; Zhang, L.; Shi, Y.; Xie, C. Risk-averse stochastic capacity planning and P2P trading collaborative optimization for multi-energy microgrids considering carbon emission limitations: An asymmetric Nash bargaining approach. Appl. Energy 2024, 357, 122505. [Google Scholar] [CrossRef]
  34. Li, L.; Liu, S.; Ning, C. Data-driven distributionally robust planning of electricity-heat-hydrogen-ammonia microgrid considering the electrothermal-aging effect of SOEC. Power Syst. Technol. 2025, 49, 22–31. [Google Scholar]
  35. Zou, S.; Jiang, Y.; Lin, Q.; Wen, B.; Liao, J.; Xu, C. Double-layer coordinated planning for electricity and water in zero-carbon microgrids on an independent island considering the dynamic aging characteristics of energy storage. South Power Syst. Technol. 2025, 1–12. Available online: https://link.cnki.net/urlid/44.1643.tk.20250708.1024.004 (accessed on 29 August 2025).
  36. Lu, S.; Gu, W.; Xu, Y.; Dong, Z.; Sun, L.; Zhang, H.; Ding, S. Unlock the thermal flexibility in integrated energy systems: A robust nodal pricing approach for thermal loads. IEEE Trans. Smart Grid 2023, 14, 2734–2746. [Google Scholar] [CrossRef]
  37. Wang, X.; Zhao, H.; Cao, Y. Photovoltaic-hydrogen energy storage multi-agent decentralized cooperative scheduling based on stochastic-nash-harsanyi bargaining game. Trans. China Electro Tech. Soc. 2024, 39, 2652–2666. [Google Scholar]
  38. Dong, J.; Guo, H.; Jiang, T.; Du, E.; Zhang, N.; Kang, C. Research on electricity-carbon coupling trading in the new power system. Proc. CSEE 2025, 45, 5752–5771. [Google Scholar]
  39. Ren, Y.; Sun, F.; Yang, X.; Zhang, J. Analysis of the dynamic transmission efficiency of carbon prices from the perspective of the electricity-carbon market linkage. Stat. Decis. 2024, 40, 183–188. [Google Scholar]
  40. Wu, C.; Yang, X.; Wan, Z.; Yang, F.; Wu, Z.; Zhou, Q.; Xu, J. Two-stage robust optimal scheduling for virtual power plants considering carbon-green certificate interlinked trading. Smart Power 2025, 53, 16–23. [Google Scholar]
  41. Xiao, B.; Zhang, Q.; Qin, W.; Qu, G.; Kong, Y.; Zhang, X. Source-grid-load-storage synergistic planning considering electricity-carbon coupling and flexible supply-demand balance. Electr. Power Constr. 2025, 46, 116–127. [Google Scholar]
  42. Shen, M.; Hu, Z.; Kong, F.; Tong, L.; Yin, S.; Liu, C.; Zhang, P.; Wang, L.; Ding, Y. Comprehensive technology and economic evaluation based on the promotion of large-scale carbon capture and storage demonstration projects. Rev. Environ. Sci. Bio/Technol. 2023, 22, 823–885. [Google Scholar] [CrossRef]
  43. Zhang, S.; Wang, D.; Cheng, H.; Song, Y.; Yuan, K.; Du, W. Key Technologies and challenges of low-carbon integrated energy system planning for carbon emission peak and carbon neutrality. Autom. Electr. Power Syst. 2022, 46, 189–207. [Google Scholar]
  44. Zhang, W.; Zhai, X.; Zhou, J.; Wang, S.; Yin, S. Review of carbon dioxide capture technology. South Energy Constr. 2025, 1–11. [Google Scholar] [CrossRef]
  45. Abdilahi, A.M.; Mustafa, M.W.; Abujarad, S.Y.; Mustapha, M. Hamessing flexibility potential of flexible carbon capture power plants for future low carbon power systems. Renew. Sustain. Energy Rev. 2018, 81, 3101–3110. [Google Scholar] [CrossRef]
  46. Cui, Y.; Deng, G.; Zeng, P.; Zhong, W.; Zhao, Y.; Liu, X. Multi-time scale source-load dispatch method of power system with wind power considering low-carbon characteristics of carbon capture power plant. Proc. CSEE 2022, 42, 5869–5886+6163. [Google Scholar]
  47. He, Y.; Wang, Y. Low-carbon economic scheduling of virtual power plants with hydrogen-blended gas and liquid-storage CCS coupled P2G. Power Gener. Technol. 2025, 1–14. Available online: http://kns.cnki.net/kcms/detail/33.1405.tk.20250307.1119.002.html (accessed on 12 July 2025).
  48. Mu, Y.; Wu, Z.; Wang, C.; Yu, X.; Jia, H.; Zhang, Y. Optimal configuration method for park-level integrated energy system based on information gap decision theory-utility entropy. Autom. Electr. Power Syst. 2024, 48, 41–53. [Google Scholar]
  49. Liu, S.; Wu, S.; Liu, W.; Liu, C.; Wang, X.; Kang, J. Capacity optimization of wind-solar pumped storage power generation system considering uncertainties. J. Hydroelectr. Eng. 2024, 43, 43–56. [Google Scholar]
  50. Wang, Y.; Wang, Y. Dynamic programming of park-level integrated energy system considering electricity hydrogen production and carbon capture. J. China Univ. Pet. (Ed. Nat. Sci.) 2024, 48, 142–150. [Google Scholar]
  51. Qiu, Z.; Wang, B.; Ben, S.; Hu, N. Bi-level optimal configuration planning model of regional integrated energy system considering uncertainties. Electr. Power Autom. Equip. 2019, 39, 176–185. [Google Scholar]
  52. Deng, L.; Liu, S. Snow ablation optimizer: A novel metaheuristic technique for numerical optimization and engineering design. Expert Syst. Appl. 2023, 225, 120069. [Google Scholar] [CrossRef]
  53. Ma, L.; Cheng, S.; Shi, Y. Enhancing learning efficiency of brain storm optimization via orthogonal learning design. IEEE Trans. Syst. Man Cybern. Syst. 2020, 51, 6723–6742. [Google Scholar] [CrossRef]
  54. Xiao, B.; Han, K.; Zhang, X. Robust IGDT planning for stand-alone microgrid with hydrogen energy storage. Electr. Power Constr. 2024, 45, 77–88. [Google Scholar]
  55. Cui, S.; Gao, Y.; Chang, W.; Xie, H.; Zhu, R. Integrated optimization of distribution network considering ladder-type carbon trading. China Meas. Test 2025, 51, 139–147. [Google Scholar]
  56. Zhang, J.; Yao, Y. A multi-user integrated energy service sharing method considering stepped carbon emission cost. Mod. Electr. Power 2025, 42, 987–999. [Google Scholar] [CrossRef]
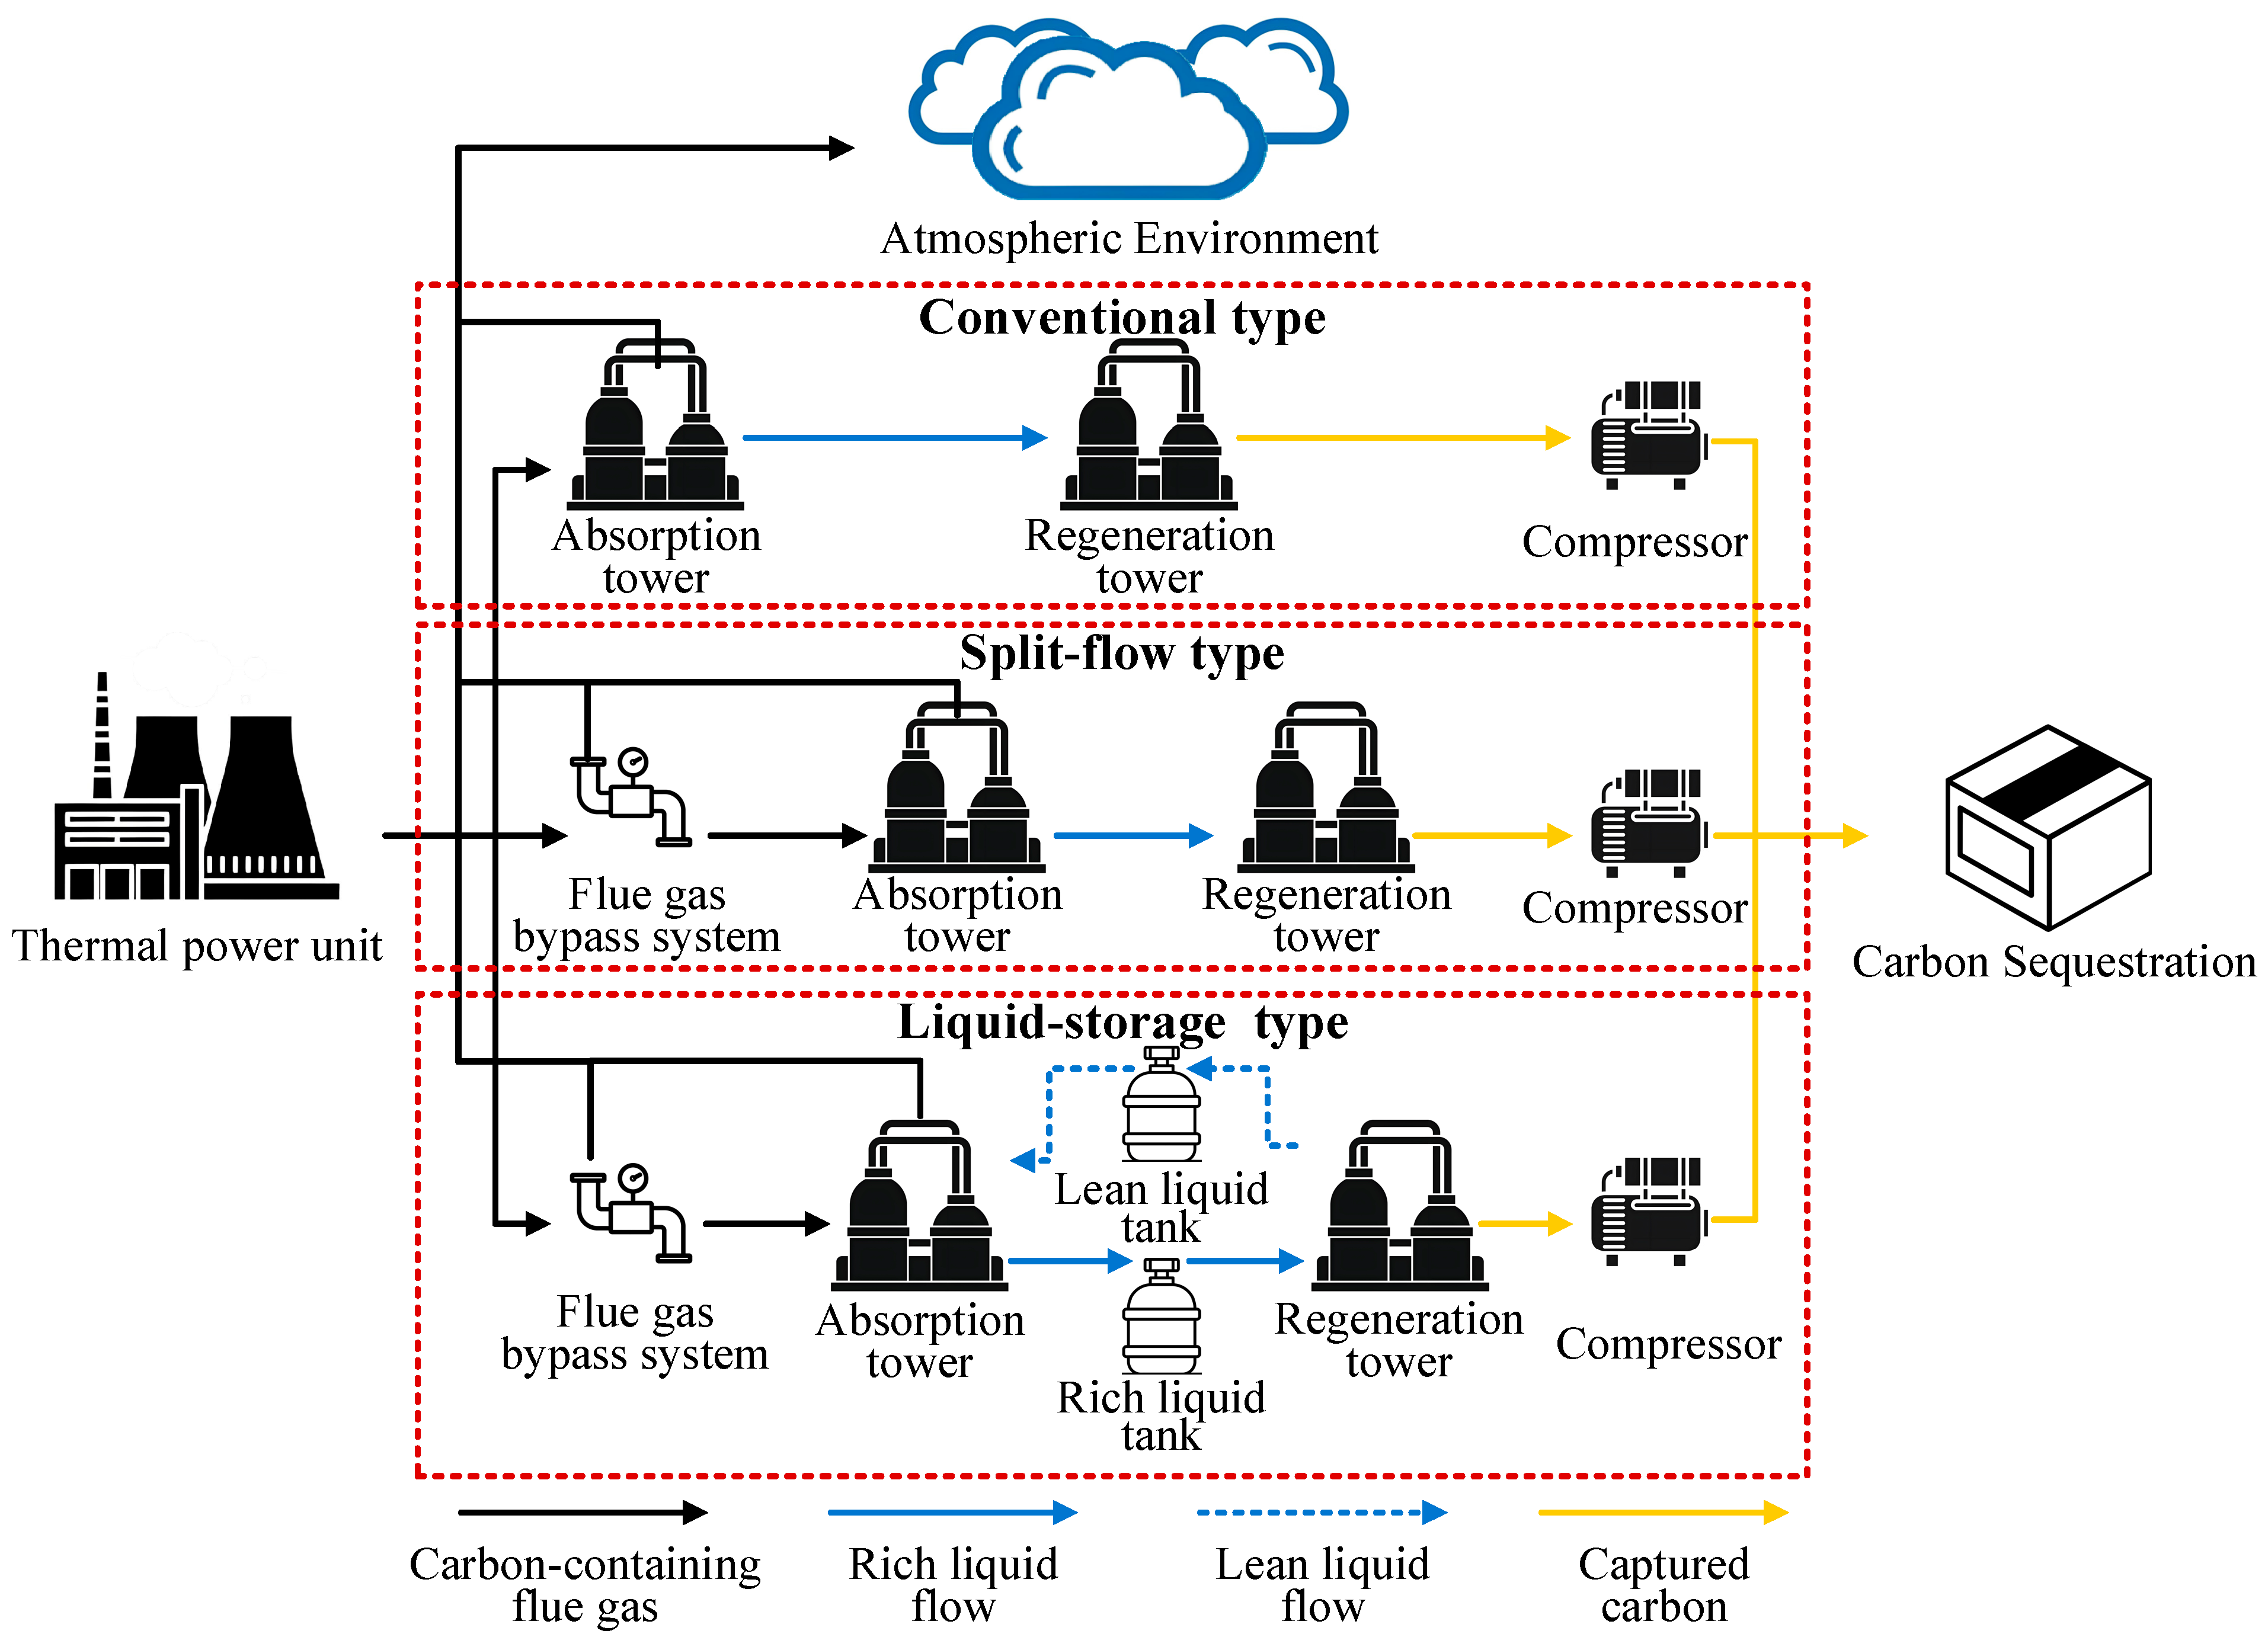
Figure 1. Typical operational modes of post-combustion CCS.
Sustainability 17 09588 g001
Figure 2. Grid-connected microgrid capacity allocation optimization framework under multi-market conditions.
Sustainability 17 09588 g002
Figure 3. Bi-level model mechanism schematic.
Sustainability 17 09588 g003
Figure 4. Tiered carbon trading mechanism.
Sustainability 17 09588 g004
Figure 5. Bi-level model solving process.
Sustainability 17 09588 g005
Figure 6. WT output on typical days.
Sustainability 17 09588 g006
Figure 7. PV output on typical days.
Sustainability 17 09588 g007
Figure 8. Load curve on typical days.
Sustainability 17 09588 g008
Figure 9. Electricity trading price.
Sustainability 17 09588 g009
Figure 10. Annualized investment cost structure of allocation schemes in S1–S3.
Sustainability 17 09588 g010
Figure 11. Change rate of operating cost items across scenarios.
Sustainability 17 09588 g011
Figure 12. Environmental characteristics items for allocation schemes in S1–S3.
Sustainability 17 09588 g012
Figure 13. Change rate of environmental characteristics items across scenarios.
Sustainability 17 09588 g013
Figure 14. Microgrid operation status on a typical winter day in S1.
Sustainability 17 09588 g014
Figure 15. Microgrid operation status on a typical winter day in S2.
Sustainability 17 09588 g015
Figure 16. Microgrid operation status on a typical winter day in S3.
Sustainability 17 09588 g016
Figure 17. Absorption and desorption status of CCS in S3.
Sustainability 17 09588 g017
Table 1. Nomenclature of the model.
SymbolDescriptionSymbolDescription
α A , max Upper limits of carbon absorption efficiency. α D , max Upper limits of carbon desorption efficiency.
α , β Coefficients of carbon price variation. a CCPP , b CCPP , c CCPP Operational cost coefficients for the CCPP.
β flow Flow diversion coefficient of the flue gas bypass system. C inv Investment cost.
C rep Replacement cost. C main Maintenance cost.
C inter Cost of grid support services. C inv , CCS CCS retrofitting cost.
C retro One-time capital cost of CCS retrofitting. C i , inv Initial investment cost of the i-th type of equipment.
C o Variable operating costs of all equipment types. C waste Penalty costs for wind/solar curtailment.
C CO2 Carbon trading costs. C GEC GEC trading costs.
C grid Cost of power exchange with the grid. C o , CCPP Variable operating cost of the CCPP.
C o , WT Variable operating costs of WT. C o , PV Variable operating costs of PV.
C o , CCS Operating operational cost of the CCS. c inv , ESS Specific investment cost per unit capacity of the ESS.
c main , i Unit capacity annual maintenance cost for equipment type i. c inv , i Unit capacity investment cost for equipment type i.
c tank Unit investment cost of storage tanks. c o , WT Operational cost coefficients for WT, can be considered negligible (approximated as zero).
c o , PV Operational cost coefficients for PV, which can be considered negligible (approximated as zero). c o , ESS Cost coefficient for ESS charging/discharging operations.
c MEA MEA cost coefficient. c ss Carbon sequestration cost coefficient.
c waste Penalty cost for WT and PV curtailment. c con ,   MEA Concentration of MEA.
d Step length of the carbon emission interval in the tiered carbon pricing mechanism, representing the proportion of the exceeded/reduced carbon amount to the total allowance. E t , A , E t , C , E t , D The quantities of CO2 absorbed, desorbed, and compressed at time t.
E t , CCS Carbon emissions diverted to the carbon capture system from the CCPP at time t.EiInstalled capacity of equipment type i.
E i , max Maximum investment capacity for the i-th type of equipment. E t , A Amount of CO2 captured.
e t Carbon emission intensity of the unit. E Positions of each particle in the initial solutions of SAO.
E ¯ ( k ) Centroid position of the particles in the population during the k-th iteration of SAO. E ¯ j 50 % ( k ) Centroid position of the particles whose fitness ranks in the top 50% of the population.
E tank Designed capacity of storage tanks. E tank , rich , E tank , lean Investment capacities of the rich solution tank and lean solution tank.
F lower Comprehensive operational cost transmitted from the lower-level model. G ( k ) Elite population in the k-th iteration of SAO.
I salvage Residual value recovery income from equipment disposal.INumber of distinct equipment types.
KMaximum number of iterations of SAO. k ch , k dis Constraint coefficients for the maximum charge and discharge power of the ESS, with their values ranging from (0, 1).
L t Load of the microgrid at time t. M MEA Molar mass of MEA.
M Snow-melting process simulated based on the degree-day method.N, DPopulation size and the number of decision variables in the upper-level model of SAO, respectively.
N D , d Number of days for typical scenario d. P t , grid Exchange power between the microgrid and the grid at time t, where a positive value indicates electricity purchase from the grid and a negative value indicates electricity sale to the grid.
P t , net Net output of the CCPP. P t , f The fixed power consumptions of the CCPP’s carbon capture system.
P t , o Operational power consumptions of the CCPP’s carbon capture system. P CCPP , min , P CCPP , max Minimum and maximum power outputs of the CCPP.
P inter Annual maximum net load declared by the microgrid. p inter Unit capacity charge for grid support services.
P inter , max Maximum capacity of the tie-line. P t , CCPP Output of CCPP.
P t , WT Output of WT. P t , PV Output of PV.
P t , ESS dis Discharging power of the ESS at time t. P t , ESS ch Charging power of the ESS at time t.
P ch , max , P dis , max Maximum charging power and discharging power of the ESS. P t , re max , P t , PV max , P t , WT max Maximum available output of the renewable energy unit, WT, and PV, respectively.
P t , re , P t , PV , P t , WT Actual output of the renewable energy unit, WT, and PV, respectively. p CO2 Benchmark carbon price.
p GEC Unit price of GECs. p penalty , GEC Penalty for failing to meet the RPS.
p penalty , grid Penalty imposed when the exchange power exceeds the declared net load (grid support services) of the microgrid. Q RPS Excess consumption amount of renewable energy power in the microgrid.
Q CO2   Excess emission amount. Q CO2 , mic Actual carbon emissions of the microgrid.
Q CO2 , CA Carbon allowance of the microgrid. R Replacement coefficient.
R t , up , R t , down Upward and downward ramping capabilities of the CCPP.rDiscount rate.
S O C max , S O C min Maximum and minimum values of of SAO. s j ( k ) Search step size of particle j in the k-th iteration, which follows a standard normal distribution.
TNumber of dispatch intervals. U , L Upper and lower bound constraints of each decision variable of SAO.
V 0 , lean , V 24 , lean MEA volumes in the lean solution tank at the beginning and end of the scheduling period. V 0 , rich , V 24 , rich MEA volumes in the rich solution tank at the beginning and end of the scheduling period.
v MEA MEA volume required per unit of CO2 absorbed and desorbed. v MEA MEA volume required per unit of CO2 absorbed.
YiService life of equipment i.YCCSLifespan of CCS equipment.
Y ESS Lifespans of ESS and the microgrid. Y Lifespans of the microgrid.
Z ( k ) Optimal solution in the k-th iteration of SAO. Z 2nd ( k ) , Z 3rd ( k ) Positions of the second-best and third-best particles of SAO, respectively.
η ESS , η ch , η dis Self-discharge coefficient, charging efficiency, and discharging efficiency of the ESS. θ Charge-discharge state coefficient.
θ a A random number within the range of [0, 1]. θ b A random number within the range of [0, 1].
λ A random number within the range of (0, 1) of SAO. λ i Recovery coefficient of the i-th type of equipment.
μ A , μ D , μ C Energy consumption per unit of CO2 for absorption, desorption, and compression during the capture process. ξ MEA Correction factor for the absorption/desorption capacity of MEA.
ρ MEA The MEA density. φ MEA loss coefficient during CO2 capture.
Ω D The set of typical days for the microgrid. ω grid Carbon emission factor of the grid.
ω CO2 Weighting coefficient for carbon allowance. ω RPS Weighting coefficient for the RPS.
Table 2. Nomenclature of the model.
ItemDescriptionEquations
Objective functionUpper-level model objective function and the calculation of its sub-components.(7)~(12)
Lower-level model objective function and the calculation of its sub-components.(15)~(22)
ConstraintsEquipment investment capacity constraint.(13)~(14)
Supply–demand balance constraint of the microgrid.(23)
Constraints on CCPP.(2), (5), (24)~(27)
Renewable energy unit output constraints.(28)
ESS constraints.(29)~(30)
Grid power exchange constraint.(31)
Table 3. Equipment parameter information.
ItemValueItemValue
P CCPP , min (MW)60 P CCPP , max (MW)200
R up , CCPP , R down , CCPP (MW/h)10 P f (MW)8
e (t/MWh)0.8 α A , max , α D , max 90
μ A (MWh/tCO2)0.0229 μ C (MWh/tCO2)0.029
μ D (MWh/tCO2)0.108 β (%)0.8
φ 0.01 v MEA (m3/tCO2)18.5
ρ MEA (kg/m3)1.01 M MEA (g/mol)61.08
M CO2 (g/mol)44 ξ MEA 248
c con , MEA 0.3 η ESS 0.9
η ch , η dis 0.9 k ch , k ch 0.8
P inter , max (MW)12 ω grid (t/MWh)0.7
Notes: The parameters listed in this table apply exclusively to the units and equipment involved in the case study.
Table 4. Technical and economic parameter information.
ItemValueItemValue
r 0.08 a CCPP (RMB/MW2)0.00005
b CCPP (RMB/MW)210 c CCPP (RMB)5000
c inv , WT (RMB/kW)4500 c inv , PV (RMB/kW)2500
c inv , ESS (RMB/kW)1500 c inv , tank (RMB/m3)700
C retro (RMB)1,500,000 c main , WT (RMB/kW)110
c main , PV (RMB/kW)50 c main , ESS (RMB/kW)70
c main , tank (RMB/m3)100 c o , WT , c o , PV (RMB/kWh)0
c o , ESS (RMB/kWh)0.1 c MEA (RMB/m3)200
c ss (RMB/t)21 c waste (RMB/kWh)0.1
p inter (RMB/kW·year)165 λ 0.1
Notes: The parameters listed in this table apply exclusively to the units and equipment involved in the case study.
Table 5. Multi-market parameter information.
ItemValueItemValue
α (%)10 β (%)10
d (%)10 p penalty , grid (RMB/kWh)0.47
ω CO2 (kg/kWh)0.5 ω RPS (%)25
p GEC , p penalty , GEC (RMB/piece)50 p CO2 (RMB/tCO2)96 (spring)
90 (summer)
94 (autumn)
106 (winter)
Notes: The parameters listed in this table apply exclusively to the units and equipment involved in the case study.
Table 6. Microgrid capacity allocation optimization results.
ItemS1S2S3
Multi-marketsUnimplementedImplementedImplemented
CCS retrofittingNoNoYes
WT (kW)17,98039,87030,050
PV (kW)34,98022,14010,200
ESS (kW)12,03015,46015,180
Grid support services (kW)263623104890
CCS Liquid Storage Tank (m3)//37,000
Annualized total cost F upper
(Million RMB)
240.42252.57261.88
Annual GEC trading cost C GEC
(Million RMB)
/3.615.49
Annual curtailment cost C waste
(Million RMB)
0.762.370.16
Annual carbon trading cost C CO2
(Million RMB)
/7.31−31.79
Annual carbon emissions
(kt)
543.68525.6272.77
Table 7. Comparison of performance characteristics.
ItemPerformance CharacteristicsSAOPSO
S1Average convergence value
(Million RMB)
240.42244.87
Average computation time (s)592.44621.12
Average iteration count at convergence1520
Coefficient of variation (%)2.613.43
S2Average convergence value
(Million RMB)
252.57271.72
Average computation time (s)632.74701.25
Average iteration count at convergence1626
Coefficient of variation (%)2.568.22
S3Average convergence value
(Million RMB)
261.89289.43
Average computation time (s)723.81801.22
Average iteration count at convergence2029
Coefficient of variation (%)2.929.45
Disclaimer/Publisher’s Note: The statements, opinions and data contained in all publications are solely those of the individual author(s) and contributor(s) and not of MDPI and/or the editor(s). MDPI and/or the editor(s) disclaim responsibility for any injury to people or property resulting from any ideas, methods, instructions or products referred to in the content.