Abstract
This study examines the impact of environmental, social, and governance (ESG) performance on corporate performance in China’s manufacturing sector, incorporating trade credit financing as a mediator and environmental information disclosure quality as a moderator. Using unbalanced panel data from Chinese A-share listed manufacturing firms between 2011 and 2023 and employing two-way fixed effects models, we provide robust empirical evidence that superior ESG performance directly enhances corporate performance by reducing information asymmetry, strengthening corporate reputation, and lowering capital costs. Furthermore, we identify a key mediating mechanism: strong ESG practices improve access to trade credit financing—an efficient non-bank funding alternative—which alleviates financing constraints, optimizes resource allocation, and amplifies operational and financial outcomes. In a notable departure from conventional expectations, we find that high-quality information disclosure negatively moderates these relationships. Excessive disclosure induces signal overload and adverse selection, raising financing costs and external scrutiny that ultimately diminish the marginal benefits of ESG investments. Cross-sectional analyses reveal that these effects are particularly pronounced in non-state-owned enterprises, non-heavy-polluting industries, and firms located in eastern regions, highlighting the contextual boundaries of ESG efficacy. Our contributions are twofold: we theoretically advance the ESG-finance literature by unveiling trade credit as a transmission channel and revealing the unintended consequences of disclosure overload, and we offer practical guidance for firms seeking to optimize ESG disclosure strategies and for policymakers aiming to design targeted sustainable transition policies.
1. Introduction
In recent years, corporate sustainability has gained increasing attention globally, accelerated by influential corporate actions from firms such as Pang Donglai, Xiaomi, and Erke. Against this backdrop, concepts like carbon neutrality and Environmental, Social, and Governance (ESG) criteria have entered mainstream discourse. Although global frameworks such as the UN Principles for Responsible Investment (UNPRI) were introduced as early as 2006, China’s ESG development began in earnest with the 2006 Social Responsibility Guidelines for Listed Companies issued by the Shanghai and Shenzhen Stock Exchanges. Domestic efforts gained further momentum through the New Development Philosophy and the report to the 20th CPC National Congress, which emphasized green development and ecological civilization. Regulatory measures, including the “13th Five-Year Plan” and the CSRC’s 2022 ESG disclosure mandate, have significantly advanced ESG integration within Chinese enterprises.
As the backbone of the industrial economy, the manufacturing sector is central to national economic development and industrial modernization. In light of pressing global challenges such as climate change and social inequality, the ESG performance of manufacturing firms not only affects their competitiveness but also significantly influences supply chain sustainability and broader societal outcomes. With China’s “dual carbon” goals and ecological policies gaining prominence, ESG factors have become critical indicators of corporate performance. The publication of China’s inaugural ESG White Paper in 2017 marked a pivotal moment, precipitating a significant expansion in both scholarly study and regulatory initiatives pertaining to ESG. By the end of 2022, ESG-themed public funds in China’s A-share market had reached 971 products, totaling approximately RMB 518.2 billion in scale. Moreover, as shown in Figure 1, 2124 A-share companies had issued ESG reports by mid-2024, accounting for 39.88% of all listed firms and reflecting consistent growth over the past three years [1]. Data source: Wind Information Co., Ltd., Shanghai, China, (WIND Database).
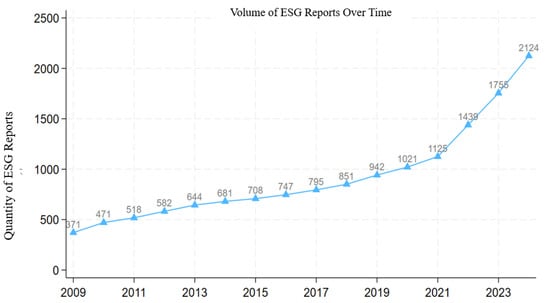
Figure 1.
Trend in ESG Reports by A-Share Listed Companies. Data source: Wind Information Co., Ltd. (WIND Database).
Despite these advances, China’s manufacturing industry faces structural challenges in transitioning toward sustainable development, particularly due to persistent financing constraints that hinder technological innovation and operational optimization [2]. This financing gap creates a critical imperative: to identify how ESG performance can translate into tangible financial benefits while addressing these constraints. Trade credit has emerged as a vital alternative financing channel due to its flexibility and accessibility, yet current scholarly study on ESG remains fragmented. While some studies explore mechanisms such as innovation or policy transmission, few investigate the mediating role of specific financing channels like trade credit, creating a significant literature gap. Furthermore, existing studies have not sufficiently examined how environmental information disclosure quality affects the ESG-performance relationship. Although signaling theory [3] suggests that high-quality disclosure can mitigate information asymmetry, the potential negative effects of excessive disclosure—such as signal overload and increased scrutiny-remain underexplored. This oversight is particularly relevant in the Chinese context, where information disclosure practices are evolving rapidly amid growing regulatory requirements.
Our study bridges these identified gaps through a comprehensive investigation of a dual-pathway mechanism that connects ESG performance to corporate outcomes, incorporating trade credit financing as a mediator and environmental information disclosure quality as a moderator. Based on an empirical analysis of A-share listed manufacturing firms in China from 2011 to 2023 using two-way fixed effects models, we yield robust evidence that strong ESG performance not only directly improves corporate financial outcomes but also facilitates greater access to trade credit financing. In a significant departure from conventional wisdom, our results indicate that high-quality information disclosure exerts a negative moderating effect on these relationships, uncovering the unintended detrimental consequences of disclosure overload.
The originality of our approach lies in three key contributions: First, we advance beyond siloed ESG studies by examining integrated ESG performance within the manufacturing sector, a context characterized by high environmental impact and complex supply chain interdependencies. Second, we identify trade credit financing as a novel mediating mechanism that transmits ESG benefits to corporate performance, thereby extending stakeholder theory to incorporate financial relational dynamics within supply chains. Third, we challenge the conventional linear perspective on disclosure quality by demonstrating its potential dual moderating effect, thus refining signaling theory with contextual nuance [4]. Our findings offer valuable insights for manufacturing firms seeking to leverage ESG practices for improved access to trade credit and reduced financing costs, while also providing guidance on optimizing disclosure strategies. For policymakers, this study supports the design of differentiated disclosure standards and the promotion of green supply chain finance instruments that can accelerate sustainable industrial transformation in China’s manufacturing sector.
The remainder of this paper is organized as follows. Section 2 reviews the relevant literature, while Section 3 develops the hypotheses. Section 4 describes the research design and data sources. Empirical results and robustness checks are presented in Section 5. Section 6 discusses the findings and their implications. Finally, Section 7 concludes the study.
2. Literature Review
The relationship between corporate Environmental, Social, and Governance (ESG) performance and firm performance has attracted considerable scholarly attention, evolving from early debates on corporate social responsibility (CSR) into a more structured and multi-dimensional paradigm. Underpinned by theories of stakeholder engagement, information economics, and resource-based views, the literature has progressively shifted from asking whether ESG matters to how, when, and through which mechanisms it influences corporate outcomes. Despite this progress, consensus remains elusive, with significant variations across institutional contexts, industries, and firm characteristics.
ESG performance encompasses a firm’s effectiveness in managing environmental impacts, social relationships, and governance structures. Its environmental dimension (E) involves actions related to emissions control, resource efficiency, and ecological conservation. The social component (S) addresses issues such as labor practices, community engagement, and consumer protection, while governance (G) focuses on board effectiveness, shareholder rights, and managerial incentives. Although related to CSR, ESG offers a more standardized and finance-oriented framework, facilitating integration into investment and operational decisions [5]. Rating agencies such as MSCI, Sustainalytics, and FTSE Russell have developed comprehensive scoring systems, though methodological differences often lead to divergent ratings, complicating empirical comparisons [6]. In China, the Hua Zheng ESG rating system has been widely adopted, reflecting local regulatory and market conditions [7].
The economic implications of ESG performance are theoretically ambiguous. Neoclassical scholars argue that ESG activities divert resources from profit-maximizing objectives, increase costs, and may serve managerial rather than shareholder interests [8,9]. In contrast, stakeholder theory posits that attending to non-shareholder constituencies can build trust, enhance reputation, and reduce transaction costs, thereby supporting long-term value creation [10]. Empirical evidence increasingly supports a positive association between ESG and financial performance, particularly through channels such as innovation, risk reduction, and improved access to capital [11,12]. During the COVID-19 pandemic, for instance, high-ESG firms demonstrated greater resilience and lower financing costs [13,14]. Nonetheless, negative or inconclusive findings persist, especially in short-term analyses or contexts where ESG implementation is costly or poorly executed [15].
A growing body of studies has sought to identify the mechanisms through which ESG affects firm performance. Innovation is one key pathway: ESG-oriented firms often invest in green technologies and efficient processes, leading to cost savings and competitive advantages [16,17]. Risk mitigation is another: strong ESG practices reduce regulatory, legal, and reputational exposures, thereby decreasing volatility and enhancing firm stability [14,18]. Perhaps the most widely studied mechanism is the financing channel—ESG performance alleviates information asymmetry, signals managerial quality, and attracts preferential treatment from investors and creditors [19,20]. However, within this strand, the role of trade credit financing remains surprisingly under-explored, despite its importance as a source of short-term funding, especially in bank-dominated economies like China.
Trade credit-financing provided by suppliers is a critical component of corporate liabilities and working capital management. Its availability is influenced by factors such as firm size, profitability, and informational transparency [21,22]. Corporations with strong ESG performance are perceived as more reliable and less risky, making them attractive trade credit partners [23,24]. Moreover, ESG alignment between supply chain partners can strengthen relational capital and facilitate longer payment terms [25]. On the performance side, trade credit can ease financing constraints, improve liquidity, and reduce transaction costs [26,27]. However, excessive reliance on trade credit may increase financial leverage and operational rigidity, potentially undermining profitability [28,29]. Despite these insights, few studies have explicitly modeled trade credit as a mediating variable between ESG and firm performance, particularly in manufacturing sectors where supply chain interactions are intensive.
The effectiveness of ESG practices is also contingent on contextual and moderating factors, among which environmental information disclosure quality features prominently. High-quality disclosure reduces information asymmetry, enhances credibility, and helps stakeholders better evaluate ESG performance [30,31]. In capital markets, it can lower the cost of equity and debt by reducing investor uncertainty and monitoring costs [32]. From a trade credit perspective, transparent reporting builds supplier trust and facilitates financing arrangements [30]. However, there is a potential dark side: excessive disclosure may lead to information overload, proprietary cost leakage, and increased external scrutiny, ultimately countervailing the benefits of ESG [21,33]. Recent evidence from China suggests that mandatory non-financial disclosure can improve environmental outcomes but may also raise financing costs and profitability pressures [34]. Thus, the moderating effect of disclosure quality is likely nonlinear and context-dependent, though this nuance is often overlooked in empirical models.
Further complexity arises from heterogeneity across firms and regions. For example, state-owned enterprises (SOEs) and non-SOEs differ in their ESG motivations and outcomes due to divergent objectives and resource constraints [35]. Heavily polluting industries face stricter regulatory pressures, which may weaken the financial payoffs of ESG investments [36]. Regional factors such as marketization level, legal enforcement, and financial development also shape the ESG-performance link [37]. These variations highlight the need for subgroup analyses and contingent theoretical frameworks.
In summary, while the literature has made substantial progress in conceptualizing and measuring ESG performance, identifying its economic effects, and unpacking underlying mechanisms, important gaps remain. First, the role of trade credit financing as a mediator is under-studied, especially in supply-chain-intensive sectors like manufacturing. Second, the moderating effect of environmental information disclosure quality is often oversimplified; its potential nonlinear and even negative effects warrant greater attention. Third, most evidence comes from Western markets; insights from emerging economies like China are still developing. This study aims to address these gaps by examining the mediating role of trade credit and the nuanced moderating effect of disclosure quality in the context of China’s manufacturing firms, thereby contributing to a more comprehensive understanding of how ESG creates value under different informational and financing conditions.
3. Theoretical Framework and Hypothesis Development
3.1. Conceptual Foundations
This study is grounded in four interrelated theoretical frameworks that together articulate a conceptual model linking ESG performance to corporate financial outcomes, with trade credit financing as a mediator and environmental information disclosure quality as a moderator. These theories-sustainable development, stakeholder, information asymmetry, and signaling theory-provide complementary lenses through which to analyze how and under what conditions ESG creates value.
The concept of sustainable development, formally introduced at the United Nations Conference on the Human Environment in Stockholm in 1972, posits that firms must operate within ecological boundaries while pursuing economic objectives. This necessitates integrating environmental and social considerations into strategic planning and operational processes. The theory emphasizes intergenerational equity, systemic balance, and the alignment of corporate activities with broader societal goals, such as China’s “dual-carbon” targets. ESG operationalizes these principles by offering a structured framework for evaluating corporate sustainability performance. Stakeholder theory [10] extends this view by arguing that corporate value creation depends on effectively managing relationships with multiple constituencies—including suppliers, customers, employees, communities, and regulators—rather than focusing solely on shareholders. Firms that attend to stakeholder interests can build trust, reduce transaction costs, and enhance long-term resilience. The ESG framework aligns closely with this perspective by emphasizing environmental stewardship, social responsibility, and transparent governance as means to balance stakeholder demands. Information asymmetry theory [3,38] highlights how disparities in information between firms and external parties can lead to market inefficiencies, including financing constraints and suboptimal investment. Firms with opaque operations face higher costs of capital and reduced access to external financing. ESG disclosure can mitigate these asymmetries by providing credible information about firm quality and risk management practices. Signaling theory [3] addresses how firms communicate their quality to external parties. Superior ESG performance functions as a positive signal of managerial competence, ethical commitment, and long-term viability. High-quality disclosure enhances the credibility of these signals, reducing uncertainty and facilitating resource acquisition. However, excessive or unreliable disclosure may lead to signal distortion or overload, potentially counteracting ESG benefits.
Together, these theories suggest that firms with strong ESG performance can achieve better financial outcomes through enhanced reputation, reduced capital costs, and improved stakeholder relations. Moreover, trade credit financing may serve as a key mechanism transmitting ESG advantages, while environmental information disclosure quality may either strengthen or weaken these relationships depending on its credibility and volume.
3.2. Hypothesis Development
3.2.1. H1: ESG Performance and Corporate Performance
Sustainable development theory posits that the integration of environmental and social considerations into business strategies is essential for long-term value creation and resilience [39]. Complementing this, stakeholder theory suggests that firms addressing the concerns of a broad set of stakeholders-such as communities, employees, and regulators-can build trust, enhance reputation, and reduce transaction costs, thereby improving financial performance [10]. Empirical evidence further indicates that robust ESG performance helps mitigate environmental and social risks, attracts sustainability-oriented investors and consumers, and facilitates access to policy incentives and green financing [40,41]. We therefore propose that:
H1.
ESG performance is positively associated with corporate performance.
3.2.2. H2: The Mediating Role of Trade Credit Financing
Signaling theory suggests that firms use observable actions to convey quality and reliability to external parties [3,42]. In this context, high ESG performance serves as a credible signal to suppliers of a firm’s lower operational risk, stronger ethical commitment, and long-term viability [43]. Stakeholder theory further reinforces that suppliers, as key stakeholders, are more likely to offer favourable trade credit terms to firms demonstrating responsible conduct, as it reduces perceived risk and strengthens relational trust [44]. Moreover, trade credit can ease financial constraints, improve liquidity management, and enhance allocative efficiency, ultimately contributing to better corporate performance [2,26]. Thus, we hypothesize a mediating pathway:
H2.
Trade credit financing mediates the positive relationship between ESG performance and corporate performance.
3.2.3. H3–H5: The Moderating Role of Environmental Information Disclosure Quality
While high-quality disclosure is generally expected to reduce information asymmetry and enhance credibility, information asymmetry theory also raises the possibility of unintended consequences from excessive transparency. Although better disclosure can help stakeholders better evaluate ESG performance and strengthen trust between firms and suppliers [45,46], there is growing evidence that excessive disclosure may lead to information overload, increase proprietary costs, attract short-term pressure, or provoke stringent external monitoring [34,47]. These effects may counteract the positive benefits of ESG investments. Therefore, we expect that environmental information disclosure quality may negatively influence the main relationship:
H3.
Environmental Information disclosure quality moderates the relationship between ESG performance and corporate performance.
H4.
Environmental Information disclosure quality moderates the relationship between ESG performance and trade credit financing.
H5.
Environmental Information disclosure quality moderates the relationship between trade credit financing and corporate performance.
The conceptual model, illustrated in Figure 2, integrates these hypotheses into a coherent framework. ESG performance positively affects corporate performance both directly (H1) and indirectly through the mediation of trade credit financing (H2). Moreover, environmental information disclosure quality moderates three distinct pathways: the direct effect of ESG on performance (H3), the effect of ESG on trade credit (H4), and the effect of trade credit on performance (H5). This comprehensive model allows us to examine the interplay of mediation and moderation in shaping the ESG-performance link.
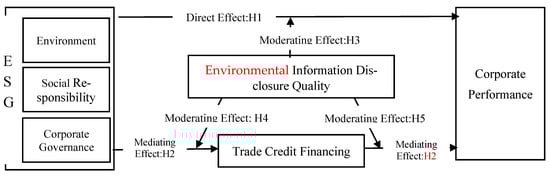
Figure 2.
Mechanism Illustration.
4. Variables and Empirical Model
4.1. Data Sources
As the backbone of China’s real economy, the manufacturing sector plays an irreplaceable role in driving national economic development and industrial modernization. It serves as a core engine for achieving industrial upgrading, technological innovation, and sustainable economic growth. According to the recently released “China High-End Manufacturing Listed Companies White Paper 2024”, manufacturing enterprises accounted for 68% of all A-share listed companies by the end of June 2024, highlighting the sector’s critical importance. Examining how ESG performance influences corporate performance in this context can provide valuable insights for promoting sustainable development and facilitating transformation within Chinese manufacturing firms.
This study employs a sample of A-share listed manufacturing companies in China from 2011 to 2023. The selection of this period is justified by several considerations: First, 2011 marks the implementation of China’s 12th Five-Year Plan, which explicitly emphasized green development and sustainability, providing a coherent policy context for the analysis. Second, the period captures the substantial development and institutionalization of ESG practices in China, allowing examination across different phases of market maturity. Finally, 2023 represents the most recent year for which comprehensive financial and ESG data were available at the time of data collection, ensuring the relevance and timeliness of the findings.
The sample construction followed a rigorous process to ensure data quality and reliability. We began with an initial sample of 28,650 firm-year observations covering A-share manufacturing firms from 2011 to 2023. We then excluded 2209 observations of companies with special treatment status (ST and *ST), which refers to firms experiencing financial distress or abnormal operations as designated by Chinese stock exchanges. After further removing 5618 observations with missing core financial or ESG data, we obtained our final sample of 20,823 firm-year observations. Finally, all continuous variables were winsorized at the 1st and 99th percentiles to mitigate the influence of extreme values. The final sample comprises an unbalanced panel of 20,823 observations.
Data Sources: ESG rating data were obtained from the Hua Zheng ESG evaluation system through the WIND database. All financial and corporate governance data were sourced from the CSMAR database. Data for constructing the Environmental Information Disclosure Quality (EIQ) variable were manually collected through content analysis of corporate annual reports, social responsibility reports, sustainability reports, and environmental reports published by the sample companies. This multi-source approach ensures comprehensive coverage of corporate disclosure practices.
4.2. Variables
(1) Dependent Variable: Corporate Financial Performance (CFP). Prior study [9] commonly employs financial and market value indicators such as Return on Assets (ROA), Total Factor Productivity (TFP), and Tobin’s Q to measure corporate performance. This study focuses on the efficiency with which a firm utilizes its assets to generate net profit. Following the approach widely adopted by international scholars examining the relationship between corporate ESG performance and corporate performance [9], Return on Assets (ROA), defined as Net Profit divided by Total Assets, is used to measure corporate performance.
(2) Core Explanatory Variable: ESG Performance (ESG). ESG performance focuses on a company’s actual performance in environmental, social, and governance aspects, emphasizing concrete practices and outcomes. Given the broad coverage and frequent updates of the Hua Zheng ESG ratings, this study adopts the Hua Zheng ESG rating to measure the ESG indicator, following the approach of study [7]. Furthermore, mirroring the method of Wang Bo et al.’s study [36], the nine Hua-Zheng ESG grades (AAA, AA, A, BBB, BB, B, CCC, CC, C) are assigned numerical scores sequentially: AAA = 9, AA = 8, …, C = 1. This numerical transformation approach is widely adopted in the literature to facilitate empirical analysis, despite its inherent limitation in capturing the full multidimensional nuances of ESG constructs. We acknowledge this simplification and posit that the Hua Zheng rating, as a comprehensive assessment, provides a valid and reliable proxy for a firm’s overall ESG performance. To avoid scale effects, this score is then divided by 100. Table 1 presents the structure of the Hua Zheng ESG rating framework, a structured overview of common ESG evaluation criteria across Environmental, Social, and Governance dimensions, with corresponding themes and specific sub-indicators.

Table 1.
Hua-Zheng ESG Rating Framework.
(3) Mediating Variable: Trade Credit Financing (TC). Drawing on the methodology of Lu Zhengfei & Yang Deming’s work [48], trade credit financing is calculated as (Notes Payable + Accounts Payable + Advances from Customers)/Total Assets. A higher value indicates better access to trade credit for the firm. Considering that changes in ESG performance may affect trade credit financing with a lag, and to mitigate potential endogeneity issues, the trade credit financing data is lagged by one period.
(4) Moderating Variable: Environmental Information Disclosure Quality (EIQ). Environmental Information disclosure quality pertains to the transparency, accuracy, completeness, and timeliness of information disclosed by a company. Utilizing a content analysis scoring method based on established approaches [32], we measured disclosure quality across five dimensions: environmental liability disclosure, vehicles for environmental information disclosure, supervision and certification, environmental management, and environmental performance and governance. The data for constructing this index were manually extracted from multiple corporate reports to ensure comprehensiveness, including Annual Reports (particularly the management discussion and analysis sections and any dedicated environmental portions), Stand-alone Social Responsibility Reports, Stand-alone Environmental, Social, and Governance (ESG) Reports, and specifically dedicated Environmental Reports where available.
For companies that did not publish standalone non-financial reports, we relied exclusively on their Annual Reports. Each company’s disclosure practices were assessed against a detailed scoring framework (Table 2) that evaluates both the existence and quality of environmental information disclosure.
Table 2.
Environmental Information Disclosure Quality Evaluation Framework.
Scoring Methodology: The evaluation framework contains 42 specific items across the five dimensions. For each item, companies received scores based on their disclosure quality- for example, quantitative disclosure received higher scores than qualitative disclosure, which in turn scored higher than no disclosure. The total possible raw score is 42. The scores for each company across these dimensions were summed to obtain its annual raw environmental information disclosure quality score, which was then transformed using the natural logarithm to normalize the distribution. This comprehensive approach captures both the breadth and depth of corporate environmental disclosure practices. The content analysis framework for EIQ (Table 2) is designed to be objective and reproducible, minimizing subjective judgment. Each scoring item is based on the dichotomous presence or absence of specific information or on clearly defined tiers of disclosure quality (e.g., not disclosed = 0, qualitative = 1, quantitative = 2). This structured approach ensures high transparency and replicability. To ensure coding reliability, the coding was conducted by a single scholar following a strict codebook. Given the objective nature of the scoring criteria (e.g., checking for the existence of a report or a specific data point), the potential for coder bias is considered low. The index’s construct validity is supported by its alignment with established frameworks in the literature [32] and its face validity in capturing key dimensions of disclosure quality.
(5) Control Variables. To control for other factors that might influence corporate performance, and following the studies [51,52], the following control variables are selected: Total Asset Turnover (Turn), Corporate Cash Strength (Cash), Corporate Growth (Growth), Board Independence (Indep), Ownership Concentration (Top1), Firm Size (Size), Earnings Per Share (EPS), Asset Tangibility (Tanb), Return on Assets (Lev, note: this appears to be a potential error; Lev typically denotes Leverage, defined as Total Debt/Total Assets), and Property Right (Property). Industry and Year fixed effects are also included. The definitions and measurements of these variables are summarized in Table 3.
Table 3.
Variable Definitions and Measurements.
4.3. Econometric Modelling
- (1)
- Baseline Model
A two-way fixed effects model incorporating both industry and year effects is employed for the baseline regression. Industry dummy variables are introduced to subdivide the manufacturing sector into sub-industries. Each sub-industry corresponds to a dummy variable to eliminate the interference of industry-specific characteristics on the results, enhancing the generalizability of the conclusions. Year dummy variables are introduced to control for macroeconomic fluctuations or policy changes across different years. Furthermore, standard errors are clustered at the firm level to more accurately reflect firm-level correlations and improve the reliability of statistical inference. The specific model is specified in Equation (1):
where is the dependent variable (Corporate Financial Performance) for corporate i in year t, is the core explanatory variable (ESG Performance) for corporate i in year t, represents a vector of firm-level control variables for corporate i in year t, and denote the sets of year and industry fixed effects, respectively, and is the error term.
- (2)
- Model for ESG Performance, Trade Credit, and Corporate Performance
Drawing on Jiang Ting’s work [53] recommendations for testing mediation effects, the following mediation effect Equation (2) is constructed based on Equation (1). Furthermore, acknowledging the potential endogenous issue of reverse causality between trade credit and corporate performance, as highlighted in Lu Zhengfei et al.’s work [48], and to account for the time-lagged characteristic of trade credit’s impact, the trade credit variable is incorporated with a lead of one period (t + 1). This also implies that the sample size for the regression in Equation (2) will be smaller than the total sample size. The model is specified as follows:
where is the mediating variable (Trade Credit Financing) for firm corporate i in year t.
- (3)
- Moderating Role of Information Disclosure
To test hypotheses H3–H5, environmental information disclosure quality (EIQ) is introduced as a moderating variable. Following the approach of Wang Guohong et al.’s work [54], interaction terms between ESG performance and environmental information disclosure quality (ESG × EIQ), and between trade credit financing and environmental information disclosure quality (TC × EIQ), are incorporated to construct the moderation models. The specific models are as follows:
Equation (3)—Tests moderation of the direct effect (ESG->CFP):
Equation (4)—Tests moderation of the first stage of the mediation (ESG->TC):
Equation (5)—Tests moderation of the second stage of the mediation (TC->CFP):
Note: Year and sub-industry (industry) fixed effects are applied simultaneously in all Equations (3)–(5).
5. Empirical Analysis
5.1. Descriptive Statistics
Descriptive statistical analysis summarizes the fundamental characteristics of a dataset by calculating measures such as mean, median, minimum, maximum, and standard deviation. These statistics reveal the central tendency, dispersion, and distribution shape of the data, providing an overview of the overall sample situation.
Table 4 presents the descriptive statistics for the main variables in the sample. The results show that Corporate Financial Performance (CFP) has a minimum value of −0.20 and a maximum value of 0.21, with a mean of 0.0407 and a standard deviation of 0.060. This indicates a substantial gap between high-performing and low-performing firms and a significant dispersion in performance across different enterprises. Regarding corporate ESG performance (ESG), the sample has a mean of 4.127 and a median of 4. According to the Hua Zheng ESG rating classification, the overall ESG performance of firms is medium to low, with considerable variation among different companies. The maximum value of 8 indicates that no firms in the sample achieved the leading “AAA” rating. The Environmental Information Disclosure Quality (EIQ) has a mean of 9.483, a standard deviation of 7.718, a minimum of 0, and a maximum of 37. This suggests that some firms in the sample did not engage in information disclosure, the overall quality of disclosure among firms is relatively low, and there is room for improvement.
Table 4.
Descriptive Statistical Analysis.
Regarding the control variables, Total Asset Turnover (Turn) ranges from a minimum of 0.13 to a maximum of 2.19, indicating significant differences in asset utilization efficiency among firms. Corporate Cash Strength (Cash) has a minimum value of −0.12 and a maximum of 0.24, reflecting uneven liquidity conditions and short-term solvency across firms. A negative minimum value suggests that some companies are facing financing difficulties and tight liquidity. Corporate Growth (Growth) varies from a minimum of −0.63 to a maximum of 2.95, with a mean of 0.21, indicating an overall modest development level. The negative minimum value shows that some firms experienced negative growth. Board Independence (Indep) ranges from 0.33 to 0.57, reflecting differences in the maturity of corporate governance structures. Ownership Concentration (Top1) has a minimum of 0.09, a maximum of 0.72, and a mean of 0.34, suggesting that control rights are relatively dispersed in some firms and more concentrated in others, with significant variation. Firm Size (Size) ranges from 20.03 to 25.71, indicating differences in company size. The mean of 22.11, being well above 20, suggests that manufacturing firms are generally large in scale. Earnings Per Share (EPS) ranges from −1.40 to 3.95, reflecting varying profitability among firms. The negative minimum value indicates that some firms may be operating at a loss or carrying high debt levels. Asset Tangibility (Tanb) ranges from 0.08 to 0.74, showing differences in fixed asset intensity. The Leverage ratio (Lev) ranges from 0.06 to 0.86, indicating significant differences in capital structure, financial risk, and financing strategies among firms. These results show that the control variables exhibit notable disparities across different firms and could exert varying influences on corporate performance.
Furthermore, Variance Inflation Factor (VIF) tests were conducted on the aforementioned variables to check for multicollinearity. The results, presented in Table 5, show that the VIF values for all variables are significantly less than 5, indicating that multicollinearity among the variables is minimal and does not pose a concern for the analysis.
Table 5.
VIF Test.
5.2. Correlation Test
Prior to conducting the formal regression analysis, a Pearson correlation analysis was performed on all variables except the dummy variables, based on the sample data. The results are presented in Table 6. The table shows that ESG performance is significantly positively correlated with Corporate Financial Performance (CFP), providing preliminary support for Hypothesis H1. Trade Credit Financing (TC) is positively correlated with CFP at the 1% significance level, with a correlation coefficient of 0.138. This indicates that the more trade credit financing a firm obtains, the higher its performance, offering initial verification for H2.
Table 6.
Correlation Test.
Control variables such as Total Asset Turnover (Turn), Corporate Cash Strength (Cash), Leverage (Lev), Corporate Growth (Growth), Ownership Concentration (Top1), Property Right (Property), and Firm Size (Size) are also correlated with CFP. Most of these correlation coefficients are significant at the 1% level, confirming that these are important factors influencing the dependent variable (CFP) and justifying their inclusion as control variables in the model. The coefficients between variables are mostly below 0.5, indicating that multicollinearity is virtually absent and the variables are meaningful for the study.
5.3. Baseline Regression
The baseline regression analysis was conducted using a fixed effects model to investigate the impact of ESG performance on corporate performance within the manufacturing sector. The results, detailed in Table 7, provide empirical evidence supporting a significant positive relationship.
Table 7.
Baseline Regression Test.
In the initial specification controlling only for year and industry fixed effects (Column 1), ESG performance demonstrates a strongly positive coefficient of 1.394, significant at the 1% level. This preliminary finding indicates that enhanced ESG performance is associated with substantially improved corporate financial outcomes. When additional firm-level control variables are incorporated alongside the fixed effects (Column 2), the coefficient for ESG remains statistically significant at the 1% level, though its magnitude attenuates to 0.284. This result confirms that even after accounting for various financial and governance characteristics, a one-unit improvement in ESG performance corresponds to a 0.284-unit increase in corporate performance. The persistence of this positive relationship across specifications provides robust validation for Hypothesis H1, indicating that superior ESG practices effectively contribute to better financial performance in manufacturing firms.
Analysis of control variables reveals several noteworthy patterns. Asset turnover (Turn) and corporate cash strength (Cash) both show significant positive coefficients, suggesting that operational efficiency and strong liquidity positions are important drivers of performance. Similarly, corporate growth (Growth) and earnings per share (EPS) exhibit positive relationships with performance, indicating that expansion capabilities and profitability enhance financial outcomes. Ownership concentration (Top1) also demonstrates a positive coefficient, supporting the notion that substantial shareholders provide effective monitoring that reduces agency costs. Conversely, several variables show negative associations with performance: board independence (Indep) may reflect reduced decision-making efficiency at higher levels of independence; firm size (Size) potentially indicates management complexity challenges in larger organizations; asset tangibility (Tanb) might signal inefficient resource utilization in capital-intensive firms; leverage (Lev) confirms the performance-dampening effect of higher debt burdens; and state ownership (Property) suggests that SOEs underperform due to dual objectives of profit generation and social responsibility fulfillment.
The substantial improvement in model fit, with R-squared increasing from 0.095 to 0.666 with the inclusion of control variables, demonstrates the importance of accounting for these firm-specific characteristics. The maintained significance of ESG performance throughout this process underscores its fundamental role in driving corporate performance. These findings establish a solid empirical foundation for understanding how ESG practices contribute to financial outcomes in the manufacturing sector and provide a robust basis for subsequent analysis of mediating and moderating mechanisms in this relationship.
5.4. Mechanism Testing
- (1)
- Mediating Effect
Building upon the previous analysis, this study examines trade credit financing as a mediating variable to analyze and test the pathway through which manufacturing firms’ ESG performance enhances corporate performance. Following Jiang Ting’s work [53] suggestions for testing mediation effects, Equation (2) is tested based on Equation (1). Trade credit financing serves as a critical channel for corporate debt financing and an important means to effectively support the development of the real economy. Traditional trade credit reallocation theory posits that as a form of credit financing, trade credit enables firms lacking cash flow to achieve capital circulation with liquidity-rich enterprises, thereby promoting corporate value growth [22]. Furthermore, substantial literature has verified the impact of trade credit financing on corporate performance, primarily through improving capital efficiency in the real economy [55], mitigating corporate risk [36], and reducing external financing costs [56]. The regression results are presented in Table 8. When the explained variable is trade credit financing (F.TC), the coefficient for ESG in the second column is 0.274 and significantly positive at the 5% level (t = 2.35). This indicates that better ESG performance enhances a firm’s access to trade credit financing, which in turn improves corporate performance. Thus, Hypothesis H2 is verified.
Table 8.
Mechanism Test (Trade Credit Financing).
- (2)
- Moderating Effect Analysis
Beyond the mediating effect, this study investigates the moderating role of environmental information disclosure quality on both the direct effect and the pathways between ESG performance, trade credit financing, and corporate performance. The regression results are shown in Table 9. Column (1) examines the direct moderating effect of environmental information disclosure quality. The coefficient for the interaction term ESG × EIQ is −0.205, significant at the 1% level. This suggests that higher environmental information disclosure quality increases the transparency of ESG investment costs, which in the short term elevates financial pressure on firms, thereby offsetting the performance-enhancing effect of ESG performance. Thus, Hypothesis H3 is validated. Column (2) shows the interaction term ESG × EIQ is significantly negative (−0.268), indicating that environmental information disclosure quality moderates the first stage of the mediation pathway. Specifically, the positive impact of corporate ESG performance on trade credit financing weakens as environmental information disclosure quality increases. This suggests excessive disclosure can lead to “signal overload” or “adverse selection” effects, diminishing the positive role of ESG performance. Hypothesis H4 is supported. Column (3) reveals the interaction term F.TC × EIQ is −0.008, significant at the 1% level. This indicates that higher environmental information disclosure quality is associated with increased financing costs or external monitoring pressure, ultimately negatively affecting corporate performance. Hypothesis H5 is confirmed.
Table 9.
Moderating Effect Test.
5.5. Robustness Tests
- (1)
- Test with Alternative Dependent Variable
To enhance the robustness of the empirical results, this study adopts the approach of Li Jinglin et al.’s study [52] by employing an alternative calculation method for the dependent variable, Return on Assets (ROA). Specifically, we use a modified ROA formula, calculated as (Total Profit + Financial Expenses)/Average Total Assets, where Average Total Assets is the closing balance of total assets. This step further examines the impact of corporate ESG performance on corporate performance and the moderating role of environmental information disclosure quality under a different operationalization of the performance measure, ensuring the robustness of the aforementioned conclusions. The regression results are presented in Table 10. It can be observed that the coefficients are largely consistent with the previous findings. Corporate ESG performance continues to promote corporate performance, while environmental information disclosure quality exerts a negative moderating effect. Furthermore, after testing the moderating effect of environmental information disclosure quality on the mechanism of trade credit financing, columns (3) and (4) of Table 10 show that environmental information disclosure quality still negatively moderates the relationships between ESG performance and trade credit financing, and between trade credit financing and corporate performance. This confirms the robustness of the earlier regression results.
Table 10.
Test with Alternative Dependent Variable (ROA).
- (2)
- Rigorous Fixed Effects with province-level factors
Considering significant differences among provinces in environmental policies, tax incentives, and industrial support, and particularly for manufacturing firms often clustered in specific provinces due to industrial agglomeration effects (e.g., electronics in Guangdong, chemicals in Jiangsu), which may lead to technology spillovers and competition effects potentially weakening the marginal contribution of ESG to corporate performance, this study adopts stricter fixed effects following Li, C et al.’s study [31]. Building upon sub-industry and year fixed effects, province fixed effects are added to control for common characteristics of these geographical clusters and capture province-level time-invariant features (e.g., geographic location, long-term policy orientation), thereby reducing omitted variable bias and making the model estimates more accurate. The regression results are shown in Table 11. Columns (1) to (4) present the impact of ESG performance on corporate performance, the moderating effect of environmental information disclosure quality on the main effect model, and the influence of environmental information disclosure quality in the mediation effect, respectively. All coefficients remain consistent with the baseline regression, indicating strong robustness of the aforementioned conclusions.
Table 11.
Rigorous fixed effects specification with province-level fixed.
- (3)
- Analysis Excluding Specific Years and Municipalities
Years of financial crisis are typically accompanied by drastic fluctuations in the macroeconomic environment, such as stock market crashes, exchange rate volatility, and credit crunches. These extreme events can significantly impact corporate financial conditions and other aspects, leading to substantial changes in listed company data. Additionally, municipalities directly under the central government (Beijing, Shanghai, Tianjin, Chongqing) usually enjoy more policy support and resource preference, such as fiscal subsidies, tax incentives, and infrastructure investment. Therefore, to ensure the reliability and accuracy of the conclusions and account for differences between enterprises in municipalities and other regions, data from the year 2015 and the four municipalities are excluded from the regression to ensure the generalizability of the findings. The regression results are shown in Table 12. The results in column (1) show a significantly positive coefficient between ESG and CFP. After excluding the relevant data, ESG performance still promotes corporate performance, and Hypothesis H1 remains valid, further indicating that the conclusions of the baseline regression are robust and reliable. Columns (2) to (4), showing the moderating effects on the main model and the mediation model, are also consistent with the previous findings. Environmental Information disclosure quality plays a negative moderating role, validating Hypotheses H3–H5.
Table 12.
Analysis Excluding Specific Years and Municipalities.
5.6. Tests for Endogeneity
Establishing causality in ESG-performance studies is challenging due to potential endogeneity, including reverse causality and omitted variable bias. While our use of lagged explanatory and mediating variables helps mitigate reverse causality concerns, we implement additional strategies to bolster the causal interpretation of our results. First, we include a comprehensive set of control variables and firm-, industry-, year-, and province-fixed effects to control for time-invariant unobserved heterogeneity and common macroeconomic shocks. Second, we employ a rigorous instrumental variable (IV) approach to further address endogeneity. Although we acknowledge that no empirical design can conclusively eliminate all endogeneity concerns, these combined efforts significantly enhance the credibility of our causal inferences. To mitigate potential endogeneity issues arising from omitted variables, sample selection, and measurement errors in the empirical tests, relevant tests are conducted to examine whether endogeneity exists in the model.
- (1)
- Testing for Reverse Causality
Implementing ESG concepts, particularly environmental and social responsibilities, entails certain costs for firms. Conversely, firms with better performance generally possess more funds to invest in ESG practices. Furthermore, there is a time lag for ESG rating data to be reflected within the firm and subsequently in the market. Therefore, to address potential reverse causality and explore its time-lagged nature, this study draws on Yuan Yehu et al.’s study [51] and employs a one-period lag of the explanatory variable (ESG) for regression testing. The results are shown in Table 13.
Table 13.
Endogeneity Test Using One-Period Lag (L.ESG).
The one-period lagged ESG performance remains significantly positively correlated with corporate performance at the 1% level, with a coefficient of 0.219. The moderating effect tests in columns (2) to (4) also remain largely consistent with the main test results, further demonstrating the robustness of the aforementioned conclusions.
- (2)
- Instrumental Variable (IV) Approach
To further alleviate endogeneity concerns stemming from reverse causality and omitted variables, this study employs an instrumental variable approach, drawing on Yuan Yehu &Xiong Xiaohan’s study [51]. The one-period lagged ESG (L.ESG) is used as an instrumental variable (IV). On one hand, lagged ESG performance is typically highly correlated with current ESG performance due to the persistent nature of corporate ESG practices. On the other hand, lagged ESG performance should not directly affect current corporate performance, thus satisfying the exclusion restriction requirement. The regression results are reported in Table 14. The first column shows that the coefficient for the one-period lagged ESG (L.ESG) is 0.219 and significantly positive, indicating a strong correlation between the instrumental variable (L.ESG) and the endogenous explanatory variable (ESG). This passes the weak instrument test, confirming the reasonableness of the IV choice. In the second column, the coefficient for the interaction term between environmental information disclosure quality and ESG (ESG × EIQ) is −0.386, significant at the 1% level. This suggests that environmental information disclosure quality weakens the promoting effect of ESG on corporate performance, and the estimated result still supports Hypothesis H3, indicating the reliability of the conclusion. Furthermore, the LM statistic for the instrumental variable test is 891.42 (p < 0.01), rejecting the null hypothesis of underidentification. The Kleibergen-Paap Wald rk F statistic is 1104.67, which exceeds the 10% maximal IV size critical value of 16.38 (Stock-Yogo test), leading to the rejection of the null hypothesis of weak instruments. The Anderson-Rubin test statistic is 43.09 (p < 0.01), rejecting the null that the endogenous regressors are irrelevant. These tests confirm that the instrumental variable is valid and strong, and the results are reasonable.
Table 14.
Instrumental Variable Estimation Results.
5.7. Heterogeneity Analysis
- (1)
- Heterogeneity Analysis by Ownership Type
In China’s socio-economic development, differences in ownership type represent a prominent characteristic of listed companies’ ownership structures. Considering that ownership type significantly influences corporate environmental, social, and governance (ESG) performance, the sample is further divided into state-owned enterprise (SOE) and non-state-owned enterprise (NSOE) sub-samples. A dummy variable, Property, is used, where Property equals 1 for SOEs and 0 otherwise. Separate regressions are conducted to examine the differential impact of ESG on corporate performance across ownership types and the varying moderating role of environmental information disclosure quality. Results from Table 15 show that the estimated coefficients for corporate ESG performance are significantly positive at the 1% confidence level for both SOEs [Column (1)] and NSOEs [Column (5)], further confirming the significant positive effect of ESG performance on enhancing corporate performance, consistent with prior findings. The coefficient for ESG is larger for NSOEs (0.331) than for SOEs (0.145), indicating that the performance-enhancing effect of ESG is more pronounced in NSOEs within the manufacturing sector.
Table 15.
Ownership Heterogeneity Test.
For SOEs, the coefficient for the interaction term between environmental information disclosure quality and ESG (EIQ × ESG) in Column (2) is −0.228, significant at the 1% level. For NSOEs, the coefficient in Column (6) is −0.174, also significant at the 1% level. This indicates that environmental information disclosure quality exerts a significant negative moderating effect on the relationship between ESG performance and corporate performance in both SOEs and NSOEs. Higher environmental information disclosure quality weakens the positive impact of ESG on performance, but the effect is smaller for NSOEs than for SOEs. From Column (3), the coefficient for ESG on Trade Credit (TC) is insignificant for SOEs, suggesting that ESG performance does not significantly influence trade credit financing for SOEs. Their access to trade credit is likely driven more by policy factors, such as government support, rather than ESG performance. For NSOEs, Column (7) shows a significantly positive coefficient for ESG, indicating that better ESG performance in NSOEs can enhance corporate performance by securing more trade credit financing. The coefficient for the interaction term EIQ × ESG is −0.196, significantly negative at the 10% level, suggesting that environmental information disclosure quality has a smaller driving influence on trade credit financing for NSOEs. In Column (8), the significantly negative coefficient for the interaction term F.TC × EIQ shows that environmental information disclosure quality negatively moderates the relationship between trade credit financing and corporate performance; higher disclosure quality weakens the positive effect of trade credit on performance. A possible reason for these results is that SOEs’ feature leads them to rely more on national preferential policies. Their ESG performance and access to trade credit are more driven by policy factors, and increased disclosure quality might weaken this effect. Additionally, SOEs may have more resource slack, leading to a smaller marginal contribution of ESG performance and trade credit financing to corporate performance. NSOEs, being more driven by market mechanisms, might see increased disclosure quality exposing potential risks and increasing financing constraints.
- (2)
- Heterogeneity Analysis by Industry
Existing study finds that the environmental sensitivity of an industry significantly impacts corporate environmental performance [31], social performance [58], and governance environment [59]. As stakeholders hold different expectations for the ESG performance of firms in industries with varying environmental sensitivity, the performance-enhancing effect of ESG also differs across these industries [60]. Based on the Guidelines for Industry Classification of Listed Companies (2012 revision) by the CSRC and the Listed Company Environmental Verification Industry Classification Management Catalog by the Ministry of Environmental Protection, sample firms are categorized into heavily polluting and non-heavily polluting industries to further examine the relationship between ESG performance and corporate performance and the moderating role of environmental information disclosure quality.
Table 16 show that the coefficients for corporate ESG performance are significantly positive for both heavily polluting [Column (1)] and non-heavily polluting [Column (5)] industries. The coefficient is larger for non-heavily polluting industries, indicating a greater performance-enhancing effect of good ESG performance in this sector. After introducing the interaction term, the EIQ × ESG coefficients are significantly negative for both groups [Columns (2) and (6)], with the coefficient for heavily polluting industries being smaller than that for non-polluting industries. This suggests that environmental information disclosure quality exerts a significant negative moderating effect on the ESG-performance relationship, with a slightly stronger effect in non-heavily polluting industries. For heavily polluting industries, the results in Column (3) show an insignificant coefficient for ESG on trade credit financing (TC), indicating that trade credit financing does not serve as a mediator. The inherent environmental risks of the industry may weaken supplier and customer trust in its ESG performance, making it difficult to translate into trade credit. In non-heavily polluting industries, environmental information disclosure quality has a significantly negative effect on both the first stage [Column (7)] and the second stage [Column (8)] of the mediation pathway. Firms in heavily polluting industries typically face stricter environmental regulations; high-quality disclosure may expose their environmental compliance risks (e.g., pollution control costs, penalties), leading to decreased trust from investors or suppliers. Furthermore, the relationship between ESG performance and disclosure quality in heavily polluting industries is highly influenced by the policy environment; high-quality disclosure may amplify regulatory risks, weakening the positive effect of ESG and limiting the moderating role of disclosure quality. Firms in non-heavily polluting industries rely more on market financing; high-quality disclosure may expose the short-term nature of their ESG practices (e.g., “greenwashing”), causing external stakeholders to be skeptical of their true ESG performance. Increased disclosure quality may subject non-heavily polluting firms to stricter financing scrutiny.
Table 16.
Industry Heterogeneity Test.
- (3)
- Heterogeneity Analysis by Region
To study the impact of regional differences on the relationship between ESG performance and corporate performance, as well as the moderating role of environmental information disclosure quality, the sample is divided into Eastern and non-Eastern regions based on firm location for separate empirical tests. Regression results are shown in Table 17.
Table 17.
Regional Heterogeneity Test.
From Columns (1) and (5), corporate ESG performance enhances corporate performance in both Eastern and non-Eastern regions. The ESG coefficient is larger for the Eastern region, indicating a more pronounced promoting effect of ESG on corporate performance there. Results in Columns (2) and (6) show that environmental information disclosure quality exerts a negative moderating effect in both regions, with a stronger effect in the Eastern region.
For the non-Eastern region, results in Column (7) show the coefficient for ESG on trade credit financing (TC) is 0.239 but insignificant, indicating that trade credit financing does not mediate the relationship between ESG performance and corporate performance. The remote location, lower economic development, and digitalization levels in some non-Eastern areas lead to persistent information asymmetry; suppliers may distrust the authenticity of their ESG performance. In the Eastern region, Columns (3) and (4) show that the mediation effect is significant, and the moderating effects of environmental information disclosure quality are significantly negative. The Eastern region is economically developed with intense market competition. High-quality disclosure might weaken the positive effects of ESG performance and trade credit financing due to information overload and risk exposure. Comprehensive disclosure could lead to information overload, making it difficult for external stakeholders to identify the true value of ESG performance, aligning with the negative effects of signaling theory—excessively high disclosure quality might send negative signals. Additionally, improved disclosure quality might lead firms to over-rely on trade credit financing, increasing liquidity management pressure and consequently reducing performance. The non-Eastern region is relatively less developed economically with weaker market mechanisms. High-quality disclosure might expose inadequacies in firms’ ESG practices, subjecting them to stricter financing scrutiny. Furthermore, firms in non-Eastern regions typically face lower mandatory disclosure requirements, and the market is less sensitive to marginal changes in their environmental information disclosure quality.
6. Discussion and Implications
6.1. Discussion
As China’s economy gradually transitions into a stage of high-quality development, the concept of sustainable development has gained increasing societal traction, leading more enterprises to prioritize ESG (Environmental, Social, and Governance) development. The manufacturing sector, as a vital pillar of the national economy, faces unique challenges in ESG practices due to its high resource consumption and environmental impact. With the escalating strategic importance of ecological civilization construction, national regulatory bodies have introduced numerous regulations to standardize corporate environmental information disclosure, particularly since the revised Environmental Protection Law of 2014. These developments have made environmental information disclosure quality a key indicator of corporate transparency and credibility, while trade credit financing has emerged as an important short-term funding source for manufacturing firms, where supply chain relationships significantly influence liquidity and operational efficiency. Against this backdrop, our study investigates the complex relationships between ESG performance, corporate outcomes, trade credit financing, and environmental information disclosure quality in China’s manufacturing sector.
Our analysis, based on a comprehensive sample of A-share listed manufacturing companies from 2011 to 2023, reveals several important findings. First, we establish that ESG performance significantly enhances corporate performance through multiple channels, including alleviating information asymmetry, building positive corporate reputation, reducing capital costs, and enhancing social legitimacy. Second, we identify that ESG performance improves corporate outcomes by facilitating access to trade credit financing, as adopting ESG principles helps firms reduce financing obstacles, optimize resource allocation, and generate operational benefits. These findings are consistent across various model specifications and robust to different measurement approaches, providing strong evidence for the financial value of ESG investments in manufacturing enterprises.
The most intriguing finding concerns the complex role of environmental information disclosure quality. Our results demonstrate a negative moderating effect of information disclosure on the relationships between ESG performance and corporate outcomes. While this initially appears counterintuitive, multiple theoretical mechanisms help explain this phenomenon. The information overload hypothesis suggests that excessive disclosure can overwhelm stakeholders’ information processing capacities. Through the lens of Proprietary Cost Theory, heightened transparency may reveal competitively sensitive information, potentially eroding a firm’s competitive advantage. Agency Theory further suggests that enhanced disclosure may attract heightened scrutiny from regulators and activists, raising compliance costs and constraining managerial flexibility. Additionally, in contexts where greenwashing concerns exist, extensive disclosure might be interpreted as a negative signal, triggering stakeholder skepticism. These mechanisms collectively suggest a non-monotonic relationship where the benefits of reduced information asymmetry are eventually outweighed by various costs, calling for a more nuanced application of signaling theory.
Although derived from China’s specific context, our findings offer valuable comparative insights for both emerging and developed economies. The negative moderating effect may be more pronounced in emerging economies with similar characteristics, such as rapidly evolving regulatory frameworks and less mature ESG verification markets, while developed economies with more robust institutions might experience attenuated effects. Furthermore, our heterogeneity analysis reveals substantial variation across ownership types, industries, and regions, with stronger effects observed in non-state-owned enterprises, non-heavy polluting industries, and firms in eastern China. These findings collectively emphasize the context-dependent nature of optimal disclosure strategies and suggest that firms should balance transparency with risk exposure, focusing on long-term benefits while avoiding the potential negative consequences of excessive disclosure.
6.2. Economic Implications
Based on the empirical findings which reveal the dual nature of environmental information disclosure quality-acting as both a driver of sustainable development and a potential source of additional costs-the following recommendations are proposed to maximize its positive impacts while mitigating associated risks. These suggestions target both governmental policy refinement and corporate strategic adaptation, ensuring a coordinated effort to enhance the effectiveness of ESG practices.
For the government, three suggestions are proposed. (1) Policymakers should design differentiated ESG incentive policies. Establish mechanisms linking environmental subsidies to disclosure quality to mitigate the negative effects of high-quality disclosure. Promote the adaptation of ESG rating systems to different regions and industries to avoid a “one-size-fits-all” approach, ensuring fairness and effectiveness in policy implementation. Allocate special funds for ecological and environmental protection work, rather than solely constraining enterprises through disclosure mandates and penalties after issues arise. Encourage firms, especially those in non-heavily polluting industries, to enhance the credibility of their ESG performance through third-party certifications like green bonds and ESG audits, reducing the risk of adverse selection due to disclosure. (2) Improve the ESG incentive mechanism for trade credit financing. Promote green supply chain finance policies. For manufacturing firms with excellent ESG performance, collaborate with commercial banks to provide trade credit interest discounts or supply chain bill discount preferential rates, lowering the cost of trade credit financing. Establish an ESG credit evaluation sharing platform that integrates data from environmental protection, tax, and industry and commerce departments to build a manufacturing corporate ESG credit database accessible to upstream and downstream supply chain partners, reducing the risk of credit crunch caused by information asymmetry. (3) Optimize the guidance and regulatory framework for information disclosure. Focus on regulating “signal overload” in disclosure. Guide enterprises to adopt structured disclosure, presenting core ESG data in modular reports with supplementary details. Provide fiscal subsidies to encourage firms in central and western regions to improve the quality of basic information disclosure, while offering ESG training to prevent the loss of financing opportunities due to inadequate disclosure. For heavily polluting sectors within manufacturing, mandate the disclosure of key environmental indicators but allow partial confidentiality for details involving core green technologies to avoid technology leakage or competitive disadvantage from over-disclosure. For patent-related ESG information in high-tech manufacturing, allow firms to apply for exemption from public disclosure, subject to regulatory filing, balancing transparency and intellectual property protection. Continuously refine the information disclosure system to shift the focus from increasing the quantity to improving the quality of disclosure, thereby fostering a positive moderating role for disclosure quality.
As for manufacturing firms, we also bring forward three suggestions. (1) Enterprises should rationally leverage the importance of ESG principles. Particularly for heavily polluting industries, actively establish green ecosystems and green industrial chains. Proactively engage with the environmental protection department’s “white list” system to gain financing convenience. State-owned enterprises can utilize their policy resource advantages to align ESG investments with government green projects, such as “Dual Carbon” initiatives, to mitigate the potential negative effects of high environmental information disclosure quality. (2) Accelerate the transformation of the financing structure. Increase the proportion of long-term debt financing to alleviate potential conflicts of interest with creditors. When utilizing trade credit financing, firms should optimize liquidity management to avoid financial risks stemming from over-reliance on short-term funding. Incorporate corporate ESG performance into supply chain agreements. Jointly initiate ESG supply chain initiatives with industry leaders to develop common ESG credit standards. In procurement contracts with suppliers, stipulate extended payment terms or increased credit lines for meeting ESG targets, promoting upstream and downstream collaboration to reduce financing costs. (3) Implement precise disclosure strategies when improving environmental information disclosure quality. Adopt tiered disclosure: emphasize environmental compliance to suppliers to enhance supply chain trust, while highlighting the long-term benefits of ESG (e.g., market share of green products) to investors to attract patient capital. Furthermore, firms should balance transparency with risk control, dynamically adjusting disclosure content, reduce the disclosure of technical process details during critical R&D phases and supplement with ESG success cases after establishing technological barriers to avoid increased external pressure from excessive disclosure.
7. Conclusions
This study examines the relationship between ESG performance and corporate performance in China’s manufacturing sector, emphasizing the mediating function of trade credit financing and the moderating role of environmental information disclosure quality. Based on an analysis of A-share listed manufacturing firms from 2011 to 2023 using two-way fixed effects models, our findings provide robust empirical support for several conclusions. First, ESG performance significantly improves corporate performance by reducing information asymmetry, enhancing corporate reputation, lowering capital costs, and strengthening social legitimacy. Second, trade credit financing acts as an important mediator in this relationship, as firms with stronger ESG performance gain better access to trade credit, which helps ease financing constraints, optimize resource allocation, and improve operational outcomes. Third, we observe a negative moderating effect of environmental information disclosure quality: excessive disclosure may lead to signal overload, adverse selection, higher financing costs, and increased external scrutiny, thereby reducing the marginal benefits of ESG efforts. Furthermore, heterogeneity analysis indicates that these effects are more evident in non-state-owned enterprises, non-heavy-polluting industries, and firms based in eastern regions, reflecting variations in institutional environments and market mechanisms.
8. Limitations and Future Studies
Despite its contributions, this study is subject to several limitations that offer avenues for future study. First, regarding external validity, our findings are based on China’s manufacturing sector, which may limit their generalizability to other cultural, regulatory, or economic contexts (e.g., developed economies with mature ESG markets) or to non-manufacturing industries. Future studies could test the robustness of our theoretical model in other countries and sectors. Second, while we employed a widely recognized ESG rating system, measurement challenges persist. Different rating agencies often have divergent methodologies and outcomes [61]. Future study could employ alternative ESG metrics or develop more granular measures to capture the nuances of ESG performance. Third, although we have taken steps to address endogeneity (e.g., using lagged variables and instrumental variables), unobserved confounding factors may still exist. More sophisticated identification strategies or natural experiments could be employed in the future to further establish causality.
Notwithstanding these limitations, our study provides valuable insights into the complex interplay between ESG performance, trade credit financing, and environmental information disclosure quality. These results contribute to the existing literature by introducing trade credit as a transmission mechanism between ESG and performance, questioning the universal benefit of high disclosure, and highlighting context-specific effects of ESG practices. From a practical standpoint, we recommend that firms implement balanced disclosure strategies to avoid potential drawbacks, while policymakers develop tailored incentive mechanisms and disclosure standards accounting for regional and sectoral differences. We encourage future study to build upon our framework to further explore the mechanisms and boundary conditions of ESG’s financial value creation. Ultimately, while ESG performance is an important driver of corporate success, its effectiveness depends on strategically navigating the interplay between sustainability practices, financial policies, and disclosure frameworks.
Funding
This research received no external funding.
Institutional Review Board Statement
Not applicable.
Informed Consent Statement
Not applicable.
Data Availability Statement
The datasets used and/or analyzed during the current study are available from the corresponding author on reasonable request.
Acknowledgments
We extend our sincere gratitude to Xiangyang Duan, a graduate student under my supervision, and to Xiaochun Li of the International Business College at South China Normal University for their extensive contributions throughout the development of this manuscript. Their efforts were instrumental in the initial drafting and subsequent revisions, including data curation, empirical analysis, and discussion of the results. We also extend our thanks to the three anonymous reviewers for their valuable and constructive comments, which greatly improved the quality of this paper.
Conflicts of Interest
The author declares that they have no conflict of interest.
References
- Kong, D.; Li, H.; Yang, W. Targeted RRR Cuts, Loan Availability, and SME Trade Credit—Empirical Evidence Based on Regression Discontinuity. J. Financ. Res. 2021, 3, 77–94. (In Chinese) [Google Scholar]
- Wang, Y. Financial Repression and the Secondary Allocation Function of Trade Credit. Econ. Res. J. 2014, 49, 86–99. (In Chinese) [Google Scholar]
- Spence, M. Job Market Signaling. Q. J. Econ. 1973, 87, 355–374. [Google Scholar] [CrossRef]
- Burke, J.J. Do Boards Take Environmental, Social, and Governance Issues Seriously? Evidence from Media Coverage and CEO Dismissals. J. Bus. Ethics 2022, 176, 647–671. [Google Scholar] [CrossRef]
- Dahlsrud, A. How corporate social responsibility is defined: An analysis of 37 definitions. Corp. Soc. Responsib. Environ. Manag. 2008, 15, 1–13. [Google Scholar] [CrossRef]
- Berg, F.; Kölbel, J.F.; Rigobon, R. Aggregate confusion: The divergence of ESG ratings. Rev. Financ. 2022, 26, 1315–1344. [Google Scholar] [CrossRef]
- Wu, H.; Zhu, X. ESG and Energy Technology Innovation: Burden or Empowerment? Res. Econ. Manag. 2024, 45, 18–35. (In Chinese) [Google Scholar]
- Friedman, M. The social responsibility of business is to increase its profits. N.Y. Times Mag. 1970, 1–5. [Google Scholar]
- Duque-Grisales, E.; Aguilera-Caracuel, J. Environmental, social and governance (esg) scores and financial performance of multilatinas: Moderating effects of geographic international diversification and financial slack. J. Bus. Ethics 2019, 168, 315–334. [Google Scholar] [CrossRef]
- Freeman, R.E. Strategic Management: A Stakeholder Approach; Pitman: London, UK, 1984. [Google Scholar]
- Fatemi, A.; Fooladi, I.; Tehranian, H. Valuation effects of corporate social responsibility. J. Bank. Financ. 2015, 59, 182–192. [Google Scholar] [CrossRef]
- Healy, P.M.; Palepu, K.G. Information asymmetry, corporate disclosure, and the capital markets: A review of the empirical disclosure literature. J. Account. Econ. 2001, 31, 405–440. [Google Scholar] [CrossRef]
- Long, Z.; Zhang, X. The Impact of ESG Performance on Enterprise Green Technology Innovation-Empirical Evidence from Chinese Listed Companies. South China Financ. 2023, 9, 56–70. (In Chinese) [Google Scholar]
- Broadstock, D.C.; Chan, K.; Cheng, L.T.; Wang, X. The role of ESG performance during times of financial crisis: Evidence from COVID-19 in China. Financ. Res. Lett. 2021, 38, 101716. [Google Scholar] [CrossRef] [PubMed]
- Atan, R.; Alam, M.M.; Said, J.; Zamri, M. The impacts of environmental, social, and governance factors on firm performance: Panel study of Malaysian companies. Manag. Environ. Qual. 2018, 29, 182–194. [Google Scholar] [CrossRef]
- Porter, M.E.; van der Linde, C. Toward a New Conception of the Environment-Competitiveness Relationship. J. Econ. Perspect. 1995, 9, 97–118. [Google Scholar] [CrossRef]
- Li, Q.; Xiao, Z. Heterogeneous Environmental Regulation Tools and Corporate Green Innovation Incentives—Evidence from Green Patents of Listed Enterprises. Econ. Res. J. 2020, 55, 192–208. (In Chinese) [Google Scholar]
- Karwowski, M.; Raulinajtys-Grzybek, M. The application of corporate social responsibility (CSR) actions for mitigation of environmental, social, corporate governance (ESG) and reputational risk in integrated reports. Corp. Soc. Responsib. Environ. Manag. 2021, 28, 1270–1284. [Google Scholar] [CrossRef]
- Maaloul, A.; Zéghal, D.; Amar, W.B.; Mansour, S. The Effect of Environmental, Social, and Governance (ESG) Performance and Disclosure on Cost of Debt: The Mediating Effect of Corporate Reputation. Corp. Reput. Rev. 2023, 26, 1–18. [Google Scholar] [CrossRef]
- Qiu, M.; Yin, H. Corporate ESG Performance and Financing Costs in the Context of Ecological Civilization Construction. J. Quant. Tech. Econ. 2019, 36, 108–123. (In Chinese) [Google Scholar]
- Luo, D.; Wang, B. Environmental Information Disclosure and IPO Financing Costs. South China J. Econ. 2014, 8, 13–26. (In Chinese) [Google Scholar]
- Casey, E.; O’Toole, C.M. Bank lending constraints, trade credit and alternative financing during the financial crisis: Evidence from European SMEs. J. Corp. Financ. 2014, 27, 173–193. [Google Scholar] [CrossRef]
- Liu, H.; Feng, Y. Economic Policy Uncertainty, Information Disclosure, and Debt Financing-From the Perspective of Creditor Heterogeneity. Econ. Surv. 2020, 37, 140–149. (In Chinese) [Google Scholar]
- Hu, Y.; Wu, W. Trade Credit Financing and the Structural Problems of Corporate Debt in China. China Econ. Q. 2022, 22, 257–280. (In Chinese) [Google Scholar]
- Reber, B.; Gold, A.; Gold, S. ESG disclosure and idiosyncratic risk in initial public offerings. J. Bus. Ethics 2022, 179, 867–886. [Google Scholar] [CrossRef]
- Shi, X.; Zhang, S. Trade Credit, Financing Constraints, and Efficiency Impact. Econ. Res. J. 2010, 45, 102–114. (In Chinese) [Google Scholar]
- Ferris, S.D.; Wilson, A.C.; Brown, W.M. Evolutionary Tree for Apes and Humans based on cleavage maps of mitochondrial DNA. Proc. Natl. Acad. Sci. USA 1981, 78, 2432–2436. [Google Scholar] [CrossRef]
- Zheng, J.; Lin, Z.; Peng, L. Regional Marketization Process, Relative Bargaining Power, and Trade Credit—Empirical Evidence from China’s Manufacturing Listed Companies. Collect. Essays Financ. Econ. 2013, 5, 81–87. (In Chinese) [Google Scholar]
- Wang, Z.; Sun, L. Market Power, Innovation Capability, and Optimal Trade Credit Supply. J. Shanxi Univ. Financ. Econ. 2016, 38, 36–46. (In Chinese) [Google Scholar]
- Chen, Y.; Deng, T.; Zhang, C. Corporate Information Disclosure, External Market Environment, and Trade Credit. Account. Econ. Res. 2014, 28, 16–26. (In Chinese) [Google Scholar]
- Li, C.; Liu, B.; Zhou, P.; Zhang, X. Stones from Other Hills: QFII and Information Disclosure of Listed Companies. J. Financ. Res. 2018, 12, 138–156. (In Chinese) [Google Scholar]
- Ye, C.; Wang, Z.; Wu, J.; Hui, L. External Governance, Environmental Information Disclosure, and Equity Financing Cost. Nankai Bus. Rev. 2015, 5, 85–96. (In Chinese) [Google Scholar]
- Zhu, Q. Research on the Optimization of Enterprise Performance Evaluation System under the New Development Pattern. Friends Account. 2021, 9, 2–9. (In Chinese) [Google Scholar]
- Liu, B.; Lu, J. Does the Quantity of ESG Disclosure Reduce Corporate Debt Financing Costs? Stud. Int. Financ. 2024, 6, 87–96. (In Chinese) [Google Scholar]
- Xu, M.; Liu, C.; Hu, Y.; Yue, X. An Empirical Study on the Impact of Listed Companies’ ESG Performance on Enterprise Value-Taking A-Share Listed Companies as an Example. Chin. J. Valuat. 2021, 7, 27–37. (In Chinese) [Google Scholar]
- Wang, B.; Yang, M. Research on the Impact Mechanism of ESG Performance on Enterprise Value-Empirical Evidence from China's A-Share Listed Companies. Soft Sci. 2022, 36, 78–84. (In Chinese) [Google Scholar]
- Yang, R.; Deng, C.; Hou, X. Research on the Impact of ESG Performance on Corporate Financial Performance. Technol. Econ. 2023, 42, 124–134. (In Chinese) [Google Scholar]
- Akerlof, G.A. The market for “lemons”: Quality uncertainty and the market mechanism. Q. J. Econ. 1970, 84, 488–500. [Google Scholar] [CrossRef]
- Porter, M.E.; Kramer, M.R. Strategy and Society: The Link Between Competitive Advantage and Corporate Social Responsibility; Harvard Business Review: Brighton, MA, USA, 2006. [Google Scholar]
- Albuquerque, R.; Koskinen, Y.; Zhang, C. Corporate social responsibility and firm risk: Theory and empirical evidence. Manag. Sci. 2019, 65, 4451–4469. [Google Scholar] [CrossRef]
- Branco, M.C.; Rodrigues, L.L. Corporate Social Responsibility and Resource-Based Perspectives. J. Bus. Ethics 2006, 69, 111–132. [Google Scholar] [CrossRef]
- Connelly, B.L.; Certo, S.T.; Ireland, R.D.; Reutzel, C.R. Signaling theory: A review and assessment. J. Manag. 2011, 37, 39–67. [Google Scholar] [CrossRef]
- Gualandris, J.; Klassen, R.D.; Vachon, S.; Kalchschmidt, M. Sustainable evaluation and verification in supply chains: Aligning and leveraging accountability to stakeholders. J. Oper. Manag. 2015, 38, 1–13. [Google Scholar] [CrossRef]
- Cheng, J.; Wang, H. Does corporate social responsibility affect the cost of trade credit? Evidence from China. Asia-Pac. J. Account. Econ. 2021, 28, 447–468. [Google Scholar]
- Shen, H.; Huang, Z.; Guo, F. Confession or Justification—Research on the Relationship between Corporate Environmental Performance and Environmental Information Disclosure. Nankai Bus. Rev. 2014, 2, 48–56. (In Chinese) [Google Scholar]
- Grewal, J.; Riedl, E.J.; Serafeim, G. Market reaction to mandatory nonfinancial disclosure. Manag. Sci. 2019, 65, 3061–3084. [Google Scholar] [CrossRef]
- Leuz, C.; Wysocki, P.D. The economics of disclosure and financial reporting regulation: Evidence and suggestions for future research. J. Account. Res. 2016, 54, 525–622. [Google Scholar] [CrossRef]
- Lu, Z.; Yang, D. Trade Credit: Alternative Financing, or Buyer’s Market? Manag. World 2011, 4, 6–14. (In Chinese) [Google Scholar]
- ISO 14001:2015; Environmental Management Systems—Requirements with Guidance for Use. International Organization for Standardization: Geneva, Switzerland, 2015.
- ISO 9001:2015; Quality Management Systems—Requirements. International Organization for Standardization: Geneva, Switzerland, 2015.
- Yuan, Y.; Xiong, X. Research on the Relationship between Listed Companies’ ESG Performance and Corporate Performance-The Moderating Role of Media Attention. Jiangxi Soc. Sci. 2021, 41, 68–77. (In Chinese) [Google Scholar]
- Li, J.; Yang, Z.; Chen, J.; Cui, W. Research on the Mechanism of ESG Promoting Corporate Performance—Based on the Perspective of Enterprise Innovation. Sci. Sci. Manag. S. & T. 2021, 42, 71–89. (In Chinese) [Google Scholar]
- Jiang, T. Mediating Effects and Moderating Effects in Empirical Research on Causal Inference. China Ind. Econ. 2022, 5, 100–120. (In Chinese) [Google Scholar]
- Wang, G.; Yue, X.; Huang, H. How Does Digital Transformation Affect Organizational Resilience—A Moderated Mediation Effect Model. Technol. Econ. S 2024, 43, 101–112. (In Chinese) [Google Scholar]
- Zhang, Y.; Sun, L.; Wang, Z. Can Trade Credit Financing Improve the Capital Efficiency of the Real Economy?-From the Perspective of Economic Policy Uncertainty. Mod. Financ. Econ. J. Tianjin Univ. Financ. Econ. 2020, 40, 53–67. (In Chinese) [Google Scholar]
- Fu, J. Tax Avoidance, Trade Credit Financing, and Corporate Performance. J. Shanxi Univ. Financ. Econ. 2017, 39, 87–98. (In Chinese) [Google Scholar]
- Stock, J.H.; Yogo, M. Testing for Weak Instruments in Linear IV Regression. In Identification and Inference for Econometric Models Essays in Honor of Thomas Rothenberg; Andrews, D.W.K., Stock, J.H., Eds.; Cambridge University Press: Cambridge, UK, 2005; pp. 80–108. [Google Scholar]
- Wang, J. Environmental Information Disclosure, Industry Differences, and External Institutional Pressure: Empirical Evidence from Environmental Information Disclosure of Shanghai Listed Companies. Account. Res. 2008, 6, 54–62. (In Chinese) [Google Scholar]
- Miralles-Quirós, M.M.; Miralles-Quirós, J.L.; Valente Gonçalves, L.M. The Value Relevance of Environmental, Social, and Governance Performance: The Brazilian Case. Sustainability 2018, 10, 574. [Google Scholar] [CrossRef]
- Xu, D.; Tong, M.; Lin, T. Environmental Information Regulation and Corporate Performance—A Quasi-Natural Experiment from Key Pollutant Discharge Units. Zhejiang Soc. Sci. 2020, 5, 156. (In Chinese) [Google Scholar]
- Yoon, B.; Lee, J.H.; Byun, R. Does ESG Performance Enhance Firm Value? Evidence from Korea. Sustainability 2018, 10, 3635. [Google Scholar] [CrossRef]


Disclaimer/Publisher’s Note: The statements, opinions and data contained in all publications are solely those of the individual author(s) and contributor(s) and not of MDPI and/or the editor(s). MDPI and/or the editor(s) disclaim responsibility for any injury to people or property resulting from any ideas, methods, instructions or products referred to in the content. |
© 2025 by the author. Licensee MDPI, Basel, Switzerland. This article is an open access article distributed under the terms and conditions of the Creative Commons Attribution (CC BY) license (https://creativecommons.org/licenses/by/4.0/).