Article

Mapping Regional Flows: Supply Chain Pathways of Black Carbon Emissions in China

1
Suining Flight College, Civil Aviation Flight University of China, Suining 629000, China
2
College of Resources and Environment, Huazhong Agricultural University, Wuhan 4300770, China
*
Author to whom correspondence should be addressed.
Sustainability 2025, 17(21), 9560; https://doi.org/10.3390/su17219560 (registering DOI)
Submission received: 4 September 2025 / Revised: 3 October 2025 / Accepted: 21 October 2025 / Published: 27 October 2025

Abstract

As the world’s largest anthropogenic emitter of black carbon (BC), China exhibits substantial regional disparities in emissions. This study integrates provincial data into an endogenized multi-regional input–output (MRIO) framework and applies structural path analysis (SPA) to trace embodied BC emissions across 30 Chinese regions throughout the full economic cycle. The results indicate that Southern China is the region with the highest emissions (191.85 Kt), while the northwest region, despite having the lowest absolute emissions, exhibits the highest emission intensity (9.59 kg per 105 CNY). Only 8.94% and 15.66% of the BC emissions linked to Shanghai and Beijing were produced locally, compared to 79.23% for Shandong and 79.21% for Hebei. Most BC emissions in the supply chain originate from direct emissions by the residential sector, followed by indirect emissions from carbon-intensive industries such as construction. This pattern reflects a mechanism whereby final demand in developed provinces stimulates economic output in less developed provinces, thereby driving BC emissions there. These findings highlight the need for differentiated regional mitigation strategies—such as residential clean energy transitions in underdeveloped regions and sustainable supply chain management in developed ones—to advance national sustainability goals.

Graphical Abstract

1. Introduction

Black carbon (BC) is operationally defined as a carbonaceous substance formed through the incomplete combustion of fossil fuels, biofuels, and biomass. It is distinct from elemental carbon by its amorphous microphysical structure, fine particulate nature, and strong light-absorbing properties [1]. As an important component of atmospheric aerosols [2], BC exhibits a strong absorption capacity for solar radiation from the visible to the infrared spectrum. It directly influences the radiation balance of the Earth–atmosphere system by increasing shortwave radiation absorption, thereby heating the atmosphere and altering the climate. Numerous studies have confirmed that BC is a potent climate pollutant with a strong greenhouse effect. Although BC accounts for a relatively small fraction of fine particulate matter (PM2.5), its unique properties allow it to exert substantial impacts on climate change and air quality, thereby attracting considerable attention [3,4,5,6]. In addition, extensive research has established a link between environmental BC and various serious health outcomes. Epidemiological evidence has indicated that BC exposure can harm the cardiovascular, respiratory, and nervous systems, among others [7,8,9,10,11,12,13,14]. Since the onset of economic reform and opening-up, China’s total energy production and consumption has grown continuously [15], making the country one of the world’s largest emitters of anthropogenic BC [16]. The BC and co-emitted exhaust gases generated from extensive energy consumption not only affect China’s climate change mitigation efforts [17] but also pose health risks to its population [18,19].
Examining pollutant emissions from a consumption perspective provides a valuable approach to identifying the main demand-side drivers of environmental burdens and attributing emissions to the consumers of goods and services [20,21,22]. Numerous studies have compiled BC emission inventories from this perspective [16,19,23,24,25]. For example, Gu et al. [24] combined emission inventories with model simulations to quantify the disease burden caused by rural residential BC emissions and proposed related policy recommendations. Wang et al. [16] estimated global BC emissions at a 10 km resolution using emission factors, revealing that high-emission areas were concentrated in China and Southeast Asia.
The integration of consumption-based emission analysis with input–output analysis (IOA) enables the assessment of environmental impacts across entire supply chains. Building on this approach, several studies have examined BC emissions in greater detail. Deng et al. [23] compiled BC emission inventories in China from 2002–2017 using energy consumption data and structural decomposition analysis, finding that urbanization and consumption patterns significantly influenced BC emissions. Meng et al. [25] investigated the drivers of BC emissions in four municipalities and quantified the contribution of key factors. Zhou et al. [19] examined the influence of atmospheric transmission and interprovincial trade on BC emissions in Hubei Province and proposed reduction measures. These studies collectively highlight the influence of socio-economic drivers on BC emissions and provide scientific foundations for policymaking. However, because the sectors of Chinese provinces are highly interconnected, effective decision-making requires consideration of the full cycle of production, circulation, distribution, and consumption. Identifying the supply chain linkages among economic sectors is therefore essential. The combination of structural path analysis (SPA) and IOA has been widely applied to identify critical emission and energy-use pathways and to trace emissions along these pathways [26,27]. While SPA-based studies have yielded valuable insights into the key sectors and critical paths driving PM2.5 and CO2 emissions, research specifically addressing BC is scarce. Fang et al. [28] applied SPA to reveal the critical pathways and main drivers of BC emissions in Sichuan Province, but such single-province studies cannot adequately capture the complex supply chain relationships that influence BC emissions across China. This limitation has hindered the development of more refined, region-specific mitigation strategies. Previous research has indicated that residential coal and biomass combustion are the primary sources of BC emissions in China and that significant disparities exist between urban and rural areas as well as among regions [29,30]. These differences stem from variations in income–expenditure ratios, consumption patterns, and geographic conditions. To design effective reduction policies, it is therefore necessary to understand the interactions between regional income flows and BC emissions from energy consumption.
To address these gaps, this study aims to answer the following key research questions: (1) How are BC emissions and their associated socioeconomic inequalities distributed across Chinese provinces and regions through interprovincial supply chains? (2) What are the critical transmission pathways—from final consumption through production to income generation—that drive anthropogenic BC emissions in China? To achieve this, we employed an environmentally extended multi-regional input–output (EE-MRIO) model to conduct a comprehensive assessment of black carbon (BC) emissions at both provincial and regional levels, with a focus on embodied emission flows and inequality. This approach overcomes the limitations of previous studies that focused solely on single-province or single-region analyses. To further elucidate the key pathways of anthropogenic BC emissions, we adopted structural path analysis (SPA) to quantify the flows of BC emissions embedded within the entire economic system, tracing how consumption drives production and ultimately generates income across 30 provinces in China (excluding Taiwan, Hong Kong, Macao, and Tibet). The findings provide a basis for the Chinese government to formulate targeted mitigation policies for high-emission supply chain pathways and to advance sustainable development goals. The remainder of this paper is organized as follows: Section 2 describes the construction of the endogenous input–output model, the data sources, and the calculation of critical pathways; Section 3 presents detailed analyses; and Section 4 summarizes the findings and their policy implications for sustainable transition.

2. Materials and Methods

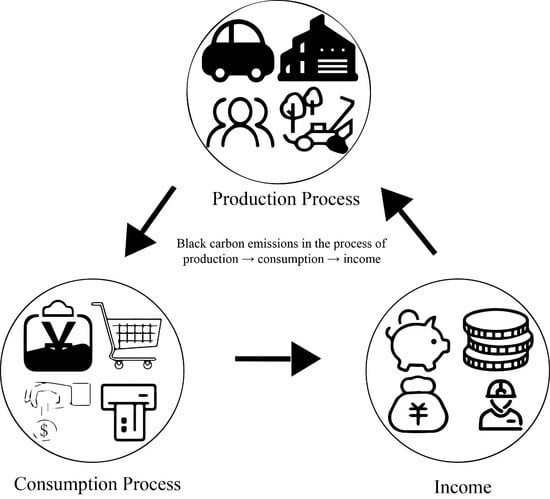
2.1. Endogenous Environmental Extended Input–Output Analysis

The multi-regional input–output (MRIO) table refers to the connection of the input–output (IO) tables of a single region into an inter-regional IO table according to the same sector’s classification. It can more comprehensively and systematically describe the economic relations and trade of products between various regions [31,32,33]. Excluding four provinces without data (Tibet, Hong Kong, Taiwan, and Macau), we divided China into 30 provinces to describe Chinese inter-provincial trade and economic ties. Considering that in the national economic system, whether imported products from various sectors are used for intermediate input or final demand, they would not play a role in stimulating the domestic economy. Therefore, we exclude the impact of the import part [33,34]. After pre-processing, the total output of each province can be expressed using Equation (1):
X   =   Ax   +   Y
where X = [ X i r ] (i = 1, 2, …16; r = 1, 2, …30) is the output column vector of 16 sectors in 30 provinces; A = [ Z ij rs X j s ] = [ a ij rs ](i, j = 1, 2, …16; r, s = 1, 2, …30) is the technology coefficient matrix of 16 sectors in 30 provinces, obtained by dividing the intermediate input matrix ( Z i j r s ) by total output column vector ( X j s ). The final demand Y = y u rb i r + y rur i r + y gov i r + y gro i r + y inv i r consists of five parts (the urban household consumption column vector ( y u rb i r ), rural household consumption column vector ( y rur i r ), government consumption column vector ( y gov i r ), gross fixed capital formation column vector ( y gro i r ), and inventory increase column vector ( y inv i r ). We reconstituted these five parts into two parts: the consumption column vector ( Y h i r = y u rb i r + y rur i r + y gov i r ), and the other final demands column vector ( Y f i r  =  y gro i r +  y inv i r ). To incorporate income and final demand into endogenous variables [34], Y h ri × 1 = i = 1 16 r = 1 30 Y h i r can be further converted: Y h = RV x , of which R ri × si = Y h i r IN j s = ( r ij rs ) (r, s = 1, 2, …16; i,j = 1, 2, …30) is the consumption coefficient matrix. It can be calculated by dividing household consumption by income; IN 1 × sj = [ in j s ] is the row vector of income from sector j in region s. This variable can be obtained from the value-added of the MRIO table. And V ri × sj   =   [ in j s x i r ] is defined as the income coefficient matrix, which means the ratio of income to total output [34]. Therefore, Equation (1) can be further decomposed into the following Equations:
X   =   Ax   +   Y h   +   Y f
= Ax + RV h   + Y f
=   ( I - A - R ) - 1 Y f
where L = ( I - A ) - 1 = ( l ij rs ) is the famous Leontief inverse matrix [32]; Equation (3) can be further expressed as:
X   =   L ( I - RVL ) - 1 Y f
Since the focus of this research is to explore the BC emissions related to the income → consumption process, we obtained the formula for income flow according to Equation (6):
IN   =   Vx   =   VL ( I - RVL ) - 1 Y f   =   ( I - VLR ) - 1 VLY f   =   KVLY f
According to Miyazawa and Masegi [34], K   ki × wj = ( I - VLR ) - 1 (i, j = 1,2,…16; k, w = 1,2,…30) refers to “relevant multipliers among income groups in different sectors”. It can be used to explain the overall inter-industry effect of the income-generating process. VLR in the formula refers to the coefficient matrix between income groups of different sectors. It represents the income paid to workers when sector k in region i produces an additional unit product that meets the final demand of sector w in region j.

2.2. Direct Residential and Consumption-Based Black Carbon Emissions

We define the direct emission intensity column vector of BC emissions per unit of income, and then the BC emissions of different provinces triggered by the final demand of each region (consumption-based BC emissions) can be estimated using Equation (7):
Em consumption - based   =   CKVLY f
where C ri × 1 = g i r in i r = ( c i r ) is the direct BC emission intensity per unit of income and is the direct BC emissions of sector i in province r. Therefore, direct residential BC emissions from different sectors in each province can be calculated by multiplying the direct emission intensity ( c i r ) by the income ( in i r ).
Em Direct = i = 1 16 r = 1 30 c i r in i r

2.3. Structural Path Analysis

Combining SPA with an endogenous MRIO model enables the identification of critical pathways leading to higher black carbon (BC) emissions within the regional economies of China’s various provinces. This methodological approach has already found widespread application: Liang et al. [35] employed the SPA model to evaluate income-based greenhouse gas emissions, pinpointing downstream emissions driven by primary inputs across different countries and sectors; Li et al. [36] utilized structural decomposition analysis to examine the drivers of CO2 emissions in Beijing from production-, consumption-, and income-based perspectives, uncovering complementary insights specific to each viewpoint. Additionally, BC emissions corresponding to different production tiers can be derived via Taylor series expansion [37], as shown in Equation (9):
T   =   C ( I - A ) - 1 Y   = CY Tier   0 + CAY Tier   1 + C A 2 Y Tier   2   +     +   C A n Y Tier   n
The production hierarchy defined in Equation (9) delineates the tiers of economic activities contributing to carbon emissions. The first tier (Tier 0) captures the direct emissions generated by each sector’s production process, while the second tier (Tier 1) accounts for the embedded emissions supporting Tier 0’s operations. Subsequent tiers progressively expand the scope of indirect emissions, ultimately forming an infinite series as the production chain extends infinitely. However, this study restricts its analysis to the first three tiers (Tier 0–Tier 2), as prior research indicates that these layers collectively account for approximately 80% of the total impact [38]. The remaining tiers are aggregated under an “other” category. This truncation is common practice in the SPA literature [38,39] as the cumulative contribution of higher-order tiers diminishes rapidly. While the aggregated residual emissions (~20%) are not negligible, they are distributed across a near-infinite number of pathways, each with minimal individual influence. Our sensitivity analysis confirms that the ranking of the dominant critical pathways remains stable regardless of this truncation.

2.4. Data

China’s latest 2017 MRIO table was compiled by Zheng et al. [40]. The MRIO table is composed of the intermediate input, final demand, export, value-added, and the total output of each province. The income used in this article can be obtained from the value-added. The direct residential BC emission data of 2017 were taken from the MEIC emission inventory of Tsinghua University, which can be accessed for free (http://meicmodel.org/). MEIC is a bottom-up air pollutant emission inventory with more than 700 emission sources and production categories [18,36]. In this study, the emission sources of MEIC were mapped to an extended input–output model. We aggregated 700 emission sources and production categories by 21 fuel types into 16 sectors. The classification conforms to the format of China’s official energy statistical yearbook [41]. For the data mapping between the emission inventory and the input–output dataset, one can refer to previous studies [42,43]. Because the sector classification of China’s input–output table is different from that of China’s official energy statistical yearbook, we aggregated the 2017 MRIO table into 16 sectors. Meanwhile, the details of the sector mapping process between different datasets and information on the 16 sectors can be found in the Supplementary Material (SM) Table S1.

3. Results

3.1. Consumption-Based BC Emissions in Different Chinese Provinces

Considering the substantial disparities in labor income and economic development among Chinese provinces, we aggregated 30 provinces into eight regions based on major economic belts (Figure 1). In 2017, China’s total consumption-based BC emissions amounted to 1003.46 Kt. Overall, BC emissions in the less-developed inland regions exceeded those in the more-developed coastal areas. In terms of contribution, Southern China accounted for the largest share (19.11%), followed by the Southwest (17.76%) and the Northern Coast (15.96%). Moreover, economically advanced coastal provinces with higher per capita income and GDP—such as Tianjin (8.68 Kt), Beijing (19.66 Kt), and Shanghai (17.02 Kt)—recorded relatively low emissions, whereas Shandong (74.15 Kt), Hubei (63.81 Kt), and Henan (53.53 Kt), characterized by heavy industry or ongoing economic development, exhibited much higher BC emissions. We also compiled BC emission data for 2012. As shown in Figure S1 (see Supplementary Information), the Northern Coast accounted for the largest share of BC emissions that year, at 17.54%, followed by the Southwest (16.99%) and Northern China (16.92%). Following the launch of the Air Pollution Prevention and Control Action Plan—a landmark national initiative for atmospheric pollution abatement—in 2013, total BC emissions across our study regions decreased by 416 Kt by 2017. Northern China saw the most substantial reduction, at 90.26 Kt, followed by the Northern Coast (82.99 Kt) and the Southwest (66.05 Kt).
Since the number of provinces varied across regions, we averaged BC emissions by dividing the total emissions of each region by the number of provinces to enable more meaningful comparisons. From the perspective of regional averages (Figure 2), Southern China recorded the highest mean emissions (47.96 Kt), followed by the Northern Coast (40.06 Kt), Eastern Coast (37.12 Kt), Northern China (36.66 Kt), and the Southwest (35.65 Kt). The average emissions of these five regions all exceeded 35 Kt. In contrast, the Northeast (28.26 Kt), Southern Coast (25.79 Kt), and Northwest (13.22 Kt) had average emissions below 30 Kt, making them the three lowest-emitting regions. Notably, significant intra-regional disparities exist. For example, in the Northern Coast region, Shandong and Hebei together accounted for 82.49% of total emissions, whereas Beijing and Tianjin contributed only 17.51%. Shandong’s consumption-based BC emissions reached 74.15 Kt (7.39% of the national total), ranking it as the largest BC-emitting province in China. The second-largest emitter was Hunan (67.17 Kt), followed by Hubei (63.81 Kt), Hebei (58.03 Kt), Jiangsu (53.62 Kt), Henan (53.53 Kt), and Guangdong (49.61 Kt). As illustrated in Figure 2, developed provinces such as Beijing, Shanghai, Tianjin, and Fujian exhibited relatively low emissions, whereas provinces adjacent to developed regions, such as Shandong, Hebei, and Shanxi, recorded much higher BC emissions.
Figure 3 shows the consumption-based BC emissions per unit of income for different provinces (i.e., emission intensity, expressed as kg/105 CNY) and the per capita consumption-based BC emissions (kg per person). Guizhou (GZ) exhibited the highest BC emission intensity at 15.46 kg/105 CNY, more than 5.6 times the average intensity of the three developed coastal regions (2.78 kg/105 CNY). Specifically, the Northern Coast recorded 3.85 kg/105 CNY, the Southern Coast recorded 2.21 kg/105 CNY, and the Eastern Coast recorded 2.30 kg/105 CNY, collectively averaging 2.78 kg/105 CNY—only 0.55 times the national average of 4.99 kg/105 CNY. Although the coastal provinces generated 49.69% of China’s total income, they accounted for only 34.78% of total BC emissions. This indicated that less-developed central and western regions could still achieve significant BC emission reductions by improving emission efficiency and lowering emission intensity.
In terms of per capita emissions, coastal provinces such as Guangdong, Fujian, Shanghai, and Anhui recorded relatively low values, whereas inland provinces such as Xinjiang, Inner Mongolia, Guizhou, Ningxia, and Heilongjiang exhibited substantially higher per capita BC emissions. Guizhou ranked highest nationwide at 1.32 kg/cap. This was partly due to the reliance of less-developed northern and western provinces on low-quality coal or biomass fuels, which are inexpensive but highly polluting. Additionally, coastal provinces generally experience milder winter temperatures, resulting in lower heating-related energy consumption. The stark differences in both BC emission intensity and per capita emissions across provinces underscore their close association with regional economic conditions and living habits.

3.2. BC Emissions Triggered by Final Demands

Accurate knowledge of provincial direct BC emissions is essential for evaluating local pollution levels and allocating mitigation responsibilities. Nevertheless, direct emissions alone do not capture BC generated by final consumption, nor the subsequent “income-induced” emissions occurring through interprovincial energy use. Based on Equation (5), we estimated consumption-based BC emissions for 30 provinces. As shown in Figure 4, gross fixed capital formation was the predominant driver in all provinces. Substantial discrepancies between consumption-based and direct BC emissions indicated that final demand in one province not only influenced its own emissions but also induced considerable spillovers to others.
Across the eight Chinese regions, BC emissions induced by final demand exhibited substantial spatial variation (Figure 5a). In the Eastern Coastal provinces, a large share of these emissions occurred outside the originating province, with only 37.86% discharged locally. In Shanghai, intra-provincial emissions totaled just 1.52 Gg (8.94% of its total), and in Beijing, they totaled only 15.66%, indicating that over 90% of BC emissions driven by final demand in these provinces were outsourced to other regions. An opposite pattern was observed in Shandong and Hebei, where 79.23% and 79.21% of emissions, respectively, were generated locally. Except for the Eastern Coastal region, the Southern Coastal region, and several developed municipalities (e.g., Beijing, Tianjin, and Chongqing), most other regions discharged more than half of their consumption-based BC emissions within their own borders, with Hubei exhibiting the highest proportion (86.44%).
Figure 5b further shows interprovincial BC flows, highlighting that Guizhou (GZ), Hebei (HEB), and Henan (HEN) are particularly vulnerable to emissions triggered by final demand from other regions. Guizhou, for instance, received over 30.07 Kt of BC emissions from provinces such as Guangdong (GD), Chongqing (CQ), Henan, Shandong (SD), Zhejiang (ZJ), and Jiangsu (JS), with Henan alone responsible for 2.43 Gg. This reflects Guizhou’s role in producing goods to meet the final demand of more developed or industrialized provinces, thereby generating both direct and indirect income. Similar dependency patterns were evident for Henan and Hebei, with neighboring provinces exerting especially strong influences on their BC emissions. This spatial decoupling between metropolitan consumption and peripheral emissions stems from three interrelated political-economic dynamics in China’s regional development. First, strategic industrial transfers—a cornerstone of national regional coordination policies (e.g., the Western Development Program and the Beijing–Tianjin-Hebei (BTH) Coordinated Development Initiative)—have driven labor- and resource-intensive sectors (steel, chemicals, power generation) to relocate from developed coastal/municipal areas to inland/peripheral provinces. These moves help metropolises cut local pollution and upgrade to high-value-added economies (services and tech) but shift emission-heavy production chains to peripheral regions, which rely on such industries for GDP growth and jobs. Second, local government incentives (fiscal and performance-based) reinforce the imbalance. Peripheral provinces, with weaker endogenous growth drivers, prioritize attracting emission-intensive but revenue-generating industries—enabled by lower environmental compliance costs and land prices—to meet GDP targets. In contrast, developed metropolises use their economic clout to import low-cost, high-emission goods without bearing the associated environmental burdens. Third, unequal environmental governance capacity widens the gap. Metropolises have stricter regulatory enforcement, advanced pollution control technologies, and stronger public demand for clean air—all pushing emission-intensive activities outward. Peripheral provinces, however, lack the resources to fully mitigate emissions from the industries they host.
Given the close interconnections among the 16 sectors in the supply chain, identifying the critical supply chain pathways of BC emissions is essential for enabling policymakers to implement more targeted emission control measures. In this section, we applied Equation (9) to perform a Structural Path Analysis (SPA) of China’s BC emissions in 2017. Although the inverse matrix expansion could extend to tier N, BC emissions declined rapidly with increasing tier depth (Figure 6). Consequently, this study focused on the first three tiers of the supply chain, which together accounted for 80.08% of total BC emissions.

3.3. Critical Path Analysis of BC Emissions in a Specific Province

Meeting final demand in each province triggered both local and interprovincial BC emissions; however, the critical emission paths within provinces remain unclear. We thus identified the top 30 critical BC emission paths (Table 1), including intra- and interprovincial flows. Among them, 25 involve the Residential sector, four involve the Construction sector, and one involves the Wholesale and Retail trade. Eleven paths exceeded 10 Kt of BC emissions. The highest was Residential (Guizhou) → Final demand (Guizhou), with 23.95 Kt. Guizhou’s total consumption-based BC emissions reached 47.20 Kt, with the Residential sector contributing 33.55%. Emission reductions in this sector would substantially mitigate BC’s environmental and health impacts. Similarly, Construction sectors in Jiangsu (18.79%), Zhejiang (26.99%), Guangdong (15.37%), and Shandong (5.69%) accounted for significant shares. Increasing demand in Construction, driven by socio-economic growth, amplified BC emissions, and stimulated related sectors such as Non-metallic Mineral Products and Transportation. Policymakers should thus prioritize green procurement and supply chain optimization in Construction to reduce emissions effectively.

3.4. Critical Path of BC Emissions from Specific Provinces to Other Provinces

Significant disparities exist in energy production and consumption across China, particularly between the developed Eastern coastal provinces and the central and Western regions. Consequently, Eastern provinces transfer income to other provinces to produce goods fulfilling their final demand, thereby generating emissions in those producing regions (Figure 7). The interregional structural paths are thus critical and cannot be overlooked. Figure 7 shows that the Construction sectors in developed provinces (e.g., Beijing, Shanghai, and Jiangsu) drive demand for production in heavy industrial provinces such as Henan, Hebei, Anhui, and other central and Western provinces.
We further identified the top 30 critical BC emission paths triggered by final demand from other provinces within each region (Table 2). The results indicated that Eastern coastal provinces rely heavily on other provinces for goods production, thereby inducing higher BC emissions elsewhere. The path with the largest BC emission was “Anhui: Nonmetallic Manufacture → Jiangsu: Construction,” where Jiangsu’s final demand in Construction drove 645.85 tons of BC emissions in Anhui. Table 2 also shows that the majority of the 30 critical emission origins are coastal provinces—13 from Shanghai, Beijing, Jiangsu, and others—demonstrating that developed regions stimulate industrial production in less developed provinces to satisfy their final demand, increasing BC emissions in those areas. Consumption in the Construction sectors of Eastern coastal provinces notably promote both direct and indirect production in “Nonmetallic Manufacture” and “Metal Manufacture” sectors across Northern, Southern, and Western provinces, exacerbating BC pollution there. Furthermore, paths such as “Hebei: Residential → Shanghai: Residential” and “Guizhou: Residential → Beijing: Residential” revealed that residential sectors in less-developed provinces supply residential final demands in developed regions, thereby generating income and associated BC emissions.

4. Conclusions and Policy Implementation

This study quantified residential BC emissions triggered by final demand across Chinese provinces and identified critical structural emission pathways within the consumption–production–income nexus. Except for the Eastern provinces, average BC emission intensity and per capita emissions were relatively high in other regions, particularly in central and western provinces such as Shanxi, Ningxia, and Inner Mongolia, indicating substantial emission reduction potential.
The study employed an endogenous MRIO model combined with an SPA model to capture recursive economic and emission feedback and to precisely quantify inter-provincial emission spillovers. Results revealed that final demand in developed eastern provinces—especially Zhejiang, Guangdong, and Jiangsu—drove embodied emissions in central and western provinces through complex supply chains involving sectors such as construction, residential, nonmetallic manufacturing, metal manufacturing, and agriculture, confirming the occurrence of carbon emission transfer driven by differential regional environmental regulations and industrial policies, with pollution-intensive production processes effectively being relocated from the eastern coastal regions to less developed central and western provinces. Provinces like Guizhou, Anhui, and Shandong exhibited major BC contributions from these key sectors
Given these findings, coordinated cross-regional governance and joint prevention efforts are essential, particularly in clusters with prominent inter-provincial BC transfers (e.g., Beijing–Tianjin–Hebei and the Yangtze River Delta). To address these inter-regional spillovers and avoid becoming pollution havens, less developed regions should receive technological and financial support for clean production transitions. Policy recommendations include implementing differentiated regional emission reduction responsibilities and prioritizing emission reduction in pollution-intensive sectors by promoting clean technology adoption, upgrading production equipment, and increasing investment in natural gas and power transportation infrastructure. Furthermore, eastern provinces should take greater responsibility for consumption-based emissions by leveraging their economic advantages to fund emission reduction projects in upstream supplier regions. Additionally, reducing residential biomass fuel use and improving urban and rural energy consumption structures are critical. As residential sources represent the largest share of BC emissions, with buildings, heating, and energy consumption as primary drivers, targeted measures such as subsidies for sustainable construction technologies (e.g., radiant floor heating and clean lighting) and encouraging green consumption behaviors—exemplified by initiatives like Xiamen’s Green Life Creation Action Plan—are warranted. Finally, enhancing inter-provincial environmental accountability mechanisms and establishing a unified air quality management platform are suggested to monitor and manage transboundary pollution flows. The findings highlight the necessity of coordinated cross-regional governance to manage transboundary pollution and support China’s goals of carbon peaking, neutrality, and air quality improvement.
While this study conducts a detailed analysis of China’s black carbon (BC) emission footprint and supply chain distribution in 2017 and proposes targeted policy recommendations, it is not without limitations. First, the static nature of the research—relying as it does on cross-sectional data—prevents it from capturing dynamic factors such as technological progress, thereby restricting the ability to project long-term emission trends and assess the effectiveness of policies. Second, although the study focuses on emissions within Chinese cities, the structure of international trade and cross-border supply chains play an increasingly significant role in driving emissions amid ongoing globalization. Third, for the sake of model feasibility and data harmonization across provinces, certain economic sectors and even provincial-level data were aggregated. While this is a common necessary step in MRIO modeling, it inevitably results in a loss of resolution, which may obscure some sub-provincial or sector-specific heterogeneities and thus affect the granularity and precision of downstream policy insights. Future research could integrate the multi-regional input–output (MRIO) model into a global framework to explore how international trade exacerbates or mitigates emission inequalities among Chinese cities, thus providing deeper insights for global climate governance.

Supplementary Materials

The following supporting information can be downloaded at: https://www.mdpi.com/article/10.3390/su17219560/s1. Figure S1: Consumption-based BC emissions in Chinese eight regions (2012); Table S1: MRIO sector names, corresponding aggregated sector names.

Author Contributions

S.L.: Methodology, formal analysis, writing—original draft, software, and visualization. K.L.: Writing—original draft, software, and visualization. Z.D.: Conceptualization, data curation, methodology, writing—review and editing, and supervision. X.Y.: Formal analysis. L.L.: Software. D.C.: Software. Y.D.: Formal analysis. Y.L.: Investigation. Y.Z.: Resources. All authors have read and agreed to the published version of the manuscript.

Funding

This study was supported by the Fundamental Research Funds for the Central Universities [Grant number 25CAFUC03109], which was secured by Shuangzhi Li.

Institutional Review Board Statement

Not applicable.

Informed Consent Statement

Not applicable.

Data Availability Statement

The data presented in this study are available from the corresponding author upon request.

Conflicts of Interest

The authors declare no conflicts of interest.

References

  1. Chen, L.; Zhang, F.; Yan, P.; Wang, X.; Sun, L.; Li, Y.; Zhang, X.; Sun, Y.; Li, Z. The large proportion of black carbon (BC)-containing aerosols in the urban atmosphere. Environ. Pollut. 2020, 263, 114507. [Google Scholar] [CrossRef]
  2. Frey, A.; Rose, D.; Wehner, B.; Müller, T.; Cheng, Y.; Wiedensohler, A.; Virkkula, A. Application of the Volatility-TDMA Technique to Determine the Number Size Distribution and Mass Concentration of Less Volatile Particles. Aerosol Sci. Technol. 2008, 42, 817–828. [Google Scholar] [CrossRef]
  3. Bond, T.C.; Bergstrom, R.W. Light Absorption by Carbonaceous Particles: An Investigative Review. Aerosol Sci. Technol. 2006, 40, 27–67. [Google Scholar] [CrossRef]
  4. Bond, T.C.; Doherty, S.J.; Fahey, D.W.; Forster, P.M.; Berntsen, T.; DeAngelo, B.J.; Flanner, M.G.; Ghan, S.; Kärcher, B.; Koch, D.; et al. Bounding the role of black carbon in the climate system: A scientific assessment. J. Geophys. Res. Atmos. 2013, 118, 5380–5552. [Google Scholar] [CrossRef]
  5. Kuhlbusch, T.A.J.; Crutzen, P.J. Toward a global estimate of black carbon in residues of vegetation fires representing a sink of atmospheric CO2 and a source of O2. Glob. Biogeochem. Cycles 1995, 9, 491–501. [Google Scholar] [CrossRef]
  6. Ramanathan, V.; Carmichael, G. Global and regional climate changes due to black carbon. Nat. Geosci. 2008, 1, 221–227. [Google Scholar] [CrossRef]
  7. Bové, H.; Bongaerts, E.; Slenders, E.; Bijnens, E.M.; Saenen, N.D.; Gyselaers, W.; Van Eyken, P.; Plusquin, M.; Roeffaers, M.B.J.; Ameloot, M.; et al. Ambient black carbon particles reach the fetal side of human placenta. Nat. Commun. 2019, 10, 3866. [Google Scholar] [CrossRef]
  8. Farzad, K.; Khorsandi, B.; Khorsandi, M.; Bouamra, O.; Maknoon, R. A study of cardiorespiratory related mortality as a result of exposure to black carbon. Sci. Total Environ. 2020, 725, 138422. [Google Scholar] [CrossRef]
  9. Feng, J.F.; Wang, L.; Jiang, Y.H.; Yang, X.C. Reactive Protein to Prealbumin Ratio (CPR): A Novel Inflammatory-Nutritional Prognostic Factor for Predicting Cancer-Specific Survival (CSS) and Overall Survival (OS) in Patients with Resectable Esophageal Squamous Cell Carcinoma. J. Oncol. 2019, 2019, 4359103. [Google Scholar] [CrossRef]
  10. Gong, T.; Sun, Z.; Zhang, X.; Zhang, Y.; Wang, S.; Han, L.; Zhao, D.; Ding, D.; Zheng, C. Associations of black carbon and PM2.5 with daily cardiovascular mortality in Beijing, China. Atmos. Environ. 2019, 214, 116876. [Google Scholar] [CrossRef]
  11. Lin, W.; Dai, J.; Liu, R.; Zhai, Y.; Yue, D.; Hu, Q. Integrated assessment of health risk and climate effects of black carbon in the Pearl River Delta region, China. Environ. Res. 2019, 176, 108522. [Google Scholar] [CrossRef]
  12. Liu, S.; Zhan, C.; Zhang, J.; Liu, H.; Xiao, Y.; Zhang, L.; Guo, J.; Liu, X.; Xing, X.; Cao, J. Polycyclic aromatic hydrocarbons in railway stations dust of the mega traffic hub city, central China: Human health risk and relationship with black carbon. Ecotoxicol. Environ. Saf. 2020, 205, 111155. [Google Scholar] [CrossRef]
  13. Menon, S.; Hansen, J.; Nazarenko, L.; Luo, Y. Climate Effects of Black Carbon Aerosols in China and India. Science 2002, 297, 2250. [Google Scholar] [CrossRef]
  14. Zhang, Y.; Zhang, X.; Fan, X.; Ni, C.; Sun, Z.; Wang, S.; Fan, J.; Zheng, C. Modifying effects of temperature on human mortality related to black carbon particulates in Beijing, China. Atmos. Environ. 2020, 243, 117845. [Google Scholar] [CrossRef]
  15. National Bureau of Statistic of China (NBSC). China Statistical Yearbook, Beijing, China, 2018; China Statistic Press: Beijing, China, 2019. Available online: http://www.stats.gov.cn/english/Statisticaldata/ (accessed on 15 October 2024).
  16. Wang, R.; Tao, S.; Balkanski, Y.; Ciais, P.; Boucher, O.; Liu, J.; Piao, S.; Shen, H.; Vuolo, M.R.; Valari, M.; et al. Exposure to ambient black carbon derived from a unique inventory and high- resolution model. Proc. Natl. Acad. Sci. USA 2014, 111, 2459–2463. [Google Scholar] [CrossRef]
  17. Shindell, D.; Kuylenstierna, J.C.I.; Vignati, E.; van Dingenen, R.; Amann, M.; Klimont, Z.; Anenberg, S.C.; Muller, N.; Janssens-Maenhout, G.; Raes, F.; et al. Simultaneously Mitigating Near-Term Climate Change and Improving Human Health and Food Security. Science 2012, 335, 183. [Google Scholar] [CrossRef]
  18. Pani, S.K.; Wang, S.H.; Lin, N.H.; Chantara, S.; Lee, C.T.; Thepnuan, D. Black carbon over an urban atmosphere in Northern peninsular Southeast Asia: Characteristics, source apportionment, and associated health risks. Environ. Pollut. 2020, 259, 113871. [Google Scholar] [CrossRef] [PubMed]
  19. Zhou, S.; Meng, J.; Wei, W.; Li, J. Cross-regional Black Carbon Transfer and Management Strategy: Based on MRIO and WRF/Chem Models. J. Environ. Econ. Manag. 2018, 3, 110–125. [Google Scholar] [CrossRef]
  20. Davis, S.J.; Caldeira, K. Consumption-based accounting of CO2 emissions. Proc. Natl. Acad. Sci. USA 2010, 107, 5687–5692. [Google Scholar] [CrossRef] [PubMed]
  21. Kang, P.; Deng, Z.; Zhang, X.; Wang, Z.; Li, W.; Qi, H.; Lei, Y.; Ou, Y.; Deng, Z. Disparities in driving forces behind energy-related black carbon emission changes across China’s provinces. J. Clean. Prod. 2021, 330, 129849. [Google Scholar] [CrossRef]
  22. Peters, G.P. From production-based to consumption-based national emission inventories. Ecol. Econ. 2008, 65, 13–23. [Google Scholar] [CrossRef]
  23. Deng, Z.; Kang, P.; Wang, Z.; Zhang, X.; Li, W.; Ou, Y.; Lei, Y.; Dang, Y.; Deng, Z. The impact of urbanization and consumption patterns on China’s black carbon emissions based on input-output analysis and structural decomposition analysis. Environ. Sci. Pollut. Res. Int. 2021, 28, 2914–2922. [Google Scholar] [CrossRef] [PubMed]
  24. Gu, Y.; Zhang, W.; Yang, Y.; Wang, C.; Streets, D.G.; Yim, S.H.L. Assessing outdoor air quality and public health impact attributable to residential black carbon emissions in rural China. Resour. Conserv. Recycl. 2020, 159, 104812. [Google Scholar] [CrossRef]
  25. Meng, J.; Mi, Z.; Yang, H.; Shan, Y.; Guan, D.; Liu, J. The consumption-based black carbon emissions of China’s megacities. J. Clean. Prod. 2017, 161, 1275–1282. [Google Scholar] [CrossRef]
  26. Meng, J.; Liu, J.; Xu, Y.; Tao, S. Tracing Primary PM2.5 emissions via Chinese supply chains. Environ. Res. Lett. 2015, 10, 054005. [Google Scholar] [CrossRef]
  27. Wang, J.; Wang, Z.; Peng, S.; Li, C.; Wei, L. Tracing CO2 emissions of China’s Construction sector. J. Clean. Prod. 2020, 275, 124165. [Google Scholar] [CrossRef]
  28. Fang, D.; Yang, J. Drivers and critical supply chain paths of black carbon emission: A structural path decomposition. J. Environ. Manag. 2021, 278, 111514. [Google Scholar] [CrossRef]
  29. Wang, R.; Tao, S.; Wang, W.; Liu, J.; Shen, H.; Shen, G.; Wang, B.; Liu, X.; Li, W.; Huang, Y.; et al. Black carbon emissions in China from 1949 to 2050. Environ. Sci. Technol. 2012, 46, 7595–7603. [Google Scholar] [CrossRef]
  30. Wu, J.; Kong, S.; Wu, F.; Cheng, Y.; Zheng, S.; Qin, S.; Liu, X.; Yan, Q.; Zheng, H.; Zheng, M.; et al. The moving of high emission for biomass burning in China: View from multi-year emission estimation and human-driven forces. Environ. Int. 2020, 142, 105812. [Google Scholar] [CrossRef]
  31. Li, S.; Zhang, X.; Deng, Z.; Liu, K.; Wang, J.; Fan, J. Widening inequality: Diverging trends in CO2 and air pollutant emissions across Chinese cities. Resour. Environ. Sustain. 2025, 21, 100227. [Google Scholar] [CrossRef]
  32. Miller, R.E.; Blair, P.D. Input-Output Analysis: Foundations and Extensions, 2nd ed.; Cambridge University Press: Cambridge, UK, 2009. [Google Scholar]
  33. Moses, L.N. The stability of interregional trading pattern and input–output analysis. Am. Econ. Rev. 1955, 45, 803–832. [Google Scholar]
  34. Miyazawa, K.; Masegi, S. Interindustry Analysis and the Structure of Laborers income-Distibution. Lect. Notes Econ. Math. Syst. 1963, 15, 89–103. [Google Scholar] [CrossRef]
  35. Liang, S.; Qu, S.; Zhu, Z.; Guan, D.; Xu, M. Income-Based Greenhouse Gas Emissions of Nations. Environ. Sci. Technol. 2017, 51, 346–355. [Google Scholar] [CrossRef]
  36. Li, J.S.; Zhou, H.W.; Meng, J.; Yang, Q.; Chen, B.; Zhang, Y.Y. Carbon emissions and their drivers for a typical urban economy from multiple perspectives: A case analysis for Beijing city. Appl. Energy 2018, 226, 1076–1086. [Google Scholar] [CrossRef]
  37. Weber, C.L.; Peters, G.P.; Guan, D.; Hubacek, K. The contribution of Chinese exports to climate change. Energy Policy 2008, 36, 3572–3577. [Google Scholar] [CrossRef]
  38. Li, S.; Zhang, X.; Deng, Z.; Liu, X.; Yang, R.; Yin, L. Identifying the critical supply chains for black carbon and CO2 in the Sichuan urban agglomeration of southwest China. Sustainability 2023, 15, 15465. [Google Scholar] [CrossRef]
  39. Waugh, F.V. Inversion of the Leontief Matrix by power series. Econometrica 1950, 18, 142–154. [Google Scholar] [CrossRef]
  40. Zheng, H.; Bai, Y.; Wei, W.; Meng, J.; Zhang, Z.; Song, M.; Guan, D. Chinese provincial multi-regional input-output database for 2012, 2015, and 2017. Sci. Data 2021, 8, 244. [Google Scholar] [CrossRef] [PubMed]
  41. Geng, G.; Zheng, Y.; Zhang, Q.; Xue, T.; Zhao, H.; Tong, D.; Zheng, B.; Li, M.; Liu, F.; Hong, C.; et al. Drivers of PM2.5 air pollution deaths in China 2002–2017. Nat. Geosci. 2021, 14, 645–650. [Google Scholar] [CrossRef]
  42. Guan, D.; Su, X.; Zhang, Q.; Peters, G.P.; Liu, Z.; Lei, Y.; He, K. The socioeconomic drivers of China’s primary PM 2.5 emissions. Environ. Res. Lett. 2014, 9, 024010. [Google Scholar] [CrossRef]
  43. Huo, H.; Zhang, Q.; Guan, D.; Su, X.; Zhao, H.; He, K. Examining Air Pollution in China Using Production- And Consumption-Based Emissions Accounting Approaches. Environ. Sci. Technol. 2014, 48, 14139–14147. [Google Scholar] [CrossRef] [PubMed]
Figure 1. Consumption-based BC emissions in eight Chinese regions (the pie chart means the percentage of BC emissions in each region; on the right are the BC emissions of each region).
Sustainability 17 09560 g001
Figure 2. Consumption-based BC emissions in different Chinese provinces (where the ☆ represents the average emissions of the region).
Sustainability 17 09560 g002
Figure 3. Consumption-based BC emission intensity and per capita BC emissions.
Sustainability 17 09560 g003
Figure 4. Impact of different types of final demands on BC emissions in different provinces.
Sustainability 17 09560 g004
Figure 5. Regional and provincial BC emissions triggered by final demand.
Sustainability 17 09560 g005
Figure 6. The contribution of different tiers and sectors in the supply chain to BC emissions (the percentage in the histogram is the ratio of the production layer to the total emissions; the percentage in the pie chart is the proportion of major sectoral emissions to the total emissions of the production layer).
Sustainability 17 09560 g006
Figure 7. Top 50 paths for BC emissions from specific provinces to other provinces.
Sustainability 17 09560 g007
Table 1. Critical paths of BC emissions within different provinces in 2017.
RegionDriver
Region
SectorBC Emissions
(Kt)
Contribution
(%)
Tier 0Tier 1
1GuizhouGZ:RES 23.9533.55
2HunanHUN:RES 20.5729.17
3HebeiHEB:RES 19.7525.11
4SichuanSC:RES 14.3431.43
5HeilongjiangHLJ:RES 14.1430.72
6HubeiHUB:RES 13.7022.89
7ShandongSD:RES 13.6118.61
8LiaoningLN:RES 10.6029.53
9Inner MongoliaNM:RES 10.5324.58
10YunnanYN:RES 10.3029.20
11AnhuiAH:RES 10.0421.43
12HenanHEN:RES 8.4916.73
13XinjiangXJ:RES 7.9931.81
14ShaanxiSAX:RES 7.6126.13
15GuangxiGX:RES 7.5331.26
16GuangdongGD:RES 7.3225.00
17JilinJL:RES 7.2528.53
18JiangsuJS:CON 7.0318.79
19ShanxiSX:RES 6.6013.26
20GuizhouGZ:WRT 6.449.03
21GansuGS:RES 6.3633.43
22FujianHJ:RES 5.5626.86
23JiangxiJX:RES 5.3823.59
24JiangsuJS:RES 5.2914.13
25ZhejiangZJ:CON 4.5826.99
26ChongqingCQ:RES 4.5325.79
27GuangdongGD:CON 4.5015.37
28ShandongSD:CON 4.165.69
29HunanHUN:AGR 4.125.85
30HebeiHEB:RESHEB:RES3.995.07
Table 2. Top 30 critical paths of BC emissions from specific provinces to other provinces.
RankDriver
Region
SectorDestination
Provinces
BC Emissions
(Tons)
Contribution
(%)
Tier 0Tier 1
1AnhuiAH:NMPJS:CONJiangsu645.851.30
2ZhejiangZJ:NMPSH:CONShanghai593.503.50
3HebeiHEB:RESSH:RESShanghai546.580.69
4HenanHEN:NMPGD:CONGuangdong492.530.97
5HeilongjiangHLJ:NMPJL:CONJilin439.330.95
6HenanHEN:NMPZJ:CONZhejiang435.720.86
7HeilongjiangHLJ:AGRJL:LIGJilin381.260.83
8HebeiHEB:MTPBJ:RESBeijing355.940.45
9HenanHEN:NMPCQ:CONChongqing328.800.65
10HenanHEN:NMPYN:CONYunnan324.990.64
11GuizhouGZ:RESBJ:RESBeijing317.420.44
12HenanHEN:NMPSAX:CONShaanxi317.160.63
13HebeiHEB:NMPBJ:CONBeijing266.590.34
14HenanHEN:NMPLN:CONLiaoning237.440.47
15HenanHEN:NMPSH:CONShanghai235.070.46
16JilinJL:RESZJ:RESZhejiang217.810.86
17ShanxiSX:PPCSH:RESShanghai215.690.43
18HebeiHEB:MTPBJ:CONBeijing192.110.24
19HebeiHEB:NMPSX:CONShanxi186.400.24
20HenanHEN:NMPGZ:CONGuizhou183.590.36
21JilinJL:NMPHLJ:CONHeilongjiang168.380.66
22HenanHEN:NMPNM:CONInner Mongolia165.110.33
23HebeiHEB:MTPYN:CONYunnan150.450.19
24HebeiHEB:MTPNM:CONInner Mongolia141.160.18
25HenanHEN:NMPJX:CONJiangxi138.160.27
26GansuGS:AGRHEN:LIGHenan133.010.70
27HebeiHEB:RESSH:RESShanghai131.930.17
28ShaanxiSAX:RESBJ:RESBeijing131.150.45
29BeijingBJ:NMPTJ:CONHenan127.482.73
30HunanHUN:RESBJ:RESBeijing126.030.18
Disclaimer/Publisher’s Note: The statements, opinions and data contained in all publications are solely those of the individual author(s) and contributor(s) and not of MDPI and/or the editor(s). MDPI and/or the editor(s) disclaim responsibility for any injury to people or property resulting from any ideas, methods, instructions or products referred to in the content.

