Abstract
In recent years, the frequency of extreme weather has begun to increase, and the impact of climate on economic and social development has started to attract people’s attention. As an important foundation for the development of human society, urban energy systems are also confronted with the challenges brought about by climate change. To explore the impact of climate policies on the stability of urban energy systems, this paper uses advanced empirical models such as the M-PSM-DID model, DML model, and SDM model to analyze the specific relationship between the carbon emissions trading policy (CETP), one of the urban climate policies, and the resilience of urban energy systems (ESR). Research has found that the CETP can not only effectively reduce urban carbon emissions but also significantly promote the improvement of urban ESR, and this promoting effect is more pronounced in environmentally friendly cities. Meanwhile, the application of artificial intelligence is an important transmission path for the CETP to enhance the ESR of cities, and the effective market and agile government play a moderating role in the process of the CETP improving ESR. Finally, the CETP has a significant spatial effect on ESR. With the change in geographical distance, this effect shows an “inverted U” shaped distribution characteristic. The above results have significant reference value for environmental policymakers in different cities.
1. Introduction
Energy, as a key strategic resource in the great power game, is an important cornerstone for addressing climate change, promoting economic growth, and enhancing people’s well-being. In recent years, climate extremes have become increasingly prominent, posing enormous challenges to the security of the world’s energy systems [1,2]. On the one hand, high temperatures, cold waves, heat waves, and other abnormal weather have damaged energy infrastructure around the world, exacerbating the risk of energy supply “broken chain”. Since the beginning of summer in 2022, many parts of Europe have been hit by a rare heat wave, with temperatures in many countries exceeding historical extremes. The high temperatures have led to an increase in evaporation and a drop in the water level of rivers, lakes, and reservoirs, which has seriously affected the power generation capacity of hydroelectric power plants, resulting in Europe experiencing a severe power crisis. Meanwhile, Texas in the United States was affected by snowfall, freezing rain, and other cold weather, and the ice blockage of natural gas pipelines led to transportation obstruction, and a number of natural gas power plants were unable to supply electricity normally, thus aggravating the pressure on the local electricity and energy supply. In addition, the energy supply shortage caused by climate change may exacerbate price fluctuations in the energy market. The drastic fluctuations in energy prices not only affect the economic benefits of energy production and consumption enterprises but may also have an impact on macroeconomic stability [3]. As the world’s biggest developing country, China has achieved great success in climate governance and energy transformation. Exploring China’s green and low-carbon development model not only helps to enhance its own international energy security but also provides reference for other developing countries.
As the economy and society are rapidly developing, how to solve the global carbon emission reduction problem is the primary task of countries to realize the industrial structure upgrade. Due to the existence of negative environmental externalities, enterprises do not need to bear additional costs for pollution emissions, and relying solely on market mechanisms can no longer adequately address the aforementioned issues. Currently, the international community has gradually adopted administrative measures such as carbon taxes and market-based measures like carbon market trading to drive enterprises to reduce carbon emissions.
In 2011, China’s Notice on Carbon Emission Trading Pilot Work explicitly calls for Beijing, Guangdong, Hubei, and other provinces and municipalities to join the plan from 2013 to 2014 (as shown in Figure 1), with the aim of controlling the total amount of carbon emissions (List of CETP projects: Beijing, Wuhan, Shanghai, Tianjin, Huangshi, Shiyan, Yichang, Xiangyang, Ezhou, Jingmen, Xiaogan, Jingzhou, Huanggang, Xianning, Suizhou, Guangzhou, Shaoguan, Shenzhen, Zhuhai, Shantou, Foshan, Jiangmen, Zhanjiang, Maoming, Zhaoqing, Huizhou, Meizhou, Shanwei, Heyuan, Yangjiang, Qingyuan, Dongguan, Zhongshan, Chaozhou, Jieyang, Yunfu, Chongqing). The implementation of the CETP will increase the costs for polluting companies, prompting them to improve energy efficiency through the introduction of new technology, thereby facilitating energy transition. In late 2023, the World Meteorological Organization (WMO) issued an important warning: “In order to reinforce the resilience and efficiency of energy ecosystem and to drive the associated energy transition, we need to have a deep understanding of climate change factors and their interrelationship with renewable energy.” As an environmental policy to address climate change, clarifying whether carbon trading policies are effective in increasing the tenacity of energy systems is a key academic concern.
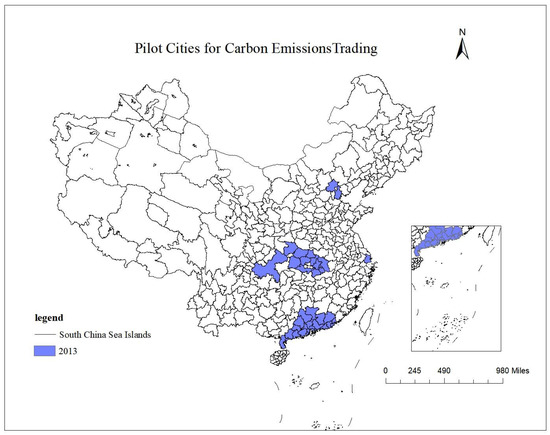
Figure 1.
Distribution of carbon emissions trading pilot cities.
2. Literature Review
Current research on carbon trading policy focuses on its influence on green technology innovation [4], corporate pollution and carbon diminution [5,6,7], investment expenditure [8], and energy utilization efficiency [9,10]. However, there is a scarcity of studies that have delved into the liaison between the CETP and ESR, as well as the pathways through which they interact. This paper fills this knowledge gap and provides new insights into the role of the CETP in promoting ESR upgrading and realizing green production paradigm shifts.
ESR denotes the competency of an energy system (ES) to sense risks in advance and respond accordingly, to react quickly and flexibly when disturbed, and to recover rapidly and adapt to future risk patterns after the disturbance ends [11,12]. Established research has emphasized assessing the ESR indicator components, impact elements, and the leading functions. The construction of ESR indicators has not yet been standardized by academics, and the composite index method [13] and the impact loss method [14,15] are the two commonly used measurement methods. Energy diversity, energy innovation, and green finance are important factors influencing the improvement of ESR [16]. Generally speaking, the enhancement of ESR is necessary for adapting to global climate change and promoting the value of the energy chain [17].
With the advent of the data era, the character of artificial intelligence (AI) technologies in driving energy demand growth and restructuring energy strategic layout cannot be ignored [18]. Nepal et al. [19] empirically examined that AI is able to promote power efficiency by optimizing energy use, monitoring energy waste, and predicting energy demand; Jiang & Yu [20] hold that artificial intelligence can promote energy technology innovation by collecting and processing big data from both producers and consumers, thereby facilitating ESR. However, previous research on the influence of AI have mainly emphasized the provincial level, with fewer studies focusing on the city level. And few studies have used AI as a mediator to explore whether it is a mechanism of action for CETP to influence the enhancement of ESR.
This study offers three tightly integrated contributions. Firstly, in light of the panel data of Chinese cities, carbon trading policy, artificial intelligence, and urban ESR are all incorporated into the same framework, and a model is adopted to empirically analyze whether the CETP affects the development of urban ESR, which innovatively proposes that AI is an important factor in driving the enhancement of ESR. Secondly, the double machine learning method is introduced to conduct a robustness test on the causality of the CETP driving the urban ESR enhancement in order to eliminate the bias brought by the model setting bias and high-dimensional data regression. Finally, the heterogeneity test of the execution effect of the CETP is conducted from three distinctive perspectives, and it is proposed that the CETP has played a positive moderating effect on the ESR through responsive government and effective markets.
3. Theoretical Hypothesis
3.1. Direct Impacts of the CETP on ESR
Against the backdrop of intensifying climate risks and overlapping energy transitions, ESR has become a core indicator of energy security. The CETP mainly enhances ESR in three dimensions: robustness, recoverability, and adaptability [11]. First, the CETP provides a clear direction and mechanism for the low-carbon transition of the energy system (ES) by establishing a “cap-and-trade” emission reduction framework. Under this framework, the government sets an upper limit on total carbon emissions and allocates emission allowances to individual enterprises. The use of fossil fuels generates a substantial amount of carbon emissions, and the CETP transforms the originally implicit external costs of carbon emissions from fossil fuel use into explicit economic costs. To meet the allowance requirements and avoid paying high carbon emission costs, enterprises are compelled to actively take measures to reduce their reliance on high-carbon fossil fuels and instead seek low-carbon and diversified energy supply approaches. This transition renders the ES more stable when facing carbon emission restrictions and fluctuations in the energy market, enabling it to effectively withstand external shocks and thereby significantly enhance the system’s robustness [21].
Second, the CETP plays a crucial incentive role through price signals. Price fluctuations in the carbon trading market reflect the cost and scarcity of carbon emissions, providing enterprises with clear economic signals. To reduce carbon emission costs, enterprises will actively invest resources in technological innovation, researching and applying more efficient and cleaner energy technologies. These technological innovation achievements can play a pivotal role during disasters. For example, some novel energy storage technologies and distributed energy systems can swiftly provide backup power when the main energy supply is disrupted, ensuring the basic power needs of critical facilities and residents. This not only helps to minimize the losses caused by accidents but also improves the overall efficiency and reliability of the ES [22].
Finally, the CETP endows the ES with a “flexible response” capability through a dynamic adjustment mechanism. The cross-period adjustment of carbon allowances and the interregional connectivity and integration are crucial components of this mechanism. Cross-period adjustment enables the flexible allocation of carbon allowances based on changes in economic development and energy demand during different periods. This alleviates the compliance pressure faced by enterprises in the short term, allowing them to plan production and emission reduction strategies more rationally. The interregional connectivity and integration promote energy cooperation and optimal resource allocation among different regions, preventing energy supply shortages or surpluses in local areas. Through these dynamic adjustment measures, the ES can flexibly adjust its energy mix and supply modes in response to real-time changes in climate and energy demand [23]. Therefore, we put forward the following hypothesis:
H1.
The CETP can markedly boost urban ESR.
3.2. The Indirect Impacts of Artificial Intelligence
As an effective tool for market-based emission reduction, the role of the CETP in promoting AI technological innovation cannot be ignored. Firstly, the government has provided substantial subsidies and tax incentives in carbon trading policies (CTPs) to promote the development of AI. These policy incentives can reduce the cost for enterprises to apply artificial intelligence technologies, enhance their enthusiasm, and promote the wide application and innovative development of AI in the carbon trading and emission reduction fields [24]. Secondly, the establishment and operation of the carbon trading market offer a vast application scenario for the innovative breakthroughs of AI. During the operation of the carbon trading market, a massive amount of multi-dimensional and dynamically updated data is generated, covering areas such as carbon emission monitoring, trading behaviors, policy compliance, and market prediction. These data provide a natural testing ground for the in-depth application of AI technologies, driving innovation breakthroughs in data collection, organization, and analysis by AI, and giving rise to new business models and industrial values [25]. Finally, CTPs drive the green transformation of AI hardware manufacturing. The wide application of AI cannot be separated from a large number of power resources [26]. By setting carbon emission quotas, CTPs significantly increase the operating costs of high-energy-consuming hardware, compelling enterprises to push for the design of AI hardware towards low power consumption, thereby optimizing production processes to reduce carbon emissions.
Meanwhile, as an important component of technological innovation, AI has significant advantages in risk prediction, dynamic dispatching, and intelligent recovery of ESs. Firstly, AI can achieve all-domain perception and risk prediction of ESs through multi-source data fusion. When analyzing the operational data of ESs in real time, AI can identify potential risks such as supply–demand imbalance and equipment failure in advance, issue early warnings, and enable the ES to take measures in advance to avoid or mitigate the influence of risks [27]. Secondly, AI can achieve dynamic dispatching and elastic optimization of ESs when there is a supply–demand imbalance. AI algorithms can dynamically adjust the production, transmission, and distribution of energy based on the real-time status of the ES and external conditions, ensuring the stable operation of the ES and quickly adjusting strategies in emergencies to enhance the system’s recovery capacity [28]. Finally, when faults occur in the ES, AI can quickly locate the problem and initiate repairs [29]. By constructing a virtual mirror of the ES through digital twin technology, AI can simulate the fault propagation path and guide repair personnel to prioritize the restoration of critical nodes, thereby improving the speed and efficiency of ES recovery (as shown in Figure 2).
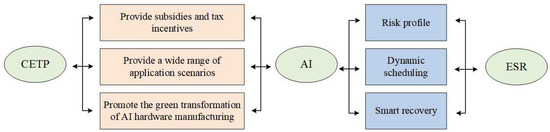
Figure 2.
Indirect effect diagram.
Therefore, this contributes to the following hypotheses:
H2.
The CETP can enhance the ESR through the innovation and application of artificial intelligence.
3.3. The Moderating Impacts of Efficient Markets and Responsive Government
The synergistic regulation of efficient markets and responsive governments is reshaping the tenacity gene of the energy system. The hybrid governance system, which is generated by the integration of market mechanisms that stimulate technological revolutions through price signals and government regulation that builds security boundaries through policy instruments, enables the ES to display an organism-like adaptive capacity. On the one hand, efficient markets optimize resource allocation through price mechanisms, competition, and innovation [30]. In the CTP, an efficient market can ensure reasonable fluctuations in carbon prices, promote low-carbon technological innovation among enterprises, and thereby reduce carbon emissions. On the other hand, a responsive government corrects market failures and promotes the public interest through policymaking, regulation, and communal services [31,32]. In the CTP, the government can set total carbon emission control targets, allocate carbon emission quotas, and regulate the carbon trading marketplace to make it fair and transparent. Therefore, the following hypotheses are proposed in this paper:
H3.
Efficient markets positively moderate the impact of the CETP on ESR.
H4.
Responsive government positively moderates the impact of the CETP on ESR.
3.4. The Spatial Effect of the CETP
The role of the CETP is not limited to a single city, and its effects often have significant spatial spillover effects that can affect neighboring areas and the wider region [33,34]. First, after the implementation of the CETP in one region, the effects of the policies will spread to the surrounding regions due to the spatial correlation of economic activities (e.g., trade, investment, labor mobility, etc.) [35]. Second, the CETP prompts enterprises to make technological innovations to improve energy utilization efficiency. These technological innovations not only generate benefits in the region but also affect neighboring regions through the knowledge spillover effect, which promotes technological progress and carbon emission reduction on a larger scale [36]. Furthermore, the implementation of the CETP provides a demonstration effect for other regions [7], prompting neighboring regions to imitate or adopt similar policies. In addition, there may be policy competition between regions, promoting the diffusion and optimization of carbon trading policies (as shown in Figure 3). In summary, the following hypothesis is proposed in this paper:
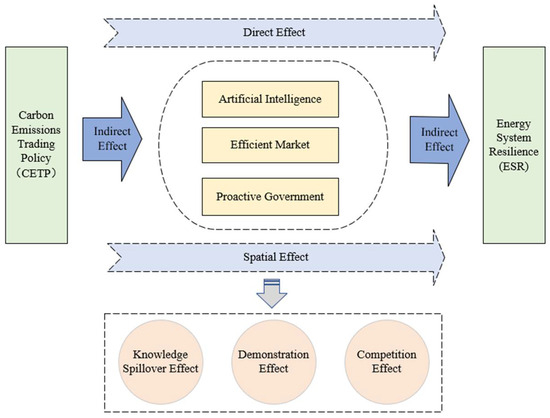
Figure 3.
The CETP and ESR mechanism road map.
H5.
The CETP has significant spatial spillover effects.
4. Research Design
4.1. Modeling
Since the cities selected for the ETP reform are not completely random, direct estimation may lead to selection bias in the results. Therefore, before using the DID model for estimation, this article first uses the PSM to solve the problem of selection bias by finding the “counterfactual group” of reform cities. Meantime, the DID technique can not only effectively circumvent the endogeneity problem but also effectively avoid the interference of time-disturbing terms on the explained variables. Therefore, this paper selects the PSM-DID method and constructs the following two models.
First, PSM processing was performed to estimate the propensity values using a binary choice model () regression, and the most commonly used 1-to-3 nearest neighbor matching was chosen, as shown in the model below:
where is a virtual variable allocated a value of 1 if city i has carried out a CETP, and 0 otherwise; is a matching variable for PSM, i.e., a control variable; and is a random perturbation factor.
Then, the PSM-treated new samples are applied to test the governance effect of the CETP.
where is the energy system tenacity; is the core explanatory variable indicating whether the city is a pilot city; and denote city and year fixed effects, respectively.
4.2. Variables Settings
4.2.1. Dependent Variables: Energy System Resilience (ESR)
Enhancing the ESR is an important measure to ensure national energy supply security and a solid foundation for promoting modernization of urban governance [37]. With insights from the research of Yang et al. [11] and taking the background of China’s cities and socio-economic transformation into account, we select 13 indicators to assess the level of ESR in three dimensions, namely, robustness, recoverability, and adaptability (see Table 1). The robustness of the system refers to the stability of urban energy supply and the rationality of energy consumption, as well as the ability to be less affected by the disruption of external energy supply chains [38]. Therefore, this paper selects four indicators for measurement: the natural gas delivery, the LPG delivery, the final consumption of coal, and the final consumption of wind power. The recoverability of the system refers to the sufficient investment in urban energy and the ability to quickly ensure the smooth transportation of energy after a disaster [39]. Therefore, this paper selects five indicators for measurement: the length of gas supply pipelines, the road area, gas investment, centralized heating investment, and environmental pollution control investment. The adaptability of the system refers to the ability of urban energy to respond quickly and flexibly when severely disturbed, which specifically includes energy technology innovation and energy infrastructure [40]. Therefore, this paper selects four indicators for measurement: scientific and technological expenditure, the number of patent applications in the fields of new energy and environmental protection, the total area of photovoltaic power stations, and the number of LPG vehicles and stations.

Table 1.
Urban ESR index system.
This paper mainly uses the entropy method to comprehensively evaluate the ESR index, and the calculation process is as follows:
- ①
- To eliminate the dimensional differences between various indicators, the range transformation method is used for processing. For positive indicators, let ; for negative indicators, let .
- ②
- Calculate the proportion of the i-th evaluated object on the j-th evaluation indicator: .
- ③
- Calculate the entropy value of the j-th evaluation indicator: .
- ④
- Calculate weight coefficients: .
- ⑤
- Calculate score: .
4.2.2. Core Explanatory Variables: Carbon Emissions Trading Policy (CETP)
Following the opening of the first CETP in Shenzhen in 2013, other regions have also launched pilot policies. According to the list of CETPs promulgated by the NDRC of the People’s Republic of China, the cities that conduct the pilots in and after 2013 are assigned a value of 1, and those that do not conduct the pilots in a specific time allocate a value of 0.
4.2.3. Intermediary Variables: Artificial Intelligence (AI)
Artificial intelligence (AI) is the mediating variable, with robot installation density (AI1) used to characterize its application level—a widely recognized indicator in related academic research [41,42]. Considering that the various algorithms applied in the control units and IoT (Internet of Things) platforms of industrial robots are developed based on AI technologies, industrial robots can, to a certain extent, reflect the practical application level of AI technologies in the industrial manufacturing sector. Some AI patents are still predominantly at the theoretical stage and have a certain gap before they can be truly applied. Unlike indicators based on AI patent transformations, robot installation density more accurately captures the real-world application of AI. Meanwhile, to enhance the robustness of the empirical results, this paper measures the development level of AI using the logarithmic value of the number of artificial intelligence enterprises (AI2).
4.2.4. Control Variables
This paper draws on the work of [43] to select industrial structure (), financial development level (), urbanization level (), and opening level () as the control variables. is measured by the proportion of tertiary industry output value to GDP; is measured by the proportion of GDP accounted for by the balance of loans and deposits of financial institutions; is measured by the ratio of urban population to total population; and is measured by the proportion of total import and export volume to GDP.
4.3. Data Source
Limited by data availability, this study focuses on a sample of 250 Chinese cities from 2011 to 2022. Given the relatively low proportion of missing data (5%), we employed linear interpolation to maintain data continuity and enhance computational efficiency. Data sources include the China Energy Statistical Yearbook, the Environmental Data Center of the Ministry of Ecology, and the environmental status bulletins of various provinces and cities.
5. Empirical Findings and Analysis
5.1. Co-Linearity Analysis
As shown in Figure 4, the absolute values of the correlation coefficients of all variables are less than 0.52, and there is no significant linear relationship. Furthermore, the VIF test indicates that the mean of all values is only 1.34 (Table 2), and the maximum value does not exceed 5. These data indicate that the establishment of the model is not significantly affected by multicollinearity [44].
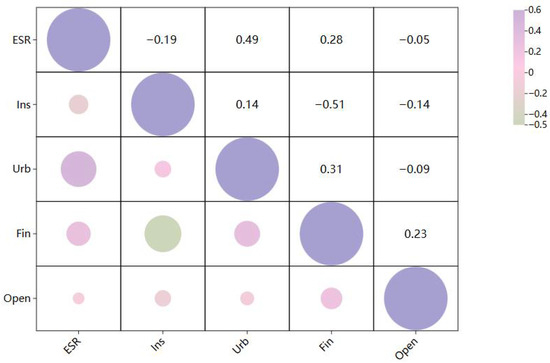
Figure 4.
Heat map of variable correlation coefficients.
Table 2.
Descriptive statistics.
5.2. PSM Tests
The matching quality of PSM directly affects the accuracy of subsequent DID results. A balance test needs to be conducted on the results of PSM. This research utilizes the 1-to-3 nearest neighbor matching approach to examine the balance (Table 3). The standardized deviation plots of the control variables show that compared with the data before matching, the absolute values of the standard deviations are all less than 20%, and the samples are matched well (Figure 5).
Table 3.
PSM matching.
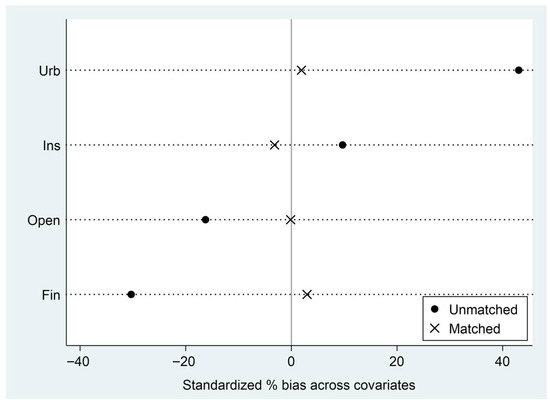
Figure 5.
Plot of standardized deviations of control variables.
To assess the matching effect of PSM, the propensity score distribution was visualized by plotting its density function. As illustrated in Figure 6, the post-matching probability density distributions for both the treatment and control groups are apparently closer to each other compared to before matching, indicating that the matching effect is good, which further confirms the rationality and validity of this paper using it to conduct the econometric analysis.
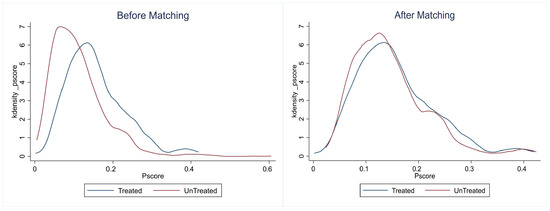
Figure 6.
Kernel density distribution of propensity scores.
5.3. DID Analysis
According to the matched specimens, model (2) is used for statistical analysis, with the outcomes displayed in Table 4. In column (1), time and city effects are controlled for, but control variables are neglected. The CETP coefficient is 0.0268 and obviously positive. In column (2), control variables are introduced and both time and city effects are accounted for, with the CETP coefficient remaining 0.0244 and significantly positive. The results provide evidence that the CETP significantly contributes to the enhancement of ESR, thus supporting H1.
Table 4.
DID baseline regression.
5.4. Robustness Test
5.4.1. Parallel Trend Test
Satisfying the parallel trend test (PTT) is the key to the difference-in-differences model. This paper draws on the research results of Cheng et al. [45] and sets up the following model for PTT:
where respectively, denote the virtual variables for n years before and after the execution of the CETP in region i, which helps examine ESR trends during the first two years and the last two years of the pilot. If the coefficients are significant, it indicates that the CETP has a sustained impact on ESR. As demonstrated in Figure 7, in the two years prior to the policy implementation, there were no systematic differences between the pilot cities and non-pilot cities. However, in the two years following the policy implementation, the coefficient of the CETP is significantly positive. The results verify that the model passes the test, which provides a reliable foundation for the subsequent double-difference analysis.
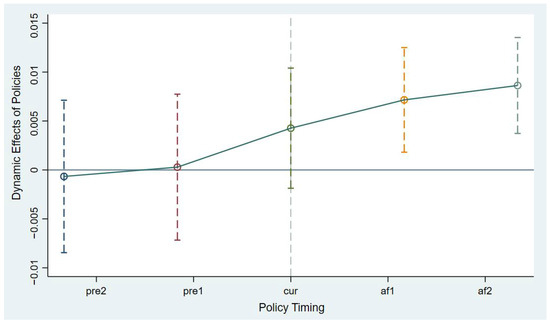
Figure 7.
Parallel trend test.
5.4.2. Placebo Test
Considering other policy factors, this paper randomly selected an experimental group and constructed a false experimental group. Then, a year was randomly chosen as the policy adoption time for the false experimental group, and regression analysis was conducted based on this. The experiment was repeated 500 times. Figure 8 displayed that the policy interaction term DID coefficients basically followed a normal distribution, with a mean of 0.001 close to 0 and most p-values greater than 0.1. This indicates that the policy effect of the false experimental group is almost negligible and not significant, which is consistent with the expected results of the placebo test.
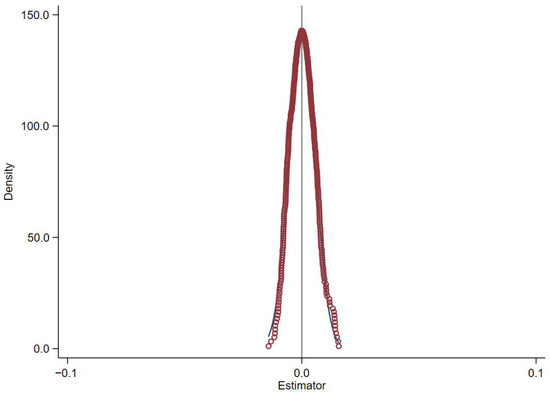
Figure 8.
Placebo test.
5.4.3. Switch in Matching Approach
Initially, this study employed 1-to-3 nearest neighbor matching for PSM, which was later replaced with intra-caliper nearest neighbor matching to evaluate the sample’s robustness. Column (1) of Table 5 exhibits that the CETP coefficient is still obviously positive, confirming that the previous conclusion is correct.
Table 5.
Robustness test 1.
5.4.4. Sample Indentation Processing
Tailoring is a widely used robustness checking method aimed at addressing the interference of outliers on the analysis results. To remove the effect of extreme values, all samples in this paper are subjected to a 1 percent and 99 percent tailing process up and down, and then the regressions are rerun. And the results do not alter the original conclusion.
5.4.5. Sample Exclusion
Given the large-scale outbreak of COVID-19 in 2020 and the increased downward pressure on the economy across the entire society, to avoid the impact of this special event on the ESR, this paper excludes the sample period of 2020 and 2021 and re-regresses. The regression results are shown in column (3) of Table 5. The estimated coefficient is still significantly positive, which can confirm that the benchmark regression results in the previous text are not disturbed by the specific sample period.
5.4.6. Increase Control Variables
To reduce the bias caused by missing important explanatory variables and further consider the impact of economic development level and population density on the energy system, the logarithm of per capita GDP and the proportion of urban permanent population to the total regional area were selected as measurement indicators and added to the benchmark regression model for control. The results show that the coefficient of the CETP is still significantly positive in Table 6, indicating that the possibility of missing important explanatory variables in the benchmark regression results is small, and the benchmark regression results have a certain degree of robustness.
Table 6.
Robustness test 2.
5.4.7. Policy Exclusion
Given that CETP projects are often influenced by other location-oriented policies and the policy implementation year of low-carbon city construction is earlier than that of the CETP, as well as that the pilot policy includes some cities with the CETP, this article further introduces virtual variables for low-carbon city pilot (LCCP) projects to accurately identify the effects of the CETP and exclude the influence of other policies. The results show that the CETP still has a significant promoting effect on the ESR in Table 6, while the preparation work of low-carbon cities has not had a significant impact on the resilience of the energy system.
5.4.8. Replace the Explained Variable
To avoid biases arising from the measurement of ESR levels, which could affect the estimation results, this study employs principal component analysis (PCA) to recalculate the ESR indicator and re-examine the impact of the CETP on ESR. The results in column (6) of Table 6 demonstrate that the CETP significantly promotes ESR improvement. Specifically, a one-unit increase in the CETP is associated with a statistically significant 0.0277-unit rise in ESR, consistent with the findings presented earlier.
5.4.9. Endogeneity Test
The CETP may enhance ESR by incentivizing firms to reduce emissions and promoting technological innovation. Conversely, firms or regions with higher ESR may respond more actively to the policy, creating a bidirectional influence. To address endogeneity issues arising from confounding variables (e.g., renewable energy subsidies, industrial upgrading programs) and reverse causality, and to better capture the dynamic effects of the CETP and ESR development, this study employs a lagged dependent variable (LDV) approach in its empirical estimation. Column (7) of Table 6 shows that the coefficient of the CETP is 0.0377, statistically significant at the 1% level. This indicates that after incorporating the lagged dependent variable, the CETP continues to promote ESR improvement, with no significant changes to the baseline regression results, thereby confirming the robustness of the findings.
5.4.10. Double Machine Learning
The impact of the CETP on ESR is highly complex and nonlinear, and the DML model, with its advantage in handling nonlinear data, avoids the problem of improper model settings. DML effectively alleviates the “regularization bias” in machine learning estimation by introducing instrumental variable functions, two-stage prediction residual regression, and sample segmentation fitting techniques, ensuring unbiased and highly stable estimation results under small sample conditions.
Drawing lessons from Yang et al. [46], we employed a random forest model with five-fold cross-validation for the analysis. In columns (1) and (2) of Table 7, linear and quadratic terms of control variables were sequentially introduced, and the coefficient of the CETP remained significantly positive at the 1% level in both cases. Building on this, column (3) adopted an alternative algorithm by further applying a Lasso regression model with a 1:4 sample splitting ratio. The results revealed an increase in the magnitude of the CETP coefficient, which continued to be statistically significant. Apparently, the utilization of the DML model does not alter the conclusion that the CETP promotes the growth of urban ESR but only slightly adjusts the magnitude of the policy effect, providing additional evidence for the exactness of the initial conclusion.
Table 7.
DML test.
5.5. Heterogeneity Test
5.5.1. Heterogeneity in the Degree of Environmental Protection
The role of the CETP on ESR may be affected by the environmental regimes of different regions. This paper divides the sample cities into key environmental protection cities and non-key protection cities based on the “Eleventh Five Year Plan for National Environmental Protection” issued by the State Council of China [8]. The results are displayed in columns (1) and (2) of Table 8.
Table 8.
Heterogeneity test.
The estimated coefficient of the CETP is statistically significant in environmentally protected cities, which suggests that CETPs are conducive to enhancing the ESR. This may be due to the fact that the policy is more strictly regulated and enforced in key environmental protection cities, which are equipped with a high-density carbon emission monitoring network that can track emission sources in real time with satellite remote sensing and big data to ensure that the policy is accurately implemented. At the same time, it can attract more carbon financial investment. When the carbon futures trading volume exceeds the spot, enterprises can lock in the cost through “hedging” to push forward long-term energy mix optimization, thereby enhancing the ESR.
In environmentally non-priority cities, the CETP coefficient is not obvious. The reason may be that the regulation and implementation of the policy in environmentally non-priority protected cities are more relaxed, the carbon market is cold, and an effective risk-hedging mechanism cannot be formed, so enterprises are more inclined to pay the carbon tax than to participate in the trading, which results in the “policy idling”.
5.5.2. Heterogeneity of Cities in Old Industrial Bases
From an industrial perspective, the implementation effect of the CETP may be affected by the industrial structure and development level of cities. Based on the National Old Industrial Base Adjustment and Transformation Plan (2013–2022), this paper categorizes the research sample into two groups: old industrial base cities and non-old industrial base cities [47]. Table 8, columns (3) and (4), presents the statistical findings.
In the old industrial base cities, the impact of the CETP on ESR is not significant, indicating that the CETP has not effectively promoted the improvement of ESR. One possible explanation is that the industrial structure relies heavily on high-carbon industries such as iron and steel, the chemical industry, etc., with high carbon emission intensity, and they also face pressures such as employment, social stability, etc., and the energy transition is more arduous, and it is difficult to implement the policy, so the policy effect is not obvious in this region.
In non-old industrial base cities, the impact of the CETP on ESR is obviously positive, suggesting that the CETP can effectively improve ESR. Perhaps the cause is that the industrial structure is mainly lightweight and diversified, and the lightweight and diversified industrial structure makes these cities more flexible in the process of energy transition and able to adapt to the requirements of low-carbon development more quickly. Meantime, they have attracted investment in green technology through policies that promote technological innovation, which improves energy utilization efficiency and enhances the ESR so that it can better cope with external shocks.
5.5.3. Carbon Trading Prices
The price mechanism is like an “economic lever” in the market, the level of which directly determines the effect of the CETP on the ESR. This paper classifies samples into high-carbon price zones and low-carbon price zones by using the average transaction prices in the carbon trading markets released by the 2022 China Carbon Market Annual Report. Specifically, samples with prices higher than the average transaction price are categorized as high-carbon price zones (Beijing, Shanghai, Shenzhen, and Guangdong), while those with prices lower than the average (Tianjin, Chongqing, and Hubei) as well as the remaining cities are classified as low-carbon price zones. The results show that the effect of the CETP on ESR is remarkably greater in high-carbon price zones than in low-carbon price zones.
The reasons for this may lie in the fact that high carbon prices increase the cost of fossil energy use dramatically, forcing firms to switch to renewable energy or energy efficiency upgrades, while high carbon prices stimulate green technology innovations through the “Porter effect”, which not only reduce compliance costs but also improve the ability to address supply disruptions. At low carbon prices, the impact of carbon emission costs on corporate operations is relatively minor, and the impetus for industrial restructuring is also comparatively weak. High energy-intensive industries may persist in their energy-intensive production methods, resulting in a slow improvement in the overall resilience of the energy system. Meanwhile, low carbon prices weaken the “innovation compensation” of environmental regulations. Enterprises are more inclined to pay carbon taxes than develop new technologies. Therefore, in regions with low carbon prices, the impact of the CETP is less pronounced compared to those with high carbon prices.
5.6. Mediated Effects Test
After the previous analysis, since AI may mediate the impact of the CETP on ESR, this paper follows the framework proposed by Fairchild & MacKinnon [48] to construct the following mediating effect model:
where represents the AI and there is a mediating effect if the estimated coefficient is significant in (4) and also the coefficient is significant in (5).
As shown in Table 9, the CETP coefficient in column (1) is 1.9794, which passes the significance level test of 1%, indicating that the CETP can effectively promote the growth of AI; the AI coefficient in column (2) is 0.0009 and passes the significance level test of 5%, indicating that the CETP can indirectly promote the ESR through AI. On the one hand, carbon trading generates massive emission data, which provides “fuel” for AI training, and enterprises use real-time sensor data for monitoring industrial carbon emissions to help AI optimize the prediction model and improve the accuracy of emission reduction strategies. On the other hand, AI constructs risk assessment models to simulate the impact of extreme weather or supply chain disruptions on the energy system, and through scenario analysis, it develops emergency scheduling plans to help promptly withstand risks. Research hypothesis H2 is established.
Table 9.
Mediation effects test results.
Meanwhile, the development of AI is multifaceted, spanning multiple domains. To enhance the robustness of the empirical results, this paper employs Python3.12.0 web crawling technology. Using the business scopes published by various enterprises in the Tianyancha (a Chinese corporate information database) as the basis for textual analysis, we identify enterprises whose business scopes involve keywords such as ‘high-end intelligence,’ ‘big data,’ and ‘intelligent manufacturing’ as AI enterprises. The logarithmic value of the number of these AI enterprises is then used to measure the development level of AI. The results are presented in columns (3) and (4) of Table 9. Apart from a few numerical differences, the directions and significance levels of the CETP coefficient and AI2 coefficient remain substantially unchanged, which once again verifies the validity of the research hypotheses proposed earlier.
5.7. Moderating Effects Test
In order to explore the moderating role of efficient market and responsive government on the relationship between the CETP and ESR, this paper constructs the following moderating effect model for testing:
where denotes the moderating variables, representing the efficient market () and the responsive government (), respectively. is described by the Fan Gang marketization index, and is measured by the share of environmental protection expenditures, in general, government budget expenditures.
Column (1) of Table 10 indicates that after the inclusion of the interaction term, the coefficient of the CETP still exerts a prominent positive effect, suggesting that the CETP can still effectively promote the enhancement of urban ESR on the whole. Meanwhile, the coefficient of is 0.0207 and statistically obvious, demonstrating that efficient markets can positively moderate the impact of the CETP on urban ESR. This may be because an effective market guides resources to low-carbon areas through price signals, stimulates technological innovation, and forms a synergy with the CETP. This combination not only reduces the cost of emission reduction but also enhances the adaptability of the energy system to extreme weather, supply chain disruptions, and other shocks, providing long-term protection for urban ESR.
Table 10.
Moderated effects test results.
Column (2) indicates that the CETP and the coefficients are remarkably positive, which suggests that active government positively moderates the link between the CETP and ESR. The reason may be that the responsive government enhances the positive influence of the CETP on ESR through a combination of policy design, regulatory guidance, infrastructure investment, tax incentives, and emergency management. This combination not only reduces the abatement cost but also promotes the dexterity and reliability of the power system, making it better able to cope with external disturbances.
6. Spatial Effects Analysis
Stemmed from the previous analysis, because of the spatial flow of resources, the spillover and diffusion of technology, and the collaborative linkage of industries, the enforcement of the CETP will have a significant impact on the ESR in neighboring regions. To verify the above hypothesis, the following spatial effect analysis is conducted.
6.1. Spatial Autocorrelation Test
Before applying the spatial econometric model, we first need to test for spatial autocorrelation in the explanatory variable (energy resilience), which is calculated by the following formula:
where , , and I are Moran’s I index, n is 255 cities, is the spatial weight matrix, is the ESR, and represents the average value of regional ESR. The outcomes are provided in Table 11.
Table 11.
Moran’s index test results.
It is calculated that the global Moran’s I index of ESR is remarkably positive between 2011 and 2022. In addition, in the Moran’s scatter plot of ESR in 2011 and 2022 presented in Figure 9, most of the strongholds are concentrated in the first and third quadrants, which indicates that the ESR of Chinese cities shows “high-high” and “low-low” clustering. This indicates that Chinese cities exhibit spatial characteristics of “high-high” and “low-low” agglomeration in terms of ESR. Specifically, the first quadrant represents the strong similarity between cities with high ESR, while the third quadrant shows the spatial clustering effect of cities with low ESR, so that the SDM model can be used for parameter estimation.
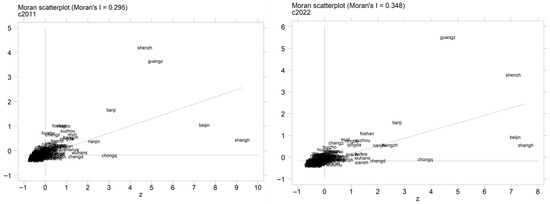
Figure 9.
Localized Moran’s index test for 2011–2022.
6.2. Regression Test for Spatial Double Differencing
Since factors of production can break through geographical restrictions to flow across regions, while communication and cooperation between cities is becoming more frequent, and interregional economic activities are greatly enhanced, the implementation of the CETP may affect ESR in neighboring cities. In order to verify whether there is a spatial correlation between the CETP and ESR, this paper follows the experience of Chagas et al. [49] and constructs a spatial double-difference model for empirical analysis. The specific model settings are as follows:
In the above equation, W represents the economic distance matrix and geographic distance matrix, respectively.
In Table 12, the direct effect results demonstrate that the CETP coefficients are remarkably positive under two different spatial weight matrices, which confirms once again that the CETP contributes to ESR enhancement. The indirect effect results demonstrate that the CETP coefficient is obviously positive under the economic distance matrix, which indicates that the CETP can lead to ESR enhancement in neighboring places. The reason may be that the CETP construction has a radiation effect on the surrounding areas, and meanwhile, the neighboring areas have learning and imitating behaviors of the economic measures implemented by the central city, and the exchange and interaction between the two promote the increase of carbon emissions trading market construction, which in turn enhances the ESR. However, under the geographic distance matrix, the CETP coefficient is not obvious, which indicates that the local CETP has not effectively promoted the resilience of neighboring energy systems, probably because local enterprises transfer high-carbon emission industries to neighboring regions to cope with carbon emission costs, which leads to an increase in carbon discharge and the pressure on the energy system in neighboring regions. At the same time, higher local carbon prices may push up energy prices in neighboring regions, increasing the energy costs of neighboring firms and inhibiting investment in upgrading their energy systems.
Table 12.
Results of spatial double difference test.
Generally speaking, spatial correlation gradually decreases as the distance between cities increases. Drawing on insights from Pang et al. [50], a distance threshold d is set for the elements of the geographic weight matrix, with an initial value of 100 km and gradually increasing to 800 km in 100 km steps. Figure 10 illustrates the indirect effects of the CETP under different thresholds. It can be observed that as the inter-city distance increases, the spatial spillover coefficient first rises, reaching a peak at 500 km; then it slowly decreases and gradually approaches 0, indicating that spatial spillover has a clear boundary. The possible reason is that within a range of 500 km, there is high-frequency technological exchange and talent flow among enterprises, and the technology spillover effect is strongest within this range, leading to a rapid increase in the spillover coefficient in this interval. Beyond 500 km, the coupling degree of energy systems among enterprises decreases, and enterprises at a distance need to bear higher transaction costs, which in turn leads to a gradual decrease in the spillover coefficient.
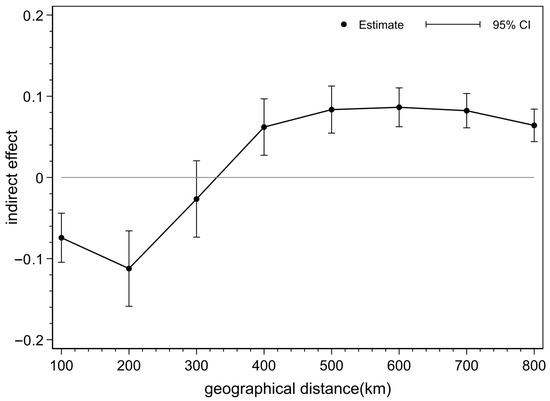
Figure 10.
Spatial heterogeneity of policy effects on the CETP.
7. Findings and Policy Implications
We draw three main conclusions: first, the CETP can significantly contribute to the ESR, which satisfies the parallel trend assumption and passes the robustness test. The effect of the CETP on ESR is significantly better in environmentally protected cities, non-old industrial base cities, and high-carbon price cities. Second, the CETP can indirectly promote ESR through AI. Efficient markets and active government have positive moderating effects in the execution of the CETP, and they enhance the ESR through price guidance and policy design, respectively. Third, the spatial effects show that under the economic distance weighting matrix, the local CETP drives ESR enhancement in neighboring non-pilot cities. However, under the geographic distance weighting matrix, the local CETP has failed to effectively promote ESR enhancement in neighboring places.
Accordingly, the paper makes the following policy recommendations:
Firstly, the top-level design of the CETP system should be strengthened to systematically build a resilient development framework for the energy transition to provide important support for comprehensively enhancing the ESR in the process of preparing for, perceiving, responding to, recovering from, and adapting to risks. Strengthen the risk awareness of climate change, consolidate research on the new risk pattern of the energy system, assess the hazard scale of various risk factors, including frequency, degree, and duration, and formulate a long-term strategy for risk response.
Secondly, increase financial support to the field of artificial intelligence, rationally use artificial intelligence algorithms to optimize scheduling strategies, and improve the system’s ability to respond to emergencies. Balance the economic interests of various segments, departments, and regions, and bring into play the coordinating role of policy tools and market mechanisms on the costs and benefits of energy transition. Moreover, incorporate the resilience of the energy system into the government’s performance appraisal system, and promote the implementation of the responsibility of energy security by local governments. Furthermore, escalate the scope of the national carbon market, include more high-energy-consuming industries, and improve the marketization of carbon prices.
Finally, differentiated and adaptive energy resilience enhancement strategies should be formulated for different regions, urban spatial linkage networks should be constructed, and regional synergy and cooperation mechanisms should be accelerated. For cities with key environmental protection, non-old industrial base cities and high-carbon price cities, intelligent energy management systems and diversified energy supply systems should be constructed to promote accurate matching of energy supply and demand and efficient utilization. For cities without key environmental protection, old industrial base cities and low-carbon price cities, energy policy guidance and supervision should be strengthened, public environmental awareness and participation should be enhanced, energy structure adjustment should be accelerated, and dependence on fossil energy should be reduced.
8. Research Prospects
China boasts a vast territory, and the economic and social development situations vary significantly across different regions. Some regions resemble developed countries in terms of resource endowment and economic development patterns, some bear similarities to South American countries, and others share features with Southeast Asian nations. The policy formulation and implementation in these regions can offer certain reference value for relevant countries. However, due to data limitations, we have not conducted in-depth discussions on this aspect. Future research could further expand along the following dimensions: first, while developing countries currently face dual challenges of energy transition pressure and climate governance, significant disparities exist among them in terms of industrial structure, institutional environment, and energy endowments. Subsequent research could employ multi-country comparative analysis to identify key contextual factors influencing policy effectiveness, thereby providing theoretical support for customized policy design in developing countries. Second, Chinese practice demonstrates that the synergy between the CETP and energy policy instruments can generate multiplicative effects. Future research needs to transcend the single-policy analysis paradigm by examining the coupling mechanisms between the CETP and industrial policies, fiscal policies, and social policies.
Author Contributions
Conceptualization, W.C.; Methodology, W.C. and Q.D.; Investigation, Q.D. and W.Z.; Writing-original draft preparation, W.C. and Q.D.; Writing-review and editing, W.C. and Q.D.; Supervision, W.C. and W.Z.; Funding acquisition, W.C. All authors have read and agreed to the published version of the manuscript.
Funding
The authors gratefully acknowledge the support provided by the national social science foundation of China (Grant No. 22XJY040).
Data Availability Statement
Data will be made available on request.
Conflicts of Interest
The authors declare no conflict of interest.
References
- Ahmadi, S.; Khorasani, A.H.F.; Vakili, A.; Saboohi, Y.; Tsatsaronis, G. Developing an innovating optimization framework for enhancing the long-term energy system resilience against climate change disruptive events. Energy Strategy Rev. 2022, 40, 100820. [Google Scholar] [CrossRef]
- Rahman, T.; Lipu, M.H.; Shovon, M.A.; Alsaduni, I.; Karim, T.F.; Ansari, S. Unveiling the impacts of climate change on the resilience of renewable energy and power systems: Factors, technological advancements, policies, challenges, and solutions. J. Clean. Prod. 2025, 493, 144933. [Google Scholar] [CrossRef]
- Zhang, X.; Xu, X.; Pan, S.; Mo, Y.; Dong, C. Exploring the impact of low-carbon city pilot policy on urban ecological welfare performance: A quasi-natural experiment in 282 Chinese cities. Urban Clim. 2024, 58, 102216. [Google Scholar] [CrossRef]
- Hu, F.; Chang, H.; Wang, D.; Chen, X. Fostering green technological innovation through carbon emission trading policies. Financ. Res. Lett. 2025, 74, 106797. [Google Scholar] [CrossRef]
- Du, M.; Wu, F.; Ye, D.; Zhao, Y.; Liao, L. Exploring the effects of energy quota trading policy on carbon emission efficiency: Quasi-experimental evidence from China. Energy Econ. 2023, 124, 106791. [Google Scholar] [CrossRef]
- Fu, X. Impacts of the pilot policy for carbon emissions trading on pollution reduction in China. J. Clean. Prod. 2024, 468, 142878. [Google Scholar] [CrossRef]
- Li, C.; Guo, G.; Gu, H.; Dong, X. How green bonds exert a demonstration effect on firms within the same region. Econ. Anal. Policy 2025, 86, 117–136. [Google Scholar] [CrossRef]
- Cheng, H.; Min, C. The mitigation effect of industrial robots on air pollution. Int. Rev. Econ. Financ. 2025, 99, 104069. [Google Scholar] [CrossRef]
- Jing, Z.; Liu, Z.; Wang, T.; Zhang, X. The impact of environmental regulation on green TFP: A quasi-natural experiment based on China’s carbon emissions trading pilot policy. Energy 2024, 306, 132357. [Google Scholar] [CrossRef]
- Sun, C.; Tie, Y.; Yu, L. How to achieve both environmental protection and firm performance improvement: Based on China’s carbon emissions trading (CET) policy. Energy Econ. 2024, 130, 107282. [Google Scholar] [CrossRef]
- Yang, J.; Zhou, K.; Hu, R. City-level resilience assessment of integrated energy systems in China. Energy Policy 2024, 193, 114294. [Google Scholar] [CrossRef]
- Monie, S.W.; Gustafsson, M.; Önnered, S.; Guruvita, K. Renewable and integrated energy system resilience—A review and generic resilience index. Renew. Sustain. Energy Rev. 2025, 215, 115554. [Google Scholar] [CrossRef]
- Shafiei, K.; Zadeh, S.G.; Hagh, M.T. Robustness and resilience of energy systems to extreme events: A review of assessment methods and strategies. Energy Strategy Rev. 2025, 58, 101660. [Google Scholar] [CrossRef]
- Kong, J.; Zhang, C.; Simonovic, S.P. Optimizing the resilience of interdependent infrastructures to regional natural hazards with combined improvement measures. Reliab. Eng. Syst. Saf. 2021, 210, 107538. [Google Scholar] [CrossRef]
- Senkel, A.; Bode, C.; Schmitz, G. Quantification of the resilience of integrated energy systems using dynamic simulation. Reliab. Eng. Syst. Saf. 2021, 209, 107447. [Google Scholar] [CrossRef]
- Mishra, D.K.; Ghadi, M.J.; Li, L.; Zhang, J.; Hossain, M.J. Active distribution system resilience quantification and enhancement through multi-microgrid and mobile energy storage. Appl. Energy 2022, 311, 118665. [Google Scholar] [CrossRef]
- Fan, W.; Lv, W.; Wang, Z. How to measure and enhance the resilience of energy systems? Sustain. Prod. Consum. 2023, 39, 191–202. [Google Scholar] [CrossRef]
- Zhang, Y.; Hu, W.; Tao, Y.; Zhang, B. How does smart artificial intelligence influence energy system resilience? Evidence from energy vulnerability assessments in G20 countries. Energy 2025, 314, 134290. [Google Scholar] [CrossRef]
- Nepal, R.; Zhao, X.; Dong, K.; Wang, J.; Sharif, A. Can artificial intelligence technology innovation boost energy resilience? The role of green finance. Energy Econ. 2025, 142, 108159. [Google Scholar] [CrossRef]
- Jiang, M.; Yu, X. Enhancing the resilience of urban energy systems: The role of artificial intelligence. Energy Econ. 2025, 144, 108313. [Google Scholar] [CrossRef]
- Patrizio, P.; Leduc, S.; Chinese, D.; Kraxner, F. Internalizing the external costs of biogas supply chains in the Italian energy sector. Energy 2017, 125, 85–96. [Google Scholar] [CrossRef]
- Feng, T.; Wang, X.; Shi, Y.; Tu, Q. The role of carbon price signal in green innovation: Evidence from China. J. Environ. Manag. 2024, 370, 122787. [Google Scholar] [CrossRef]
- Wu, W.; Zhang, N.; Li, A.; Chen, Y. The path to global climate justice: From the perspective of regional discrepancy in embodied carbon emissions. Environ. Impact Assess. Rev. 2024, 105, 107410. [Google Scholar] [CrossRef]
- Zhang, W.; Li, B. Energy-use rights trading, technological innovation, and green transformation of energy-intensive manufacturing enterprises. Econ. Anal. Policy 2025, 86, 528–544. [Google Scholar] [CrossRef]
- Carayannis, E.G.; Dumitrescu, R.; Falkowski, T.; Papamichail, G.; Zota, N.R. Enhancing SME resilience through artificial intelligence and strategic foresight: A framework for sustainable competitiveness. Technol. Soc. 2025, 81, 102835. [Google Scholar] [CrossRef]
- Niet, I.; Van den Berghe, L.; van Est, R. Societal impacts of AI integration in the EU electricity market: The Dutch case. Technol. Forecast. Soc. Change 2023, 192, 122554. [Google Scholar] [CrossRef]
- Huang, M.; Li, Q.; Li, B. From algorithms to green growth: Can artificial intelligence drive enterprise energy transformation? Econ. Anal. Policy 2025, 85, 1846–1866. [Google Scholar] [CrossRef]
- Zhu, Q.; Sun, C.; Xu, C.; Geng, Q. The impact of artificial intelligence on global energy vulnerability. Econ. Anal. Policy 2025, 85, 15–27. [Google Scholar] [CrossRef]
- Gunasegaram, D.R.; Barnard, A.S.; Matthews, M.J.; Jared, B.H.; Andreaco, A.M.; Bartsch, K.; Murphy, A.B. Machine learning-assisted in-situ adaptive strategies for the control of defects and anomalies in metal additive manufacturing. Addit. Manuf. 2024, 81, 104013. [Google Scholar] [CrossRef]
- Yue, L.; Han, L. The digital empowerment promotes synergistic efficiency in regional pollution reduction and carbon emission Reduction—Analysis of the moderating effects of market structure and government behavior. J. Clean. Prod. 2025, 493, 144867. [Google Scholar] [CrossRef]
- Stern, N. Towards a carbon neutral economy: How government should respond to market failures and market absence. J. Gov. Econ. 2022, 6, 100036. [Google Scholar] [CrossRef]
- Tian, P.; Pan, Z.; Zeng, X.; Zhu, Y. Who takes the lead: Synergistic emission reduction effects of proactive government and efficient market in atmospheric pollution mitigation. J. Environ. Manag. 2024, 371, 123001. [Google Scholar] [CrossRef]
- Sun, C.; Khan, A.; Ren, Y. Empowering Progress: Education, innovations and financial development in the battle against energy poverty. J. Clean. Prod. 2023, 425, 138941. [Google Scholar] [CrossRef]
- Wen, H.; Zhang, Y.; Zhou, F.; Tian, X. Towards ecological sustainability: The progress and spatio-temporal evolution of green development in China. J. Clean. Prod. 2025, 492, 144912. [Google Scholar] [CrossRef]
- Cui, H.; Cao, Y. Energy rights trading policy, spatial spillovers, and energy utilization performance: Evidence from Chinese cities. Energy Policy 2024, 192, 114234. [Google Scholar] [CrossRef]
- Lai, J.; Chen, Y. Innovation spillover effect of the pilot carbon emission trading policy in China. Heliyon 2023, 9, e20062. [Google Scholar] [CrossRef] [PubMed]
- Lee, C.-C.; Wang, C.-S. Financial development technological innovation energy security: Evidence from Chinese provincial experience. Energy Econ. 2022, 112, 106161. [Google Scholar] [CrossRef]
- Song, Y.; Zhang, M.; Sun, R. Using a new aggregated indicator to evaluate China’s energy security. Energy Policy 2019, 132, 167–174. [Google Scholar] [CrossRef]
- Sharifi, A.; Yamagata, Y. Principles and criteria for assessing urban energy resilience: A literature review. Renew. Sustain. Energy Rev. 2016, 60, 1654–1677. [Google Scholar] [CrossRef]
- Mou, Y.; Luo, Y.; Su, Z.; Wang, J.; Liu, T. Evaluating the dynamic sustainability and resilience of a hybrid urban system: Case of Chengdu, China. J. Clean. Prod. 2021, 291, 125719. [Google Scholar] [CrossRef]
- Acemoglu, D.; Restrepo, P. Robots and Jobs: Evidence from US Labor Markets. J. Political Econ. 2019, 128, 2188–2244. [Google Scholar] [CrossRef]
- Chen, Y.; Cheng, L.; Lee, C.-C. How does the use of industrial robots affect the ecological footprint? International evidence. Ecol. Econ. 2022, 198, 107483. [Google Scholar] [CrossRef]
- Ahmadi, S.; Saboohi, Y.; Vakili, A. Frameworks, quantitative indicators, characters, and modeling approaches to analysis of energy system resilience: A review. Renew. Sustain. Energy Rev. 2021, 144, 110988. [Google Scholar] [CrossRef]
- Johnston, J. Econometric Methods, third edition. J. Appl. Econom. 1988, 3, 249–254. [Google Scholar] [CrossRef]
- Cheng, Z.; Li, X.; Zhang, Q. Can new-type urbanization promote the green intensive use of land? J. Environ. Manag. 2023, 342, 118150. [Google Scholar] [CrossRef] [PubMed]
- Yang, B.; Huang, J.; Chen, Y. The relationship between ESG ratings and digital technological innovation in manufacturing: Insights via dual machine learning models. Financ. Res. Lett. 2025, 71, 106362. [Google Scholar] [CrossRef]
- Zhang, G.; Wang, J.; Liu, Y. “Carbon” suppresses “energy”—How does carbon emission right trading policy alleviate the energy trilemma? Energy 2024, 307, 132790. [Google Scholar] [CrossRef]
- Fairchild, A.J.; MacKinnon, D.P. A General Model for Testing Mediation and Moderation Effects. Prev. Sci. 2009, 10, 87–99. [Google Scholar] [CrossRef]
- Chagas, A.L.S.; Azzoni, C.R.; Almeida, A.N. A spatial difference-in-differences analysis of the impact of sugarcane production on respiratory diseases. Reg. Sci. Urban Econ. 2016, 59, 24–36. [Google Scholar] [CrossRef]
- Pang, S.L.; Liu, H.; Hua, G.H. How does digital finance drive the green economic growth? New discoveries of spatial threshold effect and attenuation possibility boundary. Int. Rev. Econ. Financ. 2024, 89, 561–581. [Google Scholar] [CrossRef]


Disclaimer/Publisher’s Note: The statements, opinions and data contained in all publications are solely those of the individual author(s) and contributor(s) and not of MDPI and/or the editor(s). MDPI and/or the editor(s) disclaim responsibility for any injury to people or property resulting from any ideas, methods, instructions or products referred to in the content. |
© 2025 by the authors. Licensee MDPI, Basel, Switzerland. This article is an open access article distributed under the terms and conditions of the Creative Commons Attribution (CC BY) license (https://creativecommons.org/licenses/by/4.0/).