Abstract
The study of vegetation net primary productivity (NPP) is essential in the Yanshan–Taihang Mountain Ecological Conservation Zone (YTECZ). Serving as an ecological security barrier for the Beijing–Tianjin–Hebei region, understanding the spatiotemporal dynamics and drivers of NPP in the YTECZ is fundamental for supporting effective sustainable development policies. Utilizing MODIS NPP, climatic data (temperature and precipitation), and the Human Footprint Index (HFP, a comprehensive metric of anthropogenic pressure), this study employed univariate linear regression, ArcGIS spatial analysis, and the Geographical Detector to investigate the spatiotemporal patterns and drivers of vegetation NPP in the YTECZ from 2004 to 2023 and to project its future trends through time series analysis. Our findings reveal a significant fluctuating upward trend in vegetation NPP over the 21-year period (mean annual increase: 4.58 g C·m−2), displaying a distinct spatial gradient characterized by higher values in western and northern sectors relative to eastern and southern areas. The interannual variability of vegetation NPP was primarily dominated by precipitation fluctuation, while its spatial heterogeneity was jointly driven by vapor pressure deficit (VPD) and temperature. Notably, human activities exhibited significant explanatory power on NPP’s spatial pattern, and their interaction with climatic factors (e.g., VPD) resulted in non-linear enhancements. Future projections suggest that the current increasing trend is unlikely to be sustained in the long term, indicating substantial uncertainty in vegetation carbon sequestration patterns. This study provides critical insights into vegetation response mechanisms to global change drivers, offering a scientific foundation for ecological management strategies toward sustainable development in the YTECZ.
1. Introduction
Vegetation forms the structural and functional backbone of terrestrial ecosystems, governing the exchange of water, carbon, and energy at the land–atmosphere interface. This regulatory capacity is fundamental to sustaining ecosystem services and supporting diverse human endeavors [1,2,3]. Net primary productivity (NPP) quantifies the rate of organic matter accumulation per unit area and time, calculated as the difference between photosynthetically fixed carbon and autotrophic respiration losses [4,5]. Serving as a critical metric for carbon source/sink identification, vegetation NPP provides essential insights into plant growth dynamics, ecosystem carbon sequestration potential, and ecological quality assessment [6,7,8]. Climate change and anthropogenic activities constitute pivotal drivers governing NPP dynamics [9]. Meteorological variables (e.g., temperature, precipitation) modulate NPP magnitude by regulating physiological plant processes, whereas ecological restoration initiatives—including afforestation [10], cropland-to-forest/grassland conversion, and grazing exclusion—reshape NPP spatial patterns through vegetation community restructuring [11]. Concurrently, agricultural intensification practices such as irrigation, fertilization, and adoption of high-yield cultivars amplify localized NPP via enhanced photosynthetic efficiency in agroecosystems [12]. The combined pressures of climate change and anthropogenic activities are restructuring the net primary productivity (NPP) of global terrestrial ecosystems. Consequently, understanding the spatiotemporal patterns of NPP and conducting a rigorous attribution analysis are therefore critical steps for accurately diagnosing ecosystem health and informing policies that ensure regional ecological sustainability.
Remote sensing technology is pivotal in vegetation NPP studies, enabling the monitoring and analysis of spatiotemporal dynamics and environmental responses through long-term satellite data archives [13,14]. The MOD17A3 product, with its extensively validated reliability, has become a critical tool for quantifying carbon cycle dynamics across regional to global scales [15]. An increasing number of scholars use MODIS datasets to analyze spatiotemporal patterns and drivers of NPP at national/regional scales [16,17,18]. Studies examined correlations between NPP and factors like precipitation [19], temperature [20], land cover [21], and human activities [22]. Validation shows MOD17A3 has good accuracy and reliability for analyzing NPP spatiotemporal patterns. Studies found that dominant NPP drivers vary regionally. Nemani et al. [23] estimated global vegetation NPP from 1982 to 1999 and suggested that changes in climatic conditions contributed to increased NPP across most regions worldwide. Nemani et al. and Zhang et al. [24] found significant NPP increases in the Dongting Lake wetlands (2000–2019), with temperature, precipitation, and solar radiation positively contributing (solar radiation being strongest), while human activities dominated degradation and climate dominated restoration. However, Xue et al. [25] showed that fluctuating NPP increases (2.91%/yr) in the Qimeng region (2003–2020), with precipitation, population density, and gross domestic product (GDP) as main drivers, where human activities slightly outweighed climate. This heterogeneity underscores that the relative importance of climatic vs. anthropogenic drivers on NPP dynamics exhibits substantial spatial–temporal variations, contingent upon region-specific environmental contexts and socio-economic conditions. For instance, in the flat, agriculturally dominated North China Plain, research indicates that human activities and atmospheric aridity are dominant factors [26]. However, it remains unclear whether the same driving mechanisms apply to the adjacent Yanshan–Taihang Mountain region, which predominantly serves ecological conservation functions. Consequently, rigorous investigation of region-specific spatiotemporal patterns and underlying drivers of vegetation NPP remains imperative.
Functioning as a critical component (“Four Zones”) within Hebei Province’s ecological security framework (“One Core, Four Zones, Multiple Corridors, Multiple Centers”), the YTECZ delivers vital ecosystem services including water conservation, soil retention, and recreational provision, thereby maintaining regional ecological security as a primary barrier for the Beijing–Tianjin–Hebei megacity cluster. Mandated by the Beijing–Tianjin–Hebei Coordinated Development Plan [27], systematic conservation of biodiversity and ecosystem integrity in the YTECZ requires transcending administrative boundaries to advance green circular economy initiatives while enhancing integrated ecological governance. While prior research has documented an overall increasing trend in vegetation NPP in this region [28], critical knowledge gaps persist regarding the scale-dependency of drivers, their synergistic interactions, and the long-term sustainability of these trends. Specifically, the mechanisms through which climatic and anthropogenic factors interact across spatial and temporal scales to shape NPP dynamics remain poorly quantified. This study therefore aims to (1) disentangle the spatiotemporal dynamics of NPP and its primary drivers across scales, (2) quantify the interactive effects of key environmental factors, and (3) project future NPP trajectories to assess the sustainability of current trends. Addressing these questions will provide a mechanistic understanding essential for guiding evidence-based ecological management and policy in this critical zone.
2. Materials and Methods
2.1. Study Area
The Yanshan–Taihang Mountain Ecological Conservation Zone (YTECZ; 36°18′–42°37′ N, 113°27′–119°36′ E) encompasses the Yanshan and Taihang mountain ranges, forming a topographic periphery around the Beijing–Tianjin–Hebei metropolitan region, covering 103,400 km2 (Figure 1a). The region experiences a warm–temperate continental monsoon climate, under semi-humid to semi-arid conditions. A pronounced seasonality is evident, featuring hot, rainy summers and cold, dry winters with prevailing northwesterly winds. Mean annual precipitation ranges from 300 to 580 mm, with an average temperature of 8.3 °C. Elevations average 800–900 m asl, culminating at 2882 m on Xiaowutai Mountain—Hebei’s highest peak. Dominant vegetation comprises cultivated lands (>50% coverage), coniferous forests, broadleaved forests, grasslands, and shrublands, reflecting intensive anthropogenic influence across the landscape (Figure 1b).
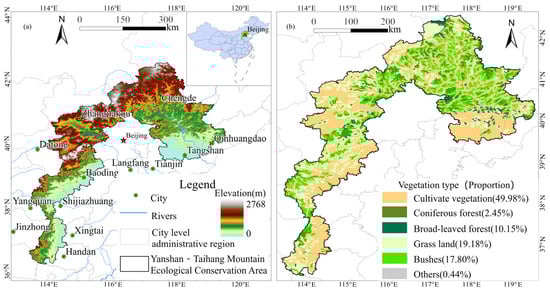
Figure 1.
Geographical setting and vegetation types of the Yanshan–Taihang Mountain Ecological Conservation Zone (YTECZ). (a) illustrates the geographical location of the YTECZ within Northern China, highlighting its position relative to the Beijing–Tianjin–Hebei metropolitan region. (b) depicts the spatial distribution of dominant vegetation types across the study area.
2.2. Data and Processing
Detailed data sources and key specifications are provided in Table 1. The annual net primary productivity (NPP) data for 2004–2023 was obtained from the MOD17A3HGF Version 6 product (NASA’s LP DAAC). Annual precipitation totals were computed by aggregating monthly precipitation values extracted from the TerraClimate dataset at 4000 m resolution. Mean annual temperature was calculated as the arithmetic mean of monthly average temperatures, which were themselves derived from the average of TerraClimate’s monthly Tmax and Tmin data. A digital elevation model (DEM) was sourced from the 90 m SRTM product. All raster datasets were reprojected to the WGS 1984 Albers Equal Area Conic coordinate system. They were then resampled to a unified 1 km resolution using bilinear interpolation in ArcGIS Pro 3.2.

Table 1.
Summary of data sources used for vegetation NPP analysis in the YTECZ.
2.3. Research Method
2.3.1. Quantification of NPP Trends
We employed a pixel-based univariate linear regression model to assess interannual vegetation NPP trends across the YTECZ from 2004 to 2023. This approach fits a least-squares regression line to the NPP time series at each pixel, with the slope of this line indicating the magnitude and direction of change per year.
where represents the NPP value in year , is the temporal index, and n = 20 years. Positive slope values indicate vegetation improvement, while negative values suggest degradation.
2.3.2. Analysis of the Correlation Between NPP and Climatic Factors
We assessed the relationships between NPP and two key climatic drivers: annual precipitation (Pre) and mean annual temperature (Temp). This assessment was based on Pearson correlation analysis. The analysis was conducted at the pixel level to capture spatial heterogeneity in vegetation–climate interactions.
Here, , , and, represent the NPP (g C·m−2·yr−1), precipitation (mm), and temperature (°C) in year , respectively, while , , and denote their multi-year averages. The significance of each correlation was assessed using a two-tailed t-test at α = 0.05:
with a critical t-value of 2.093 for n = 20.
2.3.3. Stability Analysis Using Coefficient of Variation
We used the coefficient of variation (Cv) to evaluate the stability of vegetation NPP from 2004 to 2023. The calculation formula is as follows:
Higher Cv values indicate greater variability. We applied the Jenks natural breaks classification to categorize stability into three levels: low (Cv ≤ 0.11), moderate (0.11 < Cv ≤ 0.16), and high variability (Cv > 0.16).
2.3.4. Identifying Driving Factors of NPP Using a Geographical Detector Model
We applied a Geographical Detector model to examine the individual and interactive influences of environmental and anthropogenic factors on NPP spatial heterogeneity. The model evaluates the explanatory power of each factor through the following q-statistic:
where represents the total number of strata for a given factor. The terms and denote the sample size and variance within the -th stratum, respectively, while N and represent the total sample size and variance. The q-statistic ranges from 0 to 1, with higher values indicating a greater power of the factor to explain the observed spatial heterogeneity.
To minimize interannual fluctuations and better represent the underlying spatial pattern, we used the 19-year average NPP (2004–2022) as the response variable in this analysis. This 19-year mean NPP was used as the dependent variable in the Geographical Detector analysis. This approach mitigates the influence of interannual climatic fluctuations and captures the persistent relationships between the spatial distribution of NPP and the underlying environmental drivers.
2.3.5. Analysis of Long-Term Trends Using the Hurst Exponent
The Hurst exponent (H), which quantifies the long-term persistence within a time series, was calculated using the rescaled range analysis (R/S) method. The NPP time series were interpreted as follows based on the H value:
- A range of 0 < H < 0.5 indicates anti-persistent behavior, suggesting that future trends are likely to reverse the direction of past trends. The intensity of this mean-reverting characteristic strengthens as H approaches 0.
- A value of H = 0.5 signifies a random walk process, where the series lacks long-term memory and future changes are unpredictable.
- A range of 0.5 < H < 1 indicates persistent behavior, meaning the observed historical trend is likely to continue into the future. The strength of this trend-reinforcing behavior increases as H approaches 1.
To ensure a detailed characterization of future NPP change trends, we further classified the Hurst exponent into four distinct categories based on established thresholds from relevant ecological studies [29,30]: strong anti-persistence (Hurst < 0.35), weak anti-persistence (0.35 ≤ Hurst < 0.5), weak persistence (0.5 ≤ Hurst < 0.65), and strong persistence (Hurst ≥ 0.65).
3. Results and Analysis
3.1. Spatiotemporal Distribution Patterns of NPP in the YTECZ
3.1.1. Temporal Variation in Vegetation NPP
Figure 2 illustrates a significant increasing trend (p < 0.01) in vegetation NPP across the YTECZ from 2004 to 2023, which was superimposed on considerable interannual fluctuations. Annual NPP fluctuated between 303.08 and 469.69 g C·m−2 (mean ± SD: 395.83 ± 42.15 g C·m−2). Below-average NPP occurred in 8 years (2004–2006, 2009–2011, 2014, 2019), accounting for 40% of the study period. The remaining 12 years (60%) exhibited above-average NPP values. The minimum NPP (303.08 g C·m−2) was recorded in 2007, contrasting with the maximum (469.69 g C·m−2) in 2022, representing a 55% increase over this 15-year interval.
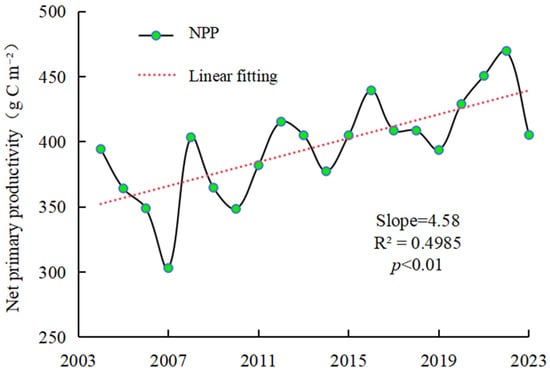
Figure 2.
Temporal trajectory of annual vegetation NPP with linear regression trendline (2004–2023) in the YTECZ.
3.1.2. Spatial Heterogeneity of Vegetation NPP
The spatial distribution of mean NPP (NPPm) reveals a distinct northwest–southeast gradient (Figure 3a; p < 0.05), characterized by a pronounced dipole pattern with significantly elevated values in the western and northern sectors contrasting with lower values in the east and south.
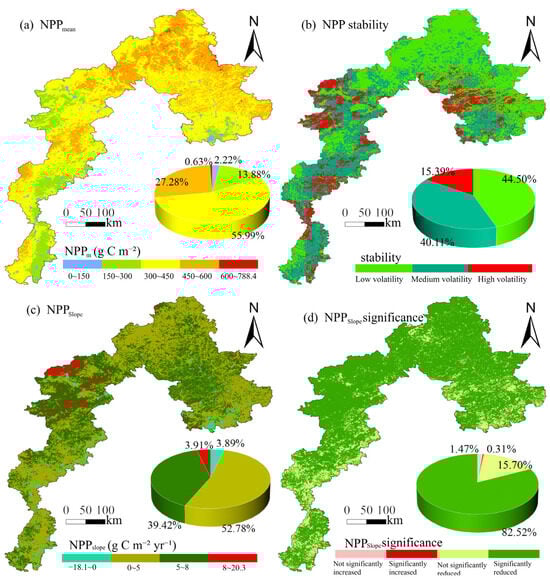
Figure 3.
Spatiotemporal patterns of vegetation NPP in the YTECZ from 2004 to 2023: (a) spatial distribution of mean annual NPP (NPPm); (b) interannual stability distribution of NPP, quantified by the coefficient of variation (Cv); (c) spatial pattern of the annual NPP change trend (slope); (d) statistical significance (p-value) of the observed NPP trends.
The spatial distribution of mean NPP (NPPm) exhibited a distinct northwest–southeast gradient (Figure 3a; p < 0.05), characterized by a pronounced dipole pattern with significantly elevated values in the western and northern sectors contrasting with lower values in the east and south. Based on Jenks natural breaks classification, five NPP zones were identified: (1) Very low (<150 g C·m−2; 2.22% coverage), concentrated in urbanized lowlands of Tangshan (Lubei/Lunan) and marginal agricultural areas of Huailai, Pingshan, and Jingxing Counties. (2) Low (150–300 g C·m−2; 13.88%), predominantly across eastern plains of the Shijiazhuang–Handan–Xingtai corridor and semi-arid valleys of Huai’an–Yu Counties in western Zhangjiakou. (3) Moderate (300–450 g C m−2; 55.99%), representing the dominant class with ubiquitous distribution across mid-elevation slopes. (4) High (450–600 g C·m−2; 27.28%), clustered in forested highlands of Fengning–Weichang–Longhua (Chengde), southern Zhangjiakou mountains (Yu–Zhuolu), and western Baoding highlands (Laiyuan–Fuping). (5) Very high (>600 g C·m−2; 0.63%), restricted to optimal forest habitats in the Longhua–Fengning–Weichang core zone of Chengde.
Interannual variability (coefficient of variation, Cv) averaged 0.12 (range: 0–1.36), suggesting generally stable NPP dynamics with moderate fluctuations. Based on standard deviation thresholds, low variability (Cv ≤ 0.11) dominated 44.51% of the area, medium (0.11 < Cv ≤ 0.16) covered 40.11%, and high variability (Cv > 0.16) 15.39%. Low-variability zones predominated in Chicheng (Zhangjiakou), continuous forests of Chengde, and western Baoding highlands. High-variability hotspots occurred in transitional ecotones of Xinglong, Wanquan, Yu, Quyang, and Xingtang Counties (Figure 3b).
Trend analysis revealed NPP change rates from −18.1 to 20.3 g C·m−2·yr−1 (Figure 3c,d). Spatially significant trends (p < 0.05) covered 82.83% of the study area. A total of 82.52% of the region exhibited significant increasing trends (mean slope = 6.24 g C·m−2·yr−1). Maximum increase rates (>8 g C·m−2·yr−1; 3.91% coverage) clustered in the Wanquan–Chongli–Zhuolu region of Zhangjiakou (Figure 3c). Declining trends (1.78% coverage) appeared as fragmented patches, primarily in Luanping, Qian’an, Luanzhou, Yi, and Pingshan Counties. Notably, non-significant declines (1.24% coverage) were more extensive than significant decreases (0.54%) (Figure 3d).
3.2. Drivers of Vegetation NPP Dynamics
3.2.1. Geodetector-Based Factor Influence Analysis
To quantify the influence of various environmental factors on the spatial heterogeneity of vegetation NPP, we employed the Geographical Detector model and its q-statistic. The factor detection results (Table 2) ranked the drivers in the following descending order of explanatory power: VPD (q = 0.480) > TEMP (q = 0.462) > HFP (q = 0.358) > PRE (q = 0.171) > AET (q = 0.180) > SM (q = 0.105) > SARD (q = 0.069).
Table 2.
Results of factor detection analysis.
Vapor pressure deficit (VPD) and annual mean temperature (TEMP) were identified as the dominant factors controlling the spatial pattern of NPP, with q-values significantly higher than those of other factors. Human Footprint Index (HFP) also played a notable role on a local scale. Interestingly, precipitation showed a relatively low q-value, contrasting with its strong temporal correlation with NPP, suggesting that while precipitation drives interannual variability, its spatial heterogeneity has limited direct influence on NPP distribution.
Interaction detection revealed synergistic effects among factors (Figure 4). For instance, the interaction between temperature and precipitation (q = 0.447) far exceeded their individual effects, indicating that coupling of hydrothermal factors significantly enhances their explanatory power on NPP spatial differentiation.
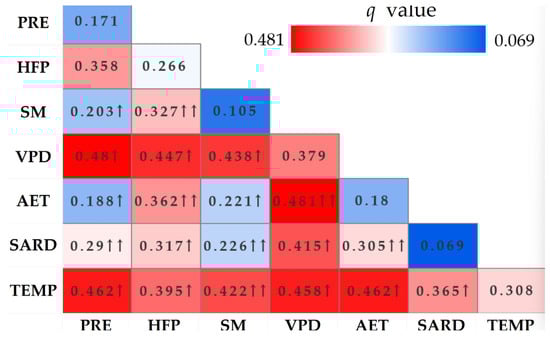
Figure 4.
Interaction detection results between driving factors. The diagonal cells show the q-value of each individual factor. The off-diagonal cells represent the q-values after the interaction of two factors. The symbols ↑ and ↑↑ denote two-factor enhancement and non-linear enhancement, respectively. Warmer colors indicate stronger interactive explanatory power.
Having identified the dominant factors governing the spatial pattern of NPP, we further investigated the temporal dynamics of vegetation productivity by examining its correlation with two fundamental climatic variables: precipitation and temperature. This analysis helps to reconcile the apparent discrepancy where precipitation, despite its low explanatory power for spatial heterogeneity, is widely recognized as a key climatic driver.
3.2.2. Climatic Controls on Vegetation NPP
Pixel-level correlation analysis revealed distinct spatial clustering in vegetation NPP responses to temperature and precipitation drivers across the YTECZ (Figure 5). Precipitation showed predominantly positive correlations with NPP (94.86% coverage; r: −0.51 to 0.82), particularly strong in agricultural lowlands (Figure 5a). Statistically significant correlations (p < 0.05) were detected in 15.39% of pixels (Figure 5c). Significant positive correlations (r = 0.10–0.60) concentrated in southwestern agricultural plains (Fuping–Shijiazhuang–Xingtai), reflecting rainfed cropland dependence. Significant negative correlations (r = −0.45–0.10) localized in urban/peri-urban zones (Weichang, Chicheng, Chengde, Baoding), likely indicating saturation effects in high-rainfall forests (Figure 5a,c). Temperature exhibited mixed correlations (r: −0.79 to 0.77), with near-equal positive (52.79%) and negative (47.21%) responses (Figure 5b). Weak temperature controls were evidenced by low significance (p < 0.05 in only 1.74% of pixels), with 98.26% exhibiting non-significant responses (Figure 5d). Significant positive correlations (r = 0–0.50) occurred in the Xindu–Wu’an–Shahe County corridor, suggesting thermal limitation in high-elevation margins. Significant negative correlations (r = −0.35–0.05) appeared as fragmented patches in Longhua–Huailai–Xingtang, possibly indicating heat stress in semi-arid valleys (Figure 5b,d).
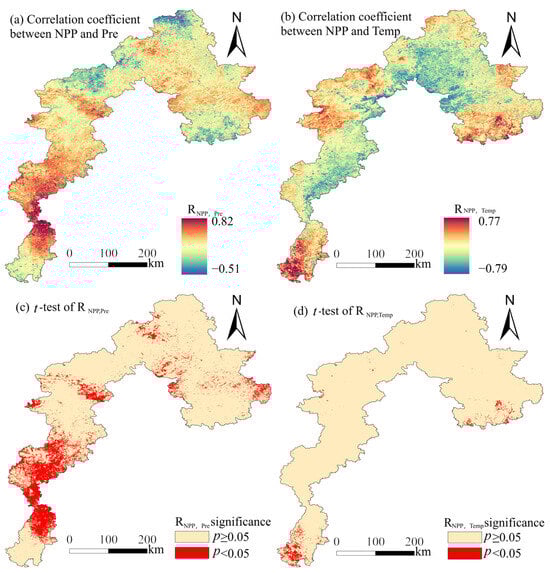
Figure 5.
Spatial patterns of correlation between vegetation NPP and climatic factors in the YTECZ. (a) Correlation coefficients between NPP and precipitation; (b) correlation coefficients between NPP and temperature; (c) statistical significance of NPP–precipitation correlations (t-test, p < 0.05); (d) statistical significance of NPP–temperature correlations (t-test, p < 0.05).
Collectively, precipitation exerted significantly stronger controls on NPP than temperature (p < 0.01), attributable to (1) differential water use efficiency across vegetation types and (2) predominant moisture limitation in this semi-arid montane ecosystem where precipitation enhances photosynthetic activity. This underscores a fundamental scale dependency in driving mechanisms: VPD and temperature dominate spatial heterogeneity, while precipitation fluctuation is the primary driver of interannual variability.
3.3. Spatiotemporal Trajectories of Vegetation NPP
3.3.1. Decadal Dynamics of NPP (2004–2023)
Figure 6 reveals consistent significant increasing trends across three decadal intervals (slope: 5.00–39.00 g C·m−2·yr−1), with accelerated-growth zones covering >33.89% of the study area per period. The 2004–2013 phase exhibited the strongest NPP gains in central-northern highlands (Chongli–Wanquan–Xinglong corridor; mean slope = 12.6 g C·m−2·yr−1), coinciding with key afforestation projects. Declines clustered in industrial corridors (Qian’an–Fengrun–Luanzhou) and mining districts (Wu’an–Shahe), reflecting localized anthropogenic pressures. The 2013–2023 interval showed expansion of growth hotspots to eastern Tangshan (slope = 9.8 ± 2.3 g C·m−2·yr−1) and southwestern Xingtai–Handan (slope = 11.2 ± 3.1 g C·m−2·yr−1), indicating spatial diffusion of restoration benefits. Over the integrated study period (2004–2023), vegetation NPP exhibited statistically significant trends (p < 0.05) across 82.83% of the YTECZ. Among these, 82.52% of the area showed sustained increases, with a mean growth rate of 6.4 g C·m−2·yr−1. Growth epicenters (>8.00 g C·m−2·yr−1) concentrated in Wanquan–Chongli–Chicheng, correlating with national ecological restoration zones. Moderate growth belts (3.00–8.00 g C·m−2·yr−1) formed contiguous patches across Xinglong–Chengde–Pingquan, representing secondary forest recovery. Marginal gains (0.00–3.00 g C·m−2·yr−1) appeared as fragmented mosaics in (1) Qinglong–Lulong agricultural valleys, (2) northern Fengning–Weichang grazing lands, and (3) Xingtang–Jingxing transitional ecotones. Declining hotspots localized in urban expansions zones (Tangshan/Zhangjiakou/Baoding metropolises) and intensive mining sites (Jingxing Mining Area, Wu’an–Shahe cluster), covering only 1.78% of the total area.

Figure 6.
Spatiotemporal patterns of vegetation NPP trajectories with significance levels across three periods (2004–2013, 2013–2023, 2004–2023) in the YTECZ.
3.3.2. Projected Future Trajectories of Vegetation NPP
Hurst exponent values (0.15–0.94; mean = 0.46) revealed strong anti-persistent dynamics (H < 0.5) in future NPP trajectories across 68.6% of the region (Figure 7a). Persistent signals (H > 0.5) concentrated in Zhangjiakou–Chengde forest reserves and Tangshan–Qinhuangdao coastal corridors. Anti-persistent hotspots (H < 0.5) prevailed in western agricultural basins (Baoding–Shijiazhuang–Xingtai–Handan). Spatial coverage was 68.57% anti-persistent vs. 31.43% persistent. Integration of the Hurst exponent with the historical trend slopes (derived from least squares regression) identified four trajectory types: (1) anti-persistent decrease, (2) persistent decrease, (3) anti-persistent increase, (4) persistent increase (Figure 7b). Pixel quantification revealed that persistent increase dominated (30.89%), while anti-persistent decrease was minimal (1.25%). Sustained increases clustered in old-growth forests of Chengde and coastal ecosystems of Tangshan. Anti-persistent decreases localized in southwestern farmlands (0.8% coverage), indicating probable recovery from current degradation. Critical concern areas include persistent decrease (0.53%) vs. dominant anti-persistent increase (67.33%). Persistent declines were concentrated in urban–industrial zones: Lubei/Qian’an (Tangshan) and Shuangqiao/Luanping (Chengde). These hotspots demand prioritized conservation strategies to avert irreversible ecosystem shifts.
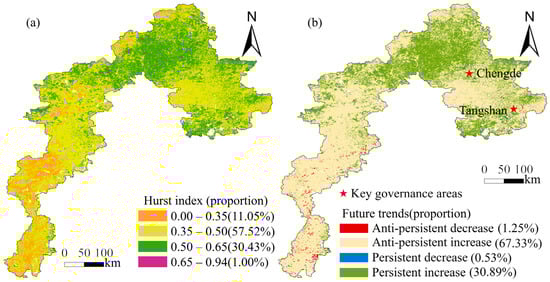
Figure 7.
Projected vegetation NPP trajectories: (a) spatial patterns of Hurst exponent, (b) integrated future trend classification based on Hurst–slope synergy.
4. Discussion
In the context of sustainable development, the YTECZ’s role as an ecological security barrier for the Beijing–Tianjin–Hebei region necessitates detailed investigation into vegetation NPP dynamics. Disentangling the scale-specific driving mechanisms is fundamental to developing adaptive management strategies that enhance ecosystem resilience under changing environmental conditions. Consequently, quantifying NPP patterns and drivers in the YTECZ provides vital insights for regional ecological sustainability. We documented a significant increasing NPP trend (2004–2023; mean: 395.83 ± 42.15 g C·m−2·yr−1), with the 2007 minimum (303.08 g C·m−2) coinciding with an extreme climate event—record-high temperatures (+1.8 °C above 20-yr mean) coupled with severe drought (precipitation deficit of 35%) [31], creating physiological stress that suppressed photosynthetic activity. Spatially, NPP exhibited a distinct northwest-to-southeast gradient, which aligns with the findings of Xin Huichao [32] and Li Xiao [33]. High NPP values were primarily distributed in Zhangjiakou, Baoding, and Chengde, while low values were concentrated in Tangshan and Shijiazhuang. An analysis combining natural conditions, topography, and anthropogenic activities revealed that the northwestern region, dominated by the Taihang and Yanshan Mountains, features vegetation types such as broadleaf forests and shrubs, with high vegetation coverage and minimal human disturbance, resulting in higher NPP values compared to other areas [34,35,36]. In contrast, the southeastern plains are highly urbanized, subject to intense human activity, and exhibit sparse vegetation, leading to lower NPP values than the mountainous northwest [26,37,38].
A central finding of this research is the clear divergence between the temporal and spatial drivers of vegetation net primary productivity (NPP). At the interannual scale, precipitation variability emerges as the principal governor of vegetation NPP dynamics, substantiating the paradigmatic role of water availability in constraining plant productivity across the region [39,40,41]. However, at the spatial scale, the Geographical Detector model revealed a more complex driver pattern. Vapor pressure deficit (VPD) and air temperature were identified as the strongest factors explaining spatial heterogeneity in NPP, exerting far greater influence than precipitation. This is likely attributable to the generally arid climate of the study region, where high VPD exacerbates plant transpiration and can induce stomatal closure, thereby directly limiting photosynthesis [42,43]. The dominant role of both VPD and temperature suggests that the spatial distribution and productivity of vegetation are constrained not only by thermal conditions but also profoundly influenced by atmospheric moisture stress, which is itself strongly driven by temperature. Furthermore, interaction analysis revealed synergistic effects between factors, where the explanatory power of any factor pair exceeded the individual contributions of either factor alone. In particular, interactions between hydrothermal factors (e.g., temperature ∩ precipitation) resulted in strong non-linear enhancement, confirming that climatic factors do not influence NPP in isolation but rather as a coupled system of synergistic effects [44].
It is also noteworthy that human activities (HFP) exhibited considerable explanatory power, underscoring the non-negligible impact of anthropogenic disturbances on vegetation change at the regional scale. More importantly, the interaction between HFP and VPD showed a strongly non-linear enhancement effect, indicating that human influence on NPP is amplified under arid conditions [45]. This synergy may stem from human regulation of water resources (e.g., irrigation for agriculture) or land use changes that either alleviate or intensify vegetation stress in dry environments [46]. For instance, in areas with high VPD, agricultural irrigation or urban greening could significantly mitigate moisture stress and enhance vegetation productivity, whereas over-exploitation may exacerbate ecosystem vulnerability [47,48]. These findings underscore the necessity to integrate anthropogenic and climatic drivers, particularly in water-limited ecosystems where human activities critically modulate vegetation sensitivity to climate chang. Therefore, future ecological management and policymaking must integrate the synergistic effects of climate and human activities to achieve the goals of vegetation restoration and sustainable ecosystem development.
Recent policies in Hebei (e.g., Grain-for-Green, Mountain Closure, Beijing–Tianjin Sandstorm Control, Plain Afforestation) enhanced vegetation coverage, promoting ecological restoration and NPP increase. A total of 67.33% of YTECZ shows anti-persistent NPP increase, aligning with prior research [49,50]. These findings yield critical implications for regional ecosystem governance: First, the Zhangjiakou–Chengde ecological corridor with good recovery trends should be designated as a priority protected area, strictly controlling urban expansion. Second, it is recommended to establish an integrated monitoring network combining remote sensing, flux observation, and machine learning early warning systems. Finally, ecological compensation standards should be optimized based on NPP recovery potential, increasing compensation for ecologically vulnerable areas. Methodologically, the Hurst exponent analysis carries inherent limitations; future research will combine process-based models, high-resolution land use change data, and climate scenarios. Structural equation modeling should be employed to partition (i) policy effects (β coefficients), (ii) climate–anthropogenic feedbacks, and (iii) extreme event thresholds (piecewise regression). which will significantly improve prediction accuracy and provide a more reliable scientific basis for implementing ecological conservation redline policies.
5. Conclusions
This study investigated the spatiotemporal dynamics and drivers of vegetation net primary productivity (NPP) in the YTECZ during 2004–2023. Our findings, which directly address the research objectives, lead to the following principal conclusions:
- Spatiotemporal Patterns: Vegetation NPP exhibited a significantly increasing yet fluctuating trend, rising at an average annual increase of 4.58 g C·m−2yr−1. Spatially, a distinct “high in the northwest, low in the southeast” gradient was identified, reflecting the underlying influences of topography, land cover, and anthropogenic pressure.
- Driving Mechanisms: A key finding of this study is the fundamental scale-dependency of the driving mechanisms. Precipitation dominated the interannual variability of NPP, whereas VPD and temperature were the primary drivers of its spatial heterogeneity. This clear divergence highlights the necessity of distinguishing between temporal and spatial scales when diagnosing vegetation dynamics. Furthermore, the interaction between these factors, particularly the non-linear enhancement between VPD and human activities, adds another layer of complexity to the driving mechanisms.
- Future Sustainability and Implications: The future NPP trajectory is characterized by strong anti-persistence (Hurst exponent mean = 0.46), indicating that the current increasing trend is unlikely to be sustainable and may reverse in the future. This finding underscores the potential vulnerability of the region’s long-term carbon sequestration potential, posing challenges for climate resilience planning. Consequently, ecological management strategies should prioritize areas with persistent decline and incorporate the inherent instability of anti-persistent increases into long-term conservation planning.
Author Contributions
All the authors contributed significantly to this study. Conceptualization, K.S. and D.Z.; methodology, M.Y. and D.Z.; software, P.C. and Z.A.; validation, K.L. and W.L.; formal analysis, M.Y.; investigation, M.Y. and P.C.; resources, K.S.; data curation, Z.A. and K.L.; writing—original draft preparation, M.Y.; writing—review and editing, D.Z. and K.S. All authors have read and agreed to the published version of the manuscript.
Funding
China Geological Survey (Grant No. DD20242329): Comprehensive Observation and Monitoring, Assessment of Natural Resources in the Yongding–Luanhe River Basin.
Data Availability Statement
The data presented in this study are available upon request from the corresponding author, upon reasonable request.
Conflicts of Interest
The authors declare no conflicts of interest.
References
- Gui, Y.; Wang, K.; Huntingford, C.; Wei, S.; Li, X.; Myneni, R.B.; Piao, S. Vegetation greenness in 2024. Nat. Rev. Earth Environ. 2025, 6, 255–257. [Google Scholar] [CrossRef]
- Wu, X.; Liang, J.; Du, D.; Xue, R.; Ding, X.; Wei, M.; Zhang, P. Spatial-temporal pattern and influencing factors of vegetation phenology and net primary productivity in the Qilian Mountains of Northwest China. Sustainability 2022, 14, 14337. [Google Scholar] [CrossRef]
- Piao, S.; Wang, X.; Park, T. Characteristics, drivers and feedbacks of global greening. Nat. Rev. Earth Environ. 2020, 1, 14–27. [Google Scholar] [CrossRef]
- Lieth, H.; Whittaker, R.H. Primary Productivity of the Biosphere; Springer: New York, NY, USA, 1975. [Google Scholar]
- Roxburgh, S.H.; Berry, S.L.; Buckley, T.N.; Barnes, B.; Roderick, M.L. What is NPP? Inconsistent accounting of respiratory fluxes in the definition of net primary production. Funct. Ecol. 2010, 19, 378–382. [Google Scholar] [CrossRef]
- Sun, Q.L.; Li, B.L.; Li, F.; Zhang, Z.J.; Ding, L.L.; Zhang, T.; Xu, L.L. Review on the estimation of net primary productivity of vegetation in the Three-River Headwater Region, China. Acta Geogr. Sin. 2016, 71, 1596–1612. (In Chinese) [Google Scholar] [CrossRef]
- Zhang, F.G.; Zeng, B.; Cao, Y.; Li, F.; Tang, Z.Y.; Qi, J.G. Human activities have markedly altered the pattern and trend of net primary production in the Ili River basin of Northwest China under current climate change. Land Degrad. Dev. 2022, 33, 2585–2595. [Google Scholar] [CrossRef]
- Afzali, A.; Hadian, F.; Sabri, S.; Yaghmaei, L. Investigating net primary production in climate regions of Khuzestan Province, Iran using CASA model. Int. J. Biometeorol. 2024, 68, 1357–1370. [Google Scholar] [CrossRef]
- Li, W.; Zhou, J.; Xu, Z.; Liang, Y.; Shi, J.; Zhao, X. Climate impact greater on vegetation NPP but human enhance benefits after the grain for green program in Loess Plateau. Ecol. Indic. 2023, 157, 111201. [Google Scholar] [CrossRef]
- Jin, K.; Wang, F.; Han, J.; Shi, S.; Ding, W. Contribution of climatic change and human activities to vegetation NDVI change over China during 1982–2015. Acta Geogr. Sin. 2020, 75, 961–974. (In Chinese) [Google Scholar] [CrossRef]
- Li, J.; Wang, Z.; Lai, C.; Wu, X.; Zeng, Z.; Chen, X.; Lian, Y. Response of net primary production to land use and land cover change in mainland China since the late 1980s. Sci. Total Environ. 2018, 639, 237–247. [Google Scholar] [CrossRef]
- Li, F.; Zhang, K.; Ren, J.; Yin, C.; Zhang, Y.; Nie, J. Driving mechanism for farmers to adopt improved agricultural systems in China: The case of rice-green manure crops rotation system. Agric. Syst. 2021, 192, 103202. [Google Scholar] [CrossRef]
- Lei, S.; Zhou, P.; Lin, J.; Tan, Z.; Huang, J.; Yan, P.; Chen, H. Spatiotemporal variation in carbon and water use efficiency and their influencing variables based on remote sensing data in the Nanling Mountains Region. Remote Sens. 2025, 17, 648. [Google Scholar] [CrossRef]
- Bulut, S.; Günlü, A.; Şatır, O. Estimating net primary productivity of semi-arid Crimean pine stands using biogeochemical modeling, remote sensing, and machine learning. Ecol. Inform. 2023, 76, 102137. [Google Scholar] [CrossRef]
- Cuo, L.; Zhang, Y.; Ri, X.; Zhou, B. Decadal change and inter-annual variability of net primary productivity on the Tibetan Plateau. Clim. Dyn. 2021, 56, 1837–1857. [Google Scholar] [CrossRef]
- Richter, G.; Topp, C. Climate factors contribute to grassland net primary productivity. Agronomy 2021, 11, 1076. [Google Scholar] [CrossRef]
- Peng, M.; Li, C.; Wang, P.; Dai, X. Spatio-temporal variation and future sustainability of net primary productivity from 2001 to 2021 in Hetao Irrigation District, Inner Mongolia. Agriculture 2024, 14, 613. [Google Scholar] [CrossRef]
- Liu, G.; Shao, Q.; Fan, J.; Ning, J.; Rong, K.; Huang, H.; Liu, S.; Zhang, X.; Niu, L.; Liu, J. Change trend and restoration potential of vegetation net primary productivity in China over the past 20 years. Remote Sens. 2022, 14, 1634. [Google Scholar] [CrossRef]
- Su, Y.; Chen, S.; Li, X.; Ma, S.; Xie, T.; Wang, J.; Yan, D.; Chen, J.; Feng, M.; Chen, F. Changes in vegetation greenness and its response to precipitation seasonality in Central Asia from 1982 to 2022. Environ. Res. Lett. 2023, 18, 104002. [Google Scholar] [CrossRef]
- Chang, S.; Gao, X.; Li, Q.; Song, X.; Lin, J. Threshold response of net primary productivity to climate change in the Qilian Mountains (2001–2022). Ecol. Indic. 2025, 178, 113900. [Google Scholar] [CrossRef]
- Lin, N.; Li, J.; Jiang, R.; Li, X.; Liu, S. Quantifying the spatiotemporal variation of NPP of different land cover types and the contribution of its associated factors in the Songnen Plain. Forests 2023, 14, 1841. [Google Scholar] [CrossRef]
- Zhao, Y.; Qie, X. Quantitative assessment of the relative impacts of climate change and human activities on net primary productivity of vegetation in the Beijing-Tianjin-Hebei Region. Front. Environ. Sci. 2024, 12, 1508433. [Google Scholar] [CrossRef]
- Nemani, R.R.; Keeling, C.D.; Hashimoto, H.; Jolly, W.M.; Piper, S.C.; Tucker, C.J.; Myneni, R.B.; Running, S.W. Climate-driven increases in global terrestrial net primary production from 1982 to 1999. Science 2003, 300, 1560–1563. [Google Scholar] [CrossRef] [PubMed]
- Zhang, M.; Yuan, N.; Lin, H.; Liu, Y.; Zhang, H. Quantitative estimation of the factors impacting spatiotemporal variation in NPP in the Dongting Lake Wetlands using landsat time series data for the last two decades. Ecol. Indic. 2022, 135, 108544. [Google Scholar] [CrossRef]
- Xue, H.; Chen, Y.; Dong, G.; Li, J. Quantitative analysis of spatiotemporal changes and driving forces of vegetation net primary productivity (NPP) in the Qimeng Region of Inner Mongolia. Ecol. Indic. 2023, 154, 110610. [Google Scholar] [CrossRef]
- Yi, M.; Zhang, D.; An, Z.; Li, K.; Shang, L.; Sui, K. Analysis of spatiotemporal variation and driving forces of vegetation net primary productivity in the North China Plain over the past two decades. Agronomy 2025, 15, 975. [Google Scholar] [CrossRef]
- National Development and Reform Commission of China. Outline of the Coordinated Development Plan for Beijing-Tianjin-Hebei Region (The Official Strategic Policy Document for Regional Development) [EB/OL]; National Development and Reform Commission of China: Beijing, China, 2015. (In Chinese)
- Cai, T.; He, C.; Gill, A.; Ma, C. Spatiotemporal variation and driving analysis of net primary productivity of vegetation in Southern Taihang Mountains, China. J. Environ. Earth Sci. 2025, 7, 611–624. [Google Scholar] [CrossRef]
- Ba, W.; Qiu, H.; Cao, Y.; Gong, A. Spatiotemporal characteristics prediction and driving factors analysis of NPP in Shanxi Province covering the period 2001–2020. Sustainability 2023, 15, 12070. [Google Scholar] [CrossRef]
- Liang, L.; Li, M.; Huang, Z.; Wang, Q.; Yang, Z.; Wang, S. Insights into spatiotemporal dynamics and driving mechanisms of vegetation net primary productivity in African terrestrial ecosystems. Int. J. Appl. Earth Obs. Geoinf. 2025, 143, 104824. [Google Scholar] [CrossRef]
- Peng, Q.; Wang, R.; Jiang, Y.; Li, C. Contributions of climate change and human activities to vegetation dynamics in Qilian Mountain National Park, Northwest China. Glob. Ecol. Conserv. 2021, 32, e01947. [Google Scholar] [CrossRef]
- Xin, H.; Zhang, A.; Wang, H.; Ma, P. Spatiotemporal variation in net primary productivity and its driving factors in the Haihe River Basin, China. Guihaia 2023, 43, 253–265. (In Chinese) [Google Scholar] [CrossRef]
- Li, X.; Yuan, J.; Meng, D. Spatiotemporal evolution of vegetation NPP and its relationship with climatic factors in Hebei Province from 2005 to 2014. Res. Soil Water Conserv. 2018, 25, 109–114. (In Chinese) [Google Scholar] [CrossRef]
- Chen, Y.; Yan, F.; Wang, L.; Yin, H.; Wang, W.; Wang, J.; Chen, Y.; Xu, H. Spatiotemporal dynamics of vegetation ecological index and its driving factors in the Taihang–Yan Mountains over the Last 20 years. Acta Ecol. Sin. 2024, 44, 8283–8293. (In Chinese) [Google Scholar] [CrossRef]
- Yan, F.; Li, C.; Wang, J.; Lu, Z.; Huang, X.; Wang, M.; Wang, W.; Li, R.; Pang, J.; Chen, Y. Quantitative analysis of driving forces behind the spatiotemporal evolution of vegetation NPP in the Beijing–Tianjin–Hebei Ecological Barrier Zone. Environ. Sci. 2025, 46, 327–339. (In Chinese) [Google Scholar] [CrossRef]
- Zhao, N.; Yue, T.; Li, H.; Zhang, L.; Yin, X.; Liu, Y. Spatio-temporal changes in precipitation over Beijing-Tianjin-Hebei Region, China. Atmos. Res. 2017, 202, 156–168. [Google Scholar] [CrossRef]
- Liu, L.; Wang, Z.; Wang, Y.; Zhang, Y.; Shen, J.; Qin, D.; Li, S. Trade-Off analyses of multiple mountain ecosystem services along elevation, vegetation cover and precipitation gradients: A case study in the Taihang Mountains. Ecol. Indic. 2019, 103, 94–104. [Google Scholar] [CrossRef]
- Weng, C.; Bai, Y.; Hu, Y.; Cai, W.; Zhang, S.; Shu, J. Virtual arable land trade reveals inequalities in the North China Plain: Regional heterogeneity and influential determinants. Phys. Chem. Earth. 2025, 138, 103889. [Google Scholar] [CrossRef]
- Liu, W.; Yan, D.; Yu, Z.; Wu, Z.; Wang, H.; Yang, J.; Liu, S.; Wang, T. Analysis of dynamic changes in vegetation Net Primary Productivity and its driving factors in the regions north and south of the Hu Huanyong Line, China. Land 2024, 13, 722. [Google Scholar] [CrossRef]
- Michaletz, S.T.; Cheng, D.; Kerkhoff, A.J.; Enquist, B.J. Convergence of terrestrial plant production across global climate gradients. Nature 2014, 512, 39–43. [Google Scholar] [CrossRef]
- Liu, L.; Guan, J.; Han, W.; Ju, X.; Mu, C.; Zheng, J. Quantitative assessment of the relative contributions of climate and human factors to net primary productivity in the Ili River Basin of China and Kazakhstan. Chin. Geogr. Sci. 2022, 32, 1069–1082. [Google Scholar] [CrossRef]
- Ni, X.; Guo, W.; Li, X.; Li, S. Heterogeneity of increases in net primary production under intensified human activity and climate variability on the Loess Plateau of China. Remote Sens. 2022, 14, 4706. [Google Scholar] [CrossRef]
- Xu, Y.; Lu, Y.-G.; Zou, B.; Xu, M.; Feng, Y.-X. Unraveling the enigma of NPP variation in Chinese vegetation ecosystems: The interplay of climate change and land use change. Sci. Total Environ. 2023, 912, 169023. [Google Scholar] [CrossRef] [PubMed]
- Li, Z.; Chen, Y.; Wang, X.; Su, M.; Xu, H.; Zhang, P. Spatiotemporal changes in net primary productivity before and after the development of unused land in the hilly areas of Hebei, China. PLoS ONE 2022, 17, e0270010. [Google Scholar] [CrossRef]
- Gu, L.; Grodzinski, B.; Han, J.; Marie, T.; Zhang, Y.J.; Song, Y.C.; Sun, Y. Regulatory coordination of photophysical, photochemical, and biochemical reactions in the photosynthesis of land plants. Plant Direct. 2025, 9, e70080. [Google Scholar] [CrossRef] [PubMed]
- Lv, M.; Qin, L.; Li, B.; Dang, Y.; Wang, J. Spatiotemporal characteristics of drought under different vegetation types and their responses to climatic factors in Jilin Province, China. Reg. Environ. Change. 2024, 25, 11. [Google Scholar] [CrossRef]
- Ge, W.; Deng, L.; Wang, F.; Han, J. Quantifying the contributions of human activities and climate change to vegetation net primary productivity dynamics in China from 2001 to 2016. Sci. Total Environ. 2021, 773, 145648. [Google Scholar] [CrossRef]
- Li, M.; Li, Q.; Xue, M. Spatio-temporal changes of vegetation net primary productivity and its driving factors on the Tibetan Plateau from 1979 to 2018. Atmosphere 2024, 15, 579. [Google Scholar] [CrossRef]
- Ma, Z.; Wu, J.; Yang, H.; Hong, Z.; Yang, J.; Gao, L. Assessment of vegetation net primary productivity variation and influencing factors in the Beijing–Tianjin–Hebei Region. J. Environ. Manag. 2024, 365, 121490. [Google Scholar] [CrossRef]
- Yao, Q.; Zhang, J.; Song, H.; Yu, R.; Xiong, N.; Wang, J.; Cui, L. Estimation of vegetation carbon sinks and their response to land use intensity in the Beijing–Tianjin–Hebei Region. Forests 2024, 15, 2158. [Google Scholar] [CrossRef]


Disclaimer/Publisher’s Note: The statements, opinions and data contained in all publications are solely those of the individual author(s) and contributor(s) and not of MDPI and/or the editor(s). MDPI and/or the editor(s) disclaim responsibility for any injury to people or property resulting from any ideas, methods, instructions or products referred to in the content. |
© 2025 by the authors. Licensee MDPI, Basel, Switzerland. This article is an open access article distributed under the terms and conditions of the Creative Commons Attribution (CC BY) license (https://creativecommons.org/licenses/by/4.0/).