Abstract
Against the backdrop of safety becoming a key objective in the restructuring of industrial chains, the impact of China’s outbound foreign direct investment (OFDI) on industrial chain risks warrants further exploration. Based on the Asian Development Bank’s Multi-Regional Input-Output Data (ADB-MRIOD) from 2007 to 2023, this study measures the external risk exposure of industrial chains from both supply-side and demand-side perspectives across 41 Belt and Road Initiative (BRI) economies. Utilizing a two-way fixed effects panel model with lagged variables and instrumental techniques to mitigate endogeneity, we empirically investigate the mechanisms through which China’s OFDI influences the external risk exposure of industrial chains. The findings reveal that (1) China’s OFDI significantly reduces such risk exposure, and (2) effect heterogeneity observed across country groups and sectors—showing stronger mitigation in high-innovation and developing countries, as well as in capital-intensive industries. (3) Mechanism analysis identifies three transmission channels: enhancing the host country’s trade network status, rationalizing its industrial structure, and strengthening Sino-host country industrial linkages. The study provides empirical support for formulating targeted investment policies to enhance supply chain resilience under the BRI framework.
1. Introduction
Against the backdrop of the profound restructuring of global industrial chains, exposure to external risks in industrial chains (EERIC) has become a core variable influencing national economic security. It is defined as ‘The systemic vulnerability of a country to external shocks (such as geopolitical conflicts, technological supply disruptions, trade barriers, etc.) due to its participation in the global division of labor is manifested in two risk dimensions: the supply side (upstream supply disruption) and the demand side (downstream demand contraction). The systemic vulnerability of a country to external shocks (such as geopolitical conflicts, technological supply disruptions, trade barriers, etc.) due to its participation in the global division of labor is manifested in two risk dimensions: the supply side (upstream supply disruption) and the demand side (downstream demand contraction).’ [1]. The World Economic Forum’s 2024 Global Risks Report lists ‘systemic disruption of supply chains’ as the fourth-largest economic risk globally, highlighting its severity. Notably, developed countries are exacerbating the vulnerability of developing countries’ industrial chains through ‘chokepoint’ strategies [2]. For example, Southeast Asia’s electronics industry is highly dependent on key equipment from the United States and Japan, with an import dependency rate exceeding 60%. Central Asian energy-producing countries rely on a single international market for 80% of their crude oil exports, and any disruption could lead to a breakdown of their industrial chains. The advancement of the Belt and Road Initiative (BRI) offers a new pathway to mitigate such risks. China is reshaping the regional industrial chain ecosystem through outbound foreign direct investment (OFDI): from 2013 to 2022, OFDI stock in BRI countries increased from 72 billion to 200 billion US dollars, with 70% invested in key sectors such as manufacturing, energy, and transportation [3]. Empirical evidence shows that Vietnam has increased its intermediate goods localization rate to 35% by attracting Chinese electronic OFDI, while Malaysia has reduced its reliance on the EU market by 28% due to Chinese photovoltaic projects [4]. These cases demonstrate the potential of OFDI to reduce risk exposure through trade network upgrading, industrial structure optimization, and strengthened industrial linkages.
However, if the differentiated impact mechanisms of OFDI in different contexts cannot be clearly identified and quantified, China’s efforts to advance the Belt and Road Initiative and build a secure and resilient regional industrial chain network may face a ‘one-size-fits-all’ dilemma. Blind investment may not only fail to effectively reduce risks in target countries but may even backfire, leading to misallocation of resources and potential geo-economic friction. As an important part of the “Belt and Road” initiative, China’s OFDI not only involves cross-border capital flows but also reshapes the regional industrial chain ecosystem by deeply integrating into the production network of the host country. Although some studies have emphasized the positive impacts of OFDI [5,6,7,8], this study mostly focuses on the benefits of the host country and does not fully distinguish the differentiated impacts of OFDI on the risks of the home country and the host country. In fact, capital outflow may have negative effects such as employment pressure and tax loss in the short term, but its long-term strategic value lies in reducing systemic risks through regional industrial chain integration. This dialectical relationship requires us to go beyond the simple “positive/negative” binary discussion and instead focus on the specific mechanisms and constraints of OFDI’s impact on risks.
Current research has mainly focused on the positive effects of OFDI on the economic growth and technological upgrades of the host country. However, the mechanism by which OFDI affects the exposure of the industrial chain risks has not been systematically explained. For instance, how does OFDI reduce risks through technology spillover, infrastructure connectivity, or institutional collaboration? And under what conditions might it lead to new dependency paths, thereby exacerbating risks [9]? The theoretical gaps in these issues urgently need to be filled. However, existing research has paid insufficient attention to the risk transmission mechanisms of OFDI, with most findings remaining at the macro level of resilience description. Ref. [10] pointed out changes in regional demand dependency but failed to reveal the formation logic of micro-level risk exposure. For example, when host countries deeply integrate into the industrial chain network centered on China, how does their vulnerability to specific supply chain segments evolve [11]? Can technology transfer and market diversification truly withstand geopolitical shocks? Although some studies mention that OFDI may exacerbate external dependencies in certain industries, there remains a lack of in-depth analysis on how such dependencies transmit cascading risks through industrial chain networks [12]. This leaves the core question unresolved: While OFDI strengthens regional industrial chain connections [13], does it also create new vulnerabilities by altering the distribution of risk [14]? Current research has neither clearly defined the comprehensive impact of OFDI on risk exposure nor empirically delineated its underlying mechanisms. Therefore, this paper attempts to integrate transaction cost economics with supply chain resilience theory to construct an analytical framework for understanding the impact of China’s OFDI on the risks of the industrial chain. On one hand, OFDI can reduce the uncertainties faced by host country enterprises by internalizing market transactions, thereby enhancing the efficiency of supply chain collaboration. On the other hand, it may also strengthen the system’s resilience to shocks by optimizing the layout of regional production networks.
Current research on supply chain risks primarily examines three categories of influencing factors: the impact of technological changes such as digital transformation on supply chain resilience [15], policy interventions including trade barriers and technology blockades [16], and external shocks such as supply chain disruptions caused by pandemics [7]. However, such research has obvious limitations—it overly focuses on the risk resilience of enterprises or nations while neglecting the transmission mechanisms of supply chain risks across international borders. As pointed out by [17], the critical process of how shocks spread through global production networks to other countries when a nation’s intermediate goods supply is disrupted has yet to be systematically explained. A more fundamental issue is that existing discussions remain at the broad conceptual level of ‘supply chain risks,’ lacking a clear definition of the core issue of external risk exposure in industrial chains. Ref. [18] emphasise that external risk exposure specifically refers to ‘the external systemic risks a country is exposed to due to its participation in international division of labour,’ but the academic community has yet to establish effective measurement methods. This cognitive deficiency leads to two research shortcomings: first, existing analyses struggle to trace the true origins of risks. Ref. [19] found that the risk generation mechanisms of simple and complex industrial chains differ fundamentally, but current methods cannot effectively distinguish between them. Second, research on risk transmission pathways is severely lacking. Although [20] noted that the restructuring of industrial linkage networks affects the efficiency of risk diffusion, the specific role of OFDI in this process remains unexplored. For example, after Chinese enterprises establish local supporting systems, do they buffer or amplify the transmission speed of external shocks? This question remains unanswered. Against this backdrop, delving into the mechanism of interaction between OFDI and the external risk exposure of industrial chains holds threefold significance. From a theoretical perspective, this helps resolve the academic debate raised by [14] regarding whether regional industrial chain integration reduces risks or creates new vulnerabilities, thereby enhancing the microfoundations of global value chain resilience theory. From a policy perspective, research findings can provide targeted evidence for ‘Belt and Road’ countries to identify key risk nodes, avoiding the blindness of preventive measures. More importantly, it holds methodological value, driving supply chain risk research from descriptive analysis to mechanism deconstruction, and establishing a systematic framework of ‘risk tracing—transmission analysis—resilience assessment’.
Current quantitative research on supply chain risk exposure has significant shortcomings. Firstly, the existing measurement indicators are relatively scarce, and there may be confusion in their definitions. While mainstream methods such as Global Value Chain Participation (GVCpt) can reflect the degree of participation in international division of labour, they cannot distinguish between the risk differences between simple and complex supply chains [18]. For example, while China and South Korea have similar levels of value chain participation in the electronics industry, South Korea’s deep integration into multi-country manufacturing processes results in its complex supply chain risks being three times higher than China’s—a critical difference completely obscured by traditional indicators [19]. Another commonly used tool, the input-output table (I-O), while capable of tracking industrial linkages, fails to separate domestic and international production networks, leading to a significant underestimation of cross-border risks [17]. Secondly, the research sometimes lacks a comprehensive examination from the perspective of risk-reward. The existing indicators for measuring the risks of the industrial chain mainly reflect the vulnerability of the production chain or the pre-event risks and may not necessarily represent the true risks of the industrial chain. Moreover, many studies ignore the impact of the activities of foreign-funded enterprises within and outside the host country on the risks of the industrial chain. The lack of a framework for calculating the risk exposure of the industrial chain by distinguishing between domestic and foreign-funded enterprises makes it difficult to precisely measure the risks and vulnerabilities of the industrial chain. To address these shortcomings, this study innovatively constructs a two-dimensional risk exposure measurement system based on the Asian Development Bank’s multi-regional input-output database. Risks are separated from the perspectives of supply and demand: when acting as a supplier, the threat to production capacity from external shocks is calculated; when acting as a purchaser, the probability of production disruptions caused by supply interruptions is assessed. The analysis is further stratified by supply chain complexity: simple supply chains focus on the impact of single cross-border disruptions, while complex supply chains quantify the cascading effects of production failures across multiple countries. This approach precisely identifies implicit risk exposures triggered by indirect channels such as international supply chain linkages [21]. It not only addresses the ‘black box’ treatment of risk structures by traditional tools but also lays an empirical foundation for revealing the mechanisms underlying OFDI.
The remainder of this study is structured as follows: Section 2 presents the theoretical framework and research hypotheses, systematically outlining the theoretical framework and causal pathways through which China’s OFDI influences the external risk exposure of industrial chains; Section 3 provides a detailed explanation of model construction, variable definitions, and data sources, including an innovative measurement method for the external risk exposure of industrial chains; Section 4 analyses the spatiotemporal evolution characteristics and industry distribution patterns of external risk exposure of industrial chains in BRI countries from both supply-side and demand-side perspectives; Section 5 empirically tests the impact effects of China’s OFDI through benchmark regression, robustness tests, endogeneity treatment, and multidimensional heterogeneity analysis; Section 6 focuses on the impact mechanisms, empirically examining three transmission pathways: the enhancement of trade network status, the rationalisation of industrial structure, and the strengthening of industrial linkages; Section 7 summarises the research conclusions and proposes targeted policy recommendations.
In summary, this paper measures the external risk exposure of industrial chains based on the Asian Development Bank’s Multi-Regional Input-Output Data (ADB-MRIOD) from 2007 to 2023 and empirically tests the relationship between China’s outward direct investment and this indicator. Compared with existing research, the marginal contributions of this paper may be reflected in the following aspects: first, it breaks through the limitations of traditional GVCpt and standard I-O and innovatively constructs a two-dimensional measurement system for the external risk exposure of industrial chains based on the ADB-MRIOD. Second, unlike previous research paradigms centred on developed countries, this study focuses on the emerging and critical group of developing countries along the Belt and Road Initiative, systematically examining the impact of China’s OFDI on their external risk exposure of industrial chains. Not only does it empirically test the comprehensive impact of China’s OFDI on risk exposure, but it also systematically reveals and empirically validates three core mechanisms: enhancing the host country’s trade network status, promoting the rationalisation of the host country’s industrial structure, and strengthening industrial linkages between China and the host country. This study expands the application boundaries of global value chain resilience theory and international investment theory, revealing the specific pathways and mechanisms through which regional industrial chain integration reduces systemic risks in the context of developing countries.
2. Theoretical Mechanism and Research Hypothesis
2.1. China’s OFDI and External Risk Exposure of Industrial Chains
China’s OFDI can effectively enhance the host country’s ability to cope with market risks and reduce the sensitivity of the industrial chain to external supply and demand shocks by helping the host country integrate more deeply into key links of the regional value chain. On the one hand, from a supply-side perspective, the cross-border production networks formed by China’s OFDI have optimized industry within the region. By establishing alternative sources of intermediate goods and geographically closer production nodes, they have constructed a multi-tiered supply system [22]. This geographical proximity also shortens the distance for technology diffusion, promotes knowledge spillovers, and creates a virtuous cycle that enhances supply chain resilience [23]. The inflow of Chinese capital helps activate underutilized production factors in host countries and optimizes the combination of production factors by introducing more advanced technologies and management experience, thereby improving overall production efficiency [24]. China’s investments in infrastructure have a multiplier effect, improving local transportation, logistics, and energy networks, significantly reducing the risks and costs of logistics disruptions, and enhancing the entire supply chain’s resilience to external shocks [25]. From the demand-side perspective, the trade network development driven by China’s OFDI promotes regional economic integration, helping host country enterprises access broader markets more conveniently [26]. This expansion of market space allows demand fluctuations to be dispersed and absorbed across a larger regional area. The technology and management expertise brought by investment have driven host country industries to extend into higher-value-added segments of the value chain, such as R&D, design, and brand marketing [27]. The enhancement of product value-added has strengthened enterprises’ bargaining power and competitiveness in international markets. Investments in consumer goods or services help meet host countries’ more diverse consumption needs, reducing their reliance on a single market or a few products, thereby diversifying demand-side risks. Therefore, this paper proposes Hypothesis 1.
H1.
China’s OFDI can significantly reduce the external risk exposure of the supply side and demand side of the industrial chain in countries along the Belt and Road.
2.2. Pathways for Chinese OFDI to Reduce External Risk Exposure in the Industrial Chain
2.2.1. Host Country Trade Network Status
In traditional GVCs, developing countries often occupy marginal positions and have limited importance within trade networks. This makes them more vulnerable to shocks from fluctuations in international markets [28]. Chinese investment helps host countries become more important ‘transit hubs’ and connection points in regional trade. This role fills the ‘gaps’ in regional trade networks and distributes trade influence across more countries. As a result, host countries reduce their reliance on a few specific markets, and the risk of supply chains being damaged by external market fluctuations is significantly reduced [29]. China’s investment in infrastructure such as transportation, energy, and communications addresses the shortcomings of host countries [30], thereby enhancing their value as regional logistics hubs. The standardization and modernization of cross-border logistics systems [10] reduce the time and distance required for goods transportation [31] and lower the costs associated with multiple transshipments. Better connectivity has transformed host countries from mere participants into organizational and coordination centers for regional trade and production. Meanwhile, Chinese investment is often accompanied by bilateral or multilateral trade agreements, whose provisions (such as cumulative rules of origin and mutual recognition of tariff preferences) [32] strengthen the direct links between host countries and other trading partners. The dispute resolution and intellectual property protection mechanisms explicitly stipulated in investment agreements [33] reduce additional costs arising from institutional differences or conflicts. These institutional arrangements lower the host country’s reliance on a single market and enhance its bargaining power in trade negotiations. Investment-supported digital trade platforms have broken the traditional trade model where information was monopolized by a few large companies [34]. Smart matching systems make it easier for SMEs to find buyers or sellers [21]; technologies like blockchain simplify transaction verification processes and reduce the difficulty of establishing trust [35]. This enables host country firms to participate more directly in global markets, weakening the control of traditional trade hubs and promoting a more equitable, multi-point connected network structure [36], thereby enhancing the host country’s overall trade network status. Therefore, we propose Hypothesis 2.
H2.
China’s OFDI has significantly reduced the exposure of its industrial chains to external risks by enhancing the status of countries along the Belt and Road Initiative in regional trade networks.
2.2.2. Rationalization of the Host Country’s Industrial Structure
The industrial structures of developing countries are often inflexible, leaving them ill-equipped to absorb and adjust to external shocks, thereby making them more susceptible to significant losses [37]. China’s OFDI can help promote the rationalization of these countries’ industrial structures, aligning industrial development with their comparative advantages, enhancing resource allocation efficiency, and strengthening the overall economy’s resilience to risks. First, China’s investments are not scattered indiscriminately but are selectively directed toward specific industrial sectors in host countries where they possess comparative advantages or can develop competitive advantages [38]. This helps host country enterprises integrate more deeply into regional production networks and focus on areas that can generate higher value-added. The technology transfer and management knowledge spillovers accompanying investment have improved the production efficiency of host country firms [7]. Chinese firms increasing their local procurement of raw materials and components reduces the host country’s over-reliance on external supply chains and enhances supply chain stability [7]. This deep integration focused on specific segments not only optimizes the division of labor within individual industries but also drives the development of related supporting industries through upstream and downstream industrial linkages, forming a more complete local industrial ecosystem. Second, Chinese investment, particularly investment centered around core enterprises, can drive the aggregation of related enterprises in specific regions, forming industrial clusters [39]. Enterprises within clusters share infrastructure, labor pools, and expertise, enabling economies of scale and scope and effectively reducing spatial costs such as transportation and communication. Geographical proximity accelerates technological exchange, imitation, and innovation collaboration among enterprises, fostering a more vibrant and resilient industrial ecosystem [40]. Clusters inherently possess information-sharing mechanisms and a degree of risk-sharing, significantly reducing the vulnerability of individual enterprises to market fluctuations [41]. Finally, the advanced technology and management experience brought by Chinese investment often create a ‘creative destruction’ effect on the host country’s existing inefficient and outdated production capacity [42]. Inefficient enterprises are forced to exit or be integrated, and capital guides resources from low-productivity sectors to high-productivity sectors. This helps resolve the contradiction of ‘structural surplus’ and ‘structural shortage’ coexisting in the economy. The ultimate outcome is an overall improvement in industrial efficiency, with a rational gradient distribution forming within the industry from basic to high-end segments. This more optimized structure endows the industrial chain with stronger self-regulatory capabilities, enabling it to better absorb and respond to shocks from both the supply and demand sides. Therefore, we propose Hypothesis 3.
H3.
China’s OFDI has significantly reduced the exposure of its industrial chain to external risks by promoting the rationalization of the industrial structure of countries along the Belt and Road.
2.2.3. Host Country Industrial Linkage
China’s OFDI has deepened the connection between the two sides in the production network by improving the quality of production factors in the host country and expanding bilateral trade cycles, thereby systematically strengthening this connection. This close connection helps reduce external risks in the host country’s industrial chain. From the perspective of the supply side of Belt and Road Initiative host countries, China’s OFDI has brought capital, technology, and management experience [36], improving the host countries’ foundational conditions in areas such as technological innovation, infrastructure, and capital accumulation. Host countries have been able to take on the processing and manufacturing segments transferred from China, thereby enhancing the competitiveness of their labor-intensive industries [43]. Meanwhile, China focuses on high-value-added segments such as research and development and design. This vertical specialization based on comparative advantages [19] is the core of bilateral production linkages. China’s ‘Five Connectivities’ policy has reduced institutional barriers [44] and improved cross-border logistics [45]. This has supported Chinese enterprises in deeper integration into host country economies, further strengthening production linkages.
From the perspective of demand-side factors in host countries along the Belt and Road Initiative, Chinese enterprises often import a significant amount of machinery, equipment, and core components from China during the initial phase of establishing factories in host countries, directly increasing China’s exports of intermediate goods to host countries [46]. Chinese investment helps cultivate host countries’ recognition of Chinese brands and technologies, establishing a sustained and stable demand for Chinese equipment, technology, and services [7], thereby creating a virtuous cycle where investment drives trade. Some of the final products produced by host countries using Chinese investment are re-exported back to the Chinese market [47]. This allows China to focus more on the research, development, and export of intermediate goods, forming a division of labor model where ‘China exports intermediate goods—host countries process them and partially re-export them.’ The re-exported products are tested in the Chinese market, and the feedback prompts host countries to improve their production [48], making the production networks between the two sides more closely connected and efficient. Therefore, we propose Hypothesis 4.
H4.
China’s OFDI has reduced the exposure of host countries’ industrial chains to external risks by strengthening production linkages between China and host countries along the Belt and Road.
3. Models and Variables
3.1. Model Construction
3.1.1. Benchmark Regression Model
To examine the impact of Chinese OFDI on the external risk exposure of host countries’ industrial chains, this paper sets the benchmark model as follows:
Among these, , and represent country, industry, and year, respectively. and are used to measure the host country’s supply-side and demand-side supply chain exposure to external risks, with higher values indicating stronger supply chain risks. is the core explanatory variable, representing the level of foreign direct investment by country and year. is the control variable vector for this paper, and is the coefficient matrix for the control variables. , and are the year, country, and industry fixed effects; the reflects the extent to which China’s foreign direct investment affects the supply chain risk exposure of countries along the Belt and Road Initiative; is the random disturbance term.
3.1.2. Mediating Effect Model
To further elucidate how China’s OFDI affects the host country’s supply chain risk exposure, this study constructs a mechanism analysis model [26,28] and employs a two-step mediation effect model to conduct regression analysis on the aforementioned pathways. The two-step method was chosen primarily because it can more effectively test the existence of mediation effects and the integrity of the path. Its advantages include simultaneously testing direct and indirect effects to improve efficiency; directly testing the significance of indirect effects to address the insufficient testing power of the traditional three-step method, resulting in more reliable outcomes; and being suitable for the complex transmission mechanism analysis in this study. The regression model is specifically as follows:
Among them, M represents the mediating variables, namely the host country’s trade network status (MCD), the host country’s industrial structure rationalisation (TL), and the host country’s industrial linkages (Forward & Backward). The definitions of other variables remain unchanged.
3.2. Variable Selection
3.2.1. Dependent Variable
The explanatory variable of this paper is the EERIC. On the basis of fully stripping away the cascading relationship between domestic and international production linkages in the industrial chain network structure, a measurement method is constructed to effectively identify a country’s (region’s) EERIC and its structure. When the market clears, there is a constant relationship between total output, intermediate use and final use as follows:
Equation (6) can be simplified as . where is the matrix of direct consumption coefficients, the elements of which represent the share of intermediate goods supplied by the country to the country as a proportion of the country’s total inputs; is the Leontief inverse matrix; and the elements of which represent the full demand on the country for an additional unit of end-use by the country, and which portrays the degree of direct and indirect linkage of the industrial chain in the transnational production process.
Following the logic of the ‘shock method’ proposed by [18], and are considered as endogenous variables and are obtained by full differentiation of the equation: .
The following is an example of a two-sector model for both countries, which introduces the basic connotations of the chain’s exposure to foreign risk, expanded into matrix form as follows. Specifically, the change in the home country’s gross output induced by the change in foreign net output is:
In this case, the boxed portion captures the corresponding change in the gross output of the country industry when the net output of the country industry changes . This establishes the external exposure of the chain, i.e., the impact on the gross output of other countries when one country in the global chain is hit by a shock that leads to a change in net output. Further, the existence of both supply and demand types in the global input-output table implies that there is a distinction between supply-side and demand-side chain external exposures; where supply-side chain external exposures are caused by supply dependence in the chain resulting from a country’s sales of intermediate goods to other countries to complete social reproduction, while demand-side chain external exposures are caused by a country’s purchases of intermediate goods from other countries to complete social reproduction. The external risk exposure of the demand-side chain is caused by the demand dependence of the chain formed by a country’s purchase of intermediate goods from other countries to complete social reproduction [18].
In fact, the international industrial chain can be divided into a simple international industrial chain and a complex international industrial chain based on the number of cross-border intermediates, and the potential systemic risks faced by the two types of international industrial chains are quite different [19]. Next, this paper expands the external risk exposure measurement method of the industry chain proposed by [18] in the following two aspects: firstly, the part involved in the production of the international industry chain is stripped out from the structure of the global industry chain network, so as to facilitate the direct application of the matrix operation to solve the external risk exposure of the industry chain; secondly, the international industry chain is decomposed into a simple international industry chain and a complex international industry chain according to the number of times of cross-border intermediates, and a simple international industry chain and a complex international industry chain are constructed for each country, respectively. The second is to decompose the international industry chain into a simple international industry chain and a complex international industry chain according to the number of cross-border intermediate goods and construct the measurement methods of a country’s external risk exposure of the simple industry chain and the complex industry chain, respectively, so as to explain the structural characteristics of a country’s industrial chain’s external risk exposure in depth.
- (1)
- Decomposition method of global industry chain structure
Further, since the Leontief inverse matrix covers both direct and indirect links of the chain, let , then the Leontief inverse matrix can be decomposed as:
where and denote the block matrix of purely domestic chain production and the block matrix of purely international chain production in the direct linkage of the chain, respectively. Noting , , and substituting Equation (8) into Equation (6) yields:
In this case, represents international chain production, represents simple international chain production and represents complex international chain production. In addition, the specific meanings of the decomposition terms are as follows: pure domestic chain production depicts a production process that is carried out and completed exclusively within a country, with no cross-border production of intermediate goods. Simple international chain production depicts a production process in which there is at least one production of intermediates and one cross-border production, i.e., a country’s intermediates are used directly by its trading partners to produce final goods, reflecting a ‘short-chained’ direct production process. Complex international chain production portrays a production process with at least two intermediate and one cross-border production, i.e., a country’s intermediate goods are processed and produced in its trading partner country and then exported to other partner countries for the production of final goods, which reflects a ‘long-chained’ round-trip production process. In the decomposition term above, the cross-border movement of intermediates is a source of a country’s external exposure to the chain, as both simple and complex chain production involve intermediates.
- (2)
- Methodology for measuring the chain’s external risk exposure and its structure
From the supply side, when the country industry is hit by a shock that changes net output, the impact on the country industry total output (the supply-side chain’s exposure to external risk) is:
Following the same logic, the external risk exposure of the supply-side chain at the bilateral level of the country, and the external risk exposure of the supply-side chain at the level of the country as a whole are expressed as follows:
From the demand side, change in the amount of intermediate inputs purchased from and used by the country industry (the demand-side chain’s exposure to external risk) is when the country industry is hit by a shock that changes its net output:
Following the same logic, the external risk exposure of the demand-side chain at the bilateral level of the country, and the external risk exposure of the demand-side chain at the level of the country as a whole are expressed as:
3.2.2. Core Explanatory Variables
The core explanatory variable is China’s OFDI. By combining China’s capital elements with the host country’s endowment advantages through OFDI, China can optimize resource allocation globally while reducing the risk exposure of both China and the host country in the global division of labour [49,50]. This paper uses the stock of OFDI in the model to measure the intensity of China’s OFDI.
3.2.3. Control Variables
To control for the impact of other factors on the host country’s external risk exposure in the industrial chain, this paper draws on existing research [17,51] and selects the following control variables:
(1) Host country import dependency (imp) is measured by the ratio of each country’s imports of goods and services to its GDP. This indicator reflects the host country’s economic dependence on international markets, particularly its reliance on imports of key intermediate goods and raw materials. A high import dependency means that supply chains are more vulnerable to disruptions in international trade, which may significantly increase supply-side risk exposure. At the same time, however, diversified import sources may also help to spread risk.
(2) The host country’s export dependency ratio (exp) is measured by the ratio of the value of exports of goods and services to GDP. This indicator measures the host country’s economic dependence on international markets, particularly the reliance of its final products on overseas demand. A higher export dependency ratio means that the demand side is more susceptible to global economic fluctuations and a decline in demand from major export markets, potentially significantly increasing demand-side risk exposure; however, export market diversification can also provide some risk buffering.
(3) Host country capital intensity (cap) is measured using per capita capital stock across countries and industries. This indicator reflects the intensity of capital inputs relative to labor inputs in the production process. Capital-intensive industries typically have higher entry barriers and technical complexity, with supply chains that may be more stable but incur higher adjustment costs; however, they may also face supply disruption risks due to their reliance on specific expensive equipment. Labor-intensive industries, on the other hand, may be more flexible but are more susceptible to cost fluctuations and low-end lock-in effects. Controlling for capital intensity at the industry level helps capture the inherent risk characteristics of industries with different factor endowment structures, thereby avoiding confusion in the impact of industrial structure differences on OFDI outcomes.
(4) Host country labor force quality (hum) is measured by the proportion of students enrolled in regular higher education institutions relative to the total population at the end of the year in each region. This indicator serves as a proxy for human capital stock, reflecting the average educational attainment and skill potential of the labor force. High-quality labor is a key factor in technology absorption, innovation, and industrial upgrading, effectively enhancing domestic supply chain capabilities and resilience to external shocks, thereby potentially reducing the EERIC. Conversely, low-skilled labor may constrain industrial upgrading and risk resilience. Controlling labor quality helps isolate the impact of the host country’s own human resource endowments on supply chain resilience, focusing instead on the exogenous effects of OFDI, such as technology spillovers and management experience improvements.
(5) The host country’s level of independent innovation (tech) is measured by the ratio of the value of technology market contract transactions to GDP across countries. This indicator reflects the level of activity in the host country’s domestic technology R&D, conversion, and commercialization. A higher level of independent innovation capability implies stronger technological self-sufficiency and control over key links in the industrial chain, which can effectively reduce vulnerability to external technology supply disruptions and may create new market demand; conversely, it may deepen technological dependence. Controlling the level of independent innovation helps eliminate the systemic impact of differences in the host country’s intrinsic innovation capabilities on supply chain risk exposure, thereby enabling a purer identification of the contribution of OFDI to reducing EERIC through channels such as technology transfer.
(6) The host country’s level of trade openness (open) is measured by the ratio of total imports and exports to GDP. This indicator comprehensively reflects the breadth and depth of a country’s participation in international trade. A high level of trade openness means deeper integration into the global division of labor network, which in theory may increase external risk exposure on both the supply and demand sides. On the other hand, the competitive effects, knowledge spillovers, and market diversification brought about by openness may also enhance industrial efficiency and resilience.
3.3. Data Sources
This paper collects and processes data from 35 industries across 41 economies along the BRI route from 2007 to 2023 (This article selects the following list of 41 “Belt and Road Initiative” countries: Austria, Bulgaria, China, Cyprus, the Czech Republic, Estonia, Greece, Croatia, Hungary, Indonesia, India, Italy, South Korea, Lithuania, Luxembourg, Latvia, Malta, Poland, Portugal, Romania, Russia, Slovakia, Slovenia, Turkey, Bangladesh, Malaysia, the Philippines, Thailand, Vietnam, Kazakhstan, Mongolia, Sri Lanka, Pakistan, Laos, Brunei, Bhutan, Kyrgyzstan, Cambodia, Maldives, Nepal, Singapore. Source: China “Belt and Road” Network (https://www.yidaiyilu.gov.cn/, accessed on 3 July 2025)). The sample selection is based on the complete coverage of the multi-regional input-output table of the Asian Development Bank (ADB-MRIOD) and the continuity of the country-specific data in the China Foreign Direct Investment Statistical Bulletin. After industry classification, aggregation, price index deflation, and calculation, it obtains relatively comprehensive country-industry-level industrial chain data. The data used for the industrial chain’s external risk exposure comes from the ADB-MRIOD. China’s outbound direct investment data is sourced from the ‘China Outbound Direct Investment Statistical Bulletin.’ Control variables are drawn from the World Bank’s ‘World Development Indicators (WDI)’ database, the Heritage Foundation, and other sources. This study excludes samples with missing values during the research period and applies tail trimming to the 1% and 99% percentiles of each variable to mitigate the impact of extreme or outlier values on the research results.
4. Analysis of the Characteristics of External Risk Exposure in the Industrial Chains of BRI Countries
4.1. Overall Feature Analysis
As shown in Figure 1, first, there are significant differences in the patterns of participation in international division of labour among countries as suppliers. Most ‘Belt and Road’ countries face external risks primarily from simple supply chains with fewer links when providing products and services. China and South Korea, however, are different. When acting as suppliers, they face external risks primarily from complex supply chains with multiple links and longer chains. This indicates that when China and South Korea participate in global division of labour, their production processes typically involve more links and longer chains, while most Belt and Road countries tend to engage in direct production with fewer links. This is likely because China has a comprehensive industrial layout, while South Korea focuses on high-tech industries, and both countries have entered the stage of advanced industrialization. In contrast, many Belt and Road countries are still in the early stages of industrialization and lack the capacity for deep processing, making it difficult for their industrial chains to extend into more complex links. Second, the patterns of participation in international division of labour as buyers are similar across countries. Whether it is China or most ‘Belt and Road’ countries, when purchasing products and services, the external risks they face primarily stem from simple supply chains with fewer stages. This indicates that both China and these countries prefer shorter, more direct supply chain models in the procurement phase. The reason may lie in the diverse demands of their vast domestic markets, which require supply chains to respond quickly, and reducing intermediate stages helps improve efficiency. Additionally, the overseas demand of Belt and Road countries is often dispersed, and this dispersion makes establishing long-chain division of labour inefficient in terms of scale, while directly connecting to final demand is more cost-effective. Third, the trends in risk exposure are different. From a developmental perspective, most Belt and Road countries, whether as suppliers or buyers, face expanding external risks in their industrial chains, and the risks for suppliers are growing faster. In contrast, both suppliers and buyers in China are seeing a decline in external supply chain risks. Fourth, there are significant disparities in the magnitude of risk exposure among countries, and there is a mismatch between the risks faced by suppliers and buyers. The five countries with the highest external risks as suppliers are Luxembourg, Singapore, Brunei, Malta, and Malaysia, with risk levels 4.1 to 6.2 times higher than China’s. The five countries with the lowest risk are: Pakistan, Bangladesh, Nepal, Sri Lanka, and India, with risk levels ranging from 0.45 to 1.04 times that of China. The five countries with the highest external risks as buyers are: Malta, Luxembourg, Vietnam, Slovakia, and Hungary, with risk levels ranging from 3.8 to 4.7 times that of China. The five countries with the lowest risk are: Russia, Bangladesh, Italy, Pakistan, and Kazakhstan, with risk levels ranging from 1.2 to 1.8 times that of China. The above two points indicate that the primary source of supply chain risks for countries stems from direct international trade links and that there are significant disparities in the risk levels faced by different countries. Additionally, countries exhibit imbalances in their supply and demand capabilities within the international division of labour, meaning that a country may excel in product supply but face higher risks in the procurement process (See Appendix A).
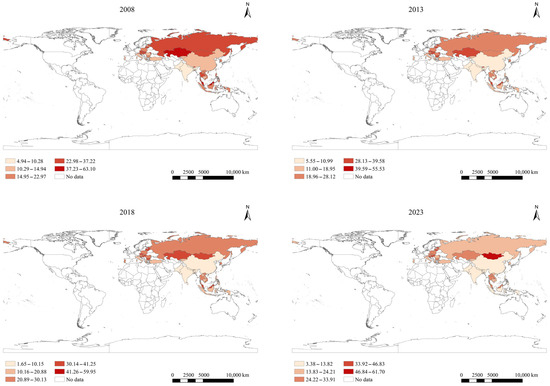
Figure 1.
Trends and Distribution of External Risk Exposure of Industrial Chains in BRI Countries (Supply Side) from 2008 to 2023.
4.2. Industry Characteristics Analysis
Furthermore, among the five countries with the largest external risk exposures in the supply-side and demand-side industrial chains, potential systemic risks in the industrial chain are primarily concentrated in the manufacturing sector, particularly capital-intensive and knowledge-intensive manufacturing, and these risks primarily arise from direct international industrial chain linkages. Specifically: on the one hand, among the top three industries with the highest supply-side supply chain external risk exposure in each country, capital-intensive and technology-intensive manufacturing industries accounted for 40.65% and 21.14%, respectively; and among the five countries—Malta, Luxembourg, Singapore, Brunei, and Malaysia—with the highest overall supply-side supply chain external risk exposure, the industries with the highest risk exposure were coke, refined petroleum, and nuclear fuel (C08), rubber and plastics (C10), water and land transport (C24), chemicals and chemical products (C09), and rubber and plastics (C10). Except for water and land transport, all these industries belong to capital-intensive and knowledge-intensive manufacturing. On the other hand, among the top three industries with the highest external risk exposure in the demand-side industrial chains of various countries, capital-intensive and knowledge-intensive manufacturing industries accounted for 47.97% and 31.71%, respectively; Furthermore, the five countries with the largest external risk exposure in their demand-side comprehensive supply chains are Malta, Luxembourg, Vietnam, Slovakia, and Hungary, with the top industries being coke, refined petroleum, and nuclear fuel (C08), basic metals and processed metals (C12), electrical and optical equipment (C14), electrical and optical equipment (C14), electrical and optical equipment (C14). These industries primarily belong to capital-intensive and knowledge-intensive manufacturing. Therefore, reducing the potential systemic risks in the supply chains of manufacturing, especially capital-intensive and knowledge-intensive manufacturing, is of utmost importance for ensuring the safe and stable development of the supply chain.
5. Results
5.1. Benchmark Regression
Table 1 presents the regression results of China’s OFDI on the host country’s external risk exposure in the industrial chain. The dependent variables in columns (1) to (3) are supply-side risk exposures, while those in columns (4) to (6) are demand-side risk exposures. Each column progressively controls for industry, year, and host country-level fixed effects. The results indicate that the regression coefficients for OFDI are significantly negative at the 1% or 5% level, suggesting that Chinese OFDI can reduce host country supply chain external risk exposure from both the supply side and the demand side. This confirms Hypothesis 1.

Table 1.
Regression results of China’s OFDI on the external risk exposure of the industrial chain.
From the supply side perspective, the technological spillover and capacity synergy effects of OFDI can drive technological upgrading of the host country’s industrial chain and enhance the standardization and stability of production processes. The combination of technological cooperation and human capital optimization reduces fluctuations caused by technological defects or supply chain disruptions [52], while the development of digital logistics systems further compresses the cross-border circulation time of intermediate goods, offsetting the supply uncertainties that may arise from trade liberalization [53]. From the demand side, OFDI enhances host countries’ agile response capabilities to global demand changes through data-driven market insights and flexible production capacity. Cross-border e-commerce platforms and industrial internet systems help host country enterprises dynamically adjust production plans, reducing the risk of capacity mismatch caused by misjudgments of demand [12], while diversified supplier networks reduce reliance on a single market. This two-way effect is particularly pronounced in the manufacturing and infrastructure sectors. Chinese investment, by building regionalised supply chain ecosystems, reduces reliance on imported intermediate goods while achieving precise supply-demand matching. This provides host countries with risk mitigation mechanisms for integrating into global value chains and offers practical pathways for co-building more resilient international industrial chains.
5.2. Robustness Tests
This paper adopts four ways to conduct robustness tests: first, replacing the measure of the explanatory variables, adopting forward (GVCpt_f) and backward (GVCpt_b) value chain participation as a proxy for supply-side and demand-side outward risk exposure [54], and re-performing the regression test; second, replacing the measure of the explanatory variables, and According to the data of calculating China’s OFDI stock [55], the regression test is re-conducted (Table 2); Thirdly, considering that the capital flow and information transmission of China’s OFDI need a certain period, its effect on the host country’s industry chain’s external risk exposure may have a certain lag. Therefore, the interference caused by the time lag effect is excluded by including the core explanatory variables in the model with a one-period lag before conducting the regression analysis. Fourth, cluster regression analyses were conducted at the year-industry and year-host country levels. The results of the above regressions are shown in Table 3, which shows that the regression coefficients of the explanatory variables are all significantly negative, indicating that the benchmark regression is robust.
Table 2.
Robustness Test.
Table 3.
Robustness Test.
5.3. Endogeneity Test
In order to mitigate endogeneity problems that may arise due to factors such as omitted variables, first, regressions are constructed using instrumental variables borrowed from [56] using the Bartik method. Specifically, the product of China’s investment stock in 2003 (initial share) and the growth rate of China’s total OFDI (common shock) is used to simulate an estimate of China’s OFDI stock to the countries along the route over the years. In terms of instrumental variable correlation, the Bartik estimates are highly correlated with the actual values; in terms of irrelevance, the growth rate of China’s total OFDI is affected by exogenous factors such as China’s domestic economic conditions, and the estimates are not correlated with the residual terms, which meets the requirement of exogeneity of instrumental variables. Secondly, the degree of rule of law indicators and corruption control indicators of each country are selected as instrumental variables of China’s OFDI stock. The host country’s rule of law level and corruption control ability are the core dimensions of measuring its business environment, which directly affect the scale and structure of foreign capital inflows. Studies have shown that a sound rule of law environment reduces the institutional costs of business operations, while effective corruption governance reduces rent-seeking behavior and enhances investment transparency [57]. Such environmental characteristics are significantly attractive to MNEs’ location choices, and China’s OFDI also shows a preference for investment in countries with high rule of law and low corruption. The rule of law and corruption indicators mainly reflect the domestic governance capacity of the host country, and their scope of action is focused on domestic economic activities rather than direct intervention in exogenous policy instruments such as international bilateral trade or investment agreements. Specifically, regression analyses were conducted using the two-stage least squares method, and the results are shown in Table 4.
Table 4.
Endogeneity test.
The instrumental variables in columns (1)–(2) and (3)–(4) of Table 4 are the degree of rule of law in the host country and the control of corruption in the host country, respectively, and columns (5)–(6) are the regression results of the constructed Bartik instrumental variables, which show that the model passes the test of non-identifiability and the test of weak instrumental variables, which illustrates the validity of the selection of the above instrumental variables. The second-stage regression results show that the regression coefficients of OFDI are both significantly negative at the 5% and 1% levels, i.e., China’s OFDI is able to reduce the industry chain’s exposure to external risks from the supply side and the demand side, which can be seen in that the results of the benchmark regression are still valid after controlling the possible endogeneity problems.
5.4. Heterogeneity Analysis
5.4.1. Industrial Heterogeneity
Drawing on the classification of industries based on factor intensity proposed by [58], the industrial chains of Belt and Road Initiative host countries are categorized into three types: labor-intensive, capital-intensive, and technology-intensive. This analysis examines the differentiated impact of China’s OFDI on the risk exposure of these various industrial chains. The specific estimation results are shown in Table 5. China’s OFDI reduces the external risk exposure of capital-intensive industrial chains but increases that of labor-intensive industrial chains. The impact on technology-intensive industrial chains is not significant. Possible reasons include: On the one hand, labor-intensive industries rely on low-skilled labor and imported intermediate goods. China’s OFDI may exacerbate dependence on international supply chains by expanding production capacity, leading to insufficient improvements in domestic supply-side capabilities [59]. Meanwhile, the demand side is increasingly affected by fluctuations in the international fast fashion market, exacerbating export dependence and vulnerability [60]. On the other hand, China’s OFDI can enhance domestic intermediate goods supply capacity through technology transfer, thereby reducing import dependence. Technology spillover effects are more pronounced in capital-intensive industrial chains. While the demand side is susceptible to fluctuations in commodity prices, OFDI partially offsets risks through regional market integration via platforms like the China-Europe Railway Express [61]. Although China’s OFDI contributes to enhancing trade openness, the impact of technological variables is weak, indicating that the host country’s weak technological foundation constrains the technology spillover effects of OFDI. Therefore, China’s OFDI cannot effectively reduce the external risk exposure of technology-intensive industrial chains.
Table 5.
Heterogeneity test.
5.4.2. Heterogeneity of Innovation Capabilities
Generally speaking, countries and regions with stronger innovation capabilities tend to have higher technology absorption capacity and domestic R&D levels, enabling them to more efficiently absorb the technological spillovers from China’s OFDI and convert them into supply chain resilience, thereby reducing the risk exposure caused by external shocks. Conversely, countries with weaker innovation capabilities may amplify risk exposure due to lagging technology conversion and inadequate industrial support, potentially exacerbating reliance on external supply chains. This paper uses the Global Innovation Index (GII) from the World Intellectual Property Organization (WIPO) to classify ‘Belt and Road’ host countries into high-innovation and low-innovation countries and examine the differentiated impact of China’s OFDI on the supply chain risk exposure of the two types of countries. The regression results, as shown in Table 6, indicate that China’s direct investment in high-innovation countries significantly reduces bilateral risk exposure. This may be because high-innovation countries possess strong technological absorption capabilities, and China’s OFDI reduces bilateral external dependence on the industrial chain through technological synergy effects and innovation chain integration [62]. However, China’s direct investment in low-innovation countries exacerbates supply-side risks, while the demand-side effect fails to materialize. On the supply side, the coefficient of China’s outward direct investment is unusually positive, indicating that the host country’s technological shortcomings lead to China’s outward direct investment relying on imported equipment, thereby reinforcing the risk of external supply of intermediate goods. On the demand side, the impact of outward direct investment is not significant, reflecting that low-skilled labor is unable to meet technology-intensive demand. Low-innovation countries are constrained by technology absorption bottlenecks and rigid factor structures, making Chinese investment prone to ‘low-end lock-in’ [63]. On the supply side, increased technology dependence exacerbates import vulnerabilities, while on the demand side, low market innovation makes it difficult to offset external shocks.
Table 6.
Heterogeneity test.
5.4.3. Heterogeneity in Economic Development Levels
This paper categorizes countries along the Belt and Road Initiative into developed and developing nations to examine the differentiated impact of China’s OFDI on the supply chain risk exposure of these two types of countries. The regression results, as shown in Table 7, indicate that for developed countries, the effect of China’s OFDI on their supply chain risk exposure is not significant. This may be because developed countries already possess well-established industrial chain systems, mature institutional environments, and strong risk-resilience capabilities. Their industrial chain risk exposure is primarily driven by internal governance mechanisms rather than external investment [64]. Additionally, developed countries’ ‘path dependence’ in high-tech sectors may weaken the technology spillover effects of China’s OFDI, making its risk mitigation role difficult to manifest. In contrast, the impact of China’s OFDI on developing countries’ supply chain external risk exposure is significantly negative at the 1% significance level. This may be because developing countries’ supply chains are in an upgrading phase, and China’s OFDI mitigates risks on both sides through infrastructure-industry linkage and technology ladder embedding. However, caution is needed to avoid falling into a capital dependency trap.
Table 7.
Heterogeneity test.
6. Impact Mechanism Testing
6.1. Enhancing the Host Country’s Trade Network Status
Highly central countries can select optimal partners and establish trade links with countries at the high end of the value chain, which helps to enhance their trade network status. Therefore, based on an analysis of the value-added trade network characteristics of Belt and Road countries, we use degree centrality as an alternative indicator of host country trade network status (TNS) to accurately reflect the status of Belt and Road countries in the trade network. The regression results are shown in Table 8. Column (1) has a significantly positive regression coefficient, while columns (2) and (3) have significantly negative regression coefficients. This indicates that China’s outbound direct investment can enhance the host country’s trade network status, thereby reducing the supply chain risk exposure of various countries. This finding suggests that China’s OFDI deepens the host country’s integration into the global value chain, expands the breadth and weight of its trade partner connections, and directly enhances its trade network centrality. This process enables the host country to transition from a passive participant to a hub node role, laying a structural foundation for its risk resilience.
Table 8.
Mechanism test.
6.2. Promoting the Rationalization of the Host Country’s Industrial Structure
The theoretical analysis in the preceding section indicates that chain-based investment driven by comparative advantage enables host countries to integrate into key nodes of regional production chains. Technological spillovers and the localization of intermediate goods procurement simultaneously enhance production efficiency and reduce external dependence. Cluster-based enterprises led by anchor enterprises reduce spatial friction costs through economies of scale and scope, while the introduction of efficient production capacity forces inefficient segments to exit the market. This process promotes the rationalization of industrial structures across countries and thereby exerts a positive influence on supply chain risk exposure. To test whether China’s outbound direct investment can reduce supply chain risk exposure by promoting the rationalization of host countries’ industrial structures, this paper uses the Theil index to measure the rationalization level of industrial structures across countries, with the index being a negative indicator. The regression results are shown in Table 9. It can be observed that the regression result in Column (1) is significantly negative, while the regression coefficients in Columns (2) and (3) are significantly positive. This indicates that China’s outbound direct investment can promote the rationalization of host countries’ industrial structures, thereby reducing the supply chain risk exposure of various countries. This finding suggests that China’s OFDI breaks the rigidity of the host country’s existing industrial structure and guides production factors toward high-value-added segments. This process facilitates the transformation of the industrial system from an inefficient and dispersed structure to a flexible framework characterized by “specialized division of labor—cluster collaboration—graded upgrading,” laying a structural foundation for risk mitigation.
Table 9.
Mechanism test.
6.3. Strengthening Host Country Industrial Linkages
China’s OFDI not only deeply embeds itself in the host country’s economic system through cross-border industrial chains, but the industrial linkage effects it generates may also become an important transmission channel influencing the host country’s risk exposure. Leontief’s industrial linkage theory posits that industries establish upstream and downstream linkages through product or technology, service elements, etc., forming supply chains. In the context of transnational division of labor, such upstream and downstream linkages are more evident in the changes in demand triggered by input-output relationships during the circulation of intermediate goods in transnational division of labor. To measure the degree of industrial interdependence among countries and sectors, influence coefficients and sensitivity coefficients are introduced to quantify forward and backward linkages, respectively, with the calculation methods shown in Equations (16) and (17):
The element in row i and column j of the direct consumption coefficient represents the forward linkage effect, which indicates the pull effect of an increase in one unit of final consumption in a particular sector on other sectors. The larger the value, the greater the pull effect of that sector’s development on the development of other sectors. The backward linkage effect represents the change in demand for a particular sector driven by an increase in one unit of final consumption across all economic sectors. The larger the value, the greater the supportive effect of that sector’s development on the development of other sectors. The industrial linkage mechanism of China’s OFDI on host country risk exposure is shown in Table 10. The direct impact coefficients of OFDI on forward and backward linkages are 0.0523 and 0.0519, respectively, and both are significant at the 1% significance level, indicating that China’s OFDI significantly strengthens the tightness of the host country’s upstream and downstream industrial linkage network. The primary mechanisms through which China’s OFDI influences host country supply chain risk exposure via industrial linkages are as follows: leading industries achieve technological synergy and supply chain fragmentation through OFDI technology exports and platform empowerment, optimize production processes in host country high-end manufacturing segments via industrial internet platforms, and integrate host country small and medium-sized suppliers into global fragmented production networks. The standard output and digital infrastructure of OFDI in foundational industries can drive a leap in intermediate goods quality, shorten cross-border circulation times for intermediate goods, further eliminate trade barriers, and provide support for countries to more deeply integrate into global industrial chain division of labor segments.
Table 10.
Mechanism test.
7. Conclusions
7.1. Conclusions
This study is based on cross-border input-output table data from 41 countries along the BRI route from 2007 to 2023. It explores how China’s OFDI reduces the external risk exposure of BRI countries’ industrial chains by promoting the improvement of host countries’ trade network status, promoting the rationalization of industrial structures, and strengthening production linkages between the two countries. The study employs econometric methods such as fixed-effects models and two-step mediation models to comprehensively reveal the mechanisms and pathways through which China’s OFDI influences the supply chain risk exposure of countries along the Belt and Road Initiative. The results reveal that:
1. Feature analysis reveals that for most BRI countries acting as product/service suppliers, external supply chain risks primarily stem from simple supply chains with few links, which is linked to their early stage of industrialization and insufficient deep processing capabilities. In contrast, China and South Korea face risks primarily from complex supply chains with numerous links and lengthy chains, reflecting the completeness of their industrial or technology-intensive characteristics. Whether as buyers or suppliers, both China and most Belt and Road Initiative countries face external supply chain risks primarily stemming from simple supply chains, indicating a preference for more direct ‘short-chain’ models in procurement. This stems from China’s massive, multi-tiered domestic demand requiring rapid supply chain responsiveness, as well as the fragmented overseas demand of Belt and Road Initiative countries weakening the scale effects of long-chain specialization. External supply chain risks on both the supply and demand sides in most ‘Belt and Road’ countries are expanding, with supply-side risks growing faster. In contrast, China’s bilateral risk exposure is declining. The risks in the industrial chains of various countries primarily stem from direct international trade links, and the risk levels vary significantly. The risk levels of countries with the highest supply-side risks are several times higher than China’s, while those with the lowest risks are below or close to China’s level. The distribution of demand-side risks is equally disparate. Notably, the overlap in risk rankings between countries acting as suppliers and as buyers is low, indicating an imbalance between their supply capabilities and demand capabilities in the international division of labor.
2. Our findings indicate that China’s OFDI plays a significant role in mitigating the external risk exposure for both the supply and demand sides of industrial chains in Belt and Road countries. This risk reduction effect is mainly achieved through three core paths: enhancing the host country’s position in the regional trade network, promoting the rationalization of the host country’s industrial structure, and strengthening the industrial linkages between China and the host country. This conclusion indicates that China’s OFDI is not merely capital outflow but rather a systematic restructuring of the regional industrial chain ecosystem, effectively enhancing the risk resilience of Belt and Road countries in the face of external shocks and providing empirical evidence for building a more resilient international industrial chain system.
3. Heterogeneity analysis reveals that China’s OFDI significantly reduces the risk exposure of capital-intensive industries but increases that of labor-intensive industries, with no significant impact on technology-intensive industries. This indicates that the risk mitigation effects of OFDI exhibit significant industry-specific structural differences. From the perspective of innovation capabilities, OFDI significantly reduces bilateral supply chain risks in high-innovation countries but may exacerbate supply-side risks in low-innovation countries while having no significant demand-side effects. This highlights the critical role of host countries’ technological absorption capacity. From the perspective of development levels, OFDI significantly reduces the bilateral supply chain risk exposure of developing countries but has no significant impact on developed countries. This reflects the endogenous risk-adjusting capacity of developed countries’ mature supply chain systems and the differences in their interaction patterns with Chinese investment.
7.2. Policy Recommendations
Based on the above research findings, this paper proposes the following policy recommendations:
1. Strengthen the construction of regional industrial chain resilience networks, focusing on key nodes and institutional coordination. In response to the findings that risk exposures are highly concentrated in capital- and technology-intensive manufacturing sectors and that these sectors rely heavily on direct trade links, priority should be given to establishing regional backup production centers for specific key intermediate or final products in hub countries with a solid industrial foundation and strategic geographical location. These centers should be led by leading Chinese enterprises in collaboration with local governments and businesses. Embed the specific requirements of ‘trade facilitation’ and ‘financial connectivity’ into the provisions of bilateral investment agreements (BITs) and free trade agreements (FTAs) signed between China and host countries. Address the friction costs arising from institutional differences highlighted in the study and systematically reduce institutional barriers to cross-border industrial chain cooperation. To address the potential expansion of risk exposure in labor-intensive industries, encourage and fund leading Chinese enterprises to establish joint technical training centers or industrial innovation workshops in host countries. This not only enhances local labor skills but, more importantly, cultivates the technical capabilities and quality stability of local small and medium-sized supporting enterprises, reducing over-reliance on imported intermediate goods and single technologies and alleviating supply-side vulnerabilities at their source.
2. Implement a mandatory mechanism for ‘technology localization binding’ and value chain upgrading. Addressing the challenges revealed in research, such as the limited impact of OFDI on technology-intensive industries and the risk of low-innovation countries falling into a ‘low-end lock-in’ trap, major investment projects must allocate a certain proportion of funds to be mandatorily invested in local R&D centers, technology incubators, or vocational training institutions in the host country. Guide OFDI to transition from single-project initiatives toward cluster-based and ecosystem-driven development. In key countries, governments or Chinese business associations should take the lead in jointly building shared industrial platforms, providing standardized factories, common technology service platforms, centralized procurement and logistics, and small and medium-sized enterprise incubators to attract supporting enterprises to cluster, forming industrial clusters with economies of scale and internal synergy capabilities. This will reduce individual enterprises’ spatial costs and information barriers while enhancing overall risk resilience. In labor-intensive sectors such as textiles and electronics assembly, link Chinese investment incentives to verifiable metrics for improving the skills of host country employees. For countries with weak digital infrastructure and insufficient market diversification, collaborate with international institutions or Chinese e-commerce giants to establish cross-border e-commerce platforms and digital supply chain management systems compliant with local regulations. Prioritize assisting local SMEs in directly accessing China’s and the global diversified consumer markets, reducing reliance on traditional intermediaries and single export markets.
3. Implement a dynamic, differentiated investment strategy based on precise profiling. Fully respect the significant heterogeneity effects revealed by research on country types and industry characteristics and abandon a ‘one-size-fits-all’ investment model. For developing and low-innovation countries, establish a database for assessing host country industrial chain risks and capabilities. Link the progress of fund disbursement and the extent of preferential treatment directly to quantifiable indicators of improvements in the host country’s business environment, creating a mechanism to drive improvements in the investment environment. For high-innovation and developed countries, reduce traditional capacity investments and increase investments in joint laboratories and green technology innovation. Encourage Chinese R&D centers to deeply integrate into local universities, research institutions, and industrial alliances, participate in standard-setting; and achieve technological symbiosis and risk-sharing. At the same time, based on real-time monitoring data, classify host countries and key industries into high-risk, medium-risk, and low-risk categories for early warning. For high-risk countries, trigger supply chain security reviews, requiring Chinese enterprises to develop detailed contingency plans and cautiously assess new investments. For low-risk countries, increase technical collaboration investments and policy support, encouraging deeper cooperation to establish them as demonstration nodes for regional industrial chain resilience. Establish an ‘industrial chain risk buffer fund’ to provide risk compensation or financing support to Chinese enterprises that have actively pursued localization and diversification efforts in medium-risk regions and achieved results.
Author Contributions
Conceptualization, L.Z. and J.J.; methodology, J.J.; software, X.C.; validation, L.Z., J.J. and X.C.; formal analysis, J.J.; investigation, L.Z.; resources, X.C.; data curation, X.C.; writing—original draft preparation, J.J.; writing—review and editing, L.Z.; visualization, J.J.; supervision, L.Z.; project administration, X.C.; funding acquisition, L.Z. All authors have read and agreed to the published version of the manuscript.
Funding
This research was funded by the General Project of Philosophy and Social Sciences in Guangxi: “Research on the Integrated Mechanism and Pathway for Enhancing the Resilience of China’s Industrial Chain under the ‘Digital Economy’ Context and the Promotion of the ‘Belt and Road’ Initiative” (23BYJ002); National Natural Science Foundation of China-funded project: “Research on the Mechanism of Digitalization and Greenization Coordinating to Drive the Upgrading of the Manufacturing Industry Value Chain” (72564014); the General Project of Philosophy and Social Sciences in Guangxi: “Research on the Mechanism and Implementation Path of the Western Land-Sea New Channel in Promoting Cross-Regional and Cross-border Synergy of the Industrial Chain in Guangxi” (22FJL011); the General Project of Philosophy and Social Sciences in Guangxi: “Research on the Impact Measurement and Policy Choices of the Regional Comprehensive Economic Partnership Agreement (RCEP) on the Marine Economy of the Beibu Gulf” (21FYJ053); and National Natural Science Foundation of China-funded project (7246040333).
Institutional Review Board Statement
Not applicable.
Informed Consent Statement
Not applicable.
Data Availability Statement
Data will be made available upon reasonable request.
Conflicts of Interest
The authors declare no conflicts of interest.
Appendix A
Table A1.
Calculation results of China’s external risk exposure in the industrial chain with host countries.
Table A1.
Calculation results of China’s external risk exposure in the industrial chain with host countries.
| Country | Average Value of External Risk Exposure Samples in the Supply-Side Industrial Chain | Average Value of External Risk Exposure Samples in the Demand-Side Industrial Chain | Country | Average Value of External Risk Exposure Samples in the Supply-Side Industrial Chain | Average Value of External Risk Exposure Samples in the Demand-Side Industrial Chain |
|---|---|---|---|---|---|
| Austria | 26.124 | 25.045 | Slovakia | 29.429 | 36.245 |
| Bulgaria | 29.558 | 27.623 | Slovenia | 33.167 | 31.458 |
| China | 9.305 | 9.249 | Turkey | 14.944 | 19.377 |
| Cyprus | 29.692 | 26.551 | Bangladesh | 4.855 | 15.647 |
| Czech Republic | 29.890 | 28.975 | Malaysia | 38.271 | 29.444 |
| Estonia | 35.353 | 31.505 | Philippines | 14.683 | 19.525 |
| Greece | 16.411 | 19.669 | Thailand | 25.375 | 26.619 |
| Croatia | 23.173 | 26.304 | Vietnam | 23.736 | 38.151 |
| Hungary | 32.441 | 36.153 | Kazakhstan | 34.337 | 16.381 |
| Indonesia | 14.082 | 17.417 | Mongolia | 35.861 | 27.772 |
| India | 9.687 | 16.703 | Sri Lanka | 8.743 | 21.163 |
| Italy | 14.961 | 16.030 | Pakistan | 4.610 | 16.123 |
| South Korea | 23.350 | 22.210 | Laos | 19.675 | 29.980 |
| Lithuania | 33.069 | 28.867 | Brunei | 47.633 | 32.379 |
| Luxembourg | 57.297 | 42.341 | Bhutan | 18.198 | 26.400 |
| Latvia | 30.235 | 25.174 | Kyrgyzstan | 18.376 | 30.222 |
| Malta | 38.786 | 43.403 | Cambodia | 13.188 | 33.969 |
| Poland | 23.521 | 23.307 | Maldives | 32.339 | 31.468 |
| Portugal | 18.983 | 21.444 | Nepal | 5.098 | 21.733 |
| Romania | 20.428 | 23.680 | Singapore | 47.640 | 35.377 |
| Russia | 23.506 | 10.889 |
Table A2.
35 industries of the Asian Development Bank.
Table A2.
35 industries of the Asian Development Bank.
| Agriculture, hunting, forestry, and fishing | C01 | Sale, maintenance, and repair of motor vehicles and motorcycles; retail sale of fuel | C19 |
| Mining and quarrying | C02 | Wholesale trade and commission trade, except of motor vehicles and motorcycles | C20 |
| Food, beverages, and tobacco | C03 | Retail trade, except of motor vehicles and motorcycles; repair of household goods | C21 |
| Textiles and textile products | C04 | Hotels and restaurants | C22 |
| Leather, leather products, and footwear | C05 | Inland transport | C23 |
| Wood and products of wood and cork | C06 | Water transport | C24 |
| Pulp, paper, paper products, printing, and publishing | C07 | Air transport | C25 |
| Coke, refined petroleum, and nuclear fuel | C08 | Other supporting and auxiliary transport activities; activities of travel agencies | C26 |
| Chemicals and chemical products | C09 | Post and telecommunications | C27 |
| Rubber and plastics | C10 | Financial intermediation | C28 |
| Other nonmetallic minerals | C11 | Real estate activities | C29 |
| Basic metals and fabricated metal | C12 | Renting of M&Eq and other business activities | C30 |
| Machinery, nec | C13 | Public administration and defense; compulsory social security | C31 |
| Electrical and optical equipment | C14 | Education | C32 |
| Transport equipment | C15 | Health and social work | C33 |
| Manufacturing, nec; recycling | C16 | Other community, social, and personal services | C34 |
| Electricity, gas, and water supply | C17 | Private households with employed persons | C35 |
| Construction | C18 |
Descriptive Statistics
Descriptive statistics for the main variables are shown in the table.
Table A3.
Descriptive statistics for the main variables.
Table A3.
Descriptive statistics for the main variables.
| Variable Symbol | Variable Name | Number of Observations | Average Value | Standard Deviation | Minimum Value | Maximum Values | VIF |
|---|---|---|---|---|---|---|---|
| Supply-side chain external risk exposure | 24,395 | 23.301 | 20.093 | 0.098 | 71.27 | ||
| Demand-side chain external risk exposure | 24,395 | 25.861 | 13.531 | 3.531 | 55.31 | ||
| China’s outward foreign direct investment | 24,395 | 12.201 | 0.994 | 10.093 | 13.318 | 2.07 | |
| import dependency | 24,395 | 55.114 | 31.469 | 15.641 | 150.135 | 4.51 | |
| export dependence | 24,395 | 54.587 | 36.786 | 8.222 | 173.803 | 7.02 | |
| capital intensity | 24,395 | 26.529 | 6.976 | 14.684 | 46.66 | 1.43 | |
| Quality of the labour force | 24,395 | 19.737 | 1.851 | 14.46 | 22.162 | 1.44 | |
| Self-innovation level | 24,395 | 18.341 | 0.653 | 15.763 | 18.734 | 2.33 | |
| Level of trade openness | 24,395 | 4.276 | 0.506 | 3.19 | 5.25 | 3.35 |
References
- Ni, H.; Zhong, D.; Peng, S. A new method for measuring industrial chain risk exposure: A regional perspective in China. J. Econ. Surv. 2024, 38, 1760–1794. [Google Scholar] [CrossRef]
- Luo, Y.; Van Assche, A. The rise of techno-geopolitical uncertainty: Implications of the United States CHIPS and Science Act. J. Int. Bus. Stud. 2023, 54, 1423–1440. [Google Scholar] [CrossRef]
- Liu, H.; Wang, Y.; Jiang, J.; Wu, P. How green is the “Belt and Road Initiative”?—Evidence from Chinese OFDI in the energy sector. Energy Policy 2020, 145, 111709. [Google Scholar] [CrossRef]
- Zhang, Y.; Li, Y.; Zhang, K. The impact of host country institutional quality on OFDI: Evidence from China. J. Int. Trade Econ. Dev. 2025, 34, 527–551. [Google Scholar] [CrossRef]
- Fu, X.; Buckley, P.J.; Fu, X.M. The growth impact of Chinese direct investment on host developing countries. Int. Bus. Rev. 2020, 29, 101658. [Google Scholar] [CrossRef]
- Liu, Y.; Zhou, J.; Zeng, X. The Reciprocal and Symbiotic Effects of Industrial Relocation between China and BRI Countries. China Econ. 2023, 18, 54–74. [Google Scholar]
- Yu, H.; Zhang, J.; Zhang, M.; Fan, F. Cross-national knowledge transfer, absorptive capacity, and total factor productivity: The intermediary effect test of international technology spillover. Technol. Anal. Strateg. Manag. 2022, 34, 625–640. [Google Scholar] [CrossRef]
- Khan, S.A.; Godil, D.I.; Yu, Z.; Abbas, F.; Shamim, M.A. Adoption of renewable energy sources, low-carbon initiatives, and advanced logistical infrastructure—An step toward integrated global progress. Sustain. Dev. 2022, 30, 275–288. [Google Scholar] [CrossRef]
- Sun, Q.; Javeed, S.A.; Tang, Y.; Feng, Y. The impact of housing prices and land financing on economic growth: Evidence from Chinese 277 cities at the prefecture level and above. PLoS ONE 2024, 19, e0302631. [Google Scholar]
- Li, L.; Wang, Z.; Ye, F.; Chen, L.; Zhan, Y. Digital technology deployment and firm resilience: Evidence from the COVID-19 pandemic. Ind. Mark. Manag. 2022, 105, 190–199. [Google Scholar] [CrossRef]
- Goel, R.K.; Saunoris, J.W.; Goel, S.S. Supply chain performance and economic growth: The impact of COVID-19 disruptions. J. Policy Model. 2021, 43, 298–316. [Google Scholar] [CrossRef]
- Qi, X.; Qin, W.; Lin, B. Case study on synergistic development strategy of cross-border e-commerce and logistics: An empirically model estimation. PLoS ONE 2024, 19, e0304393. [Google Scholar] [CrossRef] [PubMed]
- Qi, X.; Qin, W.; Lin, B. The evolving geography of production hubs and regional value chains across East Asia: Trade in value-added. J. World Bus. 2015, 50, 404–416. [Google Scholar]
- Alday, S.S. Regional integration and the regional risk paradox. Eur. Manag. J. 2022, 40, 793–808. [Google Scholar] [CrossRef]
- Sun, K.; Wang, H.; Ye, S. How does digital transformation enhance industrial chain resilience? Evidence from China. Financ. Res. Lett. 2025, 75, 106896. [Google Scholar] [CrossRef]
- Xing, Y. China and global value chain restructuring. China Econ. J. 2022, 15, 310–329. [Google Scholar] [CrossRef]
- Wang, D.; Wang, Y.; Jiang, W.; Shi, X. Has outward foreign direct investment alleviated industrial overcapacity in China? An empirical test of the upstream and downstream industrial links. Struct. Change Econ. Dyn. 2023, 67, 250–263. [Google Scholar] [CrossRef]
- Baldwin, R.; Freeman, R.; Theodorakopoulos, A. Horses for Courses: Measuring Foreign Supply Chain Exposure; National Bureau of Economic Research: Cambridge, MA, USA, 2022. [Google Scholar]
- Peng, S.; Zhong, D. Industrial Chain Risk Exposure and Economic Volatility: A Framework Incorporating Foreign-Invested Enterprises. World Econ. 2025, 48, 961–980. [Google Scholar] [CrossRef]
- Ashraf, A.; Carril-Caccia, F.; Doytch, N. Reverse technological spillovers from outward FDI on home countries’ total factor productivity: Does the mode of investment matter? Borsa Istanb. Rev. 2024, 24, 607–617. [Google Scholar] [CrossRef]
- Ge, R.; Zheng, Z.; Tian, X.; Liao, L. Human–robot interaction: When investors adjust the usage of robo-advisors in peer-to-peer lending. Inf. Syst. Res. 2021, 32, 774–785. [Google Scholar] [CrossRef]
- Wang, H.; Zhong, X. An empirical study on the impact of Chinese OFDI on the global value chain positions of countries along the Belt and Road and threshold effects. Sage Open 2023, 13, 21582440231158027. [Google Scholar] [CrossRef]
- He, J.; Li, H. A review of trade geography research: Theoretical foundations, spatial patterns, and frontier dynamics. Geogr. Res. Bull. 2025, 4, 96–119. [Google Scholar]
- Song, W.; He, J. Innovation factor double circulation: Cross-border mobility and the manufacturing industry’s total factor productivity. PLoS ONE 2023, 18, e0283693. [Google Scholar] [CrossRef]
- Blyde, J.; Molina, D. Logistic infrastructure and the international location of fragmented production. J. Int. Econ. 2015, 95, 319–332. [Google Scholar] [CrossRef]
- Chen, M.X.; Lin, C. Geographic connectivity and cross-border investment: The belts, roads and skies. J. Dev. Econ. 2020, 146, 102469. [Google Scholar] [CrossRef]
- Meng, B.; Ye, M. Smile curves in global value chains: Foreign-vs. domestic-owned firms; the US vs. China. Struct. Change Econ. Dyn. 2022, 60, 15–29. [Google Scholar] [CrossRef]
- Chen, W.; Niu, X.; Ke, W.; Yu, Z. Investigating the energy trade networks in the Belt and Road regions: Structures and evolution. Energy 2023, 283, 129157. [Google Scholar] [CrossRef]
- Shi, L.; Li, X.; Chen, X. How does FDI affect enterprises’ OFDI through trade networks? Int. Rev. Econ. Financ. 2025, 97, 103787. [Google Scholar] [CrossRef]
- Zou, L.; Shen, J.H.; Zhang, J.; Lee, C.C. What is the rationale behind China’s infrastructure investment under the Belt and Road Initiative. J. Econ. Surv. 2022, 36, 605–633. [Google Scholar] [CrossRef]
- Hua, L.; Wu, Y. Strategic analysis of vertical integration in cross-border e-commerce logistics service supply chains. Transp. Res. Part E Logist. Transp. Rev. 2024, 188, 103626. [Google Scholar] [CrossRef]
- Narayan, P.K.; Rath, B.N.; Syarifuddin, F. Understanding the role of trade agreements in Indonesia’s FDI. J. Asian Econ. 2022, 82, 101532. [Google Scholar] [CrossRef]
- Egger, P.; Pirotte, A.; Titi, C. International investment agreements and foreign direct investment: A survey. World Econ. 2023, 46, 1524–1565. [Google Scholar] [CrossRef]
- Stephenson, M.; Hamid, M.F.S.; Peter, A.; Sauvant, K.P.; Seric, A.; Tajoli, L. More and better investment now! How unlocking sustainable and digital investment flows can help achieve the SDGs. J. Int. Bus. Policy 2021, 4, 152. [Google Scholar] [CrossRef]
- Xin, X.; Liu, M.; Wang, X.; Chen, H.; Chen, K. Investment strategy for blockchain technology in a shipping supply chain. Ocean Coast. Manag. 2022, 226, 106263. [Google Scholar] [CrossRef]
- Li, C.; Huo, P.; Wang, Z.; Zhang, W.; Liang, F.; Mardani, A. Digitalization generates equality? Enterprises’ digital transformation, financing constraints, and labor share in China. J. Bus. Res. 2023, 163, 113924. [Google Scholar] [CrossRef]
- Calabrese, L.; Jenkins, R.; Lombardozzi, L. The Belt and Road Initiative and dynamics of structural transformation. Eur. J. Dev. Res. 2024, 36, 515–547. [Google Scholar] [CrossRef]
- Rodriguez-Clare, A. Clusters and comparative advantage: Implications for industrial policy. J. Dev. Econ. 2007, 82, 43–57. [Google Scholar] [CrossRef]
- Xu, S.; Zhou, Y. OFDI, industrial structure upgrading and green development—Spatial effect based on China’s evidence. Sustainability 2023, 15, 2810. [Google Scholar] [CrossRef]
- Bao, X.; Gao, L.; Jin, Y.; Sun, J. Industrial agglomeration and firm exports: Micro-evidence based on input-output linkages. Econ. Model. 2023, 119, 106123. [Google Scholar] [CrossRef]
- Grieser, W.; Maturana, G.; Spyridopoulos, I.; Truffa, S. Agglomeration, knowledge spillovers, and corporate investment. J. Corp. Financ. 2022, 77, 102289. [Google Scholar] [CrossRef]
- Peng, D.; Ji, Y.; Kong, Q. OFDI and firms’ sustainable productive capacity: Evidence from Chinese industrial firms. Int. Rev. Econ. Financ. 2023, 83, 641–652. [Google Scholar] [CrossRef]
- Wu, Y.; Chen, C. The impact of China’s outward foreign direct investment on trade intensity with Belt and Road countries. Emerg. Mark. Financ. Trade 2021, 57, 1773–1792. [Google Scholar] [CrossRef]
- Wang, C.; Piperopoulos, P.; Chen, S.; Ming, A.A.K.; Herbert, K. Outward FDI and innovation performance of Chinese firms: Why can home-grown political ties be a liability? J. World Bus. 2022, 57, 101306. [Google Scholar] [CrossRef]
- Zhou, K.; Kumar, S.; Yu, L.; Jiang, X. The economic policy uncertainty and the choice of entry mode of outward foreign direct investment: Cross-border M&A or Greenfield Investment. J. Asian Econ. 2021, 74, 101306. [Google Scholar] [CrossRef]
- Fang, J.; Lu, Y.; Yao, S. Can regional cooperation mitigate the impact of COVID-19 pandemic on greenfield investments? Evidence from the belt and road initiative. World Econ. 2024, 47, 1004–1031. [Google Scholar] [CrossRef]
- Zhang, H.; Wang, X.; Tang, J.; Guo, Y. The impact of international rare earth trade competition on global value chain upgrading from the industrial chain perspective. Ecol. Econ. 2022, 198, 107472. [Google Scholar] [CrossRef]
- Xiong, Y.; Xu, R.; Wu, S.; Li, S.; Li, L.; Li, Q. Evolution of the bilateral trade situation between Belt and Road countries and China. J. Clean. Prod. 2023, 414, 137599. [Google Scholar] [CrossRef]
- Azémar, C.; Giroud, A. World Investment Report 2022: International tax reforms and sustainable investment. J. Int. Bus Policy 2023, 6, 235–239. [Google Scholar] [CrossRef]
- Giroud, A. World Investment Report 2023: Investing in Sustainable Energy for All; United Nations Conference on Trade and Development: Geneva, Switzerland; New York, NY, USA, 2023; 205p. [Google Scholar]
- Liao, H.; Yang, L.; Dai, S.; Van Assche, A. Outward FDI, industrial structure upgrading and domestic employment: Empirical evidence from the Chinese economy and the belt and road initiative. J. Asian Econ. 2021, 74, 101303. [Google Scholar] [CrossRef]
- Ambrogio, G.; Filice, L.; Longo, F.; Padovano, A. Workforce and supply chain disruption as a digital and technological innovation opportunity for resilient manufacturing systems in the COVID-19 pandemic. Comput. Ind. Eng. 2022, 169, 108158. [Google Scholar] [CrossRef]
- Chang, Y.; Iakovou, E.; Shi, W. Blockchain in global supply chains and cross border trade: A critical synthesis of the state-of-the-art, challenges and opportunities. Int. J. Prod. Res. 2020, 58, 2082–2099. [Google Scholar] [CrossRef]
- Baldwin, R.; Freeman, R. Risks and global supply chains: What we know and what we need to know. Annu. Rev. Econ. 2022, 14, 153–180. [Google Scholar] [CrossRef]
- Busse, M.; Hefeker, C. Political risk, institutions and foreign direct investment. Eur. J. Political Econ. 2007, 23, 397–415. [Google Scholar] [CrossRef]
- Goldsmith-Pinkham, P.; Sorkin, I.; Swift, H. Bartik instruments: What, when, why, and how. Am. Econ. Rev. 2020, 110, 2586–2624. [Google Scholar] [CrossRef]
- Liu, B.; Liu, J. Did the integrity transition promote economic growth? Empirical research based on the perspective of anti-corruption approaches. Int. Rev. Econ. Financ. 2025, 101, 104156. [Google Scholar] [CrossRef]
- Rahman, J.; Zhao, M.T. Export Performance in Europe: What Do We Know from Supply Links? International Monetary Fund: Washington, DC, USA, 2013. [Google Scholar]
- Jiang, H.; Wang, X.; Liu, C. Automated machines and the labor wage gap. Technol. Forecast. Soc. Change 2024, 206, 123505. [Google Scholar] [CrossRef]
- Castañeda-Navarrete, J.; Hauge, J.; López-Gómez, C. COVID-19’s impacts on global value chains, as seen in the apparel industry. Dev. Policy Rev. 2021, 39, 953–970. [Google Scholar] [CrossRef]
- Zhou, S.; Shan, F. Discovery of innovation effect and spillover effect: Evidence from intelligent manufacturing promoting low-carbon development. J. Innov. Knowl. 2023, 8, 100383. [Google Scholar] [CrossRef]
- Tian, L.; Zhai, Y.; Zhang, Y.; Tan, Y.; Feng, S. Pollution emission reduction effect of the coordinated development of inward and outward FDI in China. J. Clean. Prod. 2023, 391, 136233. [Google Scholar] [CrossRef]
- Zhou, R.; Tang, D.; Da, D.; Chen, W.; Kong, L.; Boamah, V. Research on China’s manufacturing industry moving towards the middle and high-end of the GVC driven by digital economy. Sustainability 2022, 14, 7717. [Google Scholar] [CrossRef]
- Villena, V.H.; Dhanorkar, S. How institutional pressures and managerial incentives elicit carbon transparency in global supply chains. J. Oper. Manag. 2020, 66, 697–734. [Google Scholar] [CrossRef]

Disclaimer/Publisher’s Note: The statements, opinions and data contained in all publications are solely those of the individual author(s) and contributor(s) and not of MDPI and/or the editor(s). MDPI and/or the editor(s) disclaim responsibility for any injury to people or property resulting from any ideas, methods, instructions or products referred to in the content. |
© 2025 by the authors. Licensee MDPI, Basel, Switzerland. This article is an open access article distributed under the terms and conditions of the Creative Commons Attribution (CC BY) license (https://creativecommons.org/licenses/by/4.0/).