Article

Multi-Objective Optimization Method for Flexible Distribution Networks with F-SOP Based on Fuzzy Chance Constraints

1
School of Transportation and Electrical Engineering, Hunan University of Technology, Zhuzhou 412007, China
2
State Grid Huaihua Power Supply Company, Huaihua 418000, China
3
Jiangmen Power Supply Bureau of Guangdong Power Grid Company Limited, Jiangmen 529000, China
*
Author to whom correspondence should be addressed.
Sustainability 2025, 17(21), 9510; https://doi.org/10.3390/su17219510 (registering DOI)
Submission received: 19 September 2025 / Revised: 24 October 2025 / Accepted: 24 October 2025 / Published: 25 October 2025

Abstract

With the large-scale integration of single-phase distributed photovoltaic systems into distribution grids, issues such as mismatched generation and load, overvoltage, and three-phase imbalance may arise in the distribution network. A multi-objective optimization method for flexible distribution networks incorporating a four-leg soft open point (F-SOP) is proposed based on fuzzy chance constraints. First, a mathematical model for the F-SOP’s loss characteristics and power control was established based on the three-phase four-arm topology. Considering the impact of source load uncertainty on voltage regulation, a multi-objective complementary voltage regulation architecture is proposed based on fuzzy chance constraint programming. This architecture integrates F-SOP with conventional reactive power compensation devices. Next, a multi-objective collaborative optimization model for distribution networks is constructed, with network losses, overall voltage deviation, and three-phase imbalance as objective functions. The proposed model is linearized using second-order cone programming. Finally, using an improved IEEE 33-node distribution network as a case study, the effectiveness of the proposed method was analyzed and validated. The results indicate that this method can reduce network losses by 30.17%, decrease voltage deviation by 46.32%, and lower three-phase imbalance by 57.86%. This method holds significant importance for the sustainable development of distribution networks.

1. Introduction

To achieve the strategic goals of carbon peaking and carbon neutrality, traditional distribution grids are gradually evolving into new-generation distribution grids with diversified synergistic capabilities, including distributed generation, flexible distribution control, and user-side energy storage [1,2,3]. In this process, distribution grids will see large-scale integration of distributed photovoltaic (PV) systems. This approach enhances local power generation capacity while reducing carbon emissions [4,5,6]. However, the single-phase grid-connected mode of photovoltaic systems exacerbates source–load mismatch, overvoltage, and three-phase imbalance in distribution networks, while also causing excessive power losses and neutral point potential shift [7,8]. Therefore, improving voltage quality and ensuring the reliability of distribution grid supply are critical for developing next-generation distribution networks.
Currently, some scholars have achieved specific results in voltage quality management. The primary optimization methods include manual phase-shifting adjustments [9] and passive or active compensation devices [10,11]. Compared to manual phase-shifting methods using phase-shifting devices, passive or active compensation devices offer advantages such as dynamically balancing the currents of three-phase loads and extended service life. The authors of ref. [12] employs a coordinated control method for the upstream and downstream of distribution networks. Static VAR generators (SVGs) compensate for three-phase imbalances in distribution networks. This approach comprehensively addresses issues such as the imbalance in distribution network transformers and node overvoltage. However, SVGs face challenges in achieving large-capacity reactive power compensation. The authors of ref. [13] comprehensively considered the low cost and large capacity of group-connected capacitor banks (CBs) alongside the dynamic, continuous reactive power compensation capability of SVGs. They proposed a hybrid reactive power compensation system featuring coordinated operation between CBs and SVGs, with certain voltage deviation and voltage imbalance suppression capabilities. However, such reactive power compensation devices have limitations like single functionality and slow response times. They also fail to address the interconnection and mutual support between distribution substations, making it challenging to resolve source–load mismatches. Consequently, distribution grids require access to more flexible and reliable resources to enhance their controllability.
With the continuous advancement of power electronic devices, safe and reliable back-to-back voltage source converters (VSCs) have emerged [14]. The VSC-based intelligent soft open point (SOP) represents a novel electronic device capable of short-term continuous power regulation and precise power transmission. It can also supply reactive power to support node voltage, offering a new approach to addressing voltage quality issues in distribution networks primarily characterized by overvoltage and three-phase imbalance [15]. The authors of ref. [16] considered the constraint of the current imbalance in PV systems and proposed a dynamic reconfiguration strategy for three-phase unbalanced distribution networks that incorporates SOP. This strategy enhances economic efficiency while mitigating three-phase imbalance in distribution networks, thereby balancing safety and economy in distribution network operations. However, this type of three-phase three-arm SOP can only exchange power at the AC nodes on both sides of the SOP, which makes it challenging to achieve power transfer to the opposite phase. It is worth noting that Lou et al. first proposed the concept of phase-shifting SOP in 2020 [17]. The authors of ref. [18] connected a phase-shifting device in series with the AC side of the SOP to form a phase-shifting SOP. By coordinating the two, they achieved cross-phase and cross-node power transfer, mitigating the overall three-phase imbalance in the distribution network. The authors of ref. [19] employed a hierarchical coordination approach combining SOP and phase-shifting devices to address voltage quality issues in distribution networks. However, the method above only achieves coordination between the phase-shifting device and the SOP. Such devices still fall short of a true SOP enabling the transfer of power between relative phases.
Due to the presence of the neutral line in distribution networks, the three-phase F-SOP achieves superior control performance in interphase power exchange. The authors of ref. [20] designed a corresponding phase-shifting control strategy by incorporating the topological structure of F-SOP, enabling its application in grid regulation. This approach addresses three-phase imbalance, excessive network losses, and uneven load distribution in distribution networks. However, the aforementioned optimized scheduling model does not yet account for voltage deviation—a critical control objective—which may lead to distribution network voltages exceeding national standards in scenarios with high PV penetration. Furthermore, systematic research on the coordinated optimization of F-SOP with reactive power compensation devices such as distribution network CBs and SVGs remains lacking. CB, SVG, and other slow-response speed devices are difficult to cope with the real-time fluctuation of PV and load uncertainty. F-SOP and CB, SVG, and other devices in the regulation and response speed of the obvious differences. F-SOP can continuously regulate power regulation. It can perfectly make up for the above defects. The existing common methods for modeling uncertainty are robust optimization [1] and fuzzy chance constraints [2]. Robust optimization is based on the worst-case pursuit of absolute feasibility under all possible scenarios of source–load fluctuations. It ensures the safe operation of the power system [3]. However, the method may be too conservative and prone to sacrificing the optimality of the objective value. It considers source–load uncertainty through the worst-case scenario may lead to excessive redundancy and high cost of resources such as F-SOP capacity. At the same time, fuzzy chance constraints allow for small probability risks. The objective value can be optimized while satisfying most of the constraints [4]. Meanwhile, fuzzy chance constraints can handle more complex systems through probabilistic approximation methods. The processed model is able to be solved directly by the CPLEX commercial solver.
This paper proposes a multi-objective optimization method for flexible distribution networks based on fuzzy chance constraints and the F-SOP. First, a mathematical power control model based on F-SOP’s loss characteristics is constructed using a three-phase four-arm topology. Then, a multi-objective cooperative optimization model for distribution networks is proposed, incorporating fuzzy chance constraints to account for uncertainties in source–load interactions. This model aims to optimize three objectives: distribution network losses, overall voltage deviation, and voltage three-phase imbalance. Subsequently, the proposed model is linearized using second-order conic programming (SOCP) and solved with the CPLEX solver. Finally, the effectiveness of this method is analyzed and validated using an improved IEEE 33-node distribution network as a case study. The results indicate that this approach promotes the sustainable development of distribution networks.
The remainder of the paper is structured as follows: Section 2 presents the proposed F-SOP model; Section 3 introduces the multi-objective optimization model for flexible distribution networks; Section 4 introduces the method for solving the model; Section 5 provides simulation results on the IEEE 33-node network; and Section 6 concludes the paper.

2. F-SOP Working Principle

2.1. F-SOP Structure

SOP is typically installed between adjacent feeders to replace traditional interconnection switches in distribution networks. This device enables precise control of three-phase ground currents at low operating costs, significantly balancing load differences and reducing network losses. SOP typically controls the back-to-back VSC to achieve its basic functions. Figure 1 shows a schematic diagram of the F-SOP topology and installation location.
As shown in Figure 1, the structure of the F-SOP primarily consists of two three-phase four-wire VSCs. Their AC sides are connected to the AC grid via LC filters. The DC side connects the two VSCs via a shared DC capacitor. Within the F-SOP, the first to third arms of the VSC are connected to the a, b, and c phases of the AC grid, respectively. The midpoint of the fourth bridge arm of the VSC is connected to the neutral line of the AC grid. Consequently, the VSC achieves internal three-phase decoupling and enables autonomous control of the three-phase power and neutral line currents. This capability facilitates the absorption or release of three-phase power on the AC side of the F-SOP.

2.2. F-SOP Loss Model

The two ports of the F-SOP are connected to nodes i and j, respectively. Each port of the F-SOP operates independently, with power loss primarily determined by each port’s transmitted power and transmission efficiency. Assuming the transmission efficiency of each arm of the F-SOP is a constant value, the calculation formula is given by Equations (1) and (2).
P i , e , t loss = η F - SOP ( P i , e , t F - SOP ) 2 + ( Q i , e , t F - SOP ) 2
P j , e , t loss = η F - SOP ( P j , e , t F - SOP ) 2 + ( Q j , e , t F - SOP ) 2
where Equations (1) and (2) are the loss calculation formula of F-SOP. P i , e , t loss , P j , e , t loss denote the active power loss generated in phase e (e = a, b, c, 0) by the VSC of F-SOP access node i and j at time t. η F - SOP denotes the F-SOP power loss coefficient. P i , e , t F - SOP , Q i , e , t F - SOP , P j , e , t F - SOP and Q j , e , t F - SOP denote the active and reactive power transmitted by the VSC of F-SOP access node i and j in phase e at time t, respectively.

2.3. F-SOP Mathematical Model

In the F-SOP configuration, the VSC on each side can independently implement three-phase power control. Therefore, the controllable variables for the F-SOP are each phase’s active and reactive power. Additionally, the F-SOP incorporates a DC link that isolates the reactive power output effects between both sides of the VSC. Its mathematical modeling only needs to account for the VSC’s capacity [21]. Meanwhile, varying PV outputs and load distributions significantly impact the F-SOP’s power transfer capability. The capacity of the VSC and its power losses directly determine the F-SOP’s power transfer capacity.

2.3.1. F-SOP Operational Constraint

F-SOP possesses the capability for independent three-phase power control. F-SOP enables power transfer between phases at a single node. Consequently, the operational constraints for F-SOP only require that the sum of input and output power across all phases equals zero. Compared to traditional SOP, this eliminates the need to consider the balance between input and output power within each phase.
e Ω ( P i , e , t F - SOP + P i , e , t loss ) + e Ω ( P j , e , t F - SOP + P j , e , t loss ) = 0

2.3.2. F-SOP Capacity Constraint

( P i , e , t F - SOP ) 2 + ( Q i , e , t F - SOP ) 2 S i F - SOP 3
( P j , e , t F - SOP ) 2 + ( Q j , e , t F - SOP ) 2 S j F - SOP 3
where S i F - SOP denotes the capacity of the VSC for F-SOP access node i.

3. Multi-Objective Optimization Model for Flexible Distribution Networks Incorporating F-SOP Based on Fuzzy Chance Constraints

The workflow of the multi-objective control strategy described in this paper is shown in Figure 2. First, collect data from the distribution network during normal operation, along with parameters from equipment such as F-SOP, CB, and SVG. Second, real-time monitoring of the distribution network’s operational status is implemented. Fuzzy chance constraints are employed to characterize the uncertainty of generation and load. Next, this paper establishes the multi-objective optimization model for flexible distribution networks incorporating F-SO. The proposed model incorporates the objective function, power flow constraints of the distribution network, safe operation constraints, PV active power output constraints with fuzzy probability constraints, reactive power compensation device constraints, F-SOP constraints, and power balance constraints. Finally, the model is solved using CPLEX. This yields optimal control commands for the coordinated operation of F-SOP, CB, and SVG, which are then transmitted to the respective devices.

3.1. Multi-Objective Model Objective Function

The objective function consists of three components: distribution network losses, overall voltage deviation, and three-phase imbalance. Due to the differing physical meanings and dimensions of each objective function, their numerical ranges vary significantly. Directly weighting the objective functions would allow those with larger magnitudes to dominate absolutely. Therefore, a normalization method is required to render all objective functions dimensionless and uniformly map them to a similar numerical range. This is specifically demonstrated in Equations (6)–(10).
min f = λ LIN f LIN + λ SYN f SYN + λ UNB f UNB
λ LIN = μ LIN f LIN 0
λ LIN = μ SYN f SYN 0
λ UNB = μ UNB f UNB 0
μ LIN + μ SYN + μ UNB = 1
where Equations (6)–(10) constitute the multi-objective function incorporating the normalized objective. λ LIN , λ SYN , and λ UNB denote the weighting factors for the network loss target, overall voltage deviation target, and three-phase imbalance target, respectively. f LIN , f SYN , and f UNB denote the three targets: actual measured distribution network losses, overall voltage deviation, and three-phase imbalance. μ LIN , μ SYN , and μ UNB denote the weights for the network loss target, overall voltage deviation target, and voltage imbalance target, respectively. This paper employs the 9/9–9/1 fractional scale method based on the principles of the Analytic Hierarchy Process to determine the aforementioned weights [1]. The respective weights are 0.3, 0.4, and 0.3. f LIN 0 , f SYN 0 , and f UNB 0 represent the initial values of the network loss target, overall voltage deviation target, and three-phase imbalance target, respectively, before optimization.

3.1.1. Distribution Network Losses

f LIN = i = 0 N bus - 1 j = 1 N bus e = 1 3 I i j , e 2 r i j , e Δ t
where N bus denotes the number of nodes in the distribution network. I i j , e and r i j , e represent the branch current and resistance between nodes i and j in phase e, respectively. Δ t denotes the duration of a single time interval.

3.1.2. Overall Voltage Deviation

f SYN = j = 1 N bus e = 1 3 V j , e V N V N Δ t
where V j , e denotes the node voltage of node j in phase e; V N represents the reference voltage of the distribution network.

3.1.3. Three-Phase Imbalance

f UNB = j 33 d j Δ t
d j = max V j , A L j , V j , B L j , V j , C , t L j L j
L j = 1 3 ( V j , A + V j , B + V j , C )
where d j denotes the three-phase imbalance degree of the voltage at node j. L j denote the average value of the amplitude of the three-phase voltage at node j.

3.2. Multi-Objective Model Constraints

3.2.1. System Trend Constraint

p j , e = k : j k P j k , e i : i j ( P i j , e I i j , e 2 r i j , e ) + g j , e V j , e 2 q j , e = k : j k Q j k , e i : i j ( Q i j , e I i j , e 2 x i j , e ) + b j , e V j , e 2 V j , e 2 = V i , e 2 2 ( r i j , e P i j , e + x i j , e Q i j , e ) + ( r i j , e 2 + x i j , e 2 ) I i j , e 2 I i j , e 2 = P i j , e 2 + Q i j , e 2 V i , e 2
where p j , e and q j , e denote the active and reactive power injected by node j into the e phase, respectively. P j k , e and Q j k , e denote the active and reactive power flowing out from node j to its downstream node k in the direction of e, respectively. P i j , e and Q i j , e denote the active and reactive power flowing out from node i to its downstream node j in the direction of e, respectively. x i j , e , g j , e , and b j , e denote the reactance, conductance, and admittance of link e between nodes i and j, respectively.

3.2.2. Safety Constraint

V min V j , e V max I min I i j , e I max P GRI , min P GRI , e , t P GRI , max Q GRI , min Q GRI , e , t Q GRI , max
where Equation (17) incorporates the upper and lower limits for voltage, current, and electricity purchase volume. V max and V min denote the upper and lower limits of node voltage for node j. I max and I min denote the upper and lower limits of the branch current between nodes i and j, respectively. P GRI , e , t and Q GRI , e , t denote the active power and reactive power exchanged between the distribution network and the higher-level grid on phase e, respectively. P GRI , max , Q GRI , max , P GRI , min , and Q GRI , min denote the maximum and minimum values of the aforementioned power, respectively.

3.2.3. PV Active Power Output Constraint

Based on the error distribution of the obtained PV forecasts, opportunity constraints are introduced to generate confidence intervals for PV output. An uncertainty set with opportunity constraints is constructed for PV output. The calculation formula for the PV output confidence interval is given by Equation (18).
P j , e , t PV = P j , e , t PV , PRE + Δ P j , e , t PV
where Equation (18) represents the operational constraint for PV. P j , e , t PV and P j , e , t PV , PRE denote the actual and predicted output of the photovoltaic power station assembled at node j at time t in phase e. Δ P j , e , t PV denotes the error in photovoltaic output.

3.2.4. CB Constraint

Q j , e , t CB = y j , e , t CB Q j , e CB , step y j , e , t CB Y j , e CB , max t T y j , e , t CB y j , e , t 1 CB N j , e CB , max
where Equation (19) represents the operational constraints for the CB, encompassing the calculation formula for total reactive power output, the upper limit for tap settings, and the upper limit for tap changes. Q j , e , t CB denotes the reactive power compensation delivered by CB connected to node j at time t in phase e. y j , e , t CB denotes the number of operational units for CB. Q j , e CB , step denotes the compensation power for each group of CBs. Y j , e CB , max denotes the upper limit of the number of groups connecting node j to CB. N j , e CB , max denotes the upper limit for the number of CB operations.

3.2.5. SVG Constraint

Q j , e SVG , min Q j , e , t SVG Q j , e SVG , max
where Equation (20) represents the upper and lower limits of the reactive power input of the SVG. Q j , e , t SVG denotes the reactive power compensation delivered by SVG connected to node j at time t in phase e. Q j , e SVG , min and Q j , e SVG , max denote the lower and upper limits of the SVG compensation power, respectively.

3.2.6. F-SOP Constrain

F-SOP constraints include power loss constraints (Equations (1) and (2)), operational constraints (Equation (3)), and capacity constraints (Equations (4) and (5)).

3.2.7. Power Balance Constraint

P load + P IN = P GRI + P PV + P F - SOP Q load + Q IN = Q GRI + Q CB + Q SVG + Q F - SOP
where Equation (21) represents the active and reactive power balance in the distribution network. P load and Q load denote the active and reactive loads of the distribution network, respectively. P IN and Q IN denote the active and reactive power injected at each node of the distribution network, respectively.

4. Multi-Objective Model Solving

4.1. SOCP Linearization

The distribution network optimization model can be expressed as Equation (22).
min f ( I i j , e 2 , V j , e , t 2 ) s . t .     E q u a t i o n ( 1 ) ~ ( 5 )       E q u a t i o n ( 16 ) ~ ( 21 )
The objective function and constraints (2), (3), and (16) in this model are all strongly nonconvex. The model constitutes a mixed-integer nonlinear programming problem, which makes it challenging to solve. The search space of SOCP exhibits unique characteristics such as smoothness and high symmetry. SOCP demonstrates significant advantages and outstanding performance in terms of algorithm convergence speed and optimization capability compared to other optimization methods. This enables SOCP to efficiently and accurately find global optimal solutions or approximate optimal solutions when addressing practical d-optimization problems involving complex constraints and multiple variables. Consequently, SOCP has extensive applications across various fields, including engineering design, financial analysis, and signal processing [21]. Consequently, introducing SOCP transforms traditional models into mixed-integer models, enabling efficient solutions for the original models.
The flow constraint SOCP involves two steps. Step 1: Define new optimization variables—the square of node voltage magnitude and the square of current magnitude—to eliminate the influence of phase angles on flow calculations. Step 2: Employ second-order cone relaxation techniques to transform the original non-convex constraints into convex constraints, thereby linearizing the system for solvable solutions. Equation (24) shows the transformed system’s flow constraints.
p j , e = k : j k P j k , e i : i j P i j , e I ˜ i j , e r i j , e + g j , e V ˜ j , e q j , e = k : j k Q j k , e i : i j Q i j , e I ˜ i j , e x i j , e + b j , e V ˜ j , e V ˜ j , e = V ˜ i , e 2 r i j , e P i j , e + x i j , e Q i j , e + r i j , e 2 + x i j , e 2 I ˜ i j , e 2 P i j , e 2 Q i j , e I ˜ i j , e V ˜ j 2 I ˜ i j , e + V ˜ j , e
where I ˜ i j , e and V ˜ j , e denote the square of the branch current between node i and node j in phase e, and the square of the node voltage at node i in phase e.
Simultaneously, Equations (1) and (2) are converted into a second-order cone.
P i , e , t PC - SOP Q i , e , t PC - SOP 2 2 P i , e , t loss 2 η PC - SOP P i , e , t loss 2 η PC - SOP
P j , e , t PC - SOP Q j , e , t PC - SOP 2 2 P j , e , t loss 2 η PC - SOP P j , e , t loss 2 η PC - SOP
The transformed mixed-integer model can be expressed as Equation (26).
min f ( I ˜ i j , ω , V ˜ j , ω ) s . t .     E q u a t i o n ( 3 ) ~ ( 5 )       E q u a t i o n ( 17 ) ~ ( 21 )       E q u a t i o n ( 23 ) ~ ( 2 5 )

4.2. Fuzzy Chance Constraint Processing

The process for characterizing uncertainty in source load is illustrated in Figure 3. In the first stage, it is assumed that errors in PV and load forecasts follow a normal distribution. Concurrently, the Latin hypercube sampling method is employed to generate N uncertainty samples. In the second stage, the probability distance synchronous back-substitution method is applied to reduce and eliminate uncertainty samples down to n. This thereby reduces the computational burden of model solving.
In the third stage, an approximate transformation was performed on the power balance constraint (21) within the scheduling model. This equation can be reformulated such that the photovoltaic power generation satisfies the corresponding constraints within a specified confidence level α.
Pr P load P PV P GRI P F - SOP + P IN + P D = 0 α
where Pr{·} denotes the credibility of the event. This paper assumes fluctuations in distributed power generation of ±20% and fluctuations in load of ±10%. α denotes the confidence level. This paper sets the confidence level at 0.9.
Using the clarity equivalence class under the trapezoidal blurring parameter, the clarity equivalence class of the power balance constraint is transformed into Equation (28).
( 2 2 α ) ( P load , i 3 P PV , i 2 ) + ( 2 α 1 ) ( P load , i 4 P PV , i 1 ) P GRI P F - SOP + P IN + P D = 0
where P PV , i 1 and P PV , i 2 denote the PV membership degree parameter. P load , i 3 and P load , i 4 denote the load membership degree parameter.

5. Example Simulation and Analysis

5.1. Example Overview and Parameterization

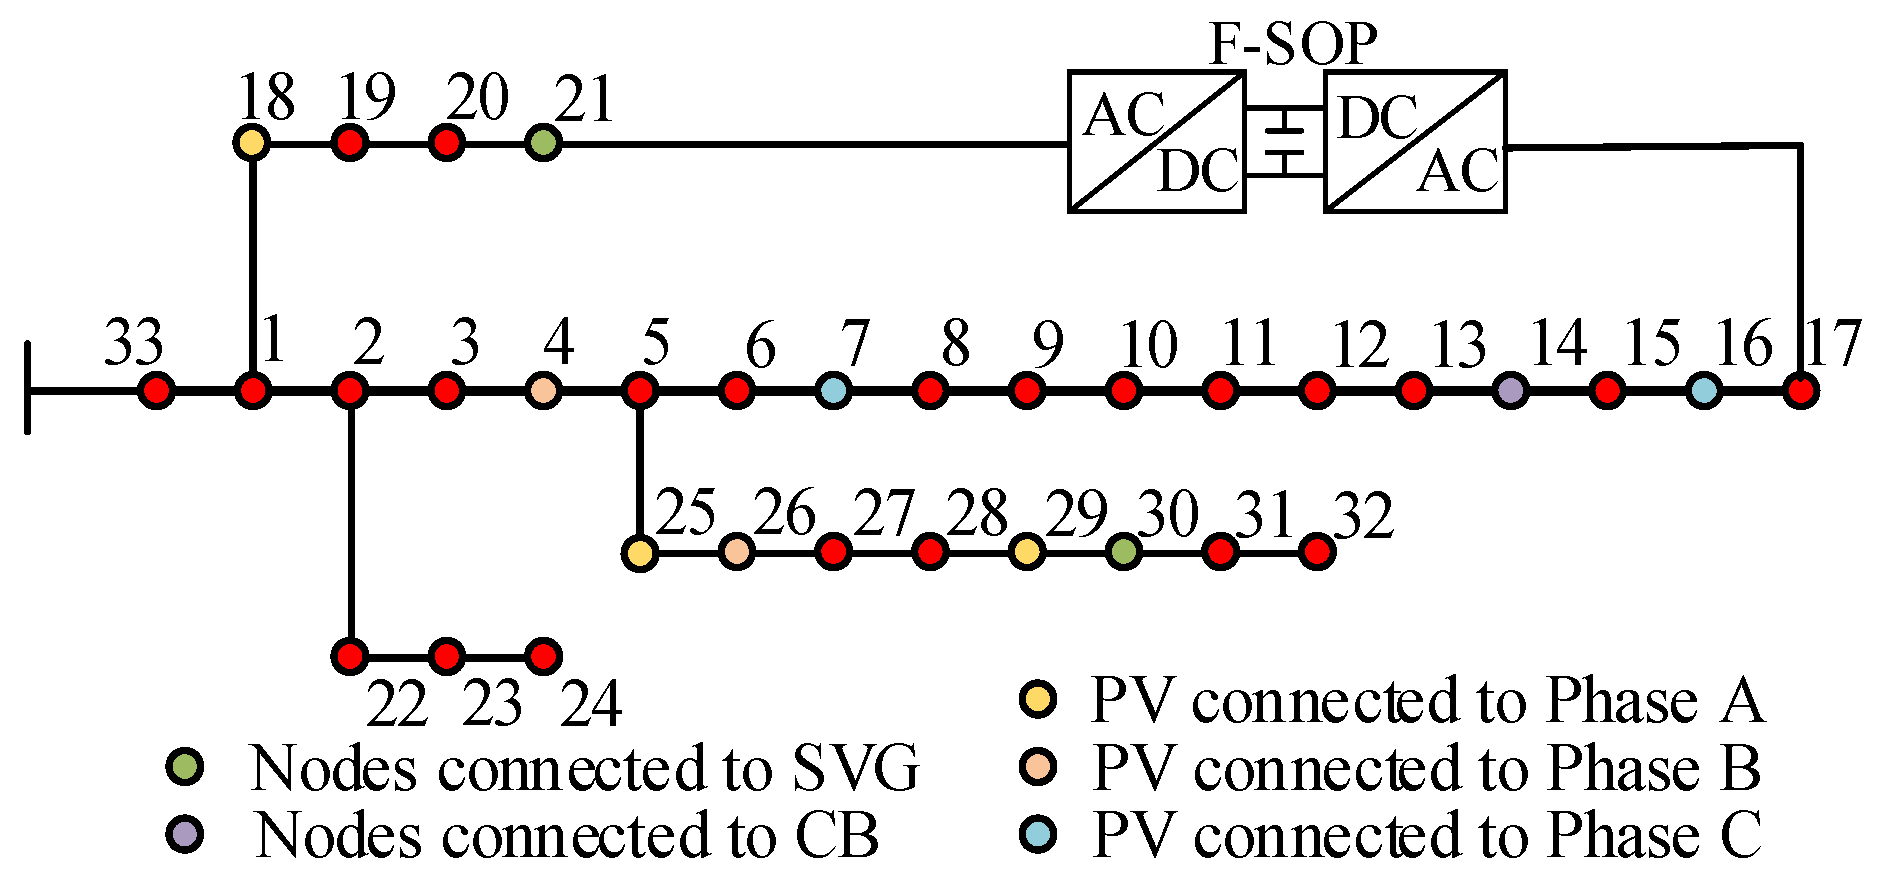
This paper employs an enhanced IEEE 33-node distribution system to simulate and validate the proposed optimization dispatch method for distribution networks. The distribution network structure is shown in Figure 4.
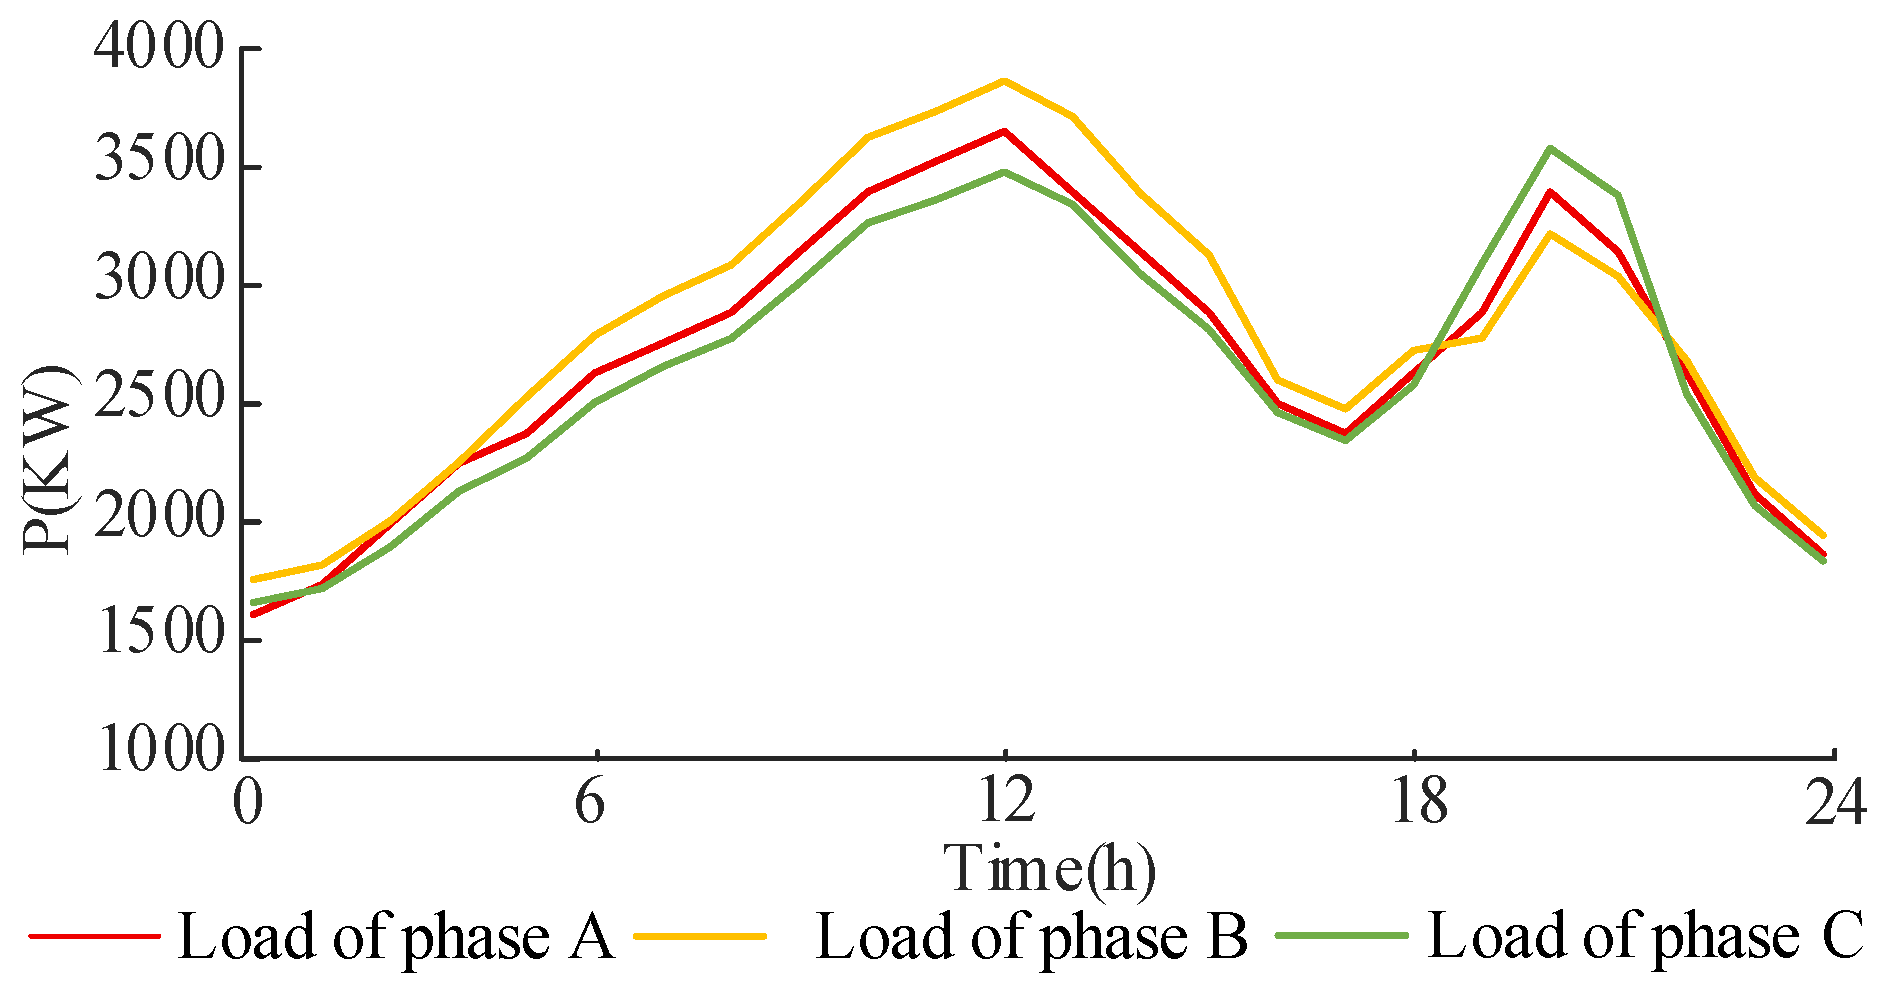
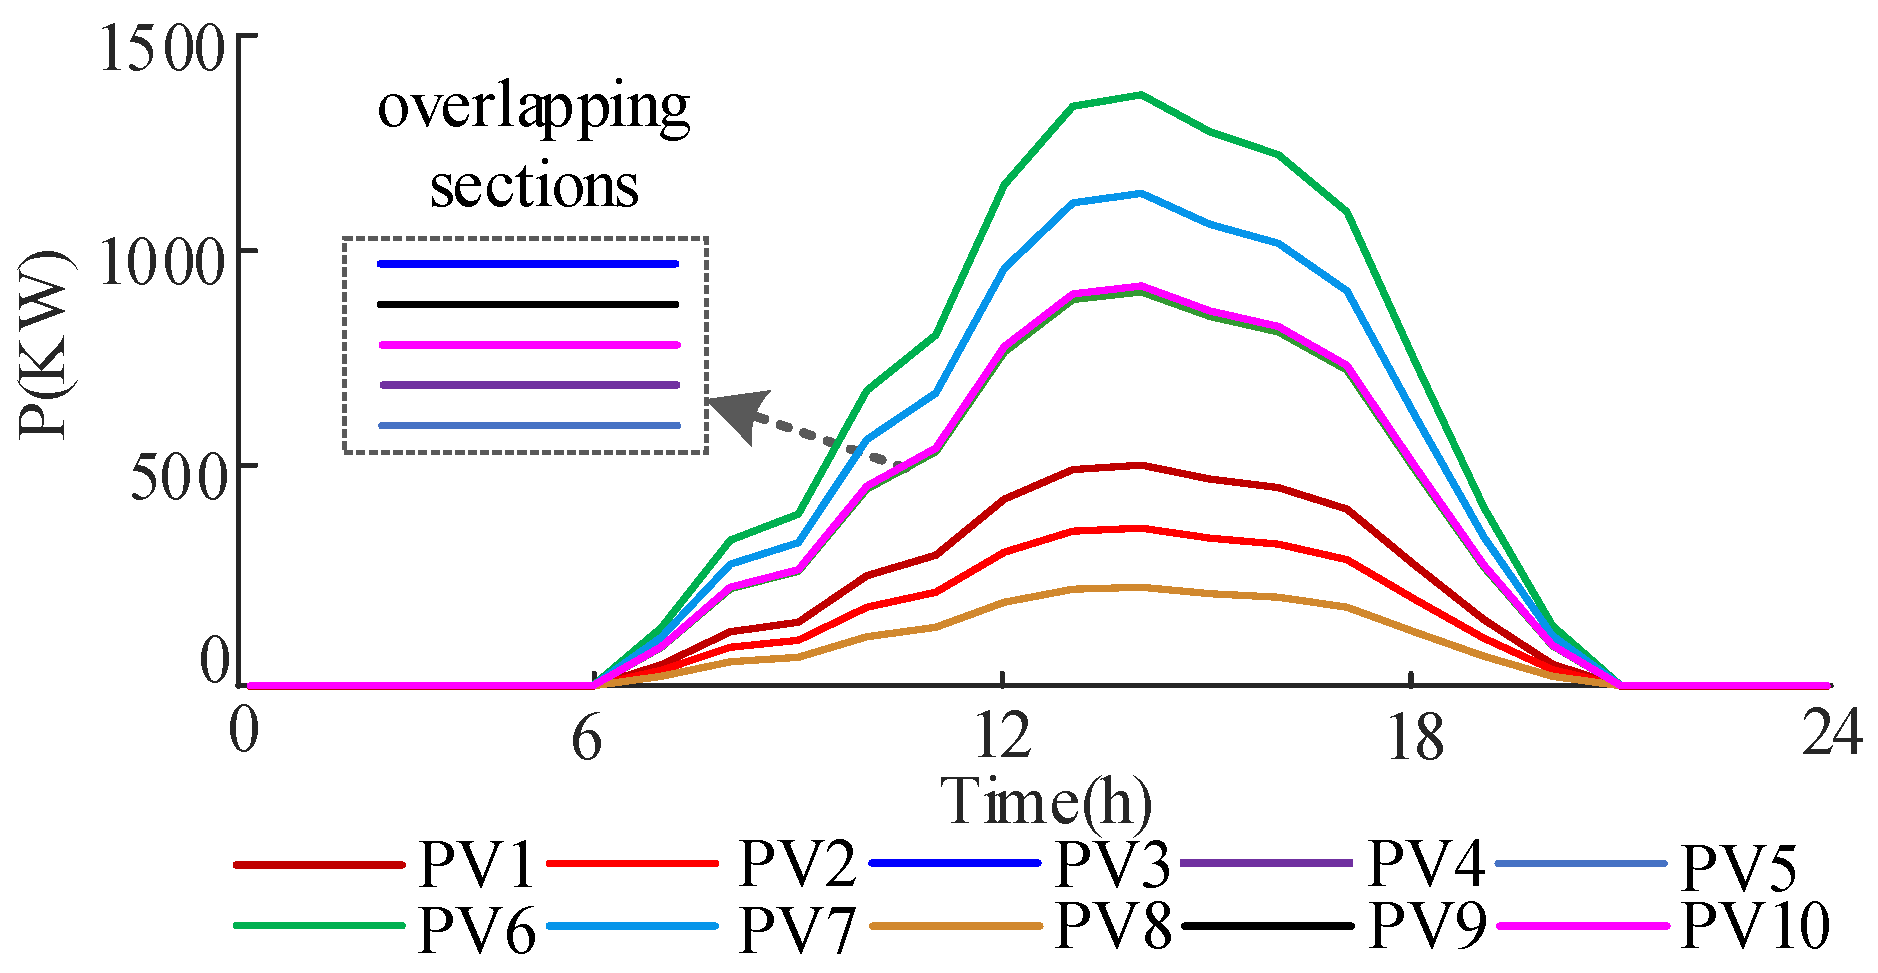
As shown in Figure 4, the F-SOP is connected at nodes 17 and 21 to replace the interconnection switch at that location. The CB is connected at node 13. The SVG is connected at nodes 21 and 30. All equipment is numbered sequentially using Arabic numerals according to the above connection order. The installation location, phase, and capacity parameters of the PV are shown in Table 1. The predicted total output curves for each phase load and PV in the distribution network are shown in Figure 5 and Figure 6. The hardware platform comprises a 12th Generation Intel® Core™ i5-12600KF processor operating at 3.7 GHz and 16 GB RAM. The software platform utilizes MATLAB R2023b, integrated with the YALMIP optimization toolbox (version 20210331) and the IBM ILOG CPLEX solver (version 12.10.0).

5.2. Simulation Results Analysis

To validate the effectiveness and accuracy of the method proposed in this paper, three planning methods were established.
Case 1: The distribution network optimization dispatch method does not consider the coordination between F-SOP and reactive power compensation devices (The blank control group is described in Ref. [21]).
Case 2: The distribution network optimization dispatch method does not employ F-SOP, considering only reactive power compensation devices (The traditional method is described in Ref. [20]).
Case 3: Distribution network optimization dispatch methods consider the coordination between F-SOP and reactive power compensation devices (the strategy of this paper).
Table 2 compares the optimization results across three scenarios for the IEEE 33-node test case. Regarding network loss optimization, the proposed method achieves the lowest network loss value, reducing losses by 30.17% and 19.82% compared to Cases 1 and 2, respectively. Regarding overall voltage deviation, the proposed method reduces deviation by 46.32% and 21.39% compared to Cases 1 and 2, respectively. The proposed method reduces imbalance by 57.86% and 10.82% for three-phase imbalance compared to Cases 1 and 2, respectively. Therefore, the method proposed in this paper significantly reduces losses and balances the voltage between phases, ensuring the safe and economical operation of distribution networks.

5.2.1. Analysis of Critical Equipment

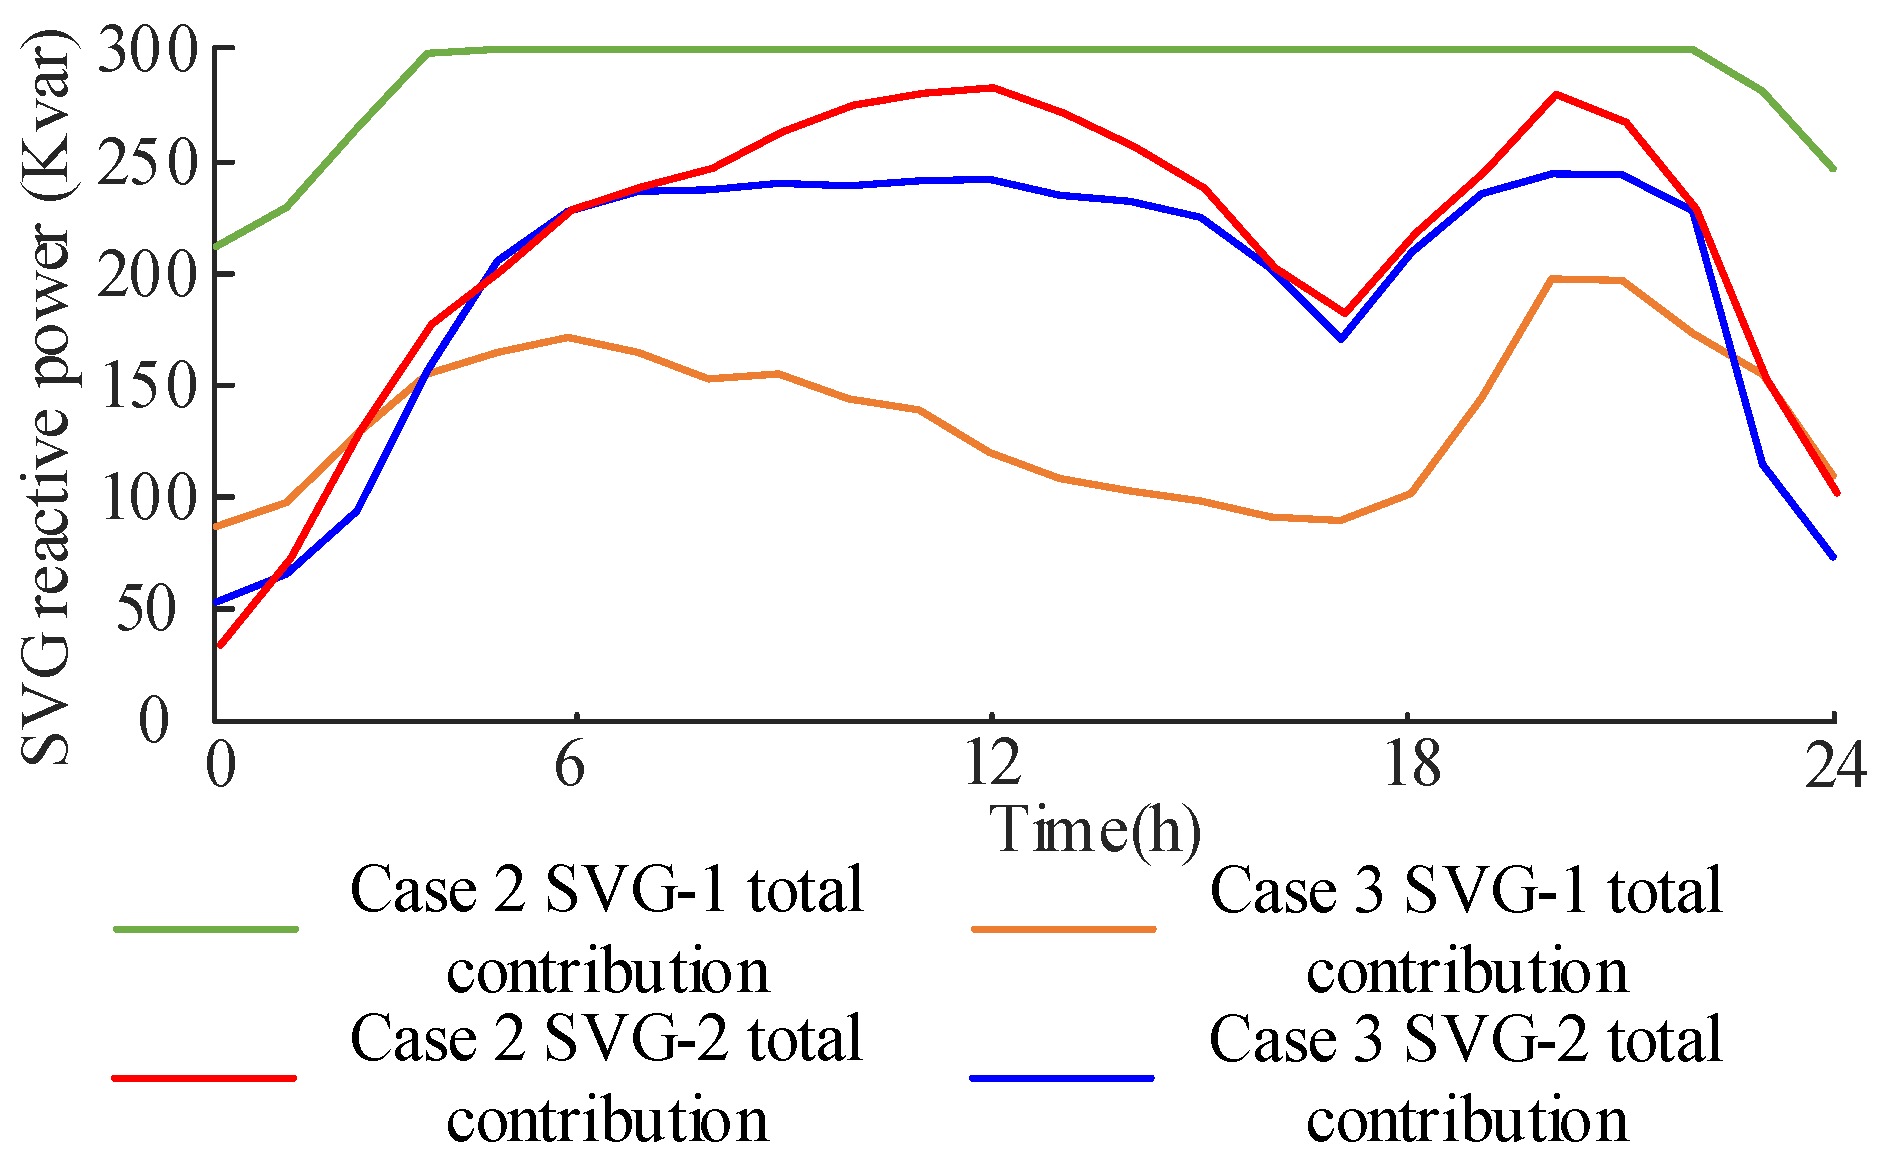
Figure 7 and Figure 8 compare the total three-phase output of various reactive power compensation devices under Cases 2 and 3. Due to the collaborative parameter of F-SOP in this paper’s control strategy, CB and SVG utilization rates decreased from 84.85% to 68.19% compared to traditional control strategies. However, the voltage level of the distribution network did not deteriorate as a result; instead, it improved. This demonstrates that F-SOP can supplement the control capabilities of reactive power compensation devices. Extending the operational lifespan of these devices enhances the economic efficiency of distribution networks.
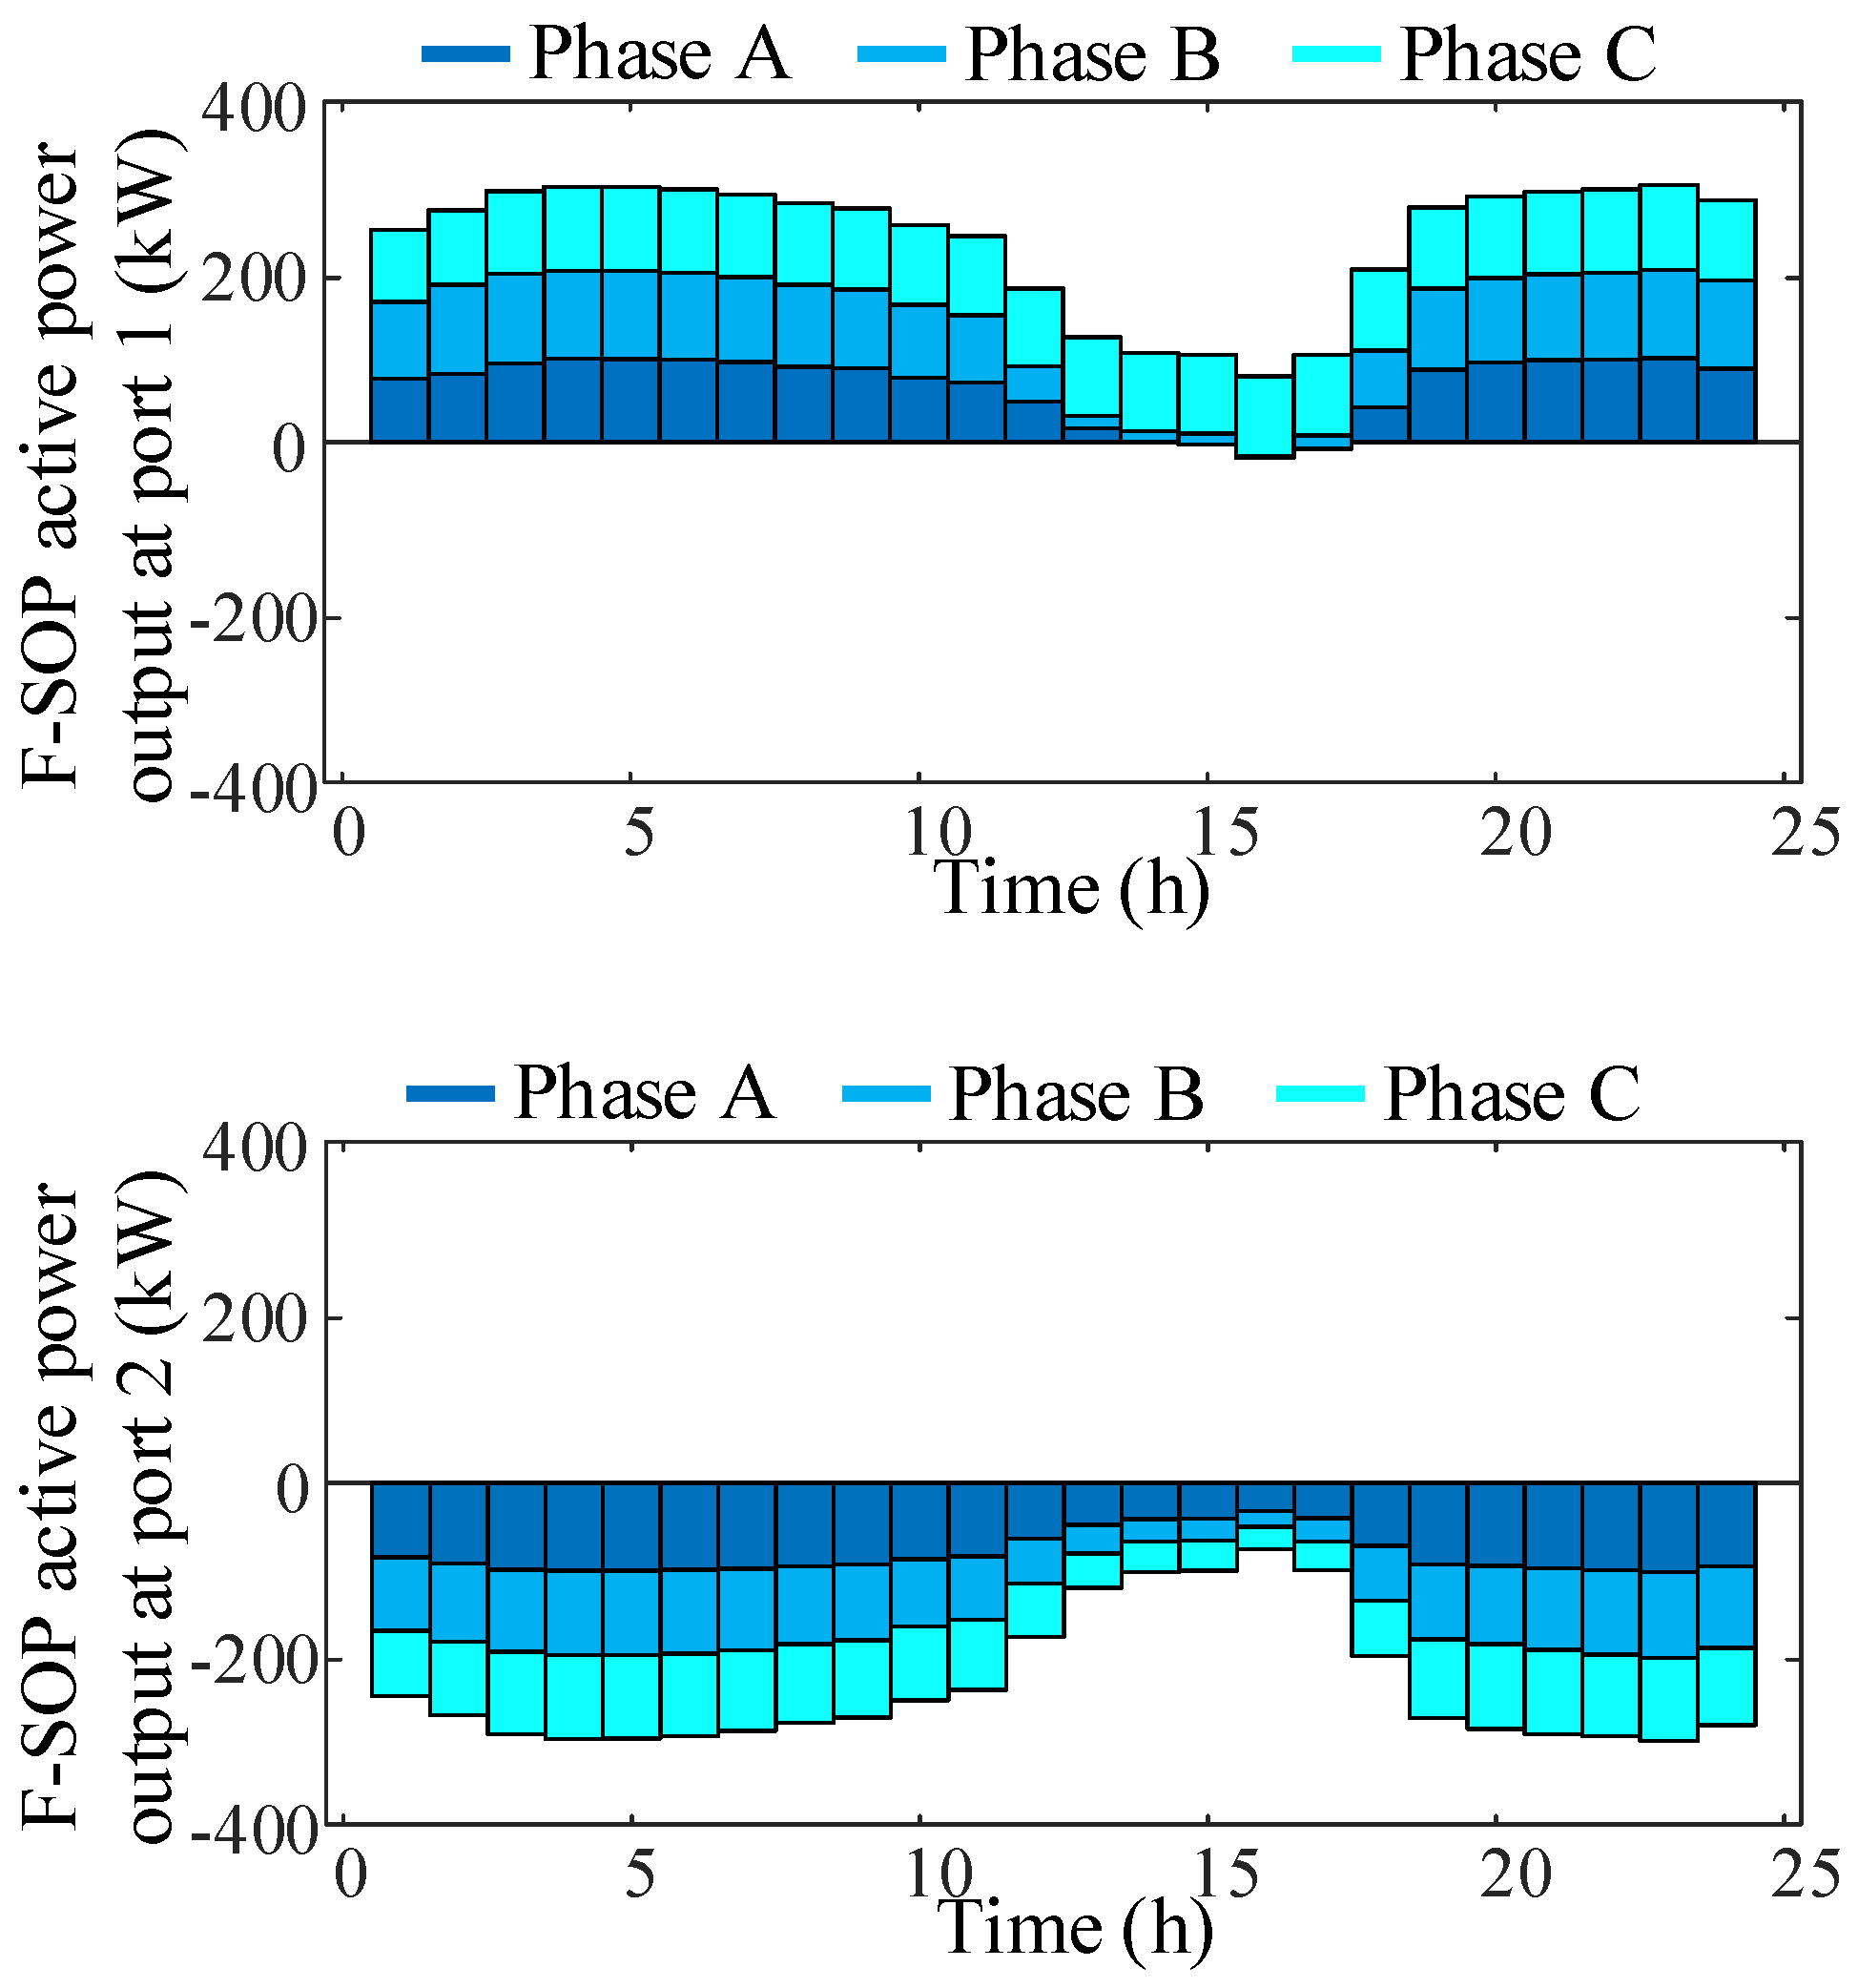
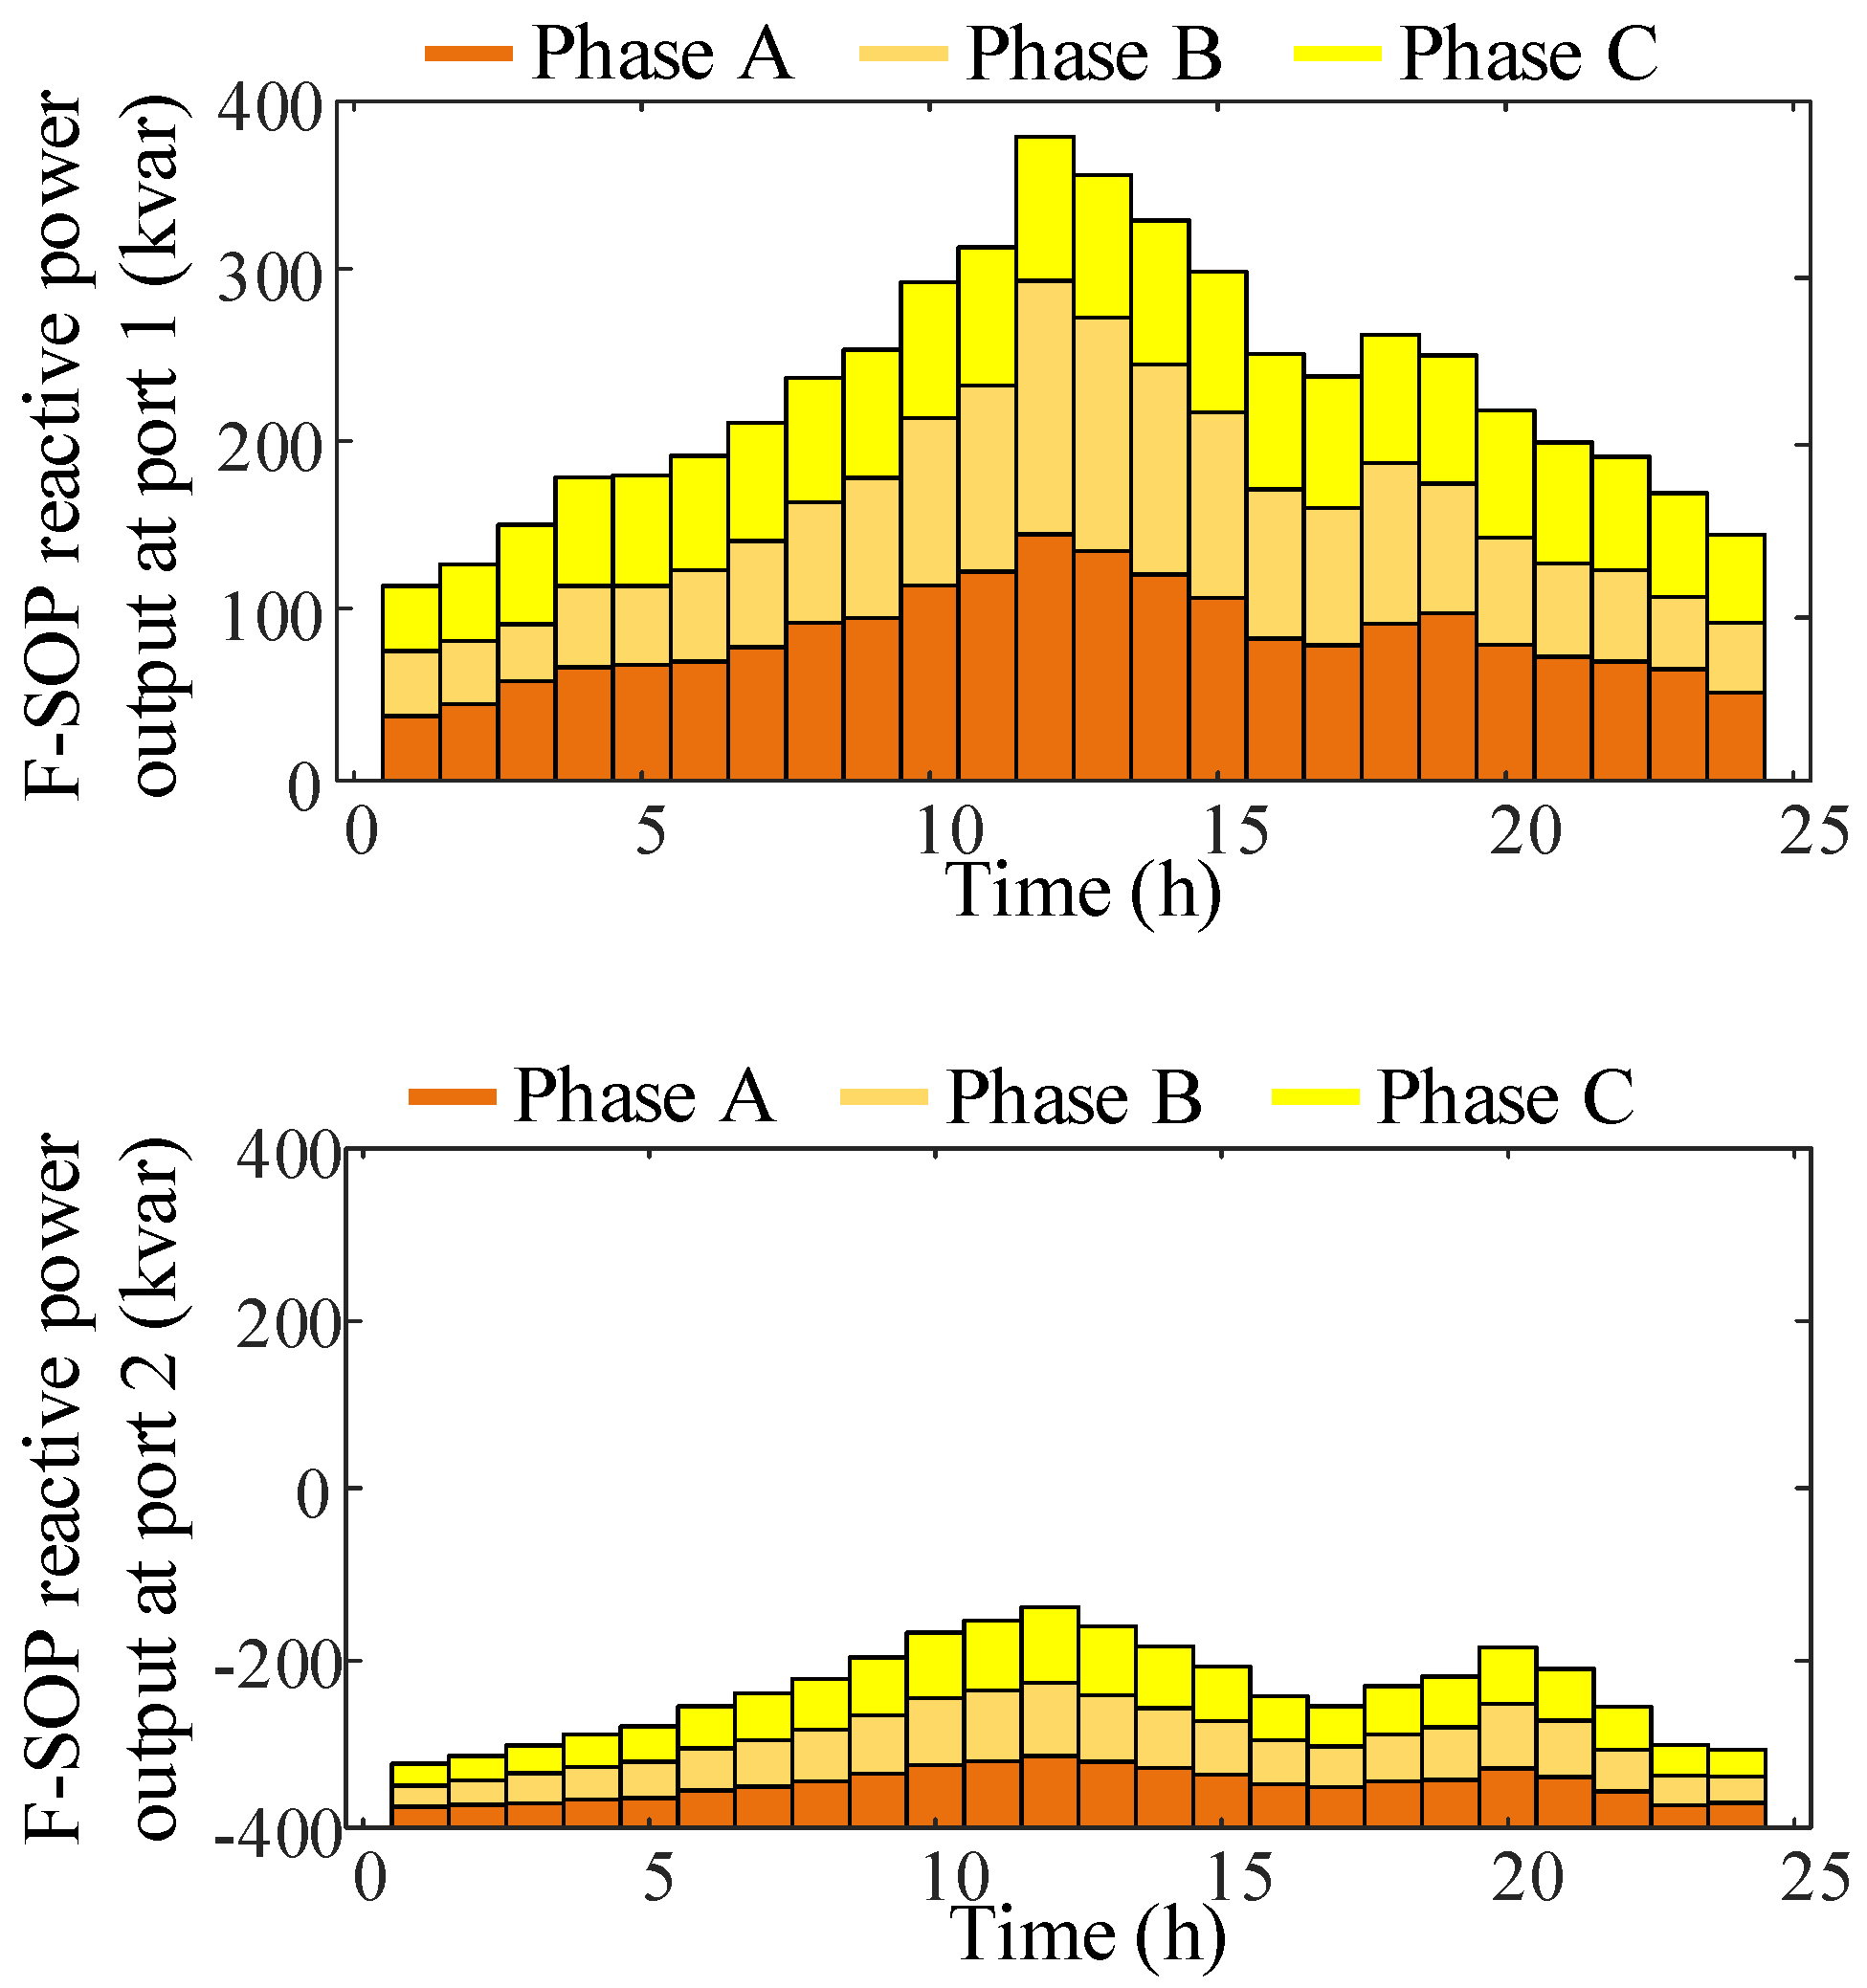
Figure 9 and Figure 10 show the F-SOP’s active and reactive power outputs, respectively. According to Figure 9, the active power output from the VSC at node 17 is primarily distributed above the coordinate system. This indicates that the VSC is inputting active power. Conversely, the active power output from the VSC at node 21 is entirely located below the coordinate system. This signifies that the VSC is outputting active power. This result indicates that active power is effectively transmitted from node 17 to node 21 via the F-SOP during the time periods from 1:00 to 13:00 and from 18:00 to 24:00. It is noteworthy that the phase outputs of the F-SOP exhibit differences. This differential output addresses and mitigates potential three-phase imbalance issues on the load side. Between 14:00 and 17:00, the VSC at node 17 outputs active power on phase A. This indicates that phases B and C at node 17 jointly supply active power to it. This achieves relative phase power exchange at a single node on the AC side of the distribution network. In the model, nodes 17 and 21 are terminal nodes in the distribution network. Compared to before F-SOP integration, the power flow distribution changes, and the network losses consequently vary.

5.2.2. Analysis of Key Indicators

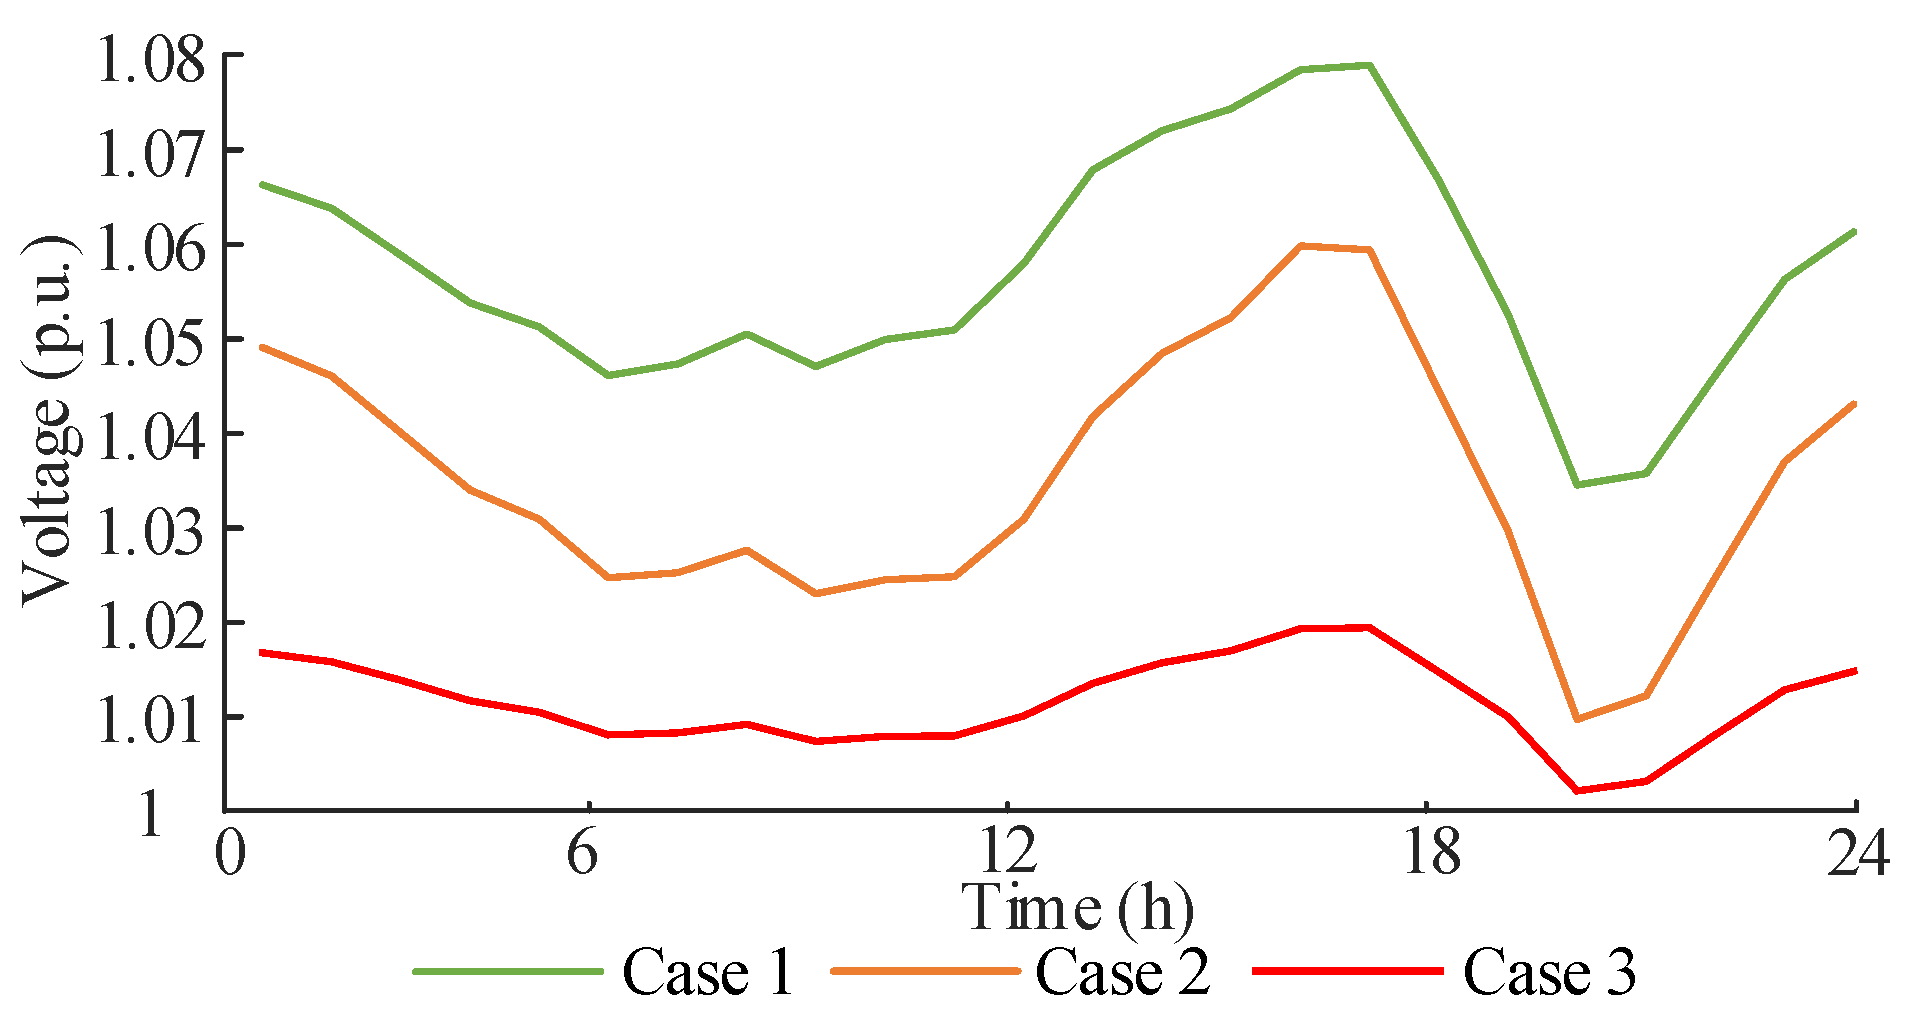
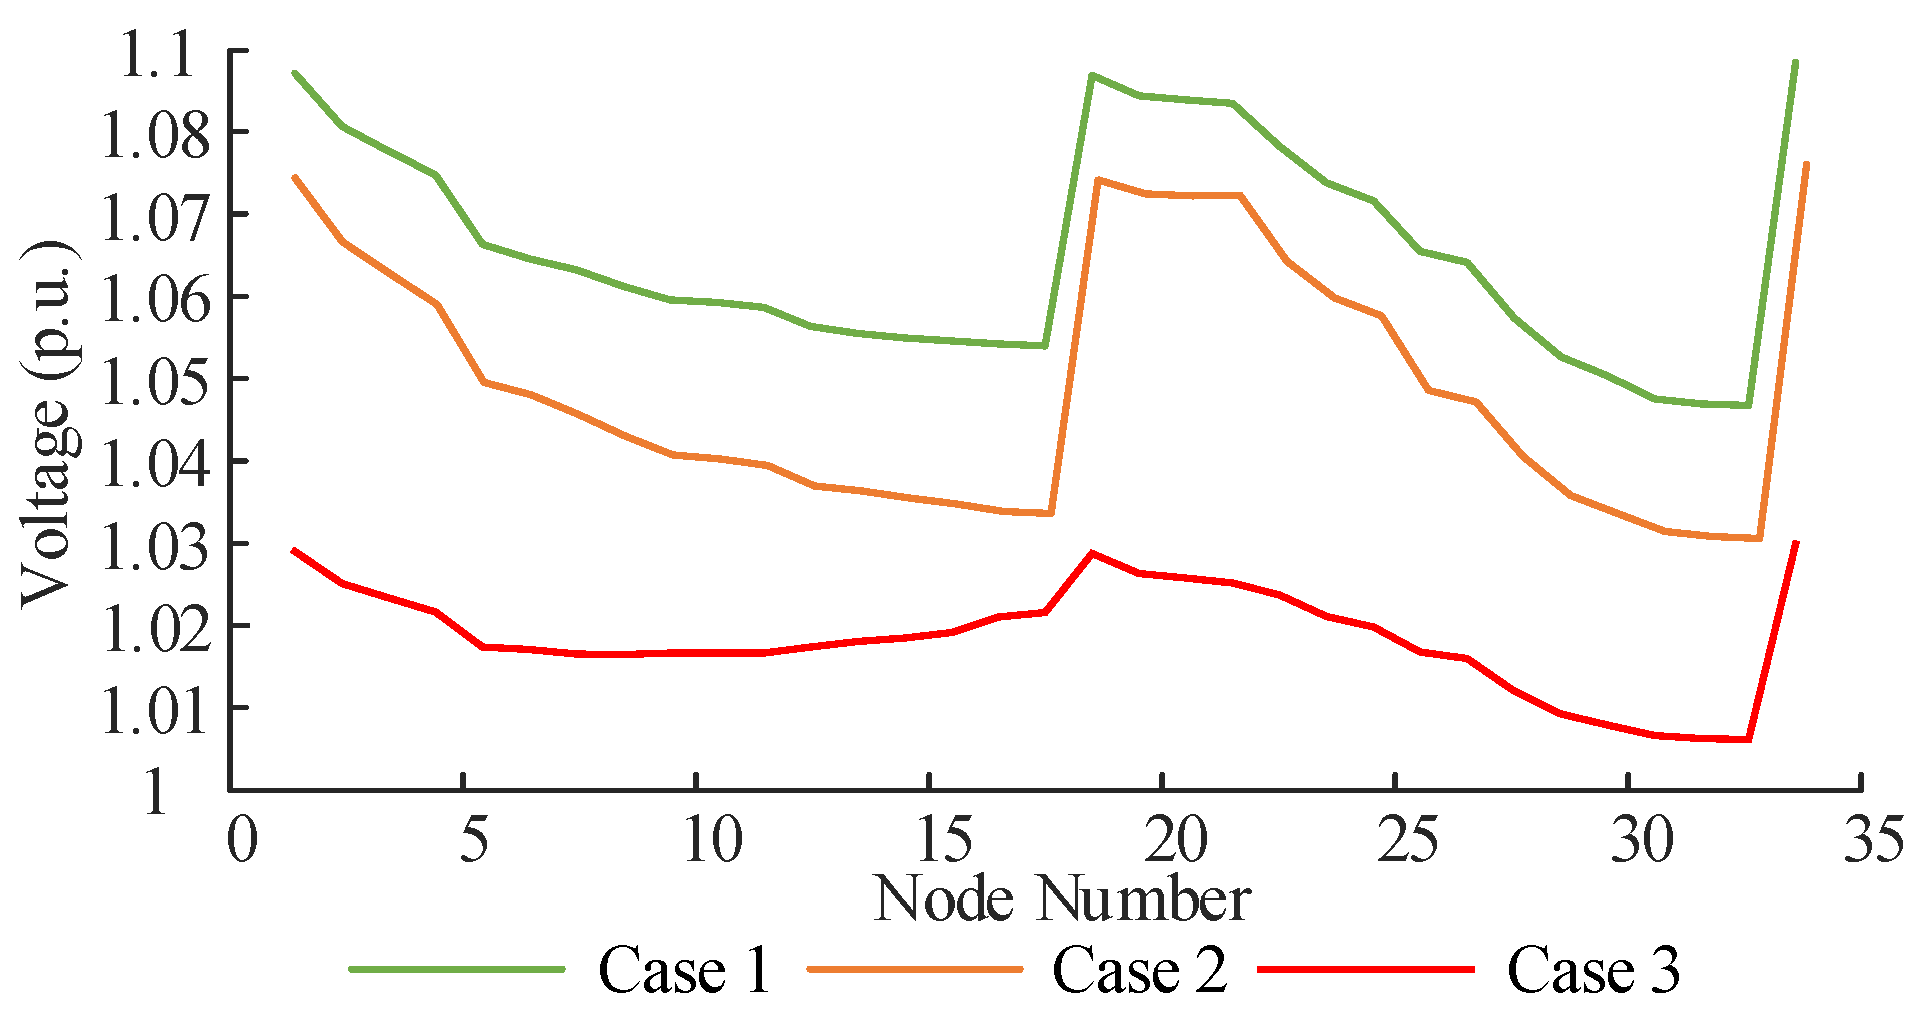
Figure 11 and Figure 12 compare the three-phase average voltage at different time points and nodes between the conventional method and the method proposed in this paper. As shown in the figures, the voltage drop in each time period is significantly improved after introducing F-SOP. Specifically, in phase A at node 32, the difference between the maximum and minimum voltages is 0.042 p.u. in Case 1. This value increases to 0.048 p.u. in Case 2, while it significantly decreases to 0.017 p.u. in Case 3.
As shown in Figure 12, the reactive power regulation function of the F-SOP effectively mitigates the significant voltage drop at the end nodes of the distribution network. It also reduces the potential voltage rise at the end nodes caused by PV integration. In Case 3, the reactive power injected by VSC17 and VSC21 not only elevates the voltage level at the end nodes of the distribution network but also appropriately reduces the voltage at nearby lightly loaded nodes. This achieves a more balanced voltage distribution across the distribution network. Compared to Cases 1 and 2, the system voltage level in Case 3 significantly improves. This demonstrates that the coordinated operation of F-SOP and reactive power compensation devices plays a crucial role in enhancing the overall voltage quality of distribution networks.
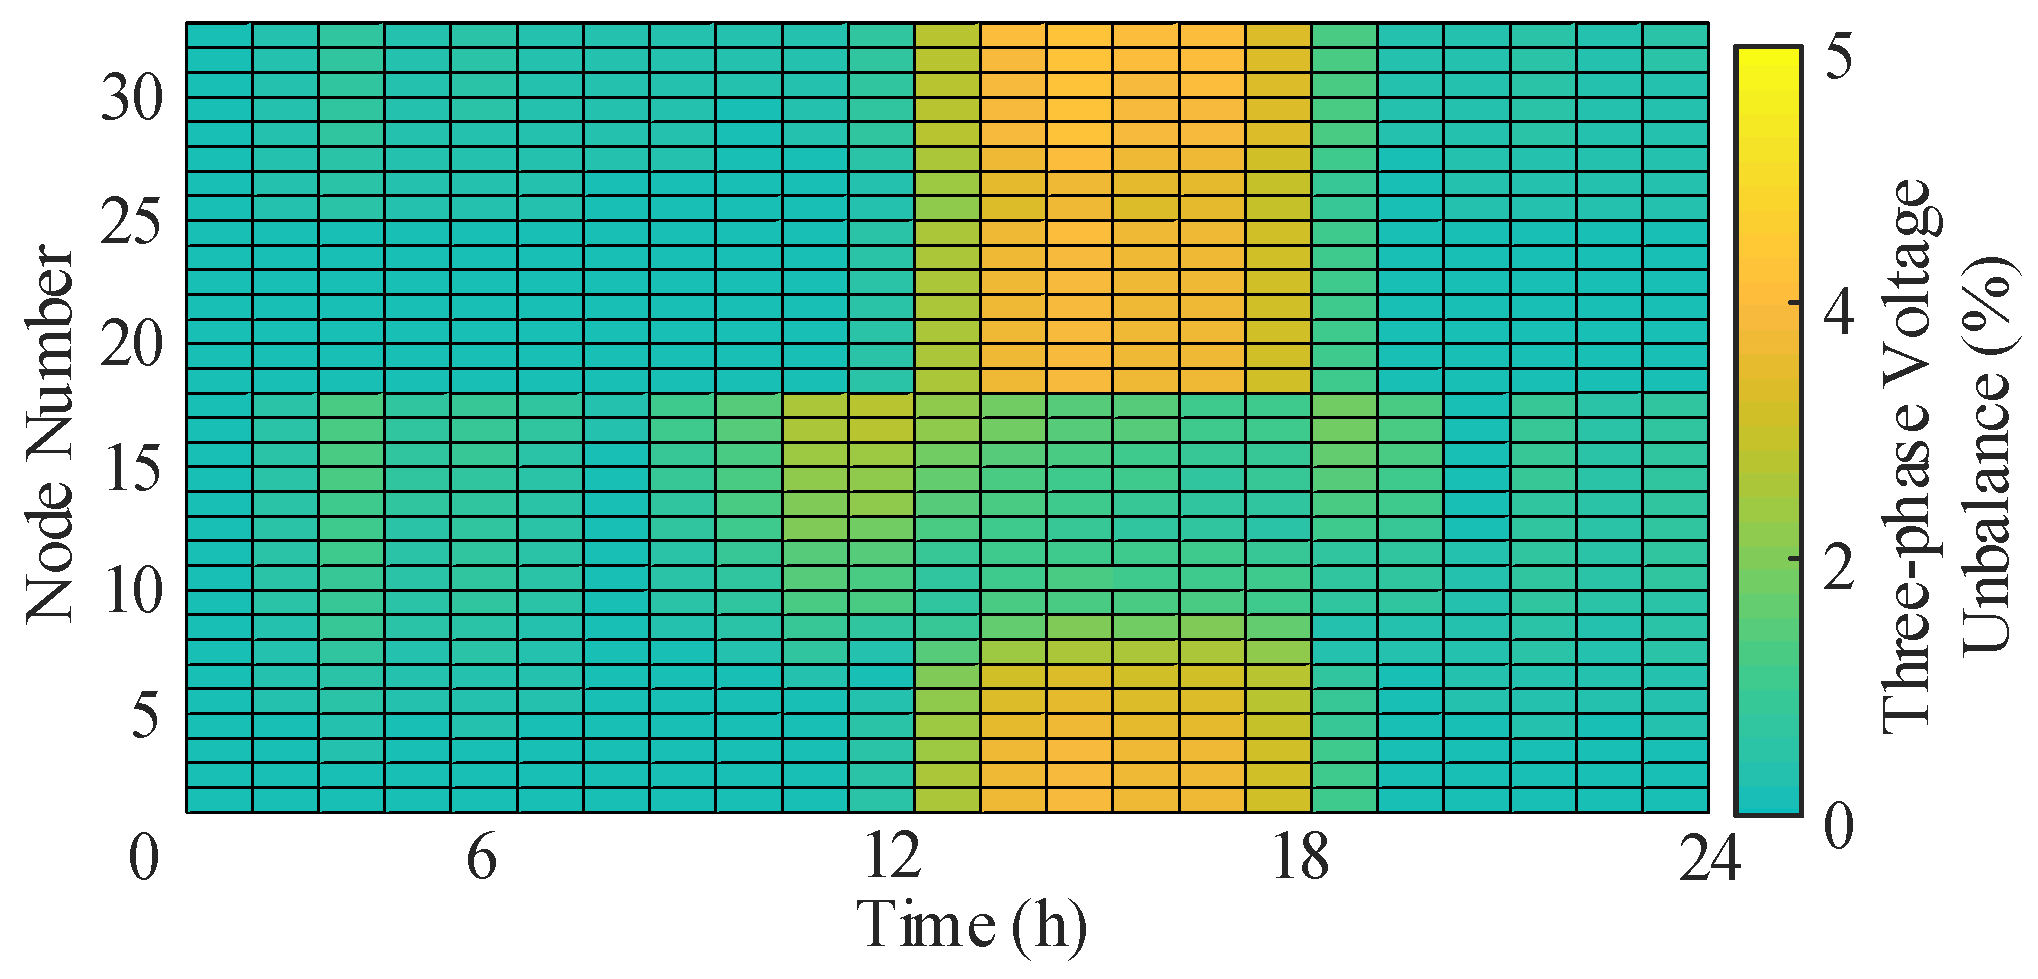
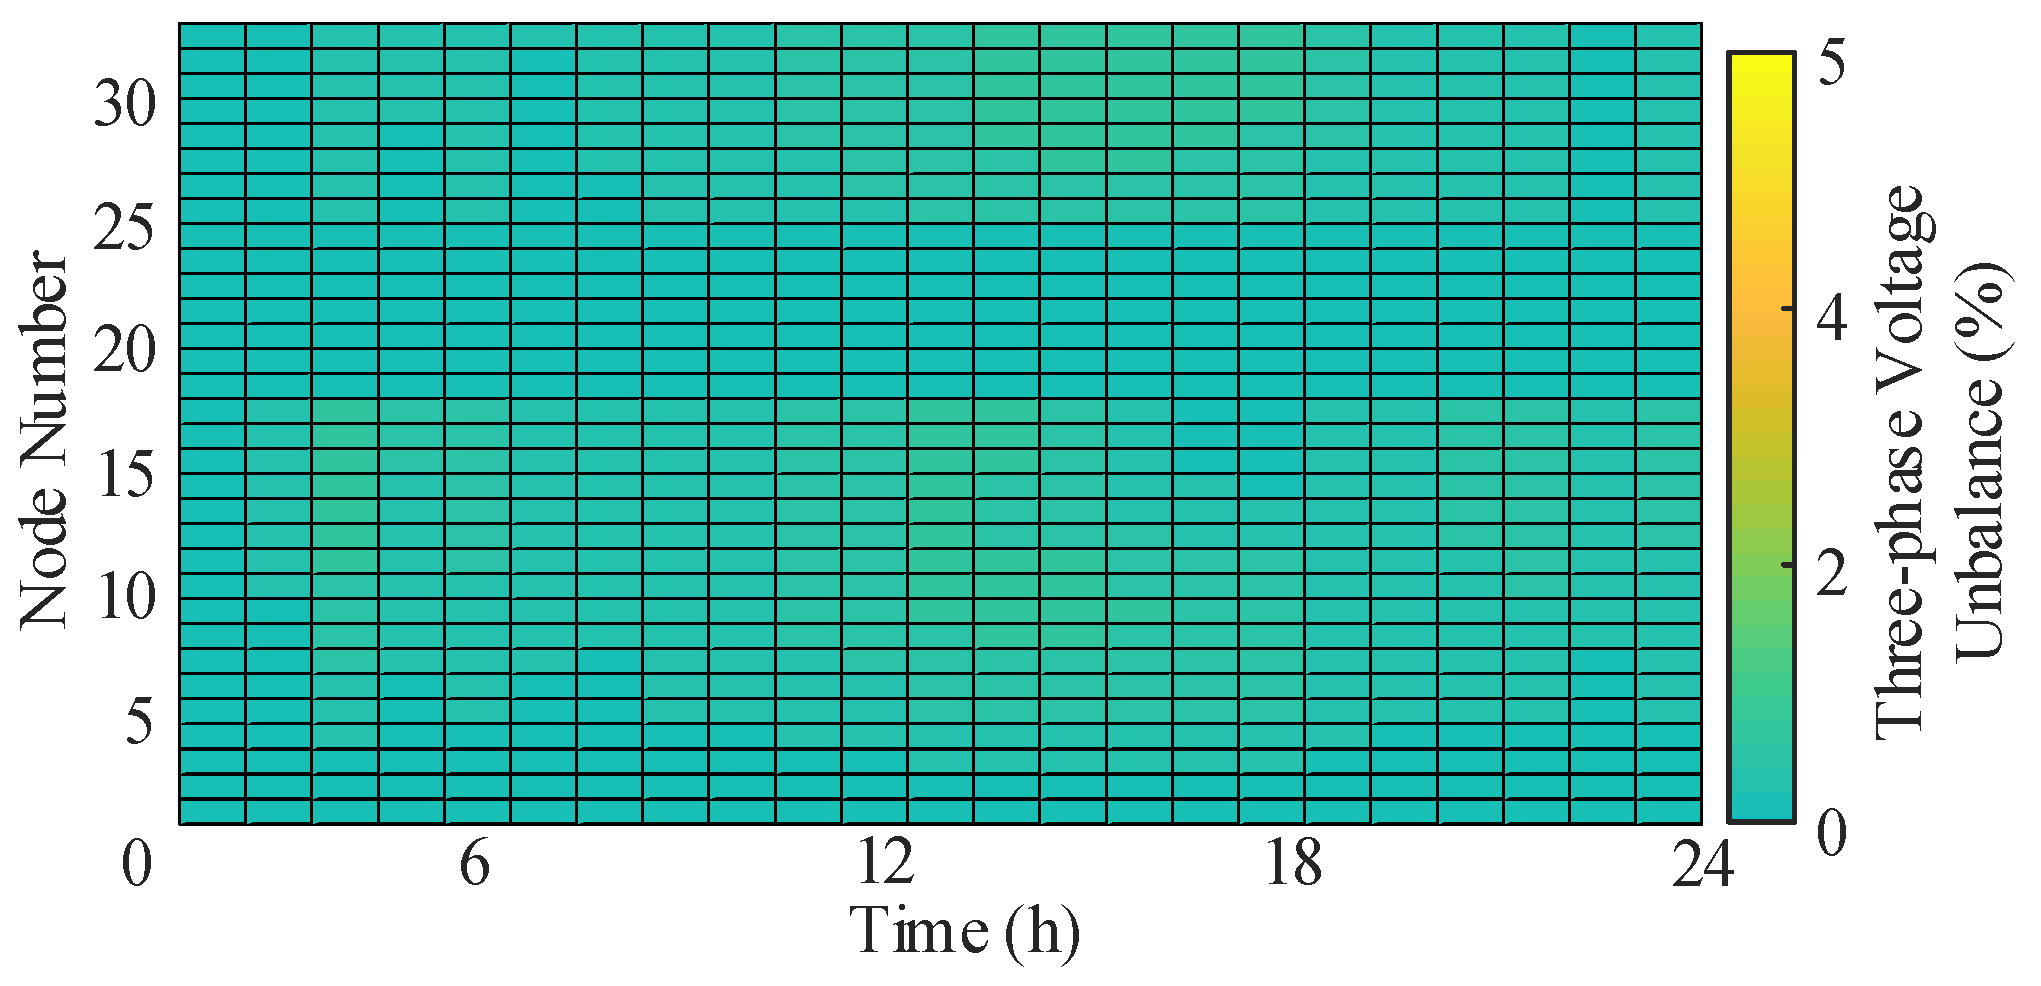
Figure 13 and Figure 14 show the results of three-phase imbalance in the distribution network before and after optimization. It can be seen that after implementing the strategy of coordinating F-SOP with reactive power compensation devices, the three-phase imbalance at each node improved significantly. The three-phase imbalance decreased from 5% before optimization to below 2%, further demonstrating the effectiveness of the method proposed in this paper. Therefore, this approach plays a crucial role in the sustainable development of power quality within distribution networks.

5.2.3. The Influence of Various Objective Weights

Based on the 9/9–9/1 scoring scale method [22,23], simulations were conducted by designating one indicator as ‘more important’ relative to the other two. The specific weighting settings are as follows:
Case 1: The target weights for line losses, overall voltage deviation, and voltage imbalance are 0.4, 0.3, and 0.3, respectively.
Case 2: The target weights for line losses, overall voltage deviation, and voltage imbalance are 0.3, 0.4, and 0.3, respectively.
Case 1: The target weights for line losses, overall voltage deviation, and voltage imbalance are 0.3, 0.3, and 0.4, respectively.
Table 3 demonstrates that the objective function achieves its minimum value when the target weight for overall voltage deviation is increased. This is attributable to the case study scenario involving a distribution network with a high proportion of distributed generation sources. Significant power generation surges occur during peak periods. Concurrently, while three-phase load imbalance exists, it is not particularly severe. The severity of voltage deviation outweighs that of network losses and three-phase imbalance. Addressing voltage deviation is therefore a more pressing priority. Consequently, the target weights for network losses, overall voltage deviation, and voltage imbalance in this study are set at 0.3, 0.4, and 0.3, respectively.

6. Conclusion

To address issues such as source–load mismatch, overvoltage, and three-phase imbalance caused by large-scale single-phase distributed PV systems connected to distribution grids, this paper proposes a multi-objective optimization method for flexible distribution networks with F-SOP based on fuzzy chance constraints. Through case study analysis, the following conclusions are drawn:
(1)
Regarding system network losses, compared to conventional three-phase imbalance mitigation methods, the approach proposed in this paper can significantly reduce both distribution network losses and reactive power output from reactive power compensation devices. Case study analysis indicates that the network losses in the proposed model decreased by 30.17% relative to traditional methods, while the utilization rate of reactive power compensation devices dropped from 84.85% to 68.19%.
(2)
Regarding voltage deviation, the maximum three-phase voltage in the distribution network was reduced to 1.029 p.u. in the method described herein. The minimum value of the three-phase voltage in the distribution network is 0.998 p.u. This method eliminates voltage over-limit conditions in the distribution network. Simultaneously, the overall three-phase voltage deviation in the distribution network under this approach is 192.95 p.u., meeting the ±7% range specified by national standards. Compared to unregulated and traditional regulation methods, this represents reductions of 46.32% and 21.39%, respectively.
(3)
Regarding three-phase imbalance, this method utilizes F-SOP’s intra-phase and inter-phase power transfer characteristics to achieve power exchange between relative phases at a single node. This effectively mitigates three-phase imbalance across node voltages. The three-phase imbalance achieved by this method is 7.43, representing reductions of 57.86% and 10.82% compared to Cases 1 and 2, respectively.
It should be noted that the methodology presented in this paper remains applicable to other complex distribution networks. Furthermore, the current research focuses solely on the operational issues of the distribution network following the selection of the F-SOP phase parameter. This method does not yet account for the impact of configuration issues in actual implementation—such as F-SOP device losses and capacity costs—on distribution network operation. Additionally, this method has not yet been applied to low-voltage distribution networks. When implementing F-SOP in low-voltage distribution networks, it is typically connected to the busbar on the transformer’s output side, enabling direct interconnection of geographically adjacent transformer substations. Simultaneously, artificial intelligence can address the challenges of obtaining topology and load data for low-voltage distribution networks. Furthermore, the selection of objective weights in this model involves a degree of subjectivity. The model has not yet employed hierarchical optimization methods to analyze the relationships among various objectives. The authors plan to conduct further in-depth research on the aforementioned aspects.

Author Contributions

Conceptualization, Z.L.; methodology, R.T. and C.Y.; software, R.T.; validation, X.P. and K.Z.; formal analysis, R.T.; investigation, X.P. and K.Z.; resources, C.Y.; data curation, K.Z.; writing—original draft preparation, R.T.; writing—review and editing, Z.L.; visualization, C.Y. and X.P.; supervision, Z.L.; project administration, Z.L.; funding acquisition, Z.L. All authors have read and agreed to the published version of the manuscript.

Funding

This research was funded by the Hunan Provincial Natural Science Foundation of China (2025JJ50232).

Institutional Review Board Statement

Not applicable.

Informed Consent Statement

Not applicable.

Data Availability Statement

The original data can be obtained from the corresponding author.

Conflicts of Interest

Author Zheng Lan is employed by Hunan University of Technology. The remaining authors declare that the research was conducted in the absence of any commercial or financial relationships that could be construed as a potential conflict of interest.

Abbreviations

The following abbreviations are used in this manuscript:
F-SOPFour-leg soft open point
PVphotovoltaic
SVGStatic VAR generator
CBCapacitor banks
VSCVoltage source converters
SOPSoft open point
SOCPSecond-order conic programming
P i , e , t loss Active power loss generated in phase e by the VSC of F-SOP access node i at time t
η F - SOP F-SOP power loss coefficient
P i , e , t F - SOP Active power transmitted by the VSC of F-SOP access node i in phase e at time t
Q i , e , t F - SOP Reactive power transmitted by the VSC of F-SOP access node i in phase e at time t
S i F - SOP Capacity of the VSC for F-SOP access node i
λ LIN Weighting factors for the network loss target
λ SYN Weighting factors for the overall voltage deviation target
λ UNB Weighting factors for the three-phase imbalance target
f LIN Actual measured distribution network loss target
f SYN Overall voltage deviation target
f UNB Three-phase imbalance target
μ LIN Weight for the network loss target
μ SYN Weight for the overall voltage deviation target
μ UNB Weight for the voltage imbalance target
f LIN 0 Initial values of the network loss target
f SYN 0 Initial values of the overall voltage deviation target
f UNB 0 Initial values of the three-phase imbalance target
N bus The number of nodes in the distribution network
I i j , e Branch current between nodes i and j in phase e
r i j , e Resistance between nodes i and j in phase e
Δ t The duration of a single time interval
V j , e The node voltage of node j in phase e
V N Reference voltage of the distribution network
d j Three-phase imbalance degree of the voltage at node j
L j Average value of the amplitude of the three-phase voltage at node j
p j , e Active power injected by node j into the e phase
q j , e Reactive power injected by node j into the e phase
P j k , e Active power flowing out from node j to its downstream node k in the direction of e
Q j k , e Reactive power flowing out from node j to its downstream node k in the direction of e
P i j , e Active power flowing out from node i to its downstream node j in the direction of e
Q i j , e Reactive power flowing out from node i to its downstream node j in the direction of e
x i j , e Reactance of link e between nodes i and j
g j , e Conductance of link e between nodes i and j
b j , e Admittance of link e between nodes i and j
V max The upper limits of node voltage for node j
V min The lower limits of node voltage for node j
I max The upper limits of the branch current between nodes i and j
I min The lower limits of the branch current between nodes i and j
P GRI , e , t Active power exchanged between the distribution network and the higher-level grid on phase e
Q GRI , e , t Reactive power exchanged between the distribution network and the higher-level grid on phase e
P GRI , max The maximum values of active power exchanged between the distribution network and the higher-level grid on phase e
Q GRI , max The maximum values of reactive power exchanged between the distribution network and the higher-level grid on phase e
P GRI , min The minimum values of active power exchanged between the distribution network and the higher-level grid on phase e
Q GRI , min The minimum values of reactive power exchanged between the distribution network and the higher-level grid on phase e
P j , e , t PV Actual output of the photovoltaic power station assembled at node j at time t in phase e
P j , e , t PV , PRE Predicted output of the photovoltaic power station assembled at node j at time t in phase e
Δ P j , e , t PV Error in photovoltaic output
Q j , e , t CB Reactive power compensation delivered by CB connected to node j at time t in phase e
y j , e , t CB The number of operational units for CB
Q j , e CB , step Compensation power for each group of CBs
Y j , e CB , max The upper limit of the number of groups connecting node j to CB
N j , e CB , max The upper limit for the number of CB operations
Q j , e , t SVG Reactive power compensation delivered by SVG connected to node j at time t in phase e
Q j , e SVG , min The lower limits of the SVG compensation power
Q j , e SVG , max The upper limits of the SVG compensation power
P load Active loads of the distribution network
Q load Reactive loads of the distribution network
P IN Active power is injected at each node of the distribution network
Q IN Reactive power is injected at each node of the distribution network
I ˜ i j , e The square of the branch current between node i and node j in phase e
V ˜ j , e The square of the node voltage at node i in phase e
P PV , i 1 PV membership degree parameter
P load , i 3 load membership degree parameter

References

  1. Elsayed, A.M.; El-Rifaie, A.M.; Areed, M.F.; Shaheen, A.M.; Atallah, M.O. Allocation and control of multi-devices voltage regulation in distribution systems via rough set theory and grasshopper algorithm: A practical study. Results Eng. 2025, 25, 103860. [Google Scholar] [CrossRef]
  2. Zhao, H.; Chen, W.; He, G.; Wang, J. A new shared module soft open point for power distribution network. IEEE Trans. Power Electron. 2022, 38, 3363–3374. [Google Scholar] [CrossRef]
  3. Wang, X.; Guo, Q.; Tu, C.; Xiao, F.; Chen, Z.; Luo, J.; Hou, Y. A hybrid advanced traction power supply equipment based on triple-port high-frequency isolated converter with its control strategy. IEEE Trans. Power Electron. 2025, 40, 10038–10048. [Google Scholar] [CrossRef]
  4. Liu, D.; Wang, W.; Wang, L.; Jia, H.; Shi, M. Dynamic pricing strategy of electric vehicle aggregators based on DDPG reinforcement learning algorithm. IEEE Access 2021, 9, 21556–21566. [Google Scholar] [CrossRef]
  5. Shaheen, A.M.; Ellien, A.R.; El-Rifaie, A.M.; El-Ela, A.A.; Ali, E.S. Performance assessment of modern distribution networks conjoined with electric vehicles in normal and faulty conditions. Sci. Afr. 2025, 28, e02630. [Google Scholar] [CrossRef]
  6. Nasef, A.F.; Alqahtani, M.H.; Shaheen, A.M. Technical and optimization insights into PV penetration in power distribution systems-based wild horse algorithm: Real cases on Egyptian networks. Results Eng. 2025, 25, 104603. [Google Scholar] [CrossRef]
  7. Aljumah, A.S.; Alqahtani, M.H.; Ginidi, A.R.; Shaheen, A.M. Improved Artificial Hummingbird Algorithm for Optimal Allocation of SVCs in Distribution Networks to Maximize Energy Efficiency. J. Mod. Power Syst. Clean Energy, 2025; early access. [Google Scholar]
  8. Zhang, D.; You, X.; Liu, S.; Pan, H. Dynamic multi-role adaptive collaborative ant colony optimization for robot path planning. IEEE Access 2020, 8, 129958–129974. [Google Scholar] [CrossRef]
  9. Liu, S.; Lin, Z.; Li, J.; Wen, F.; Ding, Y.; Wang, Q.; Lu, F.; Yang, L. Bi-level optimal placement model of phase switch devices for mitigating three-phase unbalance in low-voltage areas. IEEE Trans. Power Syst. 2022, 37, 3149–3152. [Google Scholar] [CrossRef]
  10. Razmi, D.; Lu, T.; Papari, B.; Akbari, E.; Fathi, G.; Ghadamyari, M. An overview on power quality issues and control strategies for distribution networks with the presence of distributed generation resources. IEEE Access 2023, 11, 10308–10325. [Google Scholar] [CrossRef]
  11. Zhang, J.; Chang, X.; Xue, Y.; Bai, X.; Li, Z.; Wang, P.; Sun, H. Optimal planning for electricity-gas-hydrogen integrated energy systems considering intertemporal long-term hydrogen storage and multiple uncertainties. IEEE Trans. Power Syst. 2025, 40, 4660–4674. [Google Scholar] [CrossRef]
  12. Luo, R.; He, Y.; Liu, J. Research on the unbalanced compensation of delta-connected cascaded H-bridge multilevel SVG. IEEE Trans. Ind. Electron. 2018, 65, 8667–8676. [Google Scholar] [CrossRef]
  13. Wang, H.; Wang, H. Analytical modeling and design of capacitor bank considering thermal coupling effect. IEEE Trans. Power Electron. 2020, 36, 2629–2640. [Google Scholar] [CrossRef]
  14. Wang, X.; Guo, Q.; Tu, C.; Li, J.; Xiao, F.; Wan, D. A two-stage optimal strategy for flexible interconnection distribution network considering the loss characteristic of key equipment. Int. J. Electr. Power Energy Syst. 2023, 152, 109232. [Google Scholar] [CrossRef]
  15. Wang, X.; Guo, Q.; Tu, C.; Che, L.; Yang, W.; Xiao, F.; Hou, Y. A two-layer control strategy for soft open points considering the economical operation area of transformers in active distribution networks. IEEE Trans. Sustain. Energy 2022, 13, 2184–2195. [Google Scholar] [CrossRef]
  16. Hong, L.; Qizhe, L.; Qiang, Z.; Zhengyang, X.; Shaohan, L. Optimal dispatch of unbalanced distribution networks with phase-changing soft open points based on safe reinforcement learning. Sustain. Energy Grids Netw. 2024, 40, 101521. [Google Scholar] [CrossRef]
  17. Lou, C.; Yang, J.; Li, T.; Vega-Fuentes, E. New phase—changing soft open point and impacts on optimising unbalanced power distribution networks. IET Gener. Transm. Distrib. 2020, 14, 5685–5696. [Google Scholar] [CrossRef]
  18. Lou, C.; Yang, J.; Vega-Fuentes, E.; Meena, N.K.; Min, L. Multi-terminal phase-changing soft open point SDP modeling for imbalance mitigation in active distribution networks. Int. J. Electr. Power Energy Syst. 2022, 142, 108228. [Google Scholar] [CrossRef]
  19. Cui, X.; Ruan, G.; Vallée, F.; Toubeau, J.F.; Wang, Y. A two-level coordination strategy for distribution network balancing. IEEE Trans. Smart Grid 2023, 15, 529–544. [Google Scholar] [CrossRef]
  20. Wang, X.; Guo, Q.; Tu, C.; Che, L.; Xu, Z.; Xiao, F.; Li, T.; Chen, L. A comprehensive control strategy for F-SOP considering three-phase imbalance and economic operation in ISLDN. IEEE Trans. Sustain. Energy 2024, 15, 149–159. [Google Scholar] [CrossRef]
  21. Chowdhury, M.M.U.T.; Biswas, B.D.; Kamalasadan, S. Second-order cone programming (SOCP) model for three phase optimal power flow (OPF) in active distribution networks. IEEE Trans. Smart Grid. 2023, 14, 3732–3743. [Google Scholar] [CrossRef]
  22. Han, T.; Chen, Y.; Ma, J.; Zhao, Y.; Chi, Y.Y. Surrogate modeling-based multi-objective dynamic VAR planning considering short-term voltage stability and transient stability. IEEE Trans. Power Syst. 2017, 33, 622–633. [Google Scholar] [CrossRef]
  23. Han, T.; Chen, Y.; Ma, J. Multi—objective robust dynamic VAR planning in power transmission girds for improving short—term voltage stability under uncertainties. IET Gener. Transm. Distrib. 2018, 12, 1929–1940. [Google Scholar] [CrossRef]
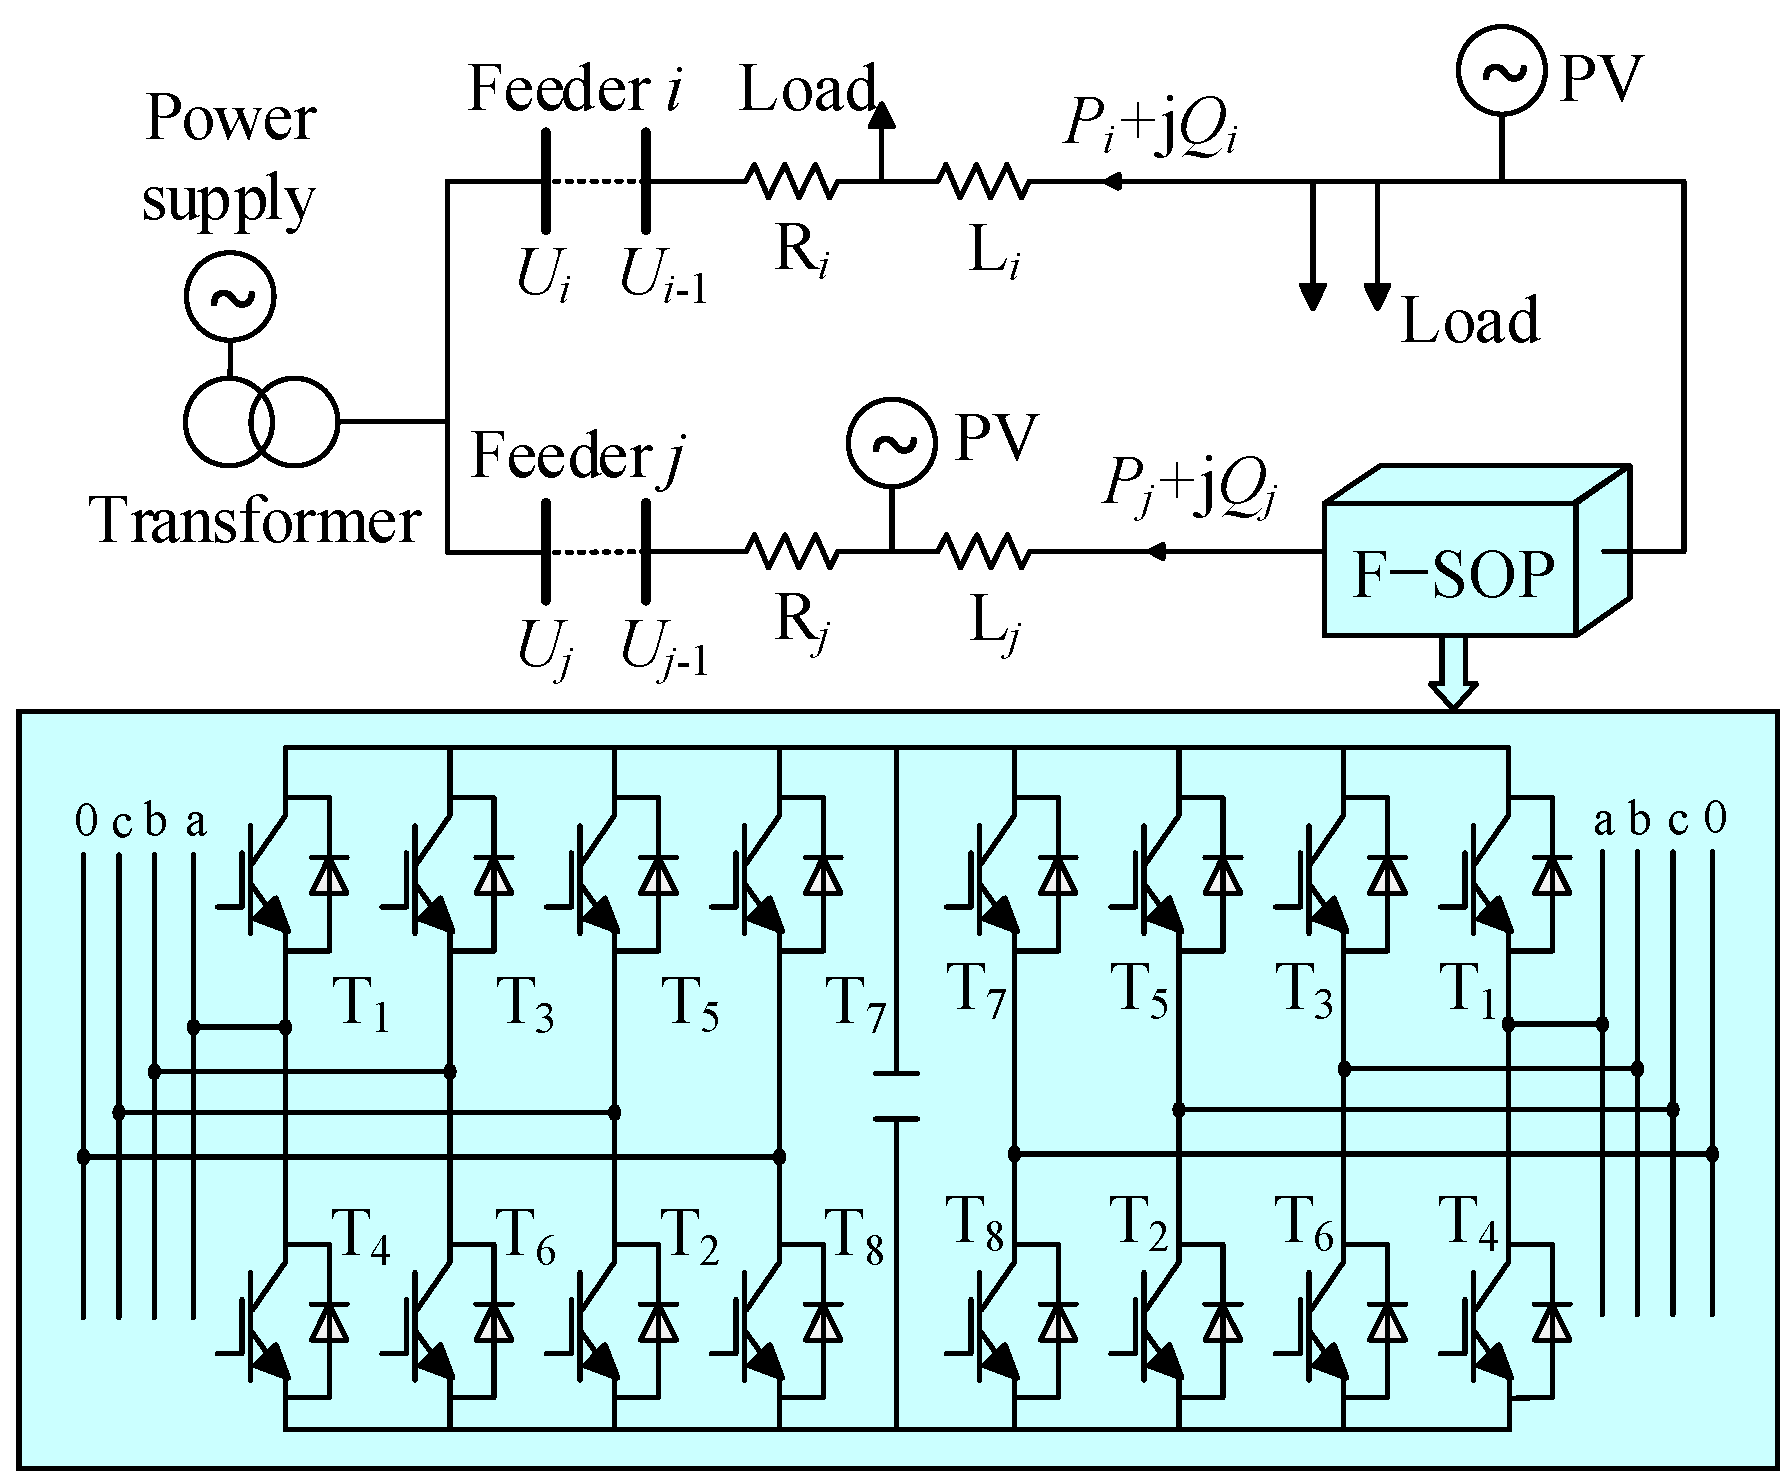
Figure 1. Schematic diagram of FSOP topology and installation location.
Sustainability 17 09510 g001
Figure 2. Multi-objective control strategy flowchart.
Sustainability 17 09510 g002
Figure 3. Source-load uncertainty characterization and approximate transformation process.
Sustainability 17 09510 g003
Figure 4. IEEE33 node distribution network topology.
Sustainability 17 09510 g004
Figure 5. Predicted data for each phase load.
Sustainability 17 09510 g005
Figure 6. PV forecast data.
Sustainability 17 09510 g006
Figure 7. CB three-phase total reactive power compensation results before and after optimization.
Sustainability 17 09510 g007
Figure 8. SVG three-phase total reactive power compensation results before and after optimization.
Sustainability 17 09510 g008
Figure 9. Active power transmitted by F-SOP.
Sustainability 17 09510 g009
Figure 10. Reactive power transmitted via F-SOP.
Sustainability 17 09510 g010
Figure 11. Phase A voltage at node 32 at different times.
Sustainability 17 09510 g011
Figure 12. Three-phase average voltage at each node.
Sustainability 17 09510 g012
Figure 13. Result of voltage unbalance in the three-phase system for Case 2.
Sustainability 17 09510 g013
Figure 14. Result of voltage unbalance in the three-phase system for Case 3.
Sustainability 17 09510 g014
Table 1. Phase and capacity parameters for DPV installation at each node.
PV NumberConnected NodesPhaseGrid-Connected Inverter Capacity/kVA
12A500
24A400
37B800
49A800
513B800
616B1300
718C1100
825C300
926A800
1029C850
Table 2. Optimization results across various cases.
CaseNetwork
Losses/kW
Overall Voltage
Deviation/p.u.
Three-Phase
Imbalance
16013.57359.4317.63
25237.43245.458.33
34199.32192.957.43
Table 3. Results of the calculation example with different weight settings.
CaseNetwork
Losses/kW
Overall Voltage
Deviation/p.u.
Three-Phase
Imbalance
16013.57359.4317.63
25237.43245.458.33
34199.32192.957.43
Disclaimer/Publisher’s Note: The statements, opinions and data contained in all publications are solely those of the individual author(s) and contributor(s) and not of MDPI and/or the editor(s). MDPI and/or the editor(s) disclaim responsibility for any injury to people or property resulting from any ideas, methods, instructions or products referred to in the content.