Article

Hydrogen Strategies Under Uncertainty: Risk-Averse Choices for Green Hydrogen Pathways

1
Faculty of Engineering and Sciences, Universitas Mercatorum, 00186 Roma, Italy
2
Department of Engineering, University of Rome “Niccolò Cusano”, 00166 Rome, Italy
3
Department of Mechanical, Energy and Management Engineering, University of Calabria, 87036 Cosenza, Italy
*
Author to whom correspondence should be addressed.
Sustainability 2025, 17(21), 9475; https://doi.org/10.3390/su17219475 (registering DOI)
Submission received: 30 July 2025 / Revised: 13 October 2025 / Accepted: 21 October 2025 / Published: 24 October 2025
(This article belongs to the Section Energy Sustainability)

Abstract

The last decade has been characterized by a growing environmental awareness and the rise of climate change concerns. Continuous advancement of renewable energy technologies in this context has taken a central stage on the global agenda, leading to a diverse array of innovations, ranging from cutting-edge green energy production technologies to advanced energy storage solutions. In this evolving context, ensuring the sustainability of energy systems—through the reduction of carbon emissions, enhancement of energy resilience, and responsible resource integration—has become a primary objective of modern energy planning. The integration of hydrogen technologies for power-to-gas (P2G) and power-to-power (P2P) and energy storage systems is one of the areas where the most remarkable progress is being made. However, real case implementations are lagging behind expectations due to large-scale investments needed, which, under high energy price uncertainty, act as a barrier to widespread adoption. This study proposes a risk-averse approach for sizing an Integrated Hybrid Energy System considering the uncertainty of electricity and gas prices. The problem is formulated as a mixed-integer program and tested on a real-world case study. The analysis sheds light on the value of synergies and innovative solutions that hold the promise of a cleaner, more sustainable future for generations to come.

1. Introduction

The issue of energy plays a prominent role in the international arena. Indeed, in recent decades, there has been an increasing need to reduce dependence on fossil fuels by making room for renewables. This process to achieve a phase-out from fossil fuels, called energy transition, is not immediate but slow and gradual. Through this process, green sources—those that have a very low cost in terms of environmental impact—can make a decisive contribution to the abatement of CO 2 emissions and all the problems that they entail.
The global rising shift towards renewable energy resources has urged practitioners and researchers in the energy sector to develop a large body of scientific contributions on the integration of clean energy sources into energy systems. The volatility and intermittency of such resources is handled through storage systems and for their ability to compensate possible mismatches between demand and supply. There are, however, areas called “hard to decarbonize” in which getting rid of fossil sources is a pipe dream. These certainly include meeting the thermal and cooling load, which is nowadays mainly covered by natural gas or coal. Indeed, the European Commission’s Energy Performance of Buildings Directive states that approximately 40% of energy consumed in the EU is used in buildings, primarily for heating, cooling, and hot water. This information is based on data from Eurostat energy balances and the European Environment Agency’s Greenhouse Gas Inventory, 2023. Hence, this sector accounts for a significant proportion of primary energy consumption. The integration of different energy resources into an Integrated Hybrid Energy System (HES) can provide a viable solution for this problem (Menniti et al. [1], Cambini et al. [2,3]).
An HES is an integrated framework, where the different energy production conversion and storage technologies are used to supply different demand loads over a long planning horizon. The optimal sizing is a crucial aspect of the design of a reliable and cost-efficient energy system that should be able to maximize the use of renewable sources to meet energy consumption (Cambini et al. [2,3], Zhou et al. [4], Yang et al. [5], Beraldi and Khodaparasti [6,7]). Combined cooling, heat and power systems offer high net efficiencies by recovering and using waste heat to meet thermal load. They are normally fueled from the natural gas grid, connected to a generator to produce electrical energy and a series of heat exchangers to recover thermal energy from both the engine exhaust and coolant.
The blending of hydrogen generated using clean energy into natural gas can efficiently support hard to decarbonize sectors, especially in an HES, when hydrogen is used as a fuel, both to be blended with natural gas and to be converted into electricity in a hydrogen fuel cell (FC). Hydrogen FCs are highly efficient, with an efficiency of up to 60% (Fan et al. [8]), and produce no harmful emissions since the only by-products are water-consumed and heat-produced. However, the development of the low-carbon hydrogen economy requires investment in both supply and demand: production necessitates investments in electrolyzers, and the use of hydrogen on the demand side often either requires re-calibration of the existing equipment or urges the acquisition of new equipment.
Due to the volatile nature of economy in the post-pandemic era, unpredictable price fluctuations may hinder green hydrogen projects, preventing them from reaching the necessary speed and scale to fulfill global climate goals. While many studies have examined the influence of uncertainty associated with the energy production from renewable sources and loads, economic uncertainty has not yet been investigated for optimal sizing of a HES. For this reason, the study looks into the effect of economic uncertainty on the optimal sizing of an HES.
A common approach under uncertainty is to consider a risk-neutral viewpoint, notably implemented through the minimization of the expected value of the random objective function. However, often, the decision maker is risk-averse (Beraldi and Khodaparasti [6]) and, hence, more interested in hedging against extreme realizations. Tostado-Veliz et al. [9] propose an optimization framework for electrolyzer sizing in industrial parks, where uncertainties in electricity prices, renewable generation and demand are incorporated through a robust optimization approach. Similarly, Wang et al. [10] develop a multi-objective distributionally robust optimization model for hydrogen–renewable energy-integrated systems. In the context of data-driven approaches, Zheng et al. [11] formulate a robust chance-constrained model for wind–hydrogen energy systems. Similarly, Liu et al. [12] develop a distributionally robust scheduling model for port energy systems with hydrogen production and ammonia synthesis. Aramoon et al. [13] present a techno-economic and optimal sizing of an off-grid photovoltaic-diesel generator-fuel cell system, where the load uncertainty is modeled by information gap decision theory. In this paper, with a view to minimizing costs, we propose a risk-averse approach to optimally design an HES in which there are different energy sources, different technologies, and devices aimed at best meeting the demand arising from the utilities. Xuan et al. [14] explicitly incorporate risk in a two-stage stochastic model for the optimal planning of an energy system. In the first stage, decisions concerning the investments made to size the system are considered, while the second stage represents operational decisions. Risk aversion is introduced in the paper through scenario-based Conditional Value-at-Risk (CVaR), expressed as a linear optimization problem, which ensures tractability even for large scenario trees. This linearity comes at the cost of strong dependence on the discretization of uncertainty, namely, the quality and size of the scenario set. This makes the measure potentially unstable when the scenario set poorly represents low-probability/high-impact events, potentially undermining the robustness of strategic decisions and distorting the evaluation of rare but impactful risks.
A distinctive feature of our paper is the incorporation of a non-scenario-based risk measure in a comprehensive multi-energy model. In particular, we provide a unified perspective on solving the problem under different risk measures in closed, yet nonlinear, form. These risk measures are not tied to a specific discretization, instead providing consistent evaluations of risk across different scenario approximations or family of plausible probability distributions, leading to more stable decisions for long-term, system-level energy planning. To the best of our knowledge this is the first contribution dealing with the problem at hand which simultaneously considers risk, through the explicit incorporation of risk measures, and distributional ambiguity. The paper contributions are therefore the following:
  • The development of a complete optimization-based methodological framework for the design of an HES. The coordinated system differs from traditional energy systems in its holistic, flexible, and interconnected approach.
  • Most of the literature has focused on uncertainties in renewable energy production or load variability, overlooking the effects of the uncertainty on system costs. In contrast, we consider economic model parameters uncertain in the design stage allowing for a more realistic assessment of risk, particularly when gas/energy prices can fluctuate significantly.
  • The incorporation of a non-scenario-based risk measure within a comprehensive multi-energy system design model. Unlike traditional scenario-based approaches, this formulation does not rely on a finite set of sampled scenarios.
  • The application of the framework to a case study to illustrate the insights that can be generated and to highlight the importance of uncertainty considerations.
This work addresses sustainability by (i) defining and quantifying key indicators ( CO 2 -related costs, renewable contribution, energy self-sufficiency, and exposure to price volatility); (ii) providing a tool to measure and monitor these indicators under uncertainty; and (iii) evaluating policies and incentives that enable green hydrogen deployment. The proposed framework supports integrated socio-economic and scientific approaches to sustainable development, contributing directly to global objectives such as SDG7—Affordable and Clean Energy and SDG13—Climate Action ([15]).
The rest of this paper is organized as follows: Section 2 discusses the structure of the system and the mathematical formulation. introduces the problem under risk. Section 3 presents the computational results, and finally, Section 4 concludes this paper and provides some promising research avenues for future studies.

2. The Integrated Hybrid Energy System: Problem Description and Mathematical Formulation

The structure of the HES is shown in Figure 1. Four different types of energy demand loads were considered: electricity load, thermal load (heating or cooling), and hydrogen load for charging fuel cell electric cars at charging stations.
In Figure 1, it can be seen that the system can be divided into three parts: electricity production, energy storage and utilization (where utilization means the conversion of energy into other forms of energy), and energy demand. The first part essentially consists of the power grid, to be used only in cases where needs cannot be met in other ways. There is also a wind farm and a photovoltaic field that contribute to direct electricity generation. Note that the cogenerator also produces electricity but not directly, since the primary energy source is natural gas. For this reason, it is represented in the energy utilization and conversion part. The latter part is somewhat complex; basically there are both electrical and thermal storage within which any surplus electrical and thermal energy can be stored. The electrical storage is essentially a battery. From the point of view of thermal load, there is an electric boiler, which receives as input an electric power and produces a thermal power. Its operation is based on the Joule effect, whereby a current-crossed resistance dissipates heat. In addition, there is a gas boiler that makes use of natural gas and its energy content that is burned. Subsequently, heat from the combustion products is transferred through a countercurrent heat exchanger to a heat transfer fluid. This device has a design feature of considerable interest: it is capable of operating with a mixture of hydrogen and natural gas, where the amount of hydrogen is limited by operational constraints. Another system featured in the central portion of Figure 1 is an electrolyzer aimed at hydrogen production. Finally, to ensure that the cooling load is met, there is an absorption chiller and an electric chiller that are reverse cycle machines to be designed appropriately. The third part of the HES is the electrical, thermal and cooling needs of the utilities.

Mathematical Formulation

In this section, the mathematical mixed integer programming model of the HES is described in detail. The goal is to find the optimal capacity installation (sizing) of different technologies in the HES minimizing the annual cost expressed in terms of investment, operating and maintenance costs, environmental costs, and the costs for the energy purchase. The excess of energy produced can be sold, producing a revenue. Instead of considering the optimal design and optimal operation of integrated energy systems as separated problems, we propose an integrated model, where long-run sizing/capacity installation and operational scheduling decisions are both involved. To account for different evaluation cycles—the optimal design should be considered an entire life cycle, usually 20 years, whereas the optimal operation can be considered on a daily basis—we consider an extended planning horizon of a representative year discretized in terms of days and hours to better reflect the variation of the renewable resource, demand load, and energy price. The set M = { 1 ,   ,   m ,   ,   M } was used to denote the set of months. For each month, a nominal day was discretized into T periods, corresponding to hours ( T = { 1 ,   ,   t ,   ,   T } ) . In what follows, we model the operations of different energy production, conversion, and storage devices followed by the description of the objective function. In the model presented in the following subsections, an hourly time discretization was adopted, meaning that each time instant has a duration of one hour ( Δ t = 1 ). Consequently, all power-related quantities are expressed in kilowatts (kW), while the corresponding energy terms—obtained by integrating power over a single time interval—are expressed in kilowatt-hours (kWh). The capacities and state variables of storage devices therefore represent energy amounts (kWh). For simplicity, the equations are formulated under the assumption of a one-hour time instant; thus, the factor Δ t is omitted from the expressions, being implicitly equal to one hour.
  • Photovoltaic System: The Photovoltaic (PV) system consists of solar panels that convert the sunlight into electric power. The area that can be dedicated to the solar panels, A P V M a x ( m 2 ), is bounded by the parameter A A v a i l a b l e , which is the maximum available area. The electric power output of the PV system on the nominal day of month m at time instant t, P P V m t (kW), is defined as
    P P V m t = η P V I m t A P V M a x
    P P V m t Γ P V c a p
    A P V M a x A A v a i l a b l e
    where η P V and I m t (kW/m2) are, respectively, the PV panel efficiency and the solar radiation intensity on the nominal day of month m at time instant t; also, Γ P V c a p denotes the nominal peak power of the PV system. The low energy density is among the greatest limitations of this technology, which requires considerable areas for the production of modest powers. In our case, we set the efficiency of the photovoltaic module equal to 15 % that is in line with an average monocrystalline module.
  • Combined Heat and Power Plant: The Combined Heat and Power (CHP) plant converts the fuel into electric power. Utilizing H2-NG technology, the fuel consumption in the CHP can incorporate both hydrogen and natural gas. This approach notably decreases methane usage and the overall carbon emissions. The proportion of hydrogen in the mixed gas must remain within a certain range, typically not exceeding 20% of the total volume. The following equation describes the relationship between fuel usage and electric power output in the CHP.
    G H 2 , C H P m t + G C H P m t = ζ 1 P C H P m t + ζ 2 U C H P m t
    G H 2 , C H P m t κ H 2 ( G H 2 , C H P m t + G C H P m t )
    where G H 2 , C H P m t and G C H P m t (kW) denote, respectively, the hydrogen and natural gas fuel consumption in the CHP on the nominal day of month m at time t; P C H P m t (kW) denotes the electric power output; the binary variable U C H P m t is set to one or zero depending on the state of the CHP (either on or off). Parameters ζ 1 and ζ 2 represent the conversion of fuel to electric power in the CHP. In addition, parameter κ H 2 displays the hydrogen blending ratio that is set to 20%.
    Constraint (6) describes the relation between CHP state and the electric power output where M is a sufficiently large constant ( M Γ C H P c a p ) , and parameter Γ C H P c a p (kW) in constraint (7) denotes the maximum electrical output in the CHP.
    P C H P m t M U C H P m t
    P C H P m t Γ C H P c a p
    In addition, waste heat from combustion can be exploited to produce thermal power to cover the thermal load. The thermal output of the CHP on the nominal day of month m at time t ( H C H P m t in kW) is expressed as
    H C H P m t = P C H P m t ( 1 η C H P η L o s s ) η C H P
    where η C H P and η L o s s , respectively, represent the power generation efficiency and heat dissipation loss coefficient.
  • Electrolyzer: The electrolyzer unit is the critical component in the power-to-gas process converting the electric power into hydrogen. The operation of the electrolyzer is modeled as
    H P r o d m t = η E L P E L m t L H V H 2
    where P E L m t and H P r o d m t are the power input and hydrogen output of the electrolyzer on the nominal day of month m at time t; under the hourly discretization ( Δ t = 1 h ), H Prod m t denotes the kilograms of hydrogen produced during time instant t (kg). Since P E L m t / L H V H 2 has units of kg h−1, multiplying by Δ t = 1 h yields kg per step. For a generic Δ t , the right-hand side of (9) would be Δ t η E L P E L m t / L H V H 2 .
    The Lower Heating Value (LHV) is set to 33.33 kWh/kg.
    G H 2 , T o t m t = L H V H 2 H P r o d m t
    Constraint (10) shows the relation between the amount hydrogen production and consumption where G H 2 , T o t m t (kW) represents the available hydrogen fuel in the system.
    Clearly, the electrolyzer power input is bounded by the installed capacity Γ E L c a p
    P E L m t Γ E L c a p
  • Gas Boiler: The natural gas blended with the hydrogen (produced by the electrolyzer) was injected as the fuel into the GB which is a thermal equipment supplying thermal power. This process is modeled as
    H G B m t = η G B ( G G B m t + G H 2 , G B m t )
    H G B m t H G B c a p
    where variables G G B m t , G H 2 , G B m t (kW) represent the energy rate equivalent of natural gas and hydrogen consumption; H G B m t (kW) is the thermal power generated by GB on the nominal day of month m at time t, and H G B c a p displays the installation capacity of GB. Finally, parameter η G B describes the GB efficiency. Similar to the case of CHP, the percentage of hydrogen blended with natural gas should be below a maximum value of κ H 2 .
    G H 2 , G B m t κ H 2 ( G G B m t + G H 2 , G B m t )
  • Electric Boiler: The Electric Boiler (EB) is another thermal device taking the electric power as the input and produces the heating power
    H E B m t = η E B P E B m t
    P E B m t Γ E B c a p
    Variables H E B m t and P EB m t (kW) in (15), represent, respectively, the thermal output and the electrical power input of the EB; parameter η E B denotes the EB efficiency, and variable Γ E B c a p (kW) in (16) is the power capacity of the EB.
  • Electric Chiller: In order to supply the cooling load, the HES operates an electric chiller (EC) working on a reversed-cycle machines aimed to satisfy a cooling load, which is primarily present in but not limited to the summer season.
    The operation of the EC is described as
    Q E C m t = η E C P E C m t
    P E C m t Γ E C c a p
    where Q E C m t and P E C m t (kW) are, respectively, the cooling output and the electric power input in the EC. Variable Γ E C c a p represents the capacity of EC.
  • Absorption Chiller: The Absorption Chiller (AC) absorbs the wasted heat and turns it into cooling power. The following constraints describe the AC operations
    Q A C m t = η A C H A C m t
    Q A C m t Γ A C c a p
    where Q A C m t and H A C m t (kW) are the cooling power output and the heating input in the AC with the efficiency parameter η A C . The variable Γ A C c a p denotes the capacity installation of AC.
  • Hydrogen Fuel Cell: Hydrogen can be injected into the Hydrogen fuel cell (HFC) to produce electric and thermal power.
    The HFC operation are described by the following constraints:
    P H F C m t = η H F C e G H 2 , H F C m t
    H H F C m t = η H F C h G H 2 , H F C m t
    G H 2 , H F C m t Γ H F C c a p
    where G H 2 , H F C m t and P H F C m t ( H H F C m t ) are, respectively, the hydrogen input and power (thermal) output of HFC, all in kW. Parameters η H F C e and η H F C h represent the electricity and thermal generation efficiency of the HFC, and variable Γ H F C c a p is the HFC installed capacity.
  • Hydrogen Storage Tank: The hydrogen produced by the EL can be stored into the hydrogen storage tank (HST) to be utilized by the GB, the CHP, and the HFC, or to satisfy the hydrogen load of the fuel cell electric vehicles. The operation of the HST is modeled by constraints (24)–(29).
    S H S T m t Γ H S T c a p
    P H S T , c h m t ( Γ H S T c a p S H S T m t ) 1 Δ t
    P H S T , d i s m t S H S T m t 1 Δ t
    S H S T m t 1 = S H S T m t
    S H S T m t 1 = S H S T 0
    S H S T m t = S H S T m t 1 + ( P H S T , c h m t P H S T , d i s m t ) Δ t
    where Δ t = 1 , Γ H S T c a p is the installed capacity of the HST; S H S T m t is the state of the charge; variables P H S T , c h m t and P H S T , d i s m t show the hydrogen charging and discharging in the HST. The input parameter S H S T 0 denotes the initial state of the charge in HST.
  • Battery Storage System: When the total power generation is greater than the total load or the electricity price drastically drops, and it is very convenient to purchase some extra power, electricity can be stored in a Battery Storage System (BSS). From the battery, electric energy can be used in times of need, to make up for any peaks not covered by intermittent power generation from renewable energy sources. To model the operation of the BSS, we introduce non-negative variables S B T m t , Γ B T c a p (kWh) and P B T , c h m t , P B T , d i s m t (kW) indicating, respectively, the state of the battery on the nominal day of month m at time t and the installation capacity of BSS, and the power charging and discharging of the BSS on the nominal day of month m at time t. We also should add the set of constraints (30)–(33).
    S B T m t = S B T m t 1 ( 1 δ B T ) + ( η B T c h P B T , c h m t P B T , d i s m t η B T d i s ) Δ t
    S B T m t Γ B T c a p
    P B T , c h m t ( Γ B T c a p S B T m t ) 1 Δ t
    P B T , d i s m t S B T m , t 1 Δ t
    where Δ t = 1 . Constraint (30) expresses the connection between the state of the charge within every two consecutive time instants with the amount of charging and discharging power. Parameters δ B T and η B T c h ( η B T d i s ) display, respectively, the energy loss rate and the charging (discharging) efficiency. Constraint (31) expresses the relation between the state of the charge and the installed capacity. Constraints (32) and (33) express the logical bounds on the power charge and discharge. Since the technology in BSS does not allow simultaneous power charge and discharge, we introduced binary variables χ B T m t and added the set of constraints in (34) and (35) where M is an arbitrary big number.
    P B T , c h m t M χ B T m t
    P B T , d i s m t M ( 1 χ B T m t )
As mentioned earlier, the HES is responsible for satisfying four types of demand: electric, cooling, heating and hydrogen loads. The set of constraints (36)–(39) show the power balance constraints for each type of demand.
P B u y m t + P P V m t + P W T m t + P C H P m t + P H F C m t + P B T , d i s m t = P L o a d m t + P S e l l m t + P E B m t + P E C m t + P E L m t + P B T , c h m t
H C H P m t + H E B m t + H G B m t + H H F C m t = H L o a d m t + H A C m t
Q A C m t + Q E C m t = Q L o a d m t
G L o a d m t + G H 2 , G B m t + G H 2 , C H P m t + G H 2 , H F C m t + P H S T , c h m t = G H 2 , T o t m t + P H S T , d i s m t
where parameters P L o a d m t , H L o a d m t , Q L o a d m t , and G L o a d m t , respectively, denote the electric, heating, cooling, and hydrogen demand loads. The parameter P W T m t represents electric power generation in the WT. Variable P B u y m t ( P S e l l m t ) shows the amount of electricity (in kW) purchased from the grid.
The objective function seeks the minimization of costs expressed in terms of the investment cost C I n v , energy exchange cost C E P C , environmental costs C CO 2 (CO2 emission), and device operating and maintenance expenses C O M , considered over a representative year.
min Z = C I n v + C E P C + C CO 2 + C O M
where
C I n v = m = 1 M t = 1 T k = 1 K γ k Γ k cap i ( 1 + i ) Y k ( 1 + i ) Y k 1
C E P C = m = 1 M t = 1 T N m λ m , t Buy P m , t Buy λ m , t Sell P m , t Sell + β Gas G m , t C H P + G m , t G B
C CO 2 = m = 1 M t = 1 T N m ϕ e P m , t Buy + P m , t C H P + ϕ g G m , t C H P + G m , t G B
C O M = m = 1 M t = 1 T k = 1 K ε k Γ k cap
In (41), γ k and Y k denote the installation costs per unit of capacity and the life cycle of device k (K represents the total number of energy devices in the HES). Here, i represents the interest rate. Variable Γ k c a p represents the capacity installation of device k. As observed, the investment costs are calculated by taking into account the annual depreciation as a function of device life cycle. In (42), β G a s and λ B u y are the gas and electricity purchase price from gas and grid network, respectively, while λ S e l l is the selling price. N m is the number of days for month m. Variables ( G C H P m t and G G B m t ) are the amount of natural gas bought from the gas network to supply the methane fuel for the CHP and the GB, respectively. Parameters ϕ e and ϕ g show the market carbon tax price of energy and gas flows. Clearly, we do not consider any compensation for the electric power produced by the HFC since it is carbon-free. Finally, the parameter ε k in (44) represents the unit maintenance cost of device k.
Let us now assume that the purchase prices β G a s , λ B u y and the selling price λ S e l l are uncertain, and let us denote the random variables with β ˜ G a s , λ ˜ B u y and λ ˜ S e l l . Then, the total energy exchange cost C E P C becomes itself a random variable C ˜ E P C governed by a probability distribution function F X , defined on a given probability space ( Ω ,   F ,   P ) , where F is a σ -algebra of subsets of Ω . Under uncertainty a very popular approach is the minimization of the expected value of the random costs. However, under volatile and dynamically changing conditions, it is preferable to adopt a risk-averse viewpoint through a proper definition of a risk function.
This kind of measure defines a mapping ρ : C ˜ E P C R that associates a scalar value (measuring risk) to the random variable, provided that its moment-generating function M X ( z ) = E ( e z X ) exists for all z 0 . The Value at Risk ( V a R ) has been extensively used as a risk measure in a variety of contexts. It is defined as the α percentile of the random variable. V a R is lower than realizations whose cumulative probability is less than 1 α and is then equivalent to the left-continuous inverse of the cumulative distribution function ( F 1 ( α )). the V a R can be formally defined as follows:
V a R α = inf η ( η | F ( η ) α )
where F ( η ) = P ( C ˜ E P C η ) . Despite its wide use, an important drawback of the VaR measure is that it does not consider the expected value of the worst cases, i.e., what happens when the V a R is exceeded. To overcome this important weakness, the Conditional V a R (denoted by C V a R α ) was proposed as a risk measure closely linked to V a R but providing several distinct advantages, among which coherency and convexity. Basically, CVaR is defined as the average of the α % worst cases and can be described as follows:
C V a R α = E [ C ˜ E P C | C ˜ E P C V a R α ] .
If F X is continuous, then we have
C V a R α = 1 1 α α 1 V a R p d p
The evaluation of the CVaR is possible when the probability distribution is discretized into possible scenarios, through the addition of binary variables in the model, which, however, complexify its solution. When the probability distribution is continuous, we can resort to closed form solutions of the CVaR. Notably, the general form of the CVaR with continuous distribution functions can be easily adapted to consider situations in which the probability distribution is unknown. This is for sure our case, where cost ambiguity prompts us to investigate the quantification of the risk in this more general setting. Assuming that the probability distribution belongs to a so-called ambiguity set, typically defined as a family F of distributions that have given first and second moments, we can adopt a distributionally robust approach. Under this setting, the risk criterion is evaluated in the worst-case W C V a R α and represents a conservative (that is, pessimistic) approximation for the true (unknown) CVaR. The W C V a R α is defined as follows:
W C V a R α = s u p F F C V a R α
where the supremum “sup” is evaluated over all the distributions in the family F , consistently with the known moments.
A further generalization of the CVaR is represented by the class of spectral risk measures that may be viewed as a weighted sum of V a R , where larger weights were assigned to larger V a R (this is a consequence of the nondecreasing property of the risk spectrum). A spectral risk measure, denoted by S R M ϕ is a function parameterized by ϕ , a density function also called an risk spectrum, which is a nondecreasing normalized right-continuous integrable probability density function, such that ϕ 0 , and 0 1 ϕ ( p ) d p = 1 .
It can be defined as follows:
S R M ϕ = 0 1 ϕ ( p ) F 1 ( p ) d p = 0 1 ϕ ( p ) V a R p d p .
It can be easily seen that CVaR is a special case of spectral risk measures, when
ϕ ( p ) = 1 1 α if p > α 0 if p α .
In analogy with the definition of the WCVaR, we can define the worst-case spectral risk measures (WCSRMs):
W C S R M = s u p F F S R M ϕ .
Theorem 1.
Let F be the set of all probability distributions with mean μ and variance σ 2 . For any random variable X R + , with a distribution function F belonging to the distributional set F , any worst-case spectral risk measure WCSRM can be evaluated in closed-form as follows:
W C S R M = μ + σ 0 1 ϕ 2 ( p ) d p 1
Proof. 
See Li [16]. □
Provided that the term 0 1 ϕ 2 ( p ) d p can be solved offline, this final problem can be solved by a commercial solver. In the case of CVaR, we have 0 1 ϕ 2 ( p ) d p = 1 1 α that gives rise to the well known formula
W C V a R = μ + σ α 1 α
Theorem 1 provides a baseline to present an equivalent expression for the risk-averse cost function, which becomes the following:
m = 1 M t = 1 T N m [ μ ( λ B u y m t ) P B u y m t μ ( λ S e l l m t ) P S e l l m t + μ ( β G a s ) ( G C H P m t + G G B m t ) ] + Γ b
s.t. (1)–(39), where
b = m = 1 M t = 1 T N m 2 [ σ 2 ( λ B u y m t ) P B u y m t 2 + σ 2 ( λ S e l l m t ) P S e l l m t 2 + σ 2 ( β G a s ) ( G C H P m t + G G B m t ) 2 ]
and Γ = 0 1 ϕ 2 ( p ) d p 1 for a given spectrum ϕ .
The above result provides a unified perspective on solving the problem under different risk measures in closed form, just by modifying the scale factor Γ of the standard deviation accordingly.
This means that one can use existing optimization methods for solving this second order cone programming problem. These problems, beyond having rich theoretical advantages, can be solved very reliably using existing general-purpose optimization packages.

3. Computational Results

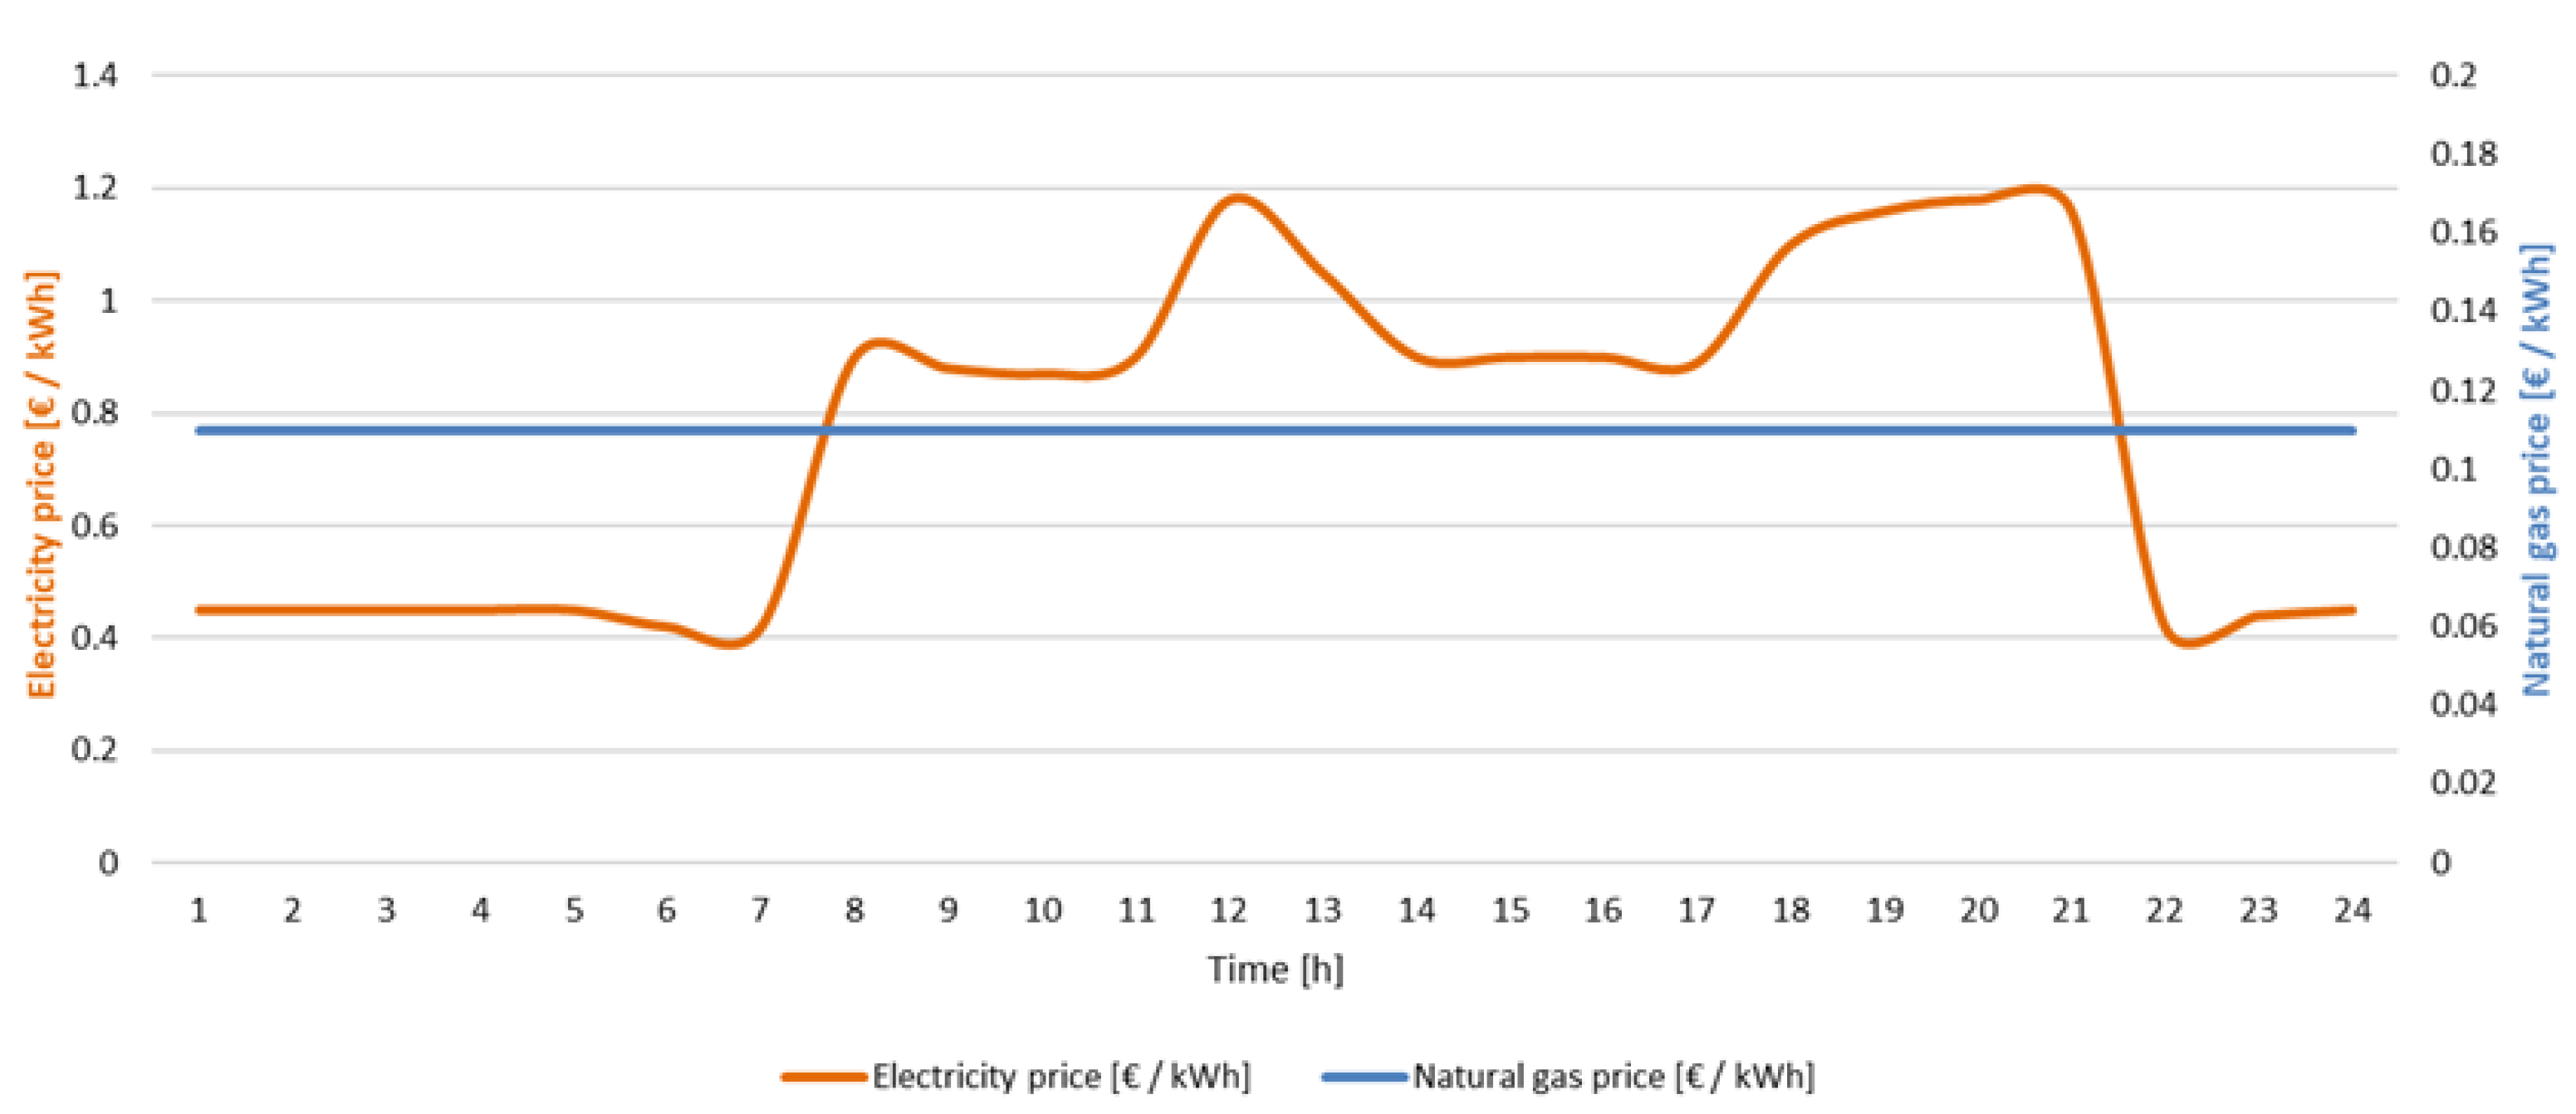
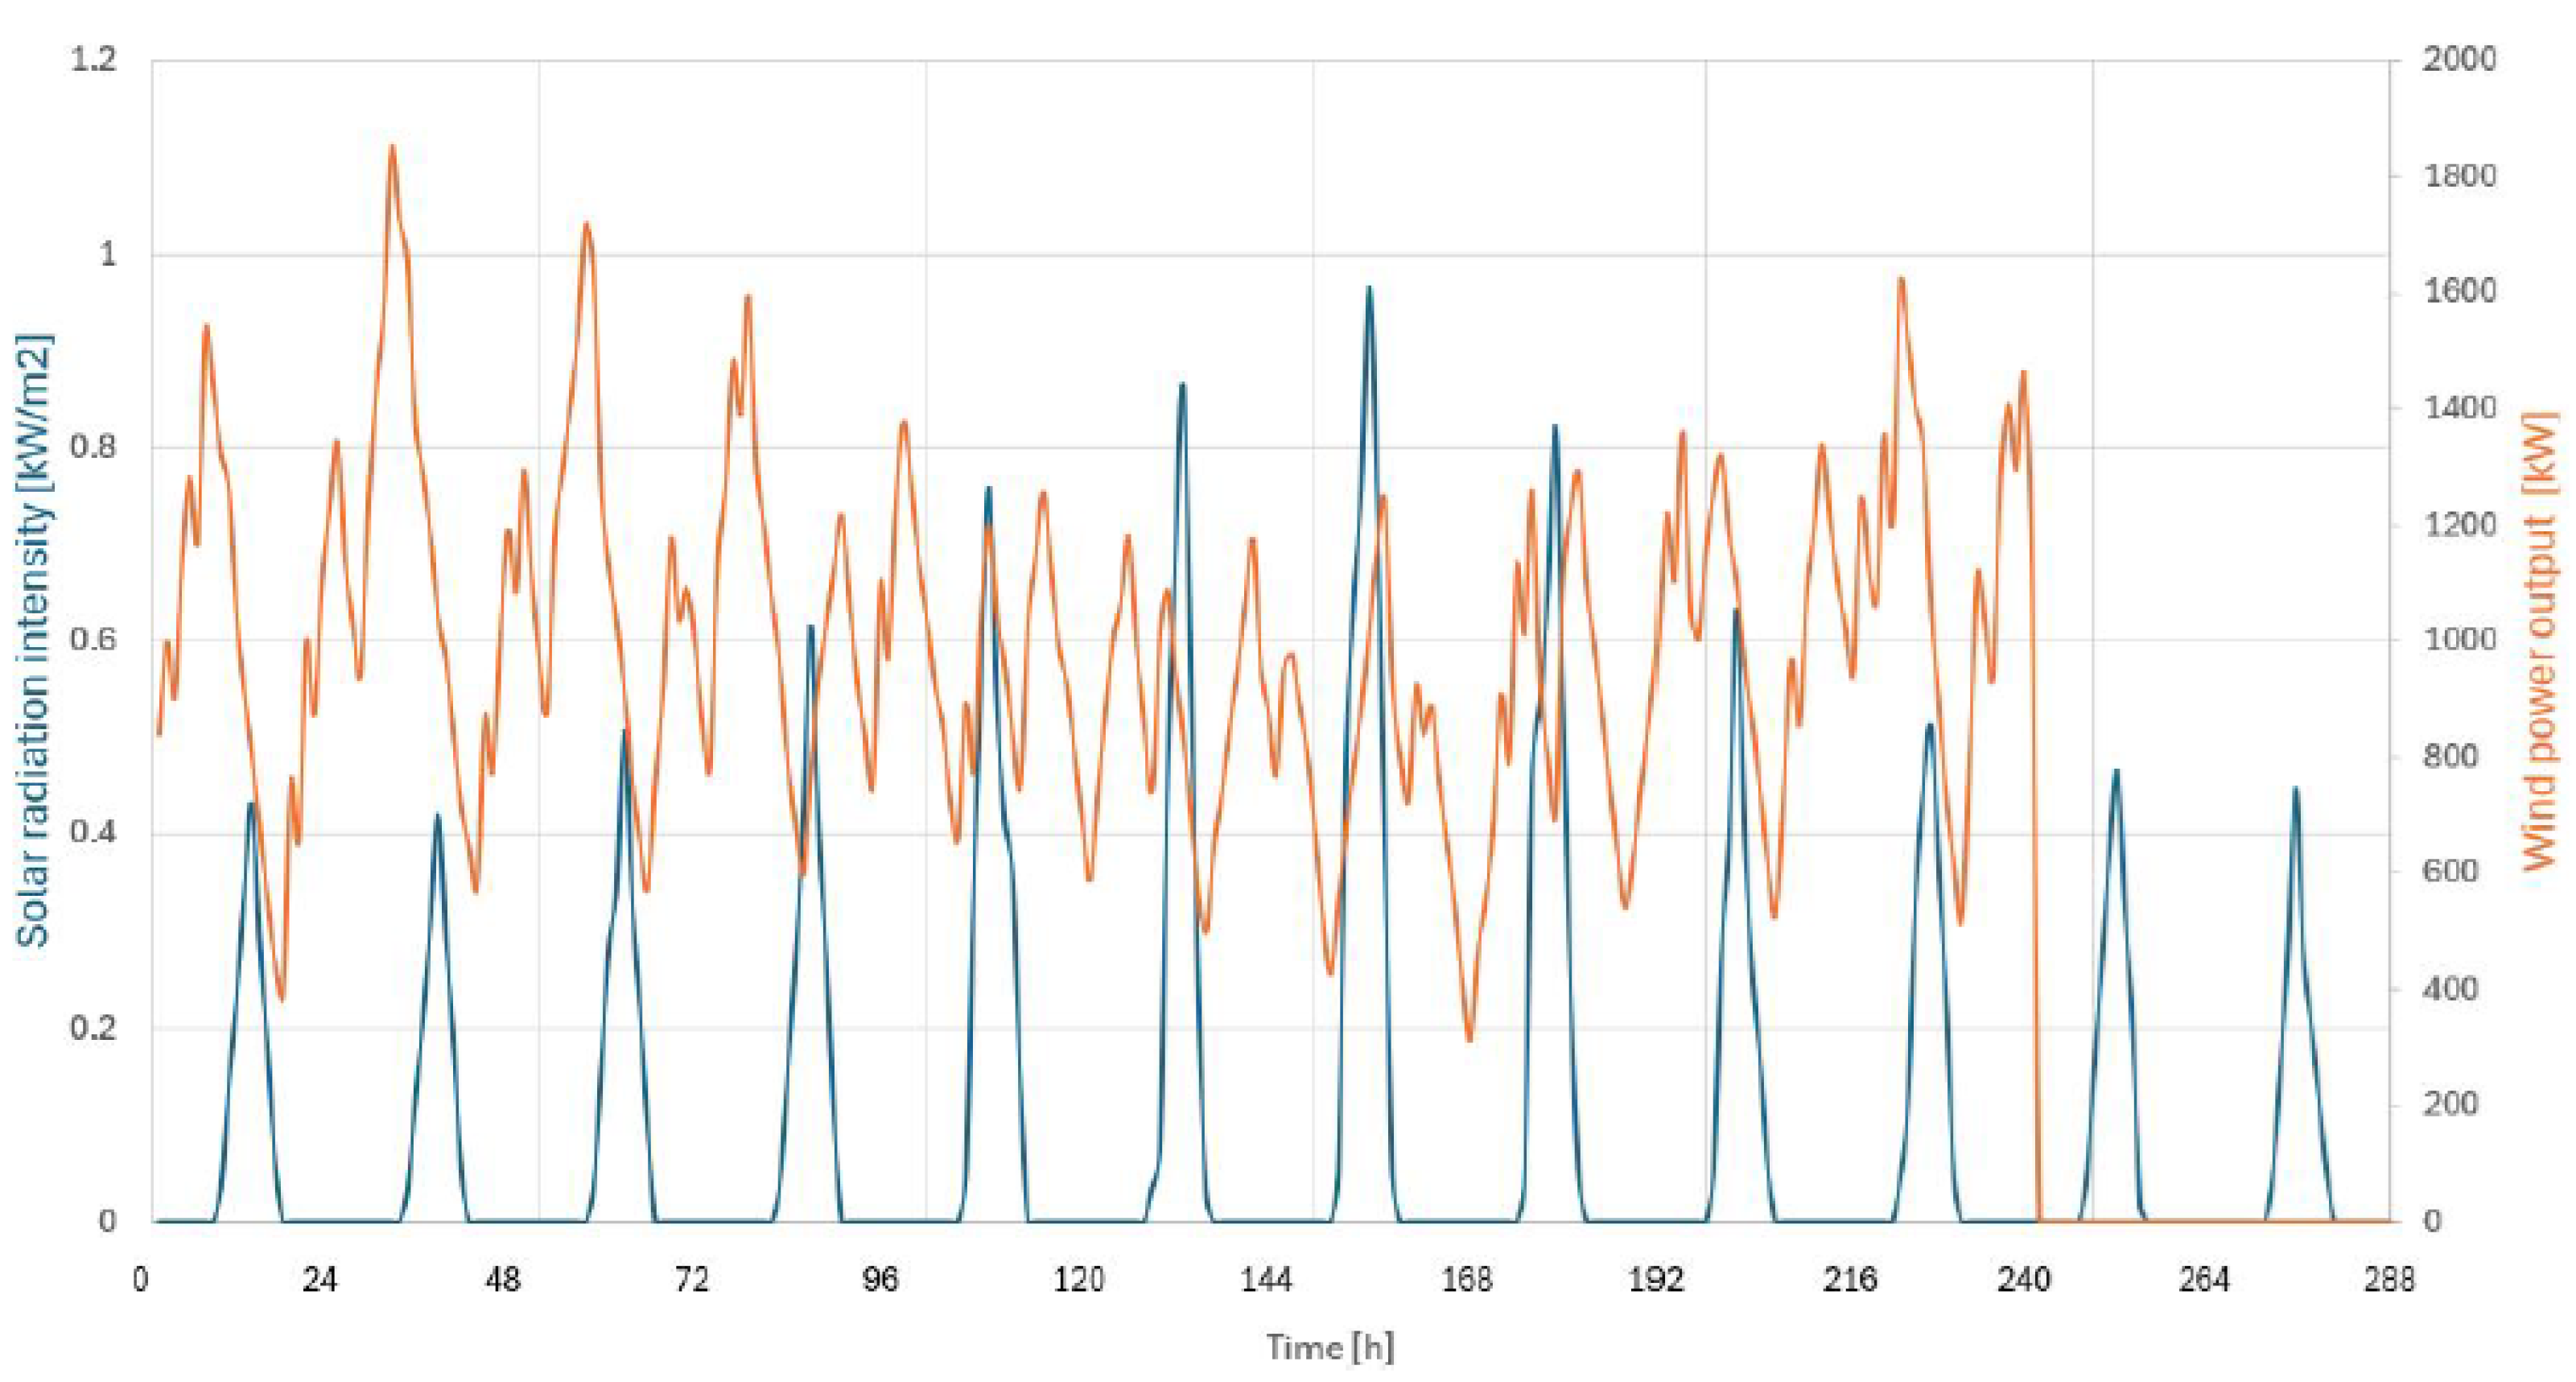
In this section, we run a set of computational experiments aimed to show the validity of the proposed model under different scenarios for a case study adopted from Zhou et al. [4] where the hydrogen load for the fuel cell electric vehicles at the public charging stations is generated randomly. All the experiments were executed on a Dell laptop equipped with an Intel Core i7-10750H processor, with 2.60 GHz CPU and 16 GB RAM. The mathematical model was implemented with the algebraic modeling language AIMMS, and the MIP problem was solved with the Outer Approximation solver. The mean values of the costs are the same as those reported in Zhou et al. [4]. The main parameters used in the mathematical model are reported in Appendix A. We conducted an analysis of historical market data to assess the variability of gas and electricity prices. For our analysis, we used internationally recognized data sources for both natural gas (TradingEconomics: https://tradingeconomics.com/commodity/eu-natural-gas (accessed on 1 January 2025), Barchart: https://www.barchart.com/futures/quotes/XLY00/historical-prices (accessed on 1 January 2025) and electricity prices (https://www.epexspot.com/en/market-results and https://www.omie.es/en/market-results/daily/daily-market/day-ahead-price) (accessed on 1 January 2025). Although it is possible to compute the empirical variance directly from historical series, we opted to generate the standard deviation randomly within the interval. The variances σ 2 ( λ B u y m t ) σ 2 ( λ S e l l m t ) σ 2 ( β G a s ) were set to σ 2 ( · ) = ζ s 2 and σ 2 ( p ˜ i ) = ζ p 2 where ζ s and ζ p are random numbers uniformly distributed in intervals [ 1 , 1 2 ( max μ ( · ) min μ ( · ) ) ] , where min μ ( · ) and max μ ( · ) denote the historical maximum and minimum prices observed. This approach captures plausible fluctuations observed in historical data, allowing to flexibly represent different levels of uncertainty across markets and time periods. Figure 2 and Figure 3 display the electricity/gas purchase price and the solar radiation intensity and wind turbine power on a typical day, respectively. The value of α was set to 0.9.
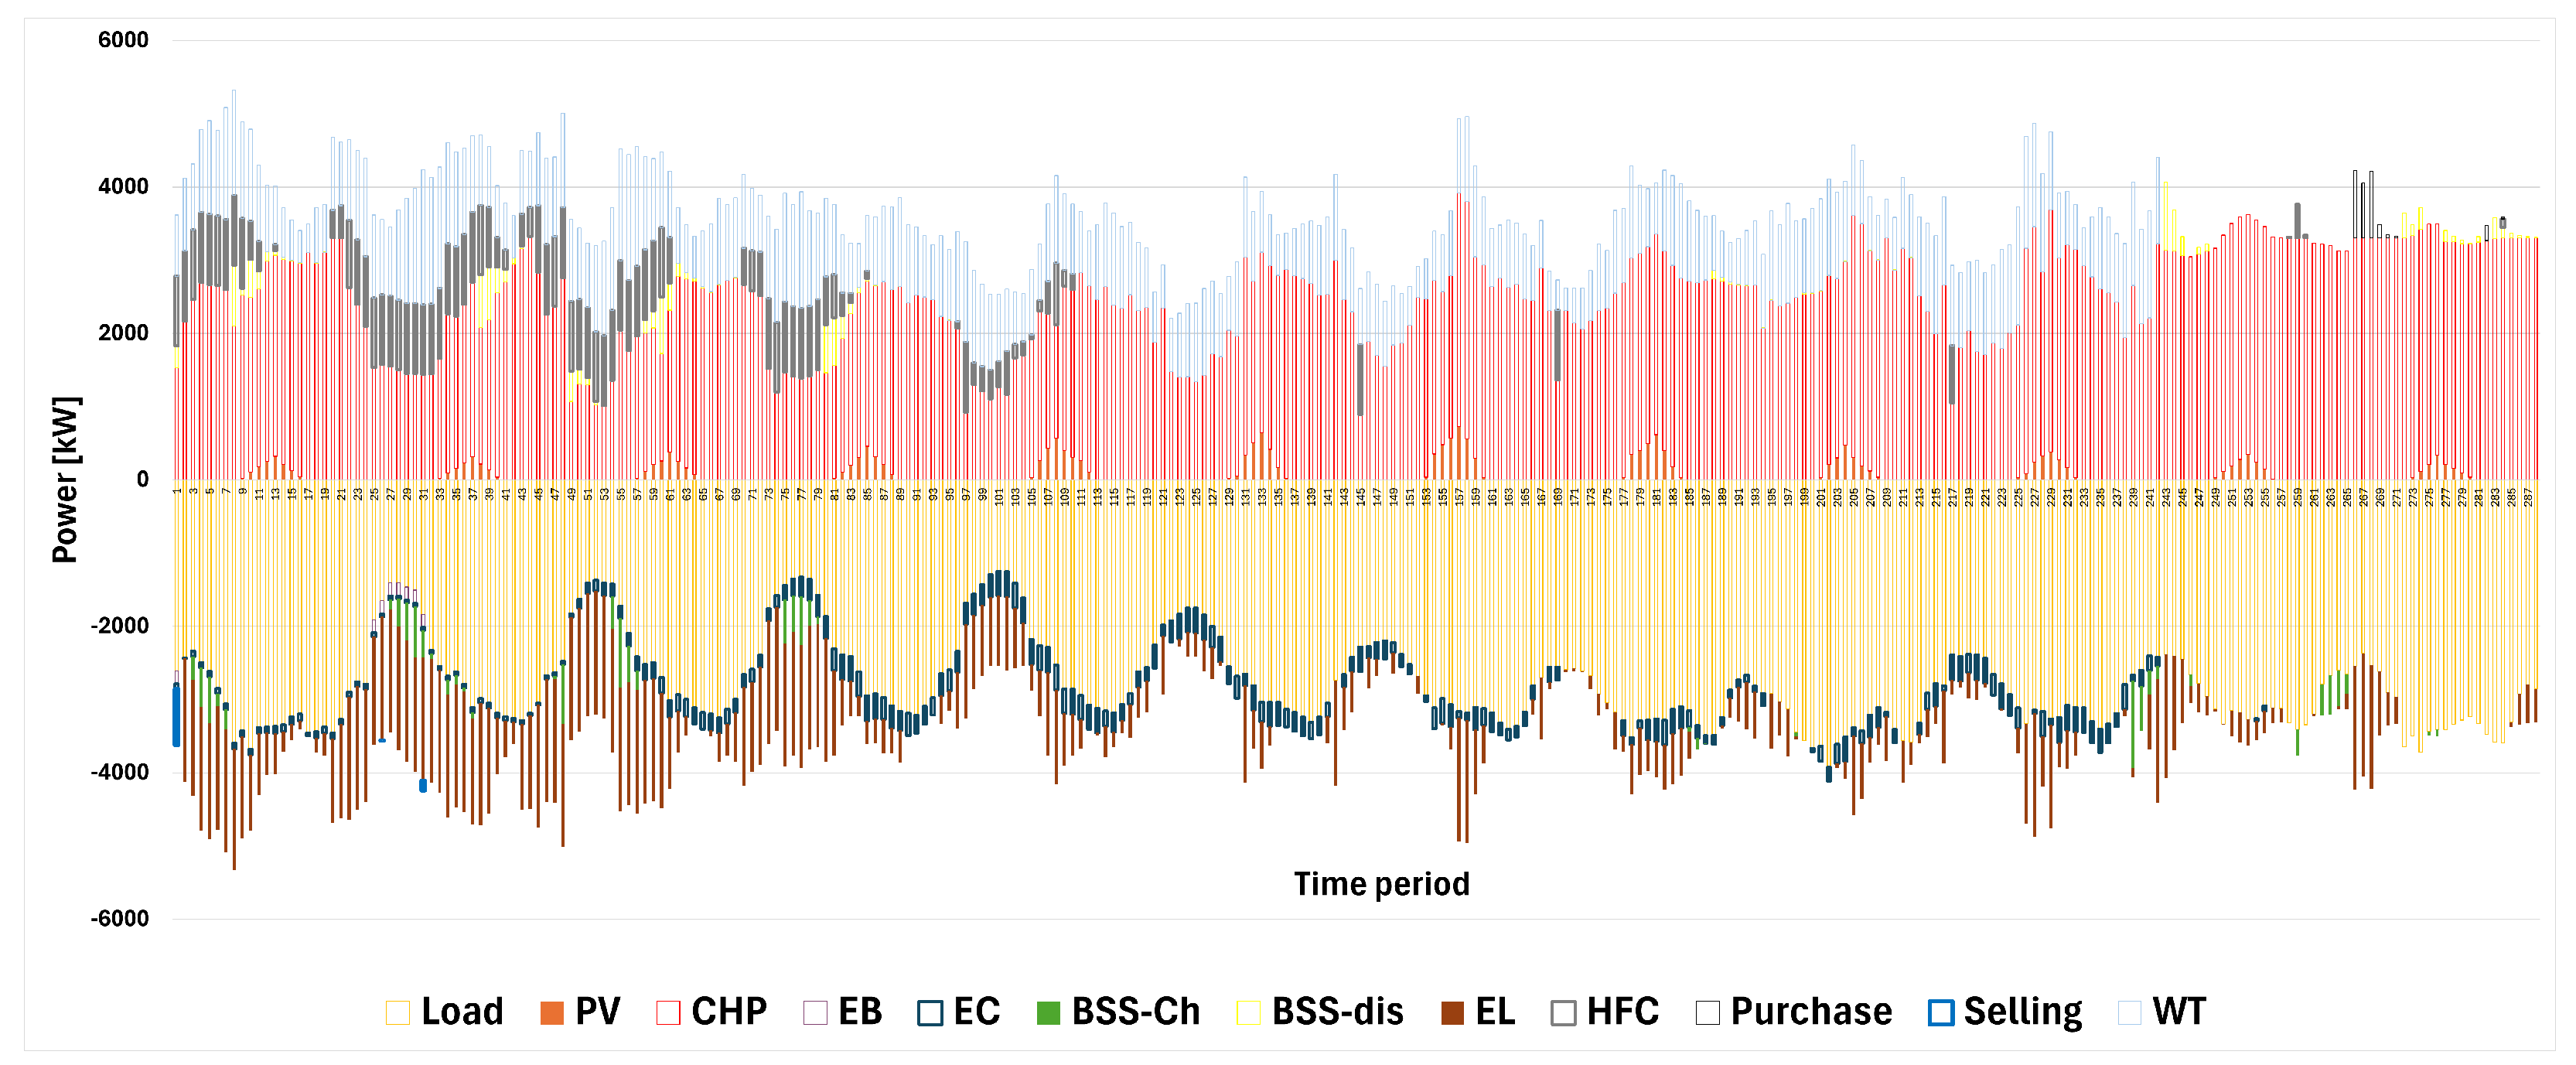
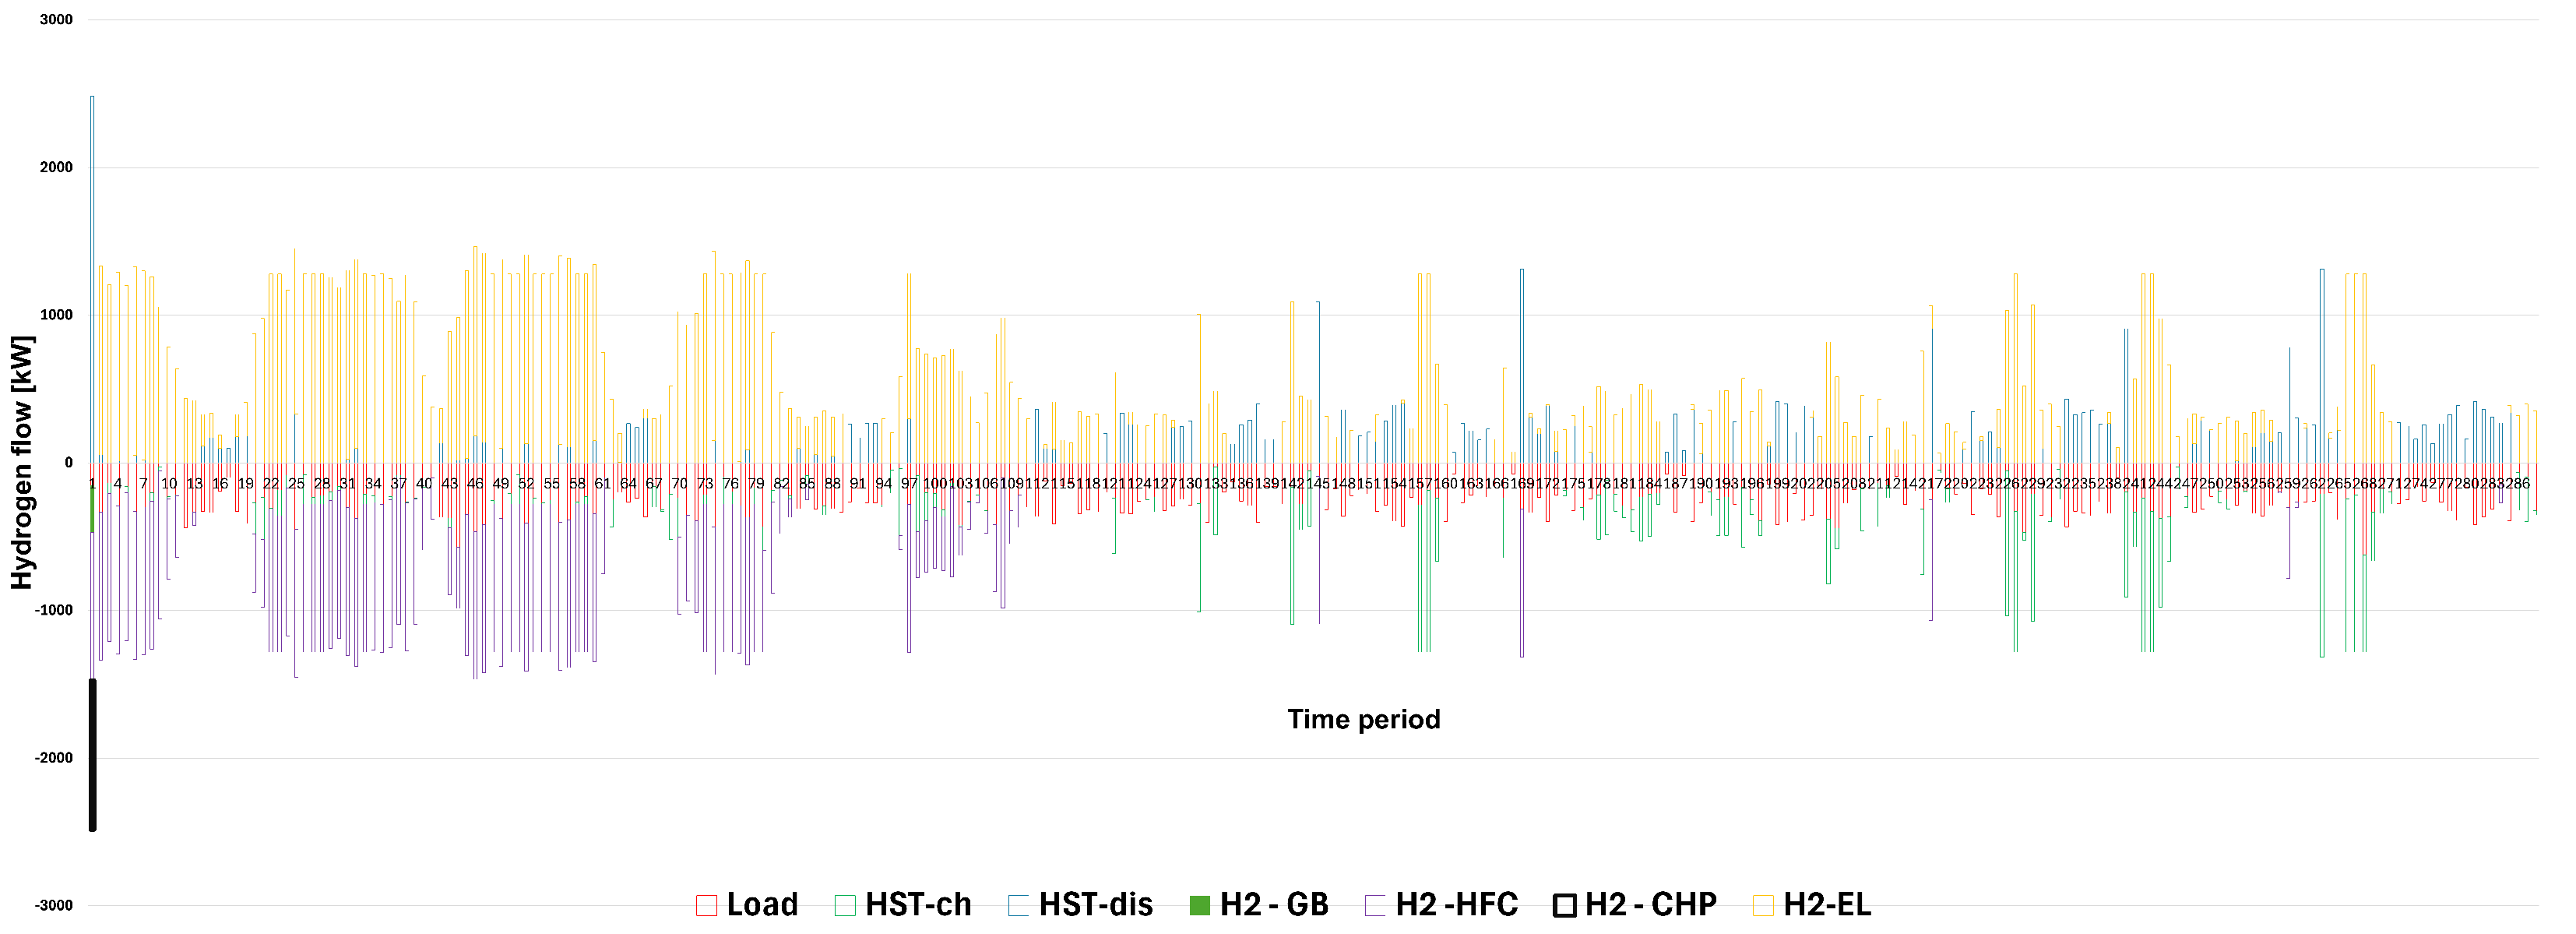
The optimal procurement and energy production plans are displayed in Figure 4, Figure 5, Figure 6 and Figure 7.
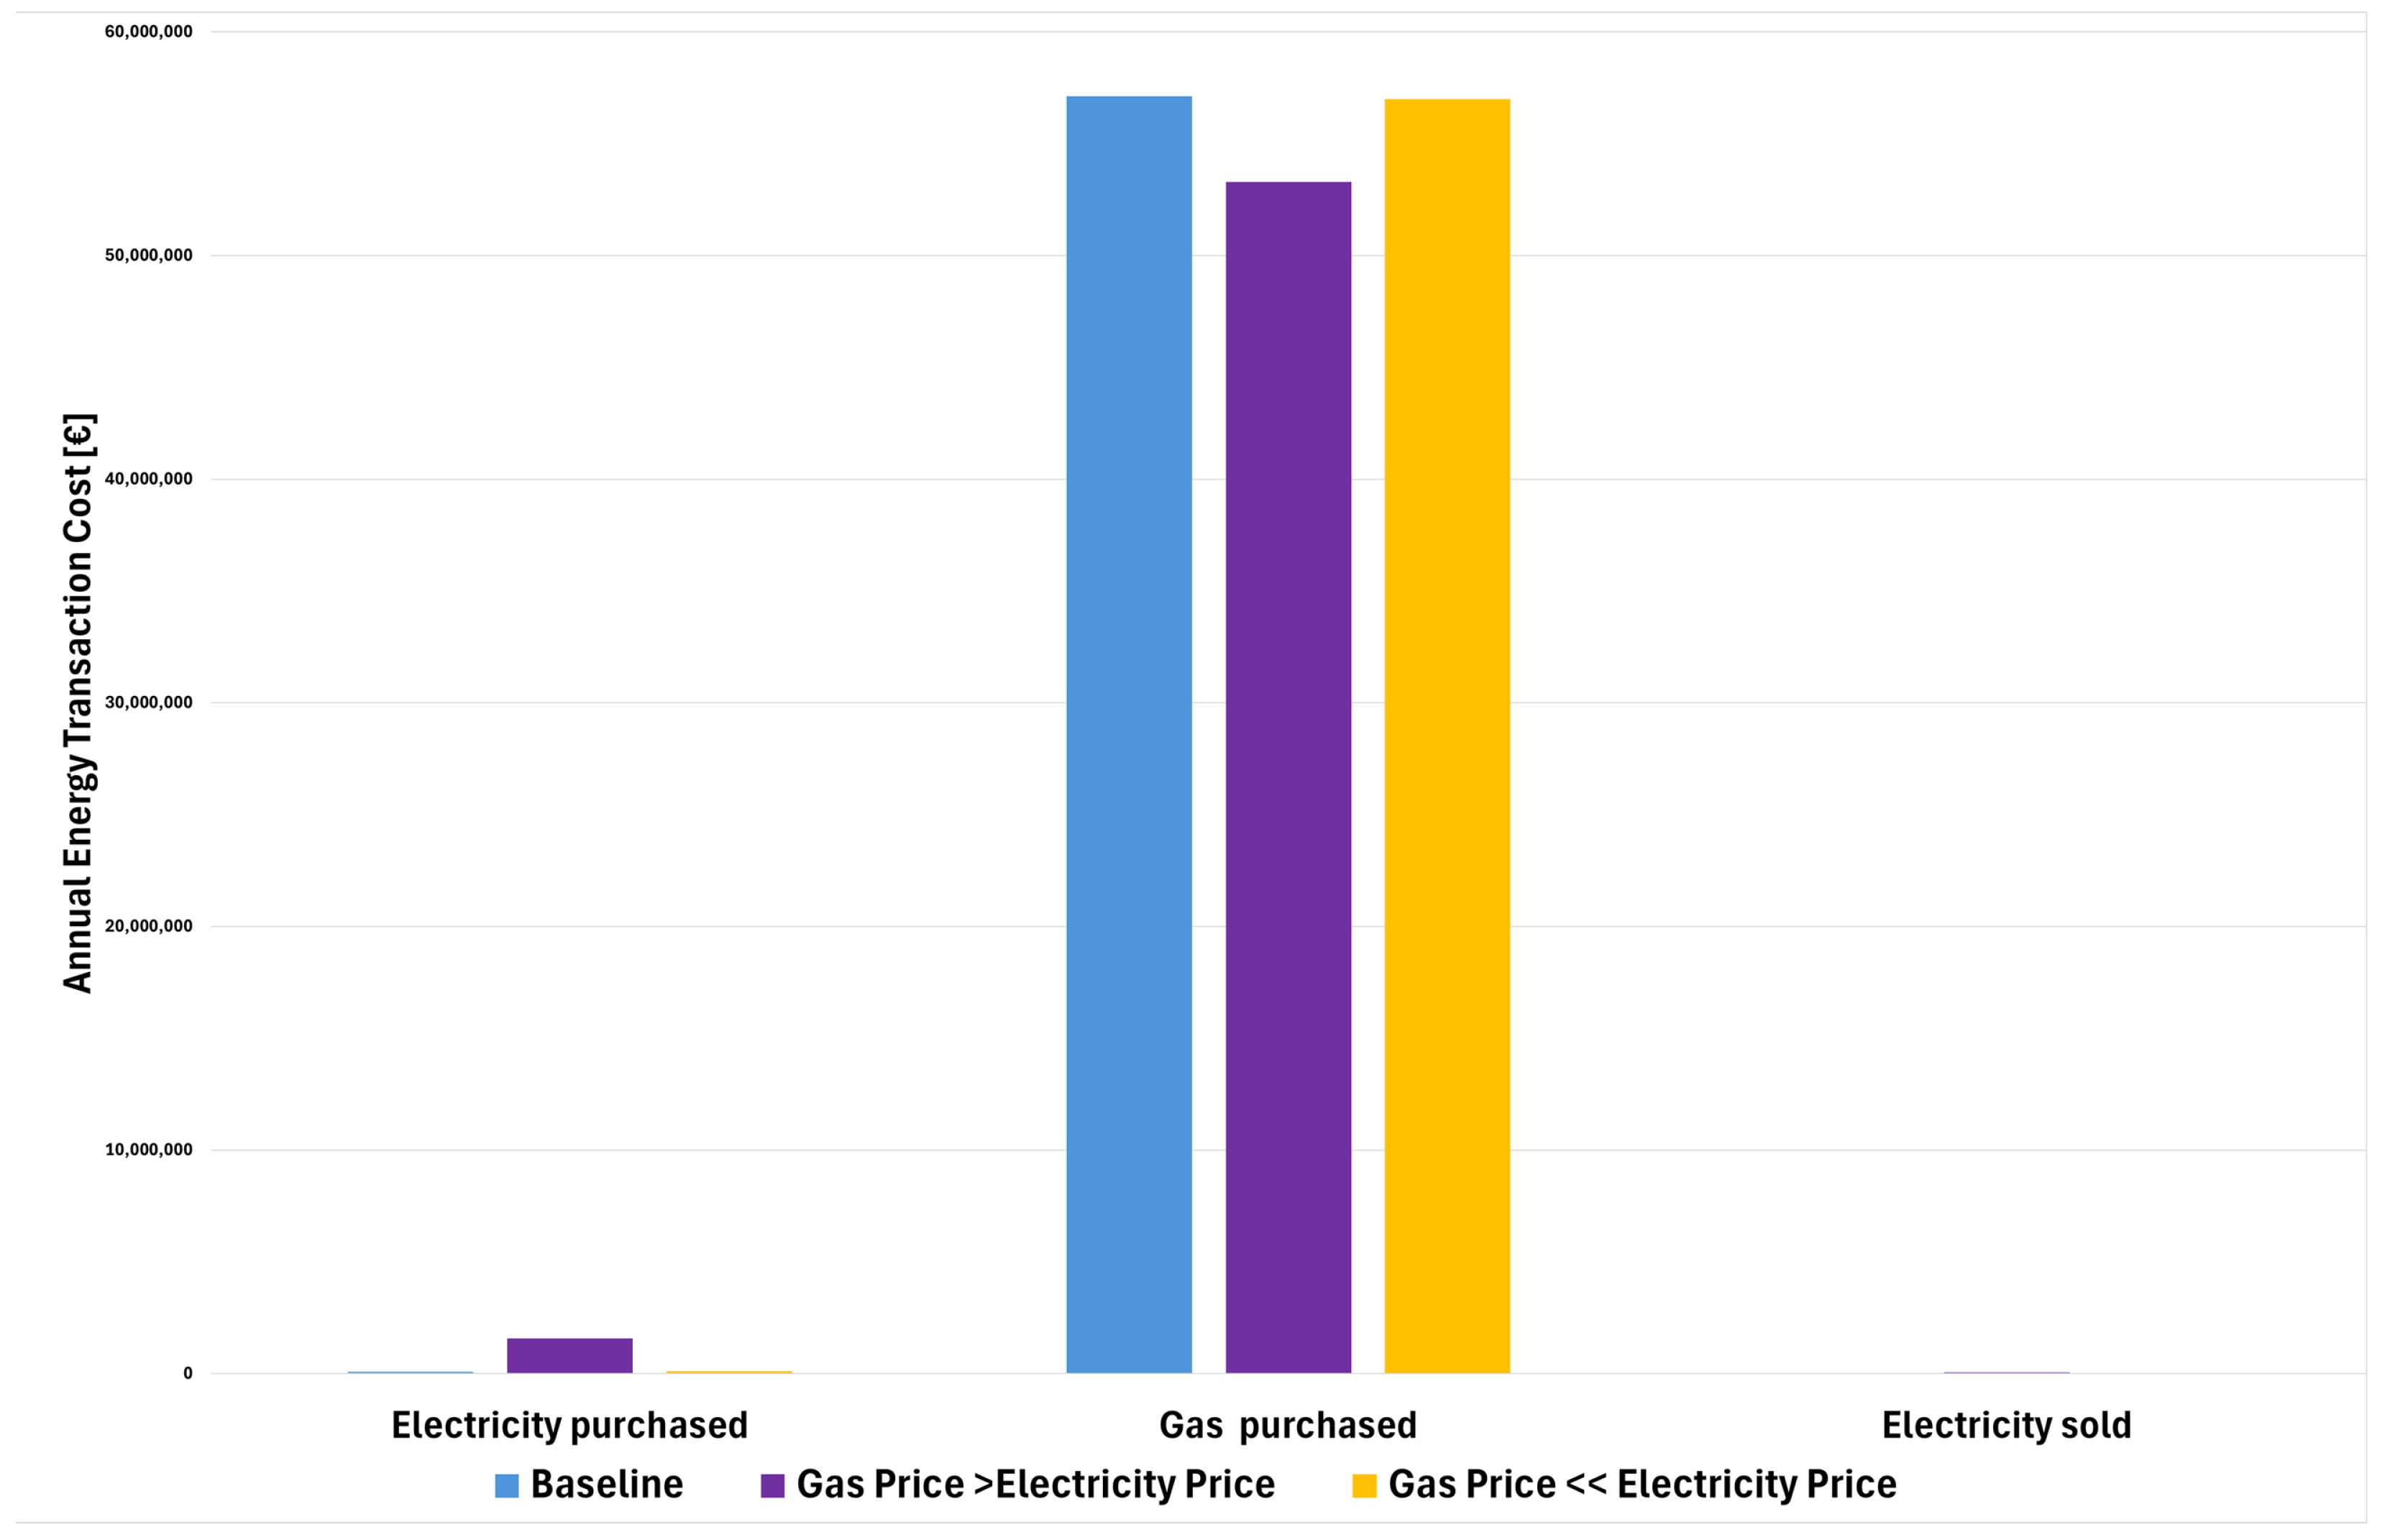
As shown in Figure 4 and Figure 5, the CHP plays a significant role in satisfying the electric and heat loads. In addition, the HFC is used in winter, when the production from PV panels is lower. Figure 8, Figure 9 and Figure 10 display the results for different scenarios: the first scenario represents the case where variability of the gas price (variance) is higher than that of the electricity, while the second scenario shows that the gas price variability is lower than the electricity. This provides us with some insights on how the optimal capacity plan changes depending on the variations in energy prices. Under the baseline scenario the installed capacities for all equipment are more or less balanced, and both technologies with electricity and gas inputs are applied. As shown by the results, a higher variability in the gas price has a compelling impact on the total cost since there is a high demand for thermal loads, and the CHP plant is dependent on the gas fuel. To hedge against this risk is beneficial to purchase and produce more electricity to match the demands by feeding it into the EL, HFC and EB (see Figure 9). Moreover, it is safer to invest more on technologies with hydrogen and electricity power inputs such as HFC, HST and EL, and the thermal load is mostly satisfied through the HFC technology.
As we can see, the effect of the variability in the electricity price has a very mild effect on the optimal design of the HES, since the installed capacities are very similar to those obtained for the baseline case. We also notice that the system does not sell electricity due to high investment costs and low market prices. High capital expenditures can lead to long payback periods, while periods of low electricity prices make revenue uncertain according to Mazarron et al. [17], Mallapragada et al. [18]. This result is in line with other studies showing that, without financial incentives, the sale of electricity from hybrid systems can be economically unfeasible; see Fagerstrom et al. [19].
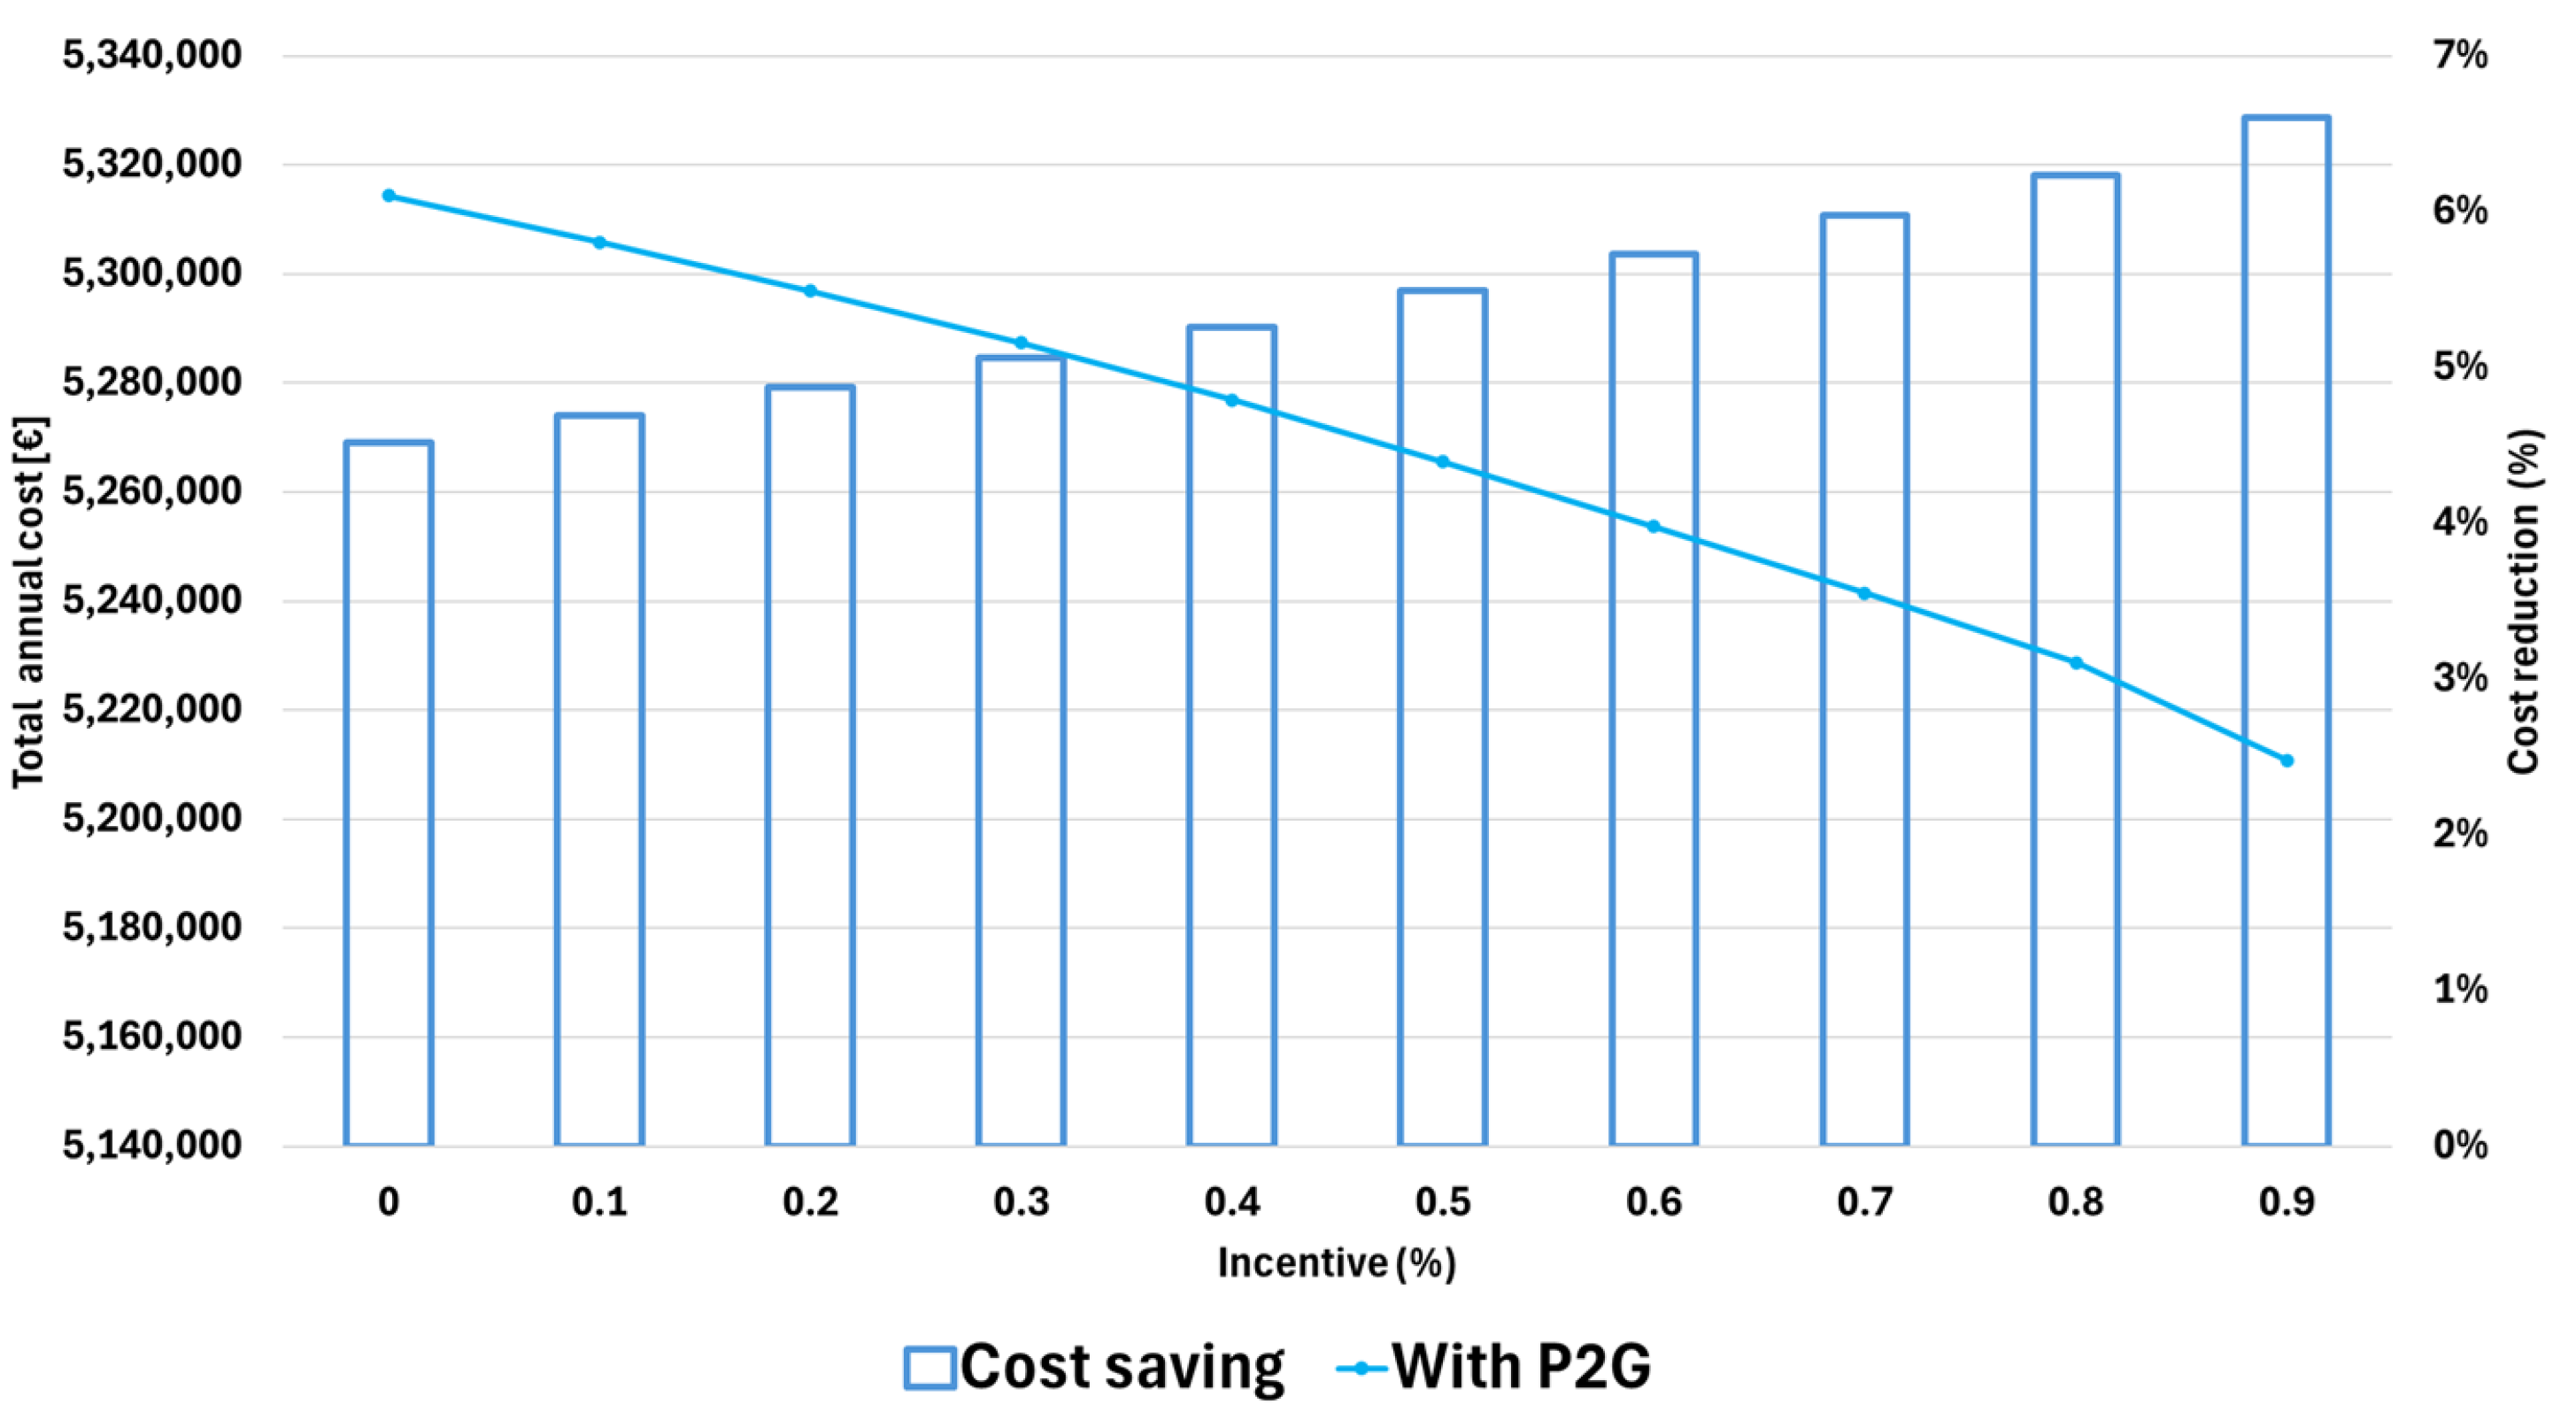
While natural gas prices are subject to volatility, the cost of green hydrogen is more capital cost-driven and predictable over the long term. Green hydrogen is still more expensive than natural gas, although costs are falling. It is not yet competitive in many markets without subsidies or carbon pricing. To investigate the impact of P2G technologies and the possible benefits of incentive programs for the production of green hydrogen, we solved the proposed model eliminating the EL and HFC devices and considering different incentive levels as shown in Figure 11. When hydrogen is not produced locally, it should be purchased from the energy market at a price of EUR 10 per kg. Figure 11 displays the impact of the incentive on the total cost for two cases with and without P2G technology. The vertical bars show the relative decrease (in percentage) in total cost when P2G technology is added to the system. Without P2G, the yearly total cost increases up to 4.52%. The blue bars in Figure 11 indicate that incentivizing P2G technologies is a successful strategy as it reduces the total cost up to 6.6%, depending on the incentive rate.
The introduction of incentives leads to a steady decline in the total annual cost of the system when P2G is included (see the left vertical axis in Figure 11), whereas the total cost without P2G remains almost unchanged. This confirms that incentive policies directly enhance the economic competitiveness of hydrogen-based technologies by offsetting their high capital costs.
Figure 11 further emphasizes this trend by showing that the relative cost reduction increases nearly linearly with the incentive rate—from about 4.5% with no incentive to around 6.6% at the highest incentive level (see the right vertical axis in Figure 11). This indicates that subsidizing hydrogen production or storage can generate tangible economic benefits, even within a moderately risk-averse optimization framework. The results are consistent with findings from recent studies highlighting that financial incentives and carbon pricing are key enablers for the cost-effective deployment of green hydrogen in integrated energy systems.
Overall, these results suggest that P2G technologies become increasingly attractive as incentive rates grow, reinforcing their potential as a strategic lever for decarbonization and energy diversification.
In the following, we discuss how different levels of risk aversion affect the optimal system design, cost structure, and operational behavior of the integrated energy system.
The deterministic configuration ( α = 0 ) corresponds to a risk-neutral scenario where the parameters assume their expected values. We remark that, in this case, the model is deterministic. In this case, the optimization exclusively focuses on minimizing expected costs. The total annual cost is the lowest among all cases (around EUR 4.6 M), and investment levels remain limited. The installed capacities of the electrolyzer, hydrogen fuel cell, and storage units are relatively modest, while the system relies more heavily on electricity and gas purchases from the external grid. This configuration, although cost-efficient, is also more exposed to volatility in energy prices, revealing its vulnerability to operational risks.
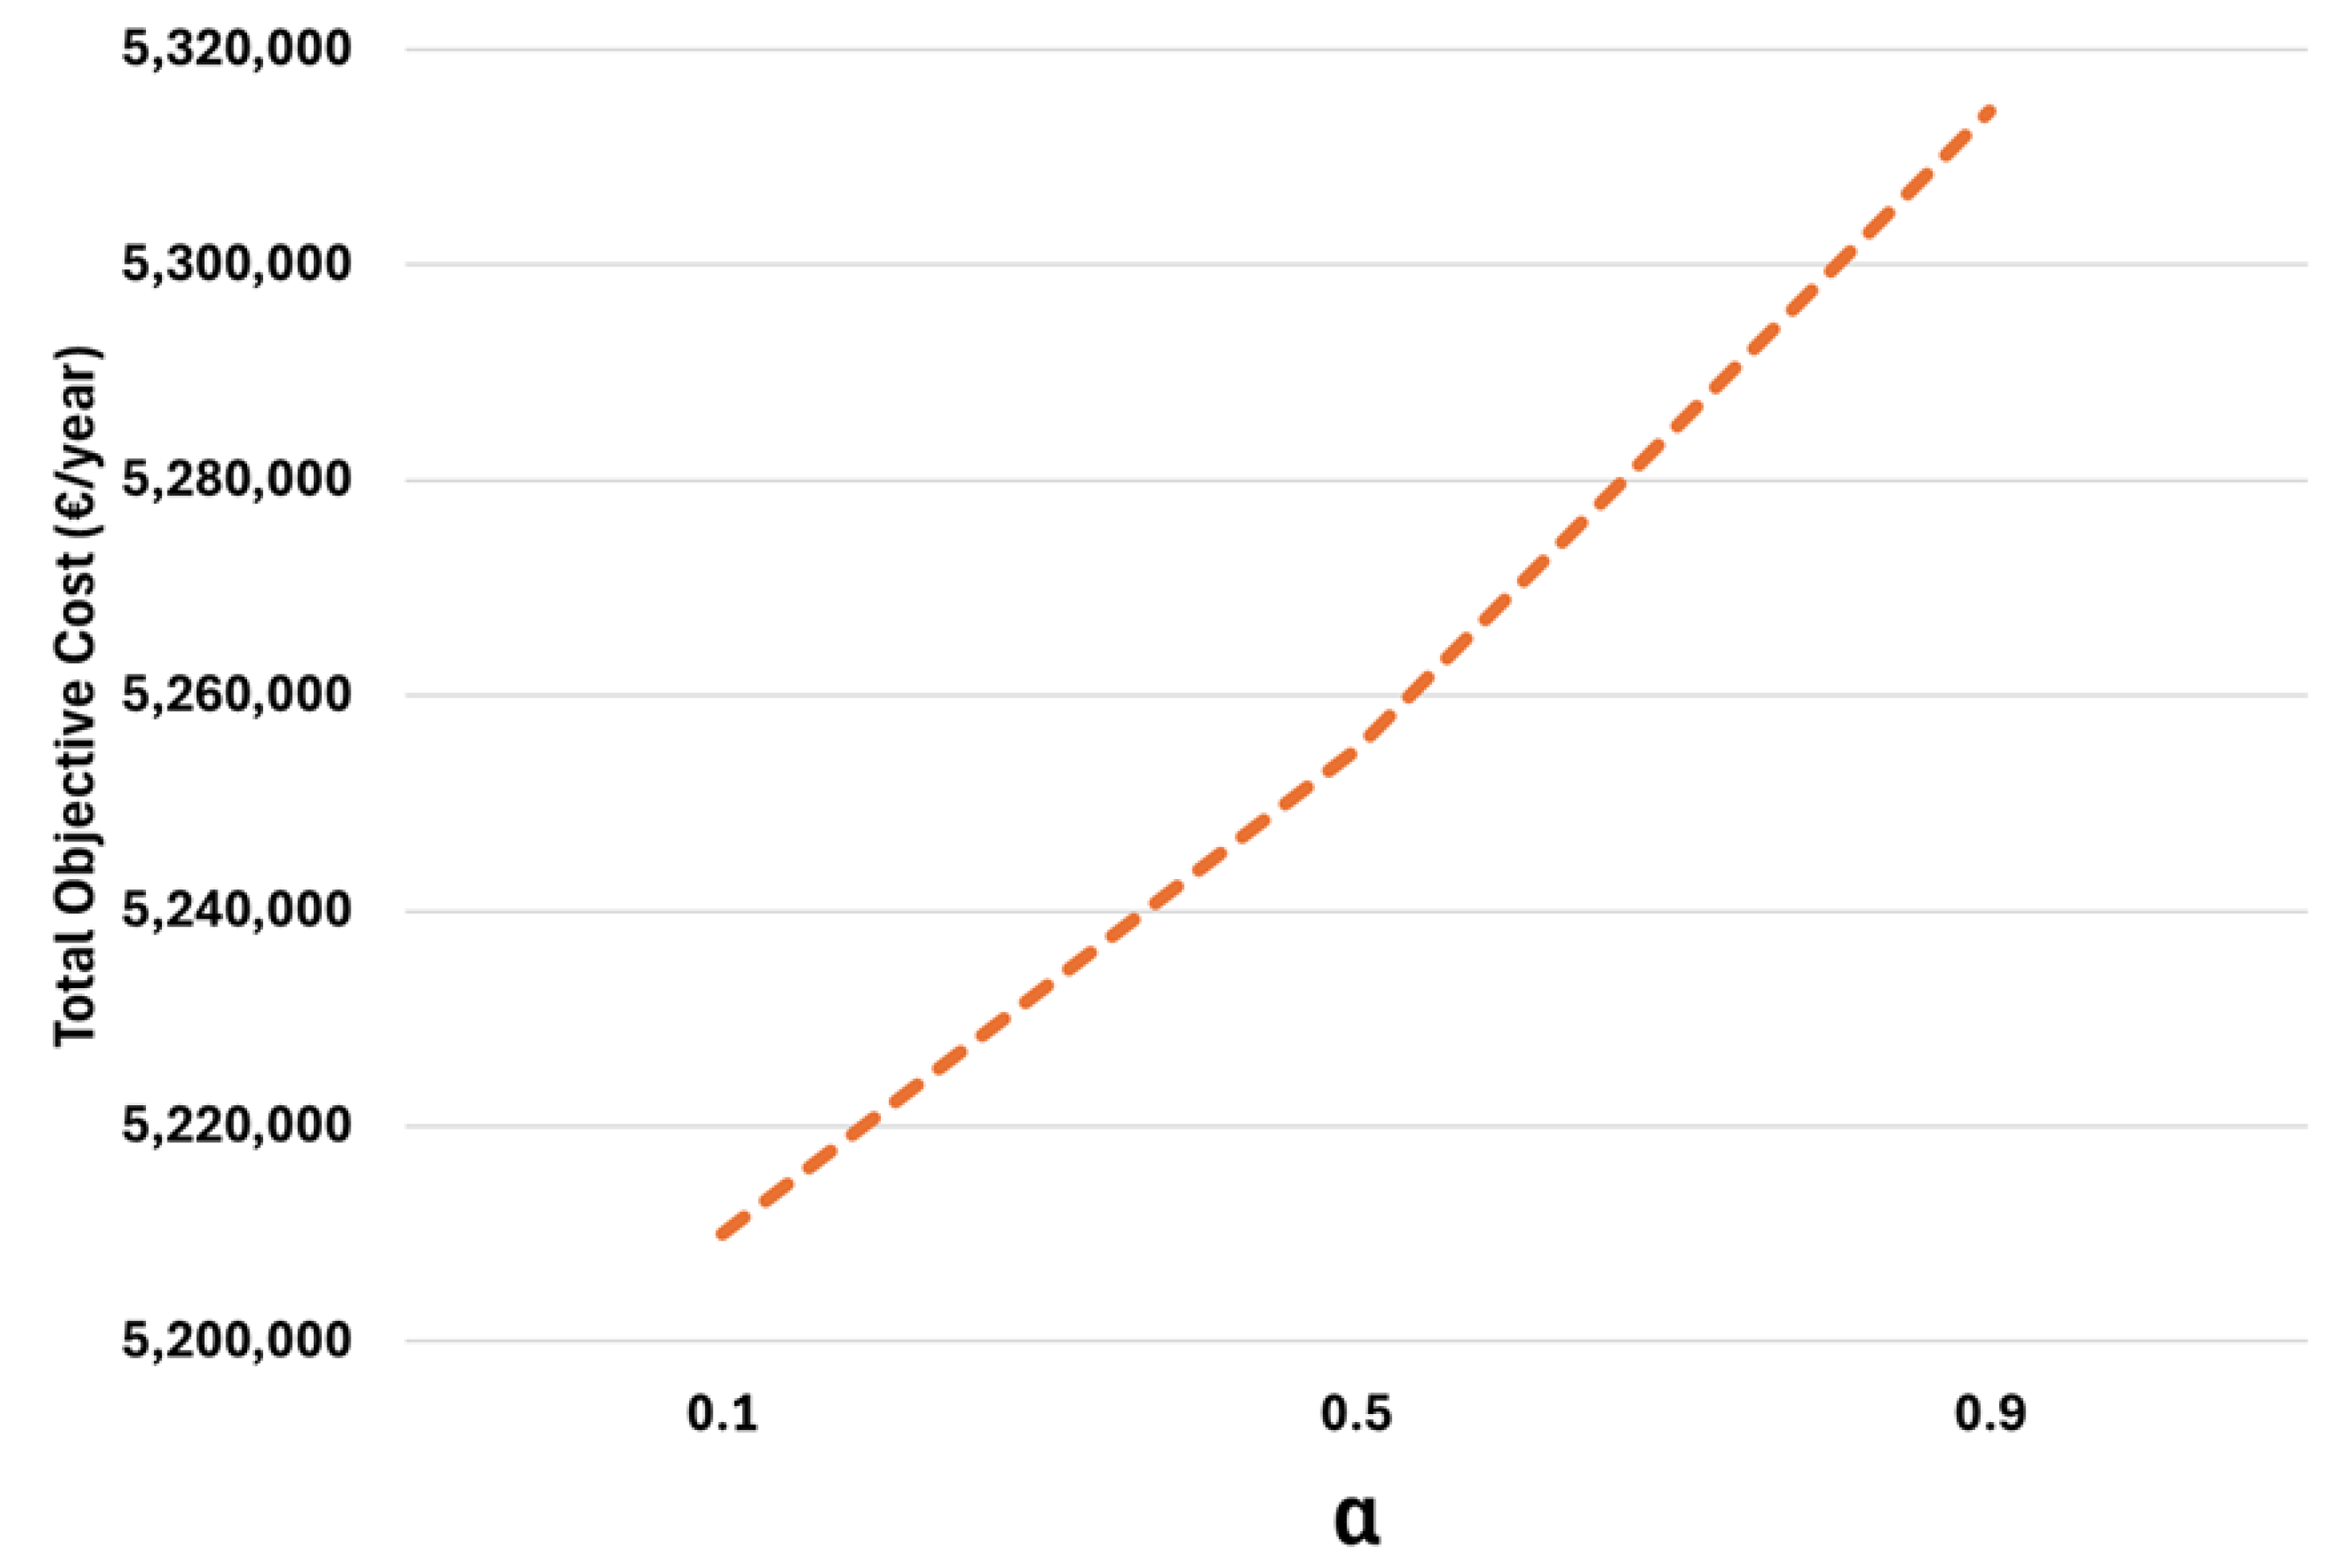
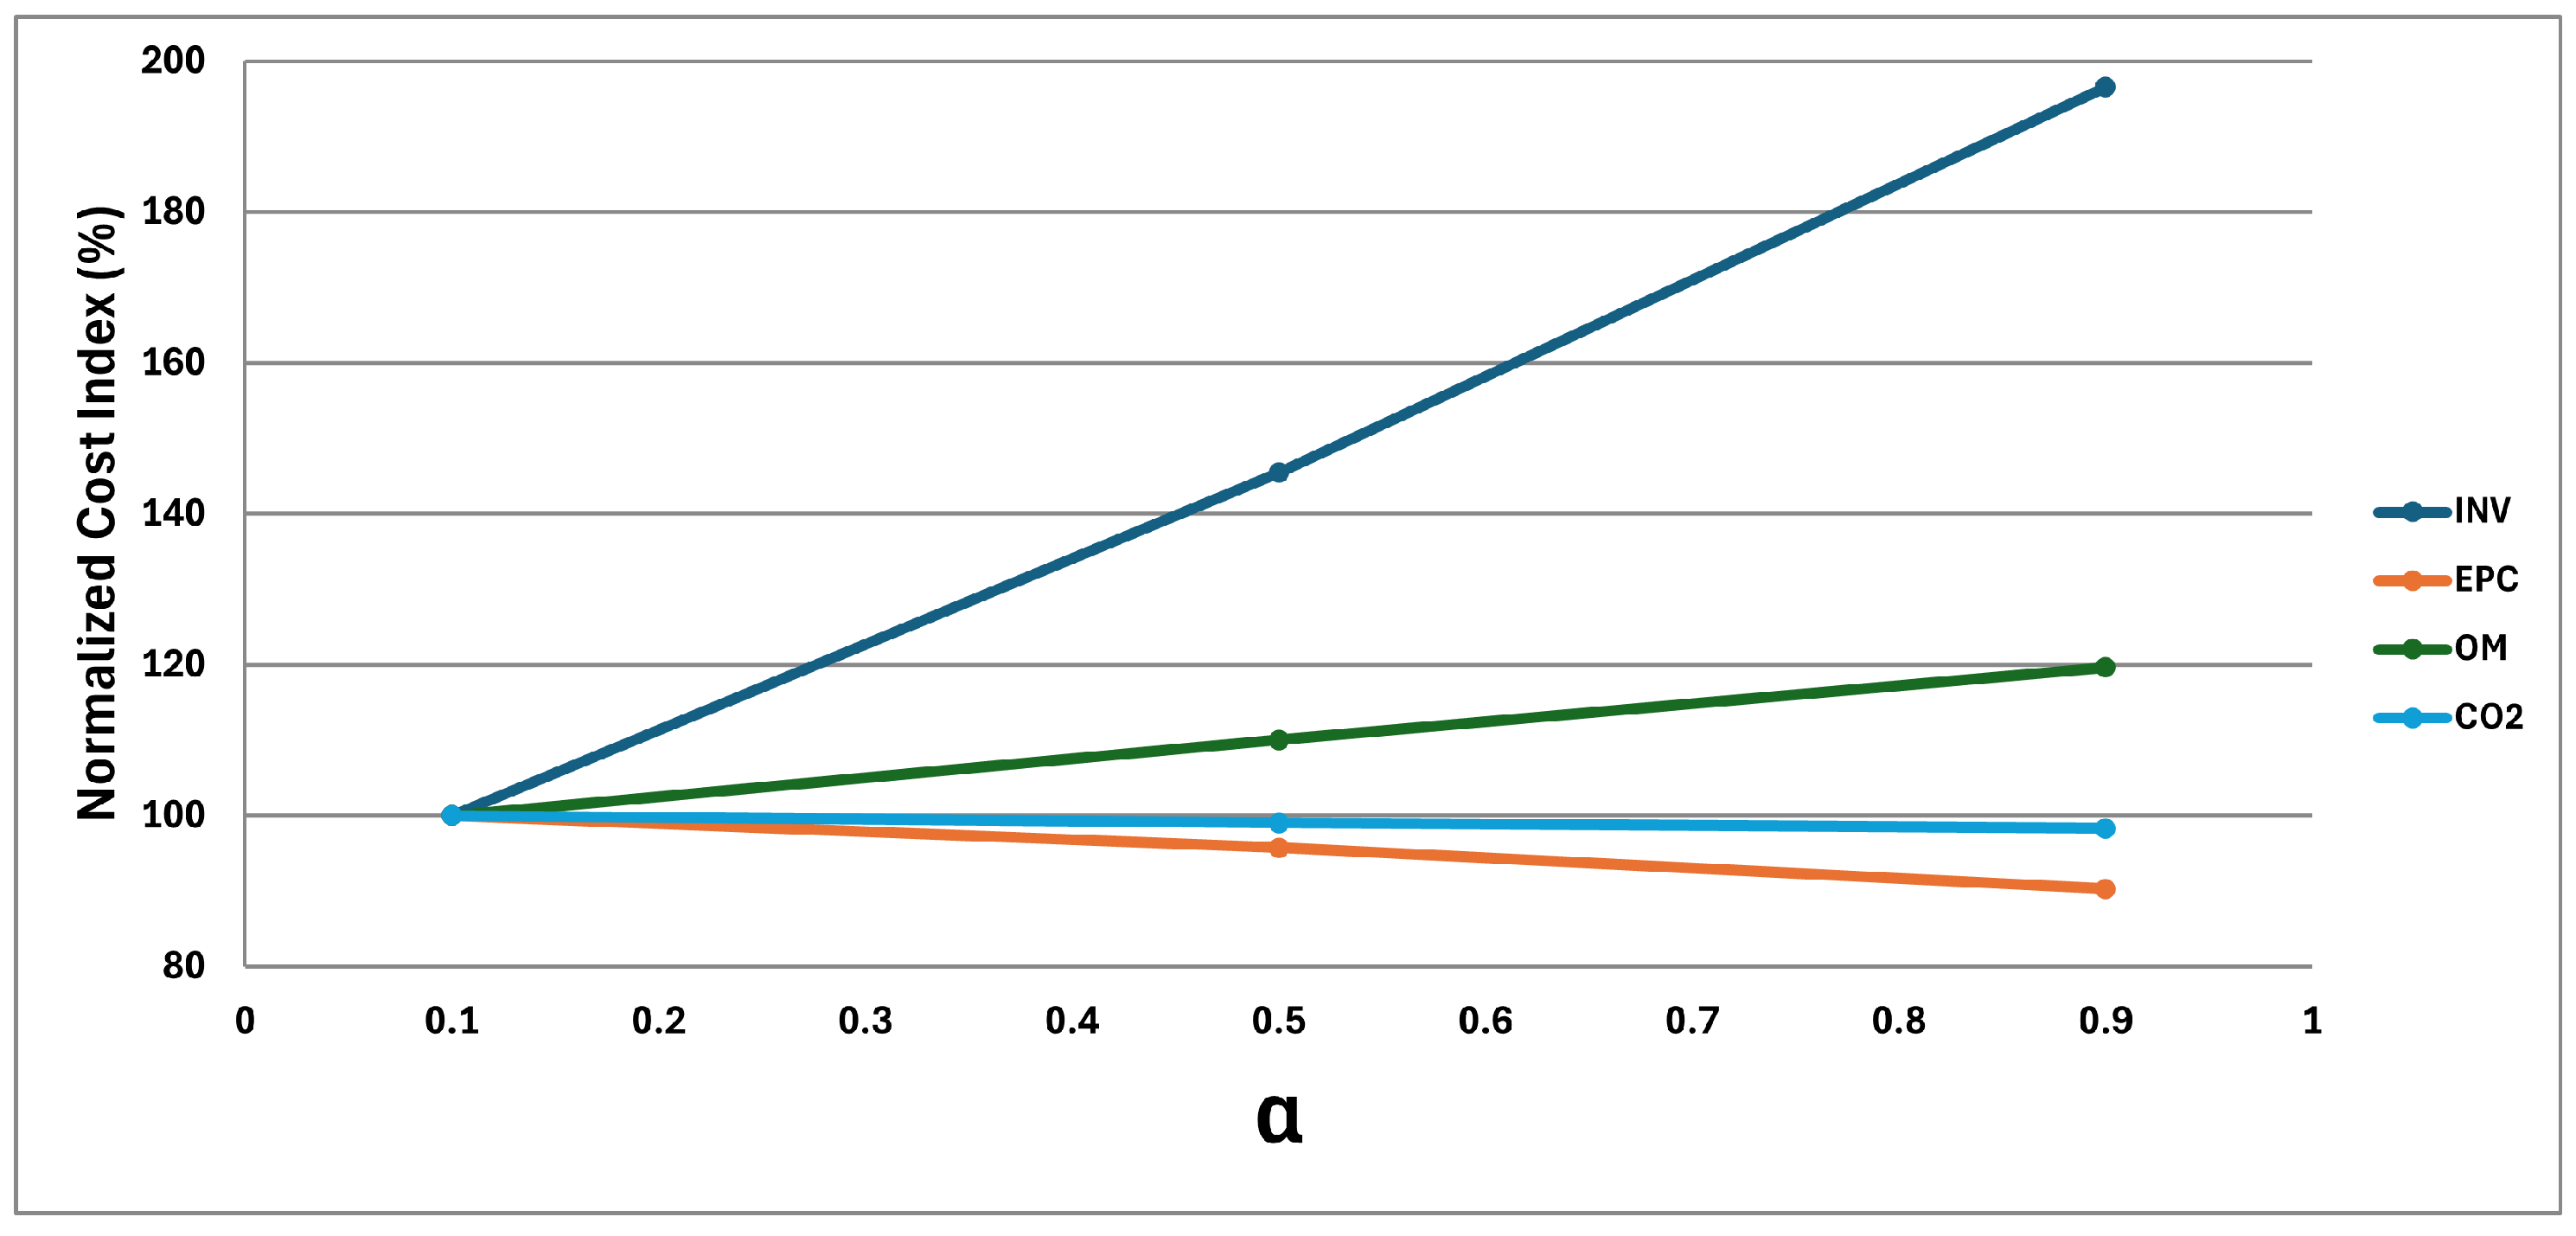
The introduction of a higher risk aversion level ( α > 0 ) progressively modifies both the economic structure and the technological composition of the system. As shown in Figure 12, Figure 13 and Figure 14, increasing α leads to a moderate but consistent rise in total system cost, roughly 15–16% higher in the most risk-averse configuration compared to the deterministic one. This difference can be interpreted as the economic cost of resilience, reflecting the additional investment required to protect the system against uncertain prices. Capital expenditure markedly grows, by approximately 65–70%, as the optimization allocates more resources to hydrogen-based technologies—namely, the electrolyzer, hydrogen fuel cell, and hydrogen storage tank. Together, these units almost double in capacity when moving from α = 0 to α = 0.9 , highlighting their role as key enablers of flexibility and internal balancing.
At the same time, electricity and gas purchases decrease by about 20%, indicating a structural shift from market dependence to local production and storage. This is consistent with the increase in the Energy Self-Sufficiency Index (ESSI), defined as E S S I = 1 E imported E total , demand , which measures the share of total energy demand met without relying on imported energy sources and rises by 9% in the case of α = 0.9 compared to the deterministic case. A higher ESSI indicates that the system is capable of satisfying a larger share of its demand through internally generated and stored energy, thereby reducing exposure to external market uncertainty.
Environmental performance also follows a stable or slightly improving trend. CO2-related costs remain within a narrow range but show a mild reduction at higher α , confirming that the additional hydrogen conversion capacity contributes to lowering emissions without compromising operational feasibility. In summary, while risk aversion entails somewhat higher upfront costs, it results in a configuration that is more robust, flexible, and environmentally consistent.
From a managerial perspective, these results suggest that incorporating risk aversion is economically justified, particularly in district or campus-scale energy systems where reliability and autonomy are crucial. In this context, ESSI provides an intuitive indicator of operational independence. The results show that this index increases more than 9% for the most risk-averse configuration compared to the deterministic case, confirming a clear improvement in local energy autonomy. Hence, the model demonstrates that moderate additional investments in flexibility-oriented technologies yield tangible gains in self-sufficiency and resilience, providing a balanced strategy between cost efficiency and operational security.

4. Conclusions

In this study, we addressed the problem of energy production and equipment sizing in an integrated energy system to supply energy of different types over a long planning horizon, with the aim of minimizing the capacity installation, energy procurement, operational and the environmental costs. The discussion presented here begins to examine how uncertainties can be hedged with ‘risk-averse’ choices. Several different criteria have been included in this analysis. To do this, we have also monetized some of the externalities through the application of a carbon price on emissions.
The results highlight that using hydrogen as a hedge against natural gas price volatility is an emerging strategic concept, particularly as energy systems transition toward decarbonization. The results also highlight the important role of P2G technologies and the effect of gas and electricity price variations on the energy production schedule. As hydrogen scales, particularly with incentive policies, it will become a viable hedge not only against natural gas volatility but also carbon price volatility. Companies in energy-intensive sectors should consider portfolio diversification that includes hydrogen to reduce exposure to gas price spikes (e.g., as seen in the 2021–2022 European energy crisis) and fuel supply chain disruptions.
Although the proposed framework provides valuable insights, several limitations of the current modeling approach should be acknowledged.
First, the analysis assumes stationarity in both energy consumption patterns and renewable generation profiles, thereby neglecting potential long-term effects of climate variability or structural changes in demand. Given the long-term nature of investment decisions, this simplification could alter the relative attractiveness of different technologies over time and is therefore among the most critical limitations for real-world deployment.
Second, the model does not explicitly include transmission and distribution network constraints. While these factors are typically of secondary importance for strategic planning compared to broader drivers such as technology costs, fuel prices, and policy signals, incorporating them in future extensions would allow for more spatially resolved and operationally realistic siting decisions.
Third, the current formulation does not fully capture broader sources of uncertainty, such as policy changes, supply chain disruptions, or systemic interactions across energy sectors. As a result, certain cross-sectoral trade-offs may be underestimated. For example, shifting demand from natural gas to hydrogen or electricity can reduce carbon emissions but may introduce new externalities, such as increased water use in electrolysis or land occupation for renewable generation. Addressing these aspects through more comprehensive, multi-sector decision models represents a priority for follow-up research.
Finally, the optimal design of incentive mechanisms for P2G and green hydrogen deployment could be further explored through bi-level optimization formulations, capturing the interaction between regulators and energy producers. This direction is particularly promising to assess how policy instruments can shape investment behavior and accelerate decarbonization at the system level.

Author Contributions

Conceptualization, M.E.B. and S.K.; methodology, M.E.B. and S.K.; software, S.K. and A.C.; validation, M.E.B. and A.P.; formal analysis, M.E.B. and S.K.; data curation, A.C.; writing—original draft preparation, S.K.; writing—review and editing, M.E.B.; supervision, M.E.B.; project administration, A.P.; funding acquisition, A.P. All authors have read and agreed to the published version of the manuscript.

Funding

Maria Elena Bruni and Anna Pinnarelli are supported by the Italian Ministry of Environment and Energy Safety (MASE) through the project “SmartHydroGrid—Smart Hydrogen Microgrid”, ID: RSH2B-000033, and the Ministry of University and Research (MUR) through the PNRR NextGeneration EU “T4Y S4G4PP1”-CUPH23C22000370006.

Institutional Review Board Statement

Not applicable.

Informed Consent Statement

Not applicable.

Data Availability Statement

Data will be made available upon request.

Conflicts of Interest

The authors declare no conflicts of interest.

Appendix A

The main The parameters adopted in the mathematical model are summarized in Table A1. The selected values are representative of typical performance and cost assumptions for contemporary hybrid energy systems, including photovoltaic, hydrogen-based, and storage technologies.
Table A1. Summary of model parameters.
ParameterDescriptionValueUnit
MNumber of months12months
THourly periods per representative day24hours/day
N m Number of days represented by month mdays
Δ t Time-step length1hour
η P V PV panel efficiency (module)0.20
I m , t Solar irradiance at ( m , t ) kW/m2
A A v a i l a b l e Maximum available area for PV5000m2
ζ 1 CHP fuel-to-electric slope2.5kW fuel/kW el
ζ 2 CHP minimum fuel offset when ON2.6kW fuel
κ H 2 Max H2 blending ratio (grid/appliance)0.2
η C H P CHP electric efficiency0.40
η L o s s CHP heat dissipation loss coefficient0.15
η E L Electrolyzer efficiency (LHV basis)0.70
L H V H 2 Hydrogen lower heating value33.33kWh/kg
η G B Gas boiler efficiency0.92
η E B Electric boiler efficiency1.00
η E C Electric chiller coefficient of performance (COP)3.5
η A C Absorption chiller coefficient of performance (COP)0.7
η H F C e Hydrogen fuel cell electric efficiency0.55
η H F C h Hydrogen fuel cell thermal efficiency0.35
δ B T Battery standing loss per hour (self-discharge rate)0.001– per hour
η B T c h Battery charging efficiency0.97
η B T d i s Battery discharging efficiency0.97
Y k Economic lifetime of device kyears
iAnnual real discount/interest rate0.051/year

References

  1. Menniti, D.; Pinnarelli, A.; Bruni, M.E.; Sorrentino, N.; Brusco, G.; Bilotta, V.; Vizza, P. The Sizing of a Smart Microgrid Integrating Hydrogen Technology for a Power to Power Scenario. In Proceedings of the 2024 AEIT International Annual Conference (AEIT), Trento, Italy, 25–27 September 2024; pp. 1–6. [Google Scholar] [CrossRef]
  2. Cambini, C.; Congiu, R.; Soroush, G. Regulation, innovation, and systems integration: Evidence from the EU. Energies 2020, 13, 1670. [Google Scholar] [CrossRef]
  3. Cambini, C.; Congiu, R.; Jamasb, T.; Llorca, M.; Soroush, G. Energy Systems Integration: Implications for public policy. Energy Policy 2020, 143, 111609. [Google Scholar] [CrossRef]
  4. Zhou, Y.; Min, C.; Wang, K.; Xie, L.; Fan, Y. Optimization of integrated energy systems considering seasonal thermal energy storage. J. Energy Storage 2023, 71, 108094. [Google Scholar] [CrossRef]
  5. Yang, D.; He, Z.; Sun, Y.; Li, B.; Li, D.; Liu, X.; Jiang, C. Optimised operation of integrated community energy system considering integrated energy pricing strategy: A two-layer Stackelberg game approach. J. Energy Storage 2024, 87, 111383. [Google Scholar] [CrossRef]
  6. Beraldi, P.; Khodaparasti, S. Designing electricity tariffs in the retail market: A stochastic bi-level approach. Int. J. Prod. Econ. 2023, 257, 108759. [Google Scholar] [CrossRef]
  7. Beraldi, P.; Khodaparasti, S. A bi-level model for the design of dynamic electricity tariffs with demand-side flexibility. Soft Comput. 2023, 27, 12925–12942. [Google Scholar] [CrossRef]
  8. Fan, L.; Tu, Z.; Chan, S.H. Recent development of hydrogen and fuel cell technologies: A review. Energy Rep. 2021, 7, 8421–8446. [Google Scholar] [CrossRef]
  9. Tostado-Véliz, F.; Contreras, J.; Rider, M.J. Risk-averse electrolyzer sizing in industrial parks: A hybrid stochastic–robust optimization approach. Appl. Energy 2022, 306, 118095. [Google Scholar]
  10. Wang, X.; Li, Y.; Zhao, H.; Chen, M.; Zhang, T.; Liu, Q.; Xu, L.; Huang, J.; Yang, D.; Sun, P.; et al. Multi-objective distributionally robust optimization for hydrogen-renewable energy-coupled CCHP systems. Energy Convers. Manag. 2022, 261, 115648. [Google Scholar]
  11. Zheng, Y.; You, S.; Wang, J.; Li, X.; Bindner, H.W.; Münster, M. Data-driven robust chance-constrained optimization for optimal operation of a wind/hydrogen system. In Proceedings of the 13th International Conference on Applied Energy (ICAE 2021), Bangkok, Thailand, 29 November–2 December 2021. [Google Scholar]
  12. Liu, Y.; Li, J.; Zhang, H. Distributionally robust scheduling of port energy systems with hydrogen production and storage. Appl. Energy 2023, 340, 120923. [Google Scholar]
  13. Aramoon, A.; Khodabakhshian, A.; Siano, P. Risk-averse techno-economic analysis of off-grid PV/diesel/fuel cell systems using IGDT. Renew. Energy 2023, 205, 722–735. [Google Scholar]
  14. Xuan, A.; Shen, X.; Guo, Q.; Sun, H. A conditional value-at-risk based planning model for integrated energy systems with energy storage and renewables. Appl. Energy 2021, 294, 116971. [Google Scholar] [CrossRef]
  15. United Nations. Transforming Our World: The 2030 Agenda for Sustainable Development. Resolution Adopted by the General Assembly on 25 September 2015. A/RES/70/1. 2015. Available online: https://sdgs.un.org/2030agenda (accessed on 10 June 2025).
  16. Li, J.Y.M. Technical note—Closed-form solutions for worst-case law invariant risk measures with application to robust portfolio optimization. Oper. Res. 2018, 66, 1533–1541. [Google Scholar] [CrossRef]
  17. Mazarrón, F.R.; Álvarez, J.; Cervera-Gascó, J.; López-Santiago, J. Impact of Electricity Price Reductions on the Profitability and Sizing of Photovoltaic Systems in Agri-Food Industries. Agriculture 2025, 15, 631. [Google Scholar] [CrossRef]
  18. Mallapragada, D.S.; Junge, C.; Wang, C.; Pfeifenberger, H.; Joskow, P.L.; Schmalensee, R. Electricity pricing challenges in future renewables-dominant power systems. Energy Econ. 2023, 126, 106981. [Google Scholar] [CrossRef]
  19. Fagerström, J.; Das, S.; Klyve, Ø,S.; Olkkonen, V.; Marstein, E.S. Profitability of battery storage in hybrid hydropower–solar photovoltaic plants. J. Energy Storage 2024, 77, 109827. [Google Scholar] [CrossRef]
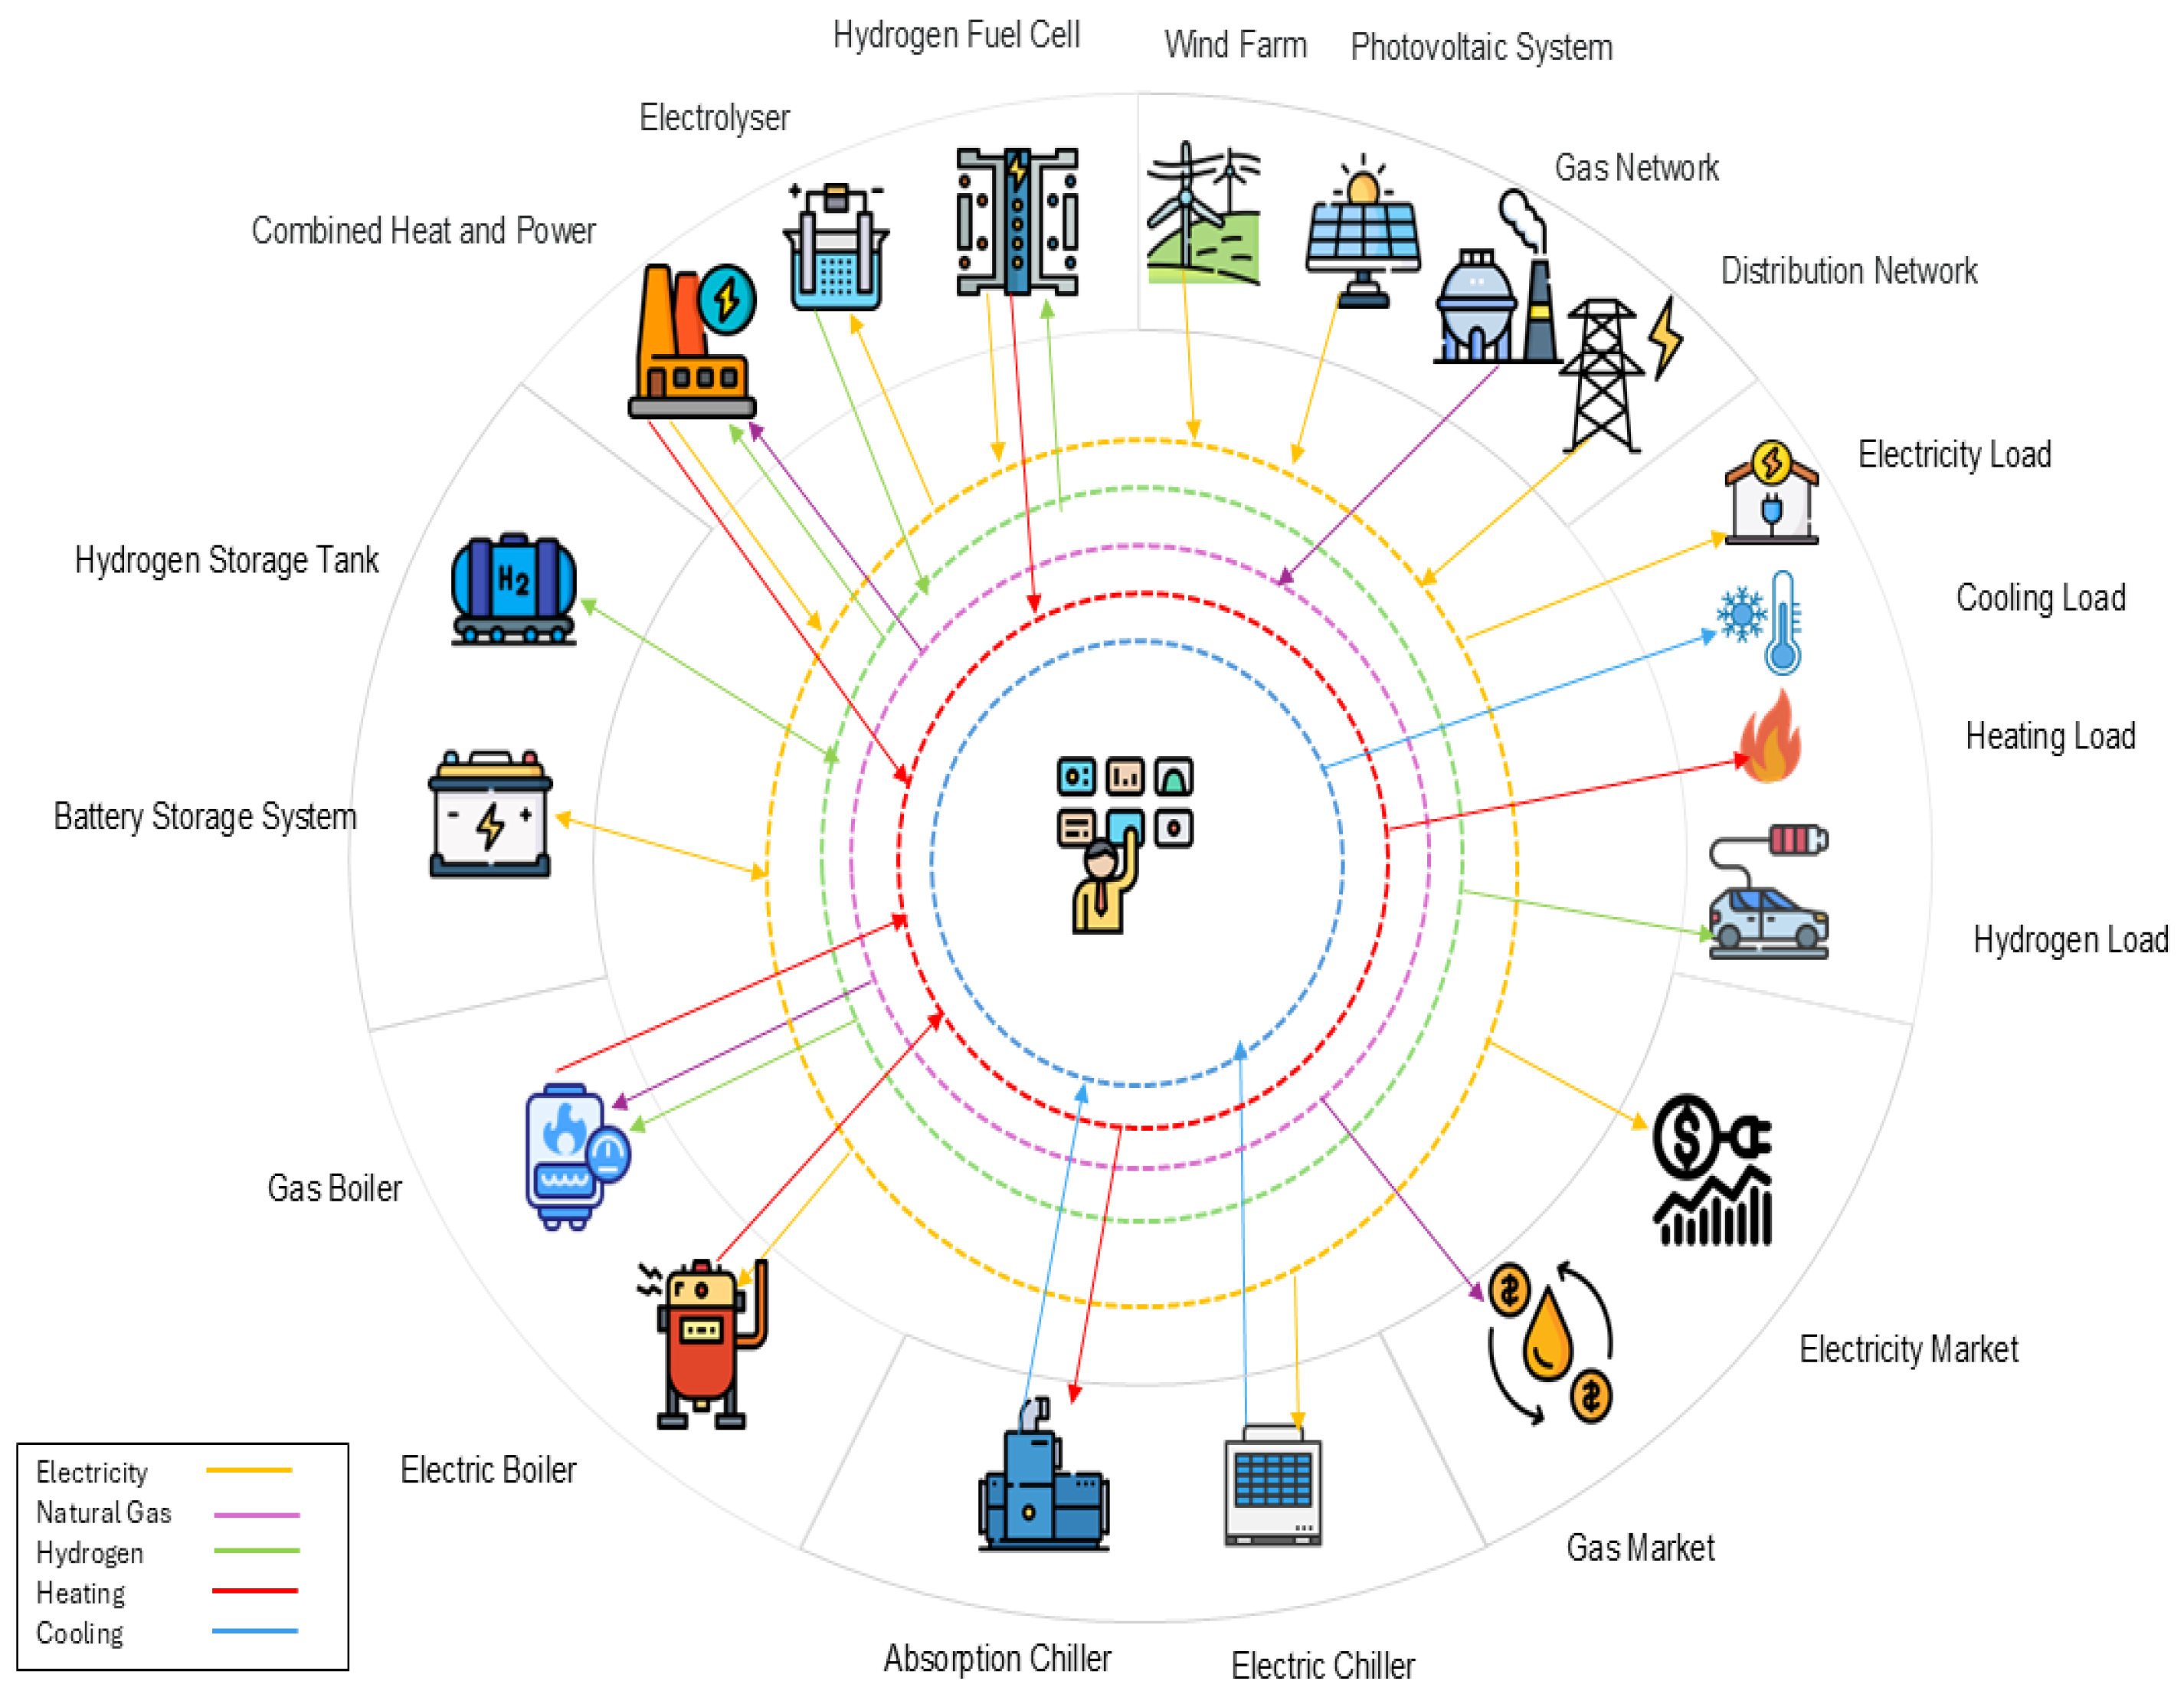
Figure 1. Structure of HES.
Sustainability 17 09475 g001
Figure 2. Electricity and natural gas price.
Sustainability 17 09475 g002
Figure 3. Solar radiation intensity and wind turbine power.
Sustainability 17 09475 g003
Figure 4. Energy production and procurement schedule: Electricity load.
Sustainability 17 09475 g004
Figure 5. Energy production schedule: Heat load.
Sustainability 17 09475 g005
Figure 6. Energy production schedule: Cooling load.
Sustainability 17 09475 g006
Figure 7. Energy production schedule: Hydrogen load.
Sustainability 17 09475 g007
Figure 8. Annual cost breakdown under different energy price variability scenarios. The total cost increases markedly when gas price volatility exceeds that of electricity, reflecting the strong dependence of CHP on natural gas.
Sustainability 17 09475 g008
Figure 9. Annual energy purchase and sale costs under different price variability scenarios. A higher gas price volatility leads to increased reliance on electricity purchases, while electricity sales remain negligible due to low market profitability.
Sustainability 17 09475 g009
Figure 10. Optimal capacity sizing under different scenarios.
Sustainability 17 09475 g010
Figure 11. Impact of hydrogen incentives on the total annual cost and the corresponding relative cost reduction.
Sustainability 17 09475 g011
Figure 12. Total annual cost as a function of the risk aversion level α .
Sustainability 17 09475 g012
Figure 13. Installed capacities of hydrogen-based technologies (EL, HFC, HST) under different risk aversion levels.
Sustainability 17 09475 g013
Figure 14. Decomposition of total cost components versus the risk aversion level α .
Sustainability 17 09475 g014
Disclaimer/Publisher’s Note: The statements, opinions and data contained in all publications are solely those of the individual author(s) and contributor(s) and not of MDPI and/or the editor(s). MDPI and/or the editor(s) disclaim responsibility for any injury to people or property resulting from any ideas, methods, instructions or products referred to in the content.