Abstract
Green and low-carbon development (GLD) is central to facilitating the high-quality transitional development of economic and social sectors, as well as to the achievement of China’s “dual carbon” goals. The digital economy (DE), a burgeoning economic paradigm, serves as a potent driver for GLD by leveraging its intrinsic strengths in innovation-led growth and cross-sectoral industrial integration. Drawing on the TOE (Technology-Organization-Environment) framework, this study employs dynamic Qualitative Comparative Analysis (QCA) and regression analysis to examine panel data (2014–2023) of 44 core coastal cities in the Yangtze River Economic Belt, aiming to identify the driving paths of GLD. The research results indicate that a single dimension in the DE cannot constitute the necessary condition for regional GLD. Specifically, there are 6 configurational paths for high-level GLD (categorized into “organization-led” and “technology-organization-environment multi-driven” models) and 3 paths for low-level GLD (summarized as “three-dimensional constraint” and “technology-organization deficiency” models). In terms of the driving effect, the technology-organization-environment multi-driven configurational path exerts the strongest promotional effect on regional GLD. This study yields a valuable theoretical foundation for understanding the synergistic role of multidimensional DE elements in driving GLD, while also delivering actionable insights for local governments to identify contextually tailored GLD trajectories.
1. Introduction
With the accelerated global process of industrialization and urbanization, issues related to greenhouse gas emissions and environmental pollution have become increasingly severe, posing significant threats to human health, economic and social development, and the global ecosystem [1,2]. Against this backdrop, achieving green and low-carbon development (GLD) has become a broad consensus of the international community [3]. As the world’s largest developing country, China’s development process exerts a crucial impact on the global economy. However, for a long time, the secondary industry has accounted for a relatively large proportion in China’s industrial structure, leading to high urban energy consumption and relatively low energy utilization efficiency, leaving China confronted with immense pressure to conserve energy and reduce emissions. The Chinese government has demonstrated a strong commitment to addressing climate change, proactively implementing measures for energy conservation, emission reduction, and low-carbon economic transition. In 2020, at the 75th Session of the United Nations General Assembly, China pioneered the announcement of its Carbon Peaking and Carbon Neutrality Goals, committing to peak carbon emissions by 2030 and achieve carbon neutrality by 2060. Subsequently, the Third Plenary Session of the 20th Central Committee of the Communist Party of China emphasized refining the ecological civilization institutional framework, promoting synergistic carbon reduction, pollution control, green development, and economic growth, and accelerating the implementation of the “lucid waters and lush mountains are invaluable assets” concept. Against this backdrop, guiding cities toward synergistic economic growth and environmental protection has become pivotal for high-quality development.
Since the onset of the 21st century, the rapid advancement of technologies such as big data, artificial intelligence, and the Internet of Things has enabled major global economies to gradually shift toward a new development phase supported by the information technology sector. This transformative shift indicates that human society is steadily evolving from the information economy era toward the DE era. As an emerging factor of production, the DE’s implications for the environment—especially its function in facilitating the low-carbon transition of cities—have increasingly garnered academic interest [4,5].
Current research on the DE empowering GLD primarily focuses on the following two aspects: First, focus on the association between the DE and GLD. Over recent years, research regarding the DE and urban GLD has seen a gradual rise, permeating various fields. Relevant research has explored the intrinsic connection between the DE and GLD from different perspectives. Some studies point out that the emerging DE holds enormous potential in driving environmentally sustainable economic growth. Specifically, under the scenario of political risk, each 1% rise in digitalization level leads to a 0.01% decrease in CO2 emission inequality [6], which implies that the DE contributes to curbing CO2 emissions. In addition, the DE exerts a notable carbon-mitigation impact on local carbon output and yields a marked positive spatial spillover impact; moreover, the greater the degree of globalization, the more robust the DE’s carbon-mitigation effect in the initial phase [7]. Second, the impact paths of the DE on GLD. Existing studies have revealed that digital platforms integrate massive amounts of market information, effectively cutting down on the decision-making burdens and information search costs of economic entities during the transaction process. This not only improves the efficiency of factor utilization and alleviates distortions in capital and labor markets but also avoids additional carbon emissions caused by irrational resource allocation, thereby strongly promoting the process of China’s low-carbon development [8]. Furthermore, as an integration of financial “digitalization” and “greening”, green digital finance serves a pivotal function in enhancing ecological environment quality. Digital green finance mainly promotes GLD by advancing energy structure transformation, reducing greenhouse gas emissions, and other approaches [9].
Although scholars have conducted extensive explorations into the relationship and impact mechanisms between the DE and GLD, laying a solid theoretical foundation and empirical analysis framework for subsequent research, there remain several shortcomings in existing studies that require further expansion and deepening. First, most existing studies treat the DE as an integrated variable for quantitative analysis [10,11], ignoring the interactions and synergistic effects among multiple factors. This makes it difficult to reveal the complex causal relationships characterized by interdependence between variables. Second, most existing studies concentrate on examining the single linear association between the DE and GLD [12]. Few studies, from a configurational perspective, investigate how different combinations of elements within the DE jointly drive urban GLD, explain the logic behind the DE’s empowerment of GLD, or provide differentiated path options for such empowerment.
Against the aforementioned theoretical and practical contexts, this study uses 44 core riverside cities in the Yangtze River Economic Belt (2014–2023) as its research sample. Leveraging the well-established TOE framework and dynamic QCA method, it sets three research motivation: First, from the technology, organization, and environment dimensions, it builds a multi-dimensional indicator system covering digital technology, digital organization, and digital environment, and analyzes in depth the driving pathways and configurational effects of the DE “Five Dimensions” elements on GLD. (The China Center for Information Industry Development (CCID Research Institute, 2022) proposed the “Five-Dimension” frame-work for the DE, which categorizes the DE into five components: digital infrastructure, digital industrialization, industrial digitalization, digital governance, and data valorization. Based on this framework, the institute has developed the China Digital Economy Development Index. Drawing on the “Five-Dimension” framework of the DE, this study constructs the DE indicator system of this paper by replacing “data valorization” with “digital innovation”). Second, it integrates the temporal dimension to examine the evolutionary stability of the above conditional configurations in panel data, clarifying the dynamic patterns of DE empowering GLD. Third, it compares the differentiated pathways leading to high- and low-level GLD, revealing causal asymmetry—thereby offering more targeted, practically guiding theoretical support for regional GLD promotion. This benefits regional GLD practitioners (who can formulate differentiated plans based on “shortboard” configurations of low-level GLD) and high-energy-consuming enterprises (which can clarify key digital transformation directions, such as optimizing digital operation management to reduce energy consumption), advancing regional green and low-carbon transformation from “broad promotion” to “targeted efforts”.
The study’s expected innovations are as follows:
- (1)
- Breaking free from the conventional single-factor linear analysis framework, this study integrates the TOE framework and dynamic QCA to unpack the asymmetric causal mechanism through which the DE drives GLD from the lens of multi-dimensional conditional configurations.
- (2)
- It builds a panel dataset of 44 core cities along the Yangtze River Economic Belt (2014–2023). For the first time, dynamic testing with a temporal dimension is conducted in the river basin’s industry-intensive corridor, boosting the timeliness and regional relevance of causal inference.
- (3)
- It transforms qualitative “conditional configurations” into measurable continuous variables, allowing for more precise capture of the marginal effects of different conditional combinations on GLD and supporting the precise design and effect evaluation of local policies.
This study is organized as follows: Section 2 first reviews the literature related to the DE and GLD, followed by the development of the research framework. Section 3 focuses on research design, which covers methods, sample selection, variable measurement, data sources, and data calibration. Section 4 presents empirical result analysis, covering necessity analysis, configuration analysis, and driving effect analysis. Section 5 summarizes key findings. Section 6 discusses key insights from the study.
2. Literature Review and Research Framework
2.1. Literature Review
In the field of GLD, existing literature has extensively explored the effects of traditional drivers—including institutional environment, industrial structure adjustment, technological innovation, and environmental regulation—on GLD. From the institutional environment perspective, Zhang et al. (2025) [13] examined the impact of three policy types (combining low-carbon city policies, innovative city policies, and new-type urbanization pilot policies) on urban GLD. They found that the synergy of multiple policies outperforms individual policies, with the “triple-in-one” policy having the strongest effect—boosting urban GLD performance by 10.8%. In terms of industrial structure, Liu et al. (2025) [14] focused on how industrial structure optimization impacts carbon emissions. They found that such optimization helps eliminate outdated production capacity, drive industrial upgrading, and thereby reduce carbon emissions. Regarding technological innovation, green technological innovation has notably enhanced carbon emission efficiency across the Belt and Road Initiative (BRI) as a whole and within each of its sub-regions [15]. For environmental regulation, existing studies note that when local governments relax environmental protection standards to boost regional economic growth, they may attract high-pollution and high-energy-consumption industries in the short term—temporarily increasing employment and tax revenues. In the long run and from a holistic perspective, however, this practice will exert adverse effects on pollution mitigation and environmental quality [16].
As information technology advances rapidly and is widely applied, scholars have incorporated the DE into the research framework of GLD, and their findings confirm that DE can effectively facilitate urban GLD. Through empirical studies, scholars have demonstrated that DE development can significantly curb carbon emissions via pathways including green technological innovation, industrial structure optimization, and energy structure adjustment [10,11,12]. Specifically, in the digital technology dimension, digital infrastructure exerts a notable effect on reducing urban carbon emissions—in particular, each extra mobile base station lowers such emissions by 36 tons [17]. In terms of digital organization, Liu et al. (2024) [18] decomposed DE development into two core dimensions: digital industrialization and industrial digitalization. Employing a fixed-effects regression model, they empirically examined the impact of these two dimensions on green innovation efficiency. Their results indicate that digital industrialization exerts no significant influence on overall green innovation efficiency, has a negative effect on research and development (R&D) activities, yet demonstrates a significantly positive role in promoting achievement transformation. In contrast, industrial digitalization markedly enhances both the transformation of achievements and overall green innovation efficiency, though its impact on the R&D stage remains statistically insignificant. Regarding the digital environment, Li et al. [19] observed that digital government exerts an impact on carbon emissions that shows an inverted “U”-shaped non-linear relationship—featuring a pattern of “initial promotion followed by inhibition”—and has an inflection point of 0.328. Once digital government development surpasses this inflection point, it exerts a significant inhibitory effect on carbon emissions.
Through a review of existing literature, it becomes clear that current studies on the DE and GLD have produced ample results. Nevertheless, several gaps still exist, which are mainly manifested in the two aspects below:
- (1)
- From the aforementioned literature review, it is clear that the majority of current studies adopt traditional linear regression models to examine the direct relationship between the DE and GLD. However, such methods overlook the impact of the multi-factor interaction effects of the DE on GLD.
- (2)
- Existing studies related to the DE typically treat the development of the DE as a one-dimensional variable when investigating its impact on GLD. Yet, examining only the impact of a single-dimensional variable on GLD often fails to reveal the complementary or substitutive relationships between elements, leading to a one-sided understanding of the mechanism through which the DE empowers GLD. In fact, the development of the DE is not only related to technology but also requires full support from organizations and the synergistic effect of the external environment—meaning the DE necessitates the alignment of technology, organization, and environment.
To address the aforementioned research gaps, this study leverages the well-established TOE framework and adopts the dynamic QCA method to formulate the following core research questions, with the aim of systematically exploring the synergistic mechanism of the multi-dimensional elements of the DE and their dynamic evolutionary patterns:
- (1)
- How do the technological, organizational, and environmental elements of the digital economy collectively drive regional GLD through configurational effects?
- (2)
- Does the driving effect of the DE’s element combinations exhibit stability or variation over time?
- (3)
- Does the configurational pathway through which the DE drives GLD exhibit regional heterogeneity?
- (4)
- Are there marginal differences in the driving effects of different element combinations?
Answering the above questions will help advance the research on the DE and GLD from the stage of “whether it is effective” to a refined stage of “when, with which combinations, and for which cities it is most effective”. For one thing, theoretically, it can clarify the substitution and complementarity relationships among the three-dimensional conditions, thereby providing dynamic causal evidence for the TOE framework. For another, practically, it can provide “city-specific policy menus” for local governments: by comparing the marginal effects of different configurations, each city can prioritize investment in condition combinations with the highest returns based on its current affiliation levels of digital infrastructure, industrial digitalization, and governance capacity. This enables the implementation of targeted carbon reduction strategies characterized by “same goals but different pathways” and avoids the waste of policy resources caused by one-size-fits-all approaches.
2.2. Configurational Framework
The TOE (Technology-Organization-Environment) framework was initially put forward by Tornatzky et al. (1990) [20]. It examines technology innovation, application, and promotion across three dimensions: Technology centers on technology-specific traits and associated technical components; Organization encompasses internal organizational resources and structures (e.g., organizational innovation capacity, human capital); and Environment covers an organization’s external macro- and micro-level factors (e.g., policy support). Currently, this framework has found wide application in fields including enterprise digital transformation [21], industrial sustainable development [22], and high-quality development [23]. As an emerging economic form, the DE—along with its associated digital technology, digital organization, and digital environment—jointly shapes regional economic development. Given that the TOE framework offers a structured analytical tool to identify the complex causal relationships underpinning GLD, this study aims to develop a theoretical framework for DE-driven GLD in Yangtze River Economic Belt cities, focusing on three dimensions: Technology (digital infrastructure, digital innovation), Organization (digital industrialization, industrial digitalization), and Environment (digital governance).
2.2.1. Technological Factors
The technology dimension comprises two conditions: digital infrastructure and digital innovation. On one hand, digital infrastructure refers to various types of software and hardware facilities that support the operation of digital technologies, including 5G, artificial intelligence, and blockchain. It serves as the foundation for the functioning of the DE. Establishing digital infrastructure enables the overcoming of temporal and spatial barriers in traditional information dissemination, thereby boosting the speed and scope of information flow. As the public and media’s attention to environmental issues increases, it will further prompt enterprises to undertake green technological innovation, develop more products and services that are energy-efficient and eco-friendly, and push for the entire industry’s transformation toward a green and low-carbon path so as to satisfy the demand of the market and society for sustainable development [24,25].
On the other hand, digital technology innovation refers to ongoing R&D and application in the digital technology domain to drive the innovative upgrading of products or services, and it acts as the core driver for DE development. This type of innovation has spawned diverse online service platforms, forging a bridge for real-time interaction between consumers and producers. Via such platforms, enterprises can more accurately understand and forecast market demand, thereby optimizing production processes and achieving flexible production management. They determine production based on orders rather than relying on inventory—this on-demand production model can avoid overproduction and inventory backlogs, reduce resource waste and pollution generation, and offer a new pathway to realizing the synergistic development of economic and environmental progress [26,27,28].
2.2.2. Organizational Factors
The organization dimension comprises two conditions: digital industrialization and industrial digitalization. On one hand, digital industrialization denotes the process of converting digital technologies into products and services that are producible and tradable. This category encompasses fields including electronic information manufacturing, software and information technology services, radio and television, the Internet, and artificial intelligence, acting as the foundational and leading industry for the development of the DE. The new formats (e.g., artificial intelligence, big data) fostered by digital industrialization inherently feature high innovation and “dematerialization”. This characteristic not only injects new vitality into industrial development but also helps advance the dematerialization process of economic activities. Meanwhile, with increased investment in the digital sector by governments and enterprises, this not only reduces the demand for and usage of fossil fuels and other non-renewable energy sources but also effectively optimizes the energy structure, cuts carbon emissions, and advances sustainable economic development [29,30,31].
On the other hand, industrial digital transformation denotes the process through which enterprises gradually adopt new technologies and new business models to drive the digitalization and intelligent upgrading of traditional production processes. It serves as a key pathway and important underpinning for the development of the DE. Beyond enhancing enterprises’ production efficiency, industrial digital transformation also enables them to gain real-time visibility into the entire product production process. In turn, this enables real-time monitoring, tracking, and management of energy consumption and pollution sources in the production process. On this basis, enterprises can promptly take effective measures to gradually phase out energy-intensive and high-pollution production methods, thereby reducing their carbon emission intensity [32,33,34]. Therefore, while achieving economic benefits, industrial digital transformation also makes significant contributions to environmental sustainable development [35].
2.2.3. Environmental Factors
The environment dimension includes one key condition: digital governance. Defined as leveraging digital technologies and platforms to refine the governance models of governments, enterprises, and society, digital governance boosts the efficiency of decision-making, supervision, and service delivery, while providing robust support for the healthy development of the DE. Digital technology application in the public sector has greatly enhanced the capacity and efficiency of government departments in internal management, external supervision, policy formulation, and public service provision [36,37]. Specifically, governments can use big data technology to gain real-time insights into the spatial distribution and flow characteristics of urban resources. Using in-depth data analysis, they can implement scientifically sound planning and policy measures to guide the development of low-carbon industries [38]. This data-driven precision governance model not only enhances the efficiency of government policy execution but also strengthens its proactivity and flexibility in addressing environmental challenges—thereby offering robust assurance for achieving sustainable development goals.
Drawing on the above analysis, the framework diagram of this study was constructed, as illustrated in Figure 1.
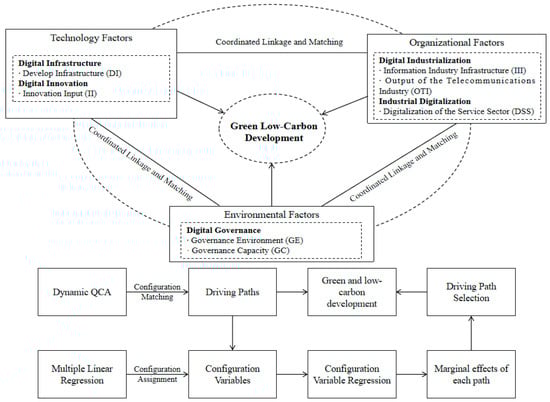
Figure 1.
TOE framework and analysis process of GLD driving paths.
3. Research Design
3.1. Research Method
GLD in the Yangtze River Economic Belt is a complex, multi-dimensional, and temporally dynamic issue, involving complex causal relationships driven by multi-factor combinations. Traditional QCA suffers from “temporal blindness” in theoretical framing; compounded by analytical tool limitations, most existing studies rely on cross-sectional data for multi-factor analysis, thereby overlooking time’s impact on conditional configurations [39]. Given that the Yangtze River Economic Belt’s GLD is a continuous, dynamic process, cross-sectional data alone cannot fully explain the underlying causal relationships or their temporal linkages. Accordingly, this study follows Garcia-Castro & Ariño (2016) [40] in adopting the dynamic QCA method. With panel data processed and analyzed via R 4.4.3, it explores how the “Five Digitalization” elements of the DE—under the TOE framework—influence the region’s GLD, as well as configurational changes over time. This serves to better capture the dynamic evolutionary process of the DE’s role in shaping GLD.
3.2. Sample Selection
Spanning China’s eastern, central, and western regions, the Yangtze River Economic Belt accounts for over 40% of the country’s total population and economic output. It is also a strategic region featuring the most concentrated innovation factors and the most diverse regional development gradients. Specifically, its practical scenarios of in-depth integration between the DE and the real economy, coupled with the transformation demand for ecological priority under the context of “jointly advancing comprehensive protection” provide a multidimensional, multi-level observation sample and demonstration platform for exploring how the DE empowers GLD. Therefore, this study exhibits strong typicality and representativeness.
Drawing on previous research [41], this study selected 44 core riverside cities as the analysis sample, considering two factors: the geographical proximity of each region to the Yangtze River and the radiating influence of the Yangtze River, while also taking data availability into account. These sample cities are Shanghai, Suzhou, Lijiang, Guiyang, Zunyi, Liupanshui, Nantong, Taizhou, Wuxi, Changzhou, Chizhou, Wuhan, Huangshi, Yangzhou, Zhenjiang, Ezhou, Huanggang, Nanjing, Ningbo, Hangzhou, Shaoxing, Jiaxing, Huzhou, Zhoushan, Hefei, Wuhu, Anqing, Maanshan, Tongling, Xianning, Jingzhou, Yichang, Changsha, Changde, Yueyang, Nanchang, Jiujiang, Chongqing, Chengdu, Luzhou, Yibin, Panzhihua, Kunming, and Zhaotong. As important components of the Yangtze River Economic Belt, these cities along the river not only continuously release regional economic momentum but also face ecological and environmental governance challenges accumulated from long-term high-intensity industrialization. Therefore, taking these cities as the research focus can offer a valuable reference for the transformation path of cities in the Yangtze River Economic Belt and other regions of China, in addressing the challenge of realizing the symbiosis between economic growth and ecological protection.
3.3. Variable Measurement
3.3.1. Outcome Variable
GLD is a sustainable development model that integrates the characteristics and connotations of greening and low carbonization in economic and social development. It aims to achieve a symbiotic and evolutionary pattern of ecological protection, energy conservation and emission reduction, and economic growth [42,43]. Based on this definition, this study divides the outcome variable into three dimensions: “green” “carbon reduction” and “development”. Drawing on previous practices, indicators for the “green” dimension include industrial sulfur dioxide emissions, industrial wastewater emissions, and industrial smoke (dust) emissions [44]; secondary indicators for the “carbon reduction” dimension include green coverage rate in built-up areas [45] and per capita carbon dioxide emissions [46]; secondary indicators for the “development” dimension include per capita regional gross domestic product (GDP) [47], per capita retail sales of social consumer goods [48], and per capita disposable income of urban households [49]. The entropy weight method is employed to compute the composite index of GLD, and the specific indicator system is presented in Table 1.

Table 1.
Indicator system for the outcome variable.
3.3.2. Conditional Variable
Digital Infrastructure. Drawing on the practices of Ma et al. (2024) [50] and Jiang et al. (2023) [51], development infrastructure is selected to represent the corresponding concept.
Digital Innovation. Drawing on the methodology of Li et al. (2024) [52], this indicator is gauged based on innovation input.
Digital Industrialization. Following the method used in Zhao et al.’s (2024) study [53], two secondary indicators—information industry foundation and telecommunications industry output—are selected to measure the corresponding construct.
Industrial Digitization. Following the approach of Chen et al. (2025) [54] and Zhang et al. (2025) [55], the digitalization of the service sector is selected as the proxy indicator for the region in this study.
Digital Governance. Governance environment and governance capacity are taken as the secondary indicators of digital governance. For the indicator of governance environment, following the approach of Chen et al. (2018) [56], Python 3.13 is used to perform word segmentation on government work reports, screen out the word frequency related to digital governance, and calculate the proportion of this word frequency in the total word frequency. This data is regarded as the government digital governance index, which reflects the level of government digital governance. For governance capacity, drawing on the idea of Gu and Li (2021) [57], the measurement is conducted using the Report on the Development of Internet Service Capabilities of China’s Local Governments, released by the University of Electronic Science and Technology of China.
The specific indicator system of conditional variables is shown in Table 2.
Table 2.
Indicator system for conditional variables.
3.4. Data Sources
In 2014, China’s State Council released the Guiding Opinions on Advancing the Development of the Yangtze River Economic Belt via the Golden Waterway, outlining its development goals as a globally influential inland river economic belt, a regional coordinated development belt, a comprehensive opening-up belt, and an ecological civilization demonstration belt. Accordingly, this study sets 2014 as the starting year and uses panel data from 44 prefecture-level cities along the Yangtze River Economic Belt (2014–2023) for empirical analysis. Data are primarily obtained from the China City Statistical Yearbook, local statistical yearbooks and bulletins, and specialized databases including EPS and CNRDS. The Digital Inclusive Finance Index is sourced from the Peking University Digital Inclusive Finance Index (5th Issue). Carbon dioxide emission data are retrieved from the China Emission Accounts and Datasets (CEADs), calculated via the internationally recognized emission factor method (missing emission data for some cities are aggregated from county-level data). The Government Internet Service Capacity Index is taken from the Report on the Development of Internet Service Capabilities of China’s Local Governments, with missing values filled via interpolation.
3.5. Data Calibration
The application of the dynamic QCA method requires data calibration, which serves to assign set membership values to individual variables. Following the method proposed by Fiss (2011) [58], this study performs direct calibration on both outcome variables and conditional variables. Based on the distribution features of variables in the full sample, the 95th, 50th, and 5th percentiles of the sample are set as the calibration anchors for full membership, crossover point, and full non-membership, respectively. To avoid excluding cases where the fuzzy set membership value equals exactly 0.5 from the analysis, the membership value of 0.5 is revised to 0.501. Detailed information on the calibration of each variable is presented in Table 3.
Table 3.
Calibration result.
4. Analysis of Empirical Results
4.1. Necessary Condition Analysis
The necessity test procedure for dynamic QCA aligns with that for traditional QCA: both rely on two metrics—consistency level and coverage—to assess if a single conditional variable serves as a sufficient or necessary condition for the outcome variable. Table 4 illustrates that none of the conditional variables demonstrate consistency above 0.9 or coverage above 0.5. Thus, no single influencing factor can dictate a region’s high or low GLD levels, necessitating a holistic analysis of multiple factors.
Table 4.
Necessary condition analysis of quantity.
A further analysis was conducted on the causal combinations with an inter-group consistency adjustment distance greater than 0.2, as shown in Table 5. The results indicate the following: First, neither Situation 3 nor Situations 5–8 simultaneously meet the criteria of inter-group consistency level >0.9 and coverage >0.5; thus, no necessary relationships exist. Second, although Situation 1 exhibits consistency >0.9 and coverage >0.5 in 2022 and 2023, the necessity test for this condition failed, as verified using X-Y scatter plots [59]. Similarly, as shown in Figure 2, by plotting scatter plots for Situation 2 (2019 and 2020) and Situation 4 (2017–2020), it was found that the conditional variables also failed the necessity test. The scatter plots for Situation 1 in 2014 and 2016 failed the necessity test; however, this does not imply that X1 constitutes a necessary condition for the outcome variable. It only indicates that X1 served as a necessary condition for GLD in these two years. The underlying reason may be that, in the first three years after the implementation of DE policies, major cities in the Yangtze River Economic Belt invested heavily in developing local digital infrastructure. This infrastructure became a key component of the DE, thereby influencing the level of GLD in these regions.
Table 5.
The data of the BECONS adjusted distance is greater than 0.2 in quantity.
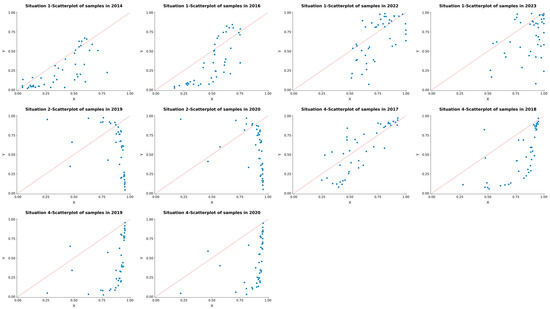
Figure 2.
Scatter plot matrix for testing necessary conditions.
4.2. Configuration Analysis
The sufficiency analysis of conditional configurations stands as a core component of QCA, as it uncovers how configurations of multiple factors or synergistic pathways drive the occurrence of a target outcome. Building on prior research [60] and contextual realities, in this study, a consistency threshold at 0.9, a proportional reduction in inconsistency (PRI) threshold at 0.75, and a case frequency threshold at 3 are established for constructing a truth table. This model includes 368 samples, satisfying the criterion of retaining at least 75% of observed cases. Prioritizing intermediate solutions while using parsimonious solutions for supplementary reference, the study identifies core and peripheral conditions and explores configurational pathways that meet the established criteria. Given the existence of causal asymmetry, separate configurational analyses are performed for high-level and low-level GLD. Table 6 summarizes the configurational pathways for key cities in the Yangtze River Economic Belt to achieve high-level or low-level GLD.
Table 6.
Results of configuration analysis.
4.2.1. Aggregated Results Analysis
Table 6 demonstrates that the overall consistency values for high-level and low-level GLD stand at 0.966 and 0.956, respectively, with both values surpassing the 0.8 threshold. This finding confirms that these conditional configurations qualify as sufficient condition configurations for high-level and low-level GLD [61]. Regarding overall coverage, the values are 0.718 for high-level GLD and 0.661 for low-level GLD, which implies these configurations encompass a substantial number of cases and possess robust explanatory power—thus satisfying the analytical criteria for dynamic QCA [58]. Additionally, the inter-group and intra-group consistency adjustment distances for each individual configuration path are both below 0.2, a result that reflects favorable configurational stability across these 9 sub-paths. Through separate classification of the configurations corresponding to high-level and low-level GLD, 4 distinct models can be synthesized:
- ①
- The 6 paths for high-level GLD fall into 2 types: H1a, H1b, and H1c can be named “Organization-Led Type”; H2a, H2b, and H3 can be named “Technology-Organization-Environment Multi-Driven Type”.
- ②
- The 3 paths for low-level GLD fall into 2 types: N1a and N1b can be named “Technology-Organization-Environment Triple-Constraint Type”; N2 can be named “Technology-Organization Deficient Type”.
Based on the configuration analysis results in Table 6, the differential adaptation relationships among technology, organization, and environment are further identified.
- (1)
- Organization-Led Type. This type of configuration indicates that cities with strong organizational conditions (digital industrialization and industrial digitalization) are more likely to achieve regional GLD. It includes 3 s-order equivalent configurations, namely Configurations H1a, H1b, and H1c, with a total unique coverage of 0.067, covering 45.7%, 51.7%, and 42.3% of urban samples, respectively. H1a and H1b are ~X1*X2*X4*X5 and X2*X4*X5*X6, respectively, where the peripheral conditions ~X1 and X6 have a substitutive relationship; H1c is X1*X3*X4*X5*X7. It can be seen that the core conditions of these three configurations are consistent, all being X4 and X5—hence the naming of this path type as “Organization-Led Type”. Among these 3 configurations, the achievement of GLD in cities of the Yangtze River Economic Belt mainly relies on digital industrialization and industrial digitalization. These two factors complement each other: they promote industrial structure upgrading, reduce carbon emission intensity, and thereby facilitate regional GLD [62].
- (2)
- Technology-Organization-Environment Multi-Driven Type. This type of configuration indicates that when the three dimensions of technology, organization, and environment are all involved and exist as core conditions, and they can efficiently drive regional GLD. It includes 3 configurations, namely Configurations H2a, H2b, and H3, with a total unique coverage of 0.038, covering 42.6%, 41.5%, and 57.6% of urban samples, respectively. Configurations H2a and H2b are X1*X2*X3*X5*X7 and X1*X2*X5*X6*X7, respectively. These two second-order equivalent configurations also have a substitutive relationship—specifically between X3 and X6. This suggests that if one region lacks one of these conditions, the presence of the other condition can achieve the same effect. Configuration H3 is X2*X4*X5*X7; compared with the previous two configurations, it lacks the core condition X1 but includes the core condition X4. These findings suggest that when high innovation investment, high digitalization of the service sector, and robust government internet service capacity coexist, the development of infrastructure for development and the output scale of the telecommunications industry are substitutable. Given that the core conditions of this configuration encompass the three dimensions of technology, organization, and environment, it is termed the “Technology-Organization-Environment Multi-Driven Type”. Analysis of this configuration type reveals that the digital economy drives GLD in a full-process and multidimensional manner as components of the digital economy, digital infrastructure, digital innovation, industrial digitalization, digital industrialization, and digital governance play important roles in promoting carbon emission reduction and achieving GLD [63,64].
- (3)
- Technology-Organization-Environment Triple-Constraint Type. This type of configuration indicates that cities will experience low-level GLD when there is a lack of innovation input, telecommunications industry output, and government internet service capabilities. It includes 2 configurations, namely Configurations N1a and N1b, with coverage rates of 53.8% and 36.3% respectively. Configurations N1a and N1b are ~X1*~X2*~X4*~X5*~X7 and ~X2*~X3*~X4*~X5*~X6*~X7 respectively. The core conditions of these two second-order equivalent configurations are consistent: ~X2*~X4*~X7, which involve the three dimensions of technology, organization, and environment—hence the naming of this type as the “Technology-Organization-Environment Triple-Constraint Type”. Innovation is the core driver of GLD and a key means to achieve carbon emission reduction goals [65]; therefore, when a city lacks innovation input, it loses the ability to drive GLD. Meanwhile, as a crucial component for measuring the development of a region’s digital economy [66], telecommunications industry output contributes significantly to economic growth and value creation, which strongly promotes urban development—low levels of this output will also restrict regional GLD. Finally, the government serves as a powerful coordinator of regional development; low levels of its service capabilities will greatly limit a region’s GLD capacity. When these three core conditions (innovation input, telecommunications industry output, government internet service capabilities) are simultaneously lacking, and two or three of the peripheral conditions—development infrastructure (X1), information industry foundation (X3), service sector digitalization (X5), and government governance environment (X6)—are also absent, this will further lead to low-level GLD in the region.
- (4)
- Technology-Organization Deficient Type. This type of configuration indicates that a lack of technological conditions and organizational conditions leads to low-level GLD, and this configuration covers 58.8% of urban samples. Configuration N2 is ~X1*~X2*~X3*~X4*~X5, which includes digital infrastructure and digital innovation (from the technology dimension) as well as digital industrialization and industrial digitalization (from the organizational dimension)—hence the naming of this configuration as the “Technology-Organization Deficient Type”. When digital infrastructure and digital innovation are lacking, a city loses the foundational support and core driver for carbon reduction. Meanwhile, in the absence of digital industrialization and industrial digitalization, the integrated industrial transformation of the city is constrained; high-energy-consumption industries still dominate, further restricting the level of regional GLD.
4.2.2. Inter-Group Results Analysis
Static QCA has an inherent temporal limitation: it relies on cross-sectional data, which fails to adequately capture temporal dynamics. To address this constraint, this study employs inter-group consistency to examine the temporal effects of configurations. Inter-group consistency assesses whether each conditional configuration functions as a sufficient condition for the outcome in each year of the research period; in doing so, it reflects the annual cross-sectional consistency level within the panel [67,68]. Figure 3 and Figure 4 show that the inter-group consistency of all 9 identified configurations exceeds 0.8. Furthermore, Table 6 reveals that the computed inter-group consistency adjustment distances all lie below 0.2—a result indicating the aforementioned configurations do not display significant temporal effects.
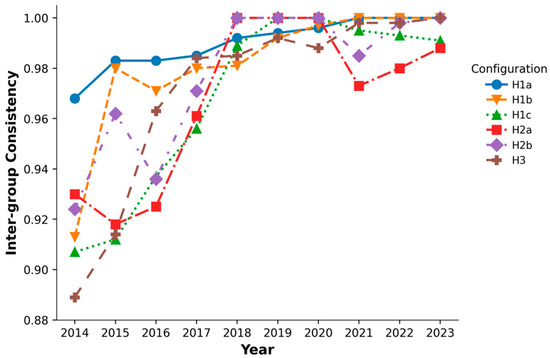
Figure 3.
Trends in inter-group consistency for high-level GLD.
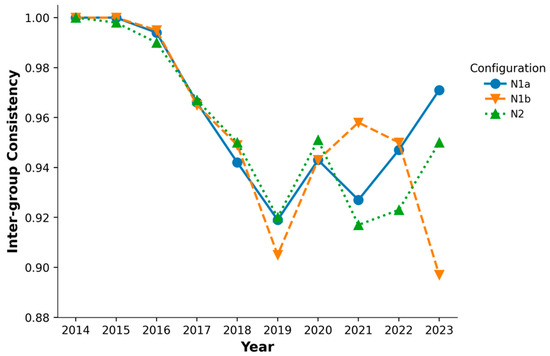
Figure 4.
Trends in inter-group consistency for low-level GLD.
First, an analysis of the configuration consistency for high-level GLD was conducted (Figure 3). It was found that the consistency of all 6 configurations showed an overall upward trend, though there were differences in the variation trends among configurations. For instance, the consistency levels of Configurations H1a and H3 increased year by year starting from 2014, eventually stabilizing at a value close to 1. In contrast, Configurations H1c, H2a, and H2b exhibited fluctuations between 2020 and 2022. The underlying reason for this may be the impact of the COVID-19 pandemic: the industrial transformation process of cities in the Yangtze River Economic Belt was hindered, the construction of digital infrastructure slowed down, and the government’s focus shifted to pandemic prevention and control—all of which temporarily disrupted the regional GLD level.
Second, an analysis of the configuration consistency for low-level GLD was conducted (Figure 4). It was found that the consistency levels of all 3 configurations showed an overall downward trend, yet they remained above 0.85. Specifically, these 3 configurations exhibited significant fluctuations between 2018 and 2023. The potential reason behind this may be that while cities in the Yangtze River Economic Belt implemented coordinated development, there were spatial conflicts between the delineation of ecological protection red lines and the layout of digital infrastructure. Additionally, market-oriented mechanisms such as carbon emission trading were not effectively connected with digital governance platforms. These factors may have led to a certain non-linear relationship between the DE and GLD in some cities, thereby causing fluctuations in consistency levels.
Finally, the inter-group consistency for both high-level and low-level GLD is greater than the standard threshold of 0.75. Therefore, the aforementioned phenomena do not affect the overall explanatory power of the configurations, and the configurations still hold reference value for the normal measurement of GLD levels.
4.2.3. Intra-Group Results Analysis
Intra-group consistency is examined at the city level, which involves evaluating whether each conditional configuration functions as a sufficient condition for the outcome across the sample cities throughout the study period. Overall configuration results show that sample cities did not adhere to a consistent conditional configuration between 2014 and 2023—meaning the configurational pathway for a given city to achieve high- or low-level GLD is not uniform. Across the two groups (high-level vs. low-level regional GLD), For all 9 configurations, the intra-group consistency adjustment distance stands at less than 0.2—which signals that there is no notable variation in the explanatory power of each configuration across different sample cities. Statistical analysis conducted on the valid cases corresponding to each configuration leads to the following conclusions:
- ①
- Cases of high-level configurations can be divided into 4 tiers: I. The “Sustained Leading Tier” represented by cities such as Shanghai, Hangzhou, and Nanjing; II. The “Steady Advancement Tier” represented by cities such as Jiaxing and Wuxi; III. The “Catch-Up Tier” represented by cities such as Wuhan, Changsha, and Hefei; IV. The “General Tier” is represented by cities such as Kunming and Guiyang.
- ②
- Cases of low-level configurations are mainly concentrated in underdeveloped cities in the upper reaches of the Yangtze River (e.g., Yibin and Panzhihua in Sichuan Province, Zhaotong in Yunnan Province, Liupanshui and Zunyi in Guizhou Province) and some underdeveloped cities in the middle reaches (e.g., Huangshi and Jingzhou in Hubei Province, Yueyang and Changde in Hunan Province, Jiujiang in Jiangxi Province).
This outcome may stem from disparities in regional economic development levels and varied paces of policy implementation: core cities in the middle and lower reaches exhibit higher green development levels than those in the upper reaches. The differentiated case distribution underscores the imbalance in GLD levels across China’s Yangtze River region, inviting in-depth consideration of enhancing regional GLD levels and redressing imbalances in green and low-carbon transition.
Taking the “Sustained Leading Tier” cities (for high-level GLD) as an example, their core pathway to driving GLD through the DE lies in reconstructing industrial ecosystems and energy systems via the DE. Building on the foundation of digital industrialization, these cities drive the intelligent transformation of traditional industries, thereby cutting energy consumption and carbon emissions per unit of output. At the same time, they leverage digital platforms to integrate resources—this not only enhances the efficiency of energy and resource allocation but also improves resource recycling rates. The commonalities of such cities include: the advanced layout of digital infrastructure under policy guidance, the synergy between leading enterprises and innovation chains, and the in-depth integration of market mechanisms with digital tools—all of which contribute to the achievement of regional GLD goals. In the future, these cities will evolve toward in-depth integration of the “digital + low-carbon” model: on one hand, they will leverage emerging technological means to strengthen the precise management and control of carbon neutrality; on the other hand, they will empower cross-regional collaboration with digital technologies to drive the gradient diffusion of low-carbon models to cities in the upper and middle reaches of the Yangtze River. Ultimately, this will form a universal zero-carbon growth paradigm with the DE as its foundation.
Cases of low-level GLD are mainly concentrated in underdeveloped cities in the upper and middle reaches of the Yangtze River. The key factors restricting the GLD of these cities include lagging digital infrastructure, regional imbalance, and slow transformation of traditional high-energy-consumption industries. In the future, these regions need to closely follow national policies, firmly seize the opportunities of digital development, integrate industrial upgrading with digital technology, and design localized policies based on local conditions to continuously narrow the gap with high-level cities. For example, Yibin (Sichuan Province) has insufficient integration between the DE and traditional industries, resulting in the failure to fully unleash the enabling effect of data factors on green and low-carbon transition. Going forward, Yibin should establish an industrial chain data sharing platform, promote the integration of enterprises in photovoltaic, energy storage, and other sectors into the industrial internet to realize dynamic monitoring and intelligent regulation of production energy consumption. Additionally, it should strengthen the intelligent transformation of traditional high-energy-consumption and high-pollution industries such as liquor-making and chemical engineering, with a view to reducing energy consumption per unit of output.
4.3. Driving Effect Analysis
Building on the configurational paths identified through the dynamic QCA method, such paths can effectively unpack the driving mechanisms by which the DE facilitates GLD in cities along the Yangtze River Economic Belt. They nonetheless fail to directly quantify the marginal effects of individual antecedent conditions on the outcome variable. To address this gap, this study draws on the configurational scoring method proposed in existing literature [69,70,71], through which each antecedent condition within the identified configurations is consolidated into a single integrated variable. The specific implementation steps of the configurational scoring method are outlined as follows:
- (1)
- Calculate the set membership degree of cases for all relevant conditions in the configuration:
In configuration analysis, relevant conditional variables can exist in two states: presence and absence. For present conditions, the membership degree of a case in the corresponding condition set—calculated in the calibration process described earlier—can be used directly. For absent conditions, the membership degree of a case in the non-condition set must be computed through a negation operation. The specific formula is as follows:
~xk = 1 − xk
Among them, ~xk denotes the membership degree of a case in the ~k (non-k) condition set; xk denotes the membership degree of a case in the k condition set.
- (2)
- Calculate the set membership degree of a case in a specific configuration Xi:
The membership degree of a case in a given configuration is calculated using the following formula:
mXi = min (x1, …, xk)
Among them, mXi denotes the set membership degree of the case in configuration Xi, while xk denotes the set membership degree of the case in the relevant condition set k.
The above operational steps can be implemented using functions such as negation and intersection operations in the fsQCA 4.0.
After integrating the antecedent conditions within each configuration into a single composite variable, this composite variable is then included in an econometric model. Econometric regression models are subsequently used to compare the marginal effects of different driving paths—a step that further deepens the interpretation of results from the configuration analysis. Additionally, to mitigate potential multicollinearity problems, this study concurrently includes both the various configurations and the conditional variables excluded from each specific configuration in the econometric model, before conducting independent regression analyses in sequence. The econometric model constructed in this study is shown below:
Among them, Y denotes the GLD level of the Yangtze River Economic Belt, Xi represents conditional variables, and Hi stands for configurational paths.
From Equations (3)–(8)—corresponding to Models (1) to (6) in Table 7—it can be observed that the variables composed of Configurations H1a, H1b, H1c, H2a, H2b, and H3 are all significantly positive at the 1% significance level. This demonstrates that each configuration exerts a promoting effect on GLD in cities along the Yangtze River Economic Belt. Among these, comparisons of the above five pathways reveal that Configuration H3 has a marginal effect of 0.889, indicating it exerts the strongest driving effect; while Configurations H1a, H1b, H1c, and H2b follow with moderate driving effects; and Configuration H2a has the lowest marginal effect (0.328), reflecting its weakest driving effect. This indicates that the “Technology-Organization-Environment Multi-Driven Model” currently serves as the core pathway for driving GLD in cities along the Yangtze River Economic Belt, providing a basis for the pathway selection of GLD in the Yangtze River Economic Belt.
Table 7.
Benchmark regression results of configurational marginal effects.
Readers who need to verify the depth of our paper may refer to the Supplementary Materials.
5. Discussion
As an emerging economic form, the DE serves as a pivotal driver for advancing urban GLD—a priority growing in significance amid global climate goals and regional sustainable development agendas. To explore this dynamic, this study systematically examines how configurations of multidimensional DE factors affect GLD by analyzing panel data from 44 cities along China’s Yangtze River Economic Belt (2014–2023) and applying the dynamic QCA method. It further identifies the specific DE factor combinations that effectively boost urban GLD levels, ultimately providing actionable insights to guide policy formulation and practical implementation. Key research findings are as follows:
- (1)
- In the necessity analysis, none of the seven antecedent variables included in the DE can constitute a necessary condition for high/non-high GLD of cities along the Yangtze River Economic Belt. That is, no single factor has been found to exert a decisive impact on the high-level or low-level GLD of cities. Consequently, realizing urban GLD requires leveraging the synergistic and interconnected effects of multiple antecedent variables—a conclusion that aligns with the findings of prior studies [72,73,74].
- (2)
- Conditional configuration sufficiency analysis reveals two pathways to high GLD for Yangtze River Economic Belt cities: the “organization-led model” and the “technology-organization-environment multi-driven model”. By contrast, pathways to non-high GLD in the region include the “technology-organization-environment three-dimensional constrained model” and the “technology-organization lacking model”. These configurational pathways for high/non-high GLD underscore the “causal asymmetry” inherent in regional GLD.
- (3)
- Inter-configuration consistency adjustment distances fall below the established judgment criterion, signaling no significant temporal effects across these configurations. Furthermore, the overall consistency of configurations linked to high-level GLD exhibits an upward trajectory, implying that the pathways through which the DE drives GLD have gradually stabilized over time.
- (4)
- Intra-configuration consistency adjustment distances also remain below the judgment threshold, signaling no significant variation in the explanatory power of each configuration across cities (i.e., no distinct spatial distribution effect is detected). Cities with high-level GLD configurations can be classified into four major tiers, while those with low-level GLD are mostly concentrated in less developed cities in the upper and middle reaches of the Yangtze River. This spatial distribution underscores regional imbalances in GLD levels, emphasizing the need to enhance regional coordinated development efforts moving forward. This aligns with Yang and Ran’s (2024) [75] findings, which show that most cities remain in the intermediate coordination stage, only a handful have attained the good coordination stage, and none have achieved high-quality coordination.
6. Conclusions
6.1. Theoretical Implications
The contributions of this study are mainly reflected in the following aspects:
First, this study applies the dynamic QCA method to explore the multi-factor driving forces of urban GLD. This addresses the limitations of traditional linear regression analysis in handling complex causal relationships among multiple factors, as well as nonlinearity and interaction effects between variables, thereby providing a more comprehensive analytical framework. Meanwhile, compared with the traditional QCA method, the dynamic QCA method overcomes the constraint of the temporal dimension and can process time-varying data. This enables more accurate capture and analysis of the dynamic changes and interactions of various factors in the process of urban GLD.
Second, this study incorporates the TOE framework and, from a configurational perspective of the DE, systematically uncovers the “different paths leading to the same goal” trait in how element combinations across various dimensions of the DE drive GLD. This not only broadens the application scope of the TOE framework in the GLD field but also offers a new lens for examining the relationship between the DE and GLD. To a certain extent, it addresses the problem of singularity and dispersion that exists in the identification of antecedent variables for GLD.
Existing studies on the DE’s role in GLD have predominantly treated DE as a monolithic variable, examining its linear emission reduction effects within Western or static cross-sectional contexts. By contrast, this study introduces the TOE framework and employs dynamic panel data spanning 44 core cities along the Yangtze River Economic Belt from 2014 to 2023, combined with dynamic QCA. This approach not only validates the overlooked nonlinear proposition that “no single factor determines GLD” but further reveals that maximal driving effects arise only when the three conditions of digital infrastructure, industrial digitization, and digital governance simultaneously function as core conditions. Through this innovation, the study shifts academic discourse from inquiries into “whether the DE influences GLD”—rooted in linear, single-factor, and static models—to an exploration of how multi-dimensional digital economy elements within the TOE framework synergistically operate in the dynamic, large-sample context of China’s Yangtze River Economic Belt. This redefines the explanatory framework for understanding the digital economy’s impact on green transitions, emphasizing the criticality of configurational synergy over isolated factor analysis.
6.2. Practical Implications
This study not only deepens the academic community’s understanding of GLD driven by DE configurations but also provides actionable practical implications for local governments.
- (1)
- Amid the rapid DE development, digital organization development is a critical means to promote urban GLD. Analysis of two high-level GLD configurational paths shows digital organizations—especially industrial digitalization—as core conditions, indicating its more universal enabling effect on GLD. Specifically, industrial digitalization provides enterprises real-time oversight of the entire production process, supporting energy consumption monitoring, management and tracking. This helps phase out traditional high-energy, high-pollution production methods to reduce pollutant emissions. To this end, governments should increase R&D investment in AI and big data, and promote Internet platform development. Relevant authorities should also use digital technologies to guide traditional industries’ digital transformation, enhancing enterprises’ digital operation and management capabilities.
- (2)
- Municipal governments should advance GLD holistically. To achieve future GLD, efforts need to focus on technical dimensions and strengthen synergy among DE factors—prioritizing multidimensional linkage and matching of digital technology, organizations, and environment to jointly drive urban GLD. Concretely, governments should step up digital infrastructure construction and upgrading, prioritize digital technology innovation and application, and boost digital industry growth (e.g., information and telecommunications). They should also guide traditional industries’ digital transformation and improve government digital governance.
- (3)
- Appropriate paths for realizing GLD should be selected based on the specific conditions of each region. For example, ordinary cities represented by Kunming and Guiyang are still in the initial stage of GLD but possess significant development potential. In the future, these cities should build on their own resource advantages to develop characteristic industries while strengthening the construction of digital infrastructure to provide strong support for GLD. For less developed cities in the upper and middle reaches of the Yangtze River, their comparatively low GLD levels are primarily hampered by underdeveloped digital infrastructure, regional disparities, and slow transformation of traditional high-energy-consumption industries. Moving forward, these regions need to integrate digital technology into industrial upgrading and pursue intelligent transformation of traditional high-energy-consumption and high-pollution industries, with the goal of reducing unit energy consumption.
6.3. Limitations and Future Work
This study yields findings on DE-enabled GLD path selection, yet has limitations to address.
First, the sample is restricted to 44 cities in China’s Yangtze River Economic Belt. Future research could expand the scope to more regions or even developed countries; comparative studies would enhance the generalizability and accuracy of results.
Second, the GLD indicator system is developed through literature analysis. Alternative measurement methods (e.g., Data Envelopment Analysis, DEA) could be adopted to improve variable measurement precision.
Finally, while dynamic QCA explores the linkage effects of DE’s “technology-organization-environment” dimensions, other factors (e.g., public environmental participation, media attention, institutional pressure) are not considered. Future work could incorporate these to build a more comprehensive driver framework.
Supplementary Materials
The following supporting information can be downloaded at: https://www.mdpi.com/article/10.3390/su17219452/s1, Table S1: Regression Results with Provincial Capital City Samples Excluded; Table S2: Regression Results with the 2014–2018 Sample Retained; Table S3: Panel Tobit Model Regression Results.
Author Contributions
Conceptualization, H.Y., X.L. and Y.Q.; Methodology, H.Y., X.L. and Y.Q.; Software, X.L. and Y.Q.; Validation, Y.Q.; Investigation, Y.Q.; Data curation, X.L. and Y.Q.; Writing—original draft, X.L. and Y.Q.; Writing—review & editing, Y.Q.; Project administration, H.Y.; Funding acquisition, H.Y. All authors have read and agreed to the published version of the manuscript.
Funding
This research received no external funding.
Institutional Review Board Statement
Not applicable.
Informed Consent Statement
Not applicable.
Data Availability Statement
Partial data are openly available in public repositories. Specifically, some of the data supporting the findings of this study can be accessed openly via the National Bureau of Statistics of China (NBSC) official website (https://www.stats.gov.cn/), the EPS Database (https://www.epsnet.com.cn/), the CNRDS Database (https://www.cnrds.com/), and the China Emission Accounts and Datasets (CEADs) (https://www.ceads.net.cn/) all accessed on 20 October 2025. Additionally, other portions of the data that support the study’s findings are available from the corresponding authors upon reasonable request.
Conflicts of Interest
The authors declare no conflict of interest.
Abbreviations
The abbreviations used in the article and their corresponding full forms are as follows: GLD (Y): Green and Low-carbon Development; DE: Digital Economy; QCA: Qualitative Comparative Analysis; TOE framework: Technology-Organization-Environment framework; DI (X1): Develop Infrastructure; II (X2): Innovation Input; III (X3): Information Industry Infrastructure; OTI (X4): Output of the Telecommunications Industry; DSS (X5): Digitalization of the Service Sector; GE (X6): Governance Environment; GC (X7): Governance Capacity.
References
- Zhang, X.; Geng, Y.; Shao, S.; Jeffrey, W.; Song, X.; Yu, W. China’s non-fossil energy development and its 2030 CO2 reduction targets: The role of urbanization. Appl. Energy 2020, 261, 114353. [Google Scholar] [CrossRef]
- Nabavi-Pelesaraei, A.; Ghasemi-Mobtaker, H.; Salehi, M.; Rafiee, S.; Chau, K.-W.; Ebrahimi, R. Machine learning models of exergoenvironmental damages and emissions social cost for mushroom production. Agronomy 2023, 13, 737. [Google Scholar] [CrossRef]
- van Doren, D.; Driessen, P.P.; Runhaar, H.A.; Giezen, M. Learning within local government to promote the scaling-up of low-carbon initiatives: A case study in the City of Copenhagen. Energy Policy 2020, 136, 111030. [Google Scholar] [CrossRef]
- Dong, F.; Hu, M.; Gao, Y.; Liu, Y.; Zhu, J.; Pan, Y. How does digital economy affect carbon emissions? Evidence from global 60 countries. Sci. Total Environ. 2022, 852, 158401. [Google Scholar] [CrossRef]
- Dong, R.; Zhou, X. Analysis of the nonlinear and spatial spillover effects of the digital economy on carbon emissions in the Yellow River Basin. Sustainability 2023, 15, 5253. [Google Scholar] [CrossRef]
- Liu, F.; Liu, W.B.; Rather, K.N.; Panda, H.S.; Mahalik, M.K.; Gozgor, G. Do digital technology and political risk reduce CO2 emissions inequality in OECD economies? Panel evidence. J. Environ. Manag. 2025, 392, 126742. [Google Scholar] [CrossRef] [PubMed]
- Tao, M.; Poletti, S.; Wen, L.; Sheng, M.S.; Wang, J.; Wang, G.; Zheng, Y. Appraising the role of the digital economy in global decarbonization: A spatial non-linear perspective on globalization. J. Environ. Manag. 2023, 347, 119170. [Google Scholar] [CrossRef]
- Lyu, Y.; Zhang, J.; Wang, W.; Li, Y.; Geng, Y. Toward low carbon development through digital economy: A new perspective of factor market distortion. Technol. Forecast. Soc. Change 2024, 208, 123685. [Google Scholar] [CrossRef]
- Yu, H.; Wei, W.; Li, J.; Li, Y. The impact of green digital finance on energy resources and climate change mitigation in carbon neutrality: Case of 60 economies. Resour. Policy 2022, 79, 103116. [Google Scholar] [CrossRef]
- Chang, H.; Ding, Q.; Zhao, W.; Hou, N.; Liu, W. The digital economy, industrial structure upgrading, and carbon emission intensity: Empirical evidence from China’s provinces. Energy Strateg. Rev. 2023, 50, 101218. [Google Scholar] [CrossRef]
- Jiang, H.; Elahi, E.; Gao, M.; Huang, Y.; Liu, X. Digital economy to encourage sustainable consumption and reduce carbon emissions. J. Clean. Prod. 2024, 443, 140867. [Google Scholar] [CrossRef]
- Wang, J.; Dong, K.; Sha, Y.; Yan, C. Envisaging the carbon emissions efficiency of digitalization: The case of the internet economy for China. Technol. Forecast. Soc. Change 2022, 184, 121965. [Google Scholar] [CrossRef]
- Zhang, Z.; Zhu, J.; Wang, J.; Chen, L. Do multiple policies better enhance urban low-carbon green development performance? Synergies and effect differences in the pilot policy combinations of low carbon, innovation, and new urbanization. Sustain. Cities Soc. 2025, 129, 106505. [Google Scholar] [CrossRef]
- Liu, H.; Wu, W.; Huang, X. Can industrial structure optimization reduce carbon emissions? Analysis of empirical regional evidence on green paths. Environ. Dev. Sustain. 2025, 1–29. [Google Scholar] [CrossRef]
- Bilal, A.; Li, X.; Zhu, N.; Sharma, R.; Jahanger, A. Green Technology Innovation, Globalization, and CO2 Emissions: Recent Insights from the OBOR Economies. Sustainability 2022, 14, 236. [Google Scholar] [CrossRef]
- Bu, M.; Wagner, M. Racing to the bottom and racing to the top: The crucial role of firm characteristics in foreign direct investment choices. J. Int. Bus. Stud. 2016, 47, 1032–1057. [Google Scholar] [CrossRef]
- Liao, K.; Liu, J. Digital infrastructure empowerment and urban carbon emissions: Evidence from China. Telecommun. Policy 2024, 48, 102764. [Google Scholar] [CrossRef]
- Liu, B.; Wang, Y.; Jiang, N.; Zhang, X. The impact of digital industrialization and industrial digitalization on regional green innovation efficiency in China—From the perspective of the innovation value chain. J. Clean. Prod. 2024, 478, 144015. [Google Scholar] [CrossRef]
- Li, C.; Chen, X.; Yuan, C.X. Does digital government reduce carbon emissions? Empirical evidence from global sources. J. Environ. Manag. 2025, 380, 125081. [Google Scholar] [CrossRef]
- Tornatzky, L.G.; Fleischer, M.; Chakrabarti, A.K. The Processes of Technological Innovation; Lexington Books: Lanham, MD, USA, 1990. [Google Scholar]
- N’Dri, A.B.; Su, Z. Successful configurations of technology-organization-environment factors in digital transformation: Evidence from exporting small and medium-sized enterprises in the manufacturing industry. Inf. Manag. 2024, 61, 104030. [Google Scholar] [CrossRef]
- Lucas, M.M.; Moreno-Luna, L.; Roets, A.O.; Al-Jaberi, S. Technological, organisational and environmental drivers of sustainability in hotels. South Afr. J. Bus. Manag. 2024, 55, 1–11. [Google Scholar] [CrossRef]
- Zhang, Z.; Feng, H.; Wang, L.; Yang, L. How to achieve high-quality development of SRDI enterprises? A study of the TOE framework-based configuration. PLoS ONE 2024, 19, e0304688. [Google Scholar] [CrossRef] [PubMed]
- Tang, C.; Xu, Y.; Hao, Y.; Wu, H.; Xue, Y. What is the role of telecommunications infrastructure construction in green technology innovation? A firm-level analysis for China. Energy Econ. 2021, 103, 105576. [Google Scholar] [CrossRef]
- Li, S.; Yang, T. The impact of digital infrastructure on air quality: Mediating role of public environmental attention and industrial development. J. Environ. Manag. 2025, 373, 123893. [Google Scholar] [CrossRef] [PubMed]
- Kaija, V.; Ralf-Martin, S.; Einari, K. Implications of digitalization in facilitating socio-technical energy transitions in Europe. Energy Res. Soc. Sci. 2022, 91, 102720. [Google Scholar] [CrossRef]
- Lyu, Y.; Zhang, L.; Wang, D. The impact of digital transformation on low-carbon development of manufacturing. Front. Environ. Sci. 2023, 11, 1134882. [Google Scholar] [CrossRef]
- Li, J.; Ma, S.; Qu, Y.; Wang, J. The impact of artificial intelligence on firms’ energy and resource efficiency: Empirical evidence from China. Resour. Policy 2023, 82, 103507. [Google Scholar] [CrossRef]
- Berkhout, F.; Hertin, J. De-materialising and re-materialising: Digital technologies and the environment. Futures 2004, 36, 903–920. [Google Scholar] [CrossRef]
- Dong, F.; Li, Y.; Li, K.; Zhu, J.; Zheng, L. Can smart city construction improve urban ecological total factor energy efficiency in China? Fresh evidence from generalized synthetic control method. Energy 2022, 241, 122909. [Google Scholar] [CrossRef]
- Duan, D.; Chen, S.; Feng, Z.; Li, J. Industrial robots and firm productivity. Struct. Change Econ. Dyn. 2023, 67, 388–406. [Google Scholar] [CrossRef]
- Gölzer, P.; Fritzsche, A. Data-driven operations management: Organisational implications of the digital transformation in industrial practice. Prod. Plan. Control 2017, 28, 1332–1343. [Google Scholar] [CrossRef]
- Li, F. The digital transformation of business models in the creative industries: A holistic framework and emerging trends. Technovation 2020, 92, 102012. [Google Scholar] [CrossRef]
- Appio, F.P.; Frattini, F.; Petruzzelli, A.M. Digital transformation and innovation management: A synthesis of existing research and an agenda for future studies. J. Prod. Innov. Manag. 2021, 38, 4–20. [Google Scholar] [CrossRef]
- Pu, Z.; Qian, Y.; Liu, R. Is digital technology innovation a panacea for carbon reduction? Technol. Econ. Dev. Econ. 2025, 31, 496–524. [Google Scholar] [CrossRef]
- Shao, S.; Razzaq, A. Does composite fiscal decentralization reduce trade-adjusted resource consumption through institutional governance, human capital, and infrastructure development? Resour. Policy 2022, 79, 103034. [Google Scholar] [CrossRef]
- Zhao, S.; Teng, L.; Arkorful, V.E.; Hu, H. Impacts of digital government on regional eco-innovation: Moderating role of dual environmental regulations. Technol. Forecast. Soc. Change 2023, 196, 122842. [Google Scholar] [CrossRef]
- Che, S.; Wang, J. Can environmental regulation solve the carbon curse of natural resource dependence: Evidence from China. Resour. Policy 2022, 79, 103100. [Google Scholar] [CrossRef]
- Meng, K.; Wei, B. Rethinking the “time blindness” of the qualitative comparative analysis: Bringing back “time” for public management research. Chin. Public Adm. 2023, 1, 96–104. [Google Scholar] [CrossRef]
- Garcia-Castro, R.; Ariño, M.A. A general approach to panel data set-theoretic research. J. Adv. Manag. Sci. Inf. Syst. 2016, 2, 63–76. [Google Scholar] [CrossRef]
- An, M.; Li, W.J.; An, H. An empirical study on the relationship between urban economic growth and environmental quality along the Yangtze River. Resour. Environ. Yangtze Basin 2022, 31, 1101–1115. [Google Scholar]
- Tian, S.Z.; Tong, M.M. Innovation driving mechanism and effect identification of green and low-carbon circular development in Yangtze River Delta. Resour. Environ. Yangtze Basin 2024, 33, 254–270. [Google Scholar]
- Chen, M.H.; Shi, N.; Zhang, B.X.; Xie, L. Spatiotemporal differentiation and evolution trend of green and low-carbon development performance in the National Major Strategic Regions. Resour. Sci. 2024, 46, 2178–2193. [Google Scholar]
- Ma, Y.; Li, R. The impact of digital economy on carbon emissions: Insights from the G-20 energy transition and environmental governance. Energy Strateg. Rev. 2025, 57, 101612. [Google Scholar] [CrossRef]
- Wang, J.; Wang, B.; Dong, K.; Dong, X. How does the digital economy improve high-quality energy development? The case of China. Technol. Forecast. Soc. Change 2022, 184, 121960. [Google Scholar] [CrossRef]
- Alshagri, R.; Alsabhan, T.H.; Binsuwadan, J. Investigating the Role of Financial Development in Encouraging the Transition to Renewable Energy: A Fractional Response Model Approach. Sustainability 2024, 16, 8153. [Google Scholar] [CrossRef]
- Ștefoni, S.E.; Brașoveanu, I.V.; Cristache, N. Advances in Economic Development through Control of the Underground Economy. Sustainability 2024, 16, 8286. [Google Scholar] [CrossRef]
- Zhang, Y.; Liu, D. Assessment of Socio-Economic Adaptability to Ageing in Resource-Based Cities and Its Obstacle Factor. Sustainability 2023, 15, 12981. [Google Scholar] [CrossRef]
- Páramo-Telle, Ó.; Vence, X. Socioeconomic factors explaining municipal solid waste generation in Galicia. Similarities and differences between aggregate magnitudes and fractions. Waste Manag. 2025, 201, 114794. [Google Scholar] [CrossRef]
- Ma, X.; Feng, X.; Fu, D.; Tong, J.; Ji, M. How does the digital economy impact sustainable development?—An empirical study from China. J. Clean. Prod. 2024, 434, 140079. [Google Scholar] [CrossRef]
- Jiang, Y.H.; Liu, M.Y.; Yang, C. Driving mechanisms of digitalization on the coordinated development of economic growth and the ecological environment. Chin. Popul. Resour. Environ. 2023, 33, 171–181. [Google Scholar]
- Li, W.; Cui, W.; Yi, P. Digital economy evaluation, regional differences and spatio-temporal evolution: Case study of Yangtze River economic belt in China. Sustain. Cities Soc. 2024, 113, 105685. [Google Scholar] [CrossRef]
- Zhao, Z.; Zhao, Y.; Shi, X.; Zheng, L.; Fan, S.; Zuo, S. Green innovation and carbon emission performance: The role of digital economy. Energy Policy 2024, 195, 114344. [Google Scholar] [CrossRef]
- Chen, Y.; Chen, D.; Gao, C.; Wei, X. The inverted U-shaped impact of the digital economy on indirect household carbon emissions—An empirical study based on CFPS. Front. Environ. Sci. 2025, 13, 1519286. [Google Scholar] [CrossRef]
- Zhang, Y.; Zhu, Y.M.; Zheng, Z.Y. Coupling coordination relationship and spatial effect of digital economy and new urbanization: A case study of the Yangtze River Economic Belt. Stat. Decis. 2025, 41, 30–35. [Google Scholar] [CrossRef]
- Chen, Z.; Kahn, M.E.; Liu, Y.; Wang, Z. The consequences of spatially differentiated water pollution regulation in China. J. Environ. Econ. Manag. 2018, 88, 468–485. [Google Scholar] [CrossRef]
- Gu, L.M.; Li, H.H. A logical exploration of the construction of local government’s administrative environment: Qualitative comparative analysis based on 68 prefecture-level cities in China. J. Beijing Adm. Coll. 2021, 4, 17–26. [Google Scholar] [CrossRef]
- Fiss, P.C. Building better causal theories: A fuzzy set approach to typologies in organization research. Acad. Manag. J. 2011, 54, 393–420. [Google Scholar] [CrossRef]
- Schneider, C.Q.; Wagemann, C. Set-Theoretic Methods for the Social Sciences: A Guide to Qualitative Comparative Analysis; Cambridge University Press: Cambridge, UK, 2012. [Google Scholar]
- Du, Y.Z.; Jia, L.D. Configuration perspective and qualitative comparative analysis (QCA): A new path for management research. Manag. World 2017, 6, 155–167. [Google Scholar] [CrossRef]
- Zhang, M.; Du, Y.Z. Qualitative comparative analysis (QCA) in management and organization research: Position, tactics, and directions. Chin. J. Manag. 2019, 16, 1312–1323. [Google Scholar]
- Tian, H.W. An analysis of digital economy empowering green and low-carbon development under the goal of “Dual Carbon”. Acad. J. Zhongzhou 2023, 9, 30–39. [Google Scholar]
- Shi, D.; Sun, G.L. An analysis on green effects of digital economy and industrial integration. Fujian Trib. Humanit. Soc. Sci. Ed. 2023, 4, 67–82. [Google Scholar]
- Wang, Y.Q.; Dong, H.J. Mechanism and spillover effect of digital economy on urban carbon emission performance. Scientia Geogr. Sin. 2025, 45, 506–517. [Google Scholar] [CrossRef]
- Shi, C.L. Carbon emission reduction effects of agricultural digitization: Theoretical analysis and empirical evidence. J. Huazhong Agric. Univ. Soc. Sci. Ed. 2025, 4, 34–46. [Google Scholar] [CrossRef]
- Xing, D.; Xu, K.N. China’s digital economy and reshaping the spatial pattern of enterprise agglomeration. Stud. Sci. Sci. 2024, 42, 528–540. [Google Scholar] [CrossRef]
- Fang, F.; Zhang, L.J.; Zhao, J. Multiple paths of agricultural green total factor productivity improvement from the perspective of institutional grouping: A panel data analysis based on dynamic QCA. Chin. Rural Econ. 2024, 2, 44–66. [Google Scholar] [CrossRef]
- Zhang, J.K.; Chen, J.; Xing, W. The path and driving effects of digital transformation of China’s manufacturing industry: A dynamic QCA analysis based on the technological economic paradigm. Soft Sci. 2025, 39, 32–40. [Google Scholar] [CrossRef]
- Fiss, P.C.; Sharapov, D.; Cronqvist, L. Opposites attract? Opportunities and challenges for integrating large-N QCA and econometric analysis. Political Res. Q. 2013, 66, 191–198. [Google Scholar]
- Meuer, J.; Rupietta, C. A review of integrated QCA and statistical analyses. Qual. Quant. 2017, 51, 2063–2083. [Google Scholar] [CrossRef]
- Meuer, J.; Rupietta, C. Integrating QCA and HLM for multilevel research on organizational configurations. Organ. Res. Methods 2017, 20, 324–342. [Google Scholar] [CrossRef]
- Jiang, H.; Lu, J.; Zhang, R.; Xiao, X. Investigation of diverse urban carbon emission reduction pathways in China: Based on the Technology–Organization–Environment framework for promoting socio-environmental sustainability. Land 2025, 14, 260. [Google Scholar] [CrossRef]
- Cheng, Y.; Tan, X.; Yan, H. What determines provincial carbon emission reduction performance in China? A study on co-movement effect based on QCA. Adv. Clim. Change Res. 2025, 16, 858–870. [Google Scholar] [CrossRef]
- Chen, W.; Cai, Q.; Di, K.; Li, D.; Liu, C.; Wang, M.; Liu, S.; Di, Z.; Shi, Q. What determines the performance of low-carbon cities in China? Analysis of the grouping based on the technology—Organization—Environment framework. PLoS ONE 2023, 18, e0289160. [Google Scholar] [CrossRef]
- Yang, X.; Ran, G. Factors influencing the coupled and coordinated development of cities in the Yangtze River Economic Belt: A focus on carbon reduction, pollution control, greening, and growth. J. Environ. Manag. 2024, 370, 122499. [Google Scholar] [CrossRef]


Disclaimer/Publisher’s Note: The statements, opinions and data contained in all publications are solely those of the individual author(s) and contributor(s) and not of MDPI and/or the editor(s). MDPI and/or the editor(s) disclaim responsibility for any injury to people or property resulting from any ideas, methods, instructions or products referred to in the content. |
© 2025 by the authors. Licensee MDPI, Basel, Switzerland. This article is an open access article distributed under the terms and conditions of the Creative Commons Attribution (CC BY) license (https://creativecommons.org/licenses/by/4.0/).