Article

A Real-World Case Study of Solar Pv Integration for Ev Charging and Residential Energy Demand in Ireland

by
Mohammed Albaba
1,*,
Morgan Pierce
2 and
Bülent Yeşilata
1
1
Energy Systems Engineering Department, Graduate School of Natural and Applied Sciences, Ankara Yildirim Beyazit University, Ankara 06010, Türkiye
2
SolarSmart Energy Ltd., D17 W267 Dublin, Ireland
*
Author to whom correspondence should be addressed.
Sustainability 2025, 17(21), 9447; https://doi.org/10.3390/su17219447
Submission received: 31 July 2025 / Revised: 28 August 2025 / Accepted: 1 September 2025 / Published: 24 October 2025

Abstract

The integration of residential solar photovoltaic (PV) systems with electric vehicle (EV) charging infrastructure offers significant potential for reducing carbon emissions and enhancing energy autonomy. This study presents a real-world case of a solar-powered EV charging system installed at a residential property in Dublin, Ireland. Unlike prior studies that rely solely on simulation, this work covers the complete process from digital design using OpenSolar to on-site installation and performance evaluation. The system includes 16 high-efficiency solar panels (435 W each), a 4 kW hybrid inverter, a 5.3 kWh lithium-ion battery, and a smart EV charger. Real-time monitoring tools were used to collect energy performance data post-installation. The results indicate that 67% of the household’s solar energy was self-consumed, leading to a 50% reduction in electricity costs. In summer 2024, the client achieved full grid independence and received a €90 credit through feed-in tariffs. The system also enabled free EV charging and generated environmental benefits equivalent to planting 315 trees. This study provides empirical evidence supporting the practical feasibility and economic–environmental advantages of integrated PV–EV systems in temperate climates.

1. Introduction

The transportation sector is a major contributor to global CO2 emissions, largely due to the extensive use of conventional fossil fuels. As the demand for fuel continues to rise, mitigating emissions becomes an urgent priority. One promising solution is the adoption of electric vehicles (EVs), which are increasingly promoted as part of the global transition to cleaner mobility. While the adoption of EVs accelerates the shift toward e-mobility, large-scale integration into the electrical grid, particularly through fast-charging stations, raises significant challenges related to grid stability, including peak load surges, voltage drops, and service interruptions [1].
To address these concerns, renewable energy sources, particularly solar energy, combined with battery energy storage systems (BESS), are being increasingly explored. These systems enable a hybrid EV charging approach that reduces pressure on the grid and promotes sustainable energy use. Solar photovoltaic (PV) systems, in particular, offer a direct and decentralized means of converting sunlight into electricity. With EVs becoming more common and PV systems increasingly affordable, there is growing momentum to develop integrated charging infrastructures that are both accessible and environmentally sound [2].
The expansion of solar PV systems is central to meeting global decarbonization targets. Recent advancements in PV and other renewable technologies have positioned them as viable alternatives to fossil fuels. Cost reductions in solar installations and the volatility of fossil fuel prices have further strengthened their appeal. In parallel, advancements in solar system design and resource management are continually improving the operational efficiency of PV systems [3,4,5,6,7].
At the same time, the automotive sector is undergoing a major shift, driven by the increasing popularity of EVs and the global push for renewable energy. The integration of solar energy into EV charging infrastructure is particularly appealing, as it links clean energy production directly with end-use consumption. However, technical barriers remain, especially in power electronics, grid compatibility, and energy management systems. Solar energy’s intermittent nature, affected by both time of day and weather, presents additional challenges for ensuring reliable and efficient charging. Moreover, poor power management could reduce battery life or compromise EV performance. Advanced energy management systems that include predictive modeling, real-time adjustments, and storage integration are essential to support efficient solar-powered EV charging [8,9,10,11,12]. Battery electric vehicles (BEVs), as a dominant subset of EVs, offer a route toward zero emissions and complete independence from traditional fossil fuels. By eliminating tailpipe emissions and reducing dependency on non-renewable resources, BEVs play a vital role in addressing climate change, urban air pollution, and the broader environmental impacts of energy consumption [13,14].
Despite the benefits of solar energy, Ireland faces distinct geographic and climatic challenges in adopting PV systems for residential use. Cloudy and rainy conditions are prevalent throughout much of the year, reducing the consistency of solar output. Table 1 presents monthly data for Dublin in 2024, including global solar radiation (J/cm2), mean temperature (°C), and total rainfall (mm) [15].
Environmental and structural constraints also hinder widespread residential PV adoption. Weather variability, roof orientation, and limited unshaded roof area can significantly reduce system efficiency [16,17,18]. To overcome these barriers, Irish companies and policymakers have advanced both technology and regulation. Among them, SolarSmart Energy Ltd., based in Dublin, has completed over 1300 installations across residential, commercial, and agricultural sectors [19]. The company employs OpenSolar [20], a digital design platform with an extensive component database including solar panels, inverters, optimizers, and fire safety switches (FSS), along with smart devices from myenergi [21], such as Zappi EV chargers [22], Eddi power diverters [23], and Harvi sensor units [24].
Energy management applications provided by inverter manufacturers and third parties like myenergi [25] enable users to optimize how energy is consumed, stored, or exported. These tools are critical in ensuring smart, flexible energy use, whether to charge an EV, store power in BESS, or sell excess electricity back to the grid. The transition to renewable energy in Ireland is steered by national and European frameworks that set binding decarbonization targets. Ireland’s Climate Action Plan 2024 maintains the goal of achieving 80% renewable electricity by 2030, with specific targets for solar PV capacity growth, energy storage, and electrified transport, and advances measures for distributed generation and smart-grid integration [26,27]. The National Energy and Climate Plan (NECP) further emphasizes distributed generation, flexibility, and grid modernization. Complementary policy tools include SEAI-administered grants for solar PV installations, EV home chargers, and battery storage. Within this policy context, Solar Photovoltaic systems play a central role and are supported by the Sustainable Energy Authority of Ireland through grants, technical guidance, and public programs [28]. Current domestic supports include the Solar Photovoltaic grant, which provides €700 per kilowatt-peak up to 2 kilowatt-peak and €200 per additional kilowatt-peak up to 4 kilowatt-peak, capped at €1800 [29]; the Electric Vehicle Home Charger grant of up to €300 toward purchase and installation [30]; and the Microgeneration Support Scheme (MSS) and Clean Export Guarantee (CEG) encourage prosumer participation by remunerating exported electricity [31]. Additionally, the 2022 changes to Planning and Development Regulations [32] have removed rooftop area limits for domestic PV systems, thereby removing a major barrier to installation. Together, these measures create favorable conditions for household-scale Solar Photovoltaic and Electric Vehicle integration and for consumer participation as active prosumers, foster an enabling environment for integrated PV–EV systems, and promote Ireland’s transition to a low-carbon energy model at the household level. Against this backdrop, the present case study examines the technical and economic performance of a hybrid residential Solar Photovoltaic and Electric Vehicle charging installation in Dublin.
This study delivers a practical, data-driven contribution to the field of residential renewable energy systems, particularly focusing on the integration of solar PV and electric vehicle charging infrastructure under temperate climate conditions. Its main contributions are as follows:
  • It presents a full real-world implementation of a residential solar PV system combined with a smart EV charger, moving beyond simulation to include actual installation, real-time operation, and measured performance.
  • It provides empirical evidence on system behavior under Irish weather conditions, addressing a gap in the literature dominated by simulation-based studies.
  • It quantifies the impact on energy independence, grid interaction, and cost savings over a seasonal cycle, achieving 67% reduction in grid electricity use and full summer self-sufficiency.
  • It integrates mobile application-based monitoring and control, demonstrating the importance of user interaction and live energy management in optimizing system performance.
  • It offers a region-specific case study with practical relevance to similar low-to-moderate irradiance climates, informing design strategies, policy directions, and adoption models.
Unlike previous studies that rely heavily on simulation, this work contributes real operational data including performance, control strategies, and user interaction via smart energy apps. The case study also highlights financial and environmental outcomes, with sections covering the system’s technical characteristics, economic viability, and carbon offset potential. A visual overview of the challenges in Ireland including environmental, technological, and practical aspects, as well as their details, is shown in Figure 1, which clarifies the relationship between the main challenges and innovations in the renewable energy sector in Ireland. The case study branch reflects how the proposed system contributes to resolving these challenges.

2. Literature Review

The study [33] presents the design and simulation of a 4 kW solar-powered hybrid EV charging station, integrating solar energy with a BESS. This design ensures consistent power supply for EVs, even during periods of low solar generation. The charging station employs a three-stage strategy: first, solar panels convert sunlight into electricity for immediate use and charging; second, excess energy is stored in batteries; and third, when solar generation is insufficient, the station draws power from the grid. To optimize performance, maximum power point tracking (MPPT) algorithms were implemented to ensure peak efficiency from the solar panels. Simulations conducted with MATLAB demonstrated the system’s capability to provide uninterrupted power, evaluating metrics such as charging efficiency and battery utilization. The findings indicate that the hybrid station can effectively address grid stability issues and meet EV charging demands while reducing reliance on fossil fuels and greenhouse gas emissions. The station’s ability to accommodate 10–12 EVs underscores its scalability.
The paper [34] develops a GIS-based method for identifying equitable locations for public electric vehicle charging stations from the perspective of local authorities. Using openly available spatial datasets and a hexagonal grid representation of the urban area, the authors implement their workflow in QGIS and quantify potential charging-site suitability by integrating social, infrastructural, and land-use criteria; the method is demonstrated through a case study in the city of Gliwice, Poland, where five candidate locations were recommended for deployment. The paper’s principal contribution is its pragmatic emphasis on data accessibility and decision-support for municipal planners, together with a structured procedure that explicitly targets equal access across urban subareas. However, the study remains focused on macro-scale site selection and suitability scoring rather than operational performance: it does not address on-site energy flows, real-time control, or field-measured generation/consumption data, limitations that highlight an evidentiary gap between planning-oriented GIS–MCDM research and household-level, instrumented installations. This distinction makes Soczówka et al.’s approach [34] a useful complement to the present work, which provides empirical, post-installation performance data for a residential PV–EV system in a temperate climate.
The author in [35] evaluates the techno-economic and environmental aspects of renewable energy-based grid-tied electric vehicle charging stations in Muzaffarabad, Pakistan. Using HOMER for feasibility analysis and Helioscope for validation, the system reduces grid consumption by 215,945 to 254,030 kWh annually, with a levelized cost of electricity of $0.016 per kWh, consuming 13% of generated power and reselling the remaining 87% to the grid.
The article [36] presents a comprehensive GIS-integrated FAHP–MABAC methodology to support the expansion of electric vehicle charging infrastructure. Their approach combines Geographic Information Systems (GIS) with fuzzy analytical hierarchy process (FAHP) for criteria weighting, followed by the Multi-Attributive Border Approximation Area Comparison (MABAC) method to rank potential station locations. The procedure is applied to a real-world regional context, incorporating diverse criteria such as land availability, population density, road network access, and proximity to existing high-voltage grid infrastructure. Bi et al.’s contribution lies in providing a structured, fuzzy logic-enhanced decision-making framework that aids planners in systematic site prioritization amid multiple conflicting factors. However, the study remains planning-focused, emphasizing macro-level geographic importance rather than operational dynamics; it lacks real-world energy flow validation, user behavior data, or real-time performance insights. This emphasis on infrastructure siting contrasts with the present work’s empirical contribution, namely, the validation of a household-scale solar PV–EV charging system through measured performance in a temperate climate environment.
Mhana and Awad [37] developed a multi-criteria framework for electric vehicle charging station (EVCS) site selection in Baghdad and Riyadh using Geographic Information Systems (GIS) combined with the Analytical Hierarchy Process (AHP) and Fuzzy AHP (FAHP). Twelve spatial and urban criteria, including traffic density, land use, and accessibility, were evaluated. Results showed high-suitability zones of 179.99 km2 (AHP) and 162.61 km2 (FAHP) in Baghdad, compared with 44.51 km2 and 34.27 km2 in Riyadh, highlighting priority districts such as Karkh and Al-Olaya. The study demonstrates that integrating FAHP with GIS provides more reliable decision support for EVCS planning in diverse urban contexts, though it remains limited by its reliance on expert-driven weighting and the absence of temporal demand dynamics.
This paper [38] examines the economic feasibility of using solar energy for powering households and EVs in Northern Cyprus, identifying Ercan as the optimal site for photovoltaic plants. Results indicate that solar charging effectively meets household and EV energy needs, which is beneficial for countries dependent on costly imported fuels. Focusing solely on solar power for EVs, without energy storage, could halve plant costs, enhancing this approach’s viability. This research offers valuable insights into sustainable energy solutions for policymakers in Northern Cyprus.
The author in [39] proposes a GIS-supported weighted-sum decision-making framework to optimize electric vehicle charging station placement along major highways. Their methodology combines expert-driven weight assignments for criteria such as service level, traffic density, and proximity to access roads with cluster analysis to identify site suitability along the Edirne–Ankara route in Türkiye. This approach strikes a balance between accessibility and technical feasibility, and successfully captures infrastructure planning complexity on a regional scale. However, it remains oriented toward network-level deployment and does not incorporate real-world energy generation or usage data, nor does it consider household-scale interactions. Consequently, it underscores a complementary gap: while the study excels in preparatory geographic planning, it differs substantively from the present work’s focus on empirical performance evaluation of a residential solar-powered EV charging system.
The article [40] presents an innovative integrated bidirectional converter designed to streamline the on-board charging process by minimizing the number of switches, size, and weight of power electronic interfaces. To address the intermittent nature of PV output due to varying weather conditions, battery storage is incorporated into a grid-tied system, ensuring a reliable power source for EV charging stations that utilize renewable energy. The study discusses a time-multiplexing method for solar energy charging and verifies the charging station’s performance as a standalone generator through simulation results. MATLAB simulations confirm the efficacy of the proposed system under various operating modes, incorporating multiple energy sources, including fuel cells and the main utility grid.
The researcher in [41] offers a GIS-based, multi-criteria decision-making framework for solar-assisted EV charging station siting in Qingdao, China. Their method blends Geographic Information Systems (GIS), fuzzy DEMATEL for criteria weight assignment, and fuzzy MULTIMOORA for ranking potential sites. Thanks to triangular fuzzy numbers, the approach manages expert judgment uncertainty effectively, and it progresses from spatial pre-selection through a rigorous prioritization stage, validated by comparative and dual sensitivity analyses. While the approach is robust for municipality-scale planning, it remains focused on the initial site rather than system-level, operational performance or real-world measurement. This contrasts with the current study, which emphasizes installed-system data, including generation, consumption, and EV usage for a residential-scale installation in a temperate, low-irradiance context.
In [42], the paper introduces a coordinated EV charging strategy that aligns with PV generation timing, maximizing solar energy use without significantly impacting EV availability. Tested using data from a European city, the approach shows substantial advantages over uncoordinated charging across seasons and varying PV and EV levels. In summer, coordinated charging enables up to 92% solar-powered EV charging, while in winter, solar provision ranges from 13% to 76%. Winter gains, particularly, outperform uncoordinated methods, offering improvements of 5 to 63 percentage points based on PV and EV integration levels.
The study [43] introduces a hybrid GIS–Bayesian Network (BN) framework for siting electric vehicle charging stations in Singapore. They combine spatial datasets from GIS with a Bayesian network architecture that evaluates candidate locations based on nine weighted criteria, such as proximity to public transport, household density, and charging efficiency, to establish causal relationships and identify optimal site rankings. Their work underscores the strength of integrating geographic visualization with probabilistic modelling, offering a stable and accurate method under noisy data conditions. However, the methodology remains grounded in planning-stage analysis, focusing on pre-deployment decision-making rather than post-installation performance or real-time operational validation. In contrast, the present study extends this line of research by providing empirical, field-based performance data from a household-scale solar PV–EV charging implementation in a temperate setting.
An optimization model for strategically placing and sizing solar-assisted EV charging stations in urban areas is presented in [44]. The model uniquely integrates location selection with station sizing. To enhance computational efficiency across a large solution space, a modified metaheuristic with three acceleration techniques is applied. Experimental results using two hundred and ninety-seven electric vehicle rental users demonstrate the ability of the method to provide high-quality and timely decisions.
Another strategy for real-time energy optimization management for electric vehicles using a hybrid energy storage system (HESS) that integrates lithium-ion batteries and ultra-capacitors is illustrated in [45]. Using a quadratic optimal control algorithm, this approach alleviates computational challenges and improves efficiency. Simulation results from MATLAB/Simulink and ADVISOR show the effectiveness of the method in reducing battery workload and power consumption. The analysis confirms the superiority of quadratic optimization in improving dynamic performance, increasing the distance traveled, and reducing the operational burden on the battery.
The researcher in [46] develops and tests a grid-connected, solar-powered EV charging station incorporating vehicle-to-grid (V2G) technology. The station comprises a PV array, a fast, accurate MPPT controller, and 15 bidirectional DC/DC converters for each EV charging unit. Unlike previous studies limited to simulations, this work provides experimental results, showing that the station generates sufficient power for EV charging on sunny days and helps balance local grid demand during cloudy days. The innovative MPPT method enhances solar energy conversion, confirming the station’s reliability and efficiency in diverse weather conditions.
Workplace EV charging in the Netherlands, powered by solar energy, analyzing the optimal PV panel orientation and energy availability based on data from the Dutch Meteorological Institute, is explored in [47]. Due to low solar insolation, a 30% oversizing of PV arrays relative to converter capacity is recommended. By comparing dynamic EV charging profiles, the study aims to reduce grid dependence and maximize solar use across weekday-only and daily charging scenarios. A priority mechanism for multi-EV charging is introduced, and the feasibility of local storage to minimize grid reliance is assessed. Findings show that a small storage (10 kWh) can reduce grid dependency by 25% but cannot fully eliminate it due to seasonal variability.
The integration of solar energy and EV charging within solar parking lots, which provide shaded parking, direct EV charging, and vehicle-to-grid (V2G) capabilities, is examined in [48]. Solar carports efficiently use urban space to promote clean energy and reduce emissions. Key technical, environmental, and financial considerations are discussed, showing that while solar power can meet 75–100% of EV charging needs, optimized smart charging is necessary to address solar and demand variability. Profitability requires a strategic business model, emphasizing the importance of economic feasibility and potential grid service revenues.
Previous studies have discussed different types of simulations by assuming some specific cases. On the other hand, there is a lack of information in terms of real case studies and analysis based on actual values of installed systems. This research paper highlights this important gap by presenting a solar-powered EV charger for home use in Dublin, Ireland, which was simulated, offered, and installed by a well-known solar energy company.

3. Methodology

3.1. Site Selection and Consumption Overview

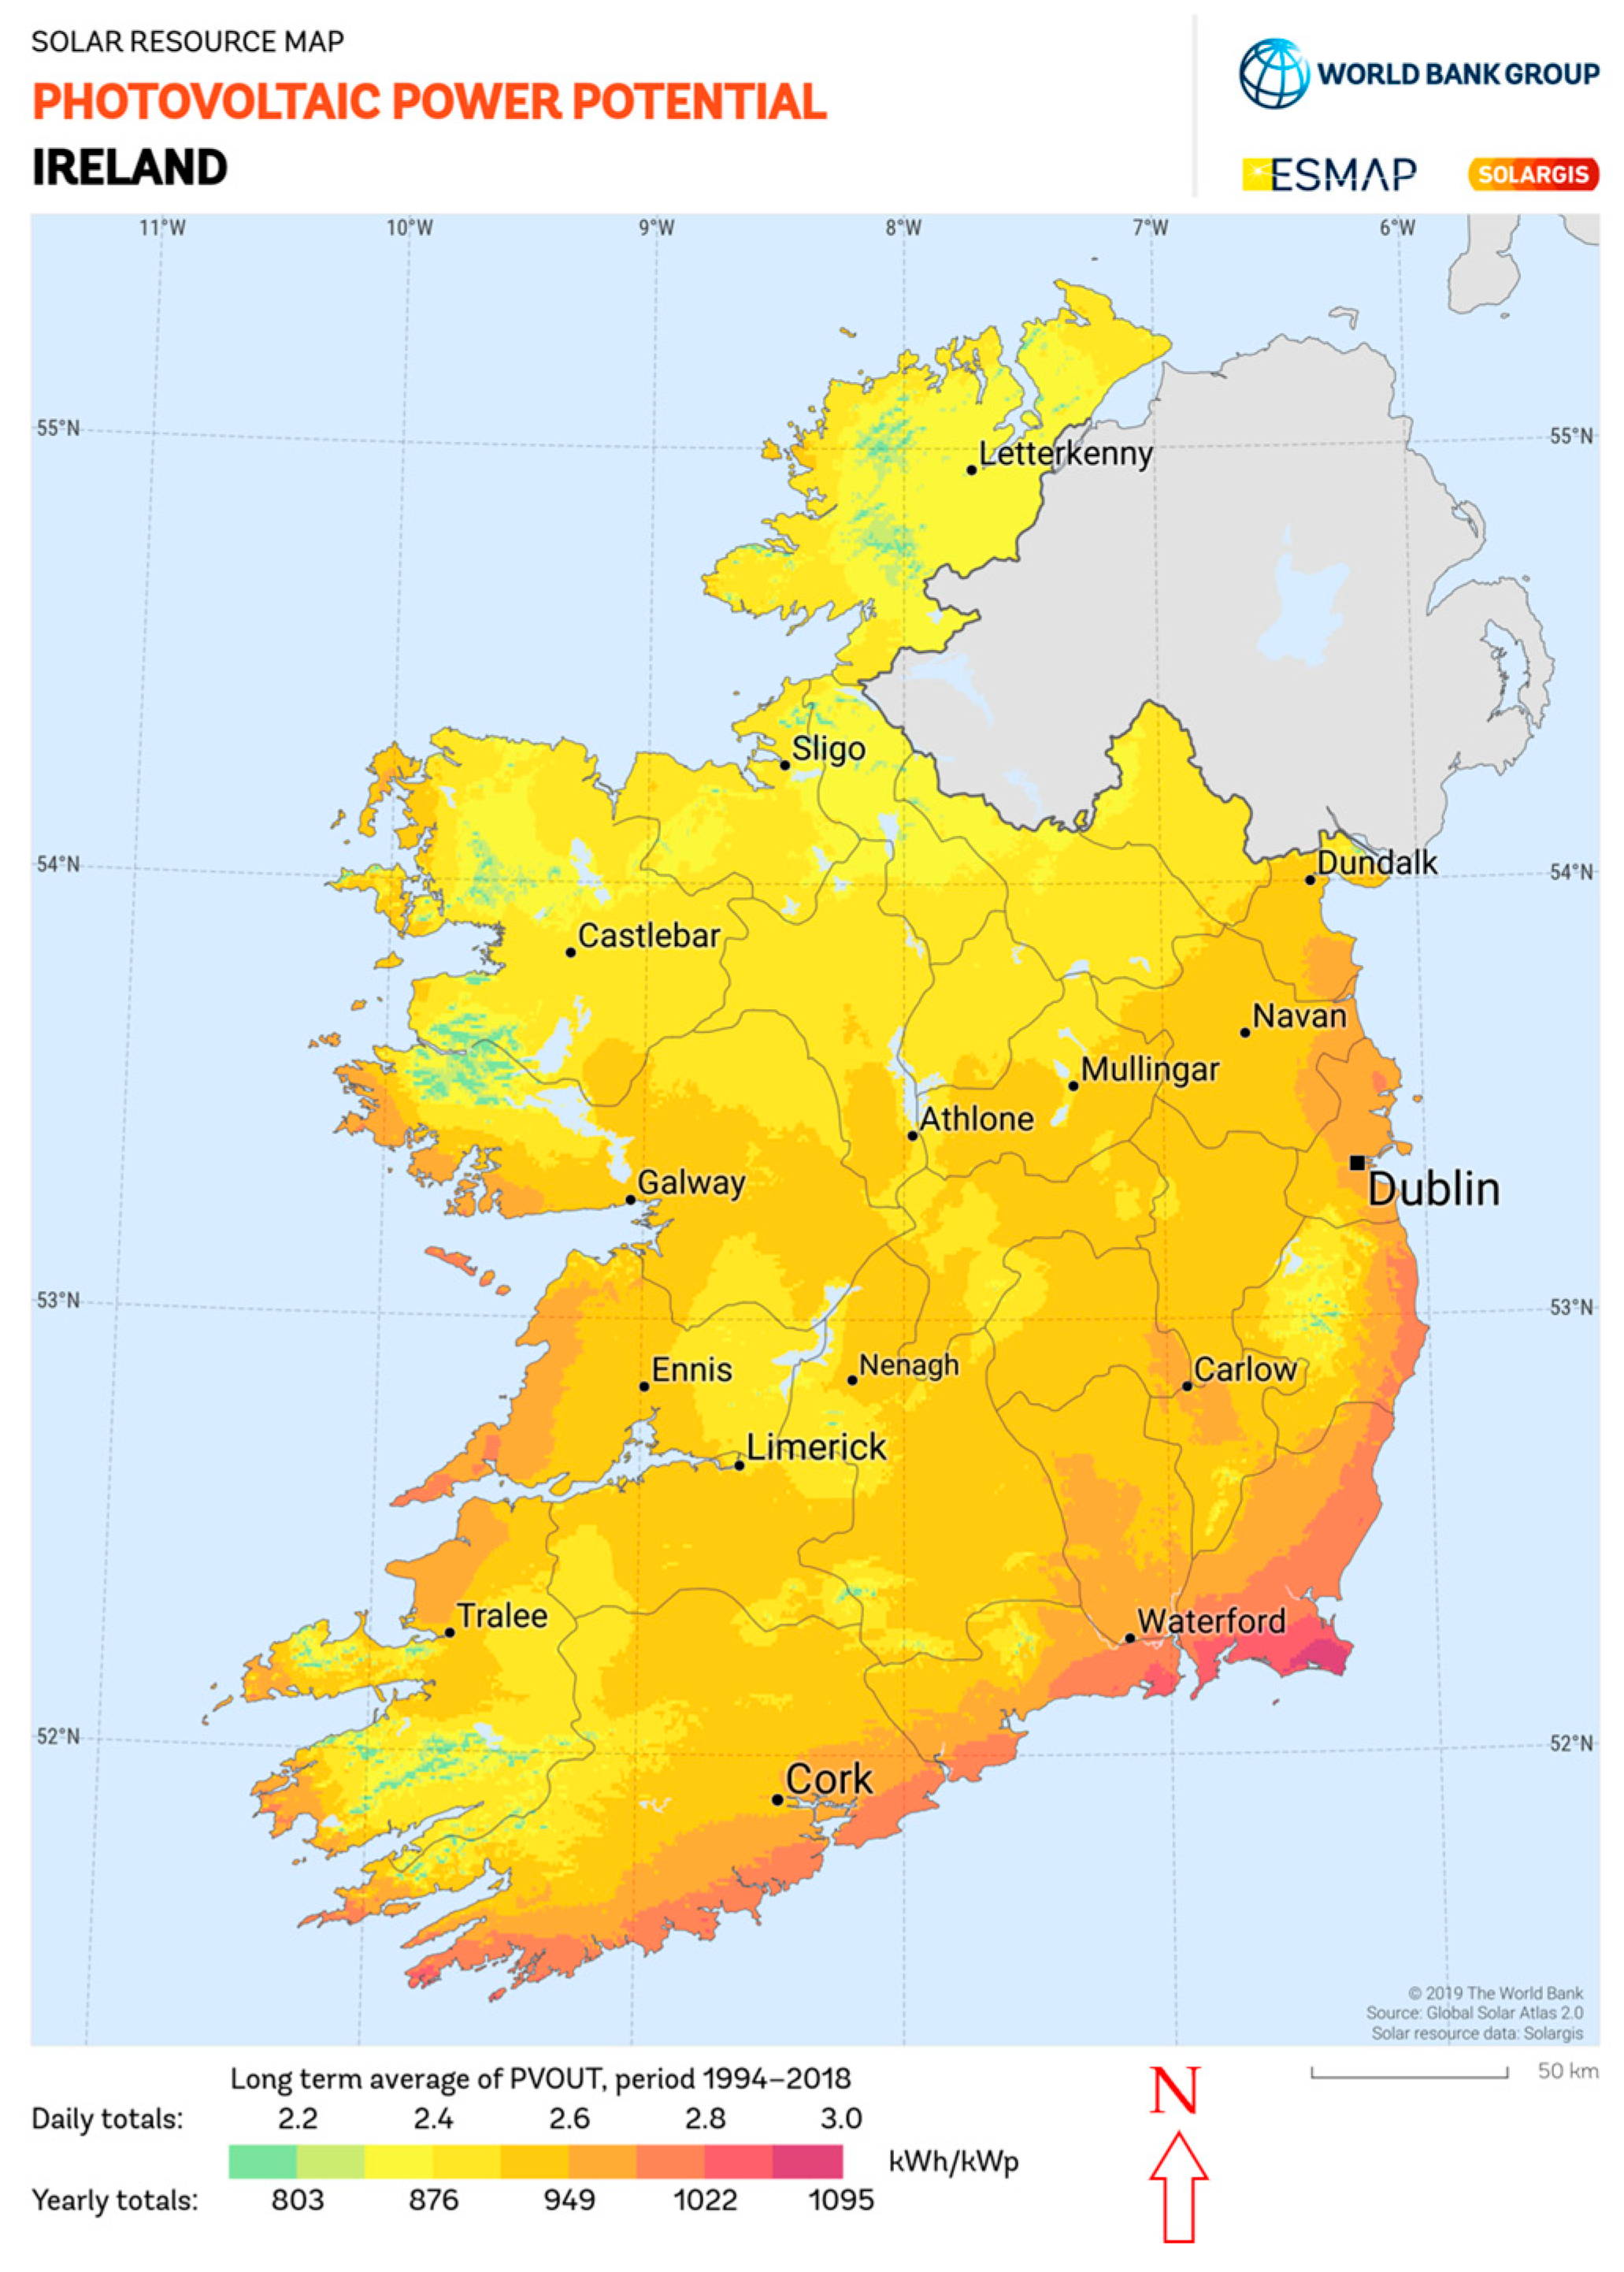
The site chosen for this study is a residential property in eastern Dublin, Ireland, where the homeowner intends to install a solar PV system along with an EV charger. This location offers strong potential for solar energy generation, as shown in Figure 2.
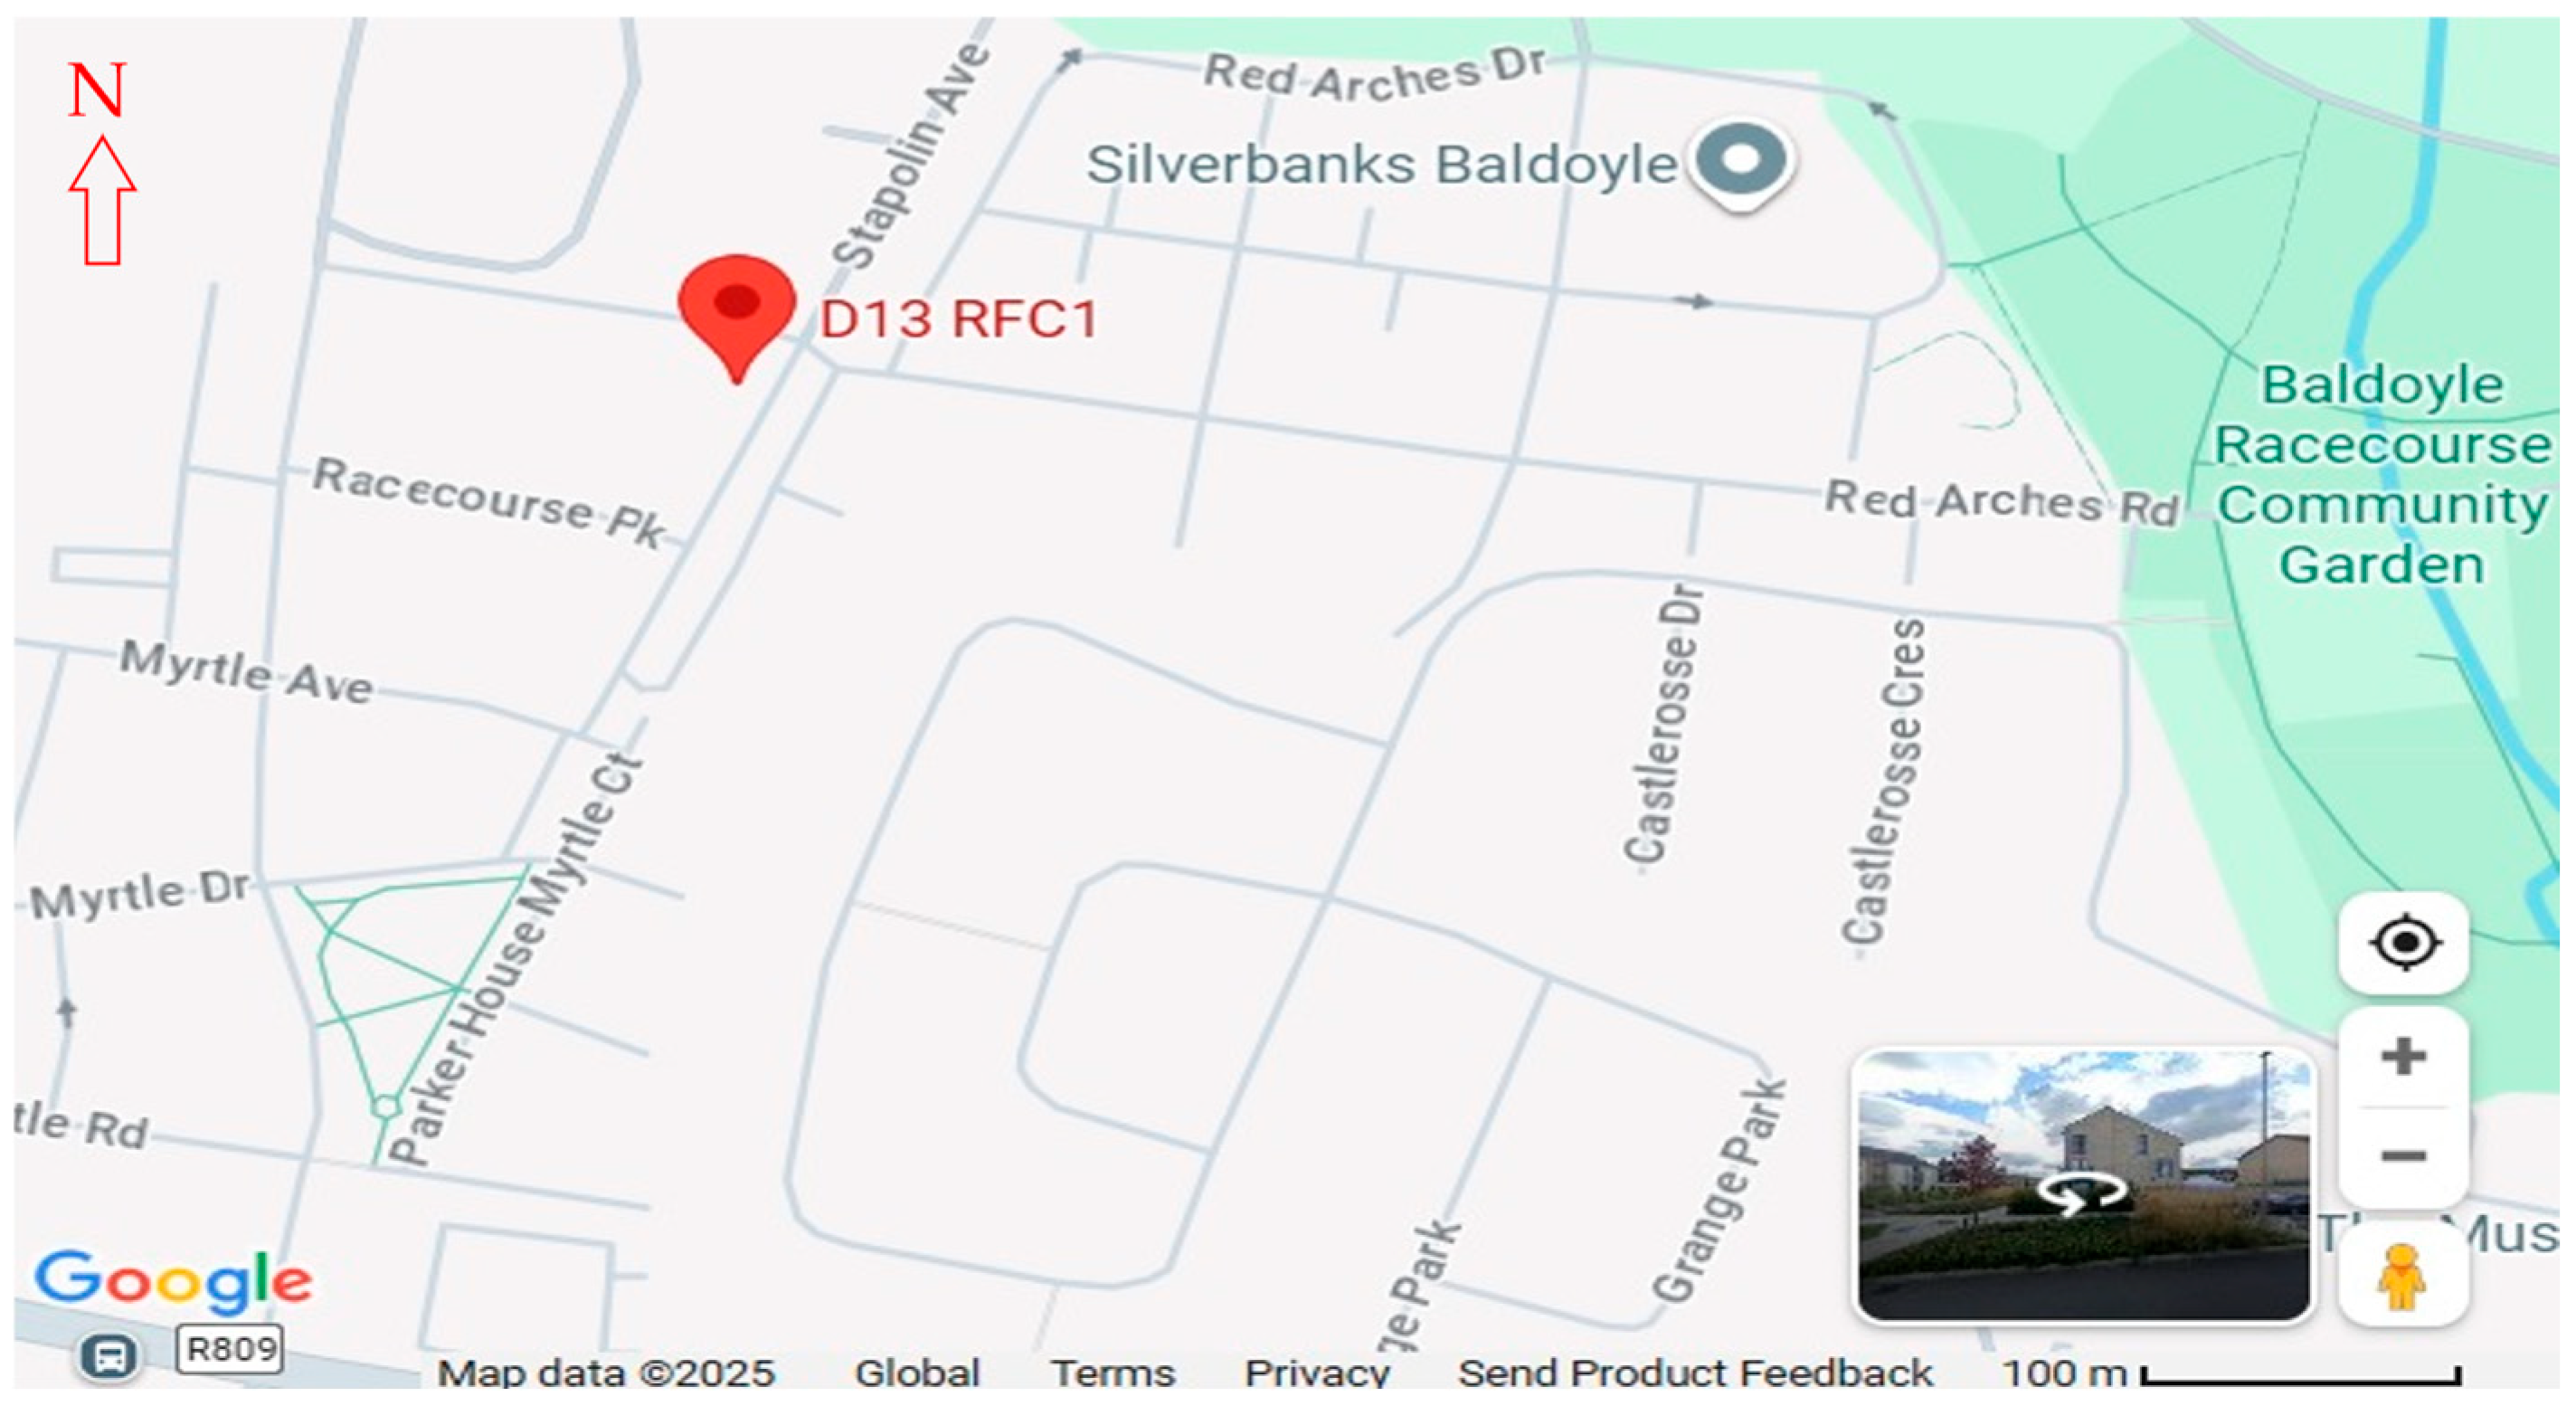
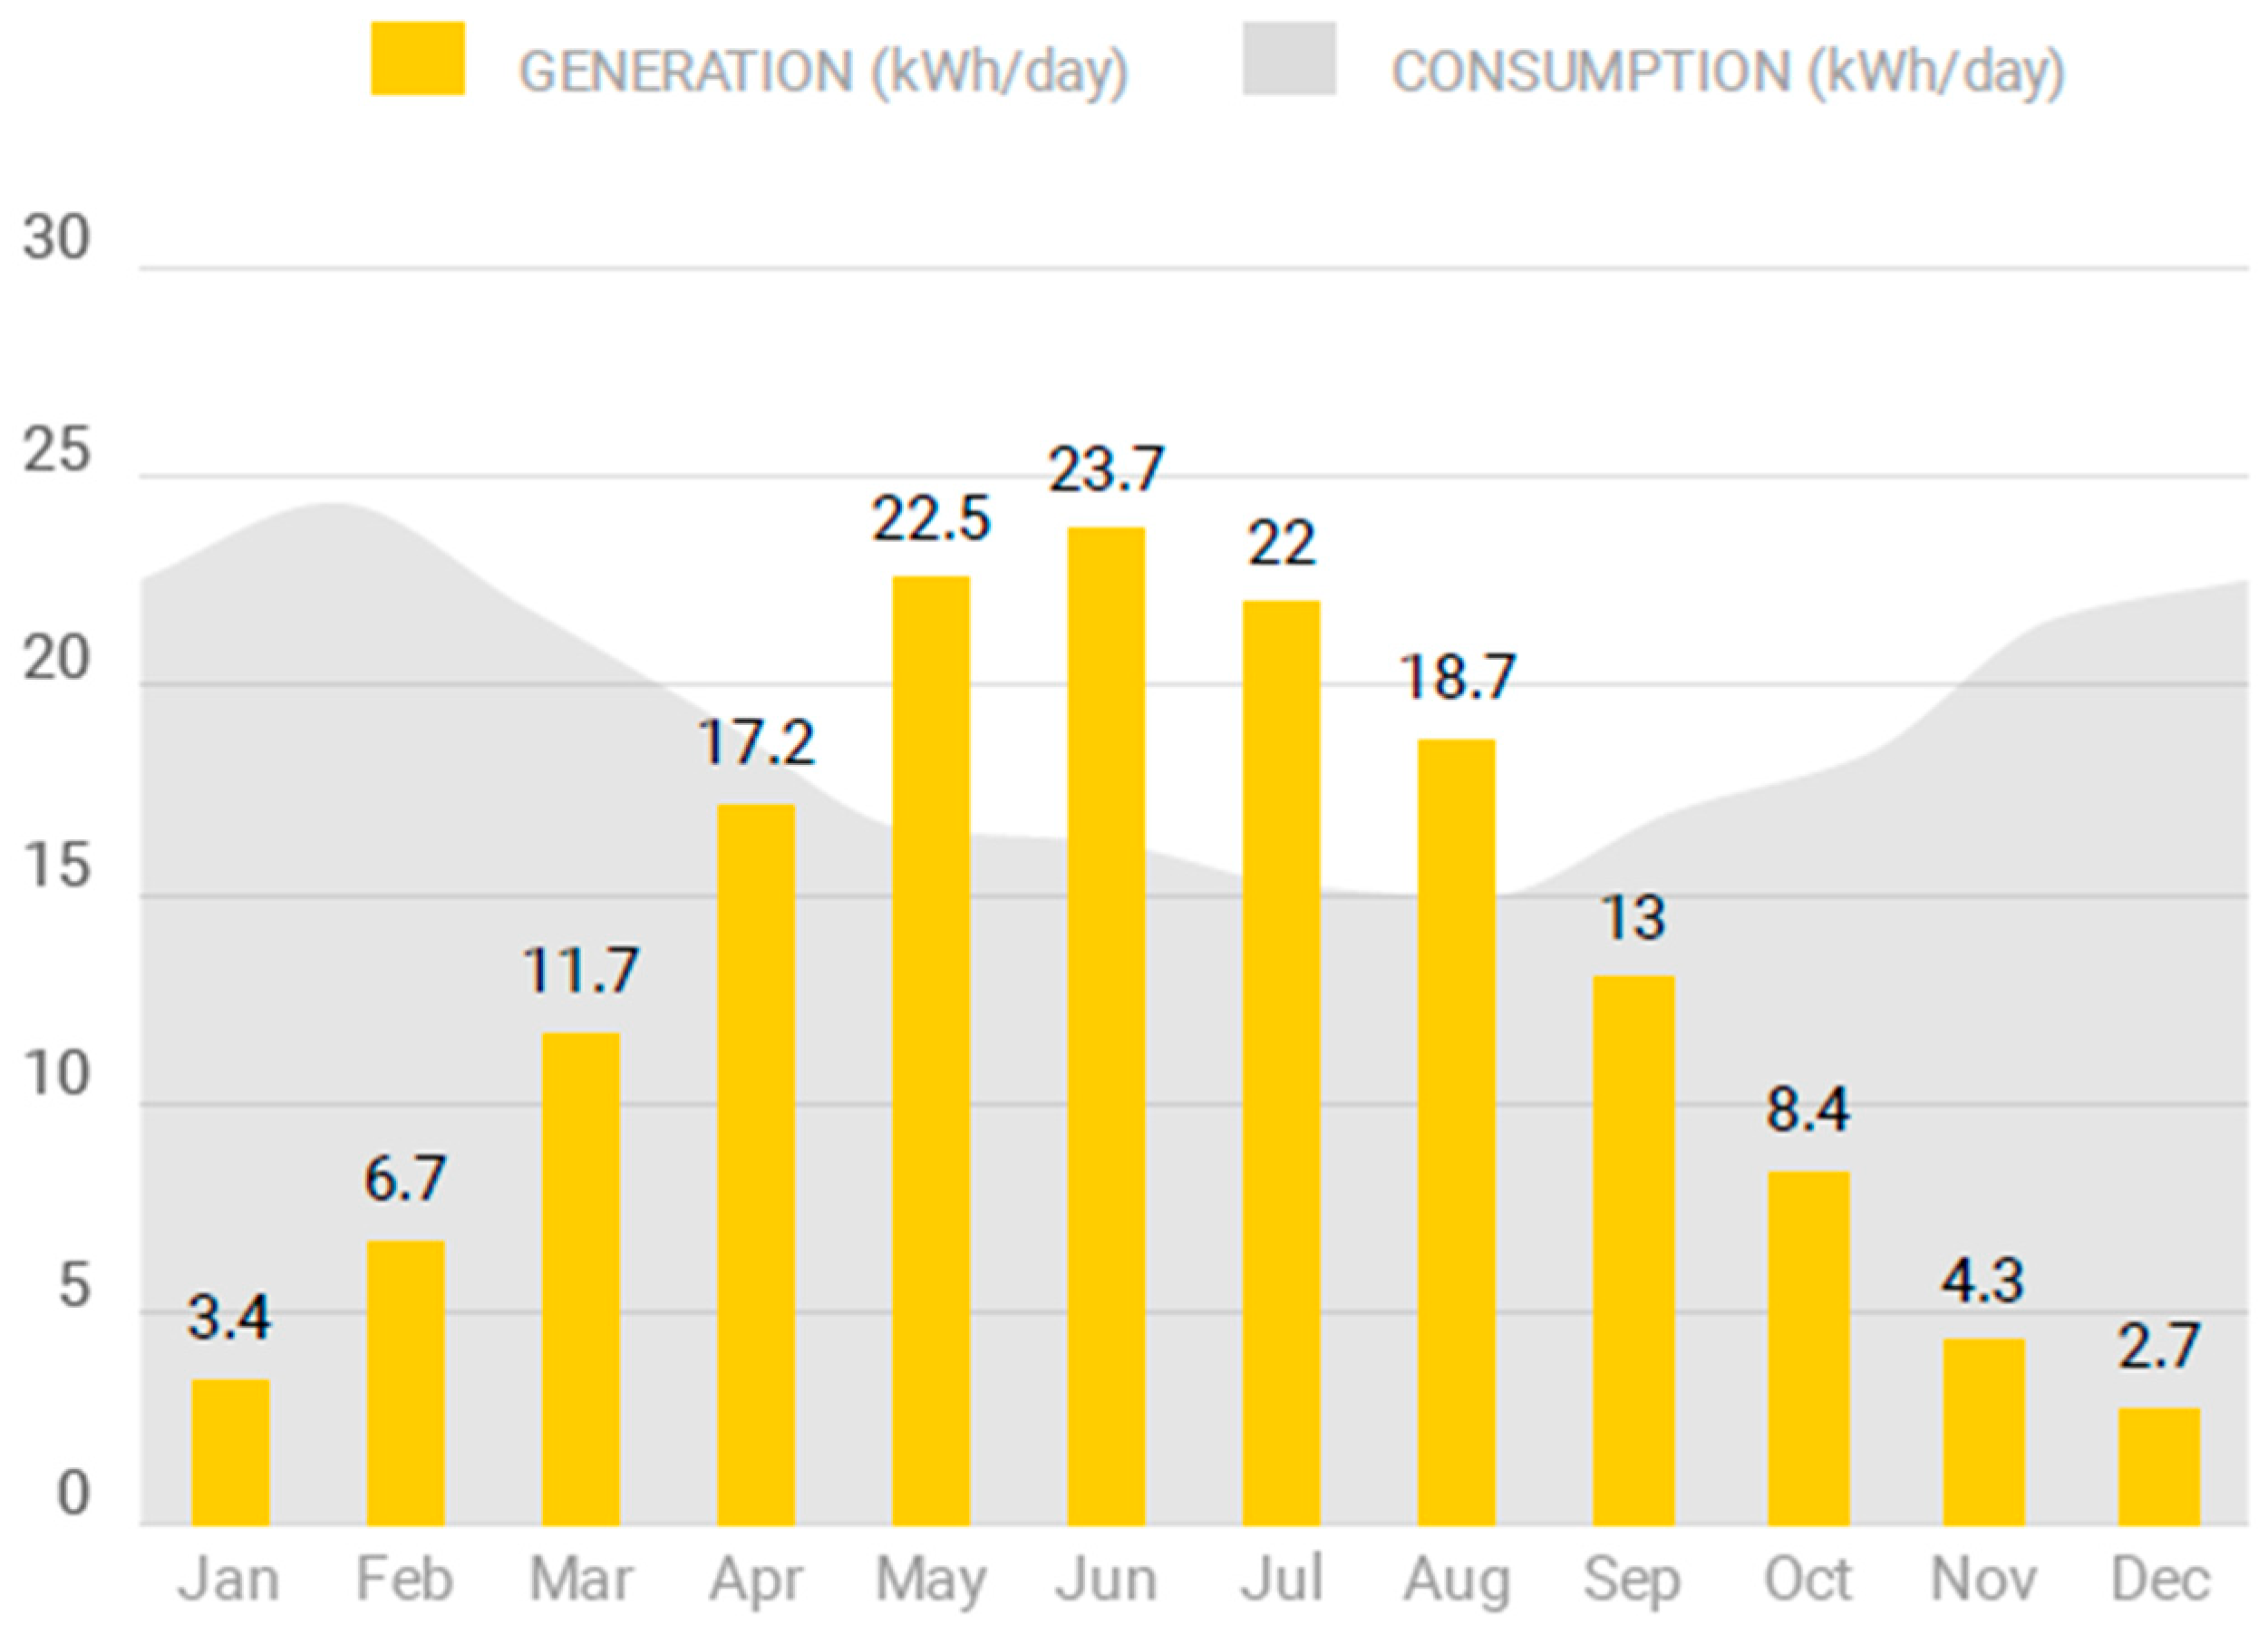
As illustrated in Figure 3, the selected location, identified by the Eircode, the national post code system in Ireland, D13 RFC1, corresponds to an address in Howth, a scenic peninsula in north County Dublin, Ireland. Data from OpenSolar provides the average monthly solar energy generation, as shown in Figure 4.
The analysis focuses on a solar energy system comprising 16 high-efficiency 435-watt panels. The peak energy production is observed in June, during the summer months, with an average output of 23.7 kWh per day.
It was found that 67% of the energy is produced by the proposed solar system. This ratio is calculated using Equation (1), which represents the energy from solar (%) [50]:
E n e r g y S   %   =   E n e r g y A P E n e r g y A U     × 100
where EnergyAP and EnergyAU represent the annual energy production and annual energy usage, respectively, both measured in [kWh].
Ireland supports the clean export guarantee system (CEG), which allows the customer to get paid by the electricity supplier for renewable electricity surplus, such as the solar PVs that it exports to the network.
Also, the electricity bills in Ireland are typically issued by the supplier every two months, calculated using Equation (2). Table 2 presents the electricity consumption prior to the installation of the solar system.
E 2 n d M C = ( D 1 s t M × E 1 s t M C ) + ( D 2 n d M × E 2 n d M C )
where E2ndMC is Electricity consumption every second month, D1stM and D2ndM show days of the first month and the second month, respectively. E1stMC and E2ndMC are electricity consumption for the first month and the second month, respectively.

3.2. Study Design

OpenSolar is a professional, web-based solar design platform that provides advanced tools for accurate site assessment, PV energy production simulation, and detailed financial analysis [20]. In this case study, it was employed to evaluate the feasibility and optimize the configuration of the proposed solar installation. The design process involved several systematic steps:
  • Site Setup: The user’s address (Eircode D13 RFC1) was entered into OpenSolar, which automatically retrieved high-resolution satellite imagery and 3D roof structure data.
  • Roof Mapping: The roof’s geometry was traced and segmented into individual planes. Orientation, tilt angles (40°), azimuth directions (115° and 294°), and shading analysis were computed automatically using built-in solar irradiation models.
  • Component Selection: The platform’s component database was used to select the Jinko Tiger 435 W panels, SoFar 4 kW hybrid inverter, WeCo 5.3 kWh battery, and myenergi Zappi EV charger. These selections were based on real product Stock Keeping Units (SKUs) available to the installer.
  • Performance Simulation: OpenSolar calculated monthly and annual energy production using Typical Meteorological Year (TMY) data for the Howth region. It estimates system losses, panel degradation, and inverter clipping effects.
  • Load Matching and Self-Consumption: The client’s historical energy usage (as seen in Table 2) was imported to compare production versus load. The software evaluated expected self-consumption ratios and export potential.
  • Economic Modeling: Using local electricity tariffs, SEAI grants, and the Clean Export Guarantee (CEG) rate, the platform generated a 20-year cashflow, estimated payback period, annual bill savings, and cumulative environmental benefits.
  • Proposal Generation: A PDF report with technical specifications, simulation charts, carbon offset projections, and visual renderings of the PV layout was generated and reviewed with the client prior to installation.
These steps ensured that the final design was both technically robust and economically viable before proceeding to the installation phase. The system designed in this study includes solar panels, a hybrid inverter, a battery energy storage unit, and an EV charger. Detailed technical specifications for each component are presented in the subsequent sections. This research paper presents a comprehensive evaluation of the installed solar system, examining its performance, operational efficiency, and economic returns, thereby providing an integrated assessment of both technical and financial aspects.
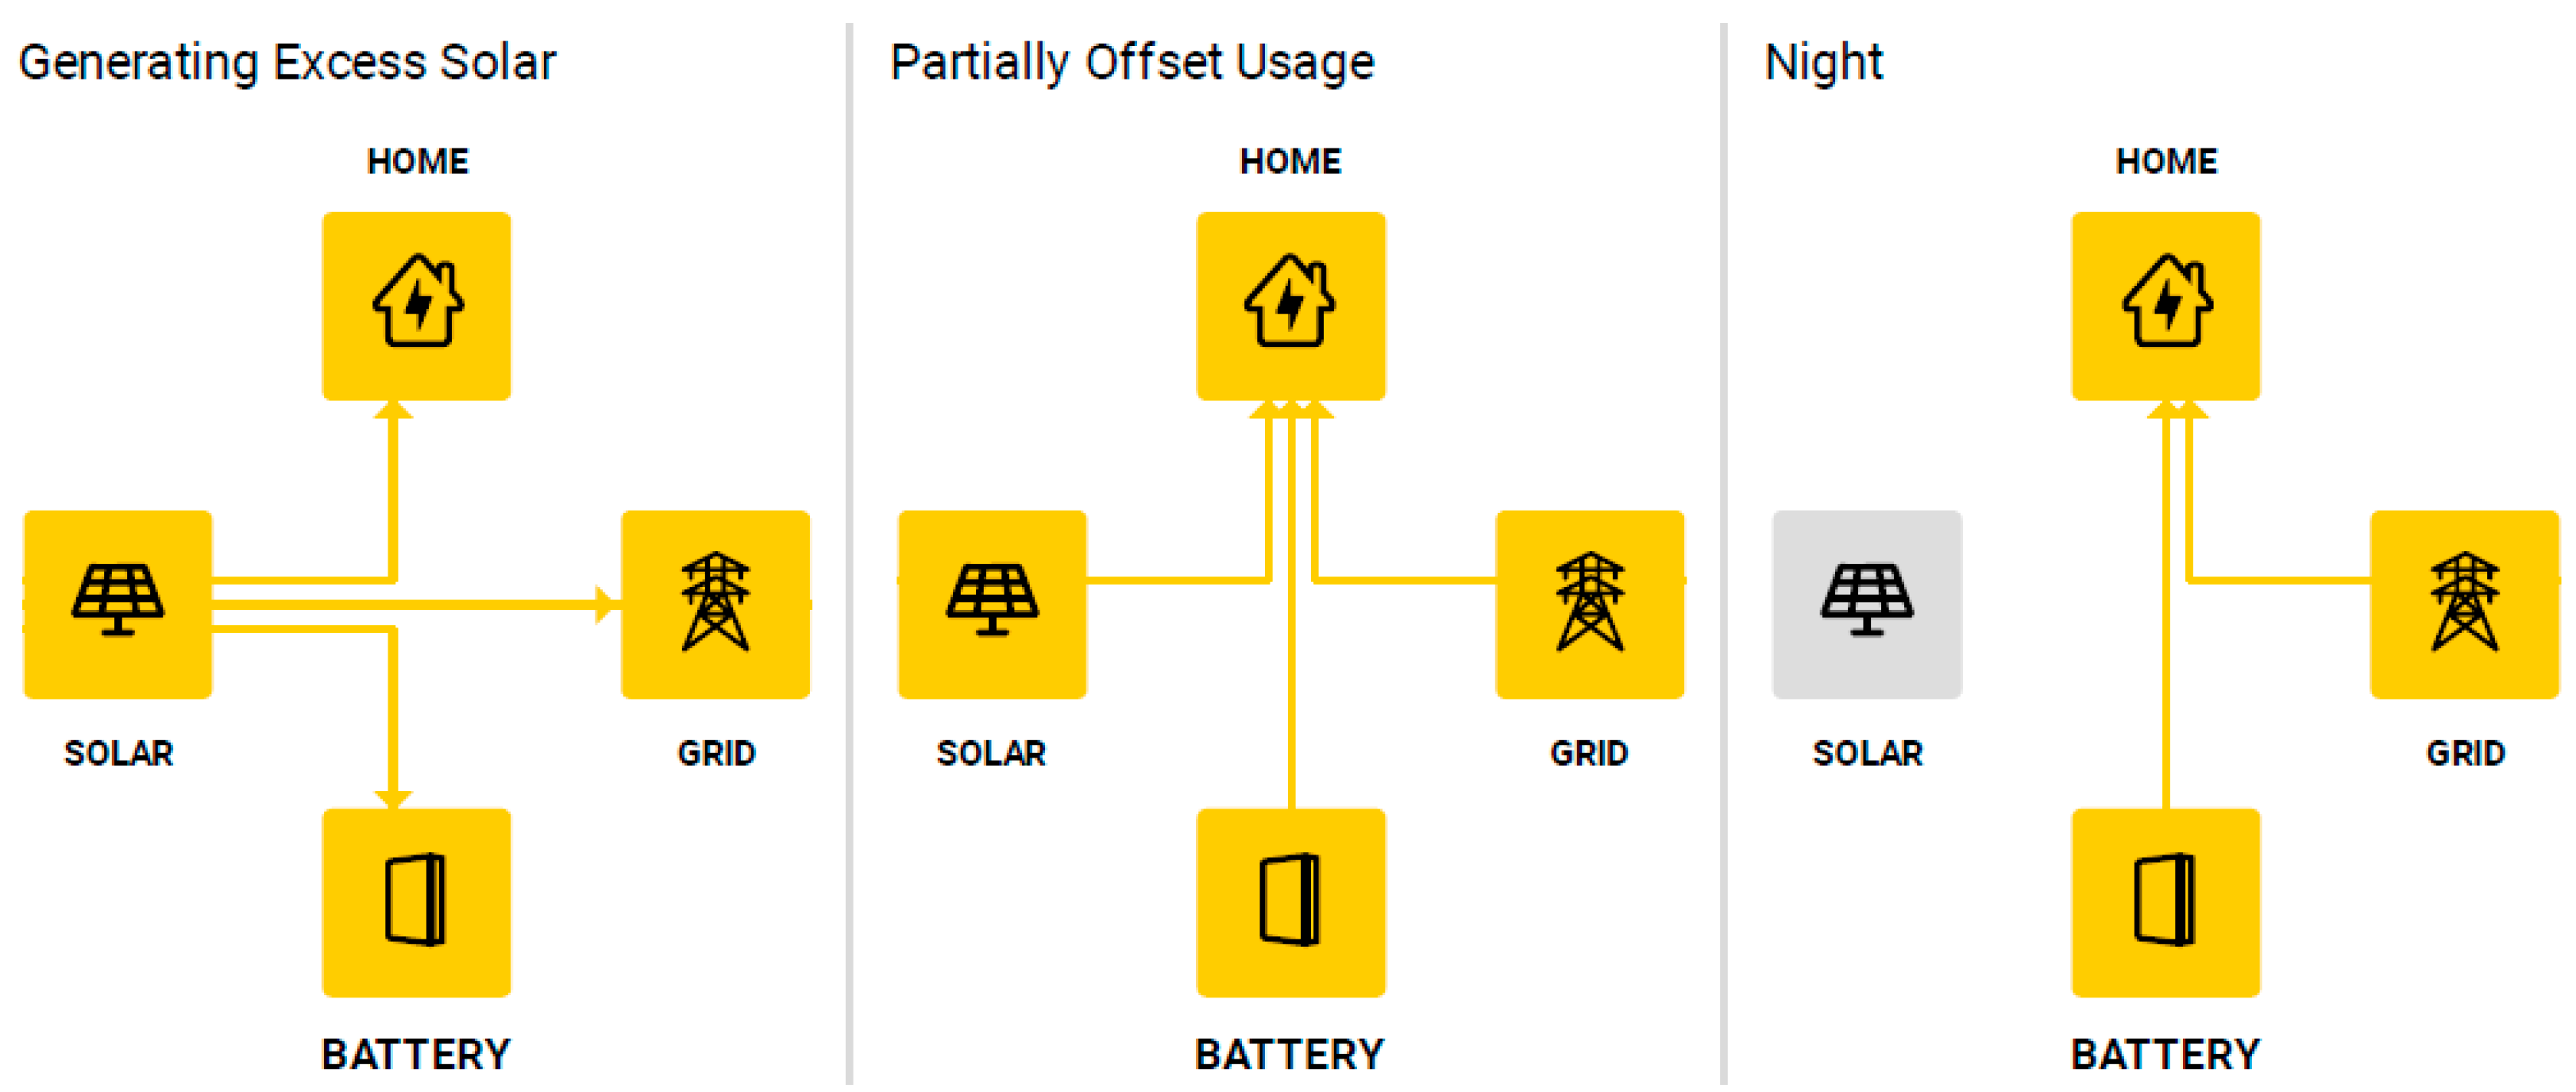
The system, as illustrated in Figure 5, offers three intelligent operating modes designed to optimize energy use based on solar generation and battery storage. In the Generating Excess Solar mode, solar power production exceeds household demand, allowing surplus energy to charge the battery and potentially feed back into the grid. Partially Offset Usage mode comes into play when solar generation alone cannot meet household consumption; in this case, solar energy powers the home, supplemented by battery storage and grid supply as needed. Finally, during Night mode, when solar generation is unavailable, the system seamlessly shifts to utilizing stored battery power alongside grid electricity to sustain household energy needs. These modes work together to maximize efficiency, reduce grid dependency, and promote sustainable energy use.

3.2.1. Solar Panel Specifications

The solar panel chosen for this project is the Jinko Solar Tiger 435 N-Type (model JKM435N-54HL4R-B), sourced from Shanghai, China, Jinko Solar’s headquarters. This panel comprises 108 monocrystalline cells and offers a nominal maximum power output of 435 W. A comprehensive overview of the specifications for this photovoltaic model is provided in Table 3.
The installation comprises 16 solar panels, strategically positioned across both sides of the roof, with 8 panels on each side. The layout was designed using the OpenSolar platform, utilizing an aerial view from Google Maps, as illustrated in Figure 6a. A real-time view of the panels on both roof sections is provided in Figure 6b,c.

3.2.2. Details of the Hybrid Inverter

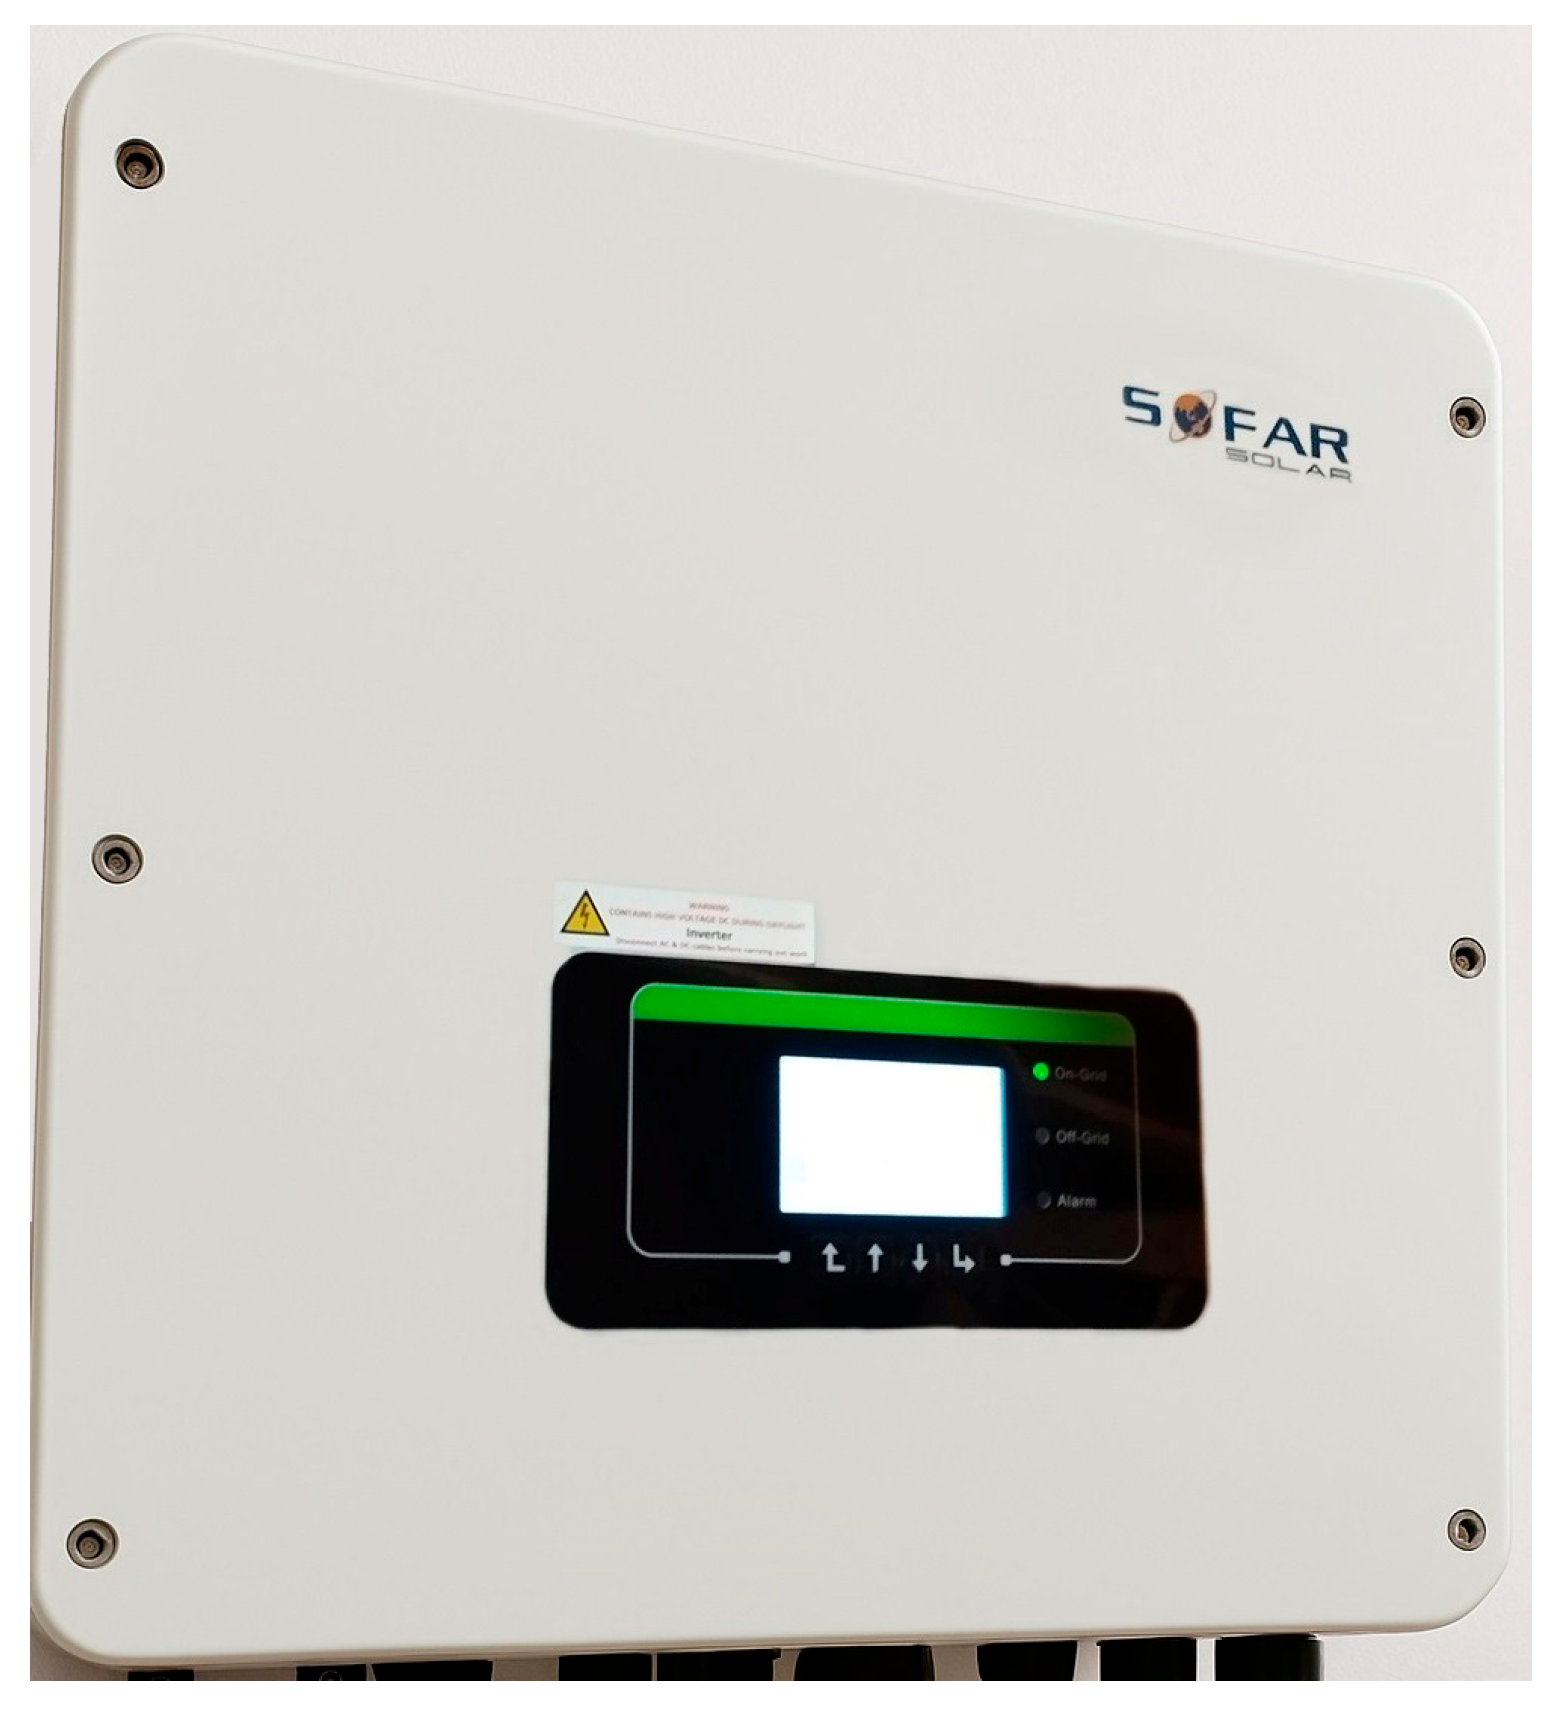
The chosen hybrid inverter is the SoFar Solar HYD 4000-EP, a single-phase model with a rated output of 4 kW, sourced from Shenzhen, China, the headquarters of Sofar Solar. Detailed specifications for this inverter are provided in Table 4. The inverter is installed on the wall in the attic, as shown in Figure 7.

3.2.3. Battery Selection

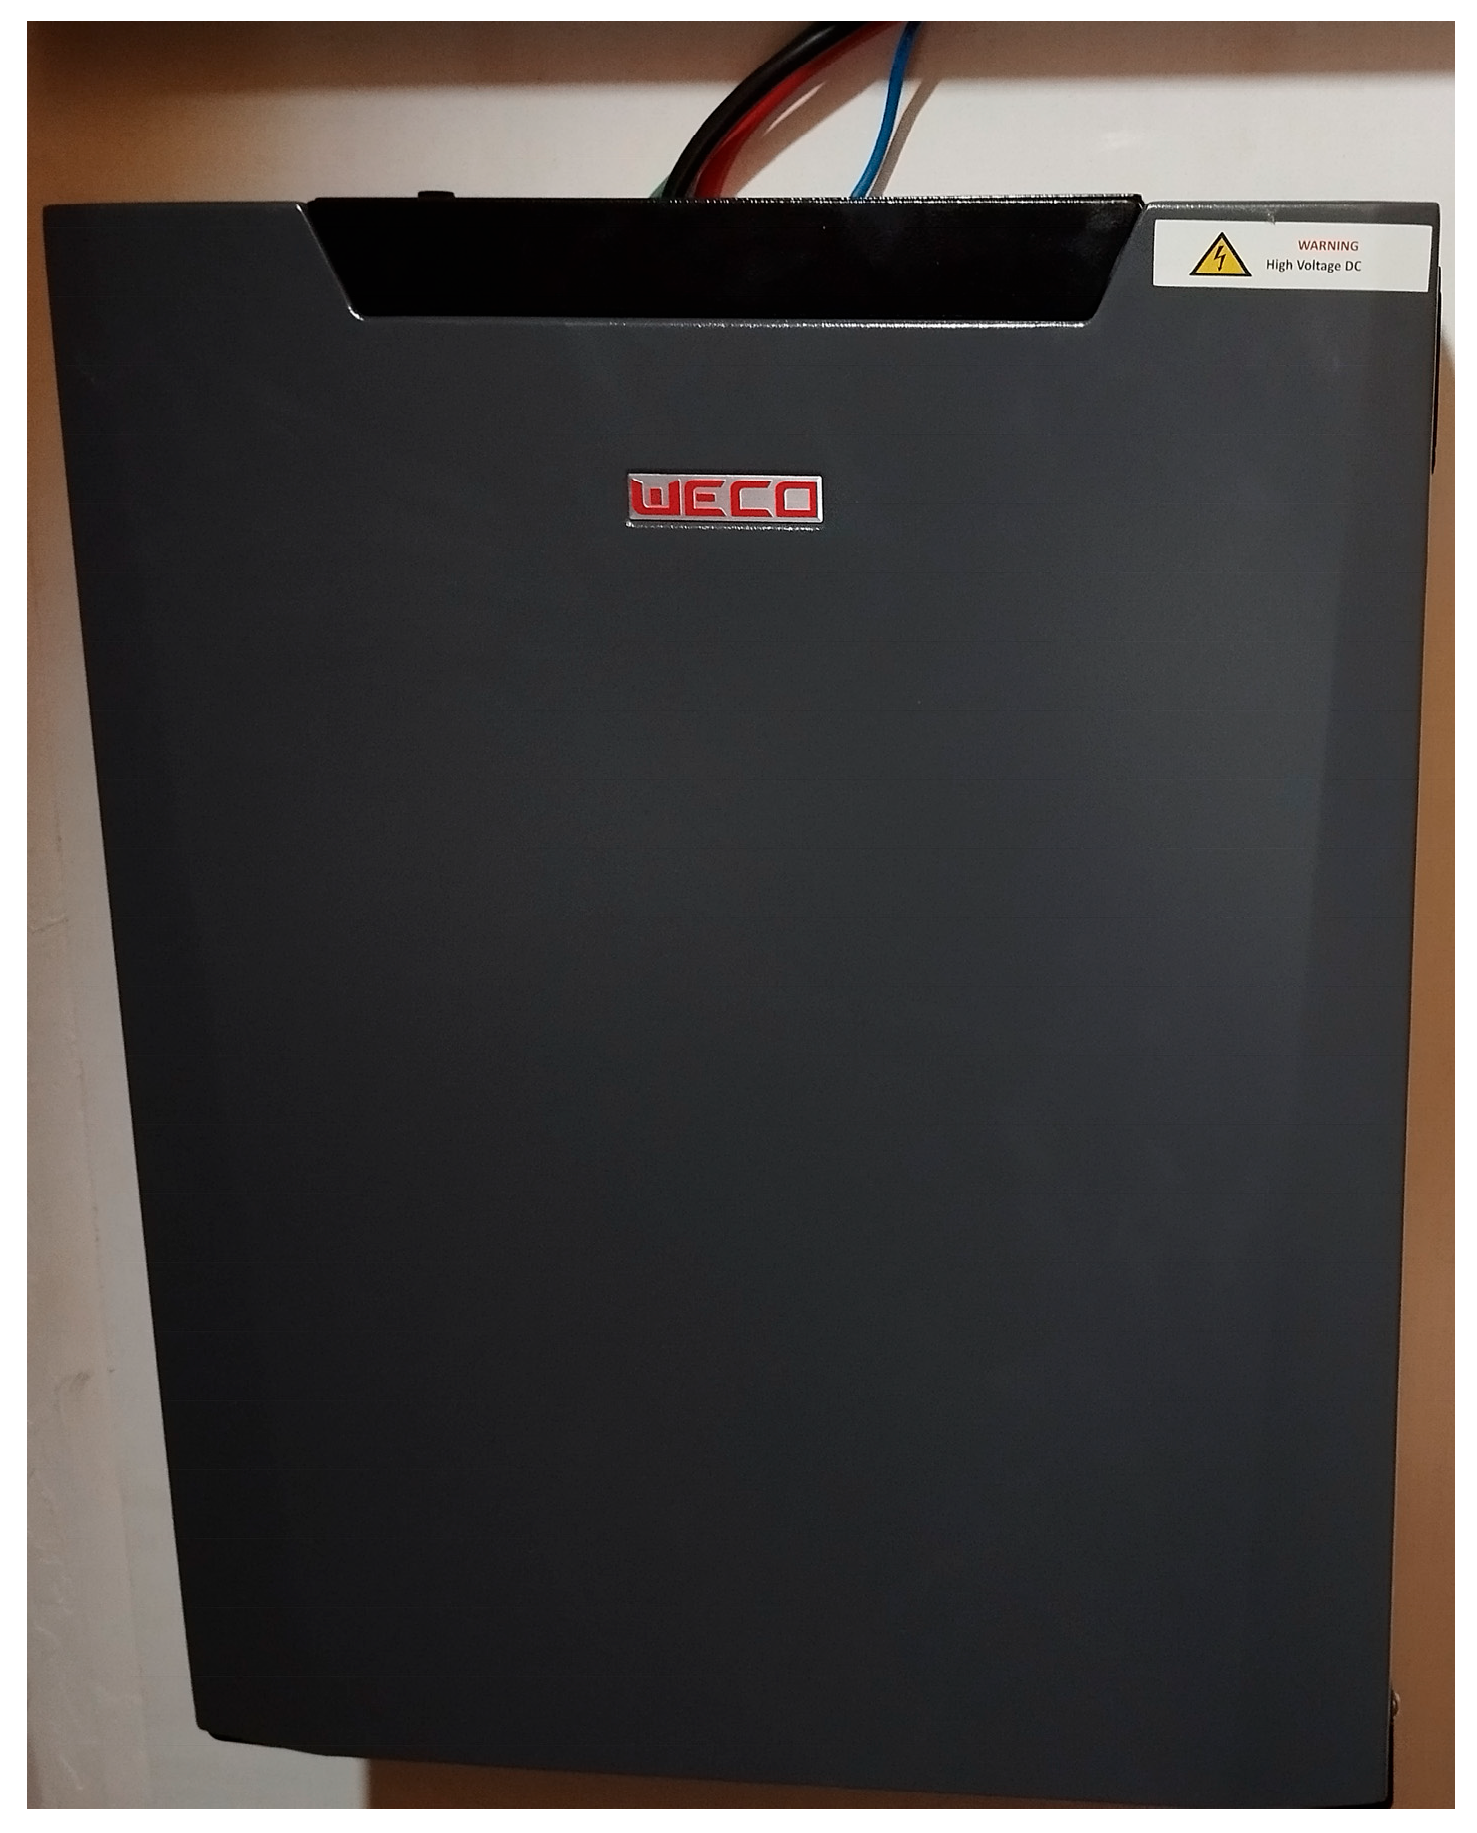
The battery selected for this study is the WeCo 5K3-XP model, a lithium-based unit manufactured by WeCo Srl Italia in Scarperia e San Piero, Florence, Italy, with an expected lifespan of 10 years. It is installed alongside the inverter on a wall-mounted support in the attic, as depicted in Figure 8. The key specifications of the battery are detailed in Table 5.

3.2.4. MG4 Electric Vehicle

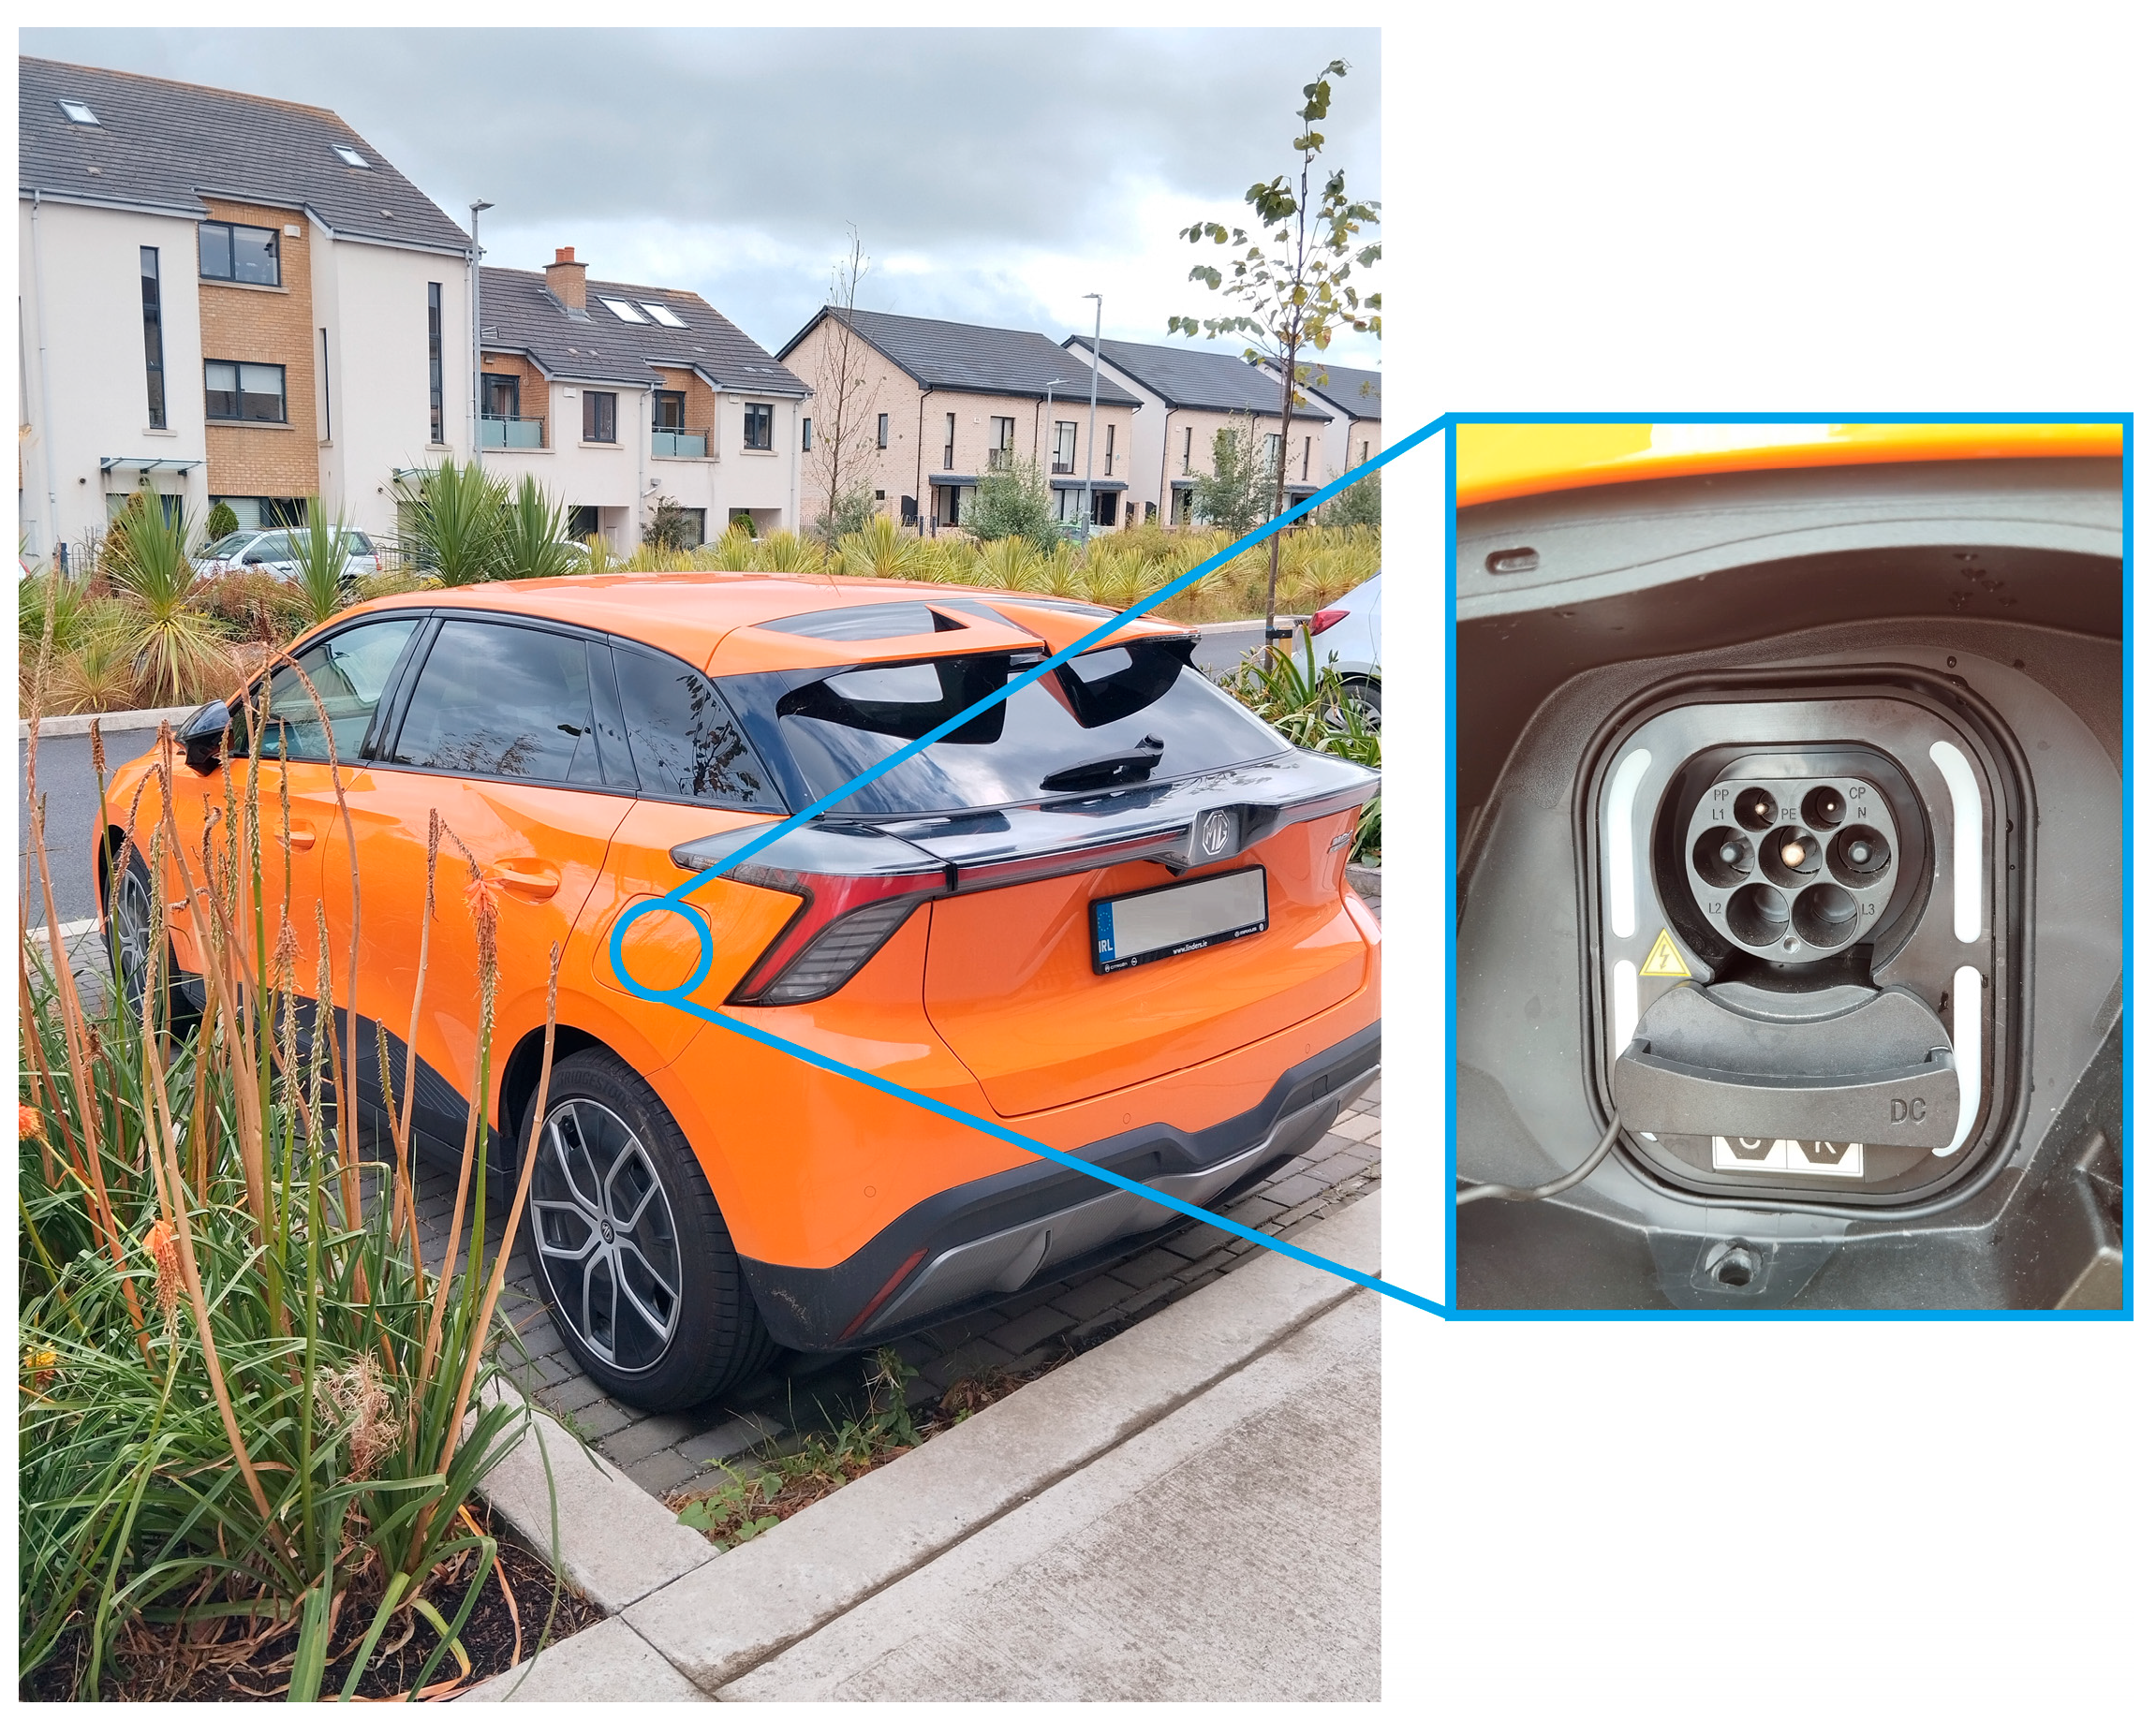
The MG4 Electric is equipped with a 400 V lithium-ion battery composed of 104 cells, offering a nominal capacity of 64.0 kWh. As shown in Figure 9, it features a Type 2 charging port with a standard AC charging power of 6.6 kW and supports fast DC charging at up to 142 kW. Under normal charging conditions, the vehicle requires approximately 11 h to fully charge, while fast charging reduces this time to just 24 min. Additionally, the MG4 Electric is capable of bidirectional charging via its Vehicle-to-Load (V2L) system, providing a maximum output power of 2.2 kW AC [54].

3.2.5. Electric Vehicle Charger (Zappi) Specifications

Zappi is a state-of-the-art electric vehicle (EV) charger developed by myenergi, a UK-based company known for its innovative eco-smart energy products. The Zappi V2 7 kW Tethered EV Charger has been incorporated into the system, offering a smart charging solution that optimizes the use of renewable energy. It enables users to prioritize surplus energy from solar panels or wind turbines for vehicle charging, while seamlessly switching to grid power when needed.
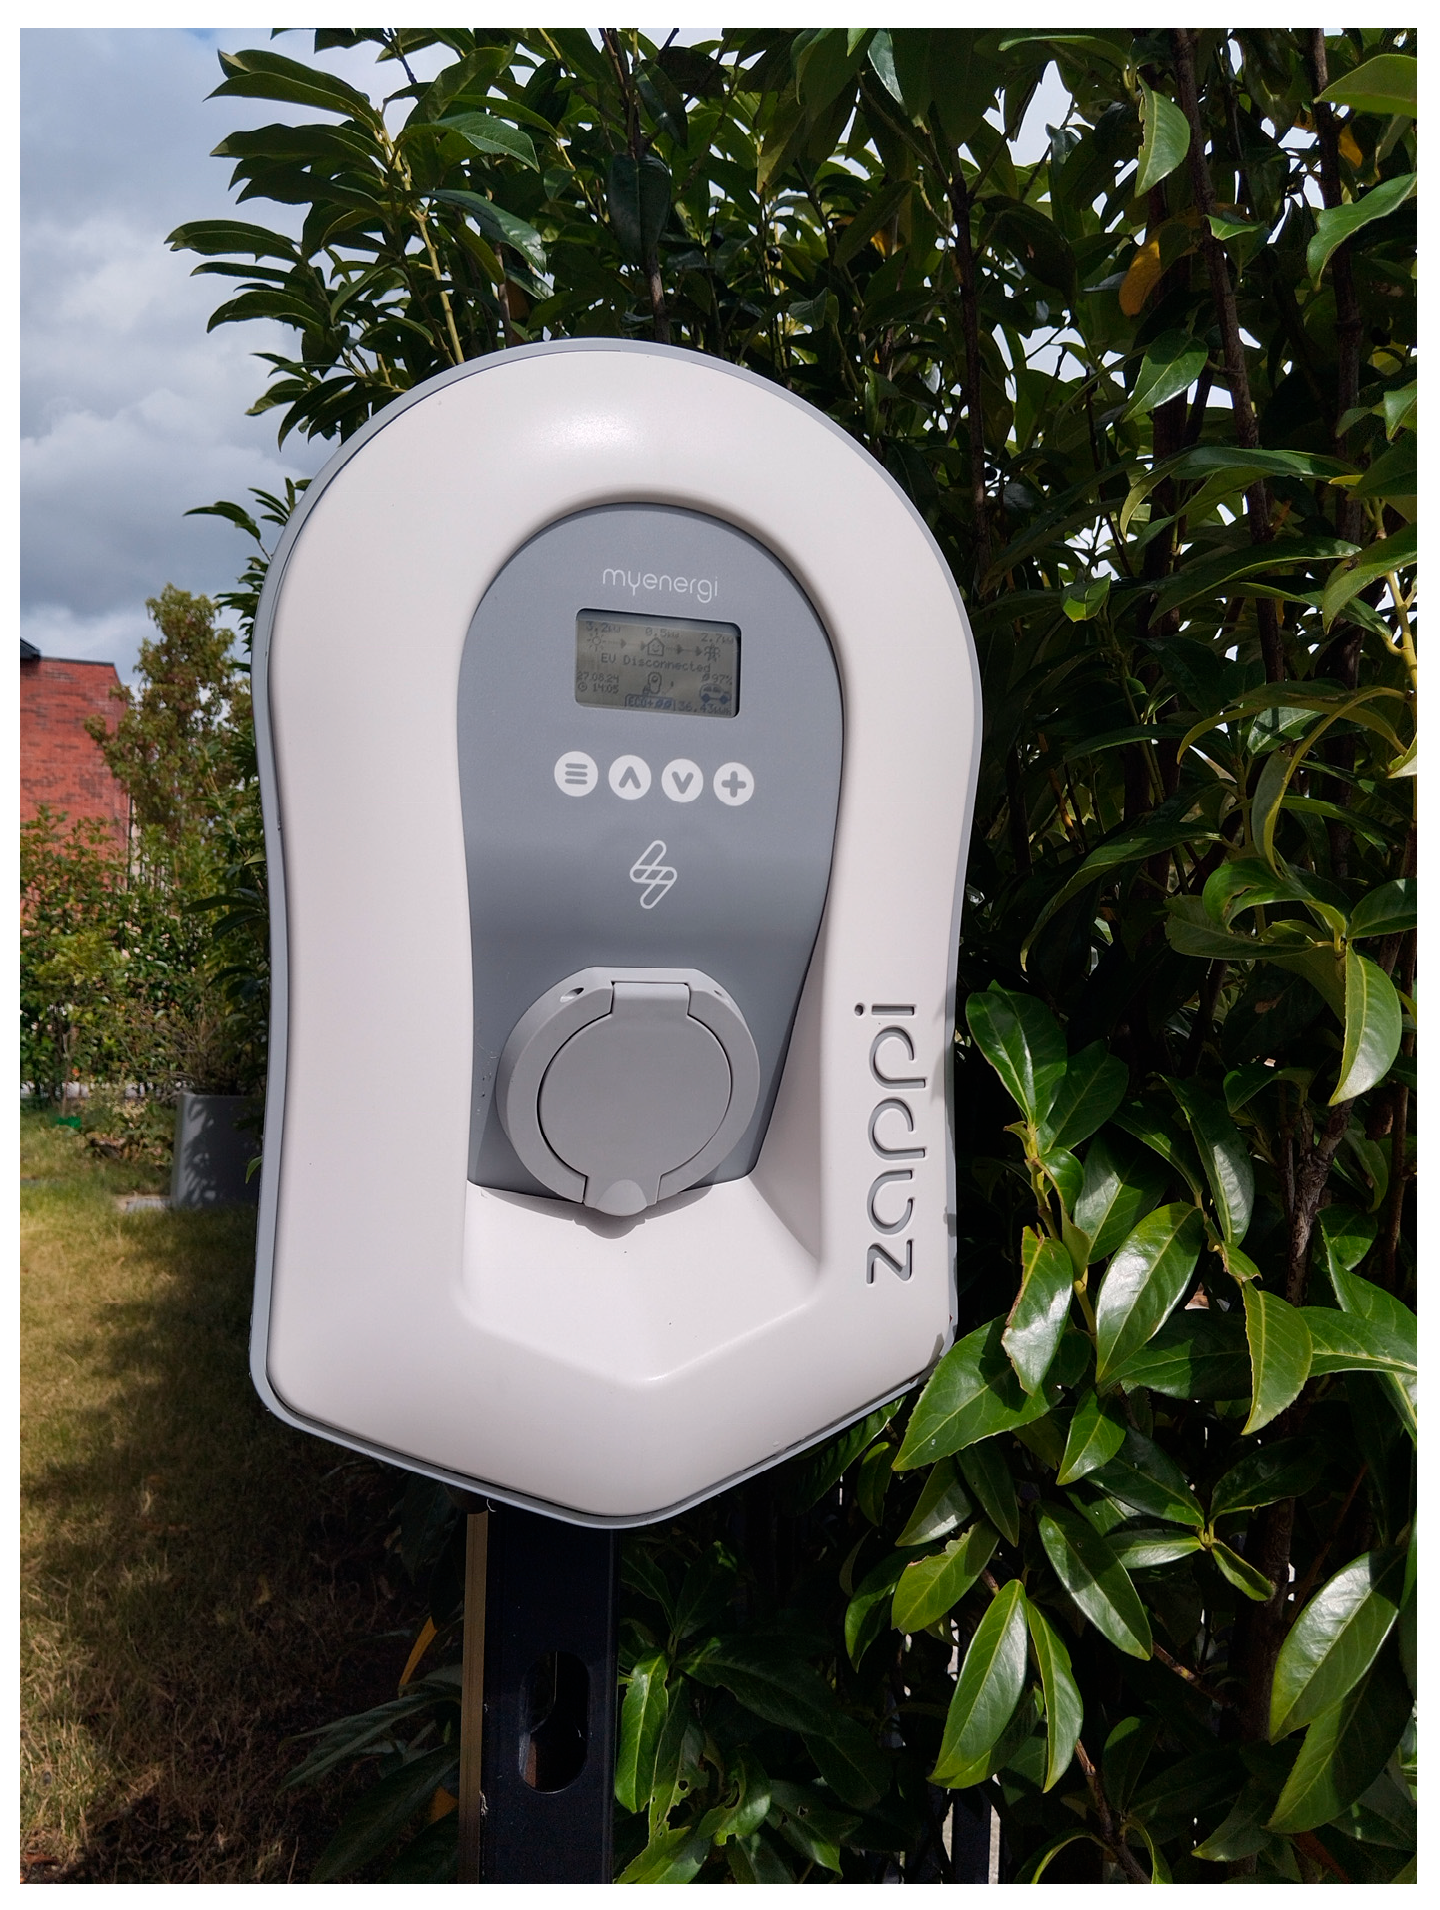
Designed for efficiency and sustainability, Zappi features advanced charging modes that adapt to available power, ensuring a balanced load and preventing system overload. FAST mode maximizes charging speed, utilizing grid power as required, while ECO mode continuously adjusts the charge rate based on available surplus renewable energy, minimizing grid use. For even greater control, ECO+ mode pauses charging if surplus renewable energy falls below a set threshold, reducing grid reliance further. STOP mode provides users with the ability to halt charging as needed, offering flexibility [55]. The charger also supports remote monitoring and management via the myenergi app, providing users with full control over their energy consumption and charging schedules. The specifications of the installed Zappi charger are outlined in Table 6. As illustrated in Figure 10, Zappi is installed outside the house for charging the MG4 Battery Electric vehicle, as shown in Figure 9.

4. Results and Discussion

4.1. Energy Production

4.1.1. Predicted Energy

Table 7 provides an overview of the predicted solar energy performance metrics generated by OpenSolar as part of the proposal. The anticipated solar generation indicates the expected energy production from the solar installation every second month, highlighting its projected efficiency. The forecasted electricity imported reveals the expected reliance on grid power after solar energy usage, while the estimated electricity exported shows the surplus energy anticipated to be fed back into the grid.

4.1.2. Real-Time Energy

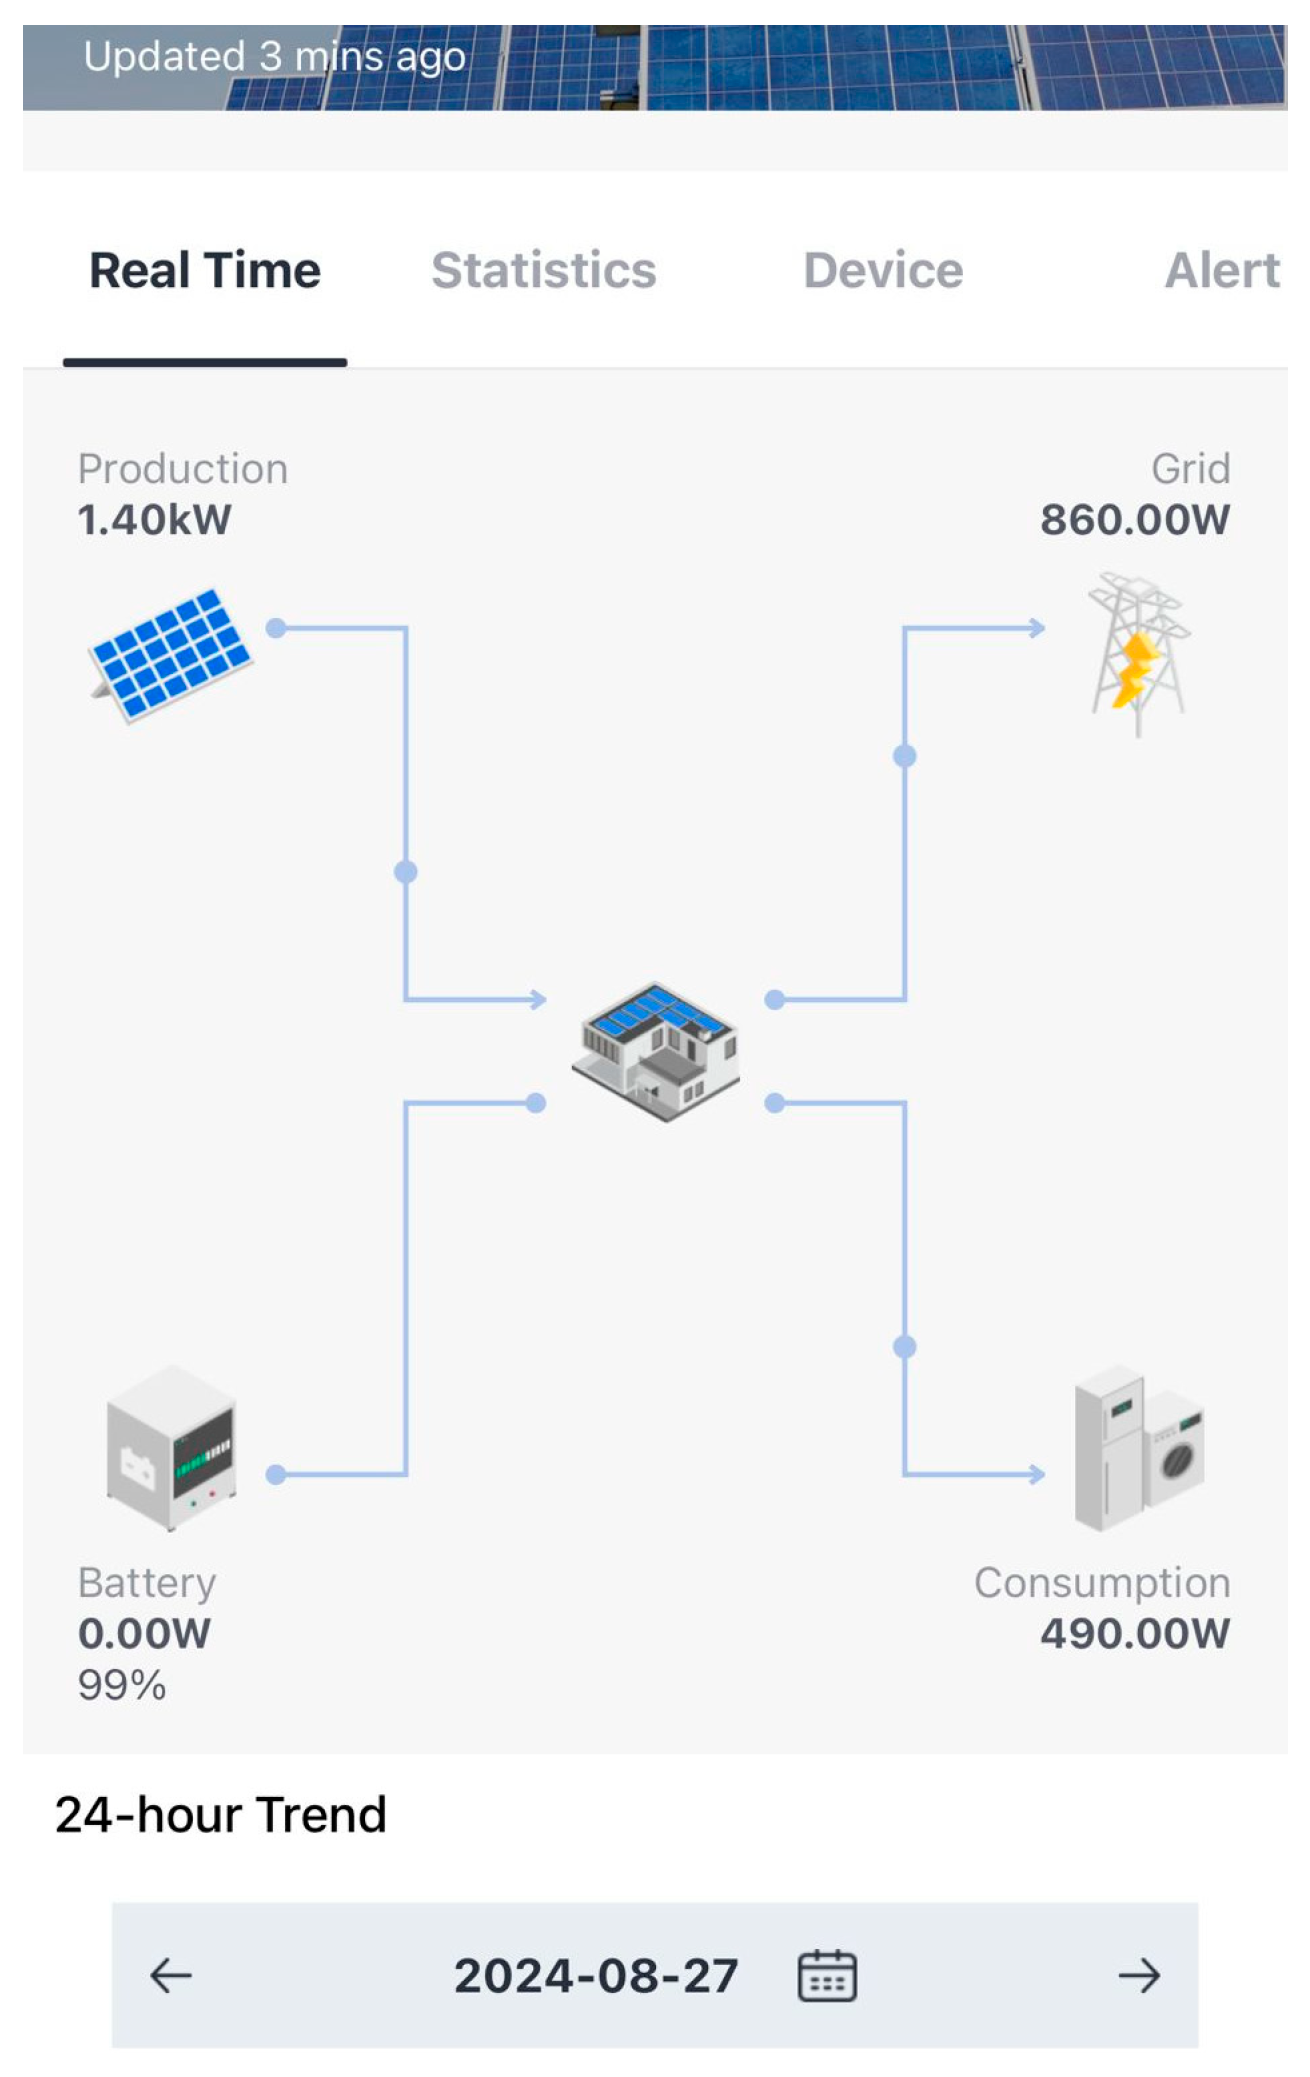
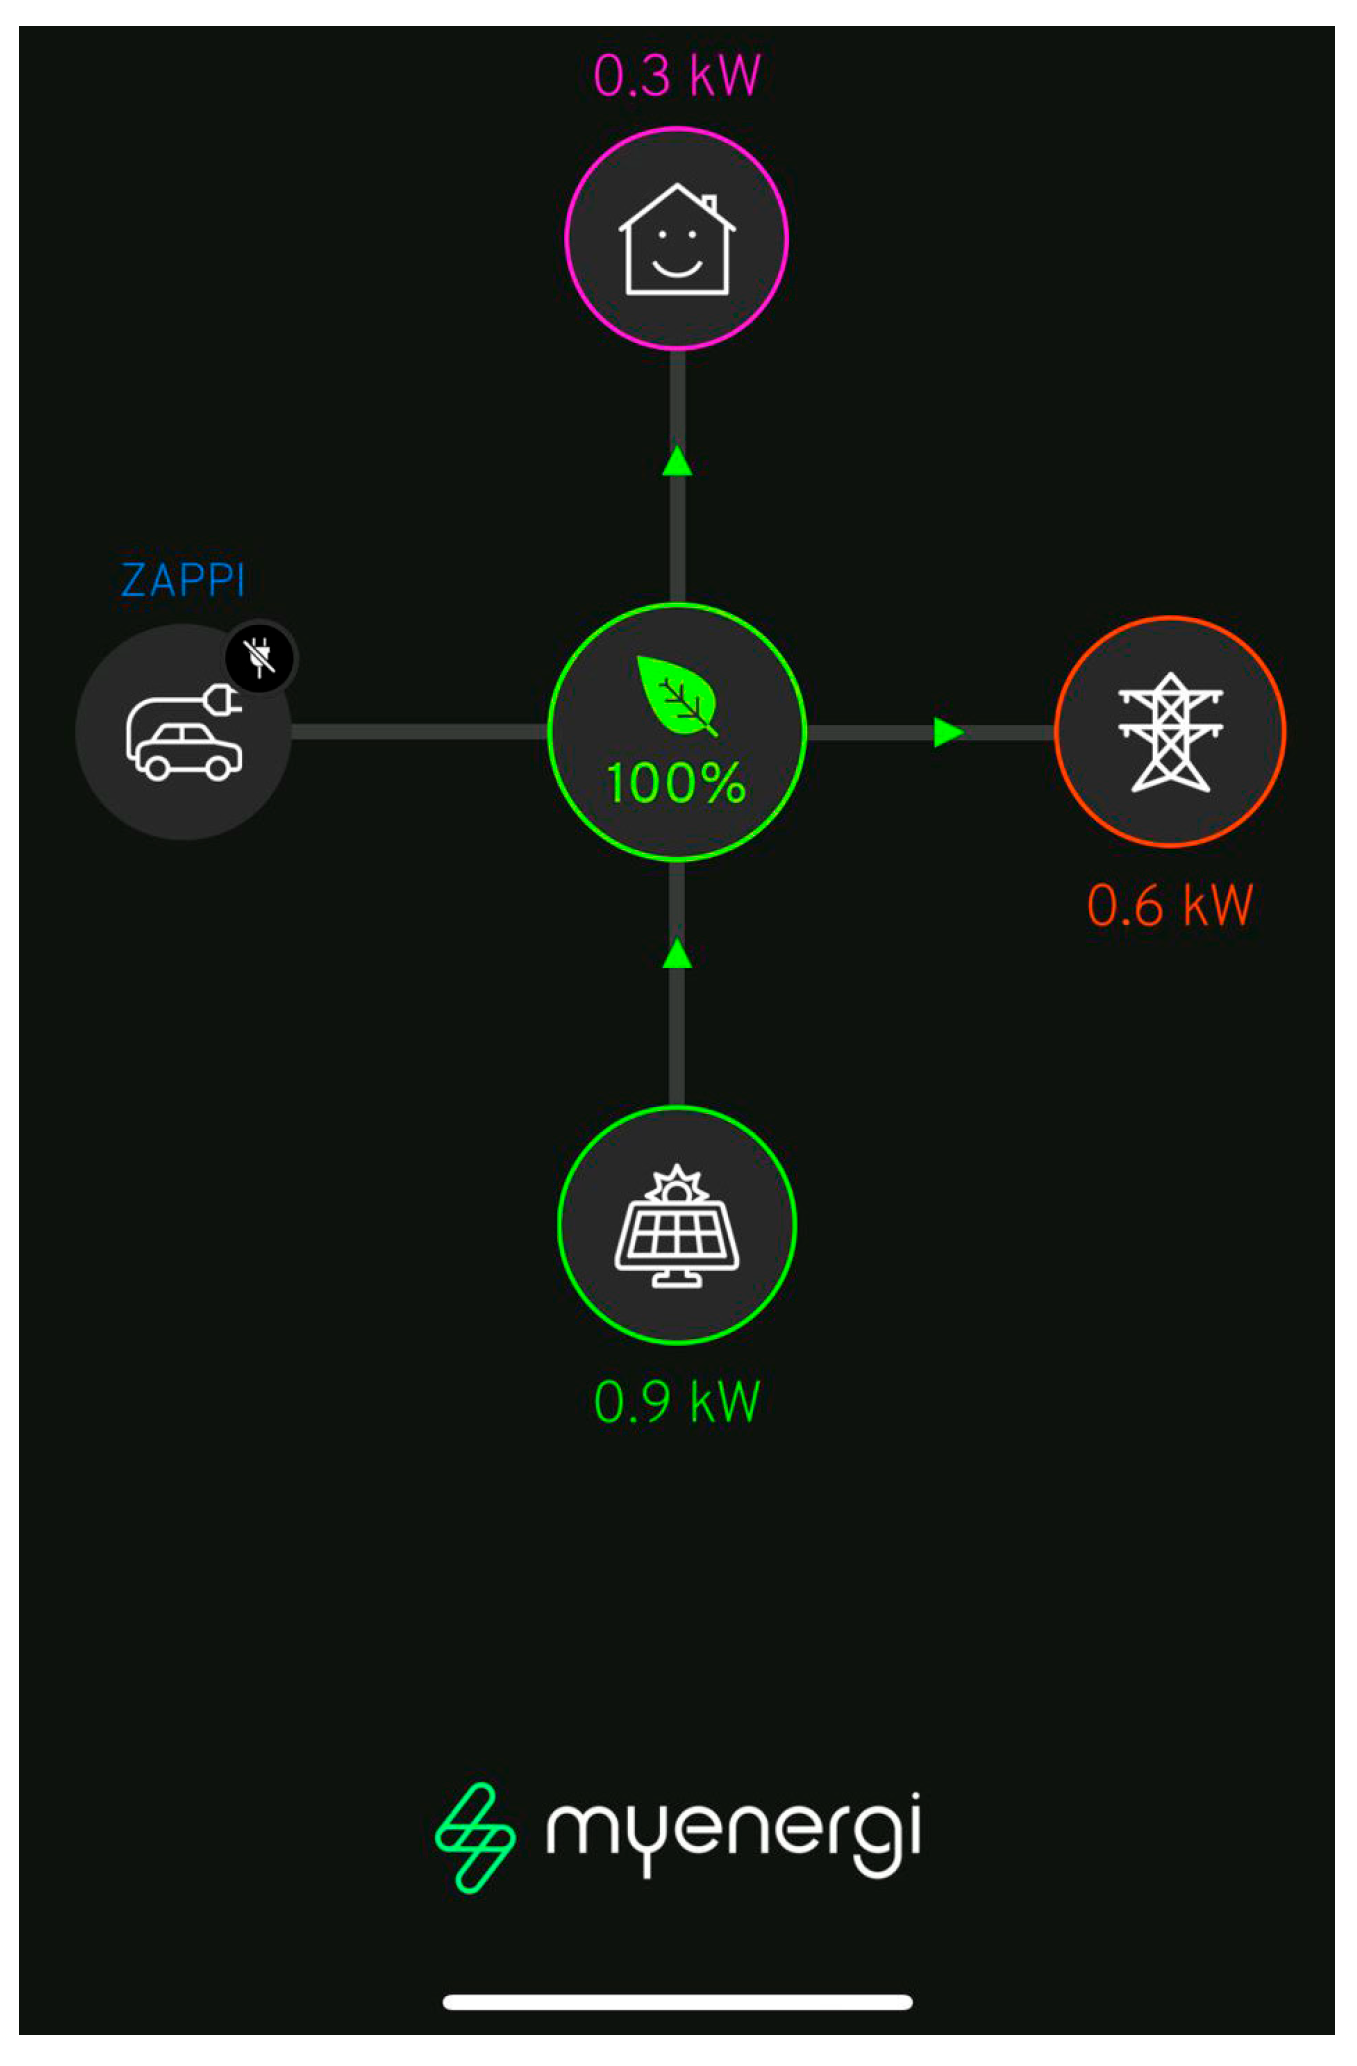
The actual values of electricity generated by the solar panels, as indicated by the myenergi app (connected to the Zappi system) and the battery charge monitoring app, show that energy production currently exceeds household consumption. With the battery fully charged, surplus power is either sold back to the grid or used for other purposes, while the electric vehicle remains disconnected as it is not charging. These values are live, recorded on Tuesday, 27 August 2024, with a slight time difference between the two readings.
Figure 11 shows the actual real-time data for 28 August 2024, with solar power production of 1.40 kW, power consumption of 490.00 W by household appliances, no power going to the battery as it is almost 99% charged, and 860.00 W power being sold back to the grid. In contrast, as production and consumption change instantaneously, Figure 12 displays updated metrics, including 0.9 kW solar power production, 0.3 kW consumption, the case of Zappi being disconnected as the electric vehicle was not charging at the time the values were taken, and the energy being exported to the grid at 0.6 kilowatts, and confirming that electricity is completely green with a 100% green leaf.

4.1.3. Actual Energy for July 2024

In July 2024, the property demonstrated efficient energy use through a balanced mix of solar generation and grid imports. The details will be provided as follows.
Consumption
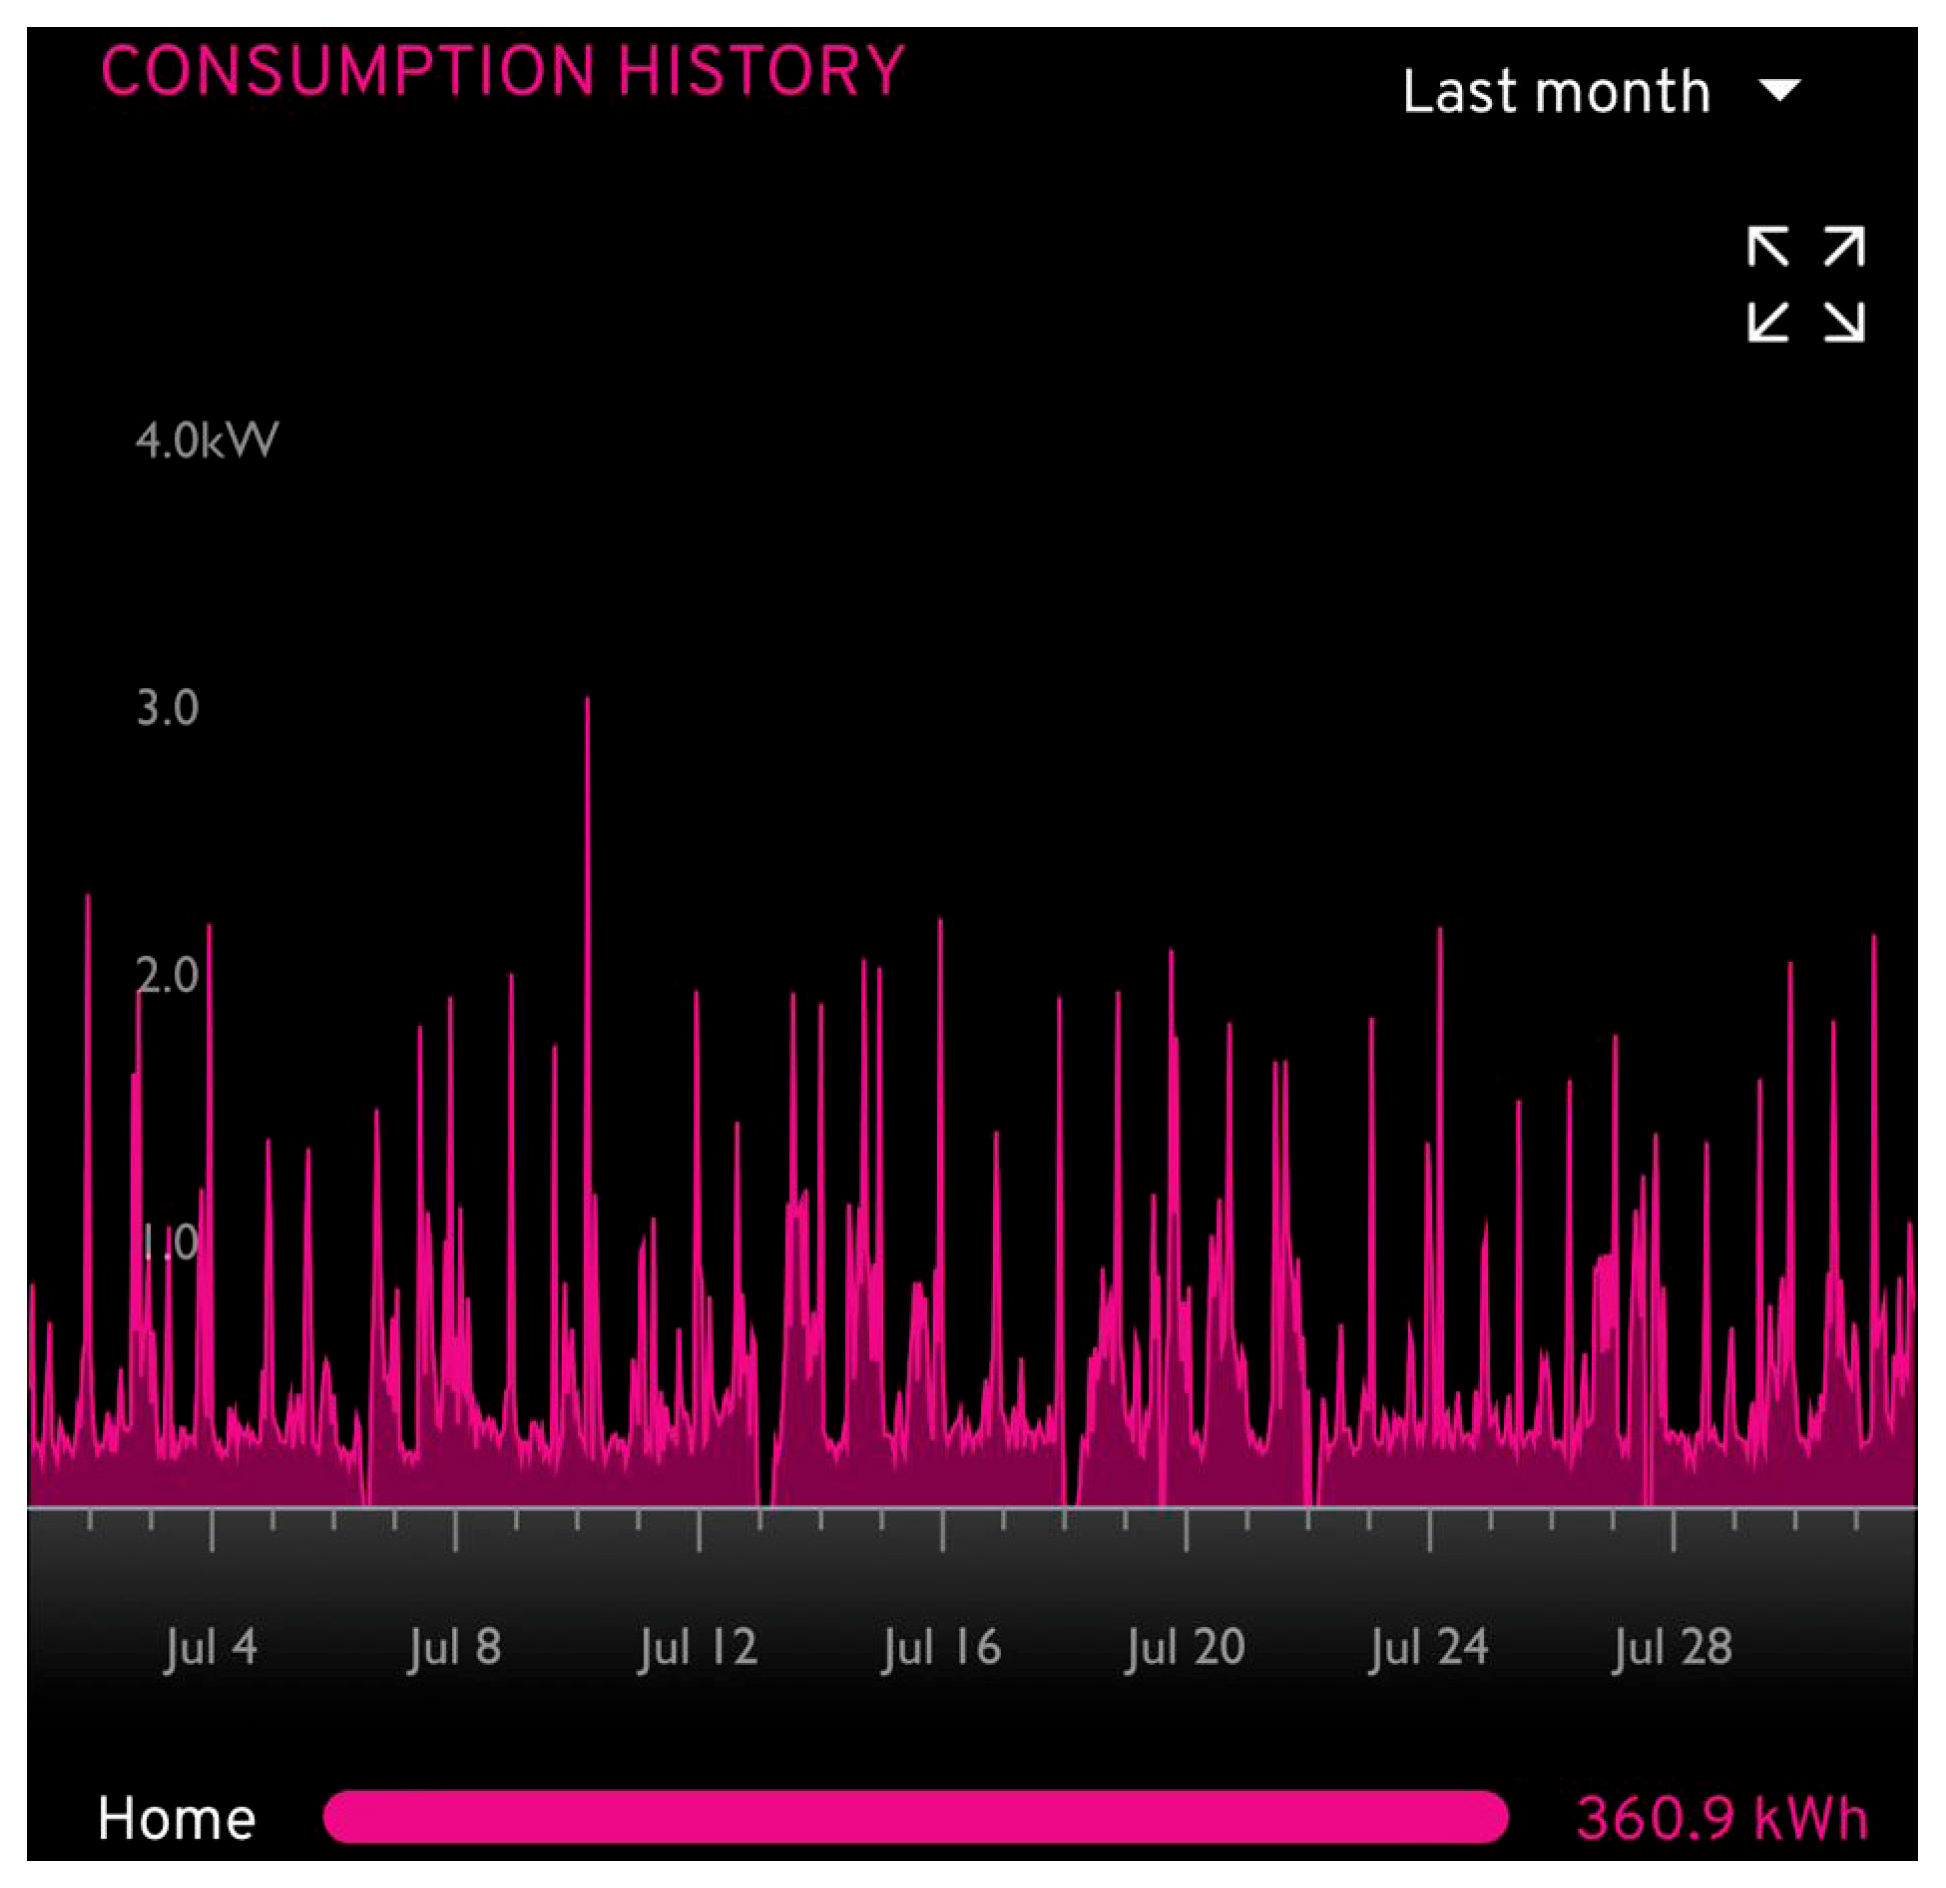
The property’s total energy consumption reached 360.9 kWh, covering all electricity used within the property, including that measured by myenergi devices, which are manufactured by myenergi GB Ltd in Stallingborough, United Kingdom, as shown in Figure 13.
Generation
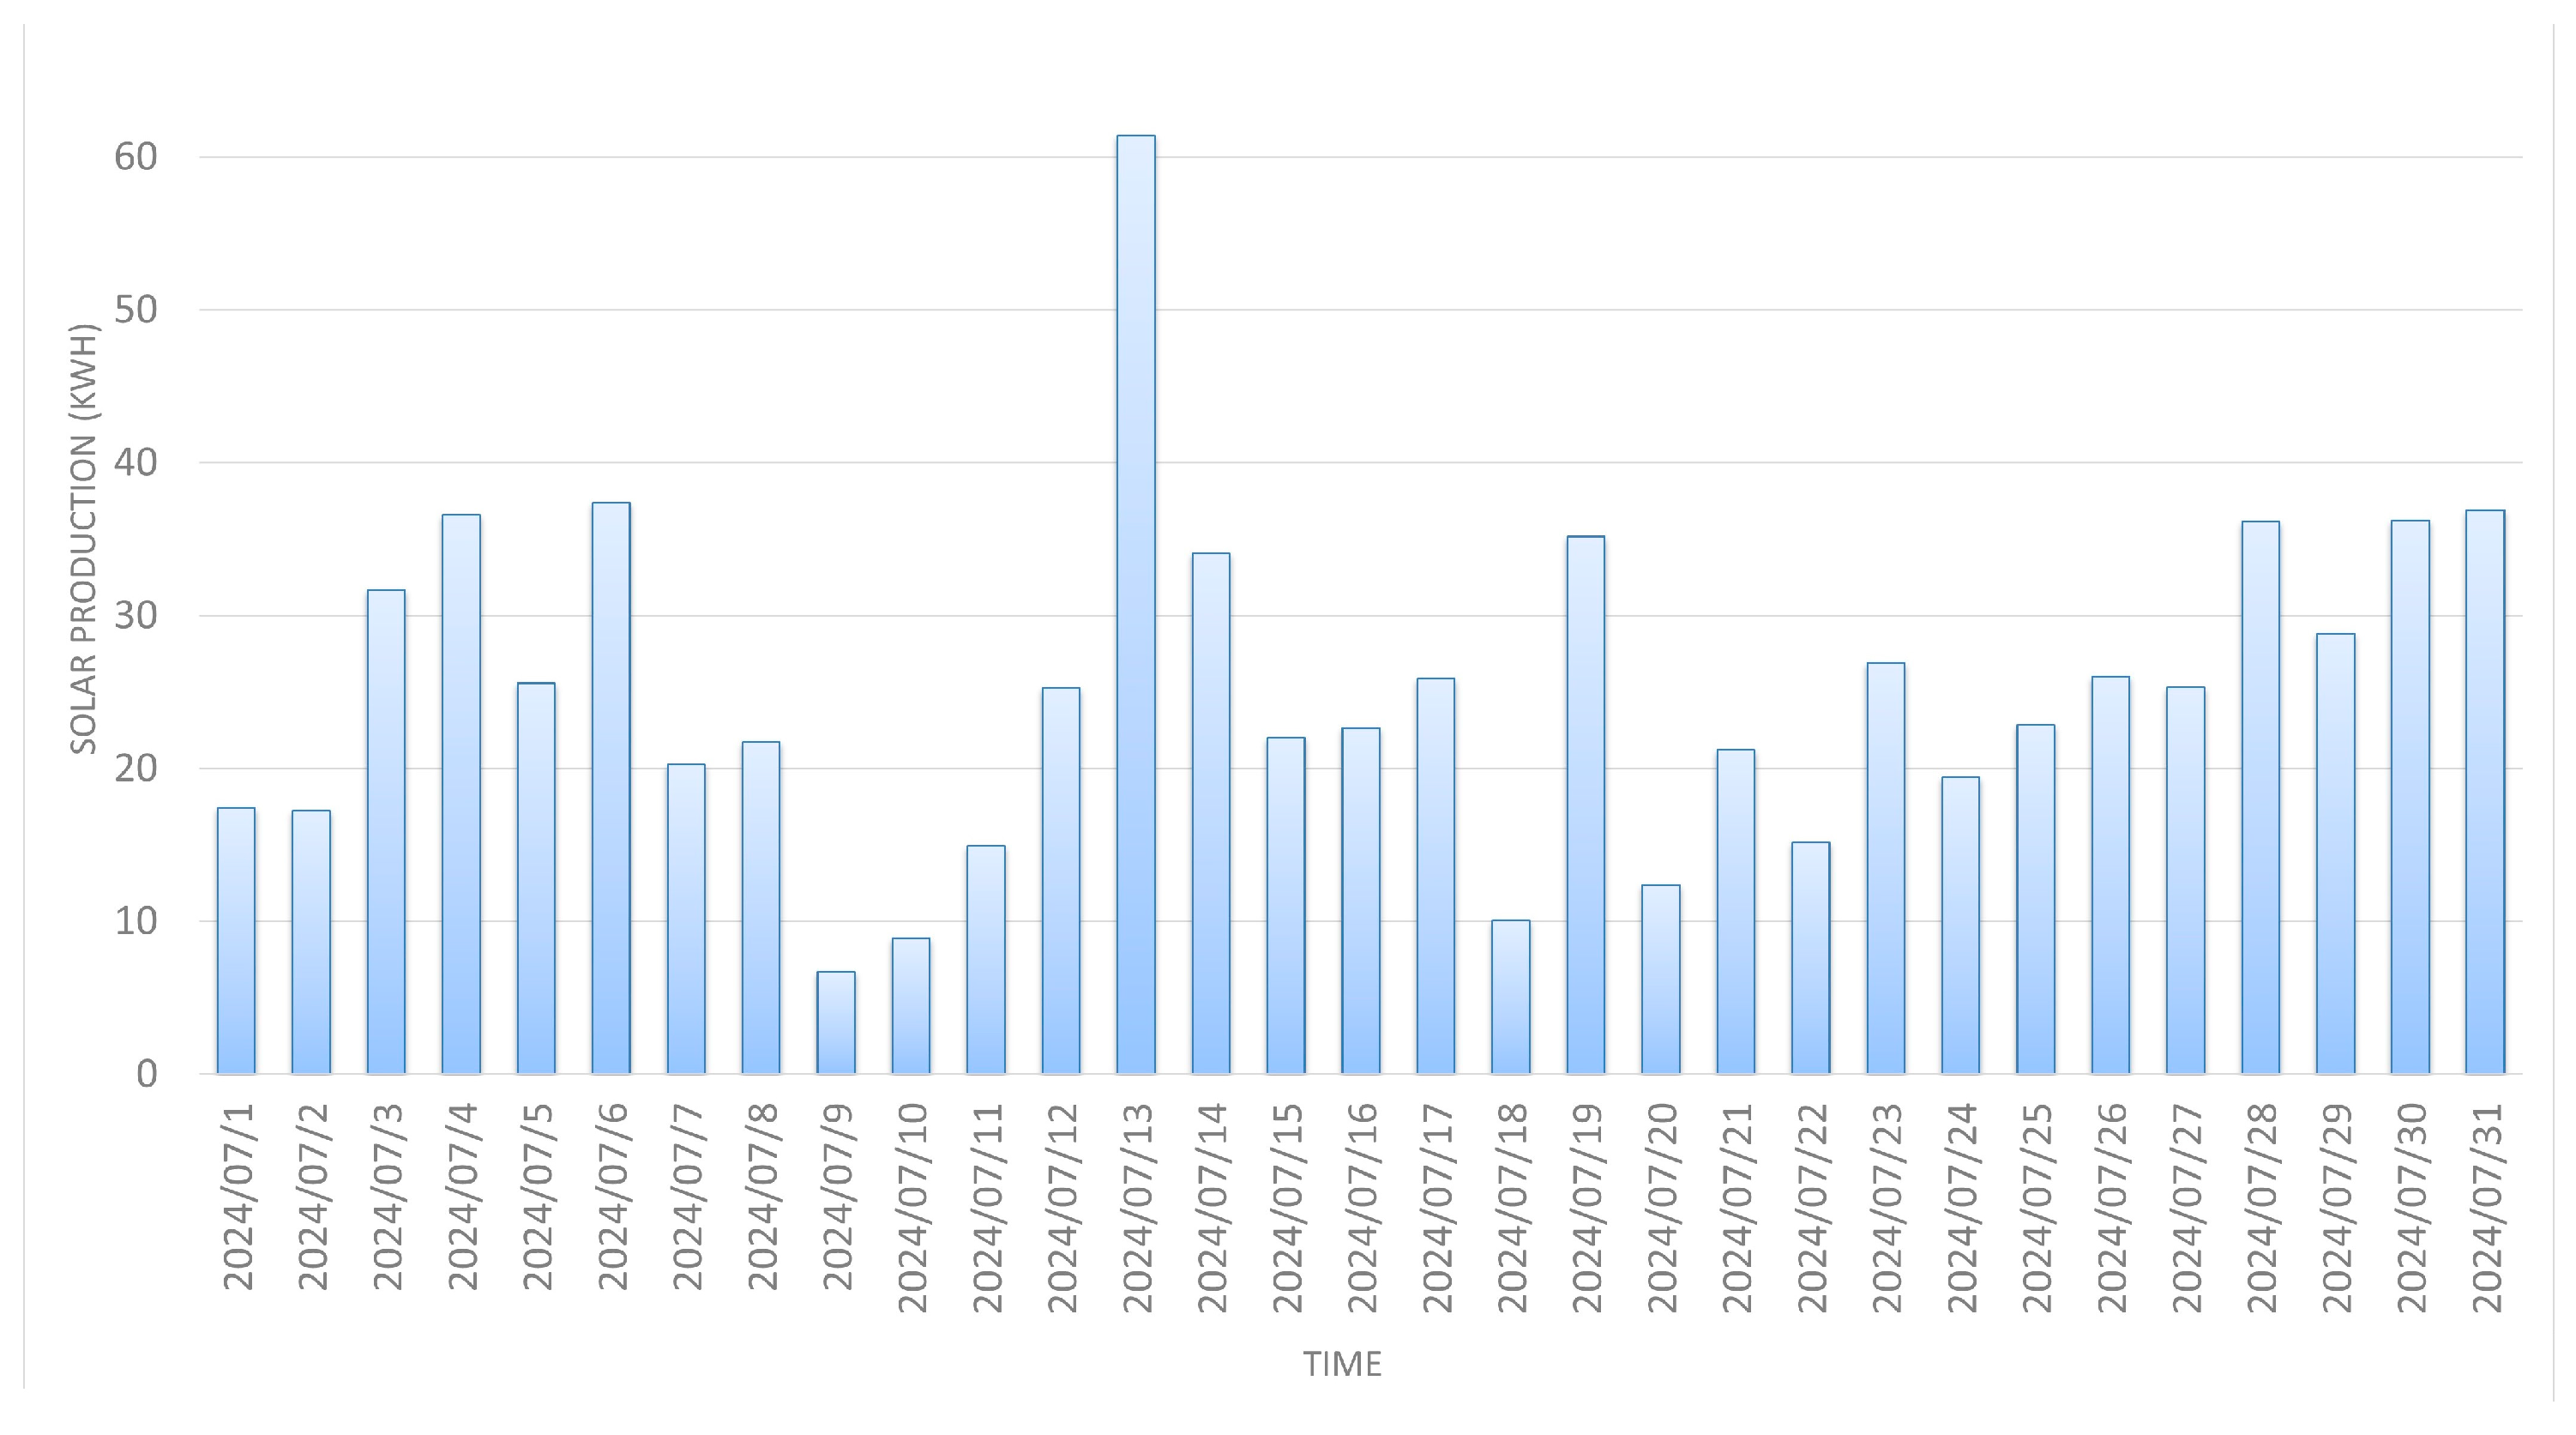
The solar panels generated a total of 781.9 kWh of renewable energy over the month, and the average daily solar production for July is indicated in Figure 14. This substantial production reflects the property’s capacity to harness solar power effectively, contributing a significant portion of the property’s energy needs.
Imported and Exported (Grid)
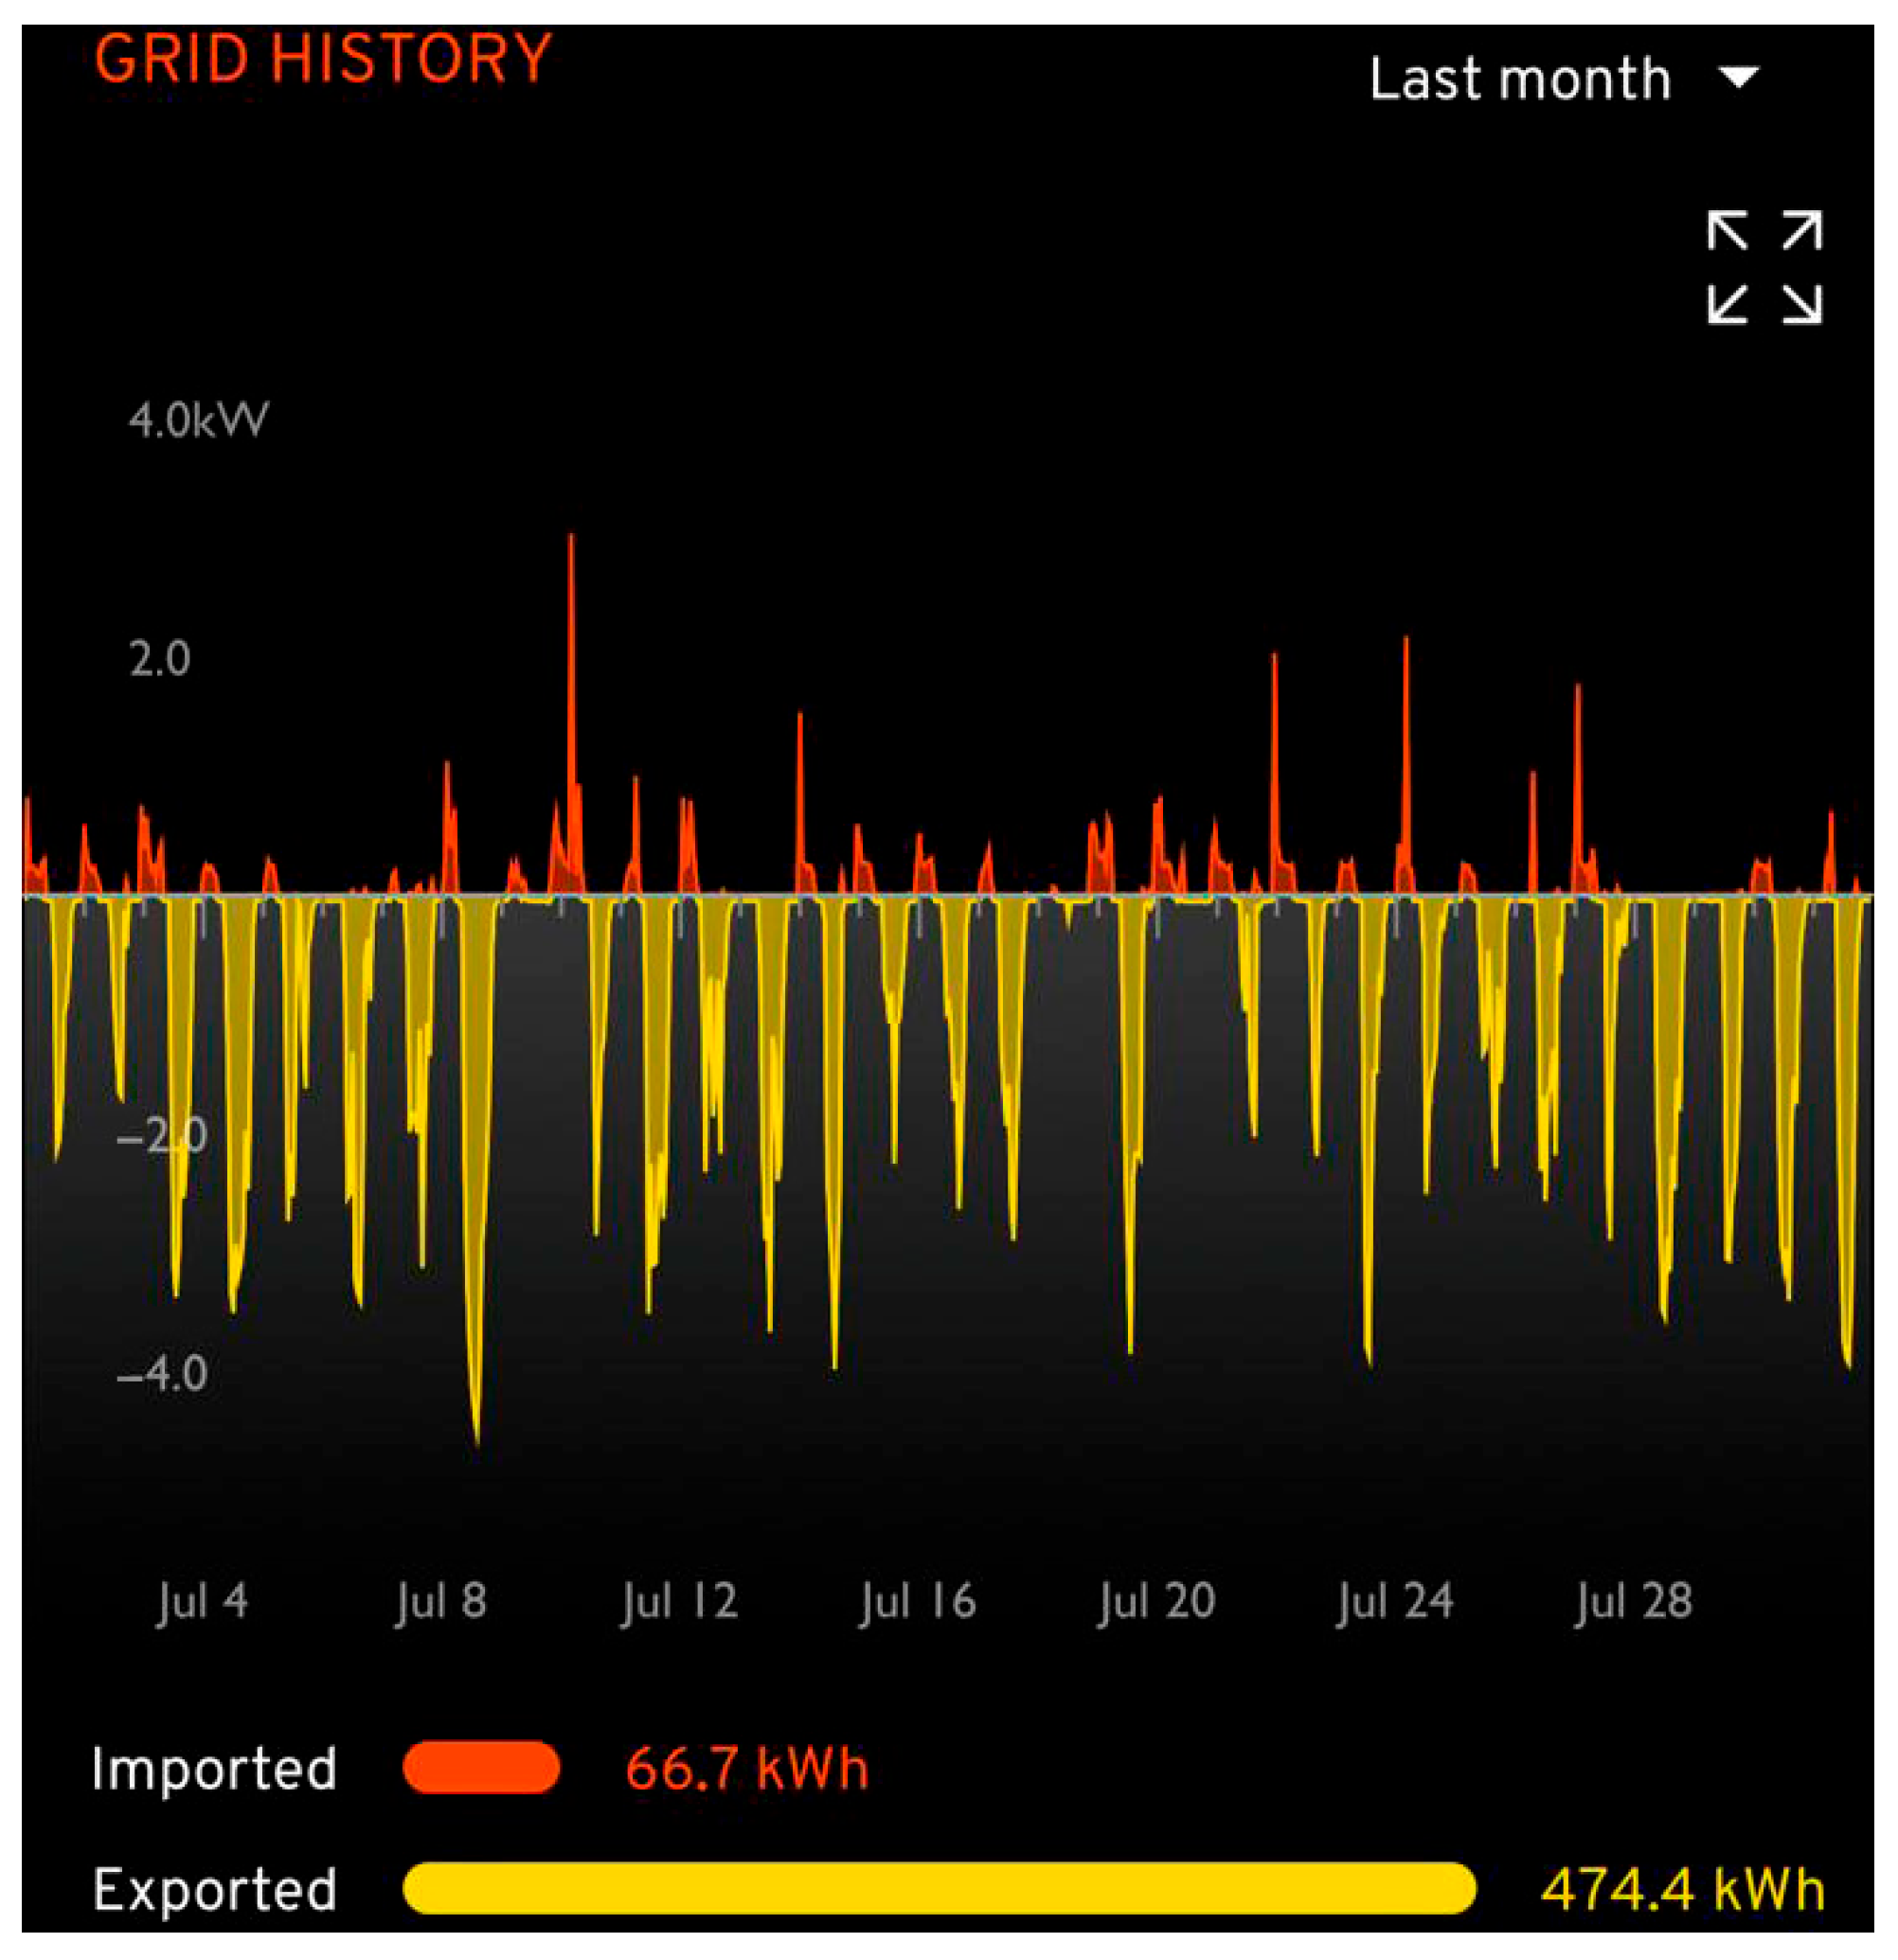
The property imported 66.7 kWh of energy from the grid to support its total energy needs. At the same time, surplus solar energy led to the export of 474.4 kWh back to the grid, contributing positively to the overall energy system, as illustrated in Figure 15.
Consumed Generation
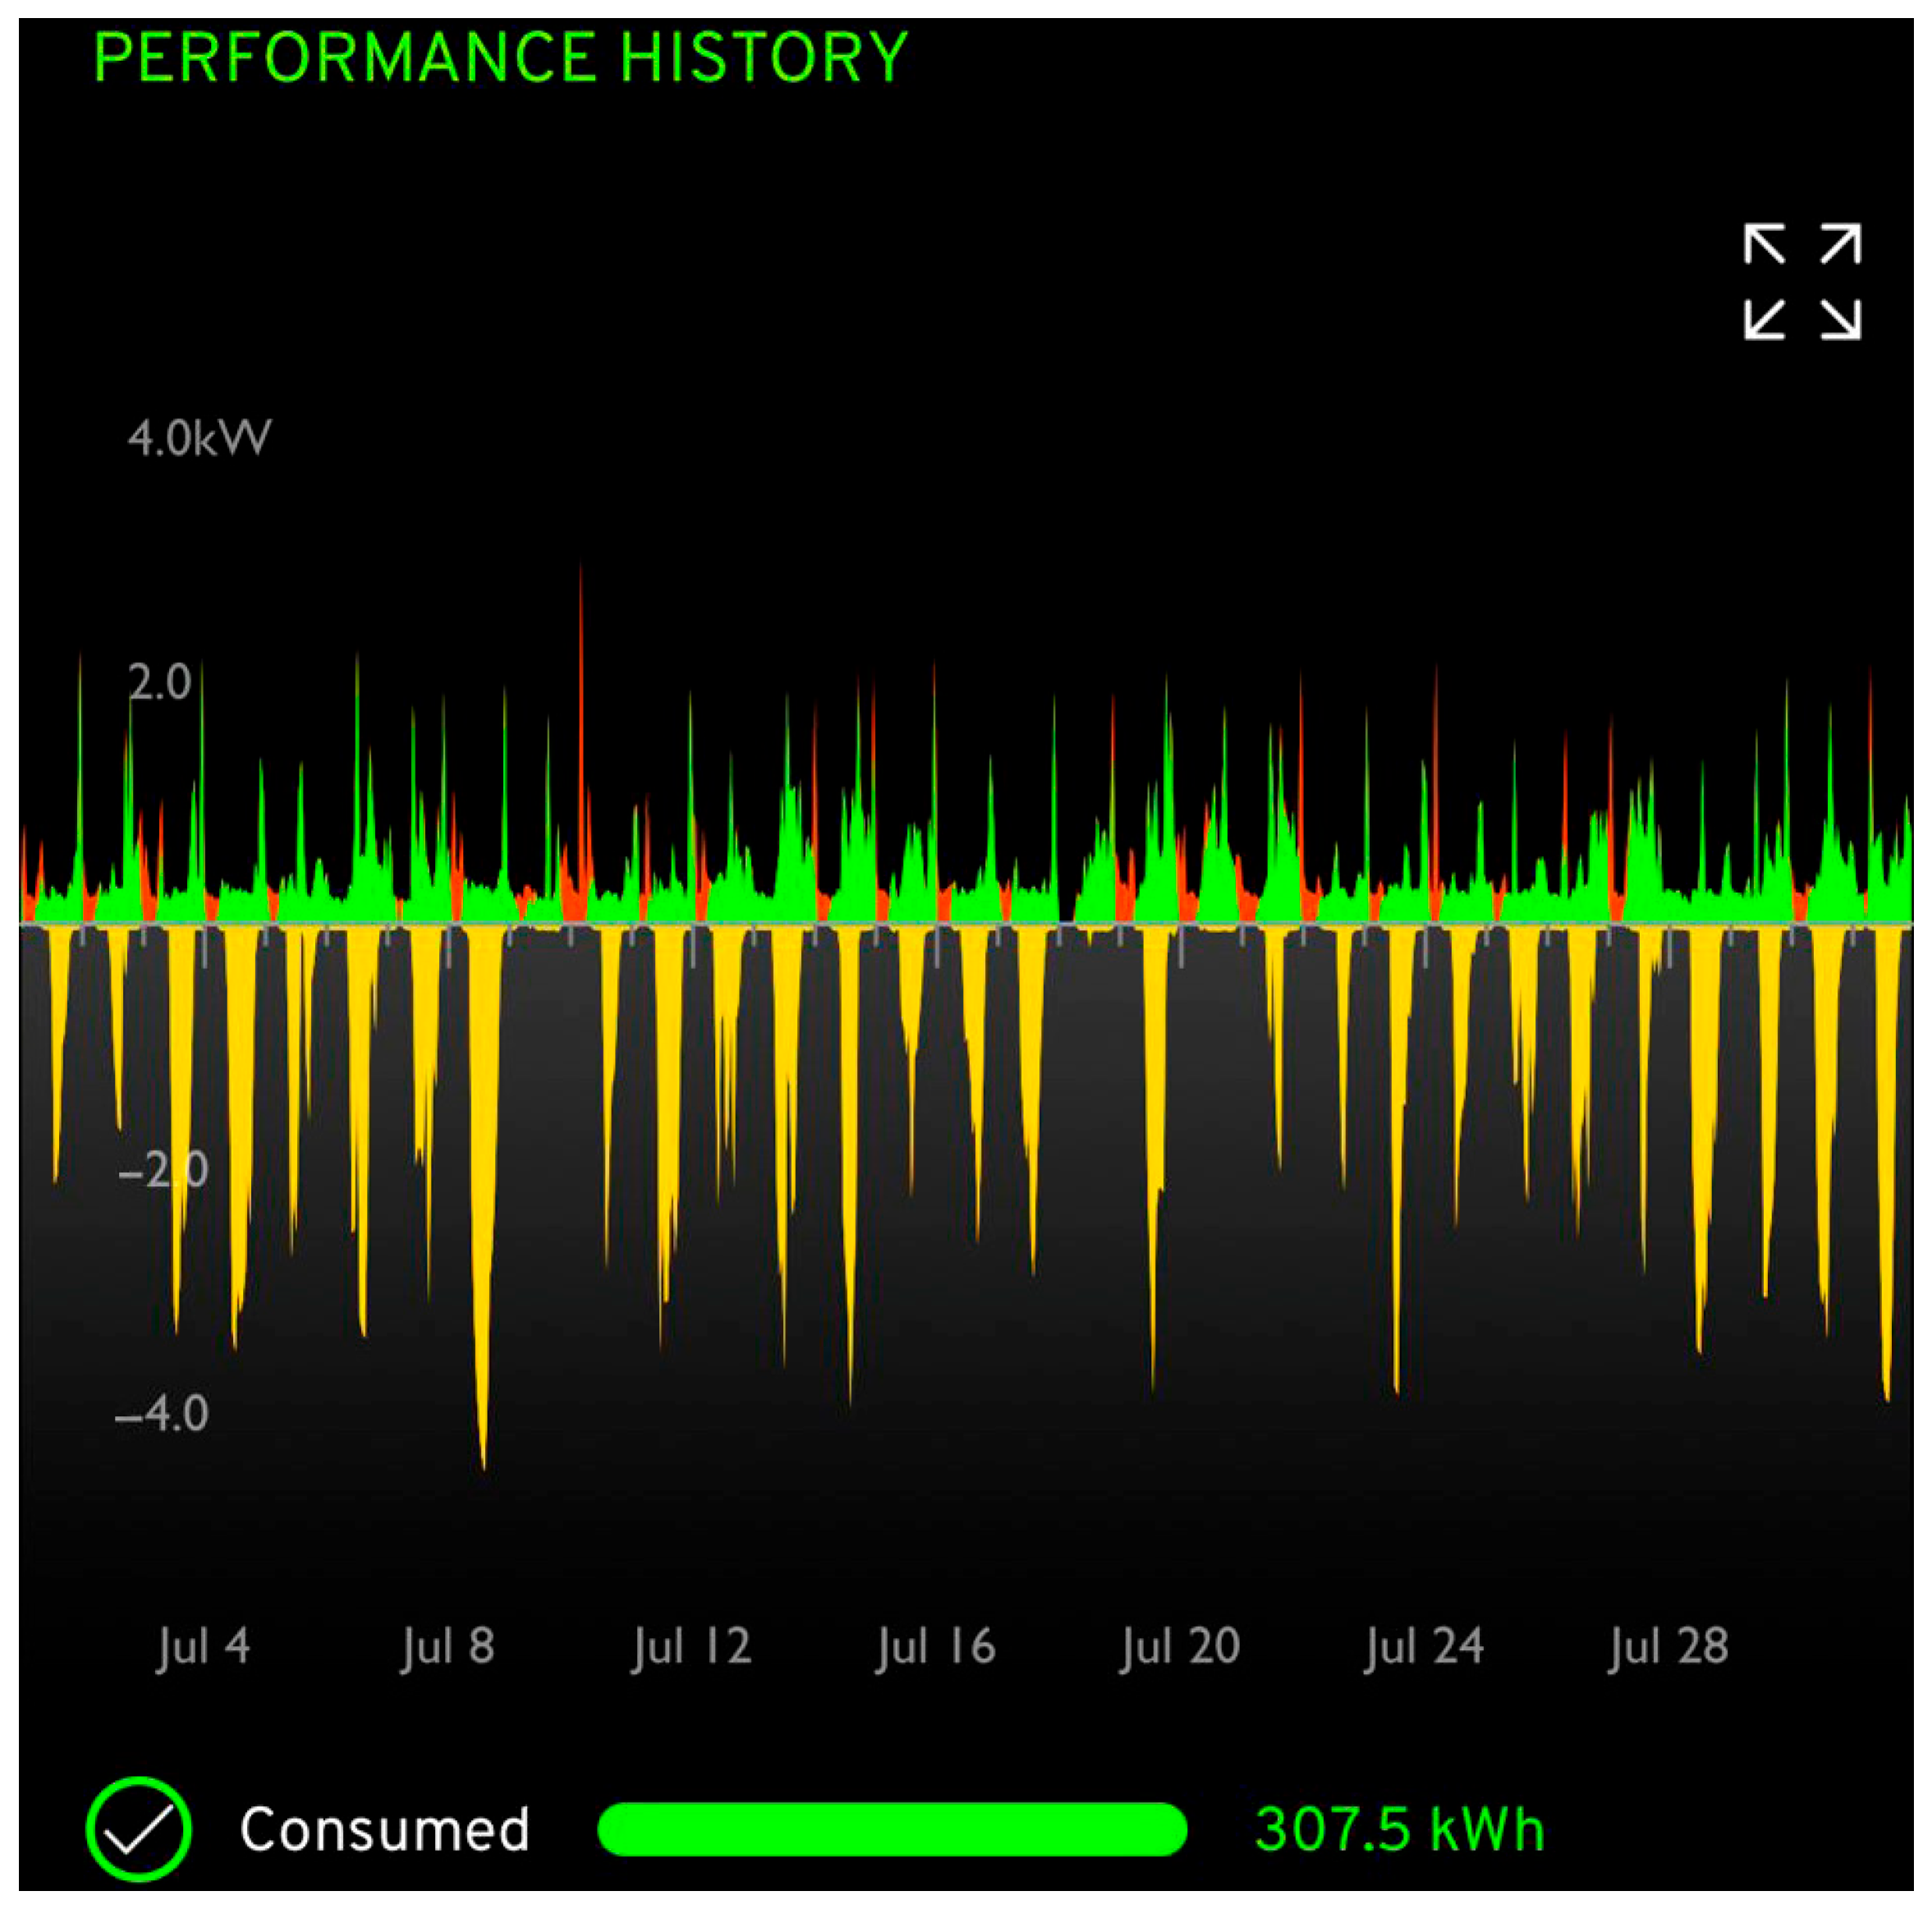
Out of the solar energy generated, 307.5 kWh was utilized within the property as detailed in Figure 16. This self-consumption metric indicates the direct use of locally produced solar energy, which helps reduce dependency on the grid and maximizes the benefits of the renewable system.
Solar Generation and Consumption
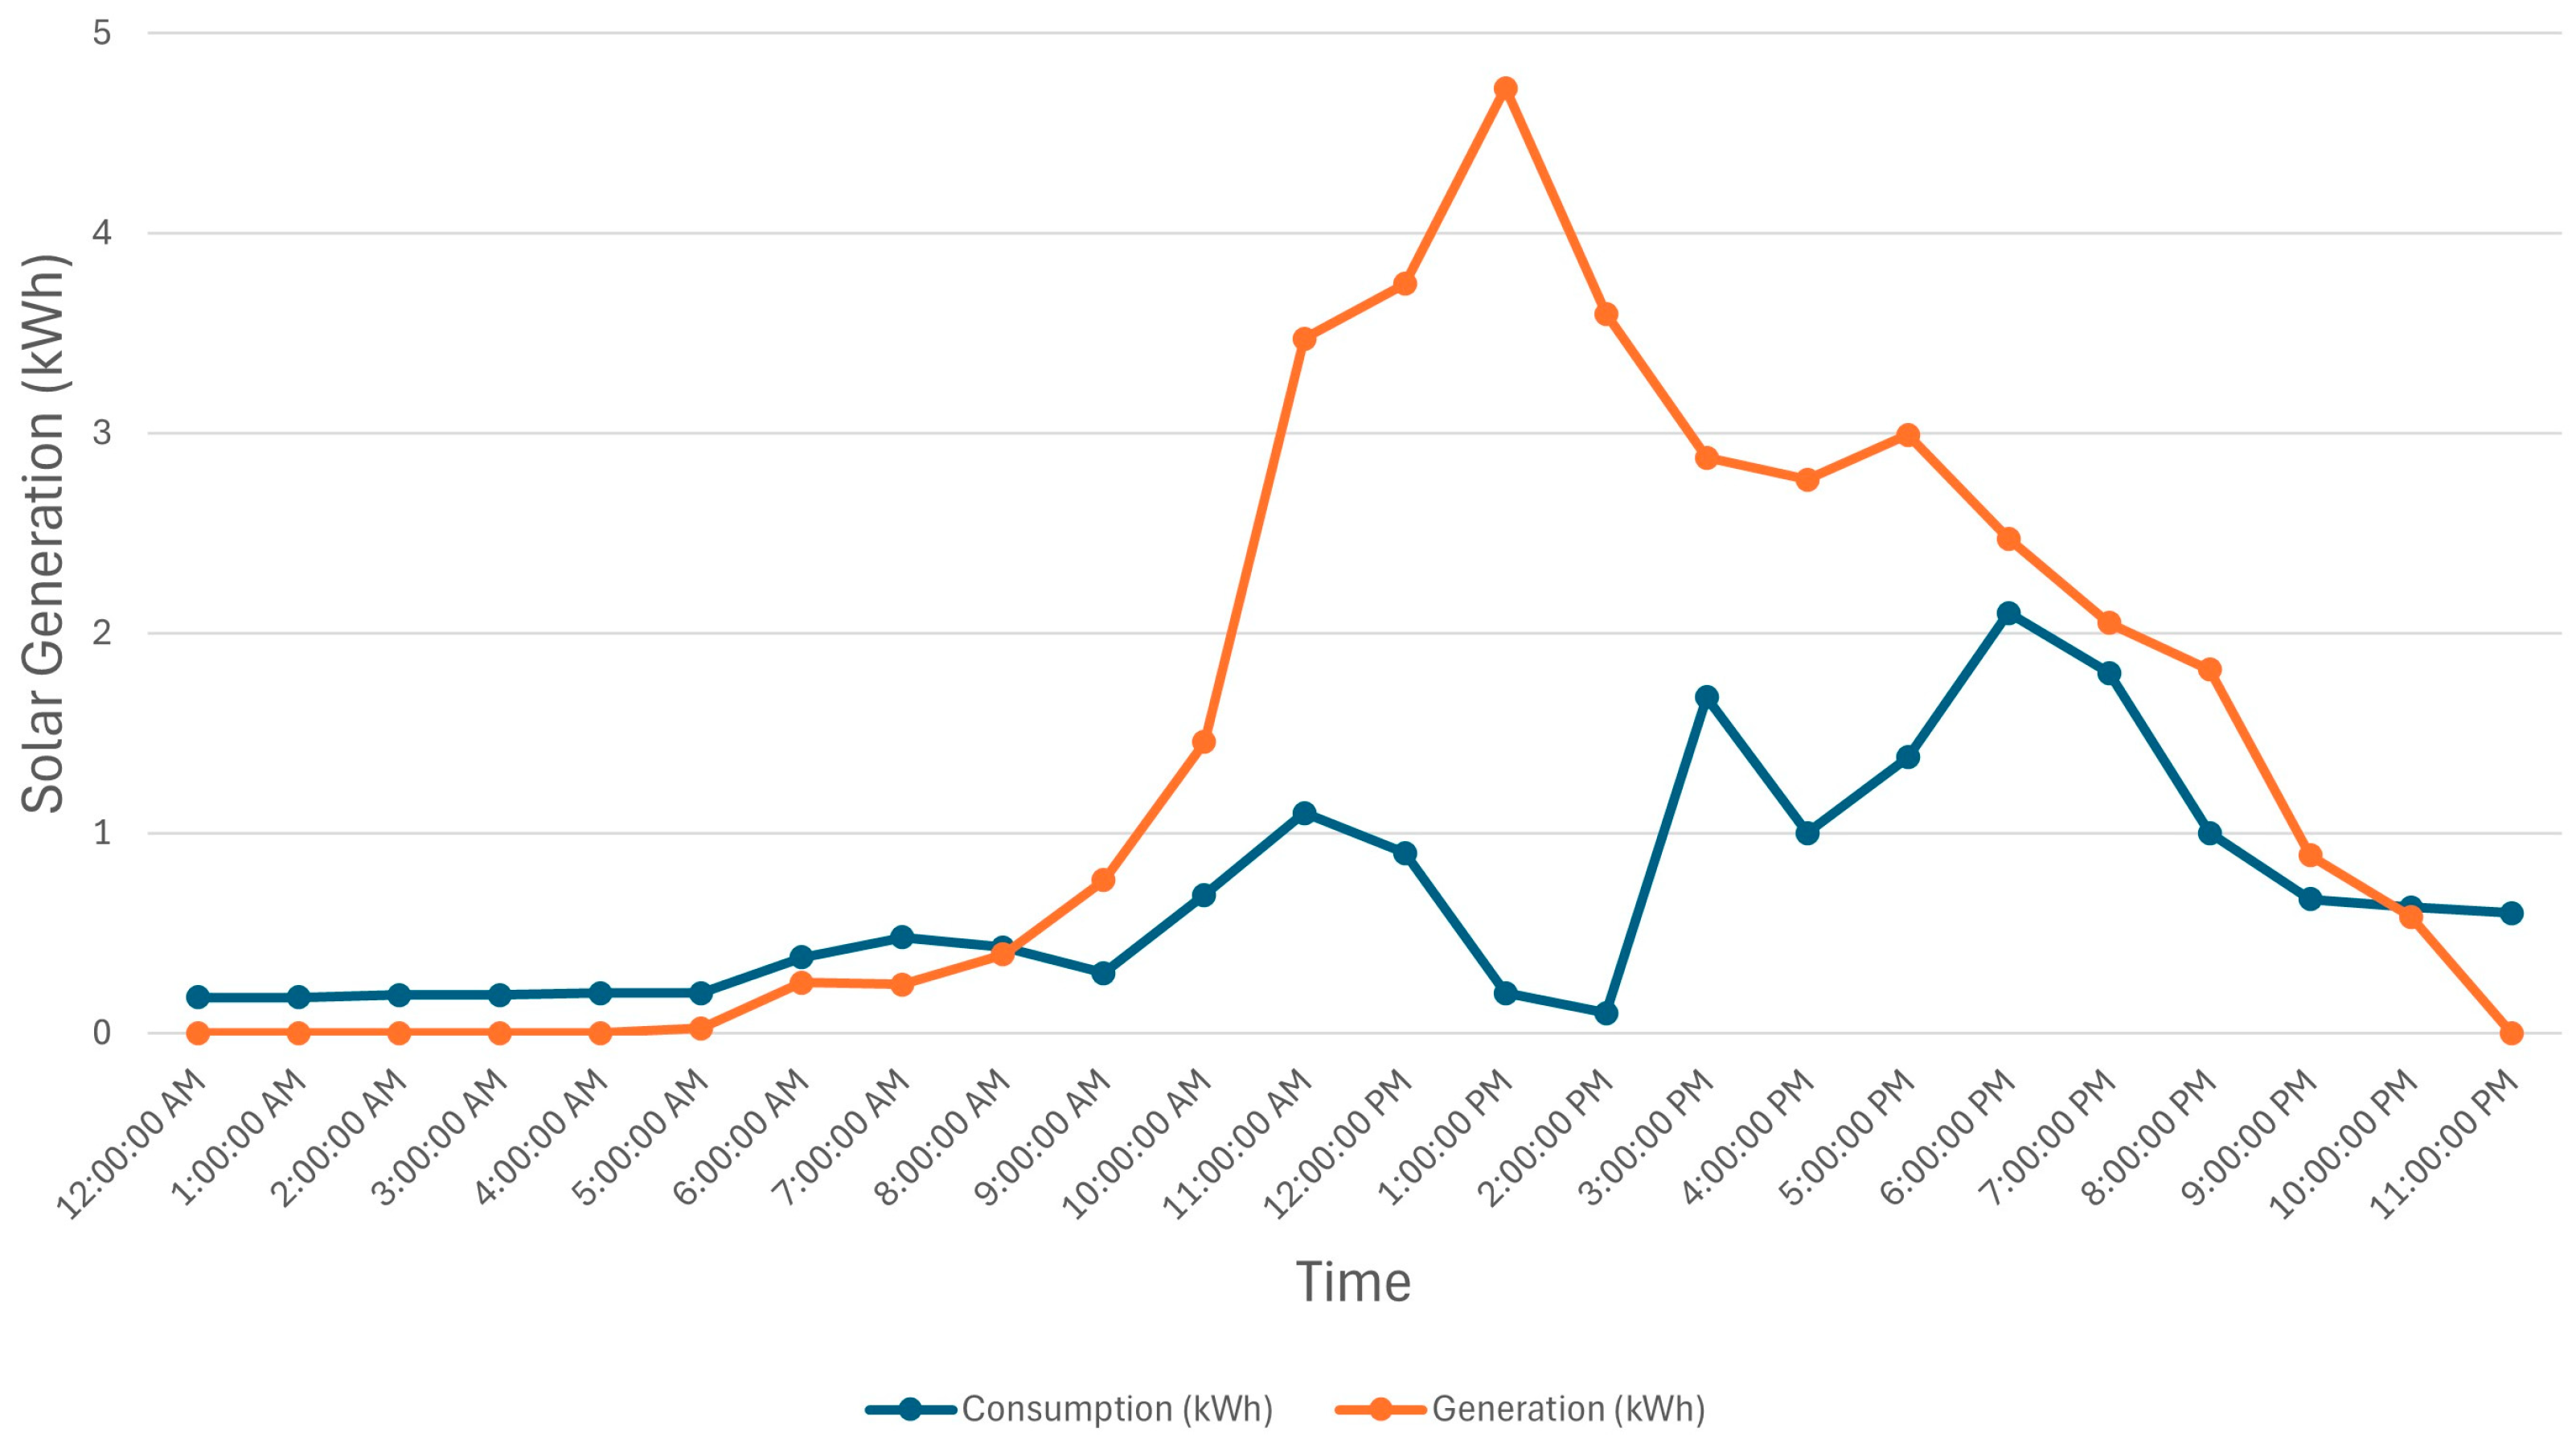
Figure 17 shows the solar energy generated by the solar system over a 24 h period, along with energy consumption during the same time frame.
Zappi Charging
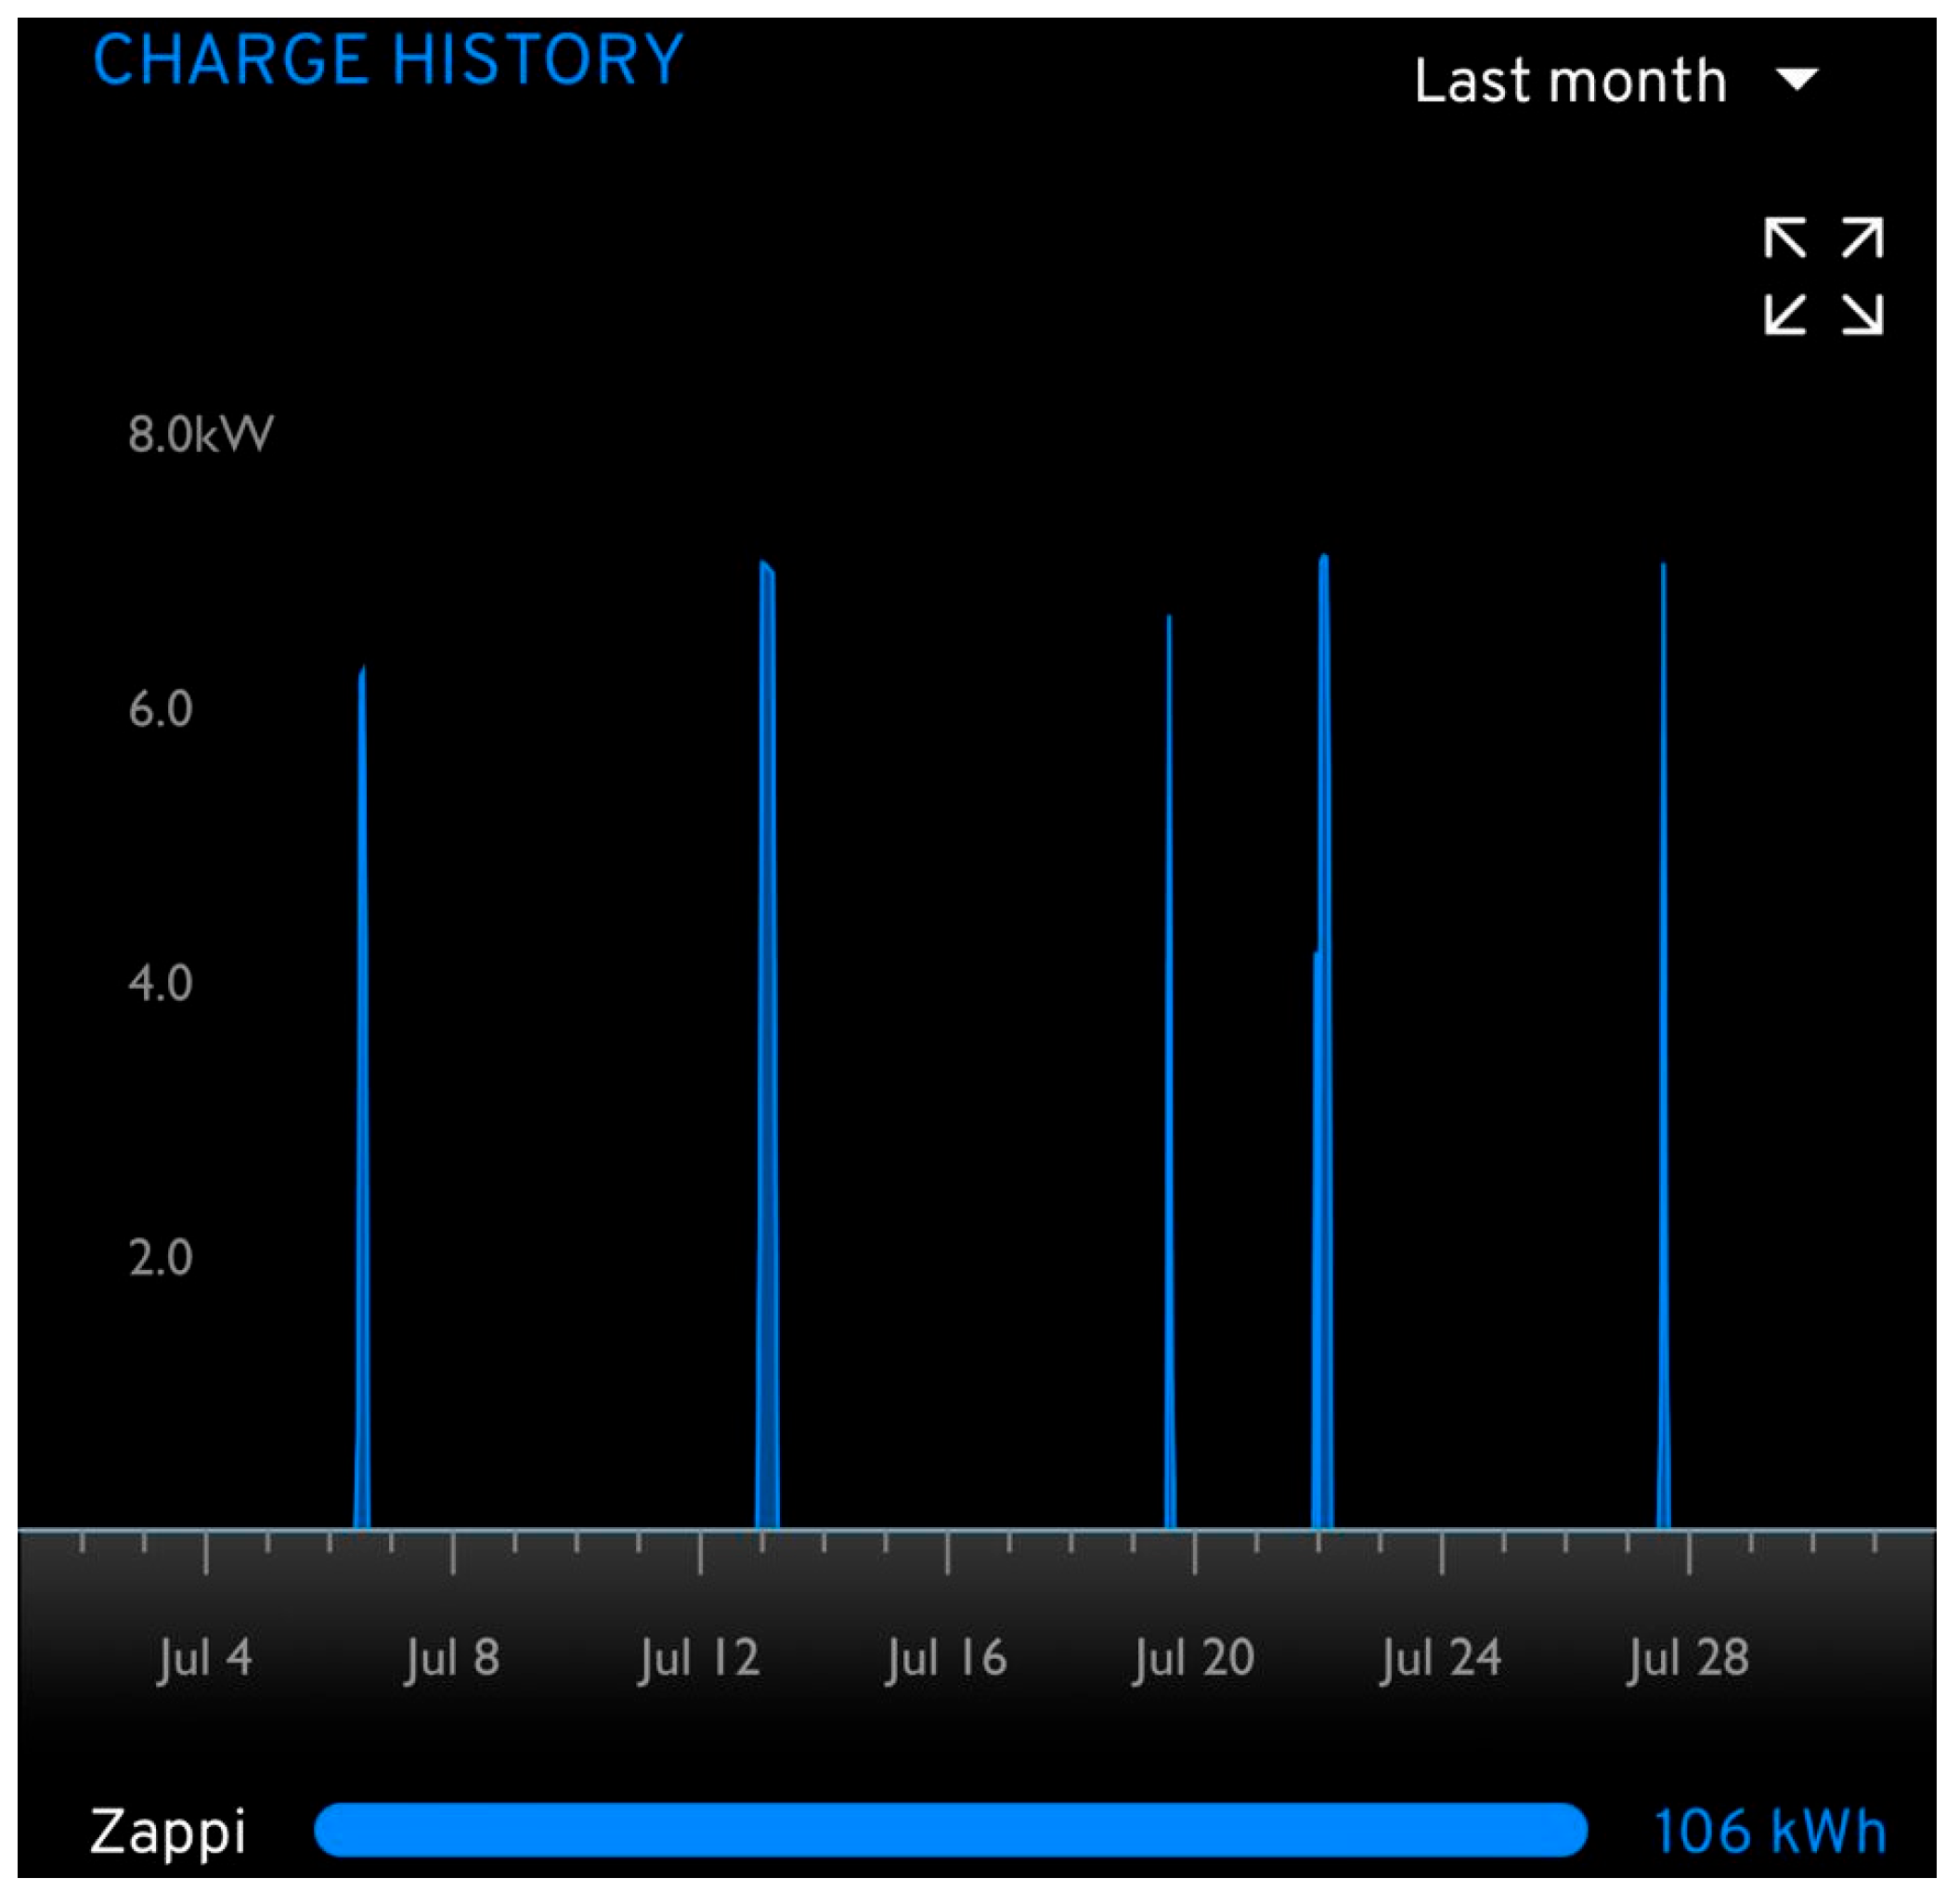
As shown in Table 8 and Figure 18, the Zappi EV charger was used five times throughout July, with a total charging power of 106 kWh, specific dates and charging power shown in Table 8. This use of the EV charger integrates both renewable and grid-sourced power, further enhancing the property’s overall energy efficiency and sustainability.

4.2. Financial Analysis

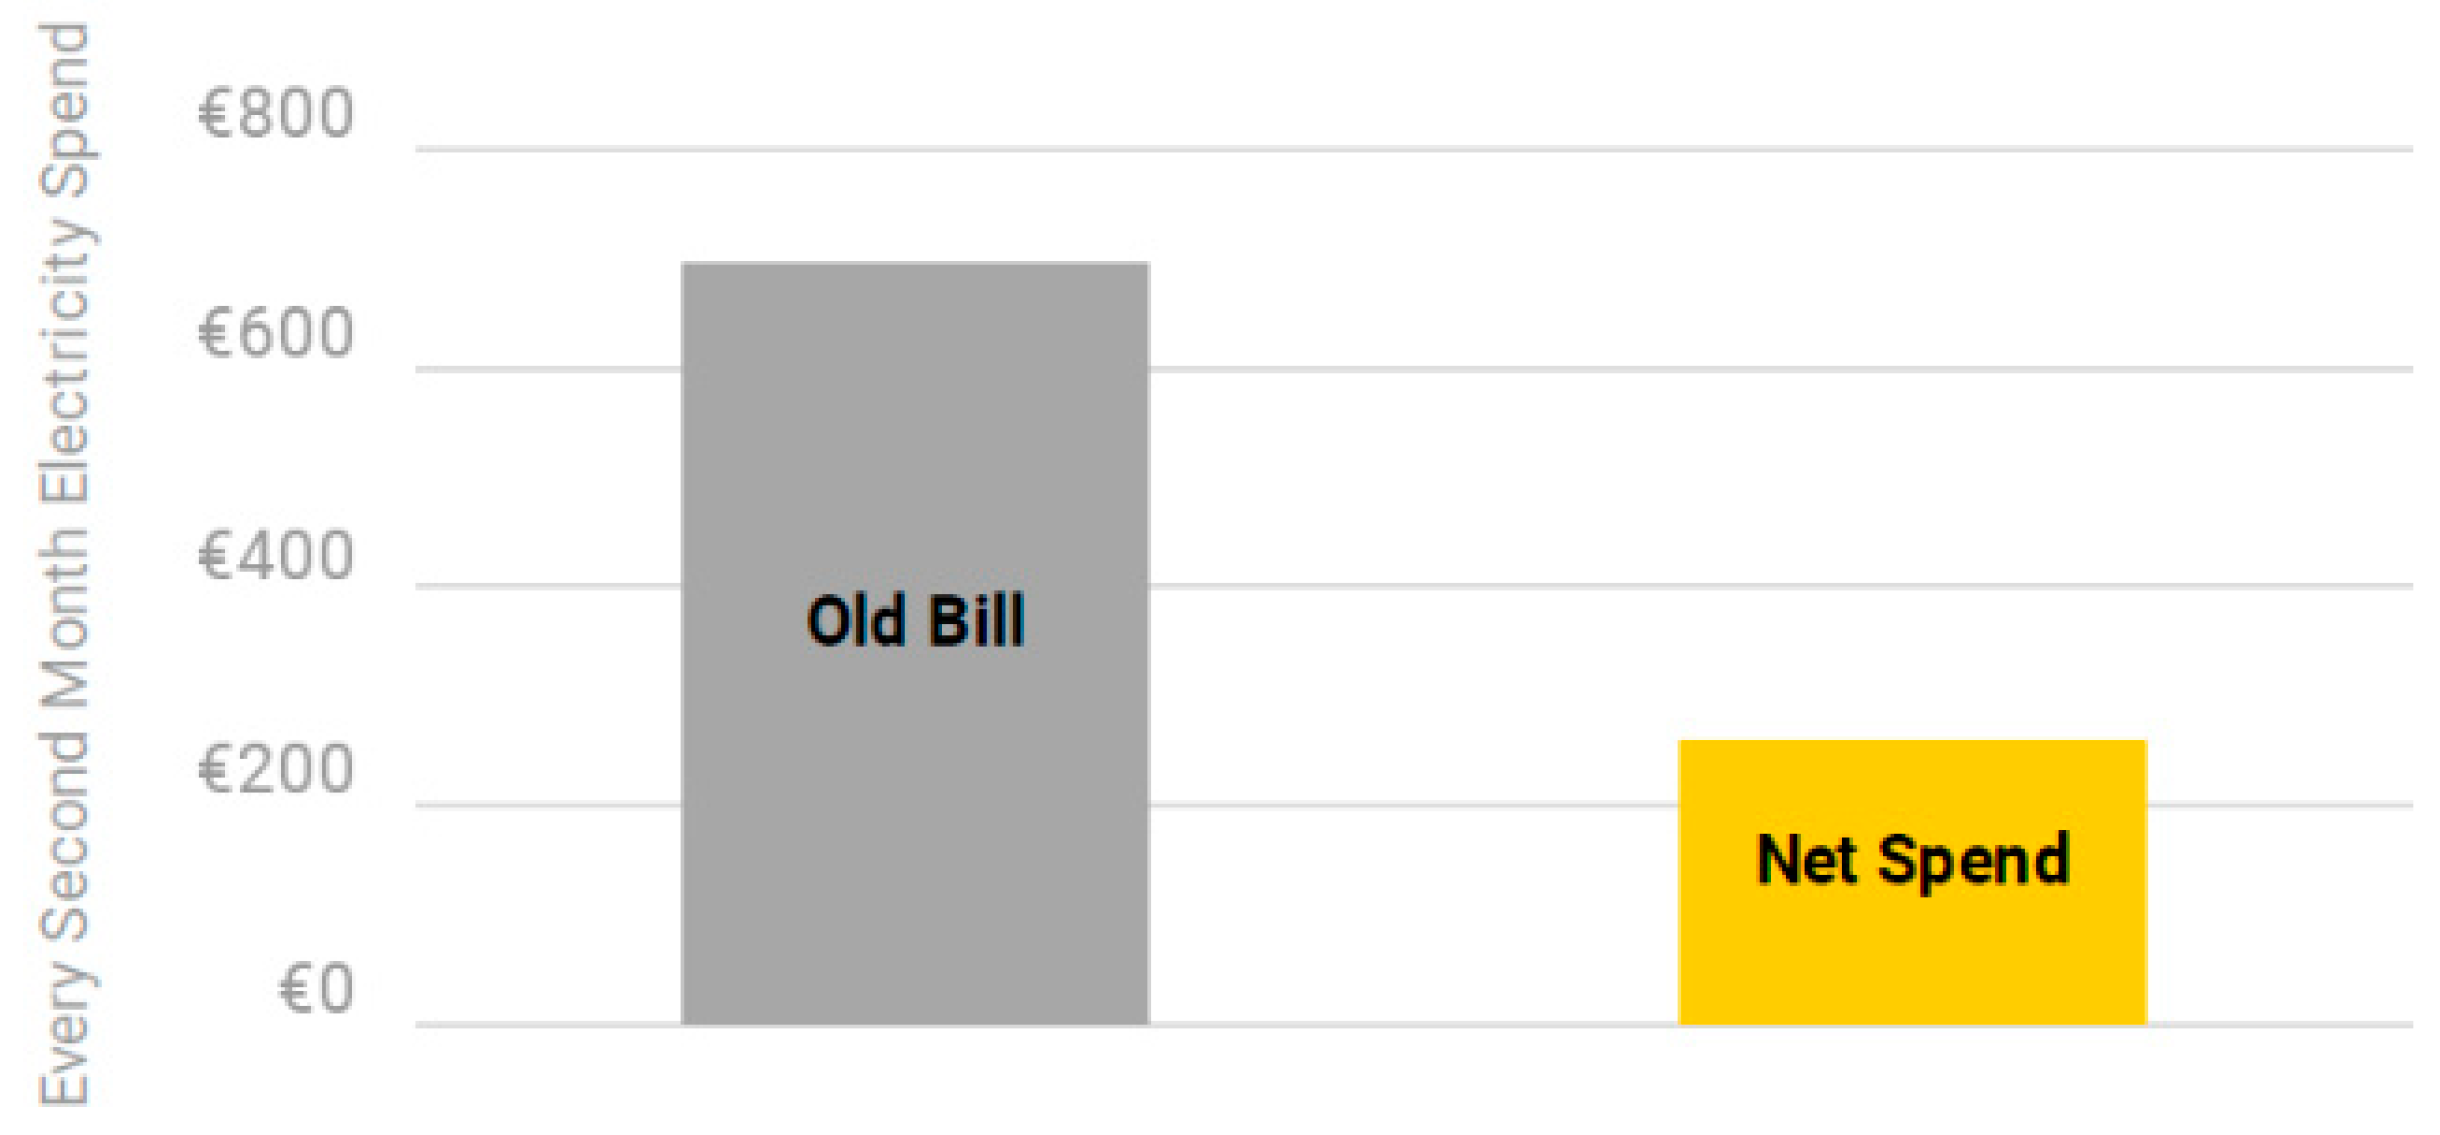
In accordance with the proposal presented by OpenSolar, the projected average bill savings for the first year, calculated for every second month, indicate that the net expenditure amounts to €258, considering that the Clean Export Guarantee (CEG) incentives equal €98.03, as indicated in Equation (3) and illustrated in Figure 19.
N e t   s p e n d = N e w   b i l l C E G
The proposal for the solar energy system shows a CEG of 5.12 kWh and projected earnings of €588.16 in the first year, with approximately €98.03 received every second month. To calculate the revenue in €/kWh, assuming an annual export of 1868.8 kWh/year, we multiply the number of days by the CEG and divide the total earnings by the exported energy. This results in a revenue of approximately €0.315/kWh.
As shown in Table 9, the data presents a comparison of utility bills before and after the solar system installation, along with the associated savings; for instance, the bill before the solar system for the month of January and February €805, while after the solar system, it becomes €653, which leads to €153 as expected savings. Equation (4) is used to calculate the estimated savings for each second month during the first year.
E l e c t r i c i t y B i l l S a v = B i l l B S B i l l A S
where ElectricityBillSav is electricity bill savings, BillBS bill before solar, and BillAS represents bill after solar.
Following the installation of the solar system, the customer’s electricity bill for the period from 16 May to 12 July 2024 demonstrated a significant decrease in energy consumption. Specifically, energy usage dropped to 272 kWh, compared to 709 kWh consumed during the same period in the previous year. This reduction can be directly attributed to the solar system, which considerably decreased the customer’s dependence on grid electricity. Consequently, the customer benefited from lower energy costs, underscoring the solar installation’s financial advantages through enhanced efficiency and savings.
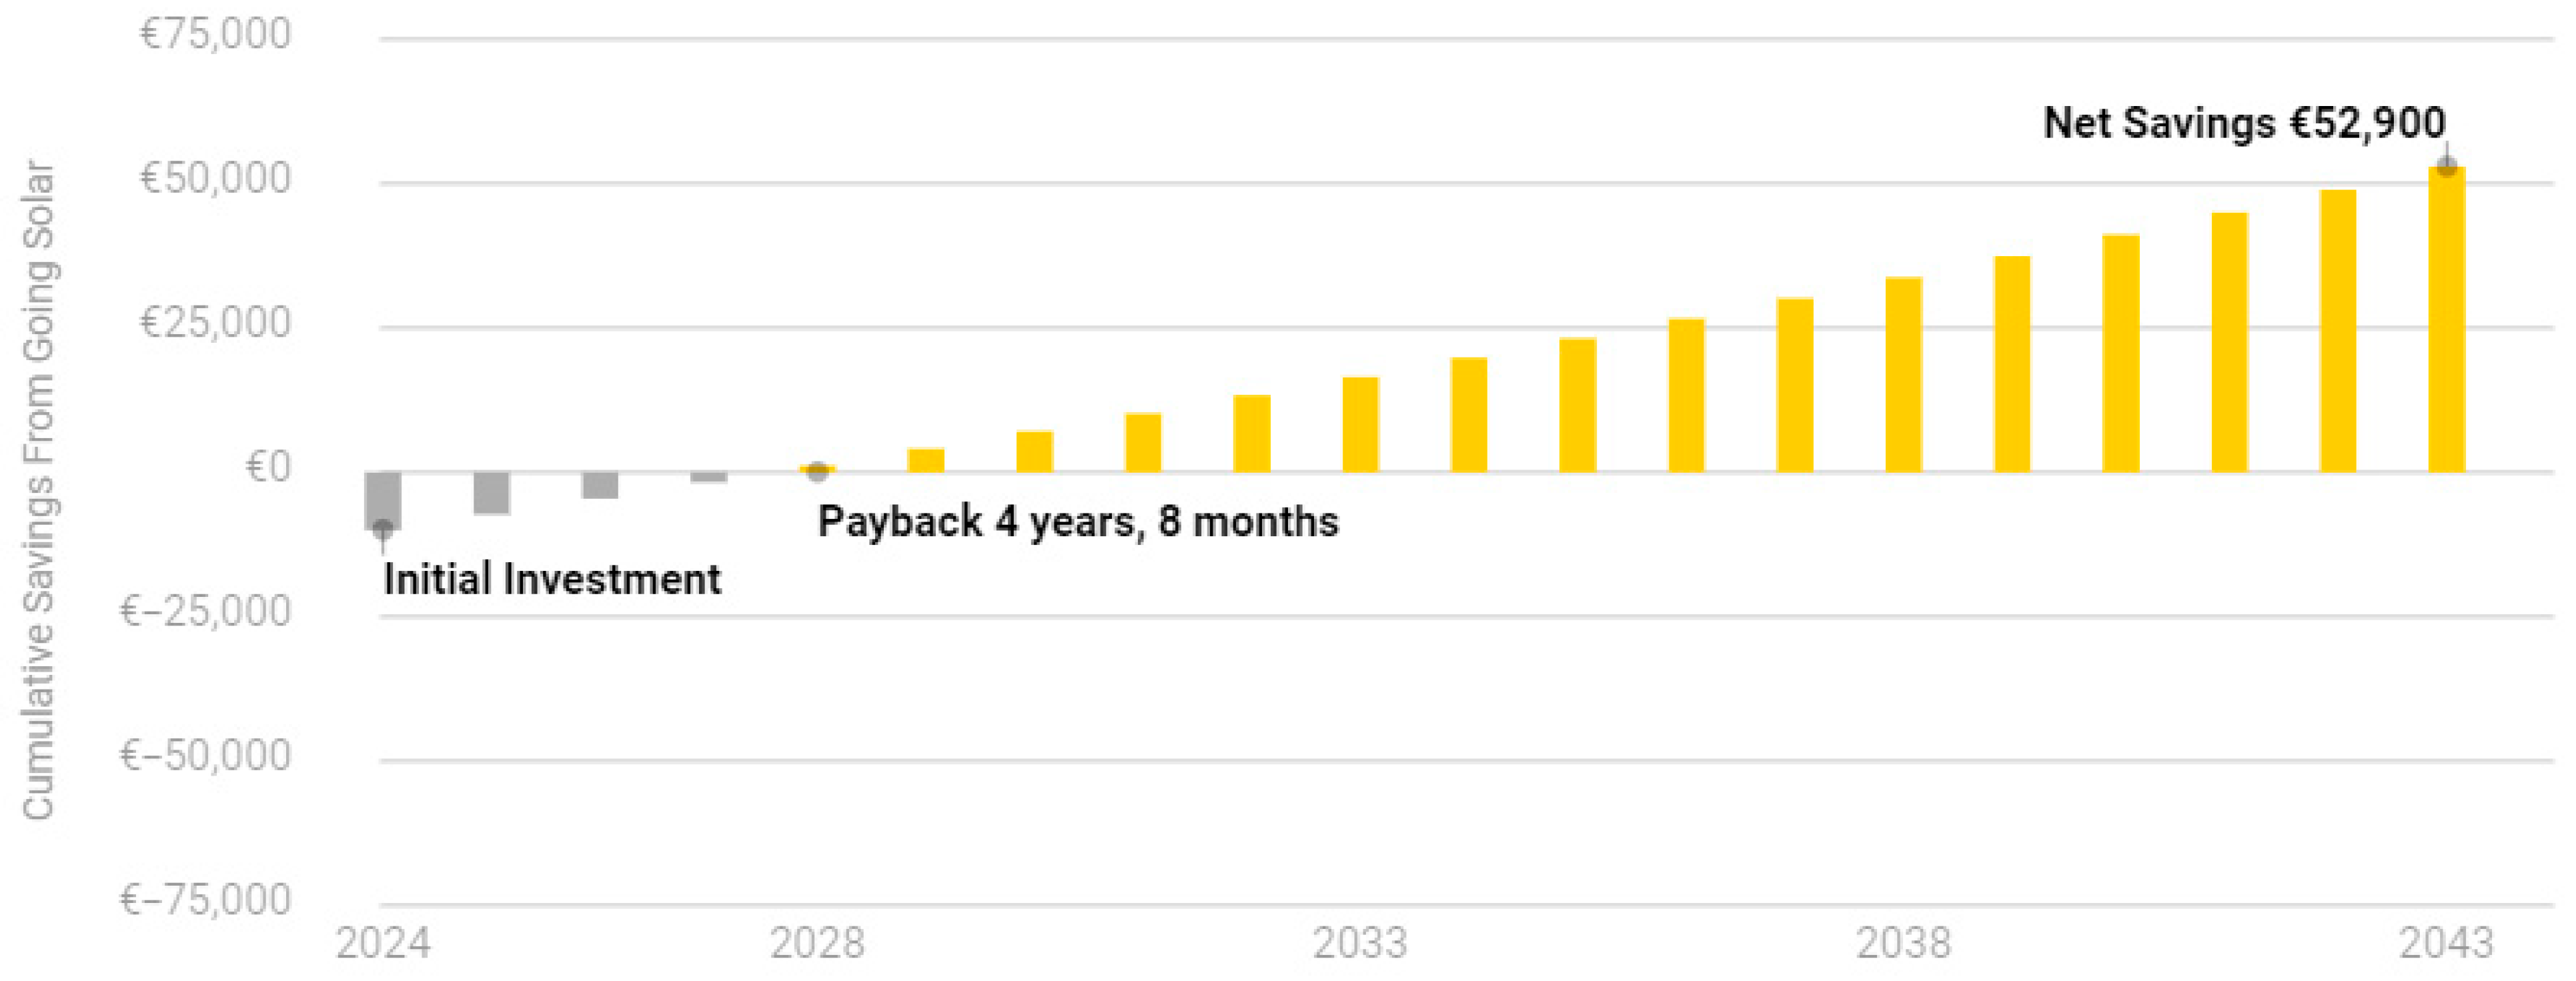
With a net system cost of €12,643 and projected annual savings of €65,543, the estimated net savings in 2043 amount to €52,900, as indicated in Equation (5).
E s t i m a t e d N e t S a v = P r o j e c t e d A S a v N e t S y s C
where EstimatedNetSav represents the estimated net savings. Projected annual savings in the equation is ProjectedASav and the net system cost is NetSysC.
Figure 20, illustrating cumulative savings from solar adoption, demonstrates that the projections extend over a 20-year period, with an anticipated payback period for the solar system achieved in 4 years and 8 months.
With regard to charging the electric vehicle and considering the unit prices for the three time-of-use periods that are day (€0.351), night (€0.1731), and nightboost (€0.1016), the total cost of charging the EV is calculated to be about €22.5, in case of grid-based charging. Of course, the customer charges his EV for free using the solar system installed at his home, and also exports excess power back to the grid, making the contribution of renewable energy to charging EV 100%.

4.3. Environmental Impact

The proposed solar system offers significant environmental benefits by providing clean, emission-free energy that actively protects the environment. Annually, the system is projected to reduce harmful emissions by 67%, avoiding approximately 2 tons of CO2, SOx, and NOx. Over the system’s lifetime, this reduction is equivalent to eliminating emissions from driving 48,962 km, planting 315 trees, or avoiding 35 long-haul flights. By relying less on fossil fuels, the proposed solar system not only reduces carbon footprints, but also contributes to maintaining a healthier world for future generations.
Photovoltaic (PV) modules and lithium-ion (Li-ion) batteries have finite lifespans and require structured end-of-life management to ensure environmental sustainability. PV modules typically last 25 to 30 years, after which efficiency losses necessitate recycling. Under the EU Waste Electrical and Electronic Equipment (WEEE) Directive, Ireland has established compliance schemes through organizations such as WEEE Ireland to manage PV panel collection and recycling. Current processes allow recovery of up to 95 percent of module materials, including glass, aluminum, and silicon, thereby reducing the need for virgin resource extraction [56].
Lithium-ion batteries generally operate effectively for 8 to 15 years, after which capacity degradation makes replacement necessary. The recently adopted EU Battery Regulation (Regulation (EU) 2023/1542) prohibits landfill disposal and requires minimum recycling efficiencies of 65 percent for lead-acid batteries and 50 percent for Li-ion batteries by 2025, increasing to 70 percent by 2030. It also mandates the recovery of critical raw materials such as cobalt, nickel, and lithium, which are essential for future battery production [57].
By integrating established recycling frameworks with advancing recovery technologies, Ireland’s regulatory environment ensures that both PV modules and Li-ion batteries can be retired without creating an ecological burden. This lifecycle perspective reinforces the long-term sustainability of residential PV and EV charging systems.

4.4. Discussion

This work focuses on a domestic house load with an EV charger in order to charge the customer’s MG4 electric vehicle. The installed solar system was studied, which provides solar energy to the customer’s home load in addition to charging his electric car from all sides. The effects of the installed solar system on the customer’s needs in terms of house consumption, charging the EV, selling back to grid, and economic and environmental aspects are explained in detail, showing the gaps that this system overcomes and results in superior performance, all proven by real values and feedback given by the customer himself.
The installed solar system has proven its worth and enormous potential under the environmental conditions in Ireland and has proven that it can produce more clean electricity than the electricity expected by the simulation program, as the expected value of electricity production by it is equivalent to 682 kWh for the month of July 2024, while the actual energy produced is equivalent to 781.9 kWh for the same period of time. As the predicted average daily PV generation (AverageP) is 22 kWh/day and the actual average (AverageA) is 25.22 kWh/day, the Mean Bias Error (MBE) can be calculated as follows:
M B E = A v e r a g e P     A v e r a g e A
After applying the equation, MBE = −3.22 kWh/day, the negative value indicates that the model underpredicted PV generation. Multiplying by 31 days for July gives an absolute monthly error of 99.82 kWh, meaning the system generated 99.82 kWh more than predicted, as shown in Figure 21. This discrepancy of approximately 100 kWh (or 14.7%) between the predicted and actual solar generation in July 2024 can be attributed to several favorable conditions. Firstly, weather data from The Irish Meteorological Service [58] indicated that July 2024 experienced above-average sunshine hours and below-average rainfall in the Dublin region, thereby increasing effective irradiance. Secondly, the dual-orientation layout (east-facing and west-facing arrays), eight panels at an azimuth of 294° and eight at 115°, both with a 40° tilt, which extended the daily solar capture window, allowing the system to generate power efficiently across morning and afternoon periods. Additionally, moderate ambient temperatures (~15 °C) during the month reduced thermal losses in the PV modules, enhancing their operating efficiency. Thirdly, the system benefited from consistent maintenance and routine panel cleaning, which minimized soiling losses. Finally, the high conversion efficiency of the selected components, 97.2% inverter efficiency, and >20% panel efficiency, also contributed to maximizing actual energy yield. These combined climatic and technical factors help explain the observed outperformance relative to simulation.
Regarding Figure 17, which shows the maximum measured export of 4.73 kW at 13:00, this value remained well within the safe operational margins for voltage and frequency defined by EN 50160 [59] and enforced through ESB Networks’ Conditions Governing Connection to the Distribution System and the national Distribution Code [60,61,62]. Under these standards, supply voltage must remain within ±10 percent of nominal values (207–253 V for single-phase, 358–440 V for three-phase) for 95 percent of each week, while frequency must stay within 49.5–50.5 Hz for 99.5 percent of the time. Compliance is assessed against ESB Networks’ technical requirements regardless of the electricity supplier, ensuring that residential photovoltaic systems operate within established voltage and power quality limits.
National data confirm the capacity of Ireland’s electricity network to integrate distributed solar generation at scale. As of July 2024, ESB Networks reported more than 100,000 rooftop solar microgenerators connected nationwide, providing over 400 MW of installed capacity without compromising grid stability [63]. This achievement, supported by ongoing grid management practices, real-time monitoring, and targeted network upgrades, demonstrates that residential photovoltaic exports at the kilowatt scale can be accommodated effectively within the existing distribution infrastructure. The present case study, therefore, operates entirely within the proven technical and operational boundaries of Ireland’s power system.
There is no doubt that the solar system plays an important role under any circumstances and that creativity in knowing the choice of devices and studying the case in both the simulation and real-world cases always leads to satisfactory results for both parties. It is also necessary to take into account the high efficiency of the solar system installed in the customer’s home and its production efficiency, and its ability to adapt to different climatic conditions that affect consumption and production, and sell excess electricity to the grid and charge the electric car battery, and charge the battery storage system.
All these factors show a very positive result in the performance of the solar system, as it showed that the electric vehicle was charged completely free of charge, not only that, but also the excess electrical energy generated by the solar system was sold to the electricity grid, allowing the customer to benefit financially.
Also from an environmental perspective, as the system is equivalent to planting 315 trees, which has a significant impact on the percentage of carbon dioxide and other harmful gases, as it was reduced by about 67% in our case.
It is worth noting that one of the facilities that had a great role in these excellent results is the availability of a mobile application that can monitor the flow of energy produced and consumed, whether at home, charging the EV battery, the battery storage system, or even the energy sold to the government network, and all of this is performed through some easy options for the user so that they can choose and make a decision in order to use the optimal energy for them, for example, the user can charge the EV battery in more than one way depending on the availability of electrical energy, they can specify clean energy and thus the battery charging will depend only on the solar energy produced, and of course there are many other options available in the application such as the FAST charging mode which draws electricity from the grid, while the ECO and ECO+ charging modes are relying on renewable energy in addition to the grid and renewable energy only, respectively. The chosen mode depends on the user’s style and method in order to obtain the maximum benefit, even if the customer is not at home or even if they are outside the country, as the application connects to the installed solar system via internet and gives it commands based on the customer’s desire and need.
In addition, Table 10 demonstrates the methodologies used in some studies, their strengths, and weaknesses. This article’s main aim, which covers all aspects of the solar energy-based EV charger system, is explained below the table, making it superior to other studies with reliable values and the customer’s feedback.
This research article, based on a home-installed solar system with an electric vehicle (EV) charging device, is a purely practical investigation conducted in several stages. These stages include inspecting the home, simulating the property and solar system using OpenSolar prior to installation, and then proceeding with the actual installation. The next step involves collecting real solar energy production data, recording the user’s EV charging consumption, and calculating the value of electricity exported to the grid. All data was collected using a mobile application.
The study comprehensively covers solar energy production, energy consumption, energy exported to the grid, and the integration of the EV charger. Additionally, financial analysis and environmental impact assessments were included. The data used was both realistically obtained from the user and estimated through simulation software. This makes the study novel and unique in its inclusion of such comprehensive and accurate data for a solar system integrated with an EV charger.

5. Conclusions

This study presented the design, implementation, and performance evaluation of a residential solar photovoltaic (PV) system integrated with an electric vehicle (EV) charging in Dublin, Ireland. Unlike many existing works that rely solely on simulation, this case study provides real-world validation through post-installation monitoring and performance analysis.
The results clearly demonstrate the technical and economic viability of solar PV systems under Ireland’s temperate climatic conditions. Approximately 67% of the total energy generated by the PV array was self-consumed by the household, leading to a more than 50% reduction in electricity bills. During the summer of 2024, the homeowner achieved complete grid independence and became a net energy exporter, receiving a €90 credit for surplus energy fed back to the grid. Additionally, the system supported free charging for the resident’s EV, further reducing operational costs and transportation-related emissions. The environmental impact was also noteworthy, with carbon offset benefits equivalent to planting 315 trees.
Beyond energy savings, the project successfully addressed multiple installation and design challenges, including adapting to an irregular-seamed zinc roof and meeting municipal requirements for installing an EV charging pedestal across a public footpath. The combination of OpenSolar simulation, accurate energy yield predictions, and advanced energy monitoring via mobile platforms played a critical role in ensuring optimal system performance. Notably, actual energy generation exceeded simulation estimates, reinforcing the system’s robustness and efficiency under real-world conditions.
This case study contributes to the growing body of empirical research on integrated PV–EV systems, particularly in regions with moderate solar availability. It illustrates the potential for residential renewable energy systems to improve energy self-sufficiency, reduce grid dependency, and contribute to national decarbonization targets.
Looking ahead, future studies should explore the integration of hybrid solar–wind systems to enhance system reliability and seasonal performance, particularly during Ireland’s cloudier months. Additionally, testing similar systems under varying climatic and urban conditions could provide insights into broader scalability. Advances in predictive analytics and dynamic control algorithms are expected to further optimize energy dispatch and user interaction, improving overall system intelligence. Continued investment, policy support, and technological innovation will be essential to unlocking the full potential of decentralized renewable energy solutions across residential sectors.

Author Contributions

Conceptualization, M.A. and M.P.; methodology, M.A. and M.P.; software, M.A. and M.P.; validation, M.A. and M.P.; formal analysis, M.A.; investigation, M.A.; resources, M.P.; data curation, M.A.; writing—original draft preparation, M.A.; writing—review and editing, M.A. and M.P.; visualization, M.A.; supervision, B.Y.; project administration, M.A. and M.P. All authors have read and agreed to the published version of the manuscript.

Funding

This research received no external funding.

Institutional Review Board Statement

Not applicable.

Informed Consent Statement

Not applicable.

Data Availability Statement

The original contributions presented in this study are included in the article. Further inquiries can be directed to the corresponding author.

Acknowledgments

Special thanks to Morgan Pierce, CEO of SolarSmart Energy Ltd., for her invaluable assistance in conducting this research. Mohammed Albaba would also like to express appreciation to the Head of PV Engineering, Darren Doyle, and the entire team for their cooperation in every possible way. In addition, Albaba thanks Marcin Grzybowski for his enthusiastic participation that made this research possible, and whose solar system served as a case study for this article, as it was implemented by the company. This work is related to the PhD thesis of Mohammed Albaba.

Conflicts of Interest

Author Morgan Pierce was employed by the company SolarSmart Energy Ltd. The remaining authors declare that the research was conducted in the absence of any commercial or financial relationships that could be construed as a potential conflict of interest.

References

  1. Vamsi, U.; SaiKrishna, C.; Swapna, G. PV based bidirectional converter for various DC loads and EV battery charging. In Proceedings of the 2022 IEEE 2nd Mysore Sub Section International Conference (MysuruCon), Mysuru, India, 16–17 October 2022; pp. 1–7. [Google Scholar] [CrossRef]
  2. International Energy Agency (IEA). Solar PV. Available online: https://www.iea.org/energy-system/renewables/solar-pv (accessed on 26 October 2024).
  3. Come Zebra, E.I.; van der Windt, H.J.; Nhumaio, G.; Faaij, A.P.C. A review of hybrid renewable energy systems in mini-grids for off-grid electrification in developing countries. Renew. Sustain. Energy Rev. 2021, 144, 111036. [Google Scholar] [CrossRef]
  4. Østergaard, P.A.; Duic, N.; Noorollahi, Y.; Mikulcic, H.; Kalogirou, S. Sustainable development using renewable energy technology. Renew. Energy 2020, 146, 2430–2437. [Google Scholar] [CrossRef]
  5. Berna-Escriche, C.; Vargas-Salgado, C.; Alfonso-Solar, D.; Escriv´a-Castells, A. Can a fully renewable system with storage cost-effectively cover the total demand of a big scale standalone grid? Analysis of three scenarios applied to the Grand Canary Island, Spain by 2040. J. Energy Storage 2022, 52, 104774. [Google Scholar] [CrossRef]
  6. Seljak, T.; Baleta, J.; Mikulčić, H. Integration of energy systems, circular economy and efficiency measures. Clean. Chem. Eng. 2023, 5, 100088. [Google Scholar] [CrossRef]
  7. Vargas-Salgado, C.; Díaz-Bello, D.; Alfonso-Solar, D.; Lara-Vargas, F. Validations of HOMER and SAM tools in predicting energy flows and economic analysis for renewable systems: Comparison to a real-world system result. Sustain. Energy Technol. Assess. 2024, 69, 103896. [Google Scholar] [CrossRef]
  8. Jaidass, N.; Krishna Moorthi, C.; Mohan Babu, A.; Reddi Babu, M. Luminescence properties of Dy3+ doped lithium zinc borosilicate glasses for photonic applications. Heliyon 2018, 4, e00555. [Google Scholar] [CrossRef]
  9. Spandana, K.; Rao, V.R.S. Internet of Things (Iot) Based smart water quality monitoring system. Int. J. Eng. Technol. 2018, 7, 259–262. [Google Scholar] [CrossRef]
  10. Kumari, C.U.; Dakshina Murthy, A.S.; Prasanna, B.L.; Prasad Reddy, M.P.; Panigrahy, A.K. An automated detection of heart arrhythmias using machine learning technique: SVM. Mater. Today Proc. 2021, 45, 1393–1398. [Google Scholar] [CrossRef]
  11. Goud, J.S.; Srilatha, R.; Varun Kumar, R.S.; Kumar, T.K.; Khan, U.; Raizah, Z.; Gill, H.S.; Galal, A.M. Role of ternary hybrid nanofluid in the thermal distribution of a dovetail fin with the internal generation of heat. Case Stud. Therm. Eng. 2022, 35, 102113. [Google Scholar] [CrossRef]
  12. Lalitha, G.; Kaliyaperumal, G.; Nijhawan, G.; Praveen; Tyagi, L.K.; Abood, A.S. Integration Challenges and Solutions for Solar-Powered Electric Vehicle Charging Infrastructure: From Panel to Battery. E3S Web Conf. 2024, 505, 02001. [Google Scholar] [CrossRef]
  13. Napoli, G.; Polimeni, A.; Micari, S.; Andaloro, L.; Antonucci, V. Optimal allocation of electric vehicle charging stations in a highway network: Part 1. Methodology and test application. J. Energy Storage 2020, 27, 101102. [Google Scholar] [CrossRef]
  14. Elma, O. A dynamic charging strategy with hybrid fast charging station for electric vehicles. Energy 2020, 202, 117680. [Google Scholar] [CrossRef]
  15. Met Éireann. The Irish Meteorological Service, Monthly Data—Athenry. Available online: https://www.met.ie/climate/available-data/monthly-data (accessed on 4 March 2025).
  16. The Future of Solar Panels in Ireland: Problems, Opportunities and Incentives. 1 December 2023. Available online: https://caldorsolar.ie/caldor-solar-blog/the-future-of-solar-panels-in-ireland-problems-opportunities-and-incentives/ (accessed on 29 October 2024).
  17. The Irish Meteorological Service. Sunshine, Sunshine and Solar Radiation. Available online: https://www.met.ie/climate/what-we-measure/sunshine (accessed on 29 October 2024).
  18. Malone, M. Solar Energy Editor. How Much Roof Space do Solar Panels Need? 17 July 2024. Available online: https://energyefficiency.ie/blog/how-much-roof-space-do-solar-panels-need/ (accessed on 30 October 2024).
  19. SolarSmart Energy Ltd. Available online: https://solarsmart.ie/about-us/ (accessed on 4 August 2025).
  20. OpenSolar. The World’s Leading Solar Design and Proposal Software. Available online: https://www.opensolar.com/ (accessed on 4 August 2024).
  21. Myenergi Products. Available online: https://www.myenergi.com/shop/myenergi-products/ (accessed on 4 September 2024).
  22. Zappi. The Smart EV Charger That Uses Grid Power, The Sun or The Wind. Available online: https://www.myenergi.com/nl/en/zappi-ev-lader/ (accessed on 4 September 2024).
  23. Eddi Product Information. Available online: https://www.myenergi.com/nl/en/product/eddi/ (accessed on 5 September 2024).
  24. Harvi Product Information. Available online: https://www.myenergi.com/product/harvi/ (accessed on 5 September 2024).
  25. The Myenergi App Is Your Central Control Panel and a Must-Have for Anyone Using Our Eco-Smart Products. Available online: https://www.myenergi.com/nl/en/app-energie-monitor/ (accessed on 5 September 2024).
  26. Department of Climate, Energy and the Environment, Government of Ireland. Accelerating Renewable Electricity Taskforce. 2025. Available online: https://www.gov.ie/en/department-of-climate-energy-and-the-environment/publications/accelerating-renewable-electricity-taskforce/ (accessed on 14 August 2025).
  27. Department of Climate, Energy and the Environment, Government of Ireland. Climate Action Plan 2024. 2024. Available online: https://assets.gov.ie/static/documents/climate-action-plan-2024-8ccbde73-e288-4241-8b26-6b4922389f25.pdf (accessed on 21 August 2025).
  28. Sustainable Energy Authority of Ireland. Solar Energy. Available online: https://www.seai.ie/renewable-energy/solar-energy (accessed on 30 October 2024).
  29. Sustainable Energy Authority of Ireland. Solar Electricity Grant. Available online: https://www.seai.ie/grants/home-energy-grants/individual-grants/solar-electricity-grant (accessed on 14 August 2025).
  30. Sustainable Energy Authority of Ireland. Electric Vehicle Home Charger Grant. Available online: https://www.seai.ie/grants/electric-vehicle-grants/electric-vehicle-charging/electric-vehicle-home-charger-grant. (accessed on 14 August 2025).
  31. Department of Climate, Energy and the Environment, Government of Ireland. Micro-Generation. 2023. Available online: https://www.gov.ie/en/department-of-climate-energy-and-the-environment/publications/micro-generation/ (accessed on 14 August 2025).
  32. Department of Housing, Local Government and Heritage, Government of Ireland. Solar Planning Exemptions. 2022. Available online: https://www.gov.ie/en/department-of-housing-local-government-and-heritage/publications/solar-planning-exemptions/ (accessed on 14 August 2025).
  33. Singla, P.; Boora, S.; Singhal, P.; Mittal, N.; Mittal, V.; Gared, F. Design and simulation of 4 kW solar power-based hybrid EV charging station. Sci. Rep. 2024, 14, 7336. [Google Scholar] [CrossRef]
  34. Soczówka, P.; Lasota, M.; Franke, P.; Żochowska, R. Method of Determining New Locations for Electric Vehicle Charging Stations Using GIS Tools. Energies 2024, 17, 4546. [Google Scholar] [CrossRef]
  35. Shafiq, A.; Iqbal, S.; Rehman, A.U.; Elbarbary, Z.M.S.; Kotb, H.; Selim, A.; Kamel, S. Integration of solar based charging station in power distribution network and charging scheduling of EVs. Front. Energy Res. 2023, 11, 1086793. [Google Scholar] [CrossRef]
  36. Bi, H.; Gu, Y.; Lu, F.; Mahreen, S. Site selection of electric vehicle charging station expansion based on GIS-FAHP-MABAC. J. Clean. Prod. 2025, 507, 145557. [Google Scholar] [CrossRef]
  37. Mhana, K.H.; Awad, H.A. An ideal location selection of electric vehicle charging stations: Employment of integrated analytical hierarchy process with geographical information system. Sustain. Cities Soc. 2024, 107, 105456. [Google Scholar] [CrossRef]
  38. Kassem, Y.; Gokcekus, H.; Aljatlawe, A. Utilization of Solar Energy for Electric Vehicle Charging and the Energy Consumption of Residential Buildings in Northern Cyprus: A Case Study. Eng. Technol. Appl. Sci. Res. 2023, 13, 11598–11607. [Google Scholar] [CrossRef]
  39. Gönül, Ö.; Duman, A.C.; Güler, Ö. A comprehensive framework for electric vehicle charging station siting along highways using weighted sum method. Renew. Sustain. Energy Rev. 2024, 199, 114455. [Google Scholar] [CrossRef]
  40. Patel, M.K.; Mathur, M.; Sharma, S. Modelling and Simulation of Solar Pv & Csp Based E.V Charging Station. Int. J. Technol. Res. Eng. 2021, 8, 4. [Google Scholar]
  41. Zhao, H.; Gao, J.; Cheng, X. Electric Vehicle Solar Charging Station Siting Study Based on GIS and Multi-Criteria Decision-Making: A Case Study of China. Sustainability 2023, 15, 10967. [Google Scholar] [CrossRef]
  42. Fretzen, U.; Ansarin, M.; Brandt, T. Temporal city-scale matching of solar photovoltaic generation and electric vehicle charging. Appl. Energy 2021, 282, 116160. [Google Scholar] [CrossRef]
  43. Zhang, Y.; Teoh, B.K.; Zhang, L. Integrated Bayesian networks with GIS for electric vehicles charging site selection. J. Clean. Prod. 2022, 344, 131049. [Google Scholar] [CrossRef]
  44. Ji, D.; Lv, M.; Yang, J.; Yi, W. Optimizing the Locations and Sizes of Solar Assisted Electric Vehicle Charging Stations in an Urban Area. IEEE Access 2020, 8, 112772–112782. [Google Scholar] [CrossRef]
  45. Kong, Z.; Cui, N.; Li, P. Energy management strategy coordinating lithium-ion battery and ultra-capacitor for electric vehicle. In Proceedings of the 2017 36th Chinese Control Conference (CCC), Dalian, China, 26–28 July 2017; pp. 9291–9296. [Google Scholar] [CrossRef]
  46. Fathabadi, H. Novel solar powered electric vehicle charging station with the capability of vehicle-to-grid. Sol. Energy 2017, 142, 136–143. [Google Scholar] [CrossRef]
  47. Mouli, G.R.C.; Bauer, P.; Zeman, M. System design for a solar powered electric vehicle charging station for workplaces. Appl. Energy 2016, 168, 434–443. [Google Scholar] [CrossRef]
  48. Nunes, P.; Figueiredo, R.; Brito, M.C. The use of parking lots to solar-charge electric vehicles. Renew. Sustain. Energy Rev. 2016, 66, 679–693. [Google Scholar] [CrossRef]
  49. Solar Resource Map, Photovoltaic Electricity Potential, Ireland. Available online: https://solargis.com/resources/free-maps-and-gis-data?locality=ireland (accessed on 10 September 2024).
  50. OpenSolar Support, Featured Figures in the Proposal, Technical Metrics. Available online: https://support.opensolar.com/hc/en-us/articles/13092835119759-Featured-Figures-in-the-Proposal (accessed on 11 August 2025).
  51. Jinko Solar. Tiger Neo N-type 54HL4R-B 425-445 Watt Datasheet, JKM435N-54HL4R-B Solar Panel. Available online: www.jinkosolar.com (accessed on 4 October 2024).
  52. Hybrid Inverter SOFAR HYD-Series 3-4.6 kW 1-Phase. Available online: https://www.effekta.com/en/produkt/hybrid-inverter-sofar-hyd-series-3-4-6-kw-1-phase/ (accessed on 4 October 2024).
  53. WeCo Batteries, 5K3-XP Dual Voltage Modules. Available online: https://wecobatteries.com/dual-voltage/ (accessed on 4 October 2024).
  54. MG MG4 Electric 64 kWh. Available online: https://ev-database.org/car/1708/MG-MG4-Electric-64-kWh (accessed on 5 October 2024).
  55. What Are the Zappi Charging Modes? © MYENERGI LTD 2024—Registration No. 10261262—VAT No. GB248171011. Available online: https://support.myenergi.com/hc/en-gb/articles/360020720298-What-are-the-zappi-charging-modes (accessed on 5 October 2024).
  56. Official Journal of the European Union. Directive 2012/19/EU of the European Parliament and of the Council of 4 July 2012 on Waste Electrical and Electronic Equipment (WEEE). 2012. Available online: https://eur-lex.europa.eu/legal-content/EN/TXT/?uri=CELEX:32012L0019 (accessed on 16 August 2025).
  57. Official Journal of the European Union. Regulation (EU) 2023/1542 of the European Parliament and of the Council of 12 July 2023 Concerning Batteries and Waste Batteries. 2023. Available online: https://eur-lex.europa.eu/legal-content/EN/TXT/?uri=CELEX%3A32023R1542 (accessed on 16 August 2025).
  58. The Irish Meteorological Service, Met Éireann. Climate Statement for July 2024. 2024. Available online: https://www.met.ie/climate-statement-for-july-2024 (accessed on 19 August 2025).
  59. EN 50160; Voltage Characteristics of Electricity Supplied by Public Distribution Networks. CENELEC: Brussels, Belgium, 2010.
  60. Walsh, S. ESB Networks, Company Standards, Conditions Governing Connection to the Distribution System, Network Assets, DTIS-250701-BDW, V2. 2019. Available online: https://www.esbnetworks.ie/docs/default-source/publications/conditions-governing-connection-to-the-distribution-system.pdf (accessed on 15 August 2025).
  61. ESB Networks, Distribution Code, Distribution System Operator, ESB Networks DAC, V8. 2023. Available online: https://www.esbnetworks.ie/docs/default-source/publications/distribution-code-version-8.pdf (accessed on 15 August 2025).
  62. Markiewicz, H.; Klajn, A. Standard EN 50160: Voltage Characteristics of Public Distribution Systems. 2021. Available online: https://powerquality.blog/2021/07/22/standard-en-50160-voltage-characteristics-of-public-distribution-systems/ (accessed on 15 August 2025).
  63. ESB Networks, Sustainability, “ESB Networks announces 100,000 microgenerators are now connected to Ireland’s electricity network”. 2024. Available online: https://www.esbnetworks.ie/about-us/newsroom/article/esb-networks-announces-100-000-microgenerators-are-now-connected-to-ireland-s-electricity-network#:~:text=ESB%20Networks%20has%20today%20announced,energy%20onto%20Ireland's%20power%20system (accessed on 15 August 2025).
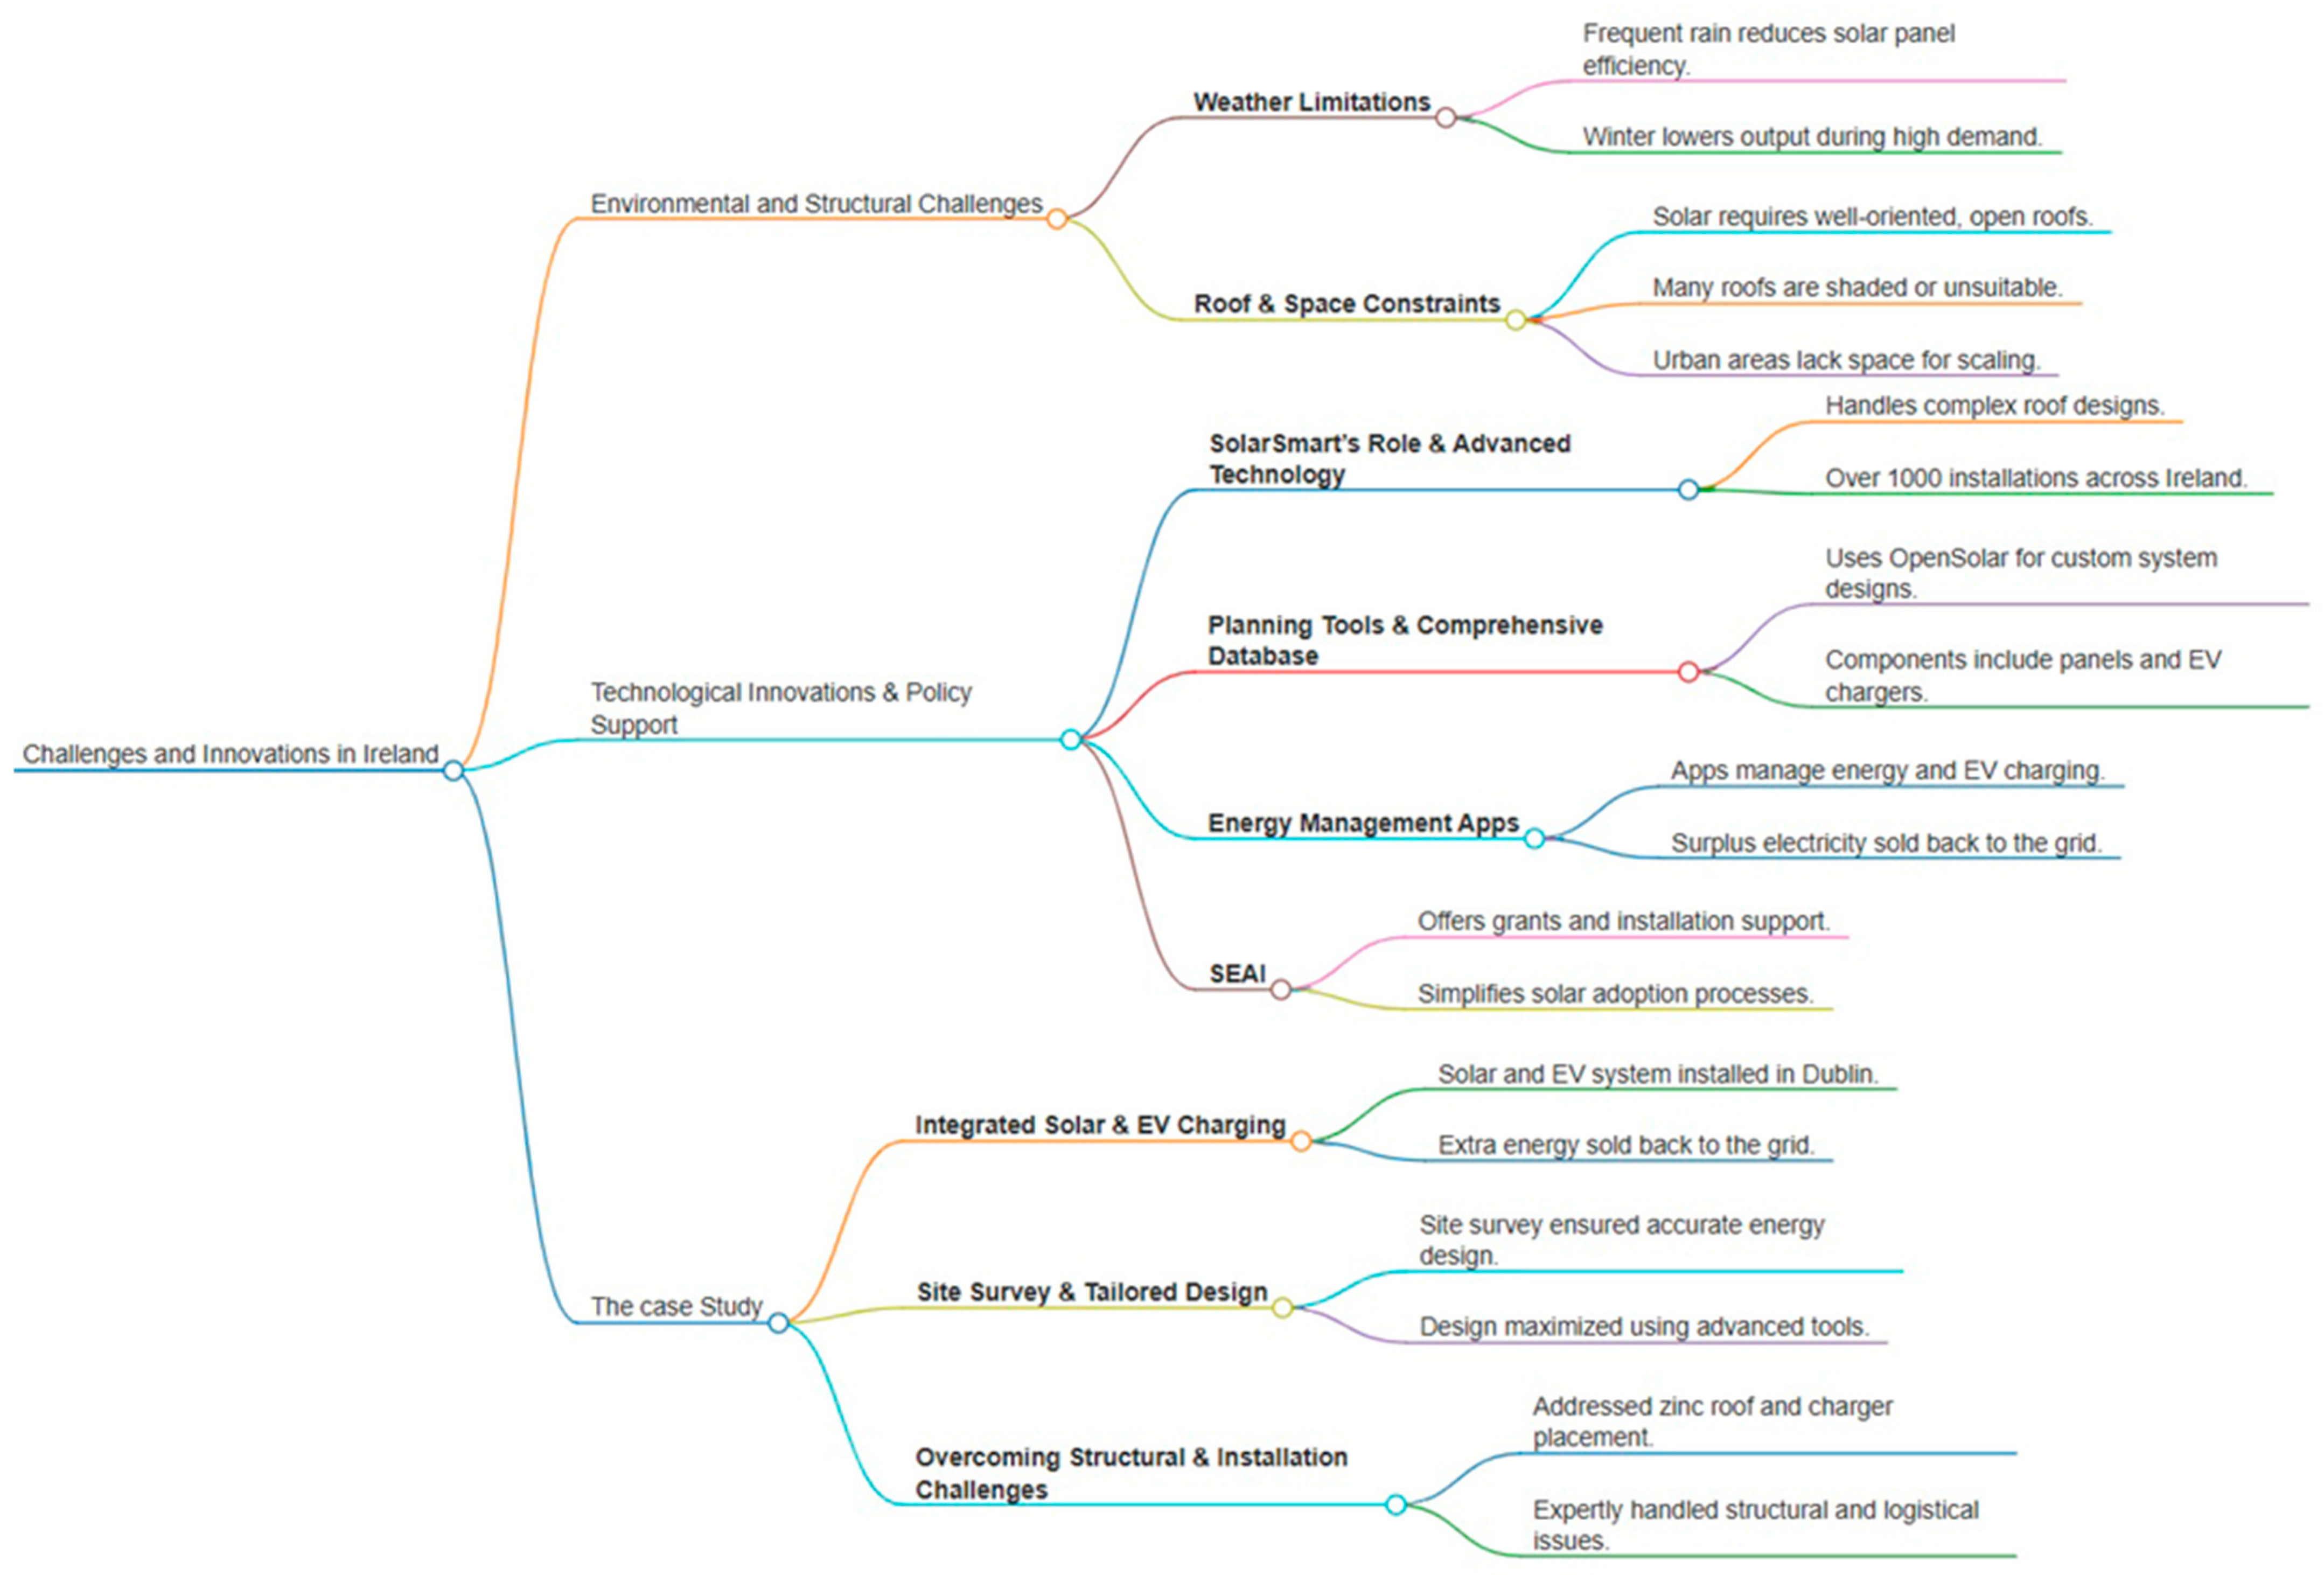
Figure 1. Ireland’s challenges, innovations, and the case study.
Sustainability 17 09447 g001
Figure 2. Photovoltaic power potential in Ireland. This map is published by the World Bank Group, funded by ESMAP, and prepared by Solargis. For more information and terms of use, please visit http://globalsolaratlas.info (accessed on 10 September 2024) [49].
Sustainability 17 09447 g002
Figure 3. The location is in the peninsula in north County Dublin, Ireland.
Sustainability 17 09447 g003
Figure 4. Average monthly on-site solar generation.
Sustainability 17 09447 g004
Figure 5. Operating modes of the installed solar system (generating excess power, partially offset usage, night), orange indicates in service components, and gray indicates out of service components.
Sustainability 17 09447 g005
Figure 6. Installed dual-array solar system distributed on front and rear roof of house: (a) solar panel distribution, (b) front view, (c) top view.
Sustainability 17 09447 g006
Figure 7. SoFar type inverter model.
Sustainability 17 09447 g007
Figure 8. WeCo type battery model.
Sustainability 17 09447 g008
Figure 9. MG4 electric vehicle with type 2 charging port.
Sustainability 17 09447 g009
Figure 10. Zappi EV charger.
Sustainability 17 09447 g010
Figure 11. Real-time solar system values.
Sustainability 17 09447 g011
Figure 12. Myenergi mobile application interface.
Sustainability 17 09447 g012
Figure 13. Energy consumption for the month of July 2024.
Sustainability 17 09447 g013
Figure 14. Solar power generation for the month of July 2024.
Sustainability 17 09447 g014
Figure 15. Imported and exported energy from and to the grid for the month of July 2024.
Sustainability 17 09447 g015
Figure 16. Consumed energy for the month of July 2024.
Sustainability 17 09447 g016
Figure 17. Consumed energy and solar generation for one day in July 2024.
Sustainability 17 09447 g017
Figure 18. Electric vehicle charging sessions.
Sustainability 17 09447 g018
Figure 19. Bill savings for the first year every second month.
Sustainability 17 09447 g019
Figure 20. Cumulative savings from going solar.
Sustainability 17 09447 g020
Figure 21. The relation between the actual and predicted solar generation.
Sustainability 17 09447 g021
Table 1. Monthly values for Dublin for the year 2024.
MonthGlobal Solar RadiationMean TemperatureTotal Rainfall
January7648561.3
February13,0957.374.3
March22,9727115.4
April39,4268.570.2
May49,2221336.8
June54,88213.130.4
July49,80214.937.7
August44,92315.436.6
September28,07612.259.6
October19,00011.347.8
November70678.154.2
December50997.245.7
Annual341,21210.3670
Table 2. The customer’s electric consumption.
MonthDaily Electricity
Consumption (kWh)
Electricity Consumption Every Second Month (kWh)
January22.61382
February24.4
March21.91255
April19.2
May16.61002
June16.3
July15.3936
August14.9
September171078
October18.3
November21.61347
December22.5
Table 3. Jinko solar Tiger 435 N-type specifications [51].
Nominal maximum power435 (W)
Maximum power voltage (Vmp)32.78 (V)
Maximum power current (Imp)13.27 (A)
Open-circuit voltage (Voc)39.36 (V)
Short-circuit current (Isc)13.72 (A)
Table 4. SoFar hybrid inverter specifications [52].
Rated output power4 (kW)
Rated output voltage230 (V)
Efficiency97.2%
Number of MPPTs2
Table 5. WeCo 5K3-XP specifications [53].
Nominal voltage51.2 (V)
Total energy5.3 (kWh)
Max continuous power5.72 (kW)
Efficiency90%
Table 6. Zappi EV charger specifications [22].
Rater power7 (kW) (1-phase)
Rated supply voltage230 (V)
Rated current32 (A)
Protection degreeIP65 (weatherproof)
Table 7. Predicted solar energy performance (kWh).
Every 2nd MonthSolar GenerationElectricity Imported After SolarElectricity Exported After Solar
Jan-Feb29310941
Mar-Apr877581183
May-Jun1410207588
Jul-Aug1262196496
Sep-Oct64954193
Nov-Dec21411350
Table 8. EV charging session using Zappi, manufactured by myenergi GB Ltd in Lincolnshire, UK.
Day of the WeekDateTime of DayCharging Hour (kWh)
Saturday6 July 2024~11:45–14:5017.6
Friday12 July 2024~23:30–00:002
Saturday13 July 2024~00:00–05:3038.4
Friday19 July 2024~13:55–15:157.8
Sunday21 July 2024~23:20–00:004
Monday22 July 2024~00:55–05:0026.7
Saturday27 July 2024~13:45–15:159.4
Table 9. Electricity bill savings (€).
Every 2nd MonthUtility Bill Before
Solar
Utility Bill After
Solar
Estimated Savings
January–February805653153
March–April741340402
May–June60762545
July–August57463510
September–October647340307
November–December790677112
Average694356338
Table 10. A comparison between other studies.
StudyMethodologyStrengthsWeaknesses
33Design and simulation of a 4 kW
solar power-based hybrid EV
charging station using MATLAB and PVsyst. The system uses a three-stage charging strategy with a solar PV, battery bank, and grid
connection.
-
Provides uninterrupted EV charging using solar and battery storage.
-
Reduces reliance on fossil fuels and grid overload.
-
Effective power management through bidirectional inverter and buck/boost converter.
-
Capable of exporting surplus power to the grid.
-
No practical implementation or actual values for solargenerated, consumed, and exported power.
-
Did not include a detailed financial analysis, environmental impact, or mobile application.
-
The P&O algorithm may fail under partially shaded conditions.
35Designed and optimized a solar-based EV charging station using HOMER Grid and Helioscope
software. The system includes a 150 kW PV system, a 118 kW converter, and six charging slots. Analyzed cost, power production, and
scheduling.
-
High efficiency and costeffectiveness.
-
Produces 254,030 kWh/year, with 86.7% of the energy sold back to the grid.
-
Reduces energy cost from $0.20/kWh to $0.016/kWh.
-
Environmental benefits by reducing CO2 emissions from 20,430 kg/yr to 1676 kg/yr.
-
No practical implementation or reallife data for generated, consumed, and exported power.
-
Did not include an actual EV charger or battery storage system.
-
Lacks a mobile application.
38Case study on the use of solar
energy for EV charging and
residential energy needs in
Northern Cyprus. Evaluated solar radiation data from NASA and used RETScreen for technical and
economic analysis.
Focused on GÜNSEL B9 and J9
electric vehicles.
-
High solar radiation levels make Northern Cyprus ideal for solarbased charging.
-
Demonstrates technical and economic feasibility of integrating solar PV with EV charging and home energy use.
-
Shows potential for energy independence and reduced carbon emissions.
-
No actual values for generated, consumed, and exported power.
-
No real EV charger or battery storage system installed.
-
Lacked detailed financial analysis, environmental impact assessment, and mobile application integration.
47A MATLAB simulation model was developed using weather data from the Dutch Meteorological Institute to estimate PV output. EV charging was simulated with both fixed and variable profiles to align with PV generation. Grid dependence and the role of battery storage were
assessed, along with financial and
environmental impacts.
-
Identified optimal tilt angle (28°) for PV panels in the Netherlands.
-
Found that oversizing PV array by 30% results in only 3.2% energy loss.
-
Gaussian charging profile closely follows PV generation, minimizing grid exchange.
-
A 10 kWh battery reduces grid exchange by 25%, improving selfconsumption of solar power.
-
Financial gain of €207.5/year from tracking systems, though high costs reduce feasibility.
-
No practical operational data; findings based purely on simulation.
-
Seasonal variation still requires grid support in winter.
-
Tracking systems are economically unattractive due to high installation costs.
-
No mention of mobile application for system control or monitoring.
Disclaimer/Publisher’s Note: The statements, opinions and data contained in all publications are solely those of the individual author(s) and contributor(s) and not of MDPI and/or the editor(s). MDPI and/or the editor(s) disclaim responsibility for any injury to people or property resulting from any ideas, methods, instructions or products referred to in the content.