Abstract
There is a growing demand for industrial materials that claim environmental attributes based on life cycle thinking. To track and manage such environmental attributes, Chain of custody (CoC) models are growingly applied. Among CoC models, the mass balance model–credit method (MB-CR) and book and claim (B&C) model implement non-proportional allocation of environmental attributes. Though there is a case that applying these models could avoid additional environmental burdens that would otherwise occur, the eligibility of applying non-proportional allocation requires careful consideration. This study aims to clarify the requirement and limitation for applying MB-CR and B&C models and to justify the cases of applying those models. A key requirement is environmental rationality, defined as the ability to contribute to avoiding additional environmental burdens, particularly during transition phases where the target environmental attribute is not abundant. A key limitation is technical feasibility, which constrains allocation within what is physically achievable for industrial materials. This study contributes to establishing a scientifically grounded and systematically structured methodology for non-proportional allocation of environmental attributes. Applying MB-CR and B&C models under the requirement and limitation ensures that the non-proportional allocation aligns with the avoidance of environmental burden while maintaining credibility, transparency, and feasibility in environmental claims of industrial materials.
1. Introduction
Recently, there has been an increasing demand for industrial materials and products that claim environmental attributes based on life cycle thinking, such as the use of recycled materials, biomass-based inputs, and sustainably managed resources. Such environmental attributes are tracked and managed throughout the supply chain, and Chain of custody (CoC) models are growingly applied to ensure the traceability of the environmental attributes [1,2]. CoC refers to one of the traceability schemes that transfers, monitors, and controls inputs, outputs, and related information across all stages of the supply chain, from upstream to downstream [3]. Historically, various standards, certifications, and industry organizations have established different CoC models. In 2020, ISO 22095 was published, providing a unified definition of CoC models and terminology [4].
ISO 22095 classifies CoC into five models based on the types of input and the degree of alignment between physical flow associated with the input of raw material and informational flow associated with the input of specified characteristics. These five models include the identity preserved (IP) model, segregated (SG) model, controlled blending (CB) model, mass balance (MB) model, and book and claim (B&C) model [4]. Figure 1 illustrates the conceptual images of those models. The IP model is applied when “the materials or products originate from a single source and their specified characteristics are maintained throughout the supply chain” [4] (Figure 1a). When “specified characteristics of a material or product are maintained from the initial input to the final output” [5], i.e., when the multiple sources of input share the same specified characteristics, the SG model is used (Figure 1b). In both the IP and SG models, inputs without such specified characteristics cannot be mixed at any stage of the supply chain. Consequently, the physical and informational flows remain fully aligned from input to final output. The CB model is applied when “materials or products with a set of specified characteristics are mixed according to certain criteria with materials or products without that set of characteristics resulting in a known proportion of the specified characteristics in the final output” [4]. In this model, the ratio of inputs with and without the specified characteristics remains constant, ensuring that physical and informational flows also remain aligned (Figure 1c). The MB model is similar to the CB model in that the inputs with and without the specified characteristics are mixed. However, under the MB model, “the proportion of the input with specified characteristics might only match the initial proportions on average and will typically vary across different outputs” [4]. ISO 22095 defines two implementation methods for the MB model: the rolling average percentage (MB-RA) method and credit (MB-CR) method. The MB-RA method is applied when the ratio of inputs fluctuates over time, with the output reflecting the average proportion of specified characteristics over a defined period (Figure 1d). This means that the specified characteristics are proportionally allocated among outputs. In contrast, under the MB-CR method, specified characteristics may be non-proportionally allocated among outputs (Figure 1e). In both implementation methods, alignment between physical and informational flows is lost, i.e., the two flows are decoupled at the point of allocation. The B&C model operates based on the trading of credits or certifications. Under this model, the informational flow of the specified characteristic may be decoupled from the physical flow of raw materials and is instead derived from an entirely separate system (Figure 1f). This allows the specified characteristic to be non-proportionally allocated to outputs, regardless of its physical composition. As a result, the physical and informational flows do not align at any stage of the supply chain. These CoC models and their respective implementation methods are summarized in Table 1, which differentiates them based on the origin of inputs, whether different types of inputs are mixed, the alignment of physical and informational flows, and the allocation method of specified characteristics.
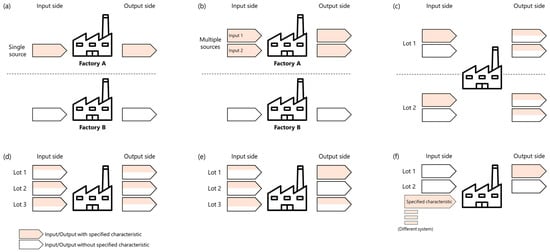
Figure 1.
Conceptual images of Chain of Custody (CoC) models. (a) Identity preserved (IP) model, (b) segregated (SG) model, (c) controlled blending (CB) model, (d) mass balance model rolling average percentage (MB-RA) method, (e) mass balance model credit (MB-CR) method, and (f) book and claim (B&C) model.

Table 1.
Summary of CoC models.
When describing the environmental attributes of industrial materials using CoC models, these attributes are regarded as specified characteristics, and MB and B&C models are growingly applied [2]. Here, the primary motivation for using MB and B&C models is that applying these models can help maintain process efficiency and consequently avoid additional environmental burdens that would otherwise occur [6]. However, currently, MB-CR and B&C models are widely applied under the interpretations that “specified characteristics can be decoupled from the product and later assigned as information” or “specified characteristics can be freely allocated”. In addition, the actual environmental burdens that are supposed to be avoided by applying these models are not sufficiently discussed. Here, the validity of decoupling physical and informational flows and non-proportional allocation of environmental attributes has not been fully evaluated. As a result, environmental claims divergent from reality, which could be considered greenwashing, are being made. It also raises doubts as to whether applying the MB-CR and B&C models will actually contribute to the avoidance of additional environmental burdens. In this regard, there should be clear cases where applying CoC models with the non-proportional allocation of environmental attributes as MB-CR or B&C models is appropriate and where it is not, yet the criteria for distinguishing between the two cases have not been clearly defined. In other words, a requirement for applying the non-proportional allocation of environmental attributes should be established. Additionally, to avoid unregulated and misleading environmental claims, a limitation should be imposed on non-proportional allocation of environmental attributes.
Therefore, this study aims to clarify the requirement and limitation where non-proportional allocation of environmental attributes is applied to industrial materials. Section 2 defines the requirement for applying for a non-proportional allocation as well as the limitation imposed on such an allocation. Section 3 examines industrial examples of applying for the non-proportional allocation in terms of the requirement and limitation to discuss the eligibility of applying for non-proportional allocation. Section 4 discusses the applicability of CoC models with non-proportional allocation and their distinction.
2. Methods
2.1. Requirement for Applying Non-Proportional Allocation of Environmental Attributes
If the additional environmental burden could be avoided by applying the MB-CR or B&C models, the use of these models would not be denied. Moreover, in some cases, a specific environmental attribute embedded in materials or products adds economic value to them. For instance, a material with certain environmental attributes may command higher prices in the market. If the MB-CR or B&C models can be applied to the material, the producers and fabricators of the material can claim the environmental attributes without changing or modifying the present processes. Such a flexible accounting method can provide both environmental and economic benefits to the entity. Given this, it is not surprising that cases of non-proportional allocation of environmental attributes have increased, particularly when environmental attributes are economically valuable.
On the other hand, ISO-compliant Life Cycle Assessment (LCA) principles recommend avoiding allocation of inputs among outputs, and in cases where allocation is unavoidable, proportional allocation is required [7]. If an environmental claim of an industrial material is made based on ISO-compliant LCA, only the IP, SG, CB, and MB-RA models can be used for the accounting of environmental attributes. Here, for instance, if the IP or SG model is applied for an industrial material, inputs with an environmental attribute should be physically separated from those without such an attribute throughout the supply chain. This requires strict control and management of inputs, which often involve duplication of dedicated production assets [8]. For complex and large-scale industries such as chemicals, duplicating production assets may result in significant economic losses [6,9]. Similarly, in cases where inputs require specialized storage environments, such as highly reactive metals or chemical substances, additional energy consumption for duplicating storage conditions becomes necessary [10,11]. Furthermore, if a single production asset is used for both inputs with and without an environmental attribute, the timing of using inputs should be strictly controlled to avoid the mixture of the inputs. However, completely switching between the inputs reduces production efficiency and requires extended operating hours to maintain the same output level. These cases can also lead to increased environmental burdens. Therefore, for industrial materials, applying the IP or SG models may not be realistic.
If the CB model is applied, inputs with and without environmental attributes can be mixed. However, the ratio of mixing should always remain constant throughout the supply chain. In the production of industrial materials, the ratio between inputs is often adjusted dynamically to optimize production efficiency based on the quality of inputs and the condition of the reaction between inputs [12,13]. Therefore, maintaining a constant mixing ratio of inputs under the CB model could reduce production efficiency, which would lead to higher energy and resource consumption. Consequently, environmental burdens associated with the process would become larger. In the MB-RA model, environmental attributes are proportionally allocated based on the rolling average of inputs over a specific period. While this model avoids efficiency losses which may be caused by the CB model, it does not offer flexibility beyond averaging in accounting of environmental attributes. As a result, the MB-RA model may not contribute to avoiding additional environmental burdens in certain cases.
As demonstrated above, the use of proportional allocation may, in some cases, increase environmental burdens rather than avoid them. In such cases, applying non-proportional allocation such as the MB-CR or B&C models can avoid additional environmental burdens. Therefore, the application of models with non-proportional allocations is justified when the allocation is environmentally rational. In other words, if the environmental rationality of applying the non-proportional allocation is demonstrated, the MB-CR or B&C models can be applied. Thus, environmental rationality is a key requirement for applying the models with non-proportional allocation. Here, examples of a quantitative indicator for environmental rationality would be greenhouse gas (GHG) emissions, recycled content (RC), and end-of-life recycling rate (EoL-RR). These indicators can be demonstrated based on, e.g., LCA results. Specific situations where the environmental rationality exists will be shown in Section 3.1.
2.2. Limitation on Non-Proportional Allocation of Environmental Attributes
Applying unrestricted non-proportional allocation of environmental attributes would lead to overstated environmental claims, which could be regarded as green washing. Tabrizi et al. (2021) argues that limitations should be placed on such claims when applying the MB model [14]. Additionally, in cases where the proportion of inputs with the specified characteristic can be analytically determined, Schyns et al. (2022) suggests that claims should be based on analytical results rather than allocation-based calculations [15]. Further, Finkbeiner et al. (2025) pointed out that the claims made under the MB-CR and B&C models are completely different from the conventional LCA result, which aims to analyze environmental impacts of a product [16]. While discussions which criticize the application of non-proportional allocation exist, there has been no systematic or concrete examination of the limitations that should be imposed on the non-proportional allocation.
As discussed in Section 2.1, applying non-proportional allocation of environmental attributes could avoid additional environmental burdens that arise when physical and informational flows are aligned. However, non-proportional allocation is only an accounting method, and it does not introduce new innovations, nor does it fundamentally transform the industrial process or create novel products that did not previously exist. This implies that claims made under non-proportional allocation should be restricted to what is technically feasible within the limitation for the inputs and processes involved. Based on this principle, two perspectives define the scope of technical feasibility as the limitation on non-proportional allocation:
Can the environmental attribute be assigned to the inputs and outputs in the first place?
If the attribute can be assigned, can it be freely allocated at any proportion?
Using these perspectives, the technically feasible range of non-proportional allocation is individually determined for each environmental attribute and each input/output. Section 3.2 will further elaborate on this limitation with specific examples.
2.3. Summary of the Requirement and Limitation for Non-Proportional Allocation
In Section 2.1, we established that environmental rationality is a key requirement for applying non-proportional allocation of environmental attributes. Moreover, in Section 2.2, the limitation for the non-proportional allocation was that the allocation should be within technically feasible limits. The requirement and limitation related to environmental rationality and technical feasibility are summarized in Table 2.
Table 2.
Summary of requirement and limitation for non-proportional allocation of environmental attributes.
3. Results
3.1. Examples of Environmental Rationality
In this section, we present some examples of the situation where applying CoC models with the non-proportional allocation is environmentally rational. First, examples for the MB-CR model are described focusing on the industrial materials containing secondary raw materials.
Chemical product with chemically recycled input
Fossil-based input and recycled input which are derived from the chemical recycling process, including pyrolysis of waste plastics, can be used as raw materials for petroleum or chemical products. This is because products produced from fossil-based and chemically recycled inputs are typically identical [6,9]. If a producer of the chemical product is required to certify that the product is composed of the recycled input without applying the non-proportional allocation, a separate and redundant asset would need to be constructed, including many reactors and storage tanks for refinery, cracking, and polymerization lines, which would result in surplus environmental impact due to inefficiency of the processes and take decades to construct [6]. Here, using the MB-CR model can help avoid additional environmental burdens that would otherwise occur for duplicating the assets.
Metal product with scrap
The proportion of secondary resources, i.e., scrap, in a metal is expressed as recycled content (RC), which serves as an indicator of circularity in material fabrication and product manufacturing [17]. Sometimes certain products require a minimum RC level for materials and components [18]. Consider a case where the RC is required to be 30% for a specific metal used in a specific product. However, the local supply of scrap around the fabrication site is limited, and the RC of the metal can only be 5%. To achieve 30% of the RC, the fabricator of the metal sources scrap from surrounding and distant regions, which requires transportation of the scrap and increases associated environmental burdens. If the MB-CR model is applied here, the fabricator can allocate the locally available amount of scrap across outputs. It means that a part of the metal can be assigned to 30% of RC without scrap transportation. Further, if the market recognizes higher RC as a value-added attribute, the manufacturer of a product may be willing to pay a premium for the metal with a high RC. Suppose the fabricator commits to reinvesting this premium into sourcing more scrap from the market. Here, it is proved in the macro scale that increasing economic incentives for sourcing of scrap will encourage the recycling industry and consequently improve the collection and recovery of EoL products, i.e., EoL-RR [19,20]. Thus, applying the MB-CR model to the RC of a metal can avoid environmental burdens associated with the transportation of scrap and the final disposal of EoL products.
Second, examples for which the B&C model is applicable are described focusing on Sustainable Aviation Fuels (SAFs) and low-carbon primary aluminum.
Sustainable Aviation Fuels (SAFs)
SAF is primarily derived from biomass-based raw materials and is considered a viable alternative to conventional petroleum-based aviation fuels [21]. SAF is recognized as a key strategy for reducing GHG emissions in the aviation industry [22,23]. However, the current production volume of SAF remains limited, with demand significantly outstripping supply [24]. Additionally, SAF production is geographically concentrated, so long-distance transportation, sometimes marine transportation, from production sites to airports is required [25,26].
Low-carbon primary aluminum
Primary aluminum is produced via electrolytic reduction (smelting) of alumina using the Hall–Héroult process [27]. The strong bond between Al and O in alumina necessitates high energy consumption, with typical electricity requirements of 14 kWh per kg of aluminum [27,28]. As a result, GHG emissions associated with the production of primary aluminum largely depend on the electricity source used for the smelting process [29]. To reduce GHG emissions of primary aluminum, renewable energy (RE)-powered smelting is a preferred option. However, regions with abundant RE are geographically limited [30]. While the long-term strategies aim to expand global RE capacity [31,32,33], in the short- to medium-term, the supply of primary aluminum from RE-powered smelting is constrained to specific regions. Consequently, low-carbon primary aluminum has to be transported over long distances to be used outside its production regions.
In both cases above, the environmental burden caused by long-distance transportation can be avoided by applying the B&C model. What is more important here is that applying the B&C model increases the global accessibility to products with specific environmental attributes, which in turn can stimulate greater demand for such products. As a result, the supply of products with those attributes is incentivized and expands globally, ultimately contributing to avoiding the additional environmental burdens at the global level.
3.2. Examples of Limitation for the Method of Claiming Non-Proportional Allocation
In Section 2.2, we defined two questions which address technical feasibility as the limitation for applying the non-proportional allocation:
Can the environmental attribute be assigned to the inputs and outputs in the first place?
If the attribute can be assigned, can it be freely allocated at any proportion?
These considerations determine the technically feasible range for non-proportional allocation and ensure that the allocation of environmental attributes is eligible. In this section, we explore specific examples to illustrate these limitations, which can be referred to when determining the eligible allocation and associated environmental claims.
As for the former question, two examples come from steelmaking and cement production. They both show inputs that cannot physically constitute the output from the process and cannot be assigned as a part of environmental attributes.
Steelmaking
During the steelmaking processes, coke and iron ore are fed into the blast furnace, where iron ore is reduced into pig iron [34,35]. To reduce GHG emissions and to recycle waste plastics, some steelmakers inject waste plastics into the blast furnace as a reducing agent, alongside coke [36,37,38]. If non-proportional allocation is applied here, an environmental claim like “a portion of this pig iron is derived from waste plastics” is not acceptable, as we can easily imagine. While waste plastics are consumed in the blast furnace, they decompose into CO and H2 within the furnace and only contribute to the reduction reaction of iron ore—it is not technically feasible that they become a component of the pig iron.
Cement production
In the cement production processes, waste tires and waste plastics are used as heat sources in the calcination process [39,40]. However, a claim as a result of non-proportional allocation that “a portion of this cement is derived from waste tires” is not acceptable. It is because, like in steelmaking, waste tires are consumed as fuel, and it is not technically feasible that they become part of the composition of cement.
As for the latter question, two examples come from the steelmaking again and polymers. They show another limitation for the non-proportional allocation in terms of the reaction and process, which impose upper limits on the ratio of input.
Steelmaking (revisited)
In the blast furnace process, in some cases, direct reduced iron (DRI) is used as an iron source alongside iron ore [41]. DRI is produced by reducing iron ore in a shaft furnace mainly by natural gas and is introduced into the ironmaking and steelmaking processes as hot briquetted iron (HBI) [42]. Since HBI has a lower GHG emission intensity than pig iron reduced in a blast furnace [43], mixing HBI into the blast furnace feedstock can reduce coke consumption and lower the overall GHG emissions of pig iron on a weighted-average basis. However, HBI does not contribute to the exothermic reactions required for the operation of a blast furnace [34,44], which means that the operation of the furnace becomes impractical if the ratio of HBI over the total inputs exceeds 30% [45,46]. For instance, consider a case where 10% of the inputs to a blast furnace are HBI. If non-proportional allocation is applied here, it might be possible to claim that some portions of the pig iron contain HBI more than 10%, e.g., 15% or 20%. However, it would not be eligible to claim HBI content over 30%, which is beyond the technical feasibility.
Polymers
Typically, polymers are derived from fossil-based input. Recently, so-called circular polymers are produced partially utilizing chemically recycled monomers which are derived from waste plastics [47,48]. Though polymers produced from fossil-based and recycled inputs are typically identical, some argue that the total volume of recycled input would not be fully allocated in outputs even if the non-proportional allocation was applied [6,9]. They consider yield ratio; the losses during the processes do contain the recycled input, which should be accounted for when applying the non-proportional allocation.
3.3. Decision Tree to Justify Non-Proportional Allocation
We summarized the examples above into a decision tree, in Figure 2, to determine the case where the non-proportional allocation of environmental attributes is justified. It follows the requirement and limitation for the non-proportional allocation. Practitioners can use this decision tree to see whether the non-proportional allocation is applicable and whether the claim is justified.
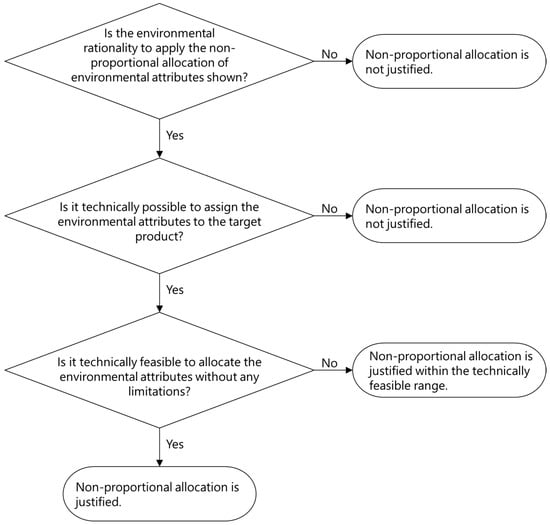
Figure 2.
Decision tree to decide whether the non-proportional allocation is justified.
4. Discussion
4.1. Conditions Where Non-Proportional Allocation Is Applicable: Transition Phase
In the previous section, we discussed the rationality of non-proportional allocation of environmental attributes in cases where demand and supply for an environmental attribute are imbalanced. For example, in the case of secondary resources, when the supply of secondary resources is insufficient while there is high demand for them, and when having a higher proportion of secondary resources in materials is recognized as valuable, non-proportional allocation could be rational. However, once the high ratio of secondary resources becomes the norm, a material with a high RC loses its relative value. For instance, paper and cardboard have some of the most well-developed recycling systems among various materials [49,50,51]. Wastepaper and waste cardboard are routinely collected worldwide [52]. In some countries, most raw materials used in paper production are derived from recycled paper [53,54]. For instance, in Japan, 67% of the paper and cardboard production was coming from recovered waste in 2024 [55]. In 1970, the number, i.e., RC, was low at 34%. To improve the recycling of paper and cardboard and to increase the RC, environmental labeling called “green mark” was introduced in 1981 [56]. The green mark indicates that a paper and cardboard product has a high RC, e.g., 40% for general use, 50% for newsprint and copy paper, and 100% for toilet paper and tissue paper. During the phase where the RC of paper and cardboard was low in the society level, green mark-labeled products attracted the consumers who were eager to promote waste paper recycling. Actually, waste paper recycling has been promoted since then, as mentioned. Thanks to this program, nowadays, paper producers in Japan can easily obtain recycled inputs. The high RC in paper no longer carries special significance, even though it is environmentally important and preferable. In such a situation, non-proportional allocation of RC in paper would never be granted to have the rationality. From this example, non-proportional allocation is rational when the supply of an environmental attribute is insufficient and when there is demand for it. However, once the attribute becomes dominant or abundant, the rationality for non-proportional allocation of the attribute disappears. In other words, non-proportional allocation should be effective only during the transition phase, where non-proportional allocation could be used to accelerate the adoption of an environmental attribute.
During the transition phase, various innovative technologies are developed to facilitate the adoption of the attributes. However, these technologies often face challenges such as technical immaturity, limited scalability, high implementation costs, and uncertainty for success. Compared to such technological solutions, accounting methods such as MB-CR and B&C models offer a lower technological barrier, time- and cost-saving solutions, and lower risks for implementation [6,57]. For businesses, such flexible accounting provides an attractive way to make environmental claims without immediately investing in innovative but costly and risky technological solutions. However, if the convenience of such an accounting method is prioritized over technological solutions, there is a risk that the innovation and technology development needed to actually (physically) achieve environmental claims would be neglected. In terms of GHG emissions, there are some studies which pointed out that companies should not easily rely on carbon credit systems for GHG reductions [58,59,60]. Applying this argument to non-proportional allocation of environmental attributes, it is evident that companies should prioritize technological development and innovation to physically achieve their environmental claims. Even if non-proportional allocation can be applied, it should only be considered a temporary measure until a technological solution is available. Once a viable technological alternative emerges, incentives should be directed toward implementing the new technology, and the rationality of non-proportional allocation should not be accepted further.
4.2. Distinction Between MB Model and B&C Model
The MB-CR model and B&C model have a common feature in that they both implement non-proportional allocation of specified characteristics to outputs. Sometimes, the distinction between these two models remains ambiguous. For instance, ISO 22095 cites renewable electricity as an example of a claim made under the B&C model [4]. Under this example, when a consumer purchases renewable electricity with a certificate, the electricity supplier guarantees that the same amount of electricity is generated from renewable energies or purchased as credits from another generator. However, since the consumer receives electricity from the mixed grid, which includes both renewable and fossil-fuel-powered, the consumed electricity cannot be distinguished. In such case, ISO 22095 recommends to apply the B&C model, when the attribute is intangible and there is an entirely controlled market. On the other hand, Alexander et al. (2021) describe the purchase agreement of renewable electricity under the MB-CR model, despite recognizing that the B&C model may also be applied to the renewable electricity in some cases [6]. It is notable that the same example is categorized under different models depending on the interpretation. This highlights the ambiguity in the distinction between the MB-CR and B&C models. However, they can be clearly distinguished in how the alignment of physical and informational flows is maintained between input and output. As summarized in Table 1, under the MB-CR model, the physical and informational flows are aligned only on the input side. The two flows are decoupled on the output side as the result of non-proportional allocation of the specified characteristic. On the other hand, under the B&C model, the two flows are not aligned on either the input or output sides throughout the entire supply chain.
Given that the MB-CR and B&C models exhibit different alignments of the flows, their requirements for application to accounting of environmental attributes also differ. Under the MB-CR model, the environmental attribute allocated to the output should originate from the inputs to the system. This means that the allocated attributes remain confined within a single system. Therefore, the MB-CR model can be applied if it is environmentally rational to allocate the environmental attributes within the target system alone. In contrast, under the B&C model, the allocated attribute originates from a different system. This implies that the B&C model induces non-proportional allocation across multiple systems, as the B&C model effectively decouples the environmental attribute from its original system and reassigns it elsewhere. Therefore, the B&C model can be applied only if it is environmentally rational to allocate the environmental attribute not only within the target system but also in the system from which the environmental attribute originates.
Thus, the MB-CR model and B&C model are distinguished by the alignment pattern of the flows and the scope of systems required to justify their application. In summary, the MB-CR model can claim the non-proportional allocation of an environmental attribute but cannot claim the allocation in which the total amount of the allocated attribute exceeds that contained in all the physical inputs. The B&C model, on the other hand, can claim that the amount of the allocated attribute is much more than in the physical inputs. The B&C model cannot claim such unless the rationality to decouple the attribute from the different system is clearly justified. This distinction eliminates the confusion arising from conventional classifications of the models by the types of inputs, attributes, or system boundaries. These points are summarized in Table 3.
Table 3.
Summary of distinction between MB-CR model and B&C model.
4.3. Harmonization Between Non-Proportional Allocation and Other Frameworks
In this study, we mainly focused on the general and qualitative discussion to clarify the requirement and limitation for applying the MB-CR and B&C models to environmental claims of industrial materials. As a result, we addressed that environmental rationality should be shown when the environmental attributes are non-proportionally allocated. Based on this, an entity should show, when implementing the non-proportional allocation to industrial materials, that applying the non-proportional allocation could avoid the additional environmental burdens which may otherwise occur. One approach to obtain such a quantitative discussion is to carry out LCA of a product. Though we did not show any environmental rationality with quantitative numbers in this study, such LCA results can be addressed by comparing the scenarios with and without applying the non-proportional allocation of the environmental attributes. Similarly, limitations to the non-proportional allocation of the target output can be determined by individually considering the process, the type of environmental attributes, and the properties of inputs and outputs. Recently, some researchers tried to harmonize the LCA methodology and the MB-CR and B&C models [16,61,62]. Parallelly, some ISO standards have been under development as of September 2025 to combine the MB-CR and B&C models with ISO-compliant LCA. Thus, further discussion is required in the form of future works to implement the concrete non-proportional allocation.
From the perspective of the eligibility of applying the MB-CR and B&C models, it is desirable that the environmental claim of a product undergoes third-party verification. One key indicator for external communication over the environmental aspect is the Environmental Product Declaration (EPD) [63]. EPDs are issued after the third-party verification and certification under EPD programs [64,65]. ISO 14025 defines EPDs as environmental data quantified based on ISO 14040/14044 [66]. This clearly indicates that EPDs should be based on an ISO-compliant LCA. Notably, ISO-compliant LCA principles recommend avoiding allocation of inputs among outputs, and in cases where allocation is unavoidable, proportional allocation is required [7]. Since EPDs follow ISO-compliant LCA principles, environmental attributes within EPDs are generally expected to be proportionally allocated. As a result, there is no consensus on applying non-proportional allocation such as the MB-CR and B&C models to EPDs [67]. In practice, several EPD programs have issued statements which prohibit the application of the MB-CR model to EPDs [68,69,70]. They are concerned that the methodology of the MB-CR model is still under development and lacks sufficient validity and fairness. Here, if a scientifically validated methodology is developed for non-proportional allocation of environmental attributes, such a methodology could be incorporated into objective and transparent accounting methods for environmental attributes. Further discussion is also required in the form of future works to harmonize EPDs and non-proportional allocation.
4.4. Towards Implementation of Non-Proportional Allocation
It is important to note that both the MB-CR and B&C models share the fundamental characteristic of decoupling the informational and physical flows of a specific attribute at some point in the supply chain. To ensure transparency, any decoupling between physical and informational flows should be explicitly stated in the environmental claims to which the non-proportional allocation was applied. The remaining issue is whether materials or products, to which the non-proportional allocation is already applied under the MB-CR or B&C models, can further be the target of these models downstream in the supply chain. To solve this, enhancing traceability across the entire supply chain, not just at the level of individual entities but at the industry-wide level, is necessary to track and verify the decoupling of physical and informational flows.
Some industry practices treat GHG emissions separately from the physical product and allocate among outputs under the B&C model [2]. Effectively, reduction of GHG emissions is regarded as a tradable environmental attribute under the B&C model in some cases. However, even if the informational and physical flows are decoupled throughout the entire supply chain, the allocation should still comply with the limitations of technical feasibility. This means that GHG emissions cannot simply be decoupled from their original source and allocated arbitrarily among outputs, a practice that would lack scientific validity. Additionally, some discussions have grouped B&C models together with insetting and offsetting mechanisms for GHG emissions [71,72,73]. Although these discussions regard them as similar, non-proportional allocation (the B&C model) and carbon credit mechanisms serve fundamentally different purposes and should not be conflated. Here, the need for further discussion on the scientific application of B&C models in environmental accounting and the limitations of treating GHG offsets as tradable attributes in the same manner as material-based environmental attributes is highlighted.
5. Conclusions
This study aimed to clarify the requirement and limitations for applying the MB-CR and B&C models, both of which implement non-proportional allocation of environmental attributes. Furthermore, this study also aimed to establish a systematic methodology for non-proportional allocation that incorporates a system-wide perspective and contributes to avoiding the additional environmental burdens in macro-level systems. To ensure the validity of non-proportional allocation, this study emphasized the necessity of establishing a requirement to justify its application. Specifically, environmental rationality should be demonstrated, defined as the ability of the non-proportional allocation contributing to the avoidance of environmental burdens within a system. Additionally, the rationality was shown to be only applicable during a transition phase, where the supply of the environmental attributes is insufficient. Furthermore, limitations should be imposed on non-proportional allocation to prevent unrealistic or misleading claims. This study demonstrated that non-proportional allocation should comply with the technical feasibility which ensures the claims made are achievable within the actual industrial processes.
Through these contributions, this study establishes a scientifically grounded and systematically structured methodology for non-proportional allocation under the MB-CR and B&C models. The methodology ensures that the application of the non-proportional allocation aligns with the avoidance of the additional environmental burden while maintaining credibility, transparency, and feasibility in environmental claims of industrial materials.
Author Contributions
Conceptualization, T.S., J.N. and I.D.; methodology, T.S., J.N. and I.D.; writing—original draft preparation, T.S.; writing—review and editing, J.N. and I.D.; visualization, T.S.; supervision, I.D.; project administration, I.D.; funding acquisition, I.D. All authors have read and agreed to the published version of the manuscript.
Funding
This article was partially supported by the New Energy and Industrial Technology Development Organization (NEDO), the project JPNP23002.
Institutional Review Board Statement
Not applicable.
Informed Consent Statement
Not applicable.
Data Availability Statement
Data are contained within the article.
Conflicts of Interest
Author Taichi Suzuki is employed by the company UACJ Corporation. This research was conducted as a part of his doctoral thesis. The remaining authors declare that the research was conducted in the absence of any commercial or financial relationships that could be construed as a potential conflict of interest.
References
- Mol, A.; Oosterveer, P. Certification of Markets, Markets of Certificates: Tracing Sustainability in Global Agro-Food Value Chains. Sustainability 2015, 7, 12258–12278. [Google Scholar] [CrossRef]
- Suzuki, T.; Daigo, I. Summary of Mass Balance Model and Its Challenges in Application to Industrial Materials. J. Life Cycle Assess. Jpn. 2024, 20, 2–10. [Google Scholar] [CrossRef]
- United Nations Global Compact. BSR A Guide to Teaceability—A Practical Approach to Advance Sustainability in Global Supply Chains; United Nations Global Compact: New York, NY, USA, 2014. [Google Scholar]
- ISO 22095:2020(E); Chain of Custody—General Terminology and Models. ISO: Geneva, Switzerland, 2020.
- ISO 14021:2016(E); Environmental Labels and Declarations—Self-Declared Environmental Claims (Type II Environmental Labelling). ISO: Geneva, Switzerland, 2016.
- Alexander, H.; Keever, T.; Pierce, C.J. Mass Balance Accounting Approach. In ACS Symposium Series; Collias, D.I., James, M.I., Layman, J.M., Eds.; American Chemical Society: Washington, DC, USA, 2021; Volume 1391, pp. 171–184. ISBN 978-0-8412-9816-3. [Google Scholar]
- ISO 14044:2006(E); Environmental Management—Life Cycle Assessment—Requirements and Guidelines. ISO: Geneva, Switzerland, 2006.
- Proforest. Developing a Mechanism for Palm Oil Traceability from Plantation to End User; Proforest: Oxford, UK, 2005. [Google Scholar]
- Ellen MacArthur Foundation. Circular Economy 100 Enabling a Circular Economy for Chemicals with the Mass Balance Approach; Ellen MacArthur Foundation: Isle of Wight, UK, 2019. [Google Scholar]
- Leggett, D.J. Safe Process Development from Reaction Hazards Testing. Thermochim. Acta 2001, 367–368, 351–365. [Google Scholar] [CrossRef]
- Leggett, D. Chemical Reaction Hazard Identification and Evaluation: Taking the First Steps. Process Saf. Prog. 2004, 23, 21–28. [Google Scholar] [CrossRef]
- Li, X.; Yu, H.; Yuan, M. Modeling and Optimization of Cement Raw Materials Blending Process. Math. Probl. Eng. 2012, 2012, 392197. [Google Scholar] [CrossRef]
- Bacharel, R.D.F.; Souza, M.J.F.; Cota, L.P. Product Sequencing and Blending of Raw Materials to Feed Arc Furnaces: A Decision Support System for a Mining-Metallurgical Industry. J. Control Autom. Electr. Syst. 2022, 33, 1091–1102. [Google Scholar] [CrossRef]
- Tabrizi, S.; Crêpy, M.; Rateau, F. Determining Recycled Content with the ‘Mass Balance Approach’—10 Recommendations for Development of Methods and Standards.Pdf; Zero Waste Europe: Brussels, Belgium, 2021. [Google Scholar]
- Schyns, Z.O.G.; Bennett, T.M.; Shaver, M.P. Recycled Plastic Content Quantified through Aggregation-Induced Emission. ACS Sustain. Chem. Eng. 2022, 10, 12659–12669. [Google Scholar] [CrossRef]
- Finkbeiner, M.; Roche, L.; Holzapfel, P. From Analysis-LCA to Message-LCA: A Lost Cause? Int. J. Life Cycle Assess. 2025, 30, 803–810. [Google Scholar] [CrossRef]
- Suzuki, T.; Daigo, I. Recycled Content for Metals with Refined Classification of Metal Scrap: Micro-Level Circularity Indicator in Accordance with Macro-Level System. Sustainability 2024, 16, 6933. [Google Scholar] [CrossRef]
- Mercedes-Benz On the Road to the Circular Economy. Available online: https://group.mercedes-benz.com/responsibility/sustainability/resources/circular-economy.html (accessed on 10 May 2024).
- Chen, W.-Q. Recycling Rates of Aluminum in the United States: Recycling Rates of Aluminum in the United States. J. Ind. Ecol. 2013, 17, 926–938. [Google Scholar] [CrossRef]
- Daigo, I.; Iwata, K.; Ohkata, I.; Goto, Y. Macroscopic Evidence for the Hibernating Behavior of Materials Stock. Environ. Sci. Technol. 2015, 49, 8691–8696. [Google Scholar] [CrossRef] [PubMed]
- Chiaramonti, D. Sustainable Aviation Fuels: The Challenge of Decarbonization. Energy Procedia 2019, 158, 1202–1207. [Google Scholar] [CrossRef]
- Capaz, R.S.; Guida, E.; Seabra, J.E.A.; Osseweijer, P.; Posada, J.A. Mitigating Carbon Emissions through Sustainable Aviation Fuels: Costs and Potential. Biofuels Bioprod. Biorefining 2021, 15, 502–524. [Google Scholar] [CrossRef]
- Cabrera, E.; De Sousa, J.M.M. Use of Sustainable Fuels in Aviation—A Review. Energies 2022, 15, 2440. [Google Scholar] [CrossRef]
- Bauen, A.; Bitossi, N.; German, L.; Harris, A.; Leow, K. Sustainable Aviation Fuels: Status, Challenges and Prospects of Drop-in Liquid Fuels, Hydrogen and Electrification in Aviation. Johns. Matthey Technol. Rev. 2020, 64, 263–278. [Google Scholar] [CrossRef]
- Pechstein, J.; Bullerdiek, N.; Kaltschmitt, M. A “Book and Claim”-Approach to Account for Sustainable Aviation Fuels in the EU-ETS—Development of a Basic Concept. Energy Policy 2020, 136, 111014. [Google Scholar] [CrossRef]
- Abrantes, I.; Ferreira, A.F.; Silva, A.; Costa, M. Sustainable Aviation Fuels and Imminent Technologies—CO2 Emissions Evolution towards 2050. J. Clean. Prod. 2021, 313, 127937. [Google Scholar] [CrossRef]
- Kvande, H.; Drabløs, P.A. The Aluminum Smelting Process and Innovative Alternative Technologies. J. Occup. Environ. Med. 2014, 56, S23–S32. [Google Scholar] [CrossRef]
- Ratvik, A.P.; Mollaabbasi, R.; Alamdari, H. Aluminium Production Process: From Hall–Héroult to Modern Smelters. ChemTexts 2022, 8, 10. [Google Scholar] [CrossRef]
- International Aluminium Institute. Aluminium Sector Greenhouse Gas Pathways to 2050; International Aluminium Institute: London, UK, 2021. [Google Scholar]
- Ellabban, O.; Abu-Rub, H.; Blaabjerg, F. Renewable Energy Resources: Current Status, Future Prospects and Their Enabling Technology. Renew. Sustain. Energy Rev. 2014, 39, 748–764. [Google Scholar] [CrossRef]
- Glasnovic, Z.; Margeta, J. Vision of Total Renewable Electricity Scenario. Renew. Sustain. Energy Rev. 2011, 15, 1873–1884. [Google Scholar] [CrossRef]
- International Renewable Energy Agency. Global Energy Transformation: A Roadmap to 2050; International Renewable Energy Agency: Abu Dhabi, United Arab Emirates, 2018; ISBN 978-92-9260-059-4. [Google Scholar]
- Gielen, D.; Boshell, F.; Saygin, D.; Bazilian, M.D.; Wagner, N.; Gorini, R. The Role of Renewable Energy in the Global Energy Transformation. Energy Strategy Rev. 2019, 24, 38–50. [Google Scholar] [CrossRef]
- He, K.; Wang, L. A Review of Energy Use and Energy-Efficient Technologies for the Iron and Steel Industry. Renew. Sustain. Energy Rev. 2017, 70, 1022–1039. [Google Scholar] [CrossRef]
- Bararzadeh Ledari, M.; Khajehpour, H.; Akbarnavasi, H.; Edalati, S. Greening Steel Industry by Hydrogen: Lessons Learned for the Developing World. Int. J. Hydrogen Energy 2023, 48, 36623–36649. [Google Scholar] [CrossRef]
- Asanuma, M.; Ariyama, T.; Sato, M.; Murai, R.; Nonaka, T.; Okochi, I.; Tsukiji, H.; Nemoto, K. Development of Waste Plastics Injection Process in Blast Furnace. ISIJ Int. 2000, 40, 244–251. [Google Scholar] [CrossRef]
- Carpenter, A.M. Injection of Coal and Waste Plastics in Blast Furnaces; IEA Clean Coal Centre: London, UK, 2010; ISBN 978-92-9029-486-3. [Google Scholar]
- Babich, A.; Senk, D.; Knepper, M.; Benkert, S. Conversion of Injected Waste Plastics in Blast Furnace. Ironmak. Steelmak. 2016, 43, 11–21. [Google Scholar] [CrossRef]
- Schneider, M.; Romer, M.; Tschudin, M.; Bolio, H. Sustainable Cement Production—Present and Future. Cem. Concr. Res. 2011, 41, 642–650. [Google Scholar] [CrossRef]
- Thomas, B.S.; Gupta, R.C. A Comprehensive Review on the Applications of Waste Tire Rubber in Cement Concrete. Renew. Sustain. Energy Rev. 2016, 54, 1323–1333. [Google Scholar] [CrossRef]
- Huitu, K.; Helle, H.; Helle, M.; Kekkonen, M.; Saxén, H. Optimization of Steelmaking Using Fastmet Direct Reduced Iron in the Blast Furnace. ISIJ Int. 2013, 53, 2038–2046. [Google Scholar] [CrossRef]
- Anameric, B.; Kawatra, S.K. Properties and Features of Direct Reduced Iron. Miner. Process. Extr. Metall. Rev. 2007, 28, 59–116. [Google Scholar] [CrossRef]
- Chung, S.H.; Kim, K.H.; Sohn, I. DRI from Recycled Iron Bearing Wastes for Lower Carbon in the Blast Furnace. ISIJ Int. 2015, 55, 1157–1164. [Google Scholar] [CrossRef]
- Lüngen, H.B.; Schmöle, P. Comparison of Blast Furnace Operation Modes in the World. Steel Res. Int. 2020, 91, 2000182. [Google Scholar] [CrossRef]
- Kobe Steel. KOBELCO Group’s CO2 Reduction Solution|KOBELCO Kobe Steel Group. Available online: www.kobelco.co.jp/english/releases/1207624_15581.html (accessed on 2 October 2024).
- Kobe Steel. KOBELCO Group’s CO2 Reduction Solution for Blast Furnace Ironmaking; Kobe Steel, Ltd.: Kobe, Japan, 2021. [Google Scholar]
- Vora, N.; Christensen, P.R.; Demarteau, J.; Baral, N.R.; Keasling, J.D.; Helms, B.A.; Scown, C.D. Leveling the Cost and Carbon Footprint of Circular Polymers That Are Chemically Recycled to Monomer. Sci. Adv. 2021, 7, eabf0187. [Google Scholar] [CrossRef]
- Beers, K.; Schumacher, K.; Migler, K.; Morris, K.; Kneifel, J. An Assessment of Mass Balance Accounting Methods for Polymers Workshop Report; National Institute of Standards and Technology: Gaithersburg, MD, USA, 2022.
- Baeyens, J.; Brems, A.; Dewil, R. Recovery and Recycling of Post-Consumer Waste Materials. Part 1. Generalities and Target Wastes (Paper, Cardboard and Aluminium Cans). Int. J. Sustain. Eng. 2010, 3, 148–158. [Google Scholar] [CrossRef]
- Nishimura, H.; Tan, L.; Sun, Z.-Y.; Tang, Y.-Q.; Kida, K.; Morimura, S. Efficient Production of Ethanol from Waste Paper and the Biochemical Methane Potential of Stillage Eluted from Ethanol Fermentation. Waste Manag. 2016, 48, 644–651. [Google Scholar] [CrossRef]
- Kong, L.; Hasanbeigi, A.; Price, L. Assessment of Emerging Energy-Efficiency Technologies for the Pulp and Paper Industry: A Technical Review. J. Clean. Prod. 2016, 122, 5–28. [Google Scholar] [CrossRef]
- Peretz, R.; Mamane, H.; Wissotzky, E.; Sterenzon, E.; Gerchman, Y. Making Cardboard and Paper Recycling More Sustainable: Recycled Paper Sludge For Energy Production and Water-Treatment Applications. Waste Biomass Valorization 2021, 12, 1599–1608. [Google Scholar] [CrossRef]
- ADEME. Bio by Deloitte Bilan National du Recyclage 2005–2014—Rapport Final 2017; ADEME: Montrouge, France, 2017. [Google Scholar]
- Lorang, E.; Lobianco, A.; Delacote, P. Increasing Paper and Cardboard Recycling: Impacts on the Forest Sector and Carbon Emissions. Environ. Model. Assess. 2023, 28, 189–200. [Google Scholar] [CrossRef]
- Paper Recycling Promotion Center. Paper Recycling by Numbers. Available online: http://www.prpc.or.jp/recycle/number/ (accessed on 27 September 2025).
- Ministry of the Environment Green Mark. Available online: https://www.env.go.jp/policy/hozen/green/ecolabel/a04_17.html (accessed on 27 September 2025).
- Jeswani, H.K.; Krüger, C.; Kicherer, A.; Antony, F.; Azapagic, A. A Methodology for Integrating the Biomass Balance Approach into Life Cycle Assessment with an Application in the Chemicals Sector. Sci. Total Environ. 2019, 687, 380–391. [Google Scholar] [CrossRef]
- Lueg, R.; Pedersen, M.M.; Clemmensen, S.N. The Role of Corporate Sustainability in a Low—Cost Business Model—A Case Study in the Scandinavian Fashion Industry. Bus. Strategy Environ. 2015, 24, 344–359. [Google Scholar] [CrossRef]
- Comello, S.D.; Reichelstein, J.; Reichelstein, S. Corporate Carbon Reporting: Improving Transparency and Accountability. One Earth 2023, 6, 803–810. [Google Scholar] [CrossRef]
- Ye, J.; Xu, W. Carbon Reduction Effect of ESG: Empirical Evidence from Listed Manufacturing Companies in China. Front. Ecol. Evol. 2023, 11, 1311777. [Google Scholar] [CrossRef]
- Holzapfel, P.; Bach, V.; Jaeger, F.A.; Finkbeiner, M. The Primary Data Share Indicator for Supply Chain Specificity in Product Carbon Footprinting. Ecol. Indic. 2024, 166, 112435. [Google Scholar] [CrossRef]
- Holzapfel, P.; Blizniukova, D.; Bach, V.; Finkbeiner, M. Chain of Custody Modelling in Carbon Footprinting and Life Cycle Assessment. Int. J. Life Cycle Assess. 2025, 30, 980–993. [Google Scholar] [CrossRef]
- Schmincke, E.; Grahl, B. Umwelteigenschaften von Produkten Die Rolle der Ökobilanz in ISO Typ III Umweltdeklarationen. Umweltwissenschaften Schadst.-Forsch. 2006, 18, 185–192. [Google Scholar] [CrossRef]
- Toniolo, S.; Mazzi, A.; Simonetto, M.; Zuliani, F.; Scipioni, A. Mapping Diffusion of Environmental Product Declarations Released by European Program Operators. Sustain. Prod. Consum. 2019, 17, 85–94. [Google Scholar] [CrossRef]
- Del Borghi, A.; Moreschi, L.; Gallo, M. Communication through Ecolabels: How Discrepancies between the EU PEF and EPD Schemes Could Affect Outcome Consistency. Int. J. Life Cycle Assess. 2020, 25, 905–920. [Google Scholar] [CrossRef]
- ISO 14025; Environmental Labels and Declarations Type III Environmental Declarations Principles and Procedures. ISO: Geneva, Switzerland, 2006.
- Ouellet-Plamondon, C.M.; Balouktsi, M.; Delem, L.; Foliente, G.; Francart, N.; Garcia-Martinez, A.; Hoxha, E.; Lützkendorf, T.; Nygaard Rasmussen, F.; Peuportier, B.; et al. Comparison of 16 National Methods in the Life Cycle Assessment of Carbon Storage in Wood Products in a Reference Building. IOP Conf. Ser. Earth Environ. Sci. 2024, 1363, 012059. [Google Scholar] [CrossRef]
- EPD International. General Programme Instructions for the International EPD® System; Version 4.0 2021; EPD International: Stockholm, Sweden, 2021. [Google Scholar]
- Sustainable Management Promotion Organization. Handling of Mass Balance Approach in SuMPO’s Policy; Sustainable Management Promotion Organization: Tokyo, Japan, 2023. [Google Scholar]
- ECO Platform. ECO Platform Public Statement on the Use of the Mass Balance Approach; ECO Platform: Brussels, Belgium, 2023. [Google Scholar]
- Gallemore, C.; Jespersen, K. Offsetting, Insetting, or Both? Current Trends in Sustainable Palm Oil Certification. Sustainability 2019, 11, 5393. [Google Scholar] [CrossRef]
- Smart Freight Centre. Deutsche Post DHL Group Carbon Insets for the Logistics Sector: Innovating Carbon Offset Practices to Accelerate Freight Decarbonization; Smart Freight Centre: Amsterdam, The Netherlands, 2020. [Google Scholar]
- Ebersold, F.; Hechelmann, R.-H.; Holzapfel, P.; Meschede, H. Carbon Insetting as a Measure to Raise Supply Chain Energy Efficiency Potentials: Opportunities and Challenges. Energy Convers. Manag. X 2023, 20, 100504. [Google Scholar] [CrossRef]


Disclaimer/Publisher’s Note: The statements, opinions and data contained in all publications are solely those of the individual author(s) and contributor(s) and not of MDPI and/or the editor(s). MDPI and/or the editor(s) disclaim responsibility for any injury to people or property resulting from any ideas, methods, instructions or products referred to in the content. |
© 2025 by the authors. Licensee MDPI, Basel, Switzerland. This article is an open access article distributed under the terms and conditions of the Creative Commons Attribution (CC BY) license (https://creativecommons.org/licenses/by/4.0/).