Abstract
Wind energy is vital for clean energy development in ecologically fragile arid regions. This study presents the first comprehensive analysis of wind farm impacts on land surface temperature (LST) in the extremely arid area of Xinjiang, China, using MODIS (2008–2022) and Landsat data. Key findings include (1) pronounced nighttime warming in winter (up to 1.548 °C/15a) in densely turbine-populated areas, contrasting with autumn cooling; (2) Random Forest regression identifying wind speed, precipitation, NDVI, and snow cover as key drivers of LST changes; (3) enhanced post-construction warming, especially in summer nights in the Southeast Wind Zone; (4) significant thermal effects confirmed against non-affected areas, showing diurnal asymmetry and downwind warming; and (5) a distance–decay pattern of LST anomalies, strongest within 2–5 km of turbines yet detectable up to 20 km. These results reveal a unique spatial–seasonal complexity in LST changes induced by wind farms in arid regions, emphasizing the critical roles of topography and turbine density. This study underscores the necessity of integrating microclimate feedbacks into sustainable wind energy planning in arid environments.
1. Introduction
With the growing global demand for clean energy, wind power has been widely adopted as a key renewable energy source. According to a 2023 report by the UK energy industry organization Energy Institute, China’s newly installed renewable energy capacity surpassed that of all other regions combined, accounting for nearly 66% of global additions in wind power capacity, making China the world leader in total installed wind energy capacity. While wind energy is regarded as a low-emission energy source and a crucial alternative to conventional fossil fuels [1,2], its large-scale development also poses environmental challenges, including potential impacts on ecosystems, land use, and biodiversity. Therefore, while promoting the development of clean energy such as wind power, it is essential to assess its long-term environmental impacts and implement effective mitigation strategies. As the primary means of wind energy conversion, wind farms are vital to the energy transition but may also exert potential impacts on surrounding environments. Studies have shown that the rotating blades of wind turbines can pose collision risks to flying birds [3] and bats [4]. The construction and operation of wind farms may disrupt and destroy wildlife habitats, resulting in deforestation and soil erosion [5], and consequently affect local ecosystems and biodiversity. Additionally, the rotation of turbine blades increases surface roughness [3,6,7], intensifies turbulence in the turbine wake zone [8], and alters the stability of the atmospheric boundary layer (ABL) [9,10]. When wind farms are large enough, wind turbines can not only convert wind energy but also influence the exchange of heat, momentum, moisture, and carbon dioxide within the ABL [11].
With the increasing share of wind energy in the global energy mix, the potential environmental impacts of wind farms have garnered growing attention. In particular, whether wind farm operations alter land surface temperature (LST) has become a research hotspot in environment and climate. Studies suggest that wind farms may influence LST modifying local aerodynamic processes and turbulence characteristics. To better understand this phenomenon, scholars have systematically investigated it through numerical simulations, field observations, and remote sensing monitoring.
Numerical simulations analyze wind farm–climate interactions via physical models such as the Regional Atmospheric Modeling System (RAMS) and 3D climate models. Early studies, such as Roy et al. [12], used the RAMS model under typical summer conditions and found that wind farms enhanced turbulence and vertical mixing, increasing near-surface air temperatures. Keith et al. [13] argued that large-scale wind energy development exerts minimal global impacts on LST, though it may induce local fluctuations. C. Wang et al. [7] showed that onshore wind farms could raise LST by more than 1 °C, while offshore wind farms might slightly reduce LST. Wang et al. [14] found that the Zhangbei wind farm in China caused nighttime warming and daytime cooling, with limited impact on the regional climate.
Field observations rely on meteorological stations to validate simulation results. Most field studies document nighttime warming around wind farms: Roy and Traiteur [9] observed significant nighttime warming in California, while Armstrong et al. [15] r recorded a 0.18 °C nighttime increase in Scotland. Moravec et al. [16] noted daytime warming of 0.387–2.082 °C near turbines in the Czech Republic. In China, Xu et al. [17] (Inner Mongolia) and Zhang et al. [18] (Hubei) observed nighttime LST increases and slight daytime decreases.
Remote sensing technologies, such as MODIS LST data, provide wide coverage, high resolution, and long-term continuous observations of LST, supporting regional and temporal analyses of wind farm impacts. Zhou et al. [19] first identified significant nighttime and summer warming (0.31–0.70 °C) in Texas wind farms, attributing it to boundary layer disruption rather than topography [20,21]. Similarly, Harris et al. [22] and Slawsky et al. [23] reported nighttime LST increases of 0.12–0.44 °C (Iowa) and 0.18–0.39 °C (Illinois), confirming seasonal (strongest in summer) and spatial coupling of warming effects. Qin et al. [24] analyzed 319 U.S. wind farms and found 61% experienced average nighttime LST increases of 0.36 °C, with stronger warming in winter and autumn (up to 0.18 °C). Studies on Chinese wind farms have revealed similar patterns but with regional variability. Chang et al. [25] found the Guazhou wind farm in Northwest China had the greatest summer nighttime LST increase (0.51 °C/8a), weaker than urban heat island effects. Research in Hebei’s Bashang area showed stronger downwind nighttime warming (0.206–0.379 °C/10a) and daytime cooling, possibly due to enhanced evaporation and turbulent mixing [26]. Zhang et al. [27] observed a maximum LST increase of 7.04 K near Qinghai’s Gonghe wind farm, with warming attenuating with distance. Han et al. [28] meta-analyzed 250 Chinese wind farms, quantifying diurnal impacts: average nighttime LST increased by 0.20 °C, while daytime LST decreased by 0.11 °C, correlating with wind farm scale and proximity. I Notably, Zheng et al. [29] observed day–night LST heterogeneity in Gansu’s deserts, potentially linked to albedo and vegetation feedback. High-resolution Landsat data have also shown contentious findings: Walsh-Thomas et al. [30] reported LST increases of 4–8 °C within 12 km downwind of a California wind farm, whereas Qi et al. [31] found no significant effect (<1 K) in China’s Kailu wind farm. These discrepancies may arise from differences in underlying surfaces (e.g., irrigated farmland vs. unmanaged grassland), atmospheric stability, and regional climate.
Methodologically, numerical simulations provide theoretical insights but face uncertainties in model assumptions; field observations reflect real-world conditions but are spatially limited; remote sensing enhances representativeness through long-term, large-scale data. Most studies suggest a trend of nighttime warming and daytime cooling or negligible change near wind farms, with warming intensity modulated by topography, wind speed, direction, and season.
In recent years, large-scale wind farm construction and operation have raised concerns that turbine operations may influence land surface temperature by altering surface airflow patterns and energy distribution. Previous studies indicate that wind farms can alter surrounding LST, potentially impacting regional ecosystems. However, most existing research has focused on humid or semi-humid regions, with limited attention to arid environments. Arid regions are characterized by fragile ecosystems, sparse vegetation, and strong surface–atmosphere feedbacks, which may lead to distinct LST responses to wind farm operations. Recent studies have begun to highlight regional specificities; for example, Zheng et al. [29] reported diurnal LST heterogeneity in desert areas of Gansu, potentially linked to albedo and vegetation feedbacks, while Qin et al. [24] identified seasonal variability in warming intensity across U.S. wind farms. Nevertheless, systematic assessments in hyper-arid regions remain scarce. Hami City, located in the eastern Xinjiang Uygur Autonomous Region, is a typical arid area with abundant wind resources and large-scale wind energy development. Its ecologically vulnerable setting makes it highly sensitive to anthropogenic disturbances. This study presents the first comprehensive analysis of wind farm impacts on LST in an extremely arid region of China, using multi-source remote sensing data (MODIS and Landsat) to quantify changes across three major wind zones. We also compare consistency across spatial resolutions and explore whether underlying mechanisms in arid regions differ from those in humid or semi-arid areas. Our work aims to fill a critical research gap and provide scientific support for sustainable wind energy planning in ecologically fragile arid regions.
2. Methods
2.1. Study Area
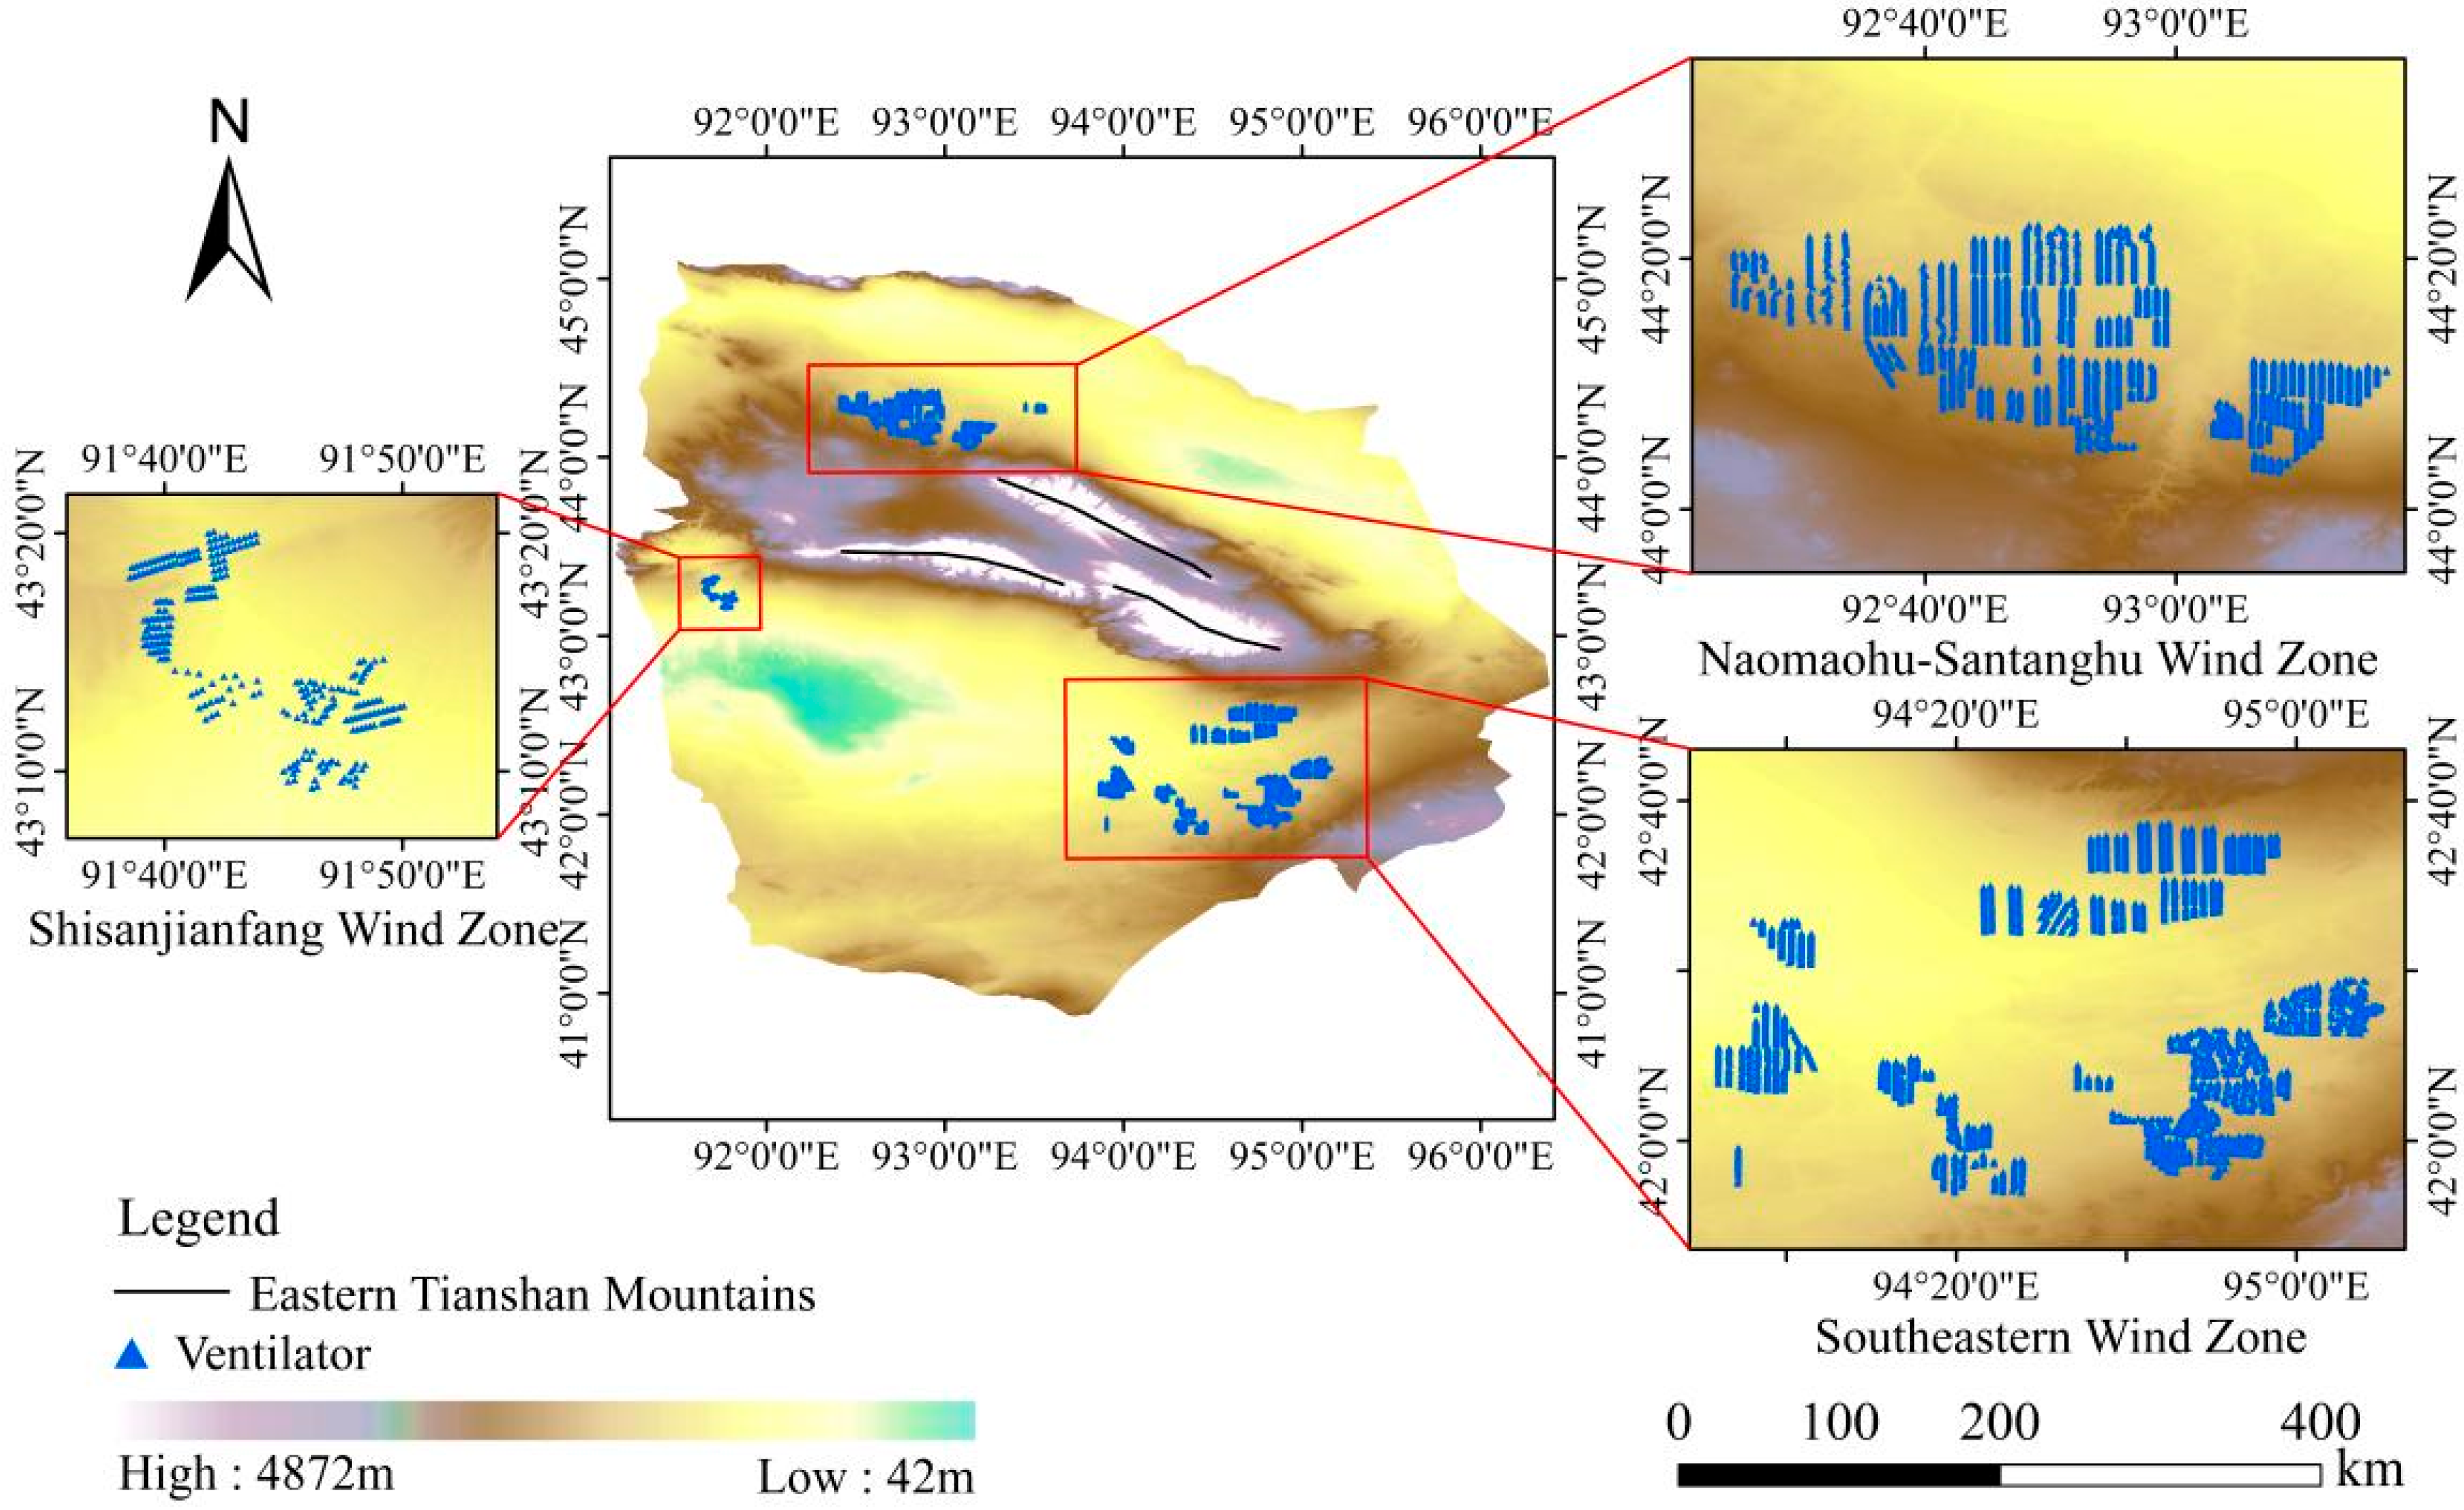
The study area is located in Hami City (91.11° E–96.38° E, 40.88° N–45.09° N), situated in the eastern part of the Xinjiang Uygur Autonomous Region, China. As a extremely arid region, Hami is characterized by abundant wind and solar energy resources. Among the nine major wind zones in Xinjiang, Hami contains three—Shisanjianfang, Southeast, and Naoma Lake–Santang Lake wind zones—which together cover approximately 51,600 km2, accounting for 66.3% of the total wind resource region in the region. These zones experience over 200 days per year of wind events exceeding level 8 on the Beaufort scale. The Shisanjianfang Wind Zone lies at the southern edge of the Tianshan Mountains, where the terrain slopes from north to south and is surrounded by mountains on three sides, forming a natural wind corridor that enhances wind concentration. The Southeast Wind Zone features complex terrain with alternating hills and basins, with the southeast characterized by low mountainous regions (1000–2000 m elevation) that accelerate wind flow due to orographic effects. The northwest consists of open basins and Gobi landscapes, forming natural wind channels that support wind energy concentration. In contrast, the Naoma Lake–Santang Lake Wind Zone occupies a relatively simple geomorphological setting—a small intermontane basin between the eastern Tianshan Mountains and Santanghu Basin—dominated by flat plains favorable for large-scale wind turbine deployment and maintenance due to terrain-induced wind acceleration. Hami has rapidly developed its wind energy sector, forming a 10-GW-class wind power base. The total installed wind power capacity in Hami has exceeded 13.03 GW. In this study, wind farm locations and individual turbine positions were identified and georeferenced using OpenStreetMap and high-resolution imagery (Figure 1).
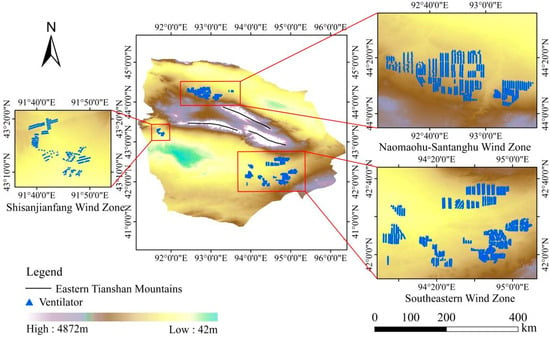
Figure 1.
Study area.
2.2. Data
The data used in this study as follows: MODIS eight-day average land surface temperature (LST) data with a spatial resolution of 0.01°; Daily snow cover data; Normalized vegetation index (NDVI) data; Potential evapotranspiration data, the spatial resolution is 0.0083333° (about 1 km), and the unit is 0.1 mm; The temporal resolution of precipitation data is 1 day, and the spatial resolution is 0.1°; The unit of daily surface soil moisture data is m3/m3, and the spatial resolution is 1 km; The albedo data is MODIS daily albedo product (MCD43A3), and the data resolution is 0.01°; DEM data is digital elevation data with 30 m resolution of Aster GDEM, and slope and aspect parameters are extracted by ArcGIS software. Land use data provide the spatial resolution of 30 m in China; The wind direction and wind speed data come from the fifth generation atmospheric reanalysis data (ERA5) released by European Centre for Medium-Range Weather Forecasts (ECMWF), the wind speed and wind direction data at 100 m close to the satellite transit time are selected to judge the upwind and downwind direction of the wind farm. In this study, the data above are uniformly resampled to a resolution of 0.01° (about 1 km) or 1 Km to ensure the spatial registration accuracy. The data above covers the period from January 2008 to December 2022. Landsat surface temperature data is a surface temperature product with a spatial resolution of 30 m and a temporal resolution of 16 days, and the data within the time required for the study is selected. The above data come from Google Earth Engine (GEE), European Centre for Medium-Range Weather Forecasts (ECMWF) and China National Qinghai–Tibet Plateau Scientific Data Center platform.
2.3. Research Methods
2.3.1. Reconstruction of MODIS LST Data Using Linear Interpolation
To ensure data completeness and consistency, MOD11A2 and MYD11A2 8-day LST products were pre-processed to exclude unreliable values. Following the methodology of Zhou et al. [21], pixels were retained only if the quality assurance (QA) field indicated good or acceptable quality (i.e., QA01 = 00 or 01, with QA67 = 00 representing the highest confidence level). All other pixels were masked as missing.
A linear interpolation method was then applied to reconstruct missing LST values, assuming a linear trend between temporally adjacent valid observations. This was implemented using the interp1 function in MATLAB 2021. Given two valid observations and , the missing value at position , where is estimated using:
The following interpolation formula was applied to estimate the missing values:
This method effectively mitigates noise from cloud contamination and enables the construction of continuous surface temperature time series.
2.3.2. Analysis Method of Wind Farms Impact on LST
Given that most wind farms in the study area were constructed after 2010, the analysis was divided into two periods: pre-construction (2008–2010) and post-construction (2020–2022). To isolate the influence of wind farm operation from interannual climate variability, an anomaly based spatial normalization approach was employed. The anomaly land surface temperature (ALSTi,j) for each pixel (i,j) was calculated as the deviation of seasonal average LST from the long-term mean (2008–2022). Subsequently, a regional anomaly land surface temperature (RALST) was derived by subtracting the wind farm zone mean ALST from the mean ALST of the broader study region. This approach effectively removes the influence of climate variability and regional differences [21].
The final LST change attributed to wind farm operation (ΔLST) is calculated as
where is the long-term average LST across the region, and is the mean anomaly in the wind farm zone. This method minimizes the influence of regional and seasonal variability.
2.3.3. Delineation of Wind Farm Impact Area and Non-Wind Farm Impact Area
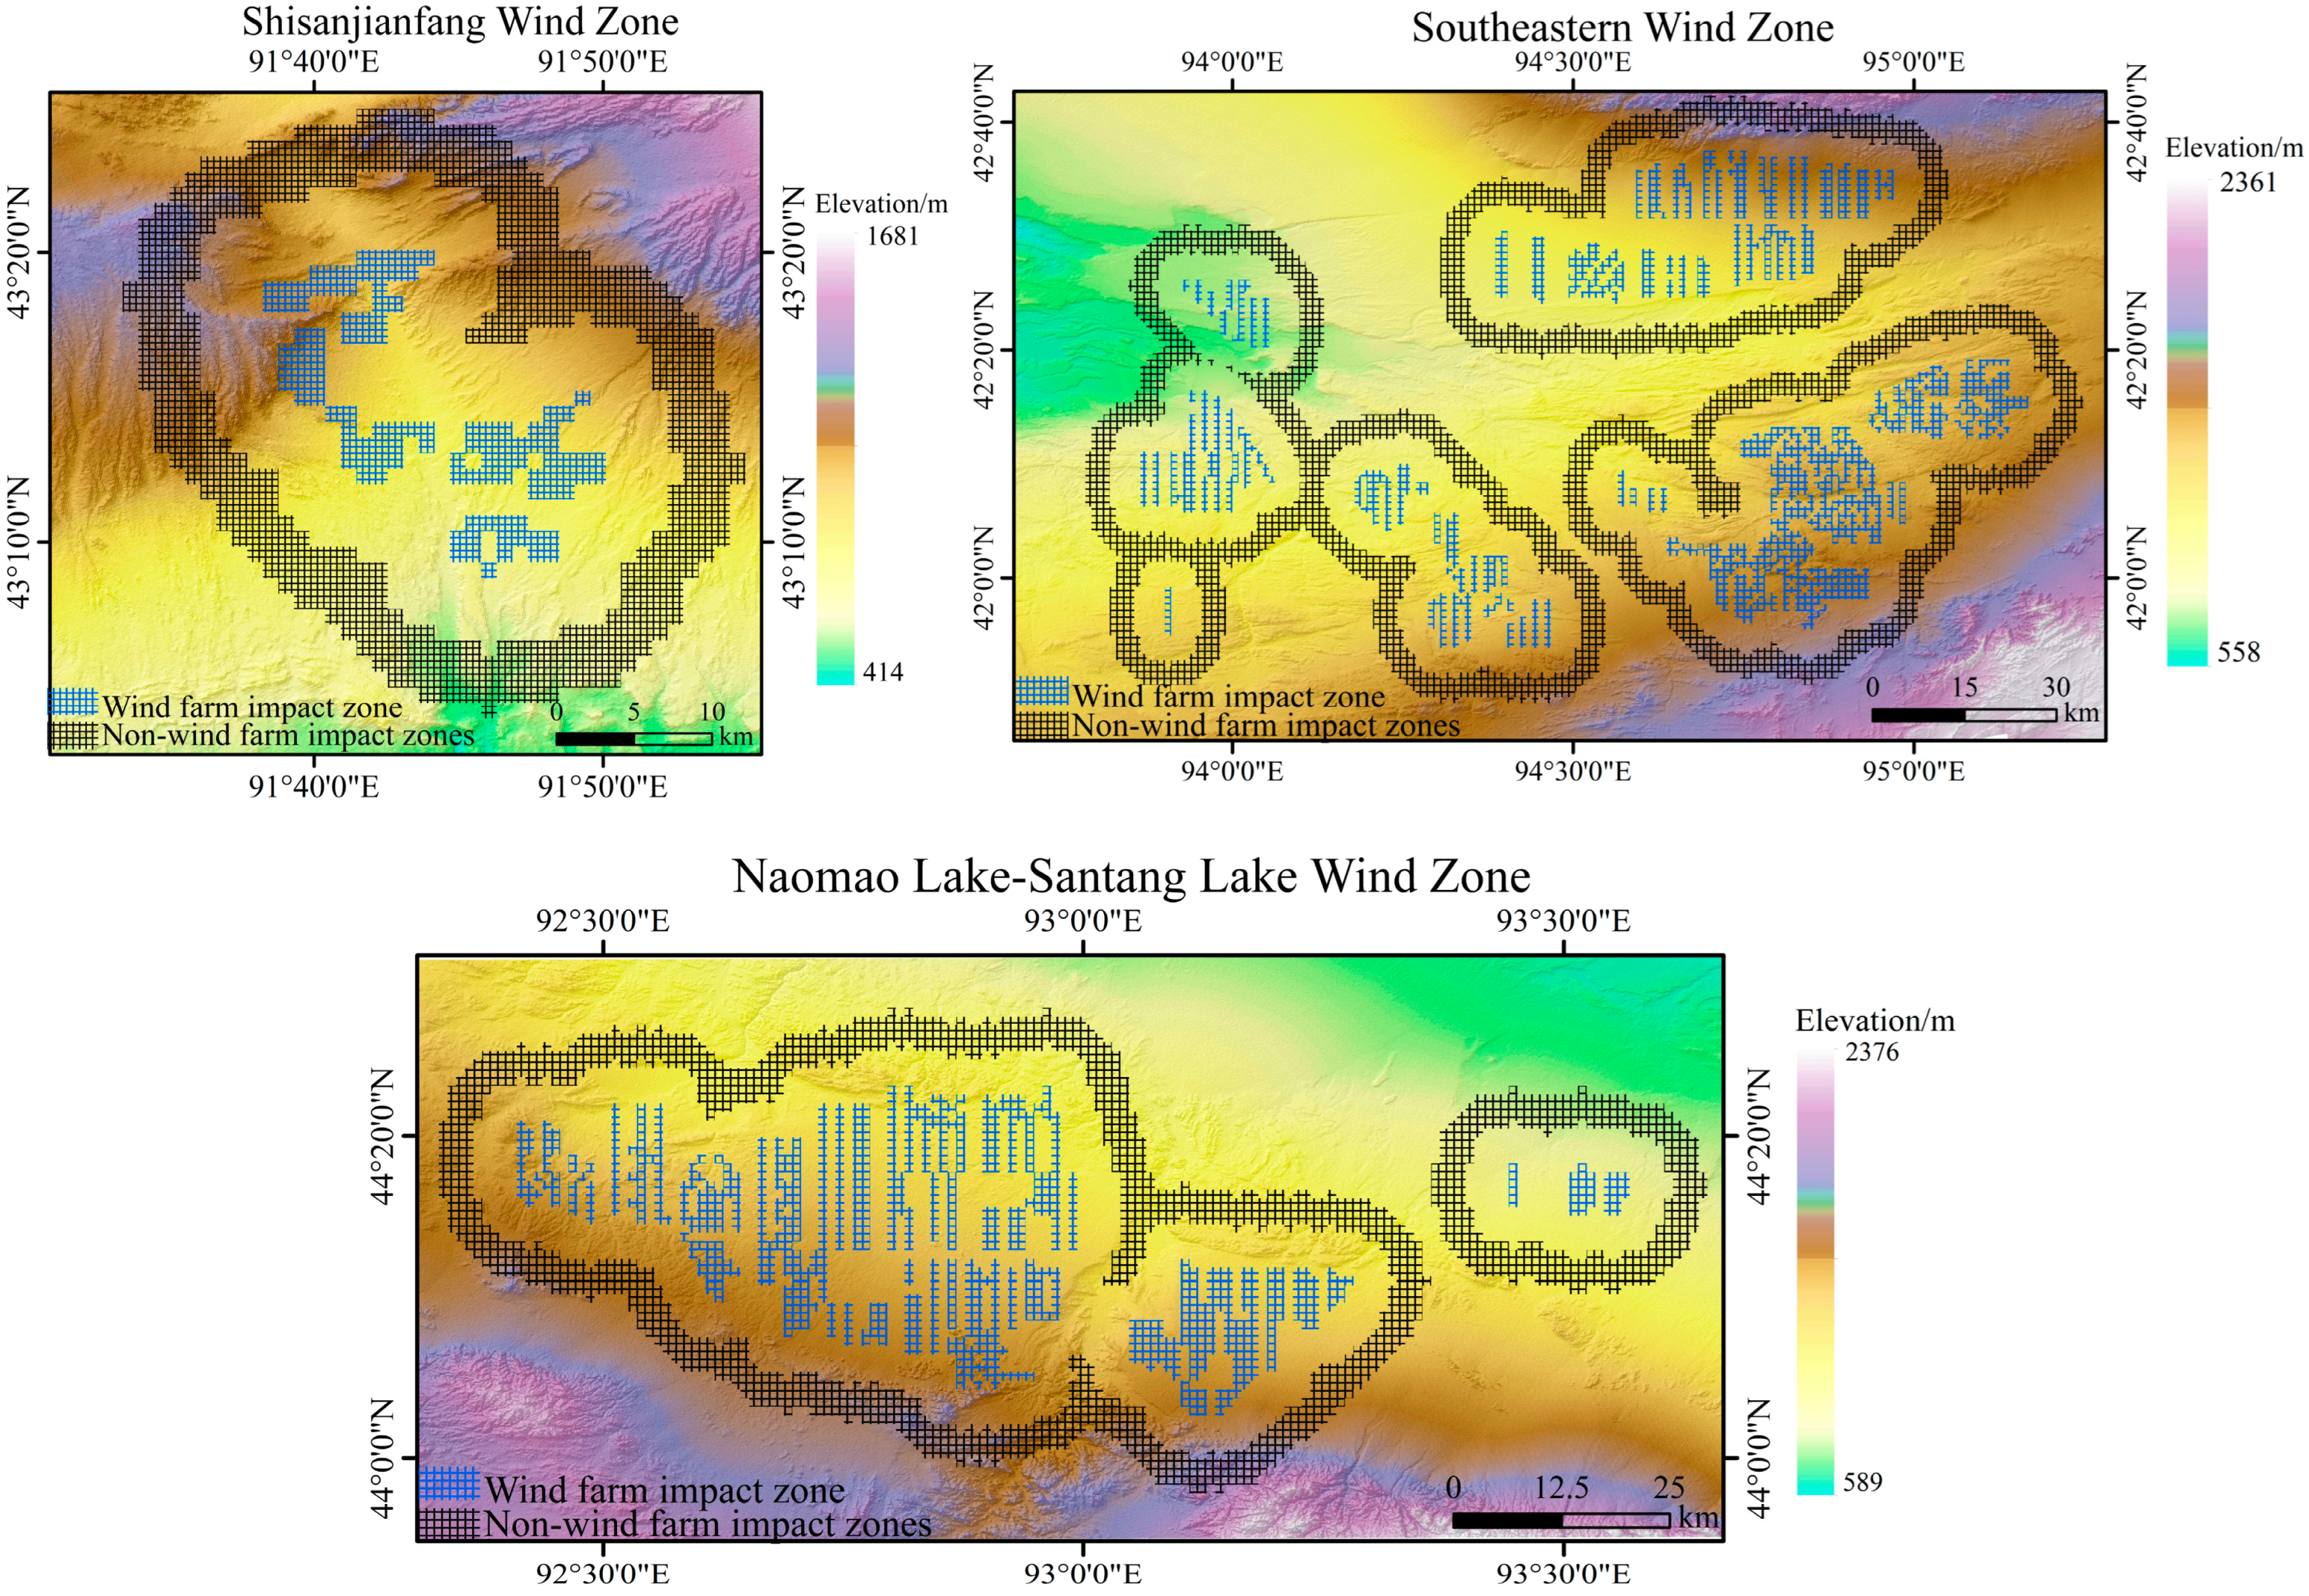
Wind farm pixels were identified at 0.01° resolution as those containing at least one turbine. Non-wind farm pixels were defined as buffer zones located 6–9 pixels away from wind farm pixels, with a width of 4 pixels. Wind farm impact areas and non-impact areas were demarcated accordingly (Figure 2), and the difference in RALST between wind farm impact areas and non-wind farm impact areas [21], analogous to urban heat island studies.
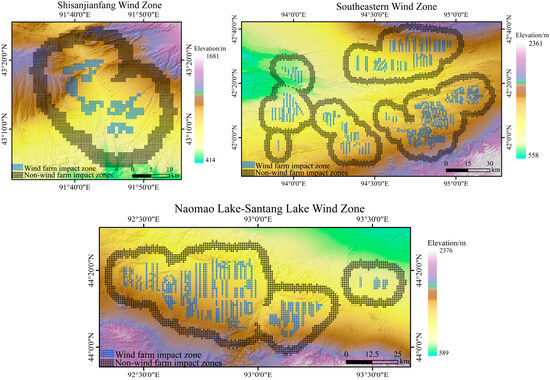
Figure 2.
Spatial Distribution of Wind Farm Impact and Non-Impact Areas at 0.01° Resolution.
2.3.4. Classification of Upwind and Downwind Areas
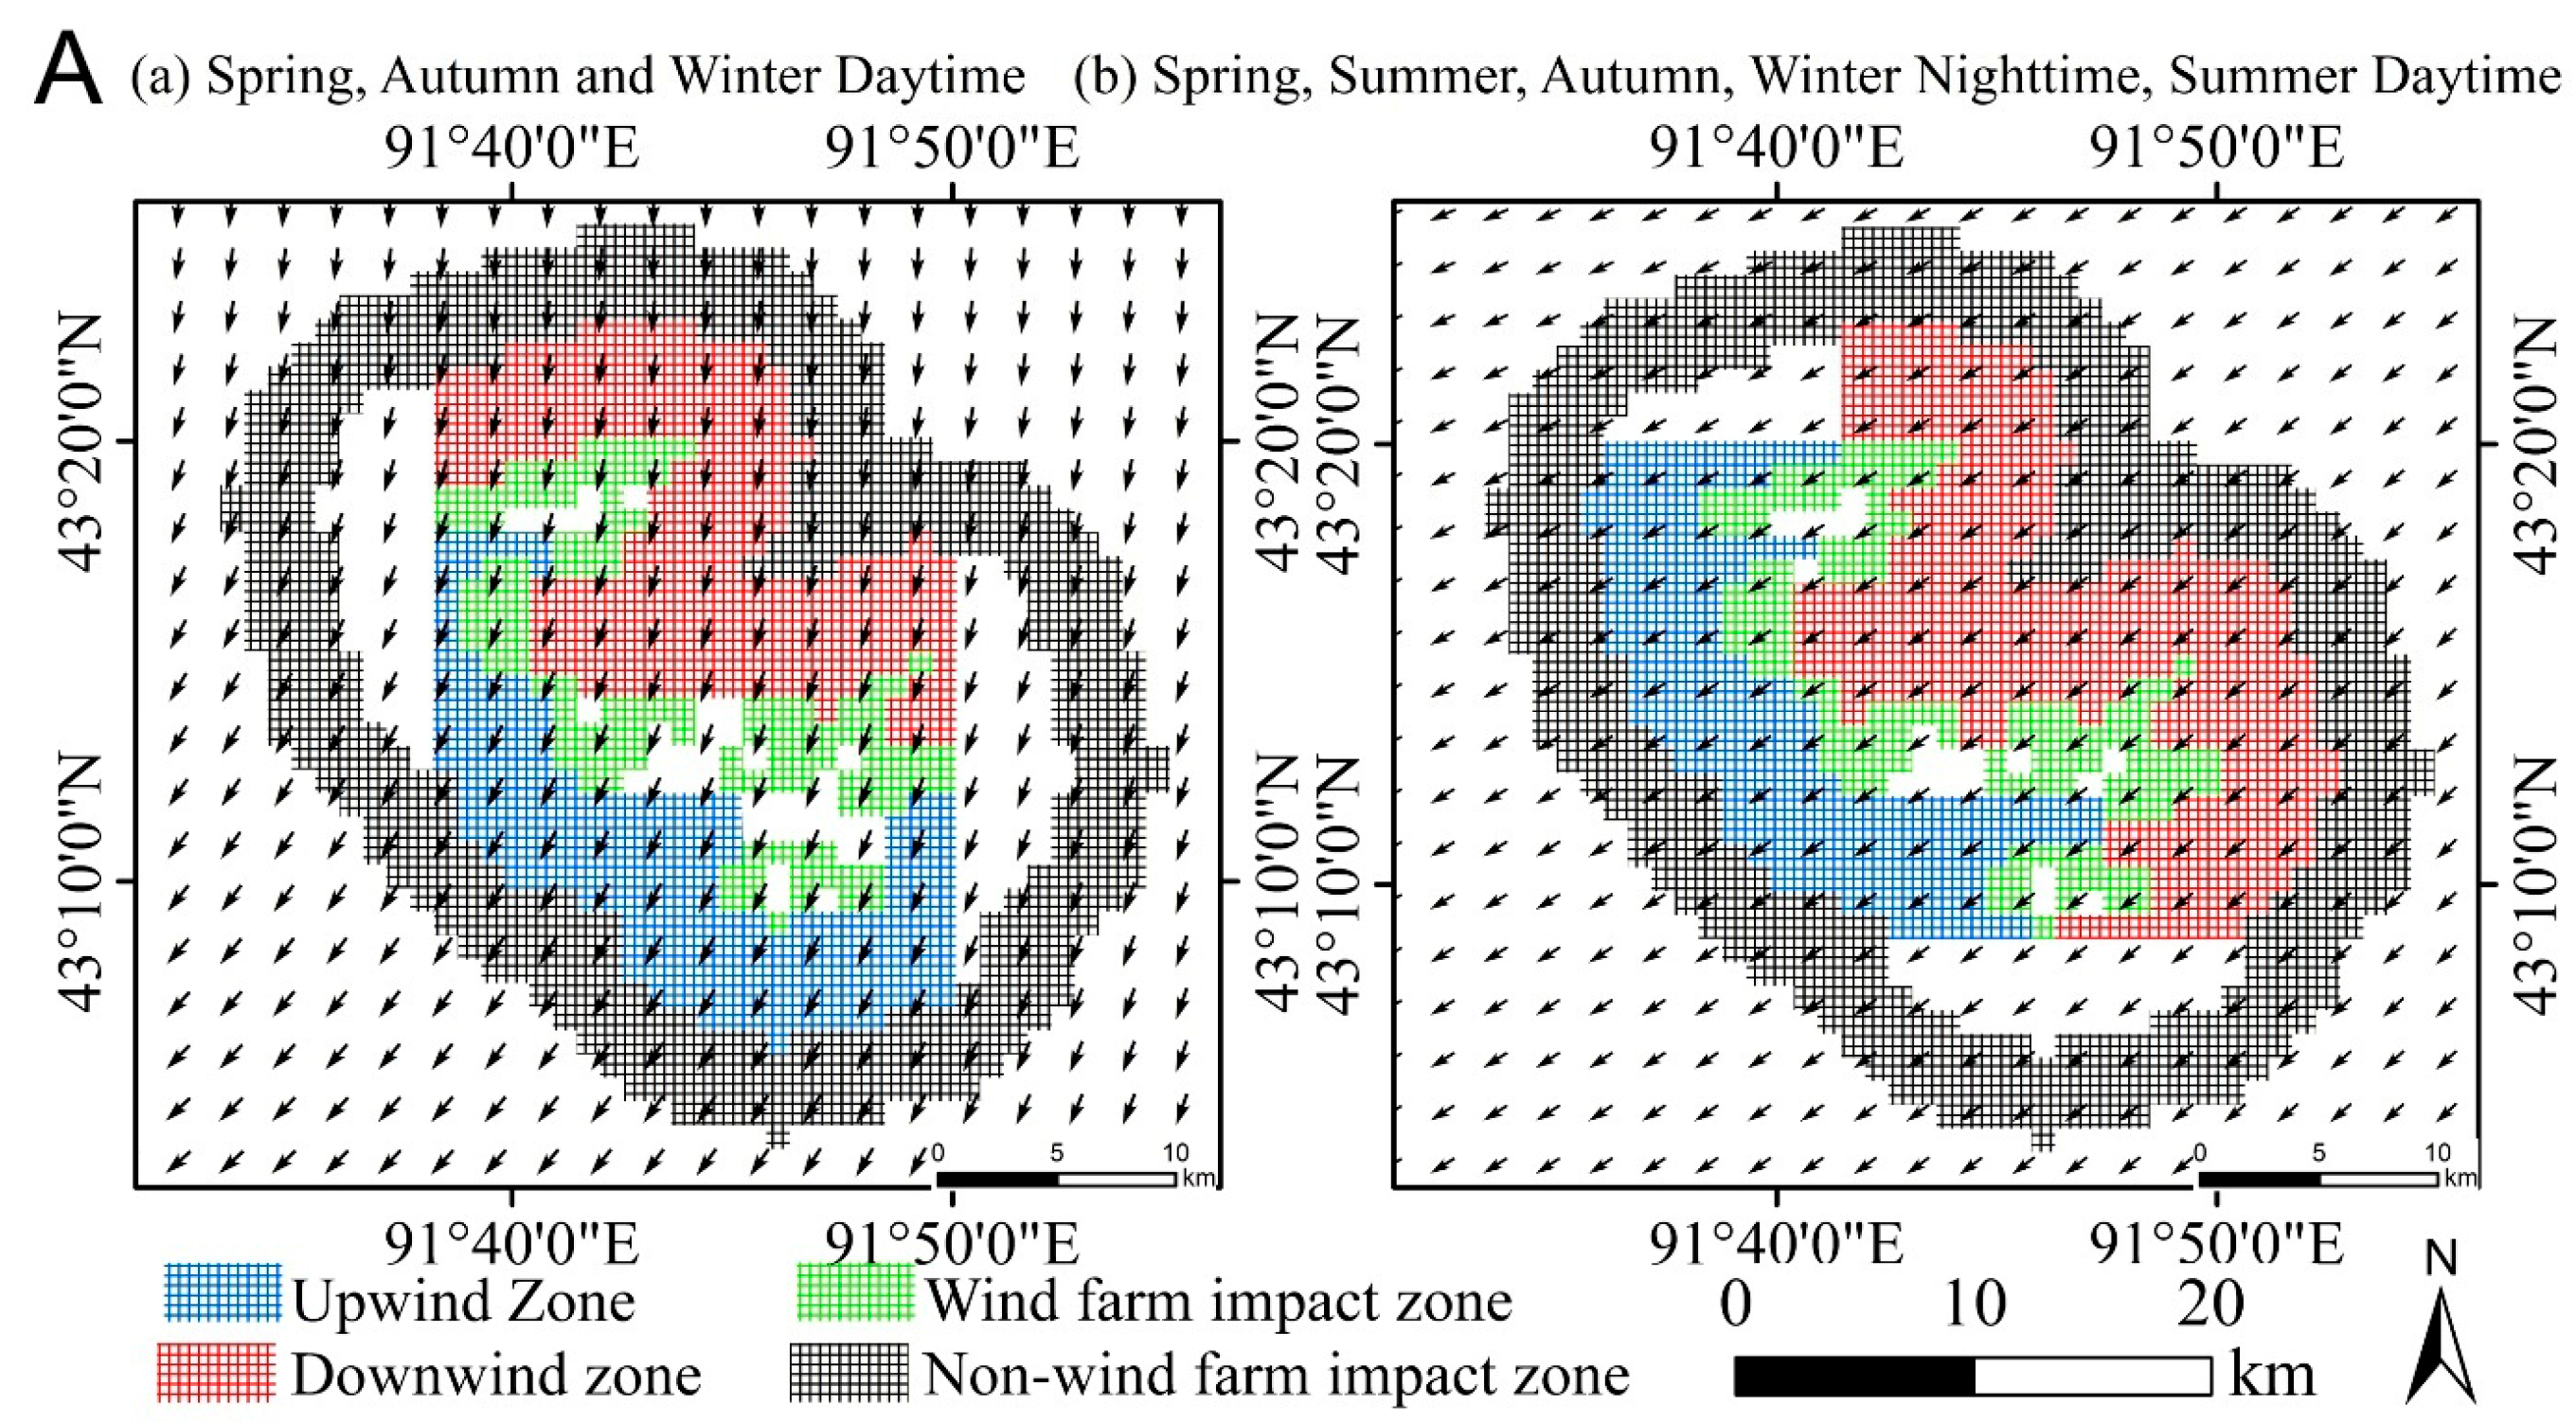
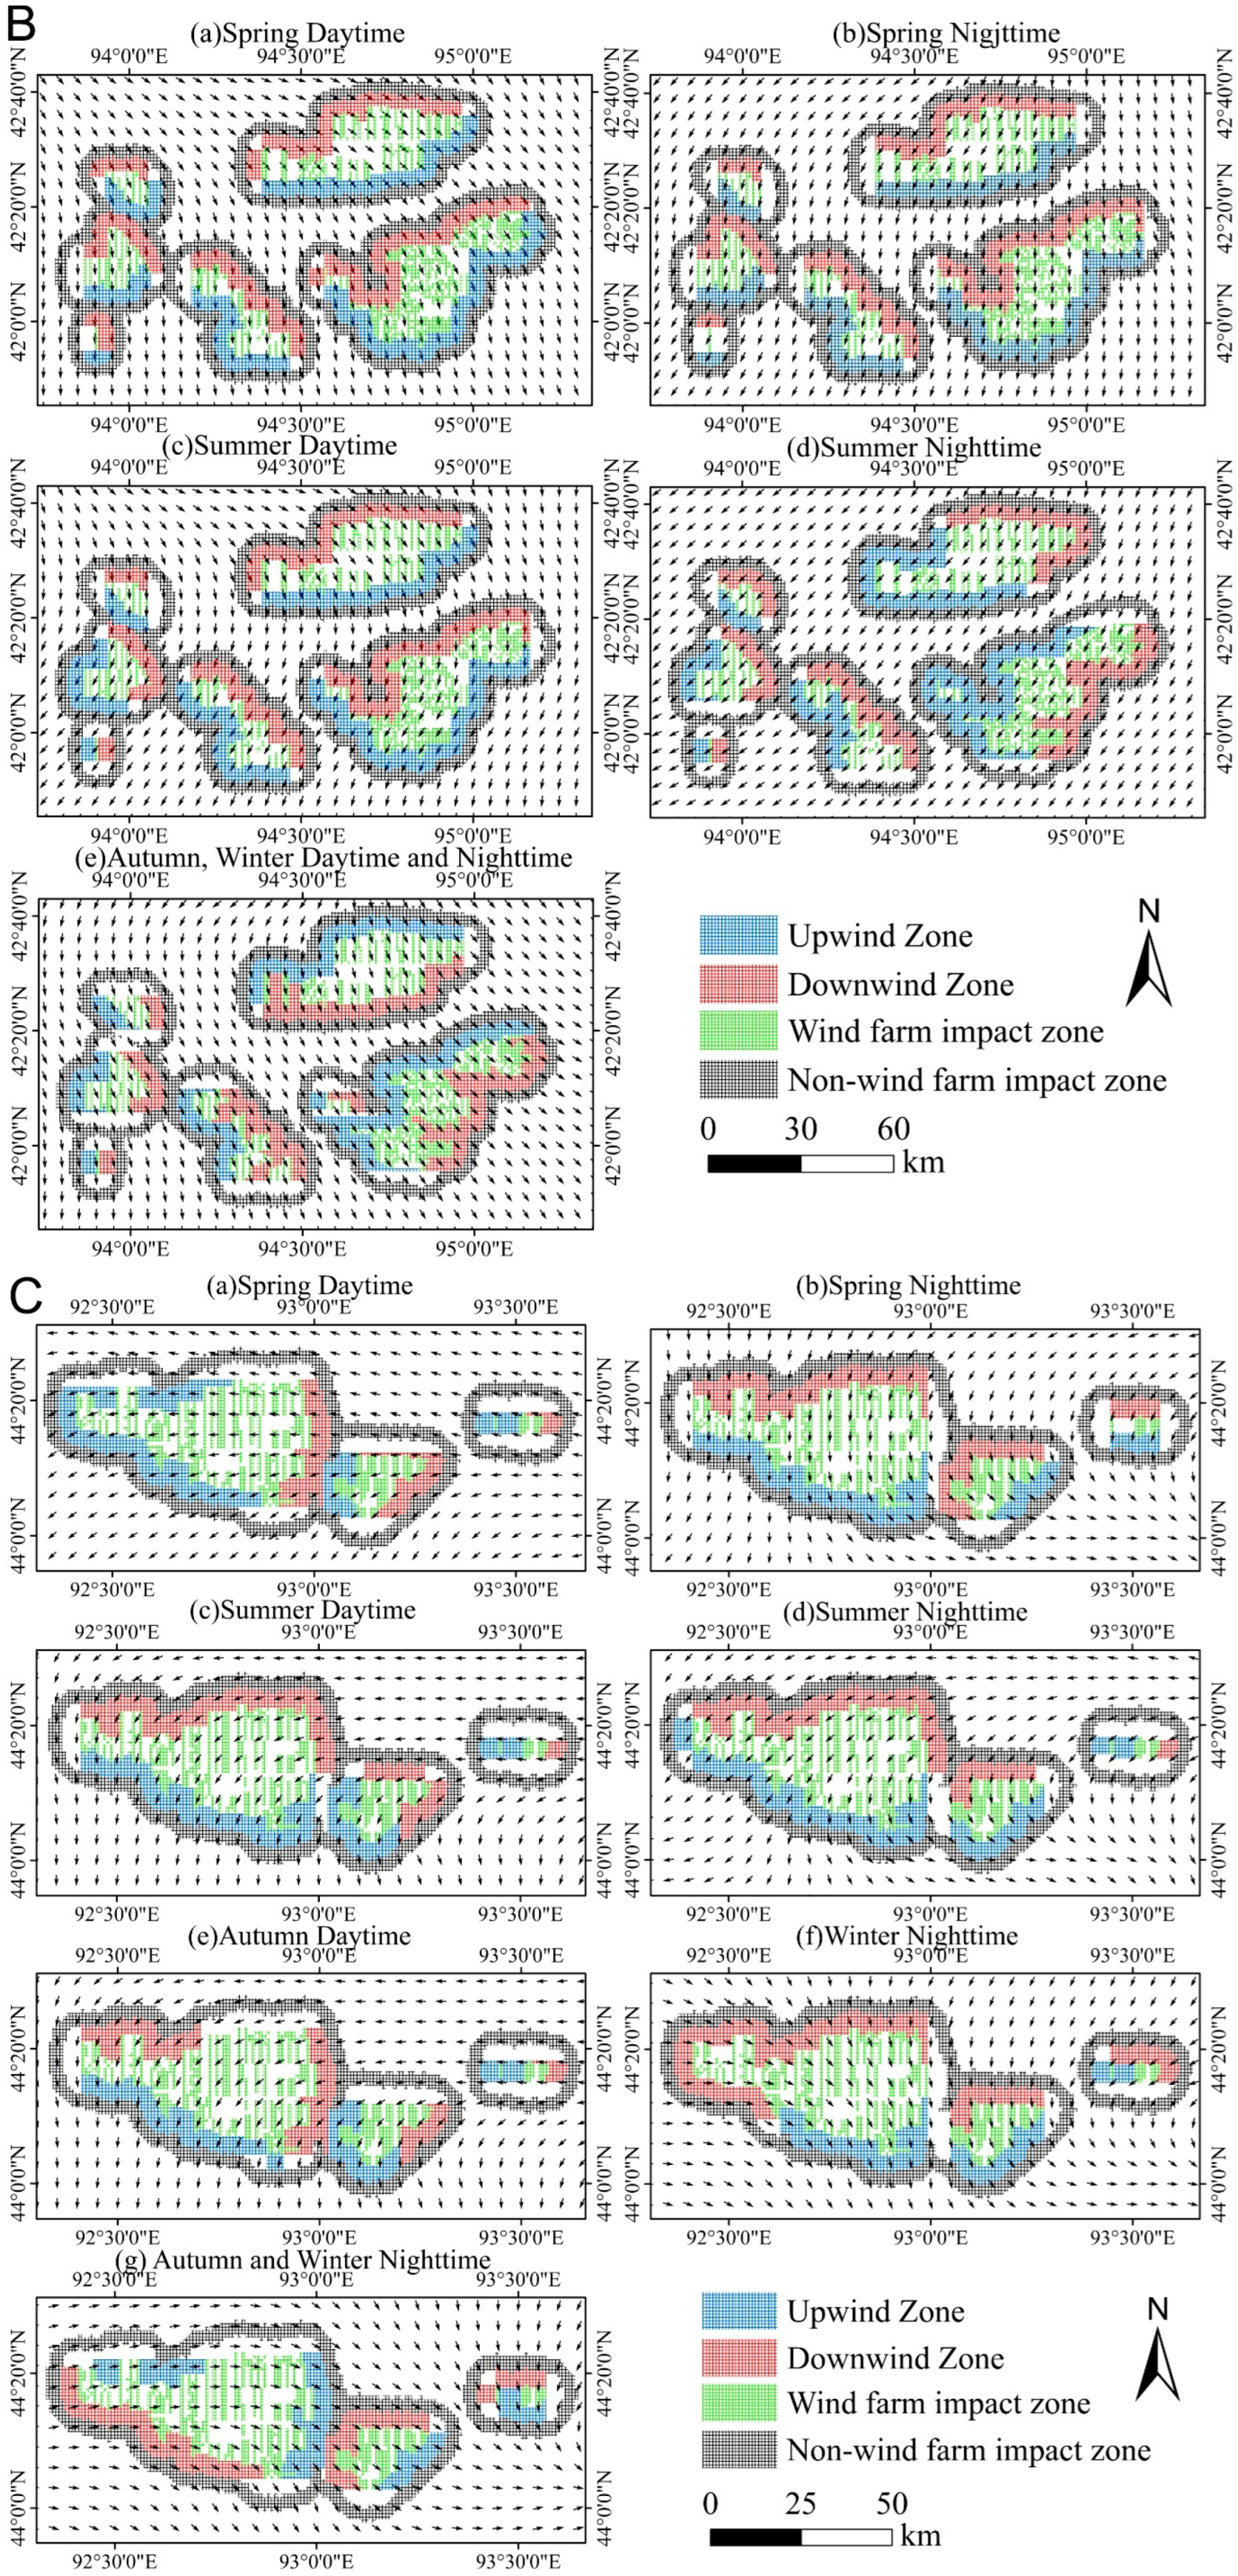
Wind farm effects on LST are often stronger in downwind areas due to enhanced turbulence in the wake zone [15]. Using seasonal 100 m wind vectors from ERA5 reanalysis, the transitional buffer zone was partitioned into upwind and downwind sectors relative to the prevailing wind direction. Differences in RALST before and after construction were compared between these zones (Figure 3) to evaluate the impact of wind direction.
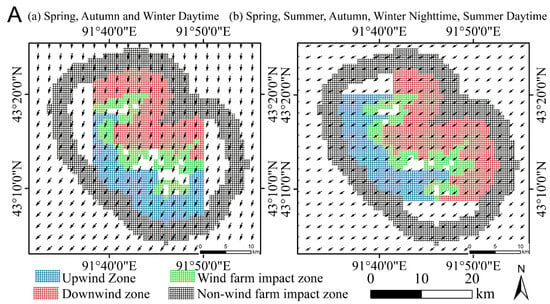
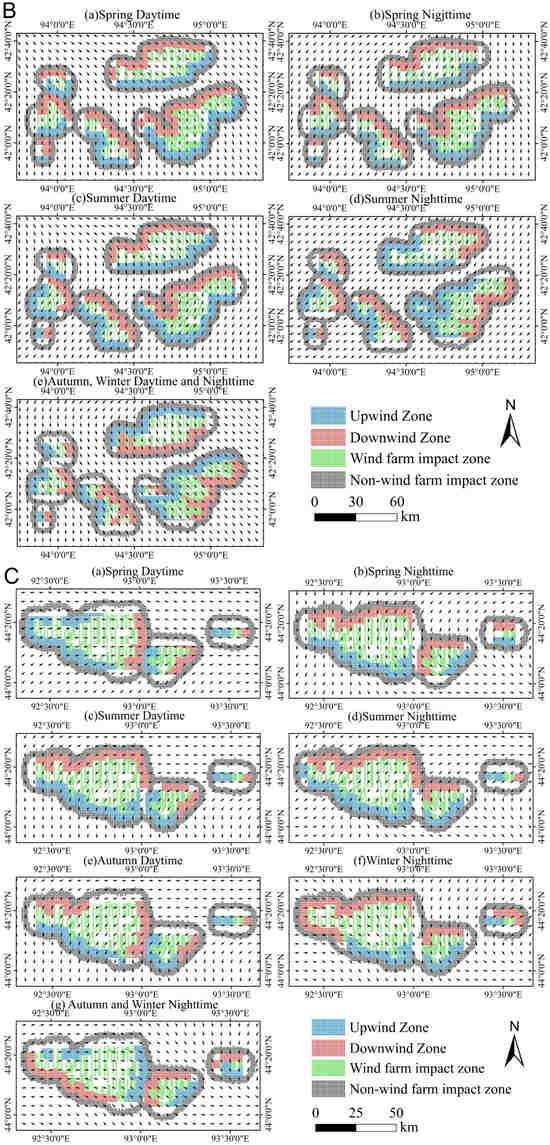
Figure 3.
Upwind and Downwind Areas in the Three Wind Zones at 0.01° Resolution Caption: (A) Shisanjianfang Wind Zone, (B) Southeast Wind Zone, and (C) Naomao Lake–Santang Lake Wind Zone. Green areas represent wind farm impact areas; black areas indicate non-wind farm impact areas.
2.3.5. Theil–Sen–Mann–Kendall Trend Analysis Method
The Theil–Sen estimator and the Mann–Kendall test are non-parametric statistical techniques widely used for trend analysis in time-series data. The Theil–Sen estimator does not require assumptions of serial autocorrelation or normality, which makes it particularly suitable for long-term time-series analysis. It is also effective at handling outliers and missing values [32]. The Mann–Kendall test assesses the significance of detected trends and is robust to non-normal data distributions and nonlinear trends, making it a reliable choice for analyzing long-term datasets [33]. The formula for the Mann–Kendall test is as follows [34]:
where represent two different years on the time series. The Median refers to the median of the series, and β is the median of the slopes of the n(n − 1)/2 data points. If β > 0, it indicates an upward trend; β < 0, a downward trend; and if β = 0, a stable trend. In practical analysis, β values between 0 and 0.005 are considered stable. The statistical variable Z, where Z > 0 indicates an upward trend and Z < 0 indicates a downward trend, is used to test significance. In this study, the significance of trends was assessed based on commonly accepted Z-value thresholds: 3.29 for 99.99%, 2.58 for 99.9%, and 1.96 for 99.5% confidence levels, consistent with established non-parametric trend analysis practice [33]. These values were categorized into four significance levels: strongly significant, more significant, significant, and non-significant.
2.3.6. Effect Size
To quantify the practical impact of wind farms on LST differences between directional sectors, effect size was calculated using Cohen’s d:
where and are the mean LST values for upwind and downwind areas, respectively, and SD is the pooled standard deviation:
where and are the sample sizes of the two groups, and and represent the standard deviations of the respective groups. Effect sizes were interpreted as small (d = 0.2), medium (d = 0.5), or large (d ≥ 0.8) [35].
2.3.7. Random Forest Regression Model
We applied the Random Forest (RF) regression model to investigate the contribution of multiple environmental and climatic factors to Land Surface Temperature (LST) variations across the study regions. RF is an ensemble learning method based on bootstrap aggregation (Bagging), which constructs a large number of decision trees and aggregates their predictions to reduce variance and improve robustness, particularly when dealing with high-dimensional and nonlinear data structures.
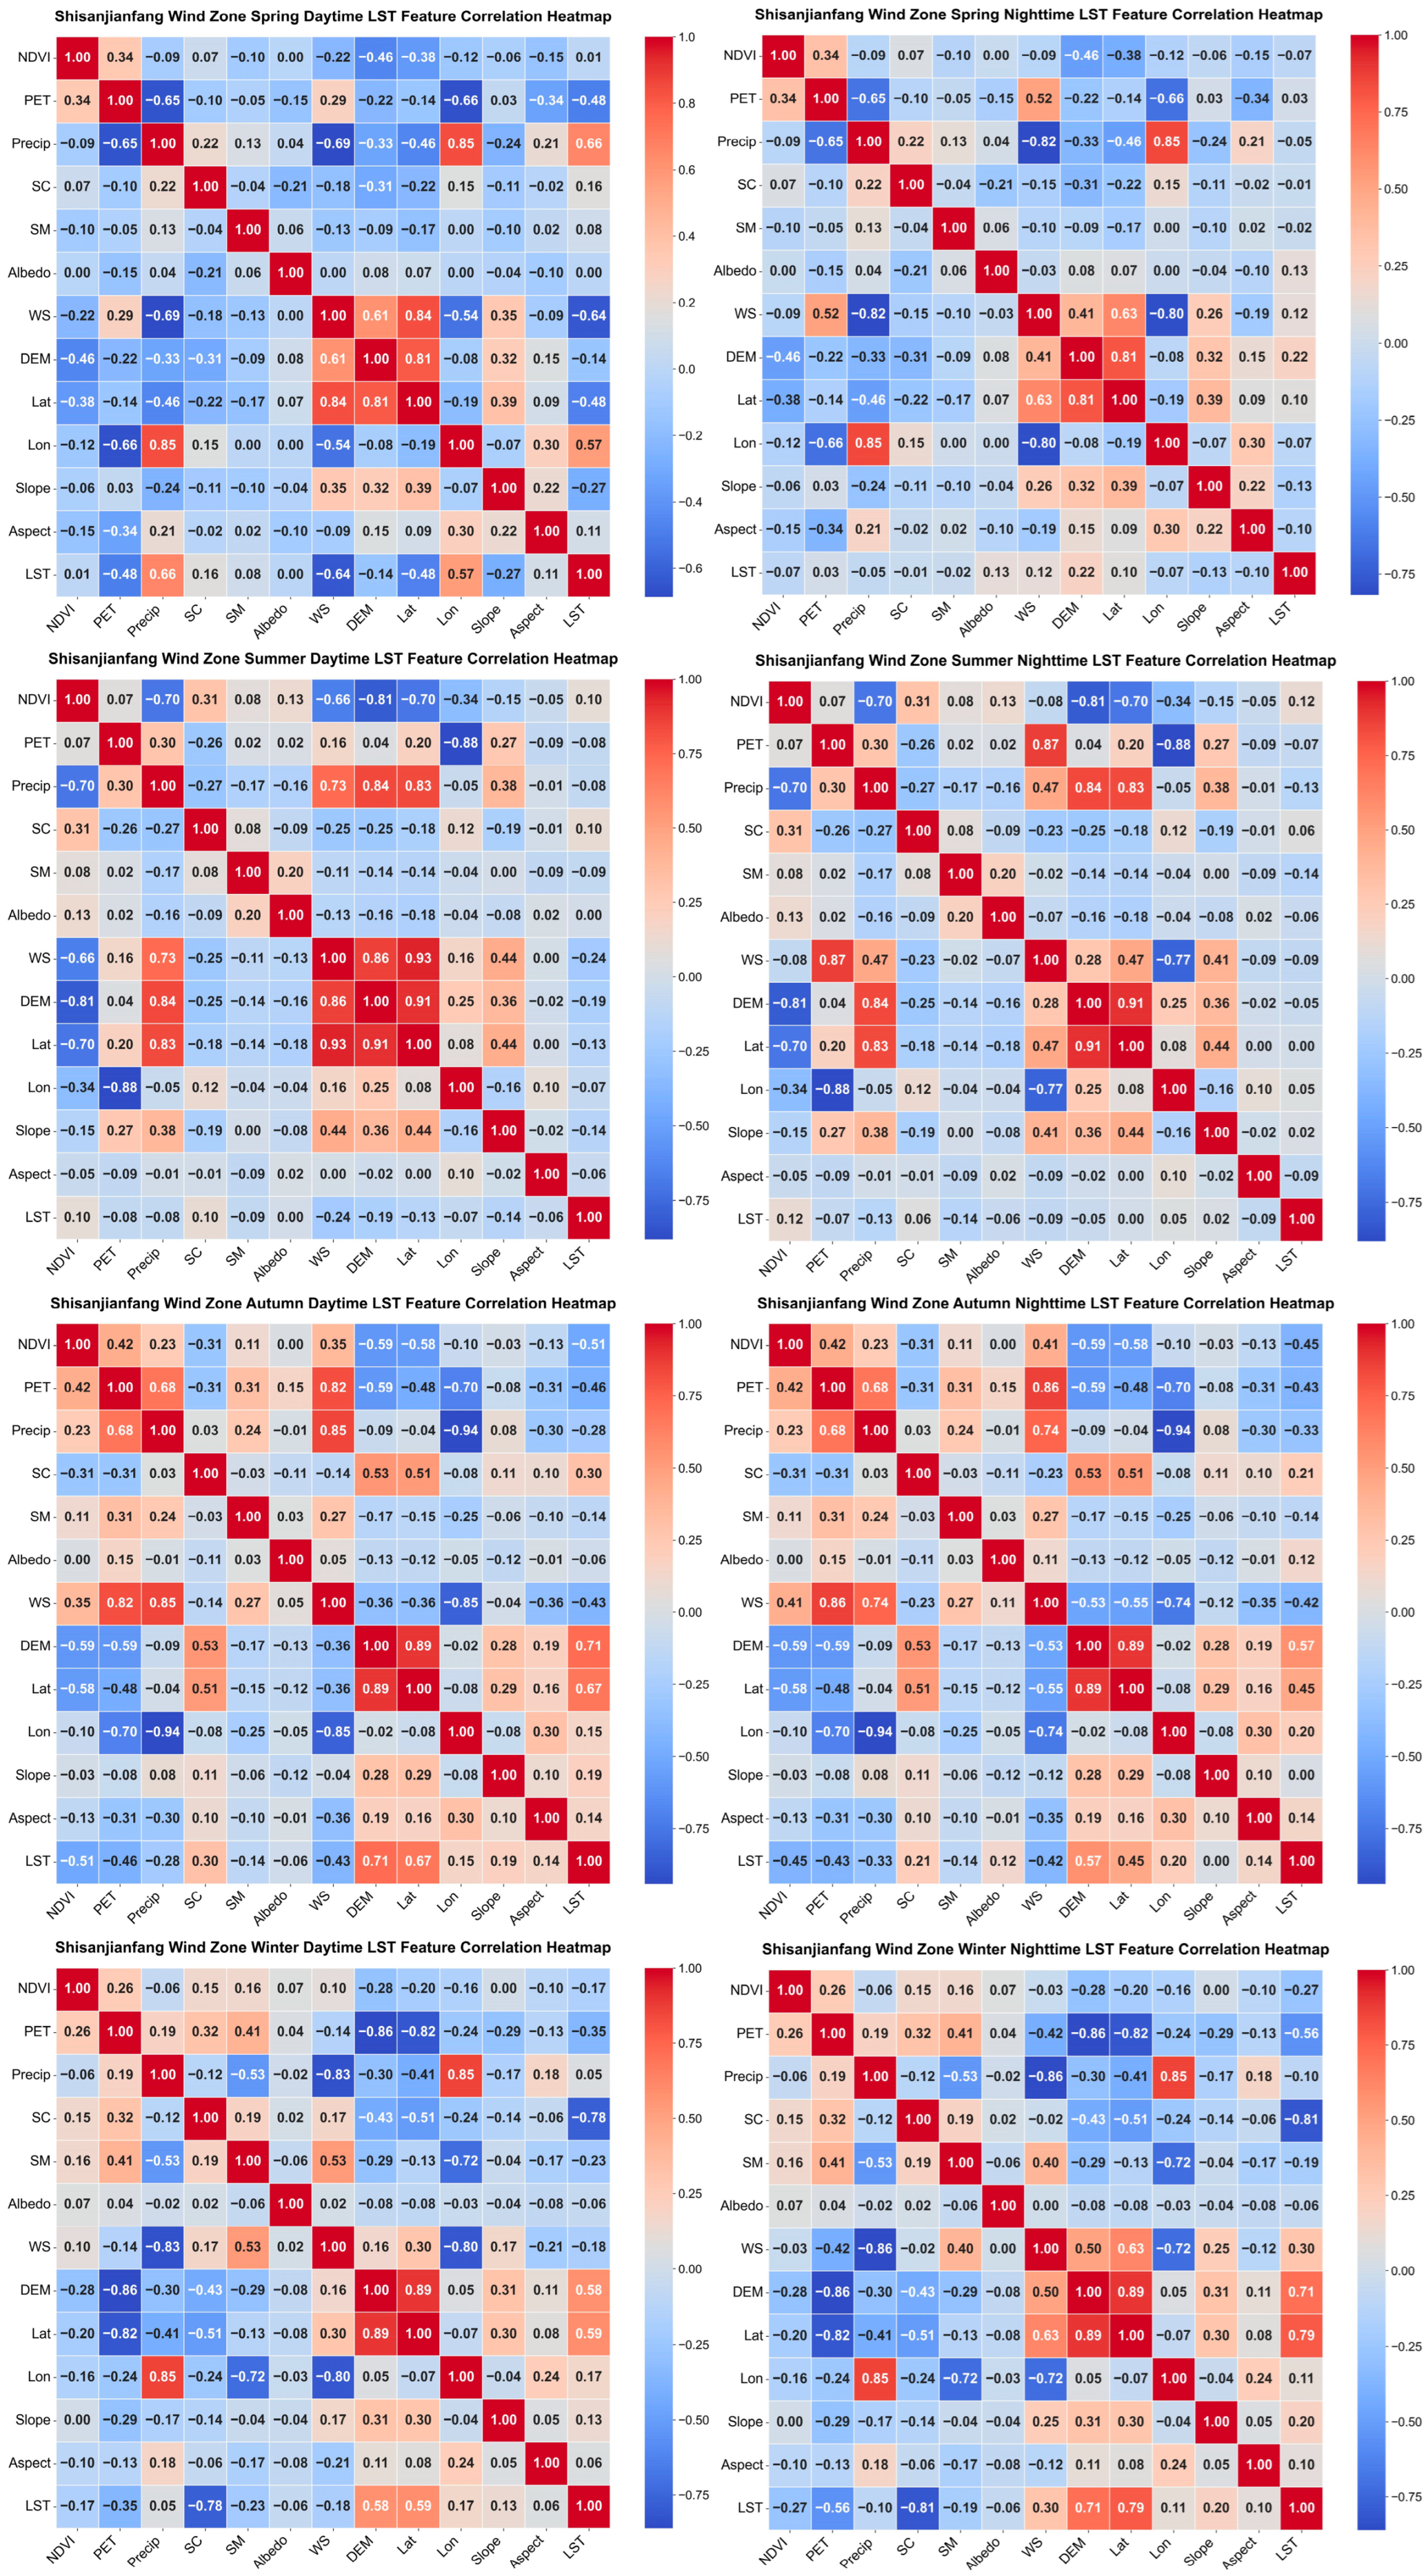
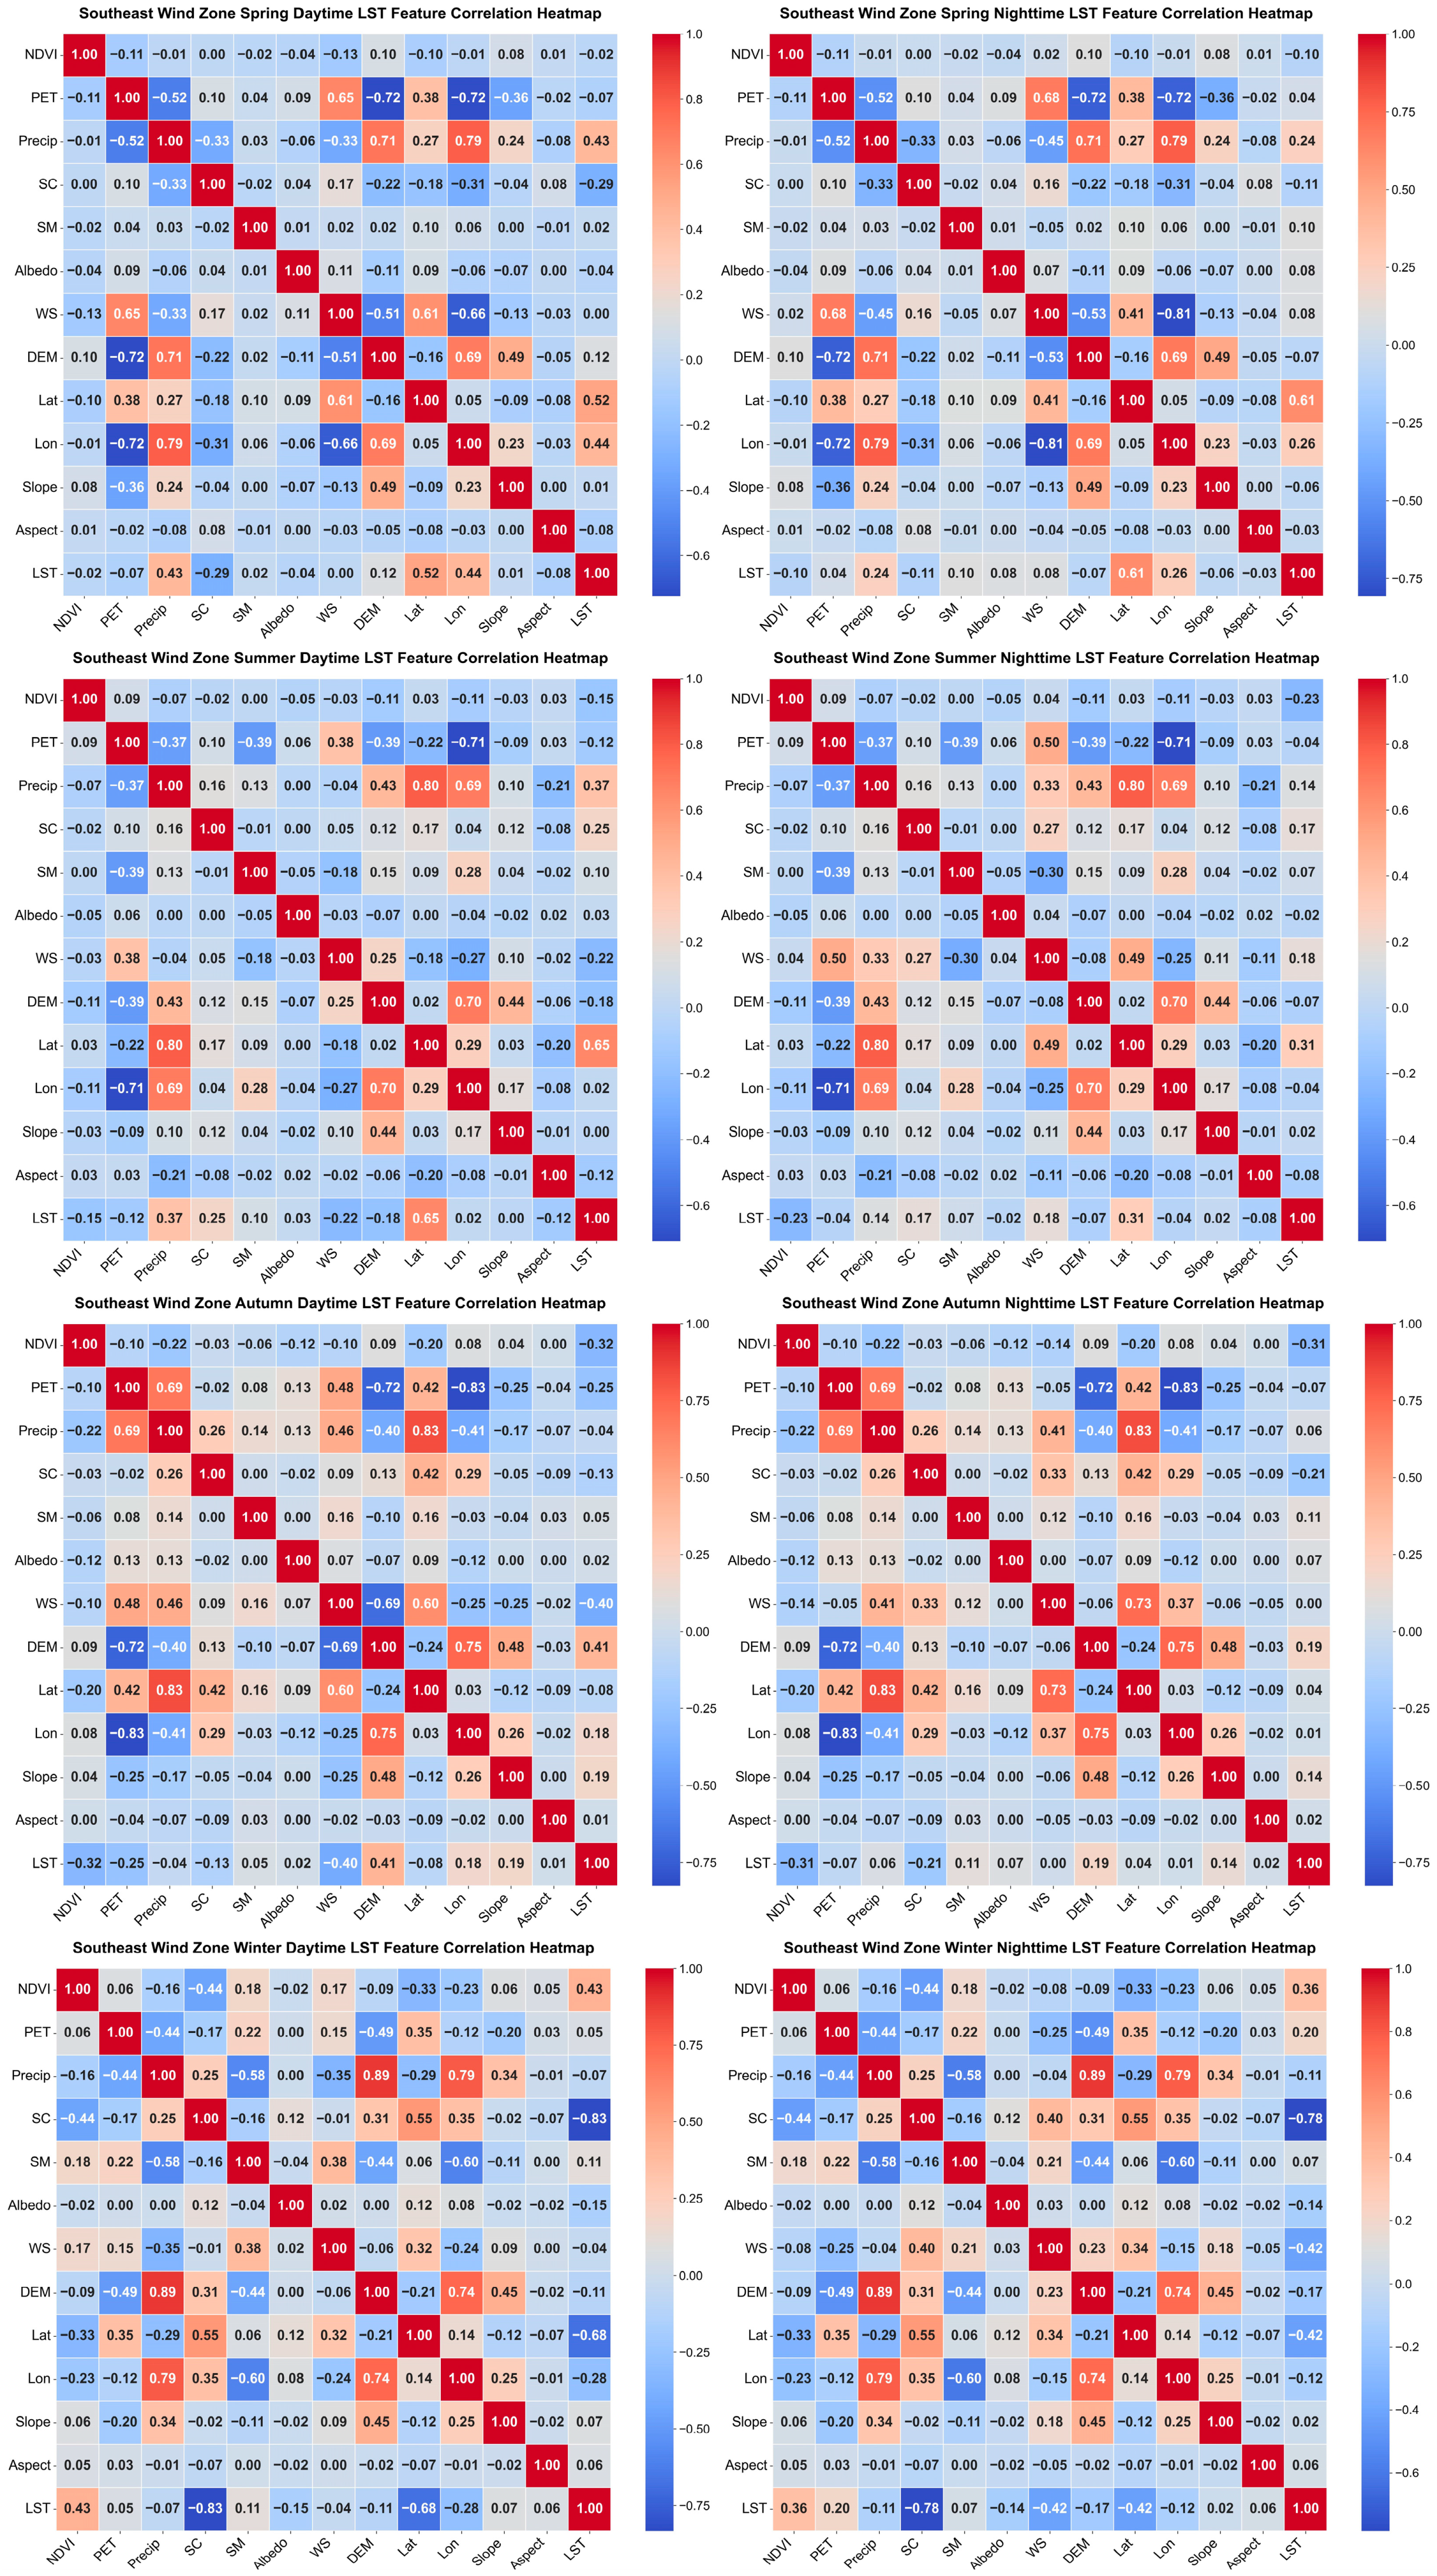
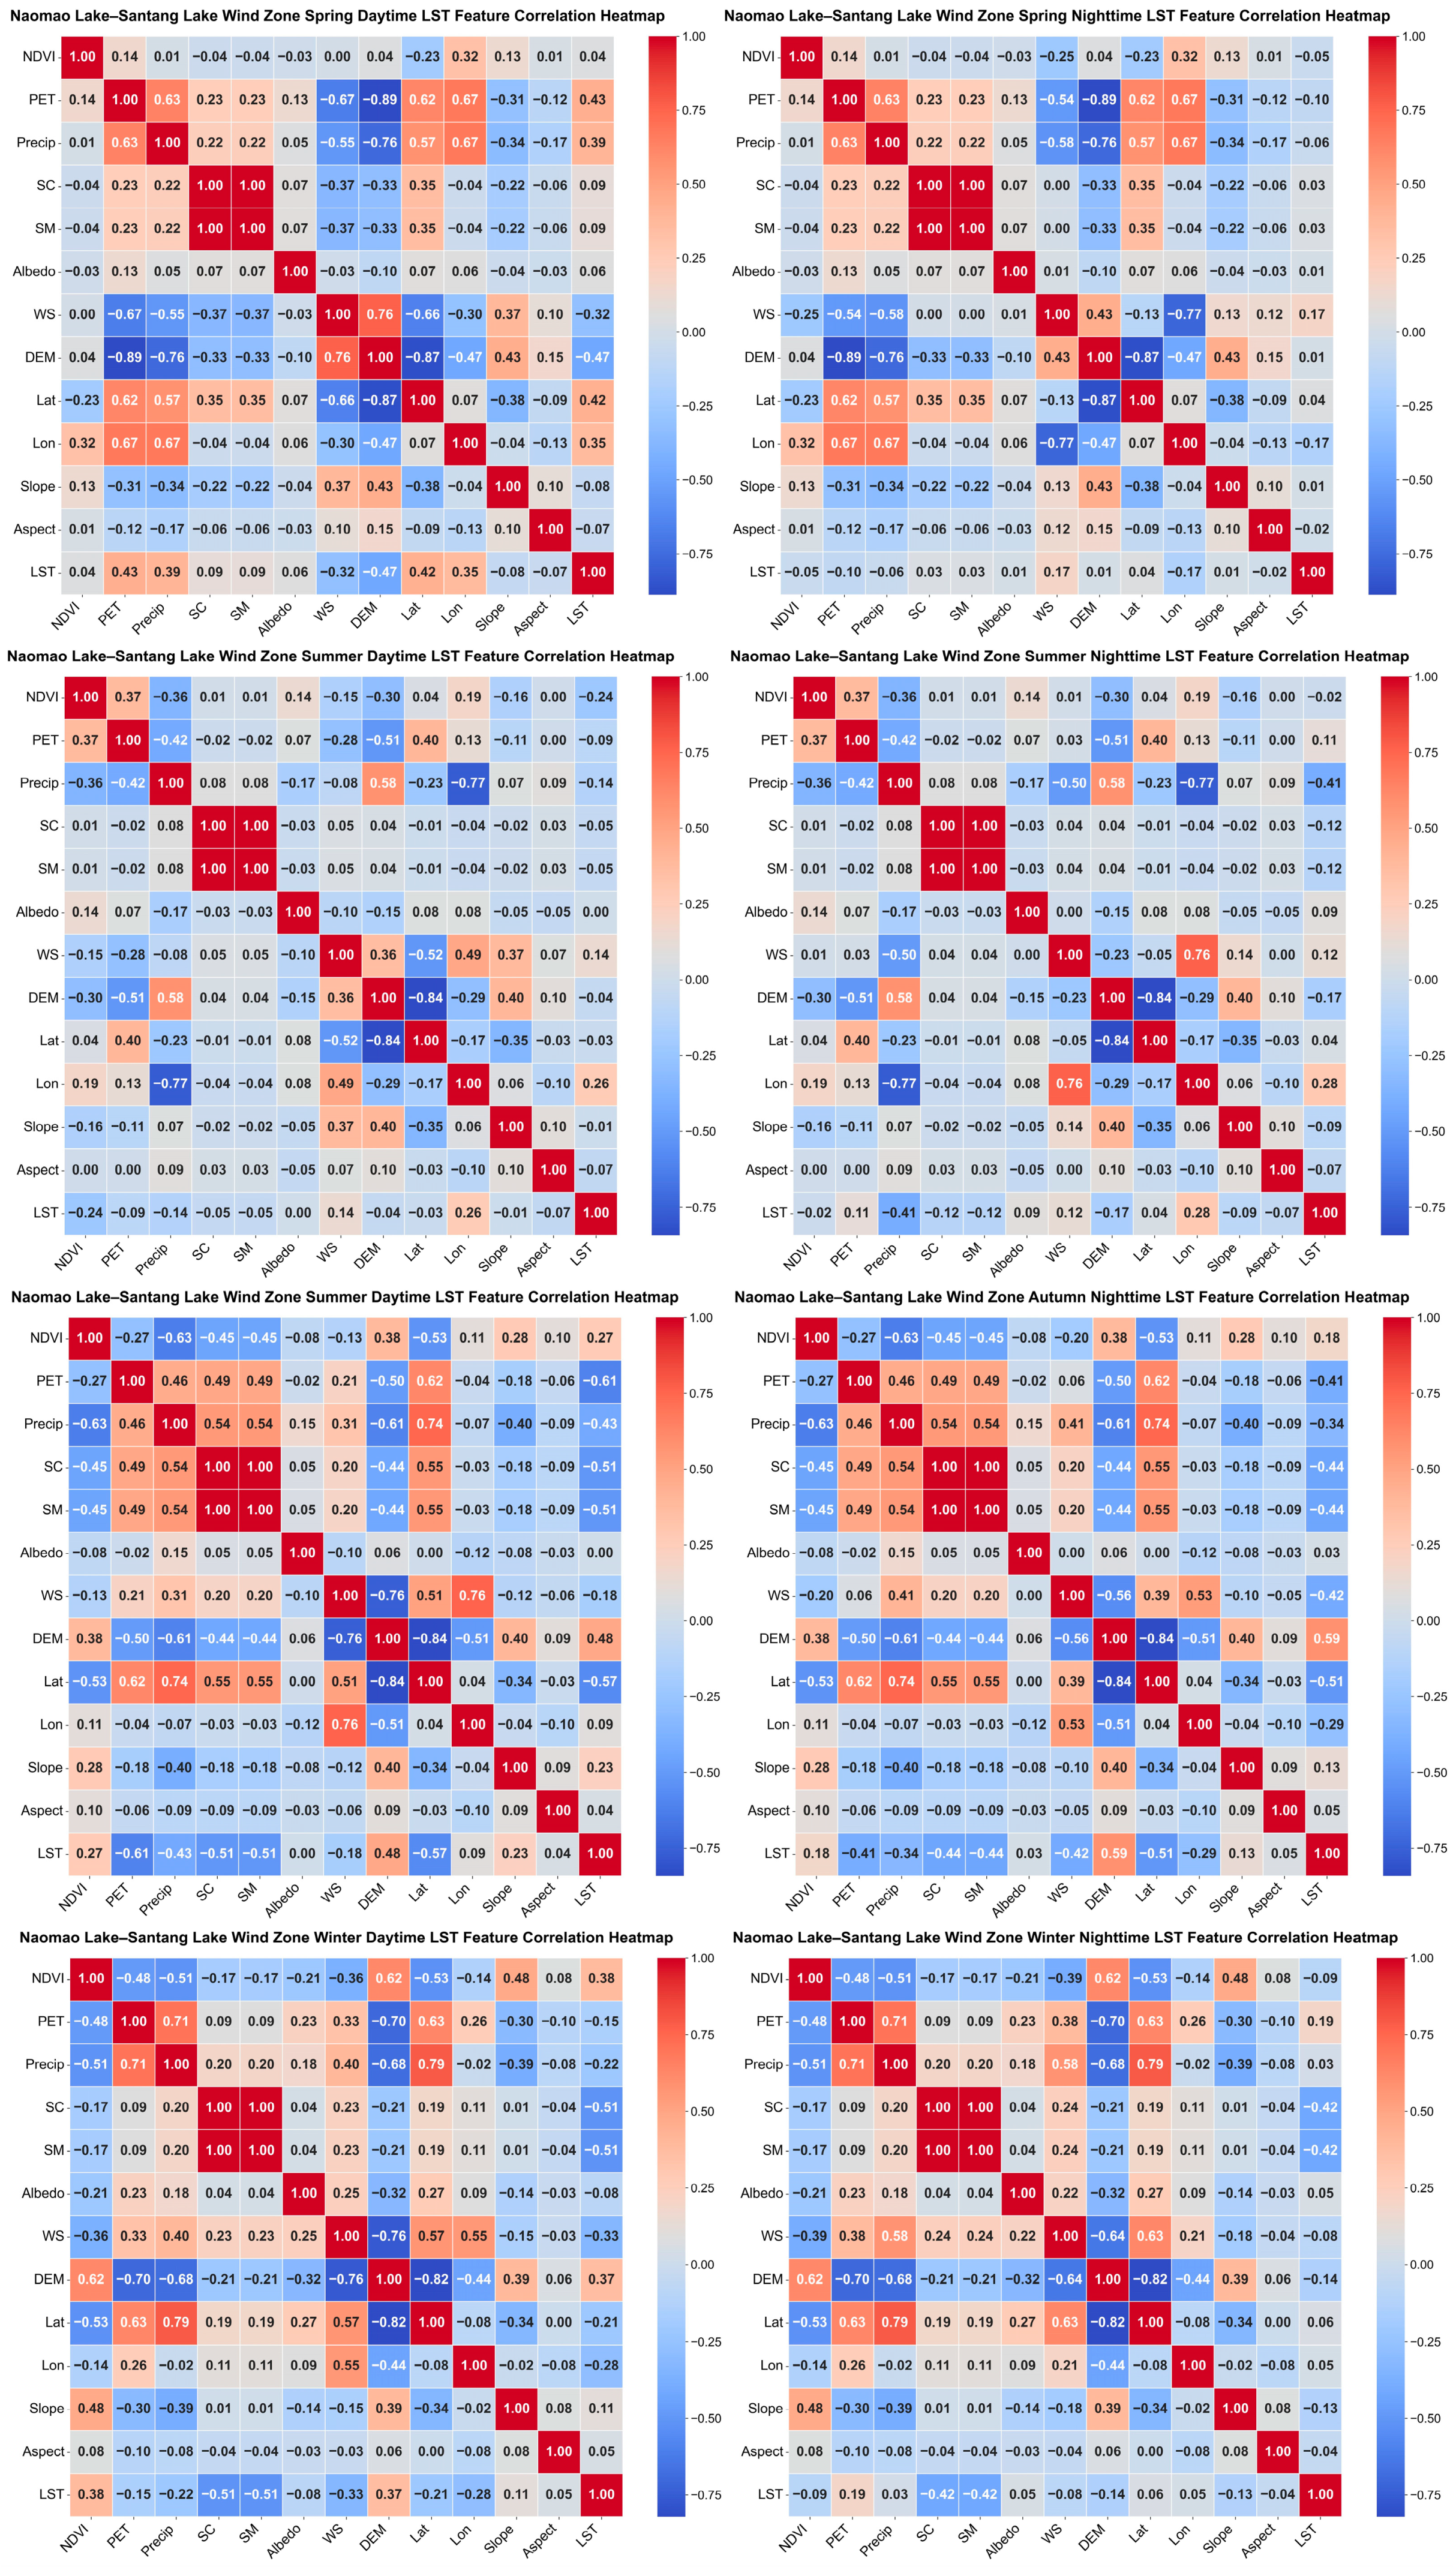
In this study, the RF model was trained using a long-term remote sensing dataset (2008–2022), including vegetation indices (NDVI), hydrometeorological variables (precipitation, potential evapotranspiration (PET), snow cover, soil moisture, surface albedo, wind speed), and topographic–geographic features (DEM, slope, aspect, latitude, and longitude). These variables were selected for their relevance to LST regulation under arid climatic conditions.
To evaluate the contribution of each predictor, we computed variable importance using the Mean Decrease in Impurity (MDI) criterion. Specifically, each split in the decision trees was associated with a reduction in node impurity—measured by the mean squared error (MSE) for regression—which was accumulated across all trees. The normalized importance scores were then used to assess the relative influence of individual variables on LST.
Separate RF models were constructed for three wind power regions (Shisanjianfang, Southeast, and Naomao Lake–Santang Lake Wind Zones) and for different seasons and diurnal periods to capture spatial–temporal variability. The model was implemented in Python 3.8 using the scikit-learn package, with the number of trees set to 500 and other hyperparameters kept at default values unless otherwise stated.
3. Results
3.1. Seasonal Trends in LST
To isolate the effects of wind farm operations on LST from confounding factors such as weather, climate variability, topography, and land use changes, a multi-faceted normalization approach was employed. Land use data from 2008 to 2022 indicated that the dominant land cover type across all three wind zones—Shisanjianfang Wind Zone, Southeast Wind Zone, and Naomao Lake–Santang Lake Wind Zone—remained stable and primarily desert, with no significant urban expansion or vegetation cover changes. Thus, land use change was excluded as a major driver of LST variation. To further control for long-term climatic influences, particularly global warming, we applied both temporal and spatial anomalies (detrending methods). The temporal anomaly approach involved comparing LST before and after wind farm construction to remove background warming trends and highlight localized temperature shifts induced by turbine operations. However, recognizing that regional warming rates may vary spatially, we also used spatial anomalies. This method compared LST changes in wind farm areas with those in nearby unaffected zones under the same climatic conditions, enabling the extraction of localized thermal signals attributable to wind farms while minimizing the influence of large-scale climate change. By integrating both temporal and spatial anomalies, this dual approach enhances the attribution accuracy of LST changes to wind farm activity, thereby improving the reliability of the findings.
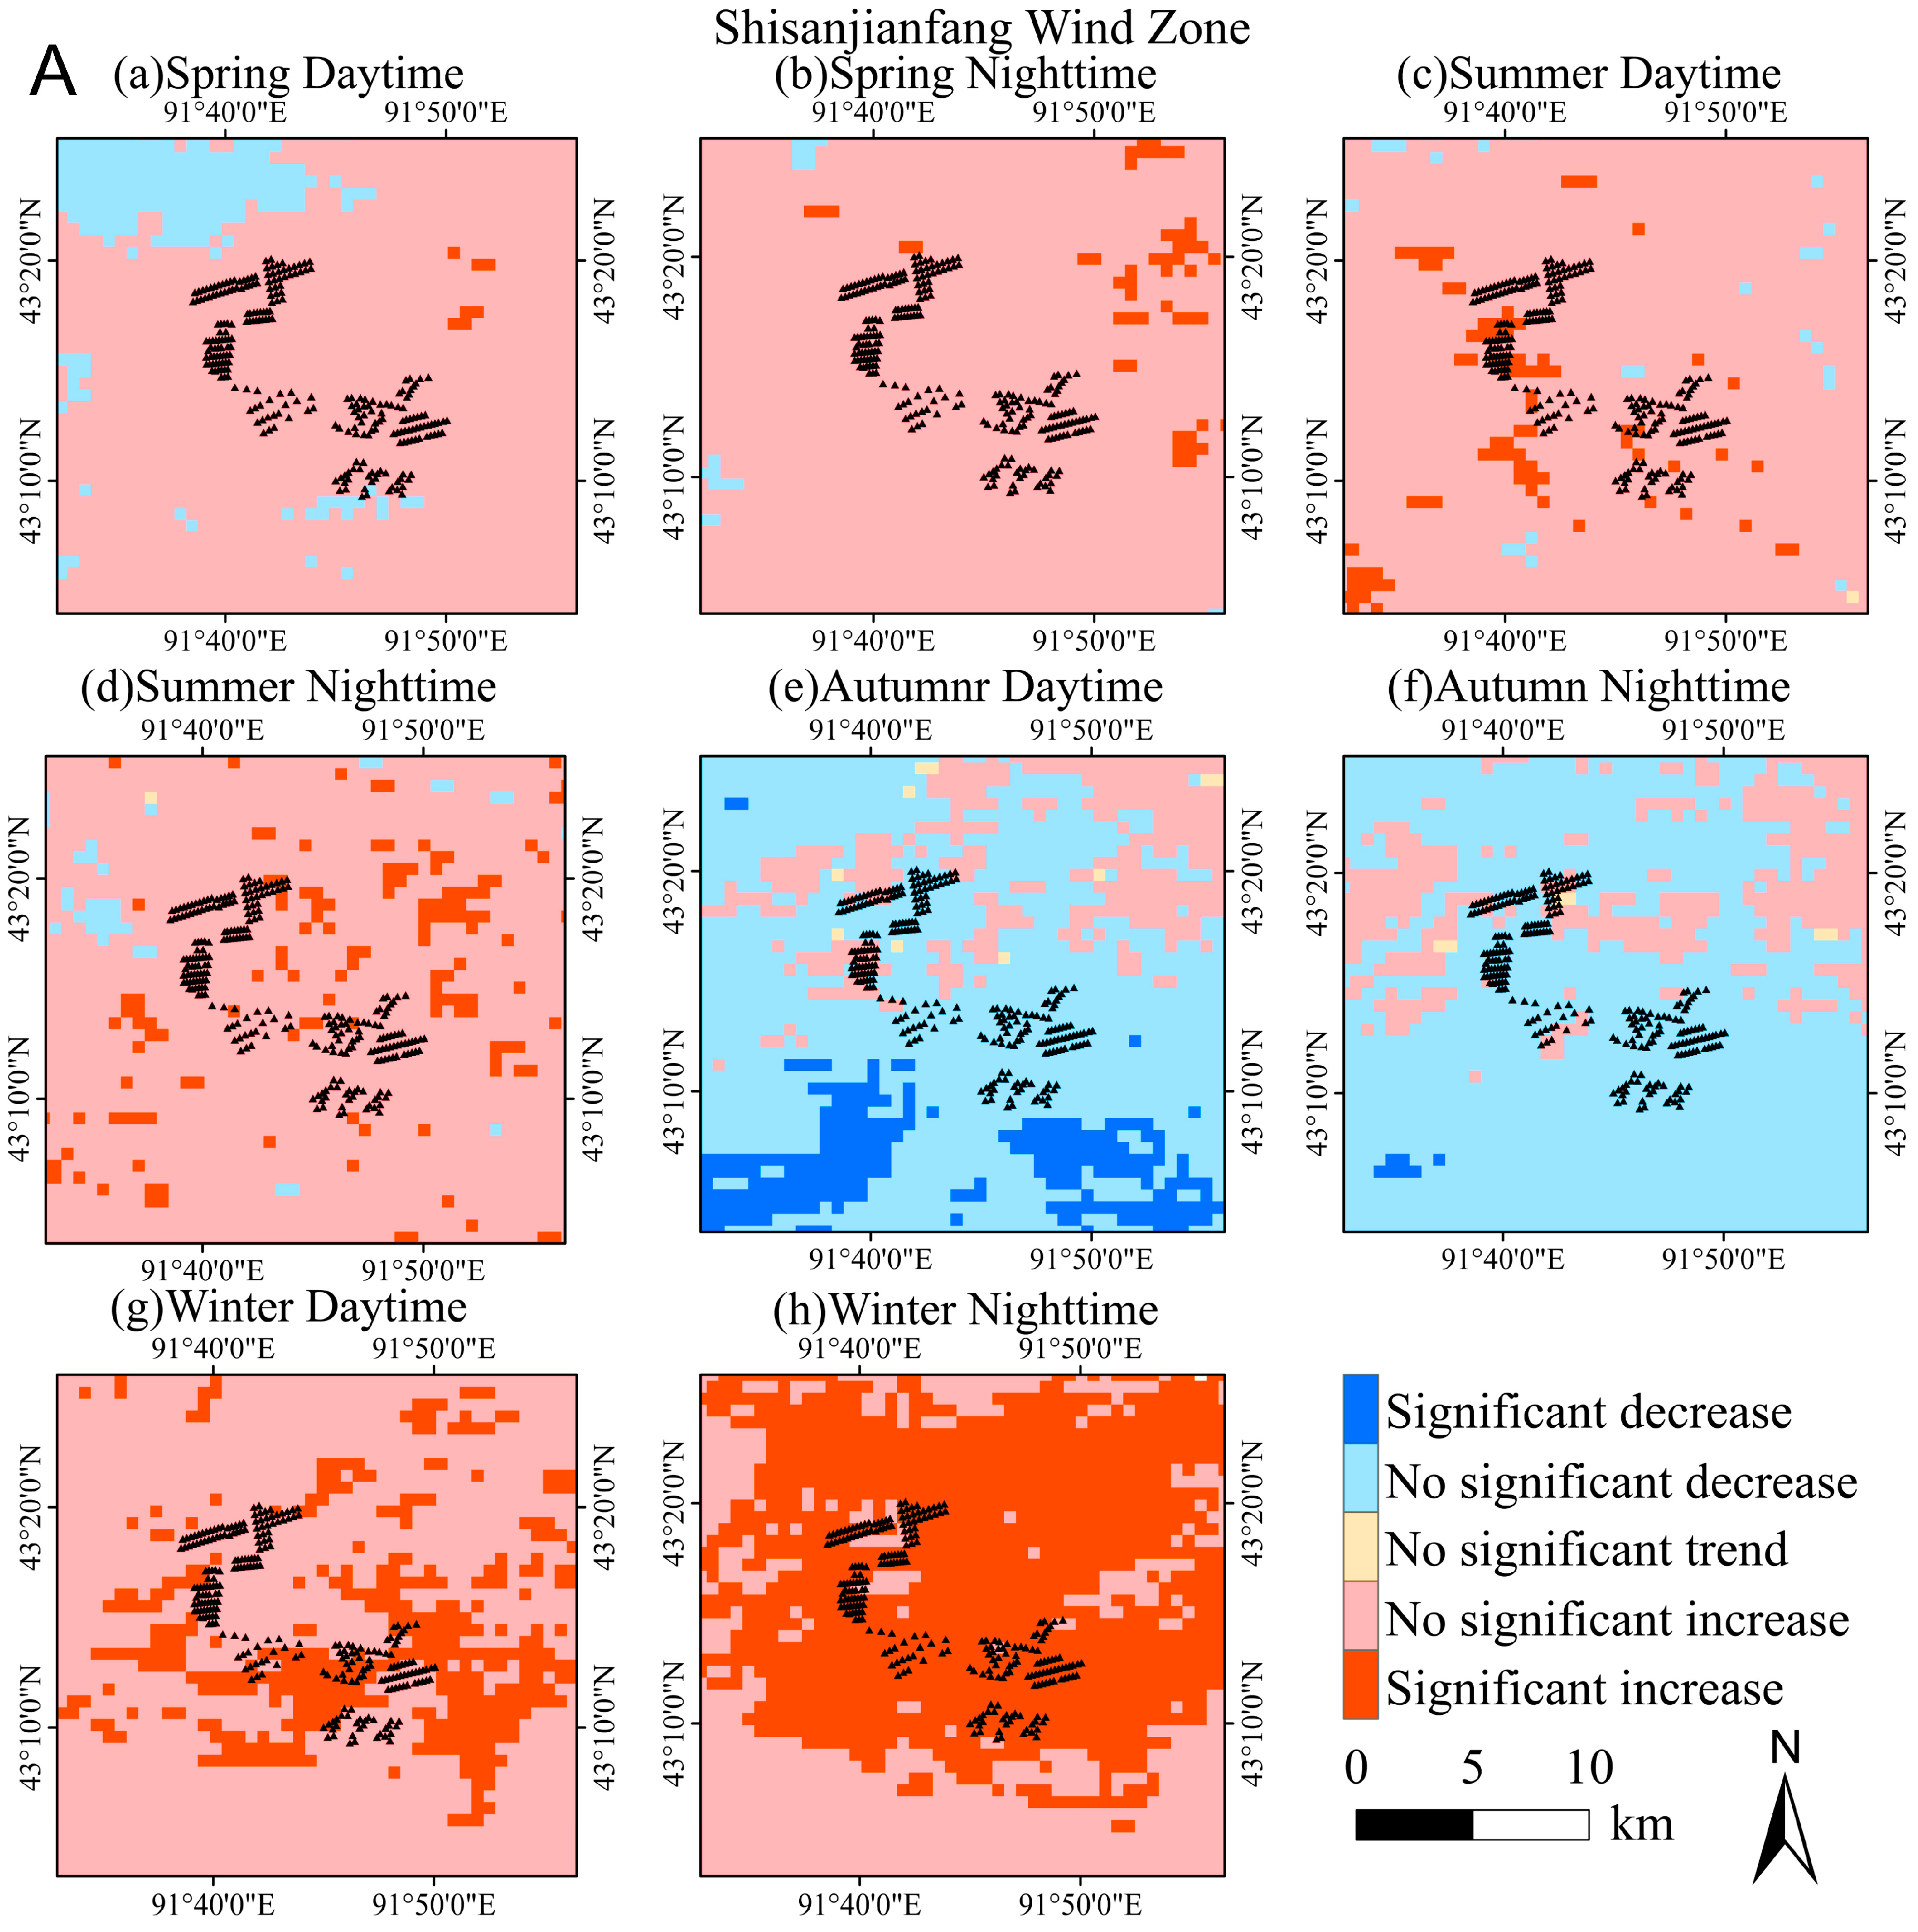
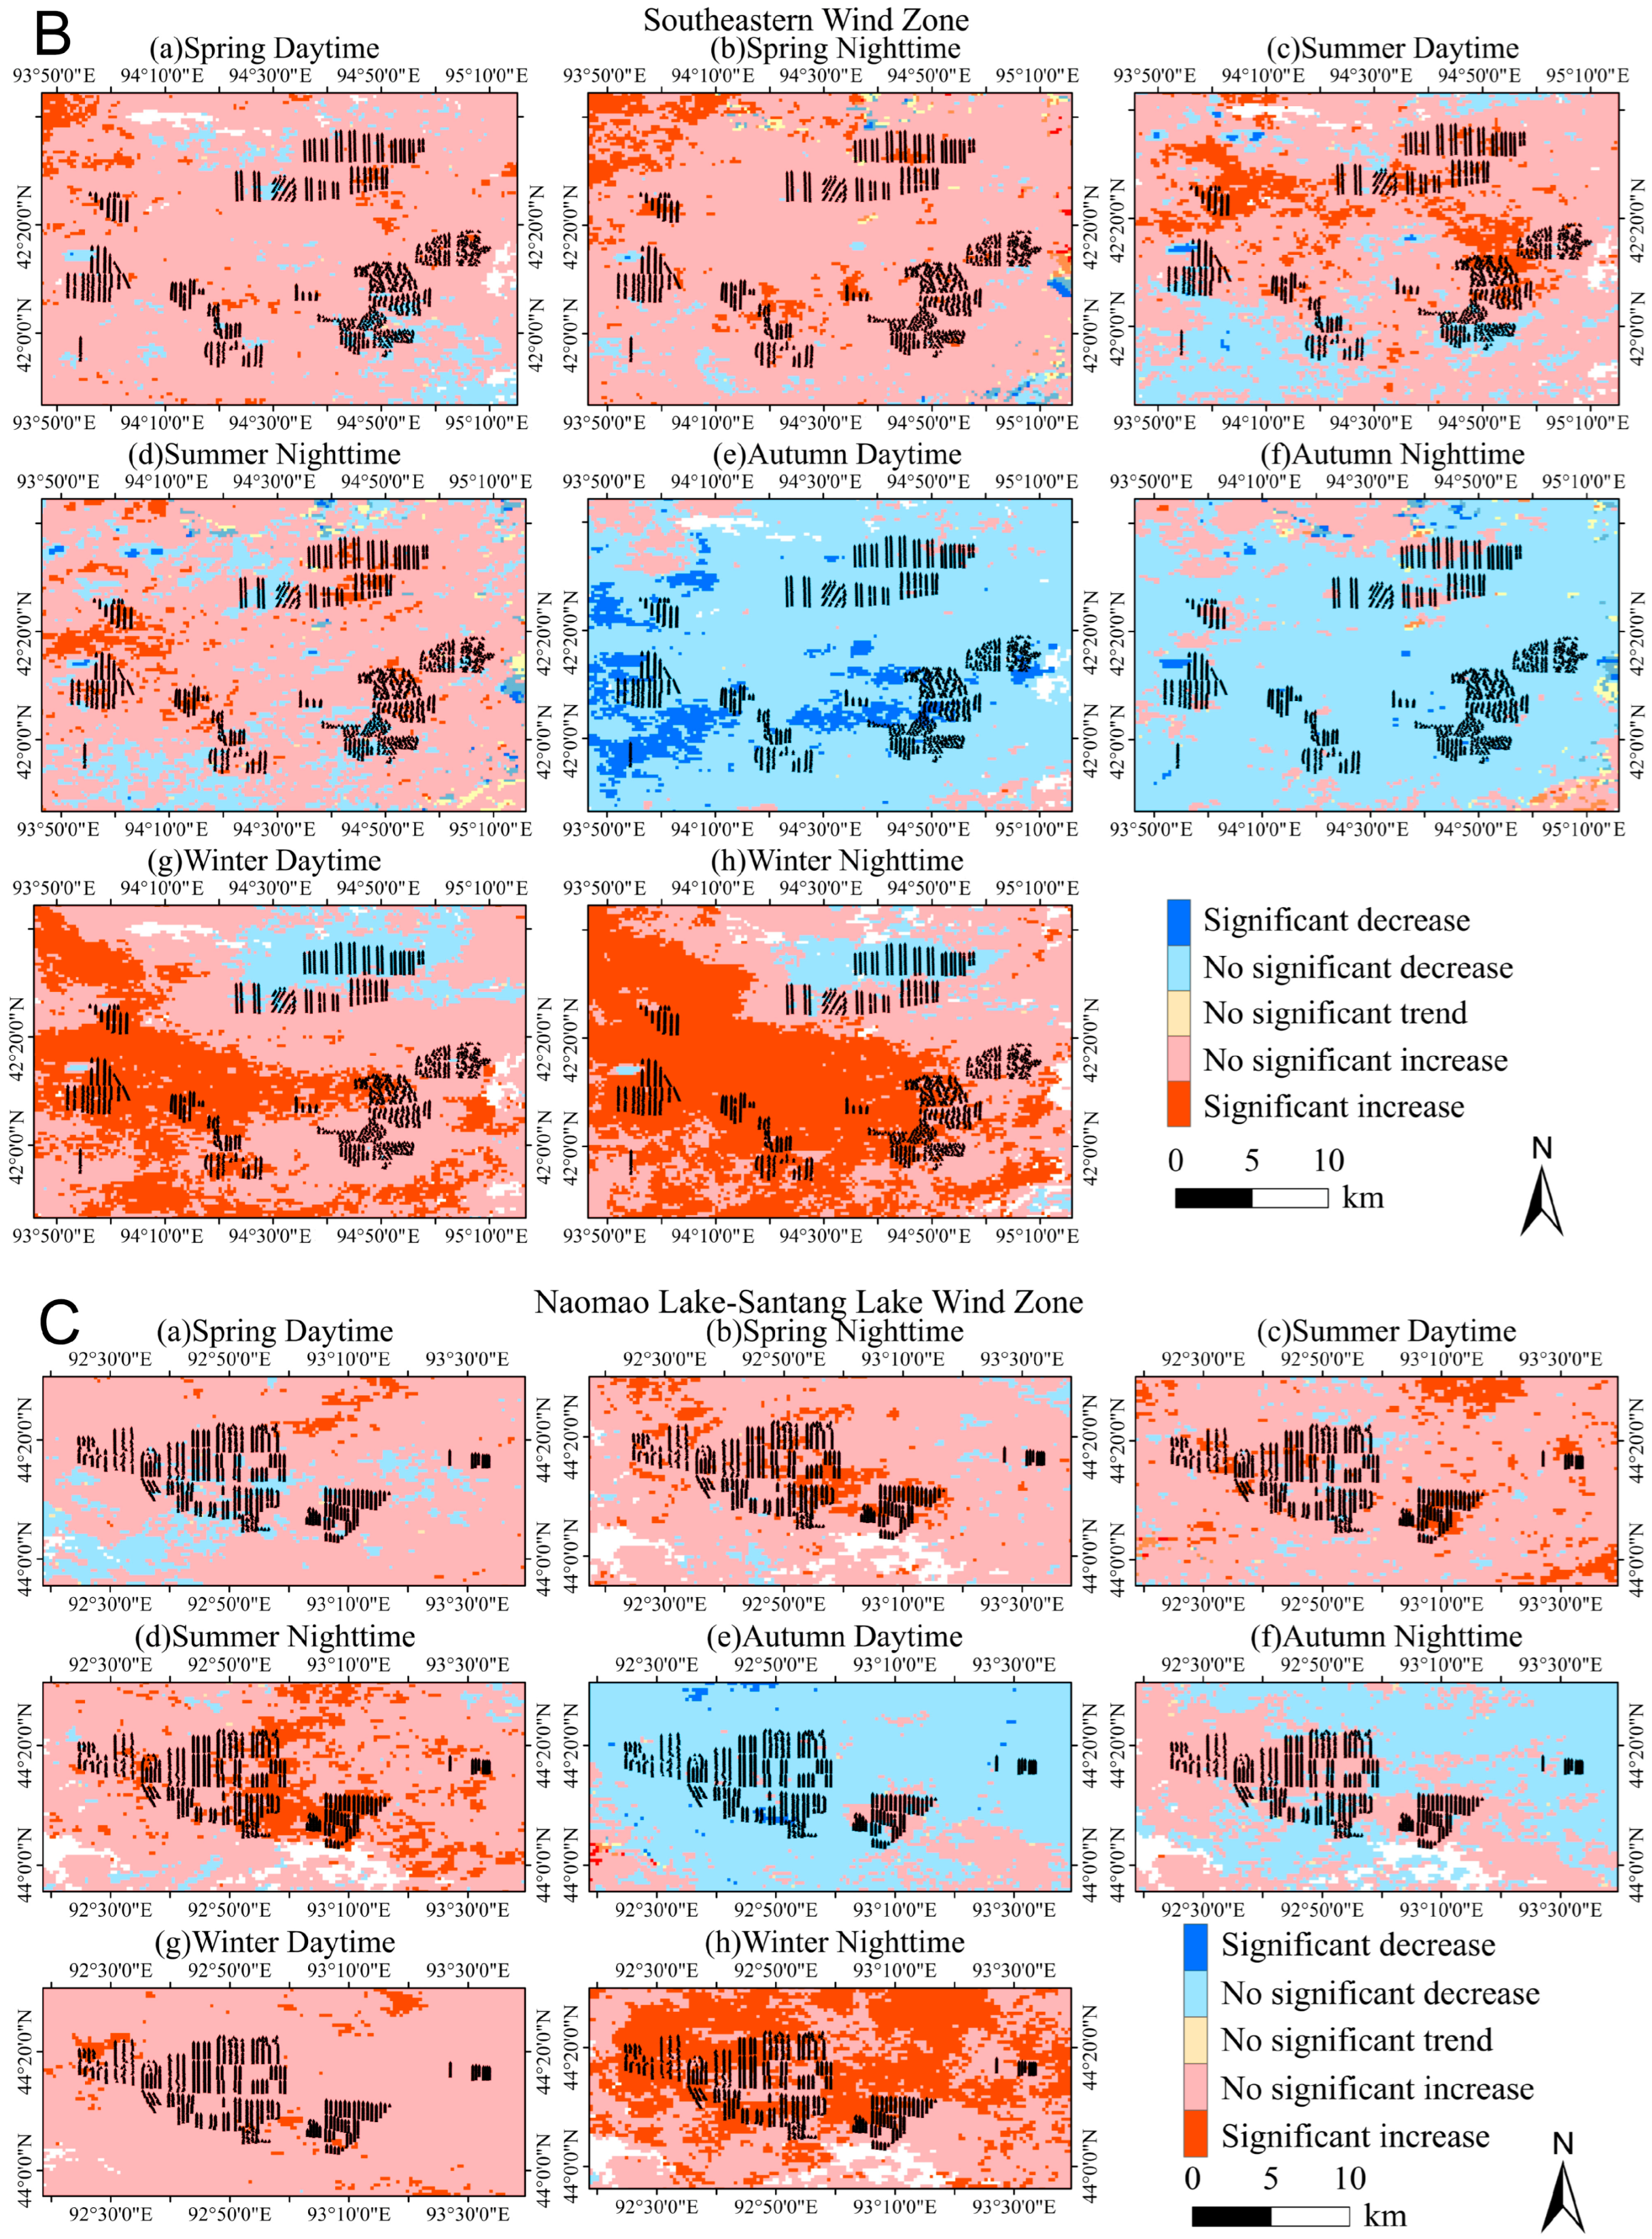
Figure 4 illustrates the Theil–Sen–MK trend analysis of anomaly land surface temperature anomalies () anomalies from 2008 to 2022 across the study region. The Theil–Sen–MK method, a robust non-parametric statistical approach, was applied to quarterly ALST data to quantify trends while mitigating the effects of random variability and outliers. Our analysis reveals spatially heterogeneous seasonal LST patterns across three wind farm zones, with notable diurnal and nocturnal variations.
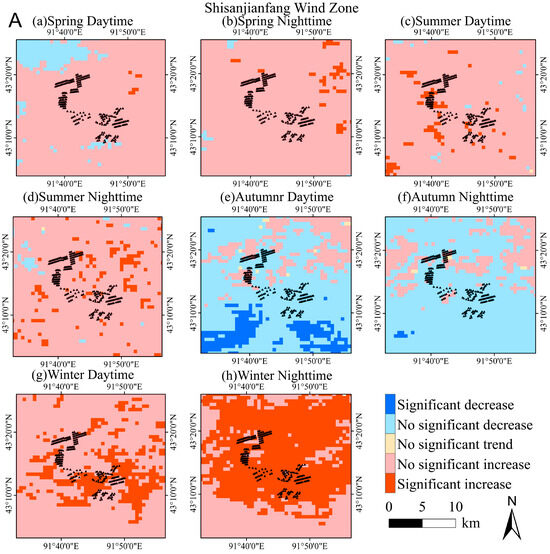
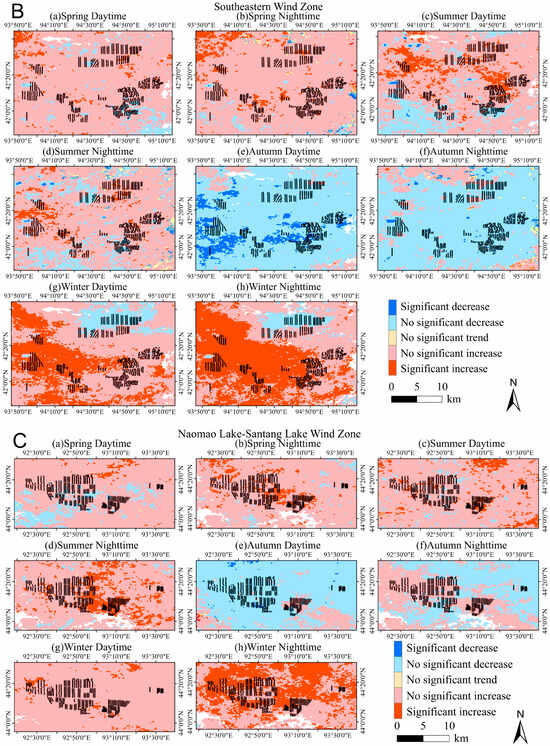
Figure 4.
Daytime and Nighttime ALST Trends Analyzed via Theil–Sen Estimator and Mann–Kendall Test in the Three Wind Zones.
In spring, both daytime and nighttime LST exhibited nonsignificant warming trends (pink areas) throughout the three zones. Summer patterns mirrored this stability, except in the southeastern Naomao Lake–Santang Lake Wind Zone, where significant daytime and nighttime warming occurred (red areas), accompanied by pronounced nocturnal warming in its central region. The Southeast Wind Zone further showed localized daytime LST increases near densely clustered turbines. In autumn, LST trends generally shift toward non-significant cooling, although notable daytime cooling occurs in parts of the Shisanjianfang and southeastern wind zones. Meanwhile, nighttime warming persists in turbine-dense areas of the Naomao Lake–Santang Lake Wind Zone, albeit non-significantly. Winter stands out for widespread nighttime warming. While the Shisanjianfang Wind Zone and Naomao Lake–Santang Lake Wind Zone experience mainly non-significant daytime warming, nighttime LST trends are significantly positive across much of the region. In the southeastern zone, both day- and nighttime warming is widespread and significant, except in the turbine-dense northeastern section, which shows a non-significant cooling trend.
Overall, the results reveal a warming tendency in spring, summer, and winter, with the most pronounced warming occurring during winter nights. In contrast, a cooling trend dominates during autumn. These patterns are consistent with earlier findings indicating that wind farm operations can influence local LST, particularly at night and in turbine-dense areas. For example, studies in Texas, USA, have documented nocturnal warming effects, especially during summer nights [20], while analyses of 319 U.S. wind farms revealed amplified LST increases during autumn and winter [24]. Similar seasonally modulated warming trends are observed in wind farms across Illinois [23] and China—notably in Guazhou (northwestern China) [25] and Gonghe County (Qinghai Province) [27], where nighttime LST rises were most evident in summer and winter, respectively. These spatial and seasonal variations underscore the role of wind farm-induced boundary-layer turbulence in modulating near-surface temperatures, particularly in regions with high turbine density.
3.2. Relationship Between LST and the Geographical Location of Wind Farms
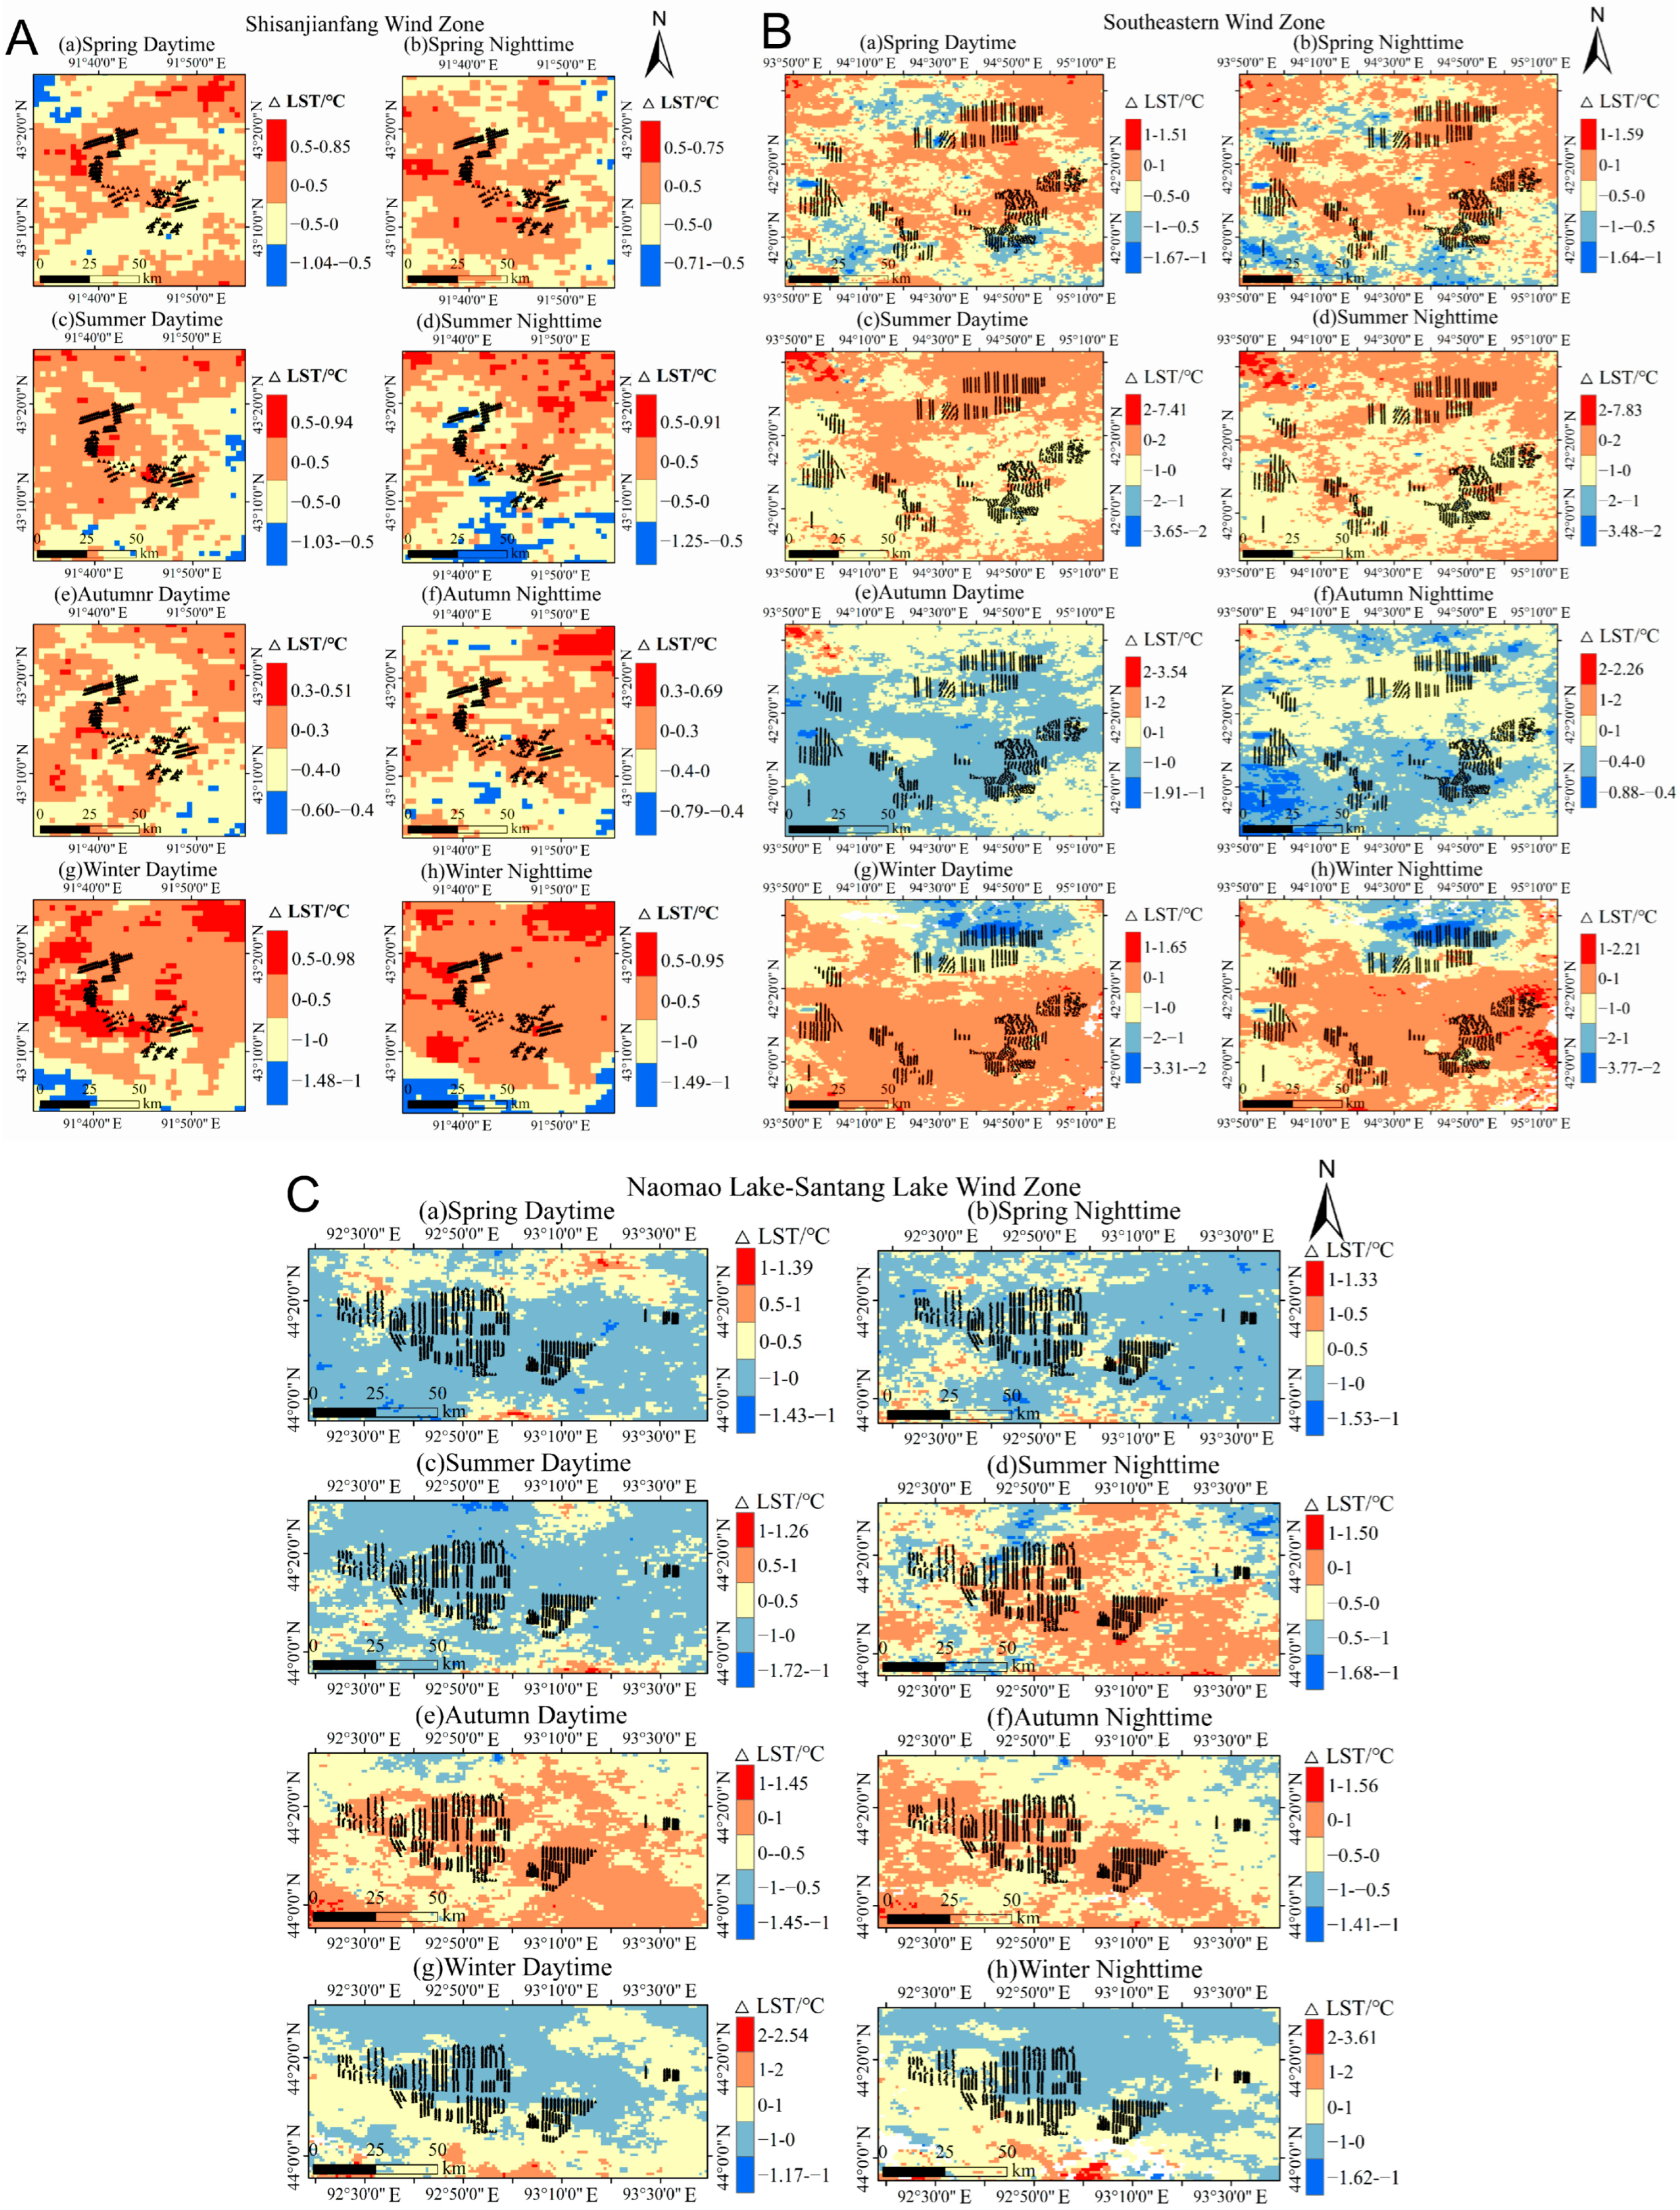
This study compares RALST differences between the pre-construction period (2008–2010) and the operational phase (2020–2022) across three wind farm zones in Hami (Figure 5), revealing the seasonal and spatial impacts of wind farms under complex topographical conditions.
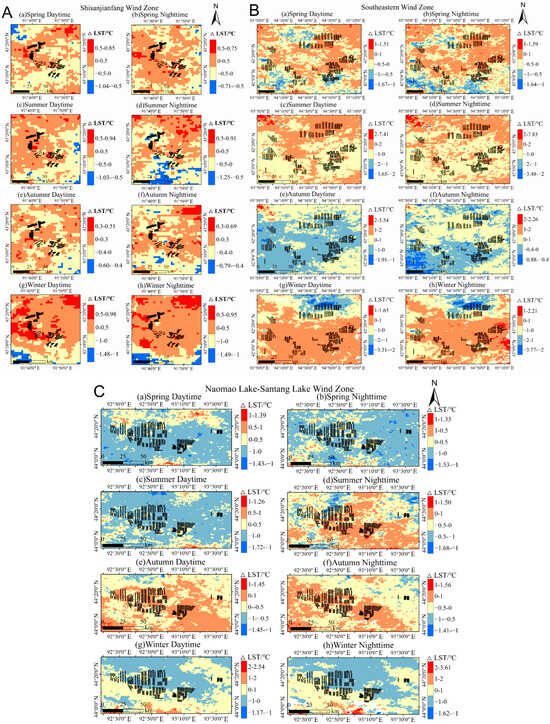
Figure 5.
Spatial Distribution of RALST Differences Between Pre- and Post-Construction Periods.
Shisanjianfang Wind Zone, characterized by a north-high–south-low topography encircled by mountains, forms a natural wind tunnel. Winter exhibits the most significant LST changes: daytime warming correlates with turbine height distribution due to turbulence-enhanced surface–atmosphere energy exchange, while nighttime warming peaks in the wind farm area (∆LST 0–0.74 °C), amplified by cold air uplift and heat retention in lower terrain. Summer warming is less pronounced but more evident near the northern Tian Shan Mountains, where daytime turbulence synergizes with high temperatures. At night, slower heat dissipation and atmospheric stabilization diminish thermal effects. Spring and autumn show cooling in peripheral areas, likely due to turbulence-reduced local evaporative cooling.
Southeast Wind Zone features low mountains, hills, and a basin. Spring shows consistent daytime and nighttime warming in hilly areas, driven by turbine-enhanced heat exchange. Summer displays spatial divergence: northern mountain-adjacent turbines warm significantly (∆LST 0–2 °C), while others cool (∆LST −1–0 °C), potentially from reduced solar absorption and enhanced evaporation. Autumn daytime cooling concentrates in the basin (∆LST −1–0 °C), with nighttime warming in central-north areas. Winter combines cold air subsidence and turbulence, causing widespread warming except in the north, where intensified airflow induces cooling. Topographic complexity results in greater LST variability than in Shisanjianfang Wind Zone.
Naomao Lake–Santang Lake Wind Zone, situated in a flat enclosed basin, shows uniform heat exchange. Autumn exhibits the strongest warming (∆LST 0–1 °C), likely from turbulence-reduced surface heat loss. Spring cooling (∆LST −1–0 °C) may stem from enhanced evaporation and reduced turbine heat absorption. Summer contrasts daytime cooling (∆LST −1–0 °C) with localized nighttime warming. Winter sees consistent warming, reflecting terrain-flattened heat distribution and turbine-induced disturbances. Hilly terrain minimally reduces wind speed but stabilizes nighttime airflow, exacerbating warming. Previous studies focused on large flat-area wind farms, with sparse research in arid, complex terrains.
Most prior studies have focused on large wind farms in flat regions, while research in arid and complex terrain remains limited. The current findings align with studies by Zhou et al. [20] reported summer ∆LST ranges of 0.5–1.3 °C in western Texas and winter peaks of 1.56 °C in Illinois [36], while Chang et al. [37] observed pronounced summer nighttime warming in the Gansu Guazhou Wind Farm. Similarly, Tang [10] also observed significant warming during summer at the Shangi Wind Farm in Hebei Province. Most studies highlight summer as the dominant warming season, yet in the Shisanjianfang and Southeast Wind Zones, winter nighttime warming prevails. This discrepancy may stem from mountainous terrain blocking and uplifting cold airflows, which accelerate cold air descent in winter. Coupled with turbine-induced turbulence, this enhances downward heat transfer from the upper atmosphere, amplifying nighttime warming—a mechanism consistent with Ma et al. [26], who identified nighttime warming in Hebei’s Shangyi-Zhangbei wind farms due to turbine-driven heat accumulation during surface–atmosphere exchange.
3.3. Comparison of Wind Farm Impact Area and Non-Wind Farm Impact Area
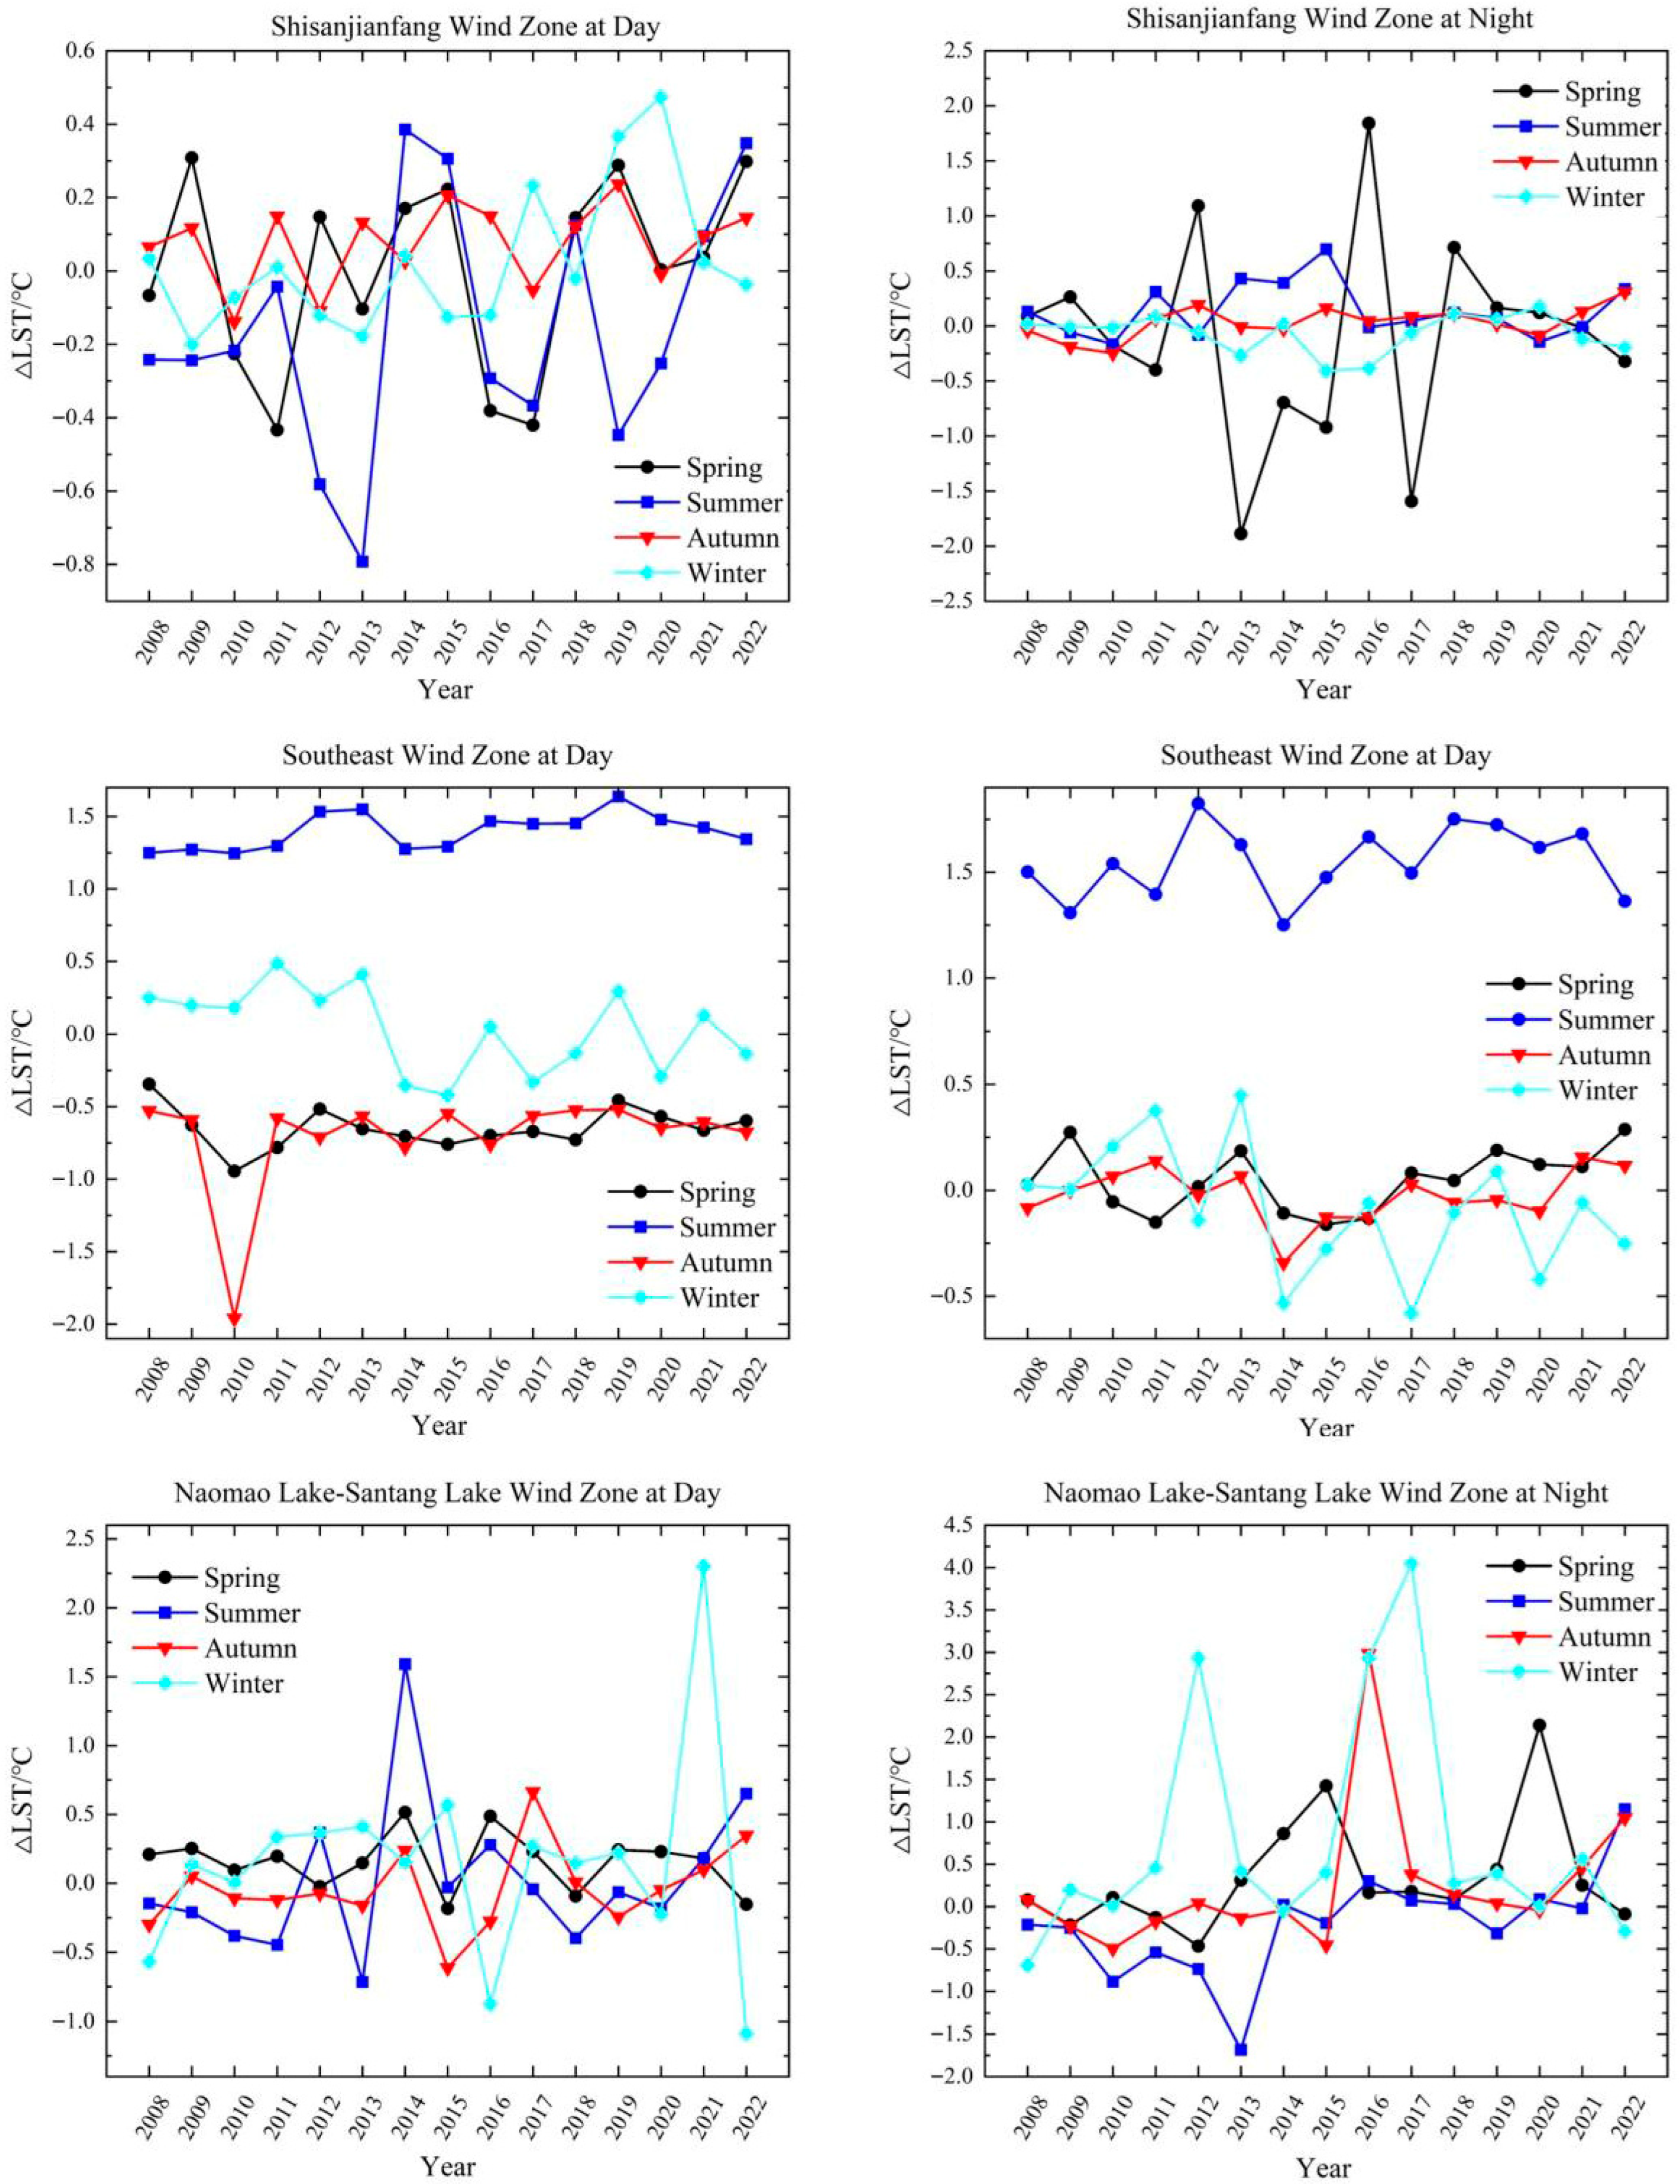
Following the method of Zhou et al. [19], the wind farm is represented by a 0.01° × 0.01° pixel. If a pixel contains ≥1 wind turbine, it is defined as the Wind Farm Impact Area. The area 6–9 pixels away from the Wind Farm Impact Area and 4 pixels wide is defined as the Non-Wind Farm Impact Area. The space between the Wind Farm Impact Area and the Non-Wind Farm Impact Area is considered the Transition Area. The effect of wind farm operations on LST is quantified by comparing the difference in ALST between the Wind Farm Impact Area and the Non-Wind Farm Impact Area, with the results presented in Figure 6 and Table 1.
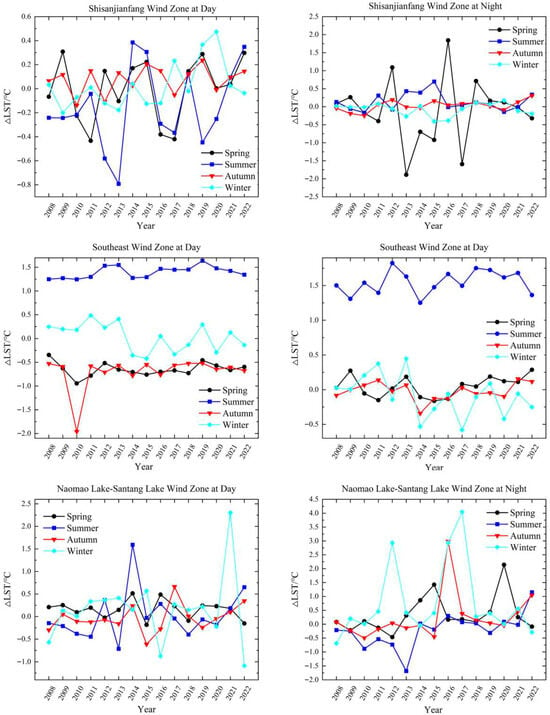
Figure 6.
Daytime and Nighttime Trends in ALST Differences Between Wind Farm Impact and Non-Impact Areas Across Three Wind Zones (2008–2022).

Table 1.
Trends in ALST Differences Between Wind Farm Impact and Non-Impact Areas Calculated via Least Squares Method.
Figure 6 illustrates the seasonal anomalies of the ALST time series from 2008 to 2022, including spring, summer, autumn, and winter. In the Shisanjianfang Wind Zone, daytime LST shows a cooling trend in summer and a slight warming trend in autumn, whereas nighttime LST increases significantly in both summer and autumn, with the most pronounced warming occurring in summer nights (0.138 °C/15a). This result is consistent with the findings of Zhou et al. [19], suggesting that complex topography and turbine-induced disturbances have a stronger impact on nighttime LST. The Southeastern Wind Zone exhibits the most dramatic LST variations, with daytime warming in summer reaching 1.398 °C/15a and even higher nighttime warming at 1.548 °C/15a. This is the highest among the three wind zones and significantly exceeds the warming observed in wind farms in Texas (0.724 °C/10a) [20], Guazhou, Gansu (0.51 °C/8a) [25], and Bashang, Hebei (0.206 °C/10a) [26]. In contrast, the Naoma Lake–Santang Lake Wind Zone shows milder LST variations, with a significant cooling trend during summer nights (−0.212 °C/15a, significant at α = 0.05), while in winter nights, LST increases significantly (0.772 °C/15a). Notably, in 2017, the maximum nighttime LST difference between the wind farm and non-wind farm areas in this zone reached 4 °C, indicating a temporally pronounced warming effect.
Overall, the warming effect of wind farms compared to non-wind farm areas tends to be most significant in summer and weaker in winter. This seasonal difference can be attributed to stronger summer winds, which enhance turbine efficiency and turbulent mixing, promoting downward heat transfer and thus more pronounced LST warming. In contrast, weaker winds in winter reduce the turbulence effect, resulting in a smaller impact on LST [24]. This phenomenon is closely related to the mechanism by which wind farms alter local boundary layer characteristics and enhance turbulent mixing. Previous studies have shown that turbine operation stirs the air, increasing heat exchange between the surface and the atmosphere. This effect is particularly strong at night, when increased turbulence reduces longwave radiative cooling from the surface, leading to elevated LST [22,26]. Additionally, turbines are typically sited in high-altitude areas with stronger wind speeds and enhanced turbulence, where the warming effect is more pronounced [21]. In contrast, in low-lying areas, turbine-induced disturbances may cause cold air to accumulate, resulting in localized cooling [23]. These findings suggest that wind farms not only alter local wind field characteristics but also redistribute surface heat through turbulence, causing spatial and seasonal variations in LST responses. Moreover, the LST trend in the southeastern wind zone is significantly greater than that in the Naomao Lake–Santang Lake Wind Zone, which may be attributed to their geographic locations on opposite sides of the Tianshan Mountains. Shen et al. [35] found that LST variations are greater on the southern side of the Tianshan Mountains, especially during summer, which aligns with the observed pattern in the Southeastern Wind Zone.
3.4. Impact of Wind Farm Operations on LST
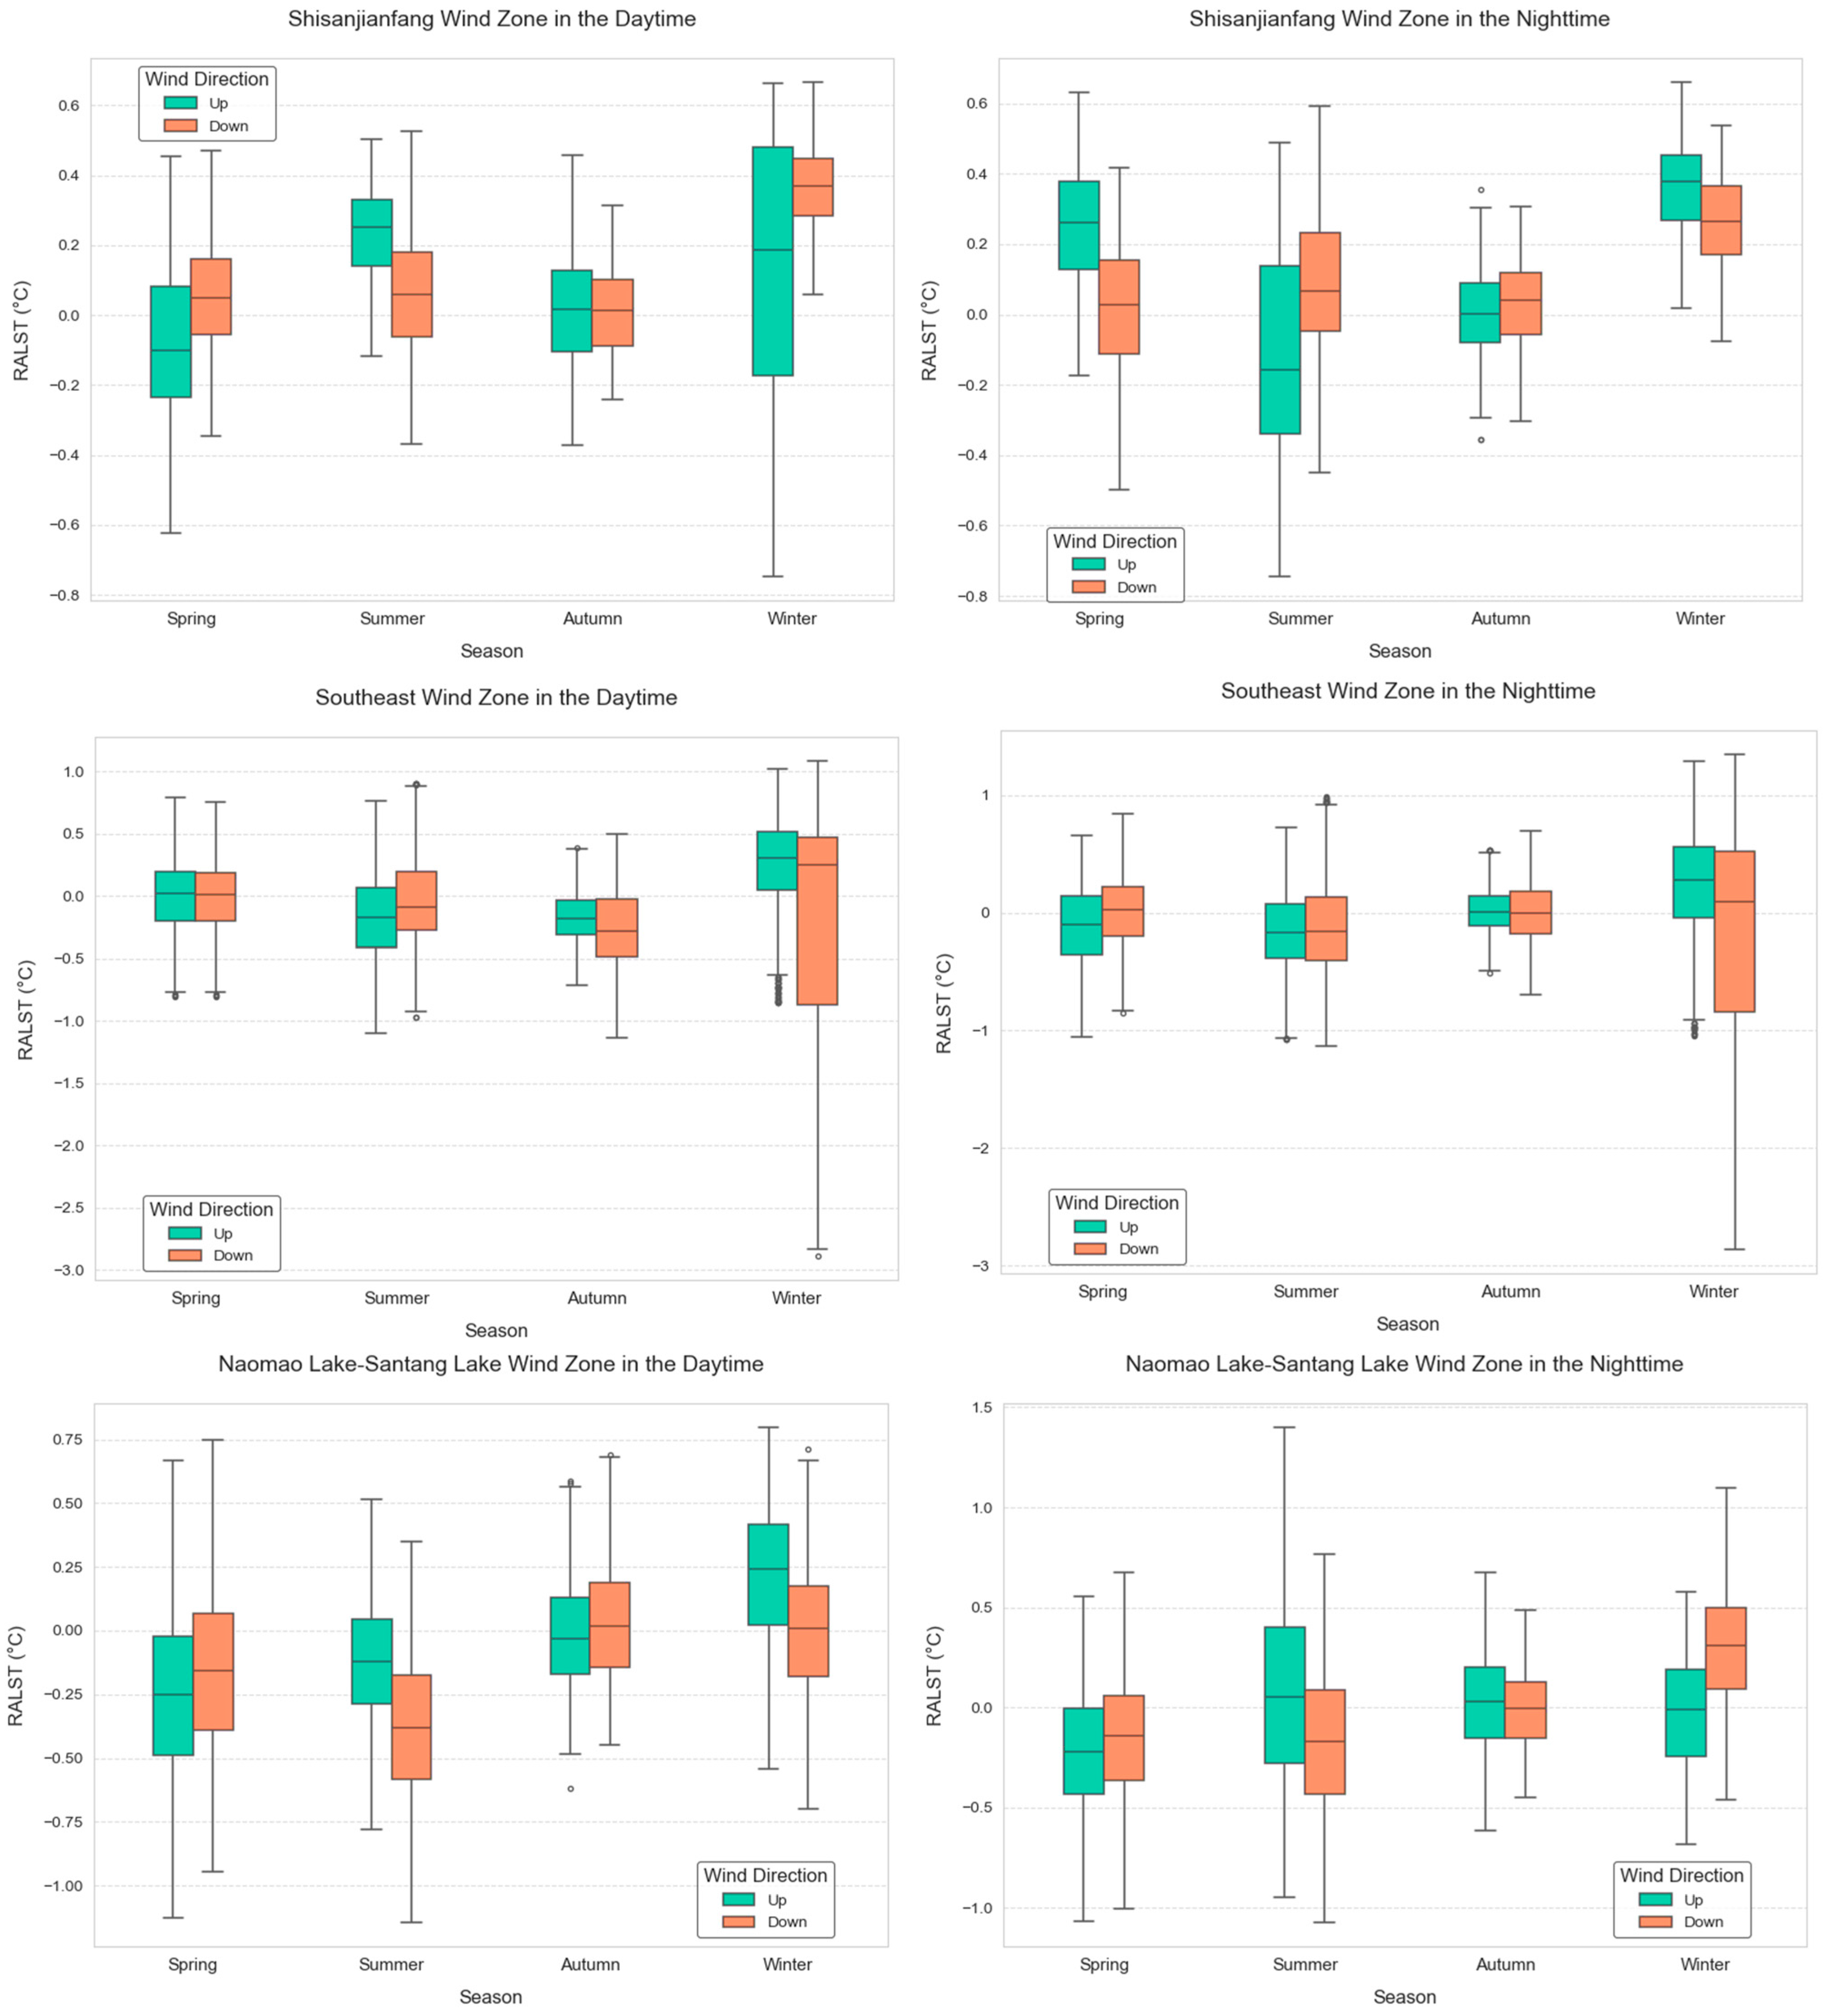
The operation of wind farms alters local wind speed, turbulence structure, and heat transport, which are considered key mechanisms affecting changes in LST. Previous studies have indicated that the wake effects induced by wind turbine operation enhance vertical mixing within the boundary layer, thereby modifying the local thermal structure. These effects can lead to opposite temperature responses under different atmospheric stability conditions [9,36].To further investigate the specific impact of wind zones on LST, this study utilizes ERA5 reanalysis data in combination with wind direction information at 100 m height to divide the areas surrounding wind zones into upwind and downwind areas. The RALST is used to systematically assess the spatial variations in LST before and after the construction of wind zones. ERA5 wind field data at 04:00 UTC (daytime) and 16:00 UTC (nighttime) were extracted to match the observation times of remote sensing-based LST products. The dominant wind direction was used to delineate upwind and downwind areas for each wind zone, and seasonal and diurnal RALST values were calculated. Cohen’s d was adopted to assess the statistical significance of LST differences between upwind and downwind areas, with positive values indicating downwind warming and negative values indicating cooling. Additionally, the effect size was used to compare RALST differences between the Upwind Area and Downwind Area before and after wind zone establishment (Figure 7 and Table 2).
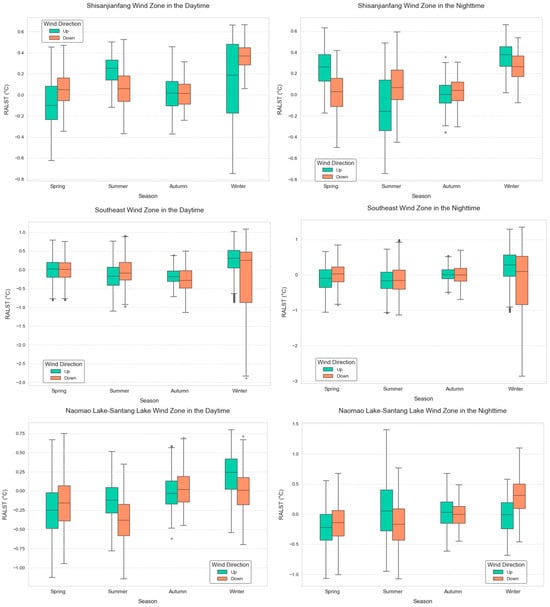
Figure 7.
Seasonal Day–Night Comparison of RALST Differences Between Upwind and Downwind Areas in the Three Wind Zones (Post- vs. Pre-Construction).

Table 2.
Effect Sizes for Upwind and Downwind Areas.
The Shisanjianfang Wind Zone exhibits significant RALST variation across seasons and between day and night. In spring, the downwind area experienced notable daytime warming (d = 0.621), while a strong cooling effect was observed at night (d = −1.304). These patterns may arise from turbine-generated turbulence enhancing boundary layer stability and surface cooling. In contrast, summer demonstrated the opposite trend: the downwind area experienced significant daytime cooling (d = −0.851) and nighttime warming (d = 0.906). Autumn exhibited weak effects overall, particularly during the day (d = −0.028), suggesting minimal operational impact. Winter revealed a dual pattern with daytime warming (d = 0.881) and nighttime cooling (d = −0.921). Collectively, this region reflects a typical “daytime cooling and nighttime warming” RALST pattern in downwind areas.
Compared with the Shisanjianfang Wind Zone, the Southeastern Wind Zone showed smaller RALST variation but more consistent seasonal patterns. In spring, the downwind area showed daytime cooling and nighttime warming, suggesting that turbine wake effects strongly suppressed daytime temperatures while enhanced vertical mixing dominated at night. In summer, LST in the downwind area was slightly higher than in the upwind area during both day (d = 0.464) and night (d = 0.155), though these effects were relatively weak. Autumn displayed the smallest diurnal differences, reflecting diminished operational influence. In winter, both daytime and nighttime cooling occurred in the downwind region (d ≈ −0.5), implying consistent disruption of local heat exchange processes by turbine operations.
The Naomao Lake–Santang Lake Wind Zone demonstrated more pronounced seasonal RALST variations. In spring, both daytime (d = 0.346) and nighttime (d = 0.257) warming were observed. Summer exhibited significant cooling during the day (d = −0.940) and night (d = −0.578), with daytime effects likely driven by atmospheric instability enhancing cold air subsidence. Autumn showed minimal RALST variation, indicating negligible temperature impacts. Winter revealed a distinct diurnal contrast: the downwind area experienced marked daytime cooling (d = −0.743) alongside the strongest nighttime warming (d = 1.174) among all three regions.
In the three study regions, after the construction of wind farms, the daytime warming amplitude in downwind areas was lower than that in upwind areas, while the reverse trend was observed at night. This indicates that wind farm operations resulted in nighttime warming and daytime cooling in downwind areas, consistent with findings from previous studies [9,19]. Additionally, the significant differences in LST between upwind and downwind areas suggest that the primary impact of wind farm operations on LST originates from wake effects generated by turbine operation. The rotation of turbine blades enhances turbulence, altering heat exchange patterns within the local atmospheric boundary layer [36]. Under stable atmospheric conditions (nighttime), wake effects transport warm air from higher altitudes to the surface, causing warming [9]. Conversely, under unstable conditions (daytime), turbulent mixing promotes the downward transport of cooler air, leading to cooling [19].
3.5. Effect of Wind Farm Operation on LST Based on Landsat Data
To accurately assess the impact of wind farm operations on LST, this study excluded two major confounding factors: (1) surface heterogeneity, including variations in topography and vegetation, and (2) climatic variability, specifically the natural spatiotemporal changes in LST. Three methods were applied: (1) Natural variability was accounted for using crosswind areas as a baseline, based on the wind rose diagrams; (2) To minimize within-pixel vegetation heterogeneity, buffer zones of 2, 5, 10, 15, and 20 km were established using ArcGIS, referencing the method of Walsh et al. [30], under the assumption that topography remained stable from 2008 to 2022; (3) Land use changes were controlled by incorporating 30-m land use data from Wuhan University, which confirmed no significant land cover changes during the study period.
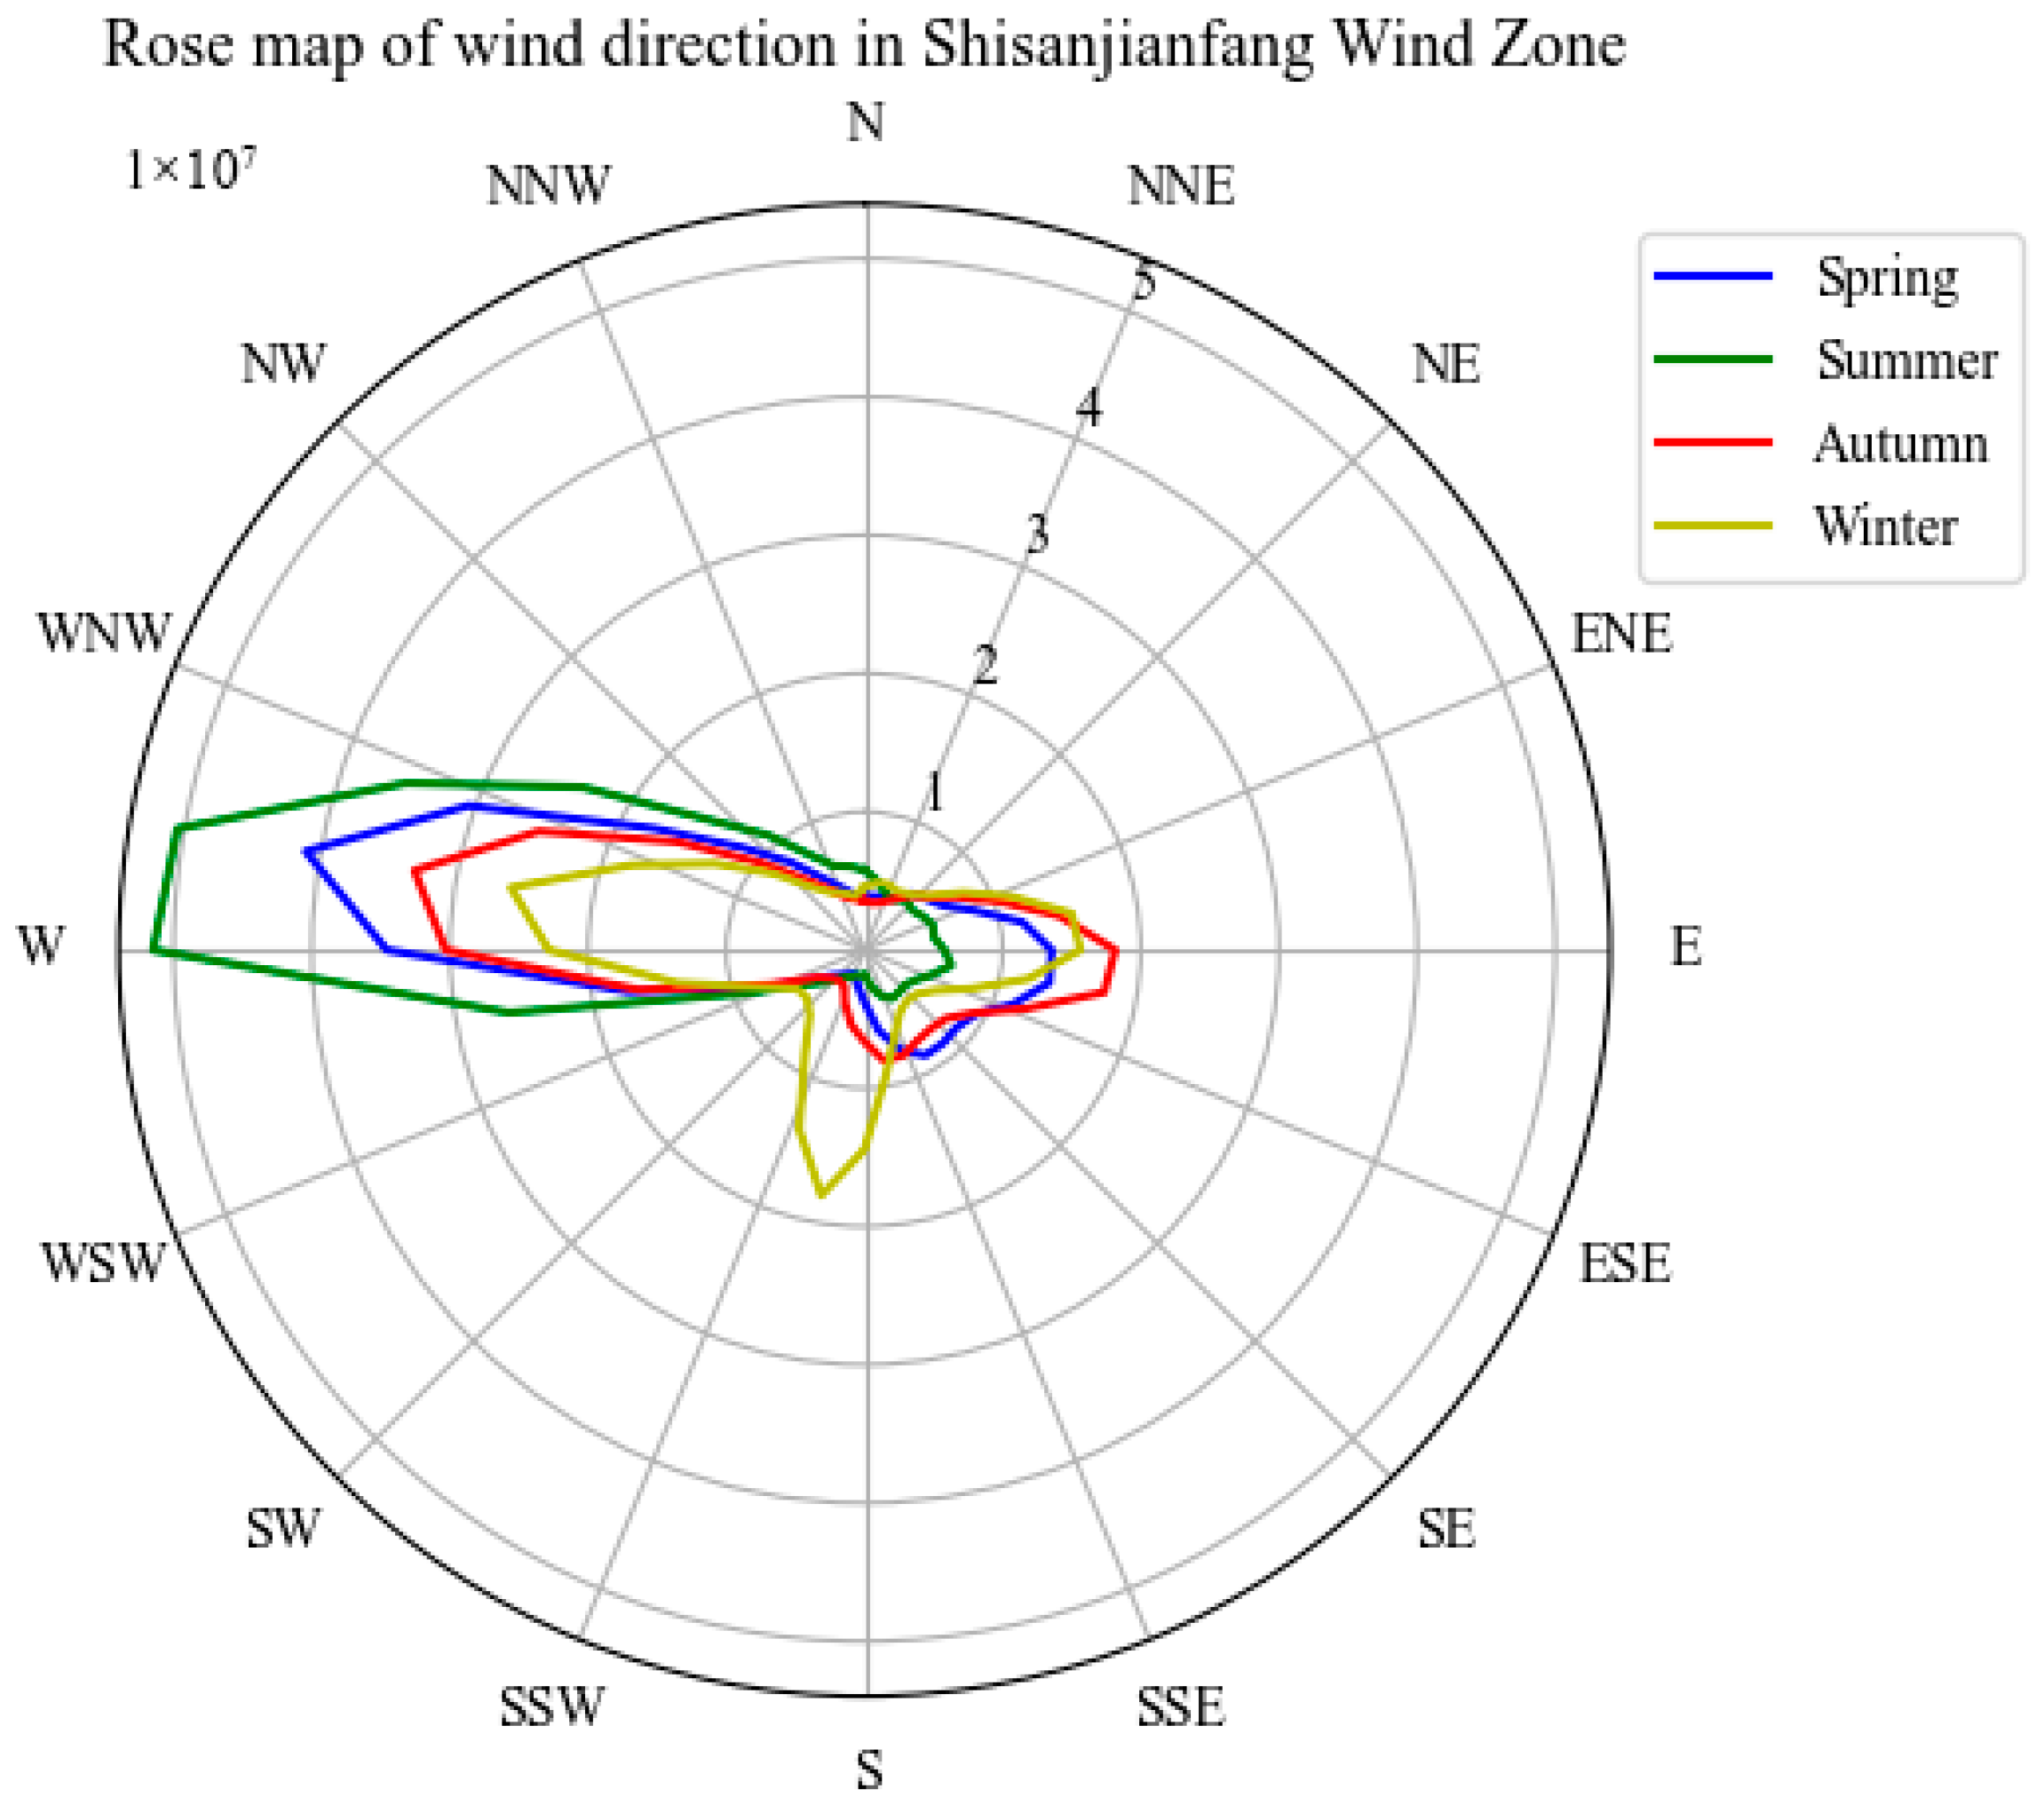
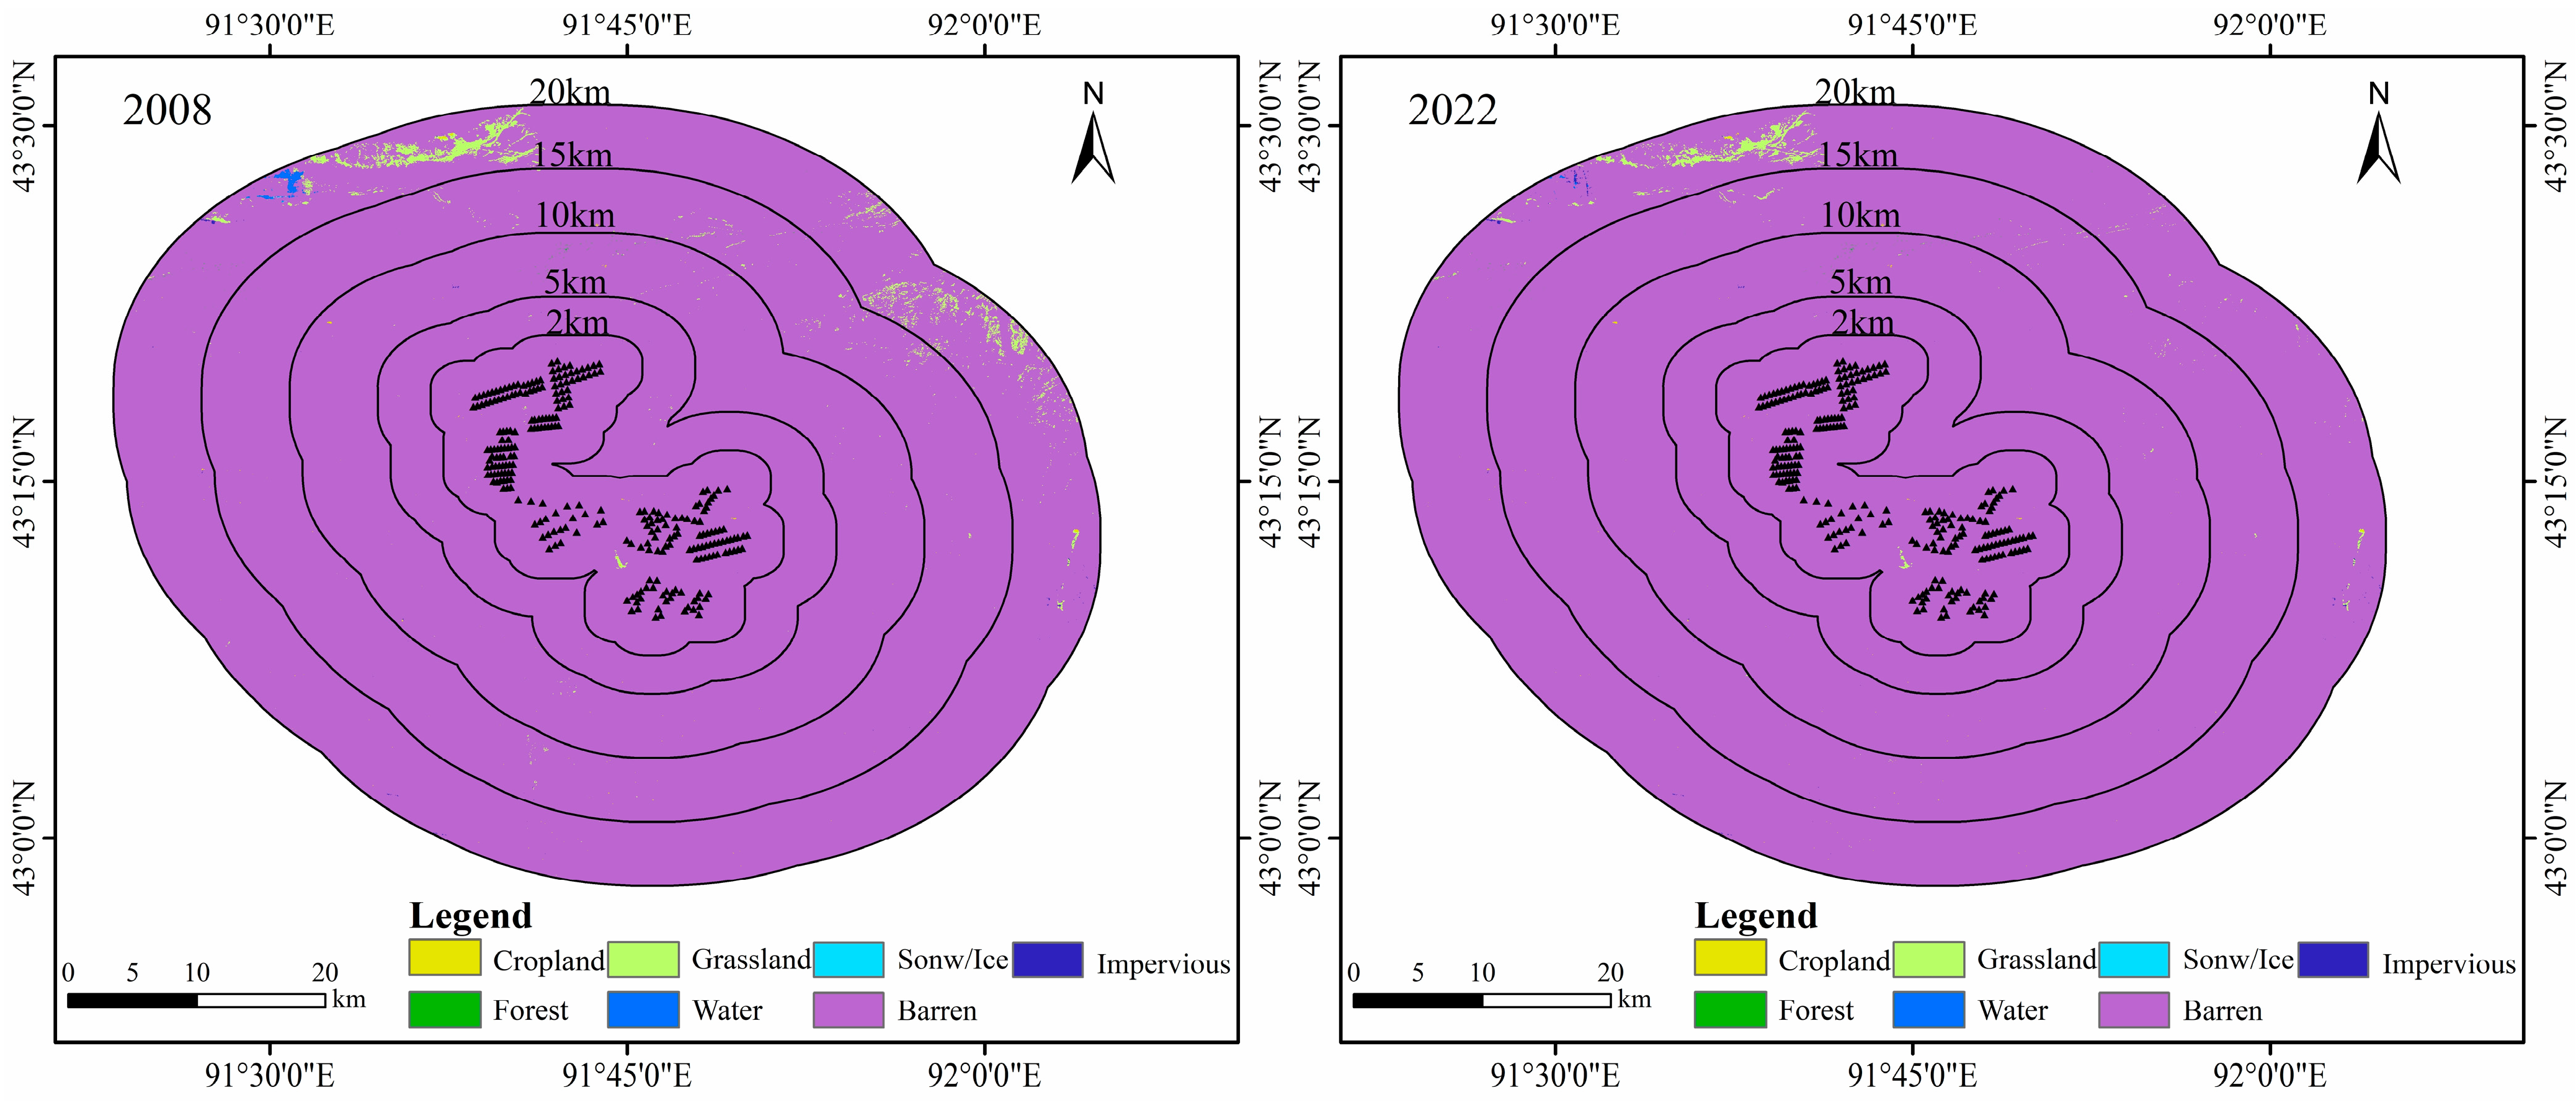
In the Shisanjianfang Wind Zone, predominant wind directions in spring, summer, and autumn ranged from WSW to WNW (upwind), with ENE to ESE as downwind (Figure 8). In winter, both WSW–WNW and SSE–SSW were considered upwind, while ENE–ESE and NNW–NNE were downwind. The wind zone, primarily composed of barren land, showed negligible land use changes between 2008 and 2022 (Figure 9).
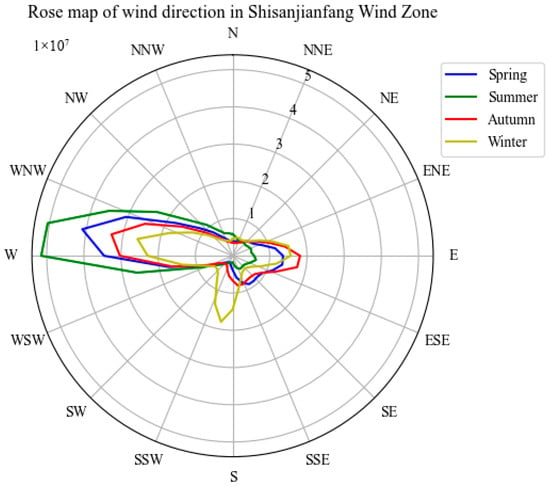
Figure 8.
Wind Rose Diagram of the Shisanjianfang Wind Zone.
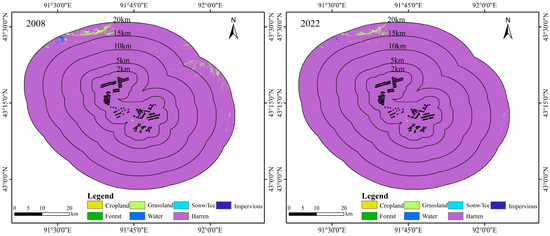
Figure 9.
Land Use Types in the Shisanjianfang Wind Zone (2008 vs. 2022).
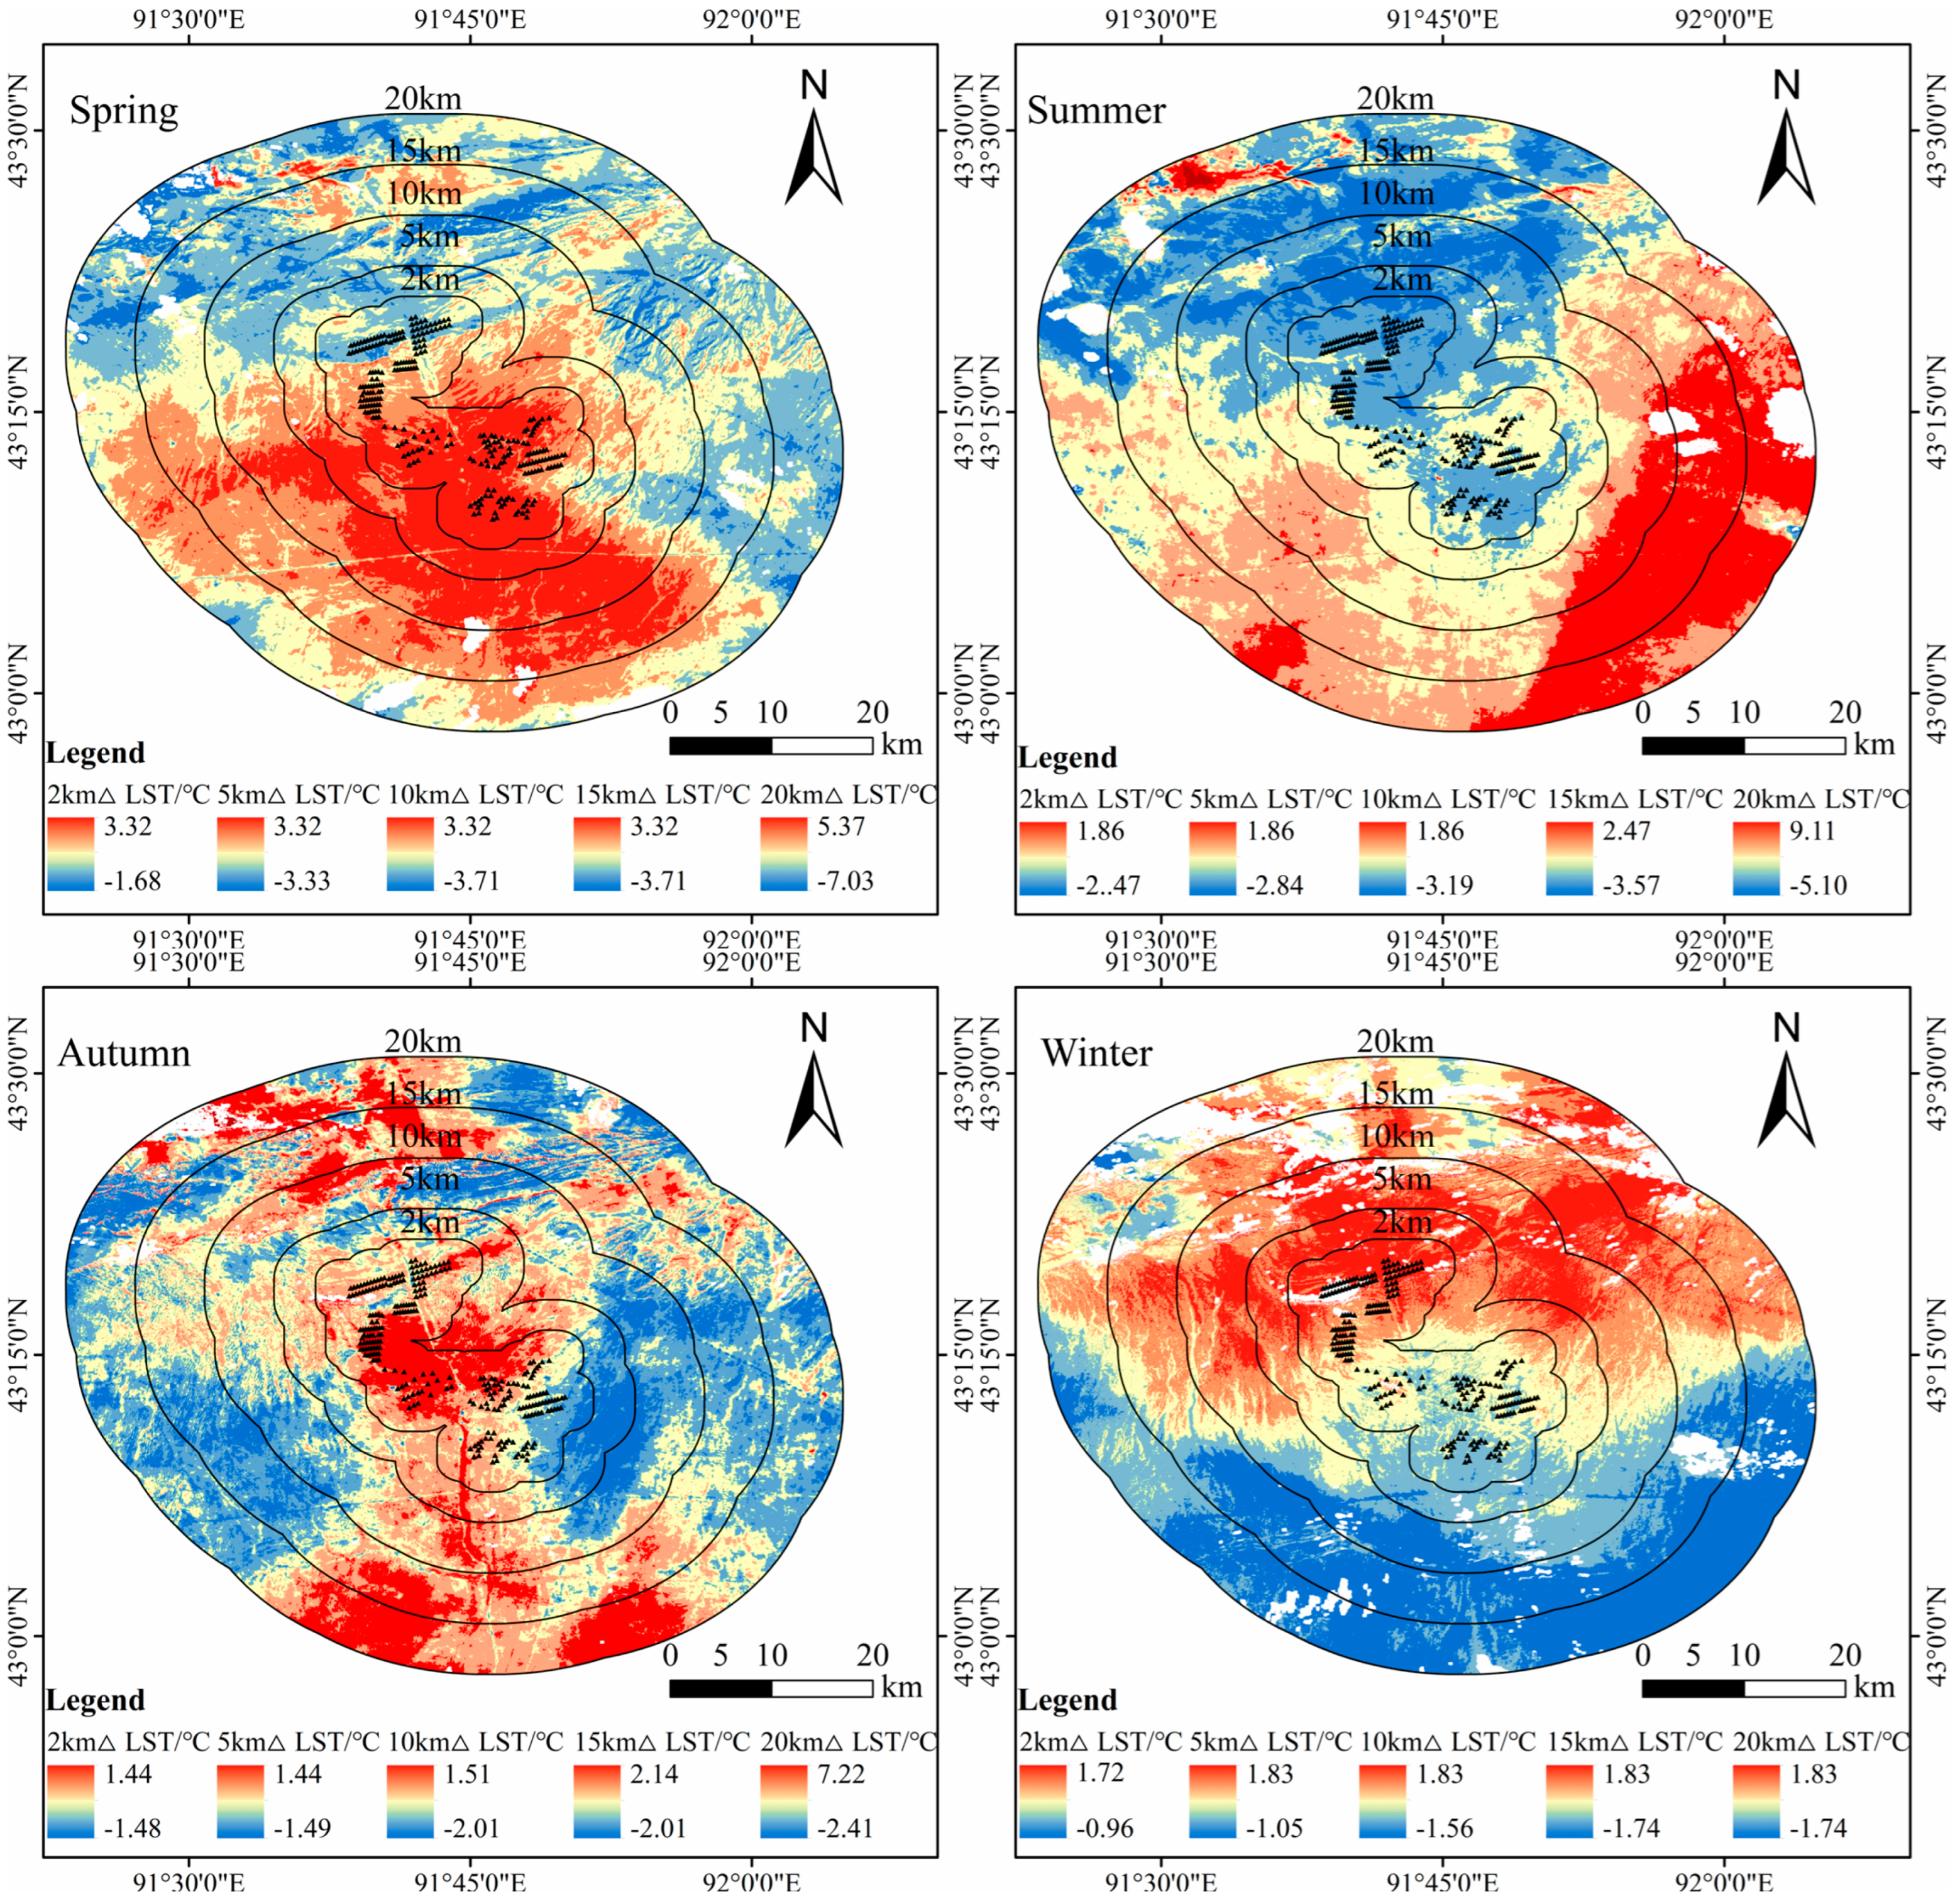
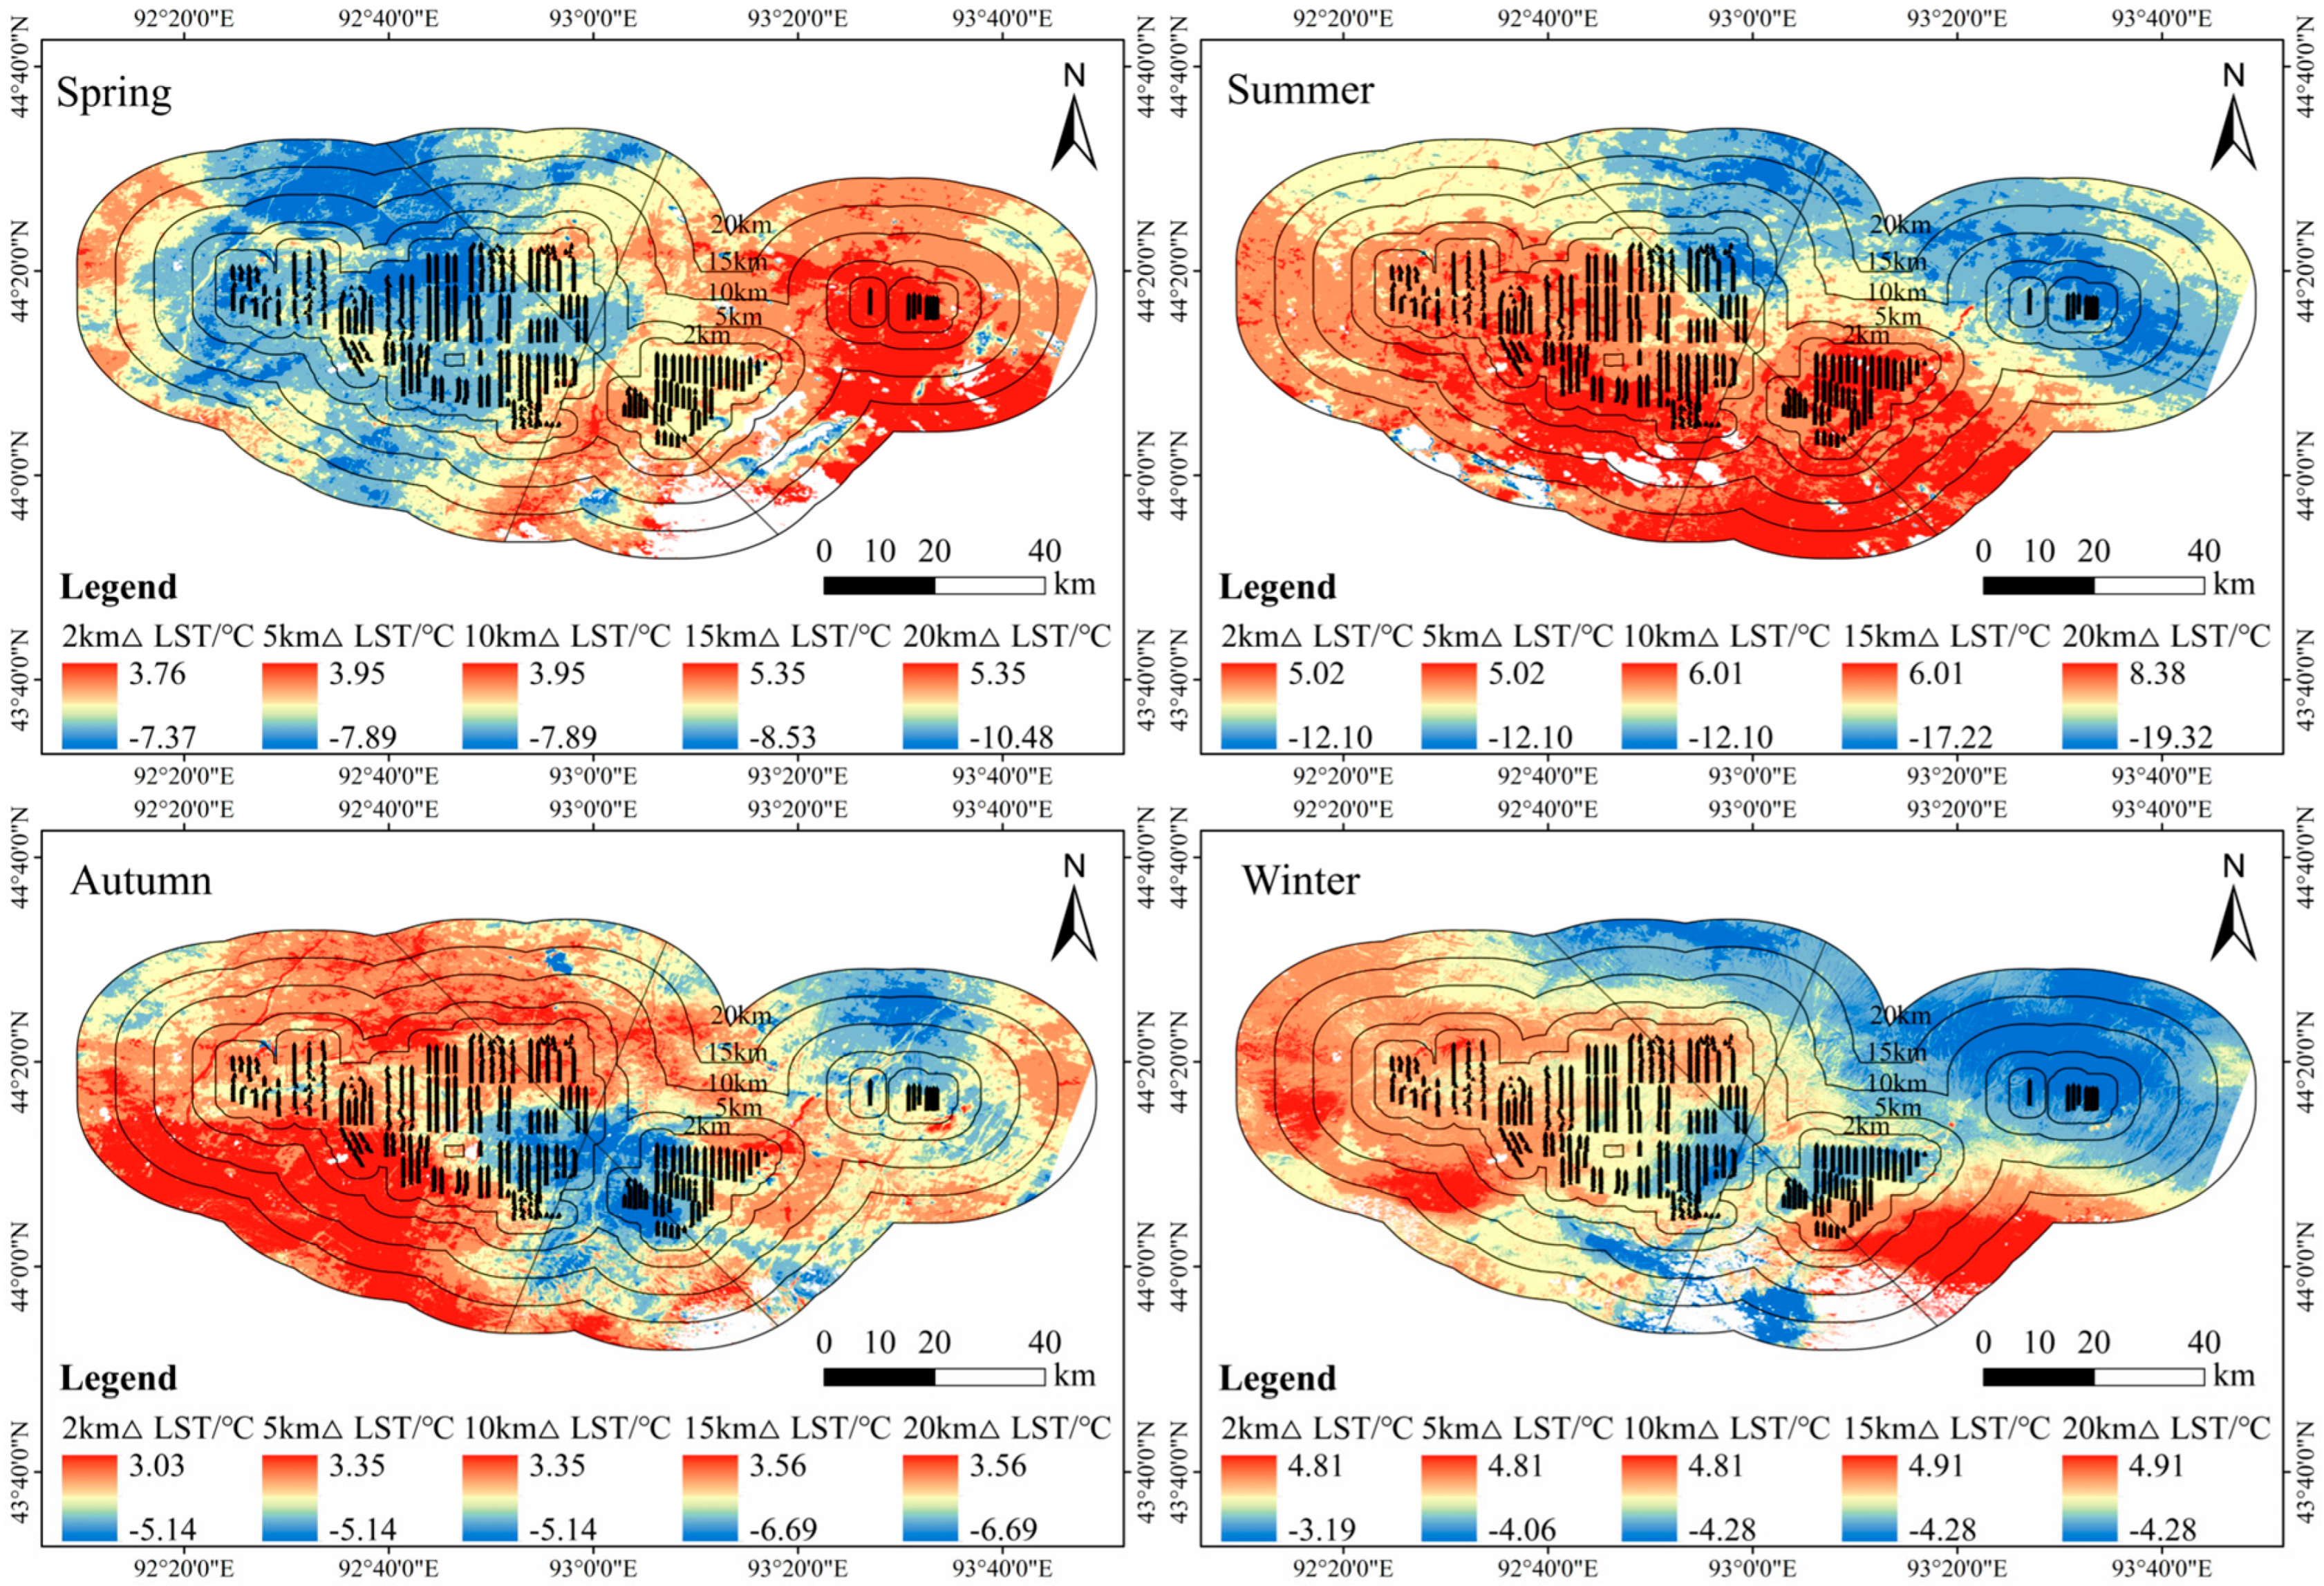
LST analysis revealed that within the 2–15 km buffer zones, LST changes were relatively consistent across spring, summer, and autumn (Figure 10). However, a gradual cooling trend was observed as distance increased, suggesting a localized warming effect from wind farm operations. At 20 km, the influence of broader regional climatic and surface conditions likely overshadowed the direct effects of the turbines. Qi et al. [31] using Landsat 5 and Landsat 8 data, demonstrated that the Kailu wind farm had no significant impact on LST before and after its construction. This discrepancy may be attributed to differences in the quantity of Landsat LST data and analytical methods employed.
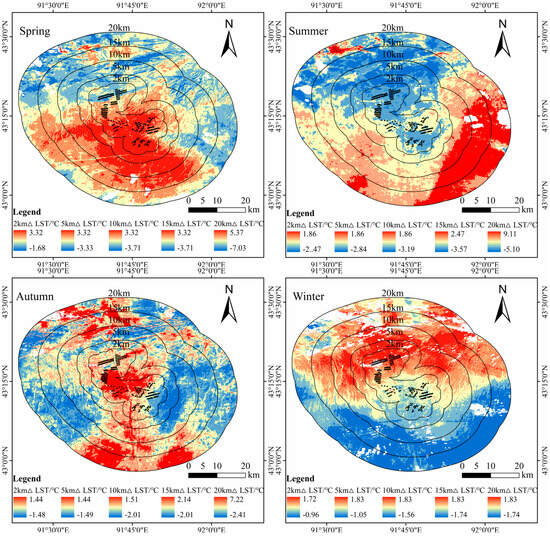
Figure 10.
Spatial Distribution of ΔLST Differences Between Post-Construction Stabilization Period and Pre-Construction Baseline in the Shisanjianfang Wind Zone.
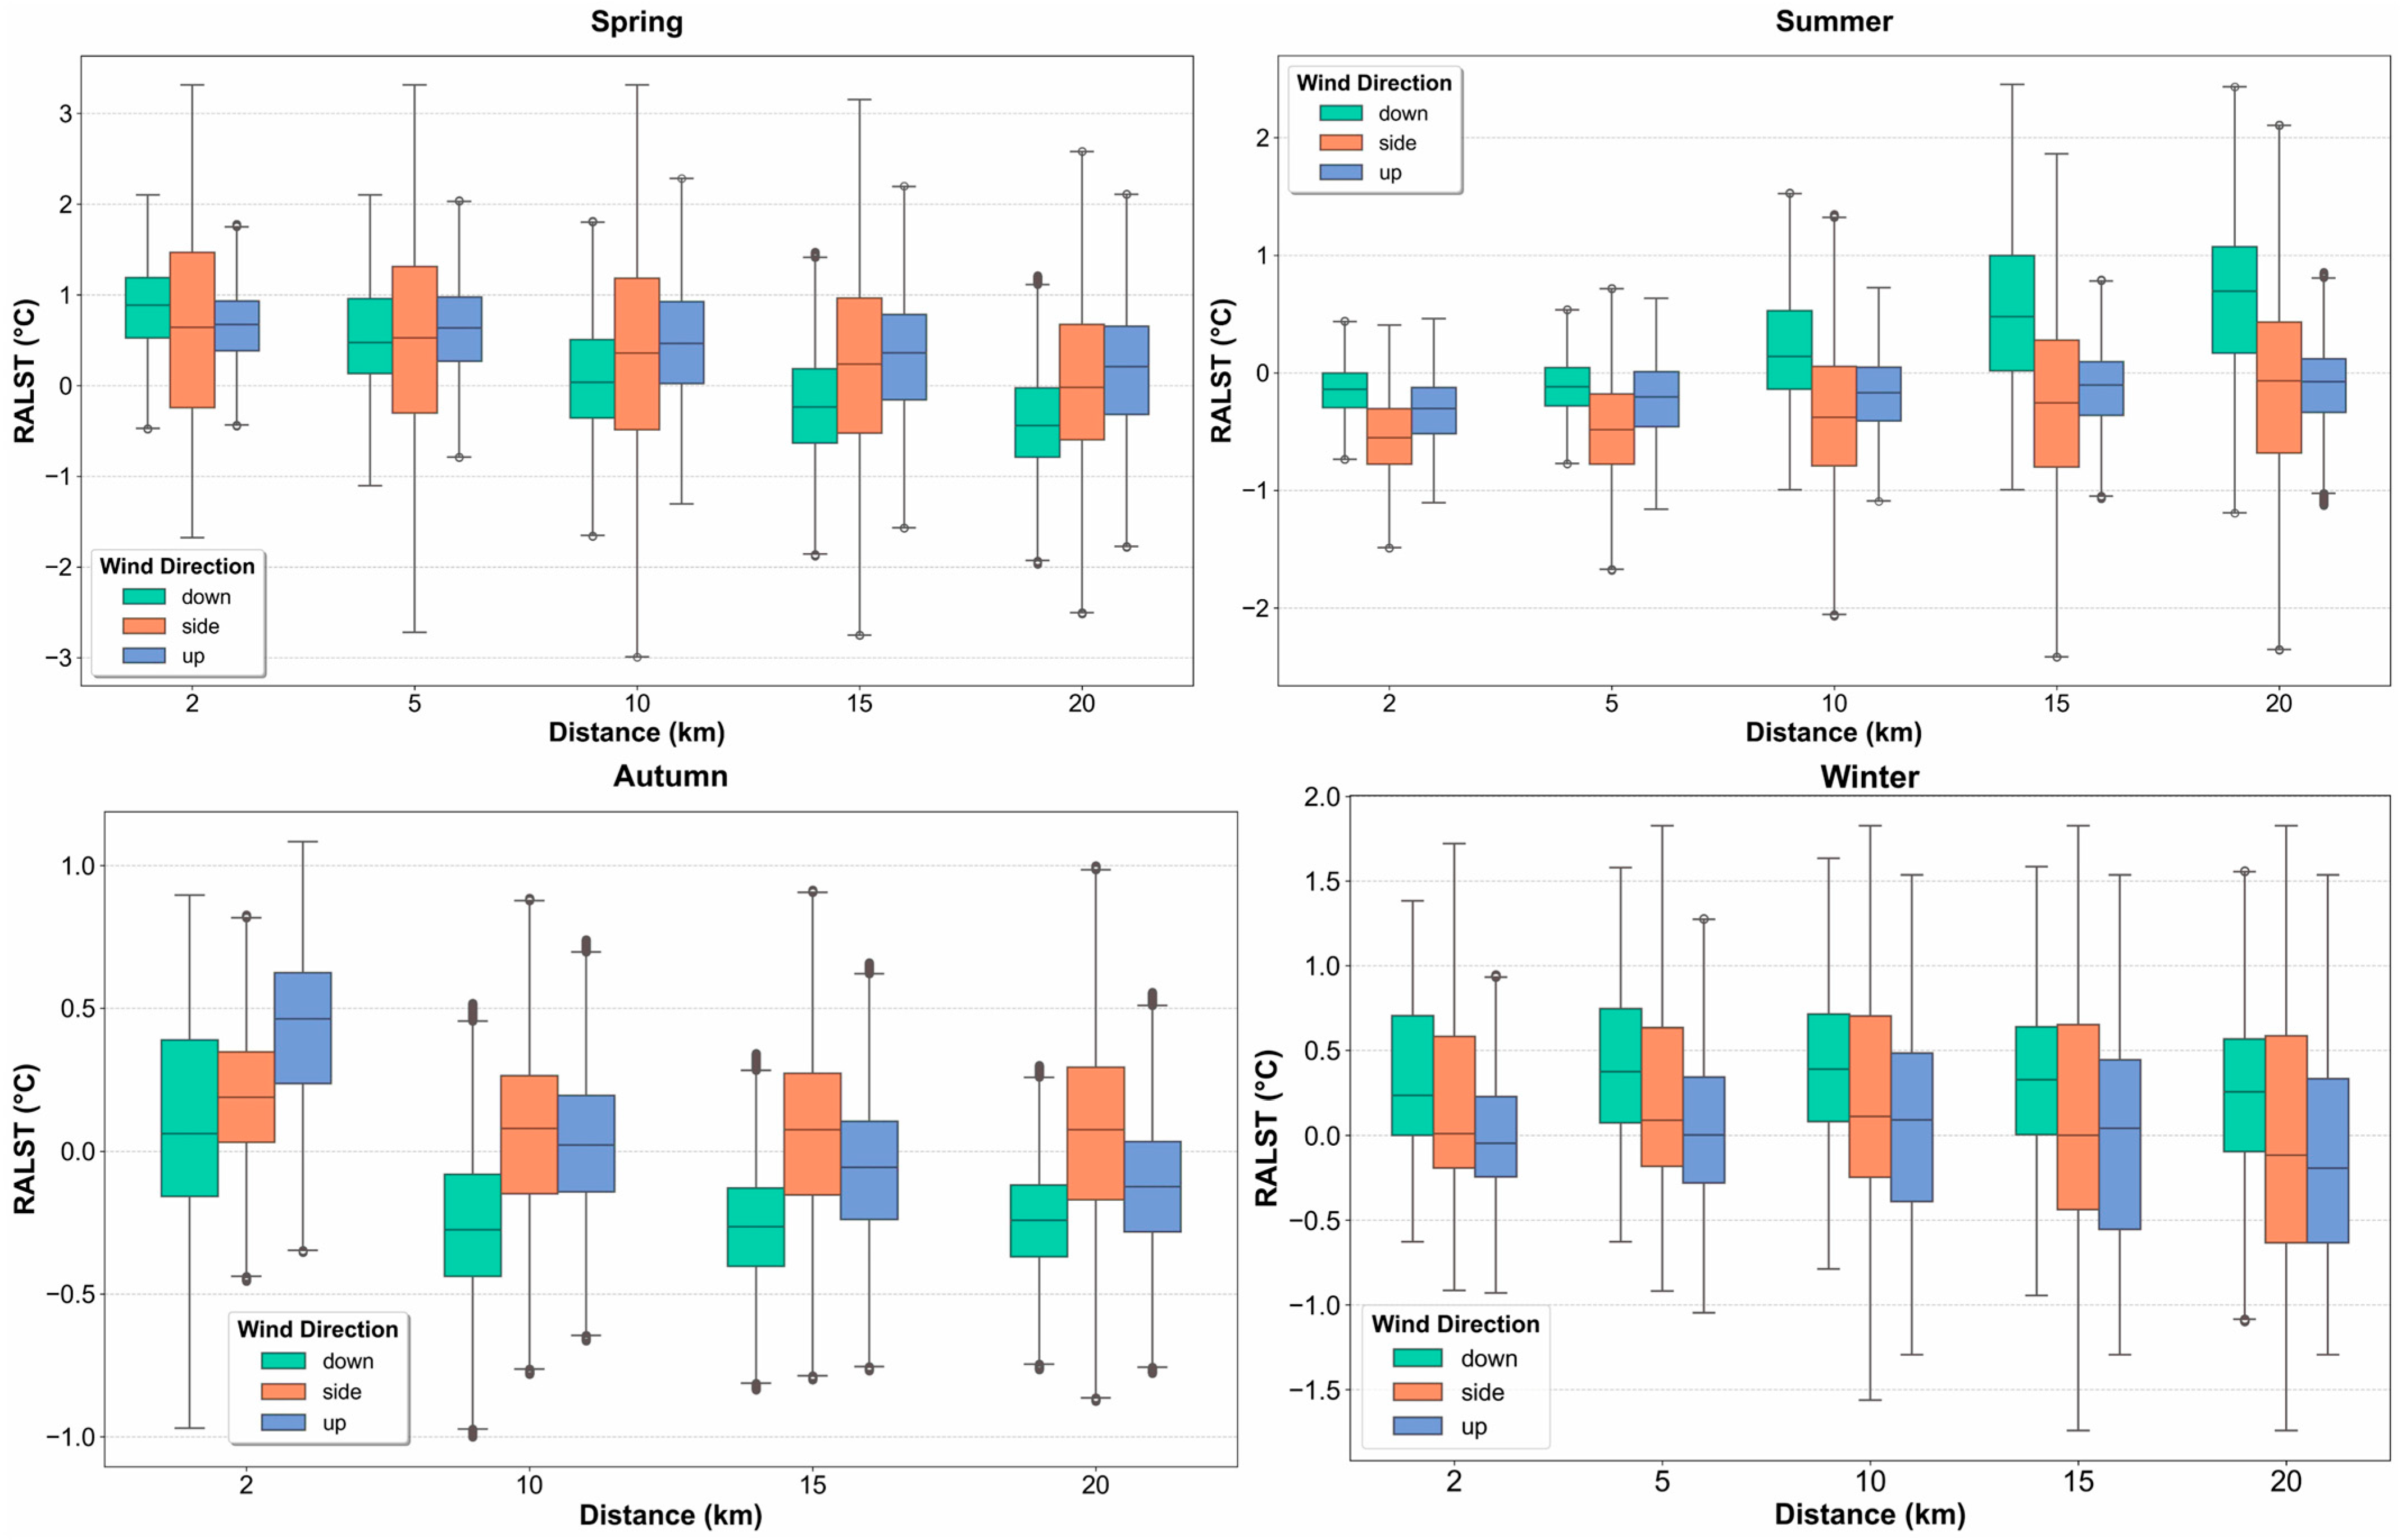
Figure 11 illustrates the RALST differences across seasons in the “upwind area”, “downwind area”, and “crosswind area” before and after the construction of wind farms in the Shisanjianfang Wind Zone. During spring and autumn, warming occurred across all wind directions, with the strongest warming in the upwind zone. In summer and winter, the most pronounced warming was found in the downwind areas within 2–5 km, whereas the upwind area exhibited stronger warming within 10–20 km. Comparisons with MODIS data confirmed significant daytime warming in the upwind area during spring and autumn, and localized warming in the downwind area during summer and winter, aligning with Landsat findings.
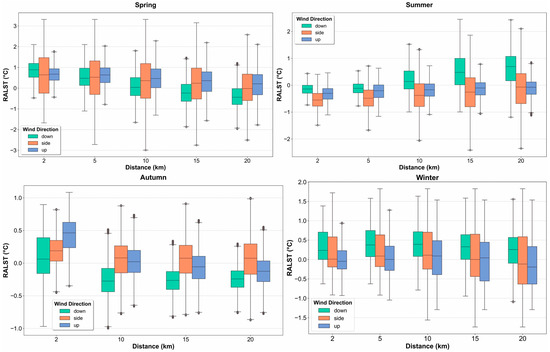
Figure 11.
Seasonal Comparison of RALST Differences Among Upwind, Downwind, and Sidewind Areas (Post- vs. Pre-Construction) in the Shisanjianfang Wind Zone.
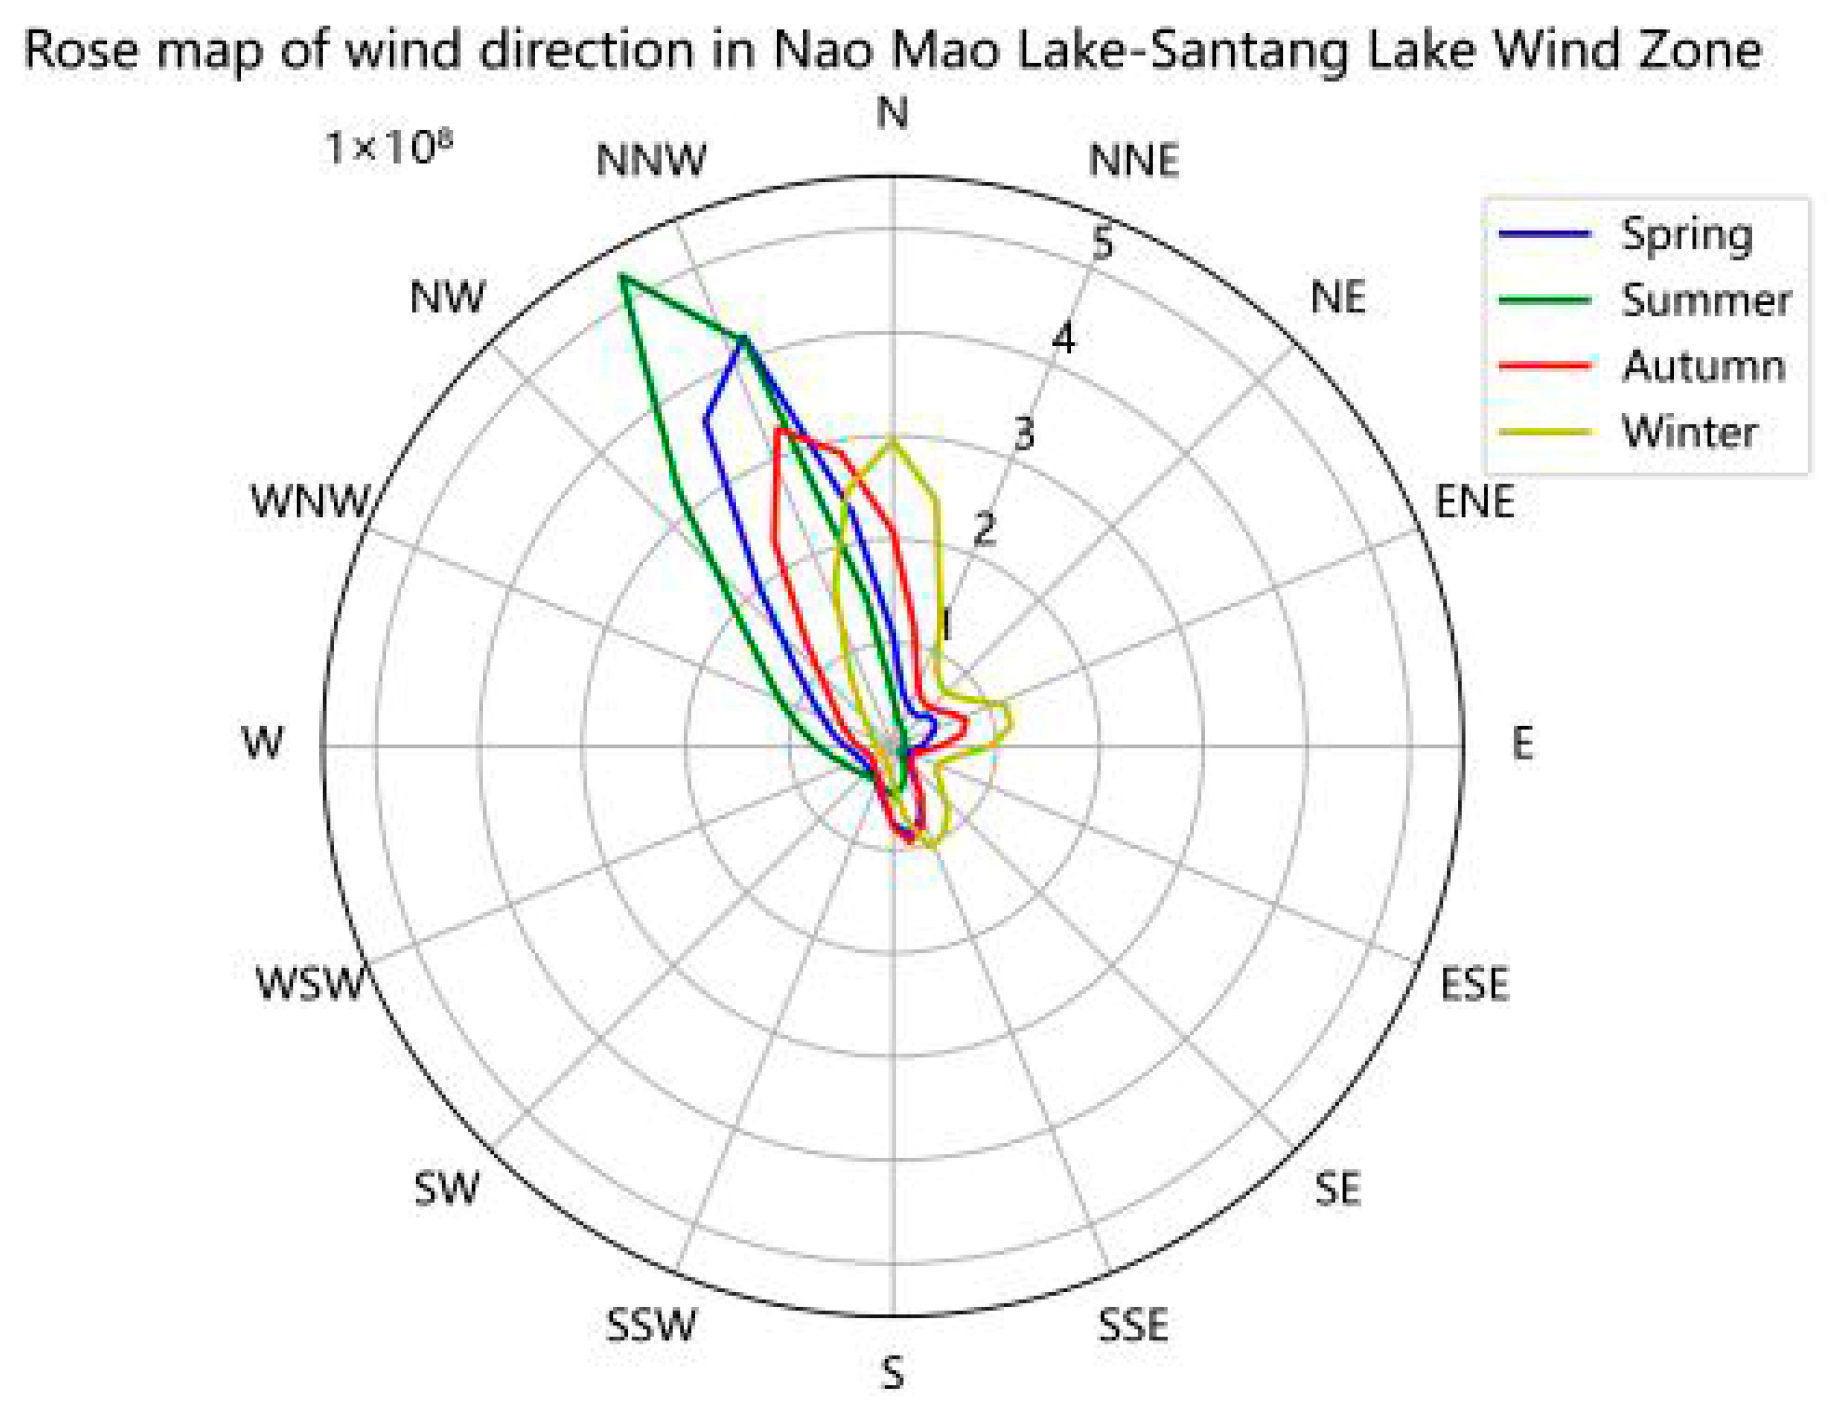
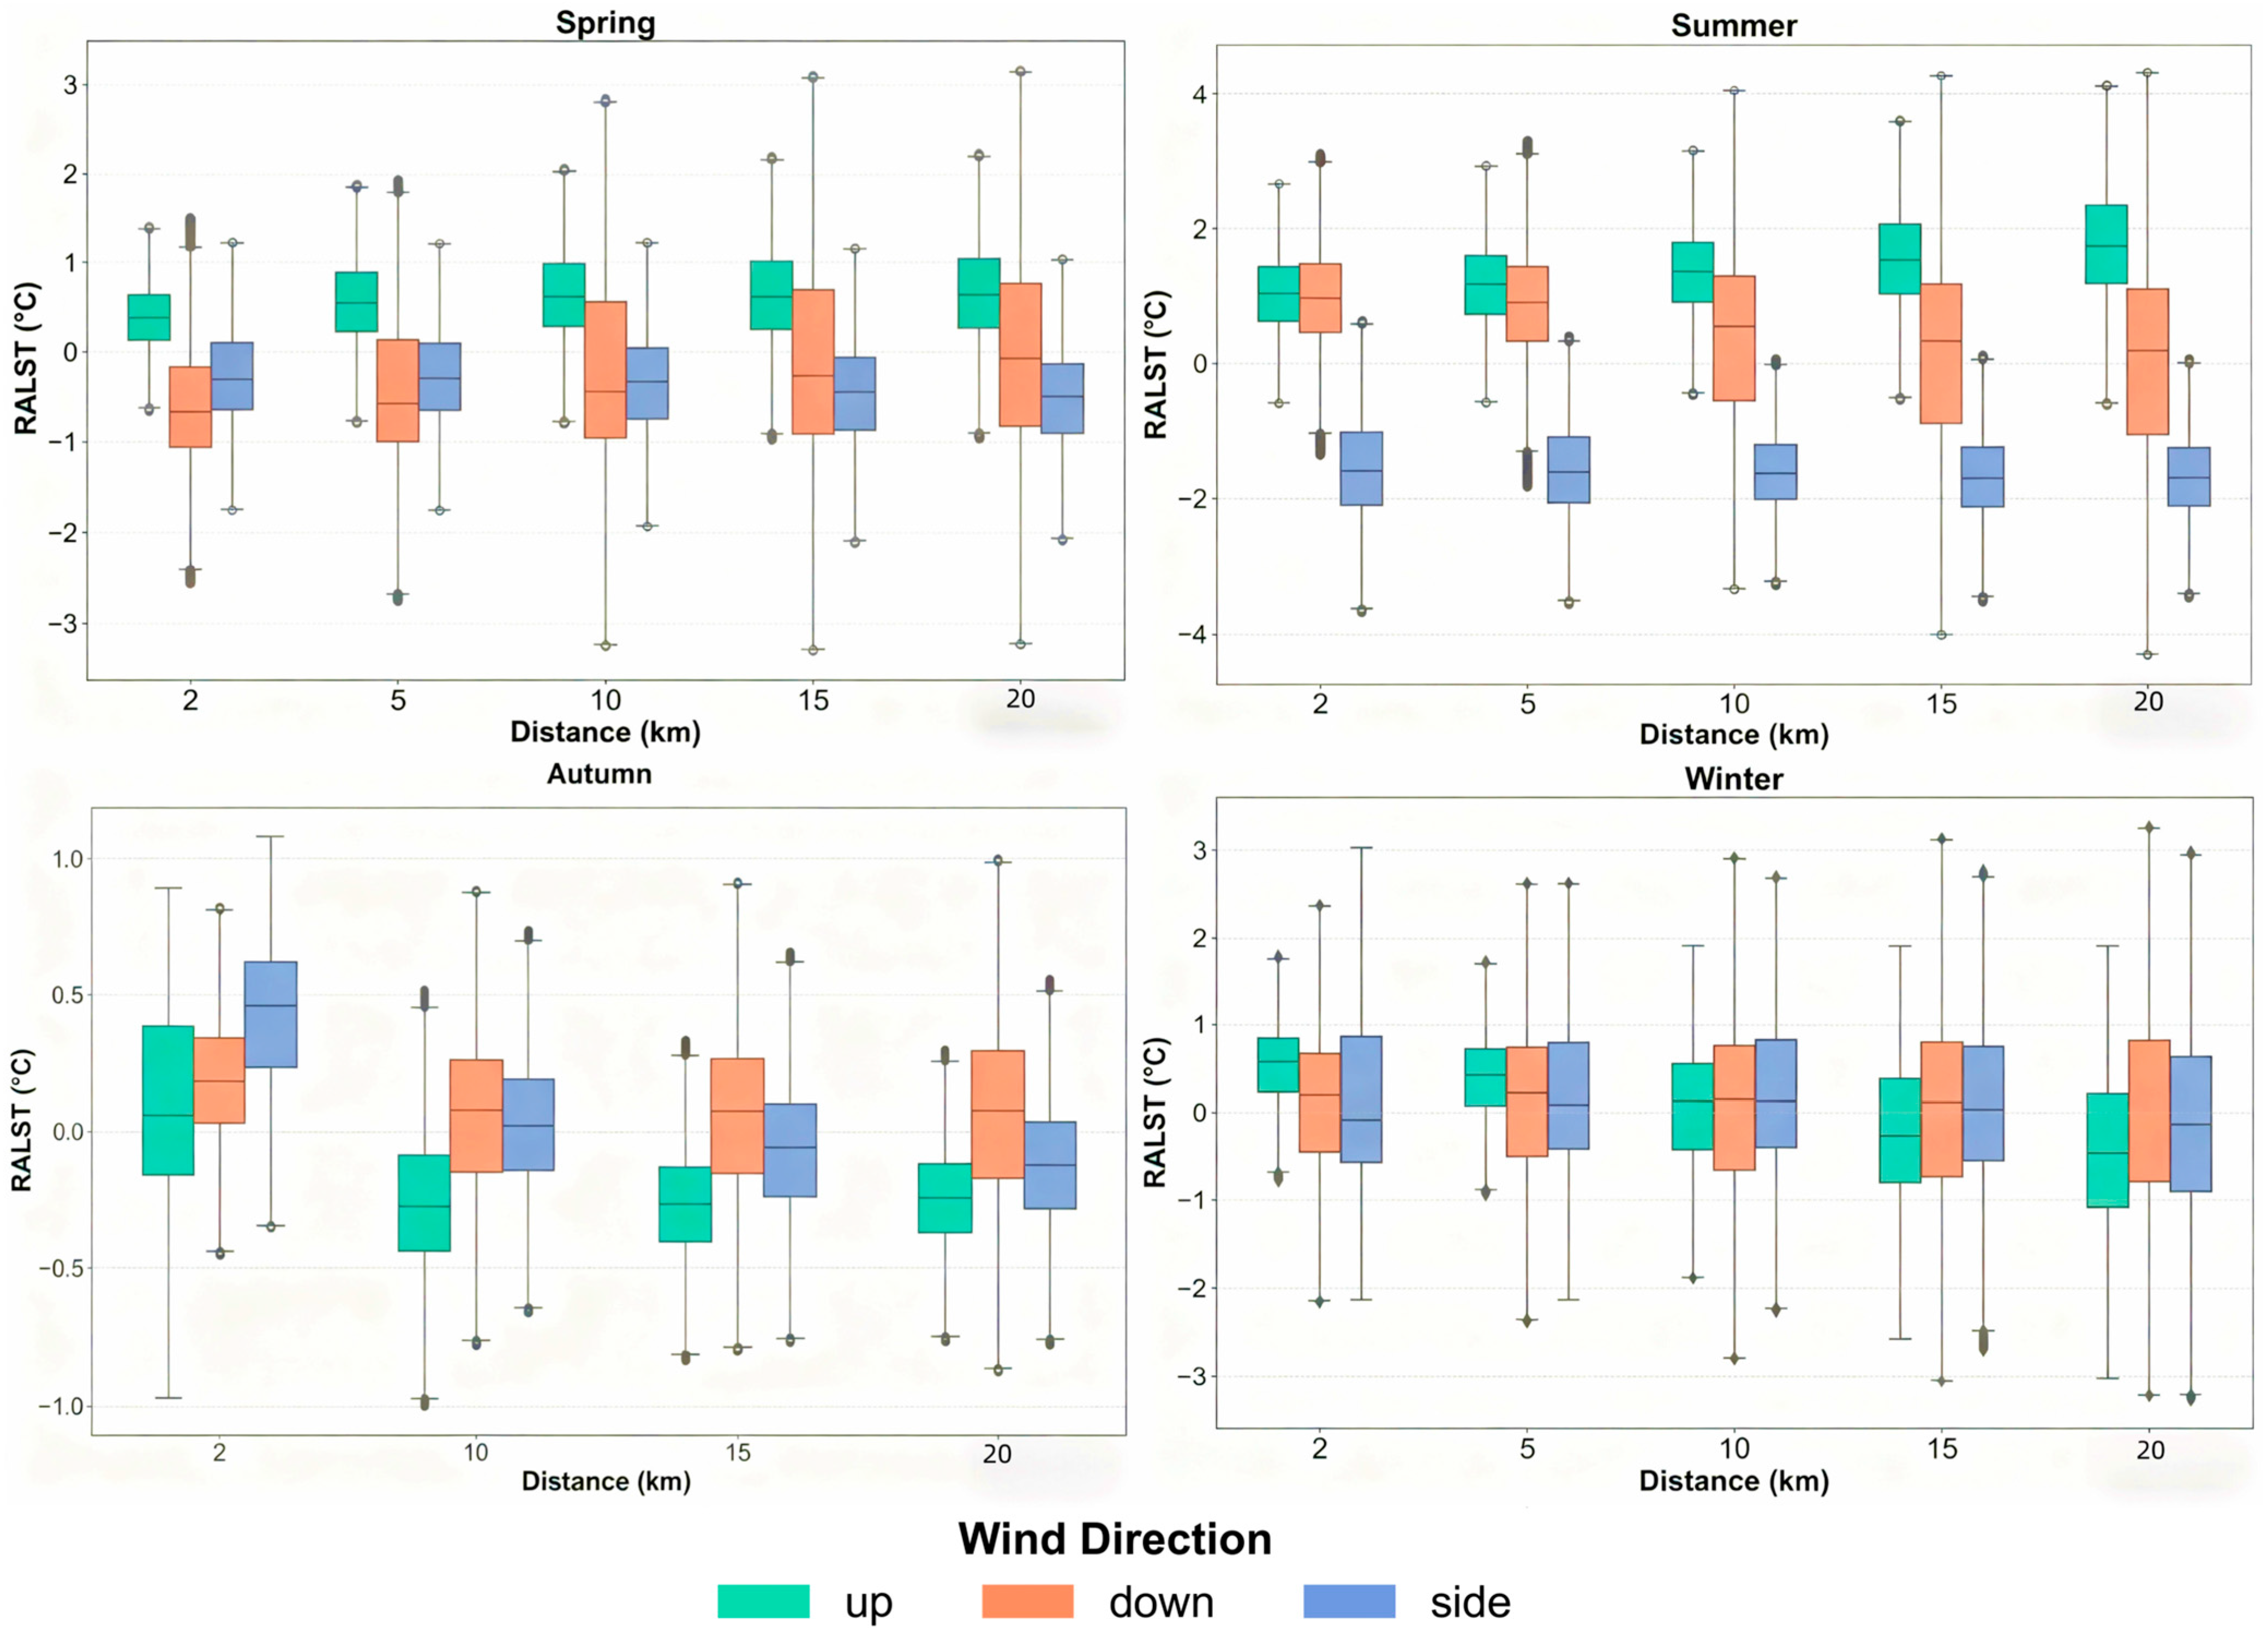
In the Naomao Lake–Santang Lake Wind Zone, dominant wind directions ranged from NW to NNE (upwind), with SE to SSW as downwind (Figure 12). Like the previous site, this region also had barren land and stable land use from 2008 to 2022 (Figure 13). LST data indicated a cooling trend within 2–10 km buffers during spring, summer, and autumn (Figure 14), suggesting a suppressive effect of wind farms on LST. In contrast, the 15–20 km zones showed occasional warming, likely due to extended wake effects. In winter, a warming trend with increasing distance from the wind farms was observed. Wind direction analysis (Figure 15) showed that in spring and summer, warming was most evident in the downwind zones, while in autumn, the upwind areas experienced greater warming. Winter results were more complex, with warming concentrated in the 2–5 km downwind areas and sidewind areas. Comparison of Landsat and MODIS data indicated some inconsistencies in summer and winter but similar results in spring and autumn. Walsh et al. [30] investigated the effects of wind farm operations on LST using Landsat data and reported a significant increase in LST in downwind areas, which aligns with the seasonal conclusions of this study. The discrepancies between MODIS and Landsat LST data may arise from differences in data continuity and the criteria used to delineate upwind and downwind regions. Overall, however, wind farm operations demonstrate a significant warming effect on local LST.
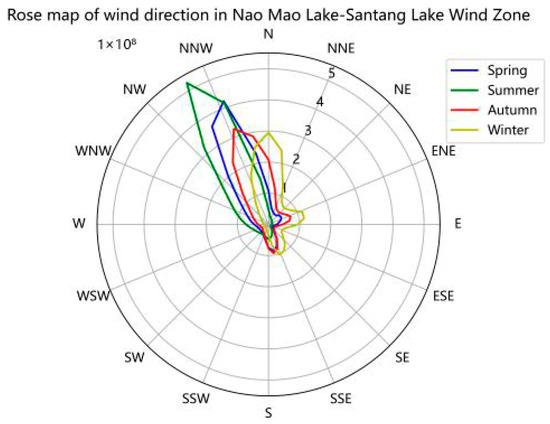
Figure 12.
Wind Rose Diagram of the Naomao Lake–Santang Lake Wind Zone.

Figure 13.
Land Use Types in the Naomao Lake–Santang Lake Wind Zone (2008 vs. 2022).
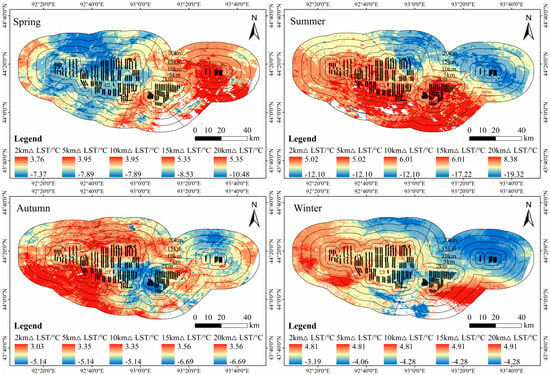
Figure 14.
Spatial Distribution of ΔLST Differences Between Post-Construction Stabilization Period and Pre-Construction Baseline in the Naomao Lake–Santang Lake Wind Zone.
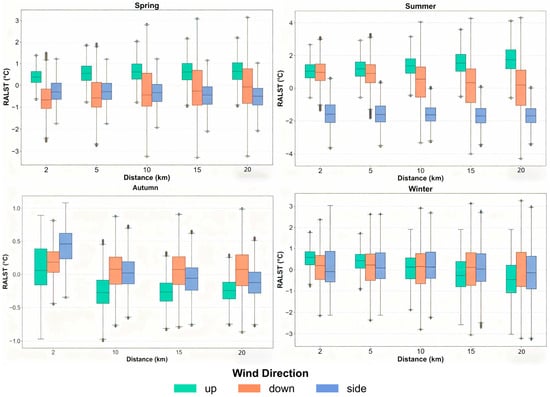
Figure 15.
Seasonal Comparison of RALST Differences Among Upwind, Downwind, and Sidewind Areas (Post- vs. Pre-Construction) in the Naomao Lake–Santang Lake Wind Zone.
3.6. Factors Analysis of Influencing Land Surface Temperature Variations in Wind Farms Using Random Forest
The results based on the Random Forest regression model indicate that wind farms affect the spatial and temporal distribution of LST by directly altering local wind speed, which in turn influences precipitation dispersion, evapotranspiration, and atmospheric mixing (Figure 16, Figure 17 and Figure 18). In spring, wind speed and precipitation emerge as the key drivers of LST variation, with wind farm-induced changes in wind fields potentially enhancing the evaporative cooling effect of precipitation [19]. During summer, the NDVI plays a significant cooling role via vegetation transpiration, but this effect is weakened by wind turbine-induced wake turbulence, which disrupts plant–atmosphere interactions [24,36]. In autumn, terrain variables such as DEM and latitude predominantly control the LST distribution. However, wind speed, as a direct impact factor of wind farms, modifies atmospheric dynamics and indirectly disrupts the cooling contributions of NDVI and PET [9,11]. In winter, snow cover exerts the dominant influence on LST through its high albedo effect. Wind farms interfere with snow deposition and melting patterns by modifying the wind field, which in turn alters the spatial regulation of LST by snow cover [9,28]. Additionally, although the direct effect of wind farms on nighttime LST is relatively limited, enhanced vertical atmospheric mixing induced by turbine operation may redistribute cold air and heat, modifying nighttime thermal patterns [37].
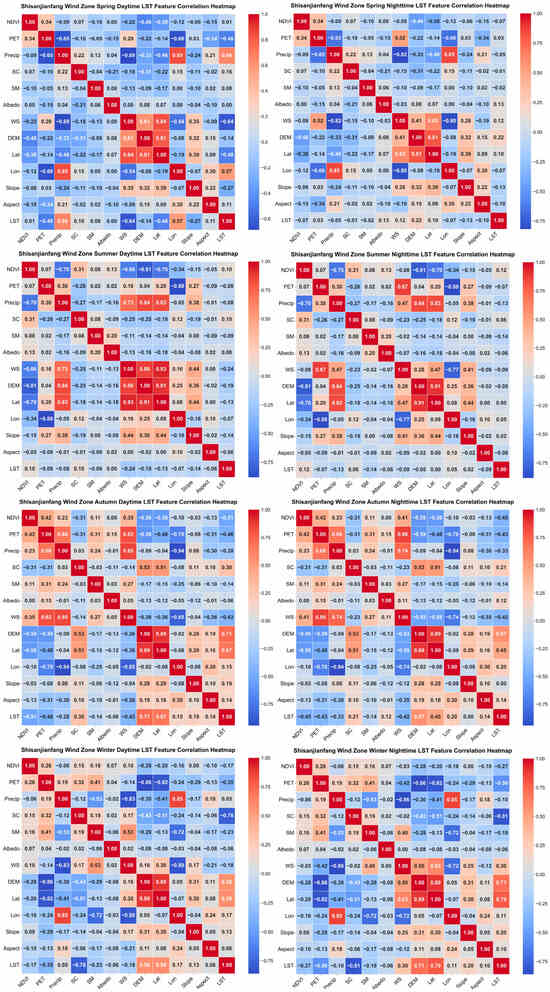
Figure 16.
Shisanjianfang Wind Zone Random Forest Feature Importance Plot.
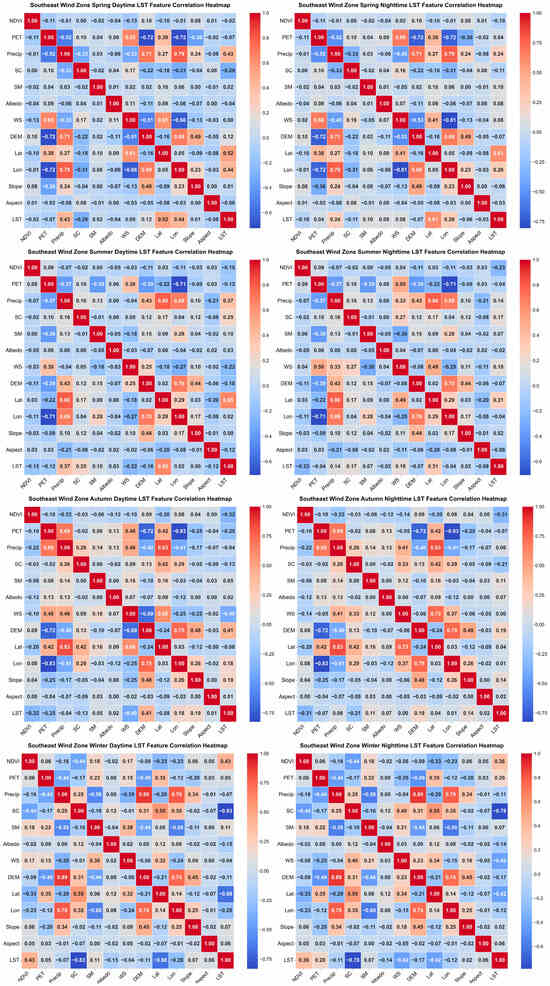
Figure 17.
Southeast Wind Zone Random Forest Feature Importance Plot.
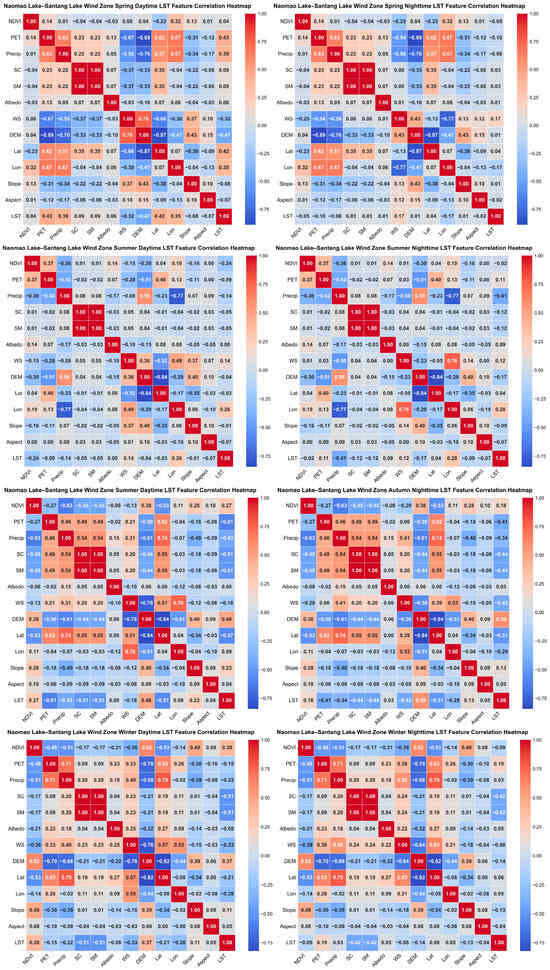
Figure 18.
Naomao Lake–Santang Lake Wind Zone Random Forest Feature Importance Plot.
4. Discussion
Based on MODIS and Landsat LST data from 2008 to 2022, this study analyzed the effects of wind farm operations on land surface temperature (LST) across three key wind zones in Hami, Xinjiang: the Shisanjianfang Wind Zone, the Southeast Wind Zone, and the Naomao Lake–Santang Lake Wind Zone. The results, derived from both satellite observations and machine learning analysis (particularly the Random Forest regression model), highlight a pronounced seasonal and spatial heterogeneity in wind farm-induced LST changes.
The most significant LST increases were observed during summer in areas with dense turbine deployment (up to 1.548 °C/15a). This warming is likely attributed to enhanced turbulent mixing triggered by turbine wake effects, which promote downward heat transport and inhibit nocturnal radiative cooling, leading to elevated nighttime temperatures [19]. The machine learning results further confirmed that summer LST is modulated by the interplay between NDVI and wind-induced turbulence. While NDVI typically contributes to daytime cooling via vegetation transpiration, wake-induced airflow disrupts this process, weakening its cooling capacity [26,27].
In autumn, a general cooling trend was detected, which may result from wind farms indirectly enhancing surface evaporative cooling by altering local wind fields and increasing moisture dispersion. The Random Forest model also identified wind speed as a key mediating variable, reducing LST through enhanced surface–atmosphere heat exchange [10,11]. In winter, terrain and snow cover emerged as dominant variables influencing LST variation. Wind farms modify wind fields, affecting snow deposition and melt patterns, which in turn alter surface albedo and thermal dynamics [10,33]. Notably, in enclosed basins like the Naomao Lake–Santang Lake Wind Zone, cold air pooling may amplify warming effects, whereas in open terrain such as the Shisanjianfang Wind Zone, enhanced turbulent mixing may promote thermal diffusion [15,22].
Furthermore, the study identified significant scale dependency in the thermal impacts of wind farms. MODIS-based macroscale analysis showed regional warming trends, particularly at night, while microscale Landsat data detected localized spring and autumn cooling effects, likely associated with complex aerodynamic wake interactions [19,30]. This divergence across spatial scales underscores the need for integrated multi-scale models to better evaluate the climatic effects of wind farm operations.
Building upon the seasonal and spatial heterogeneity identified, Random Forest analysis further elucidated the dominant seasonal mechanisms through which wind farms modulate local LST. In spring, wind farms primarily influence LST patterns by regulating wind speed, which subsequently alters precipitation diffusion processes [19]. During summer, while vegetation transpiration (as indicated by NDVI) typically buffers LST increases, wind farm operations may weaken this cooling capacity [24]. Autumn LST dynamics are significantly governed by enhanced air turbulence induced by wind farms, impacting surface–atmosphere heat exchange [11]. In winter, wind farms modify snow cover distribution and melt patterns through altered wind fields, thereby influencing surface albedo and cooling effects [12]. Additionally, although nocturnal LST variations are generally more stable, wind farm-enhanced air mixing can induce localized bidirectional LST fluctuations (either increases or decreases).
5. Conclusions
This study investigated the impact of wind farms on land surface temperature (LST) in the extremely arid region of Hami, Xinjiang, using MODIS and Landsat data (2008–2022). The key findings are as follows.
Firstly, wind farm operations induced significant seasonal and diurnal LST changes, with the most pronounced effect being nighttime warming in winter. Summer exhibited asymmetric diurnal responses, while spring and autumn showed moderated effects influenced by terrain and surface processes.
Secondly, random forest modeling identified wind speed, precipitation, NDVI, snow cover, and topography as key drivers of LST variability, with distinct responses observed between enclosed basins and open terrain.
Thirdly, LST impacts displayed spatial heterogeneity and a distance–decay pattern, being strongest within 2–5 km of turbines but detectable up to 20 km, suggesting interaction with mesoscale climate patterns.
Fourthly, comparison between impact and non-impact areas further confirmed that wind farms significantly altered LST trends, with notable warming at night and variable daytime responses. The Shisanjianfang Wind Zone exhibited daytime cooling and nighttime warming in summer, and a strong degree of warming in autumn nights. The Southeast Wind Zone showed consistent warming throughout summer, while in the Naomao Lake–Santang Lake Wind Zone, nighttime warming in winter was most pronounced. Diurnal LST differences also varied with wind direction: downwind warming at night was generally stronger than upwind warming, especially in winter and summer, highlighting the directional sensitivity of turbine-induced thermal effects.
Finally, comparisons between impacted and non-impacted areas confirmed significant thermal effects, characterized by consistent nighttime warming and seasonally variable daytime responses. Diurnal asymmetry and downwind-enhanced warming highlighted the directional sensitivity of turbine wakes.
This study provides the first comprehensive evidence that wind farm-induced LST changes in arid regions are highly complex, governed by a combination of turbine density, local climate, seasonal dynamics, and underlying surface characteristics. These findings underscore the necessity of integrating microclimate feedbacks into wind energy planning in ecologically sensitive arid zones. Specifically, we recommend that sustainable landscape planning for wind farms in such regions should carefully consider seasonal wind patterns, topographic effects, and the potential for nighttime warming when siting turbines, particularly in areas prone to temperature inversions or with fragile ecosystems.
Author Contributions
Conceptualization, H.J.; methodology, M.X. and H.J.; software, M.X.; validation, H.J. and M.X.; formal analysis, M.X. and H.J.; investigation, H.J.; resources, H.J., M.X., M.T., W.C. and D.H.; data curation, H.J., M.X. and X.L.; writing—original draft preparation, M.X.; writing—review and editing, H.J.; visualization, M.X.; supervision, H.J.; project administration, H.J.; funding acquisition, H.J. All authors have read and agreed to the published version of the manuscript.
Funding
This research was funded by the Open Subject of Xinjiang Oasis Ecology Key Laboratory (2023D04060), the National Natural Science Foundation of China (No. 41561081, No. 41001198), and the Doctor’s start-up fund of Xinjiang University (No. BS190205).
Institutional Review Board Statement
Not applicable.
Informed Consent Statement
Not applicable.
Data Availability Statement
The data presented in this study are available on request from the corresponding author.
Conflicts of Interest
The authors declare no conflict of interest.
References
- Duan, H. Emissions and temperature benefits: The role of wind power in China. Environ. Res. 2017, 152, 342–350. [Google Scholar] [CrossRef]
- Sahu, B.K. Wind energy developments and policies in China: A short review. Renew. Sustain. Energy Rev. 2018, 81, 1393–1405. [Google Scholar] [CrossRef]
- Barrie, D.; Kirk-Davidoff, D. Weather response to a large wind turbine array. Atmos. Chem. Phys. 2010, 10, 769–775. [Google Scholar] [CrossRef]
- Voigt, C.C.; Popa-Lisseanu, A.G.; Niermann, I.; Kramer-Schadt, S. The catchment area of wind farms for European bats: A plea for international regulations. Biol. Conserv. 2012, 153, 80–86. [Google Scholar] [CrossRef]
- Dai, K.; Bergot, A.; Liang, C.; Xiang, W.-N.; Huang, Z. Environmental issues associated with wind energy—A review. Renew. Energy 2015, 75, 911–921. [Google Scholar] [CrossRef]
- Kirk-Davidoff, D.B.; Keith, D.W. On the Climate Impact of Surface Roughness Anomalies. J. Atmos. Sci. 2008, 65, 2215–2234. [Google Scholar] [CrossRef]
- Wang, C.; Prinn, R.G. Potential climatic impacts and reliability of very large-scale wind farms. Atmos. Chem. Phys. 2010, 10, 2053–2061. [Google Scholar] [CrossRef]
- Baidya Roy, S.; Pacala, S.W.; Walko, R. Can large wind farms affect local meteorology? J. Geophys. Res. Atmos. 2004, 109, D19101. [Google Scholar] [CrossRef]
- Baidya Roy, S.; Traiteur, J.J. Impacts of wind farms on surface air temperatures. Proc. Natl. Acad. Sci. USA 2010, 107, 17899–17904. [Google Scholar] [CrossRef] [PubMed]
- Tang, B.; Wu, D.; Zhao, X.; Zhou, T.; Zhao, W.; Wei, H. The Observed Impacts of Wind Farms on Local Vegetation Growth in Northern China. Remote Sens. 2017, 9, 332. [Google Scholar] [CrossRef]
- Rajewski, D.A.; Takle, E.S.; Lundquist, J.K.; Oncley, S.; Prueger, J.H.; Horst, T.W.; Rhodes, M.E.; Pfeiffer, R.; Hatfield, J.L.; Spoth, K.K.J.B.o.t.A.M.S. Crop wind energy experiment (CWEX): Observations of surface-layer, boundary layer, and mesoscale interactions with a wind farm. Bull. Am. Meteorol. Soc. 2013, 94, 655–672. [Google Scholar] [CrossRef]
- Keith, D.W.; DeCarolis, J.F.; Denkenberger, D.C.; Lenschow, D.H.; Malyshev, S.L.; Pacala, S.; Rasch, P.J. The influence of large-scale wind power on global climate. Proc. Natl. Acad. Sci. USA 2004, 101, 16115–16120. [Google Scholar] [CrossRef]
- Wang, Q.; Luo, K.; Wu, C.; Fan, J. Impact of substantial wind farms on the local and regional atmospheric boundary layer: Case study of Zhangbei wind power base in China. Energy 2019, 183, 1136–1149. [Google Scholar] [CrossRef]
- Armstrong, A.; Burton, R.R.; Lee, S.E.; Mobbs, S.; Ostle, N.; Smith, V.; Waldron, S.; Whitaker, J. Ground-level climate at a peatland wind farm in Scotland is affected by wind turbine operation. Environ. Res. Lett. 2016, 11, 044024. [Google Scholar] [CrossRef]
- Moravec, D.; Barták, V.; Puš, V.; Wild, J. Wind turbine impact on near-ground air temperature. Renew. Energy 2018, 123, 627–633. [Google Scholar] [CrossRef]
- Xu, R. The Impact of Wind Farm on Local Micro Meteorological Environment in Arid Region-Taking Zhurihe Wind Farm as an Example. Master’s Thesis, Inner Mongolia Agricultural University, Hohhot, China, 2014. [Google Scholar]
- Zhang, X.; Li, J.; Chen, Z.; He, F.; Cui, Y. A preliminary exploration on the influence of wind farms on local climate in Dabie Mountainous areas in China: A case study of Dawu in Hubei province. Adv. Meteorol. Sci. Technol. 2019, 9, 56–61. [Google Scholar]
- Zhou, L.; Tian, Y.; Baidya Roy, S.; Thorncroft, C.; Bosart, L.F.; Hu, Y. Impacts of wind farms on land surface temperature. Nat. Clim. Change 2012, 2, 539–543. [Google Scholar] [CrossRef]
- Zhou, L.; Tian, Y.; Baidya Roy, S.; Dai, Y.; Chen, H. Diurnal and seasonal variations of wind farm impacts on land surface temperature over western Texas. Clim. Dyn. 2013, 41, 307–326. [Google Scholar] [CrossRef]
- Zhou, L.; Tian, Y.; Chen, H.; Dai, Y.; Harris, R.A. Effects of Topography on Assessing Wind Farm Impacts Using MODIS Data. Earth Interact. 2013, 17, 1–18. [Google Scholar] [CrossRef]
- Harris, R.; Zhou, L.; Xia, G. Satellite Observations of Wind Farm Impacts on Nocturnal Land Surface Temperature in Iowa. Remote Sens. 2014, 6, 12234–12246. [Google Scholar] [CrossRef]
- Slawsky, L.M.; Zhou, L.; Baidya Roy, S.; Xia, G.; Vuille, M.; Harris, R.A. Observed Thermal Impacts of Wind Farms Over Northern Illinois. Sensors 2015, 15, 14981–15005. [Google Scholar] [CrossRef]
- Qin, Y.; Li, Y.; Xu, R.; Hou, C.; Armstrong, A.; Bach, E.; Wang, Y.; Fu, B. Impacts of 319 wind farms on surface temperature and vegetation in the United States. Environ. Res. Lett. 2022, 17, 024026. [Google Scholar] [CrossRef]
- Chang, R.; Zhu, R.; Guo, P. A Case Study of Land-Surface-Temperature Impact from Large-Scale Deployment of Wind Farms in China from Guazhou. Remote Sens. 2016, 8, 790. [Google Scholar] [CrossRef]
- Ma, X.; Yu, Y.; Xia, D. Impacts of wind farms on land surface temperature—A case study on the wind farm in northern Zhangjiakou, Hebei. Plateau Meteorol. 2022, 41, 1074–1085. [Google Scholar]
- Zhang, X.; Wang, H.; Shang, G.; Sun, M.; Yan, Z.; Gao, Y.; Yuan, Q.; Zhang, C. Impact of wind farms on local land surface temperature in Qinghai Province, China. Int. J. Remote Sens. 2023, 45, 7318–7338. [Google Scholar] [CrossRef]
- Han, X.; Lu, C.; Wang, J. Long-Term Impacts of 250 Wind Farms on Surface Temperature and Vegetation in China: A Remote Sensing Analysis. Remote Sens. 2024, 17, 10. [Google Scholar] [CrossRef]
- Zheng, P.; Li, G.; Li, P.; Fang, Z.; Han, Q. Analysis of the impact of wind farms on surface temperature in arid desert areas. Wind Energy 2018, 4, 64–68. [Google Scholar]
- Walsh-Thomas, J.M.; Cervone, G.; Agouris, P.; Manca, G. Further evidence of impacts of large-scale wind farms on land surface temperature. Renew. Sustain. Energy Rev. 2012, 16, 6432–6437. [Google Scholar] [CrossRef]
- Qi, F.; Li, G.; Dong, L.; Ma, L.; Wang, F. Impact of wind turbines on land surface temperature and evapotranspiration in Horqin grassland. Geospat. Inf. 2019, 17, 107–110. [Google Scholar]
- Zhou, J.; Deitch, M.J.; Grunwald, S.; Screaton, E. Do the Mann-Kendall test and Theil-Sen slope fail to inform trend significance and magnitude in hydrology? Hydrol. Sci. J. 2023, 68, 1241–1249. [Google Scholar] [CrossRef]
- Collaud Coen, M.; Andrews, E.; Bigi, A.; Martucci, G.; Romanens, G.; Vogt, F.P.; Vuilleumier, L. Effects of the prewhitening method, the time granularity, and the time segmentation on the Mann–Kendall trend detection and the associated Sen’s slope. Atmos. Meas. Tech. 2020, 13, 6945–6964. [Google Scholar] [CrossRef]
- Xu, J. Quantitative Geography; Higher Education Press: Beijing, China, 2006. [Google Scholar]
- Cohen, J. Statistical Power Analysis for the Behavioral Sciences; Routledge: London, UK, 2013. [Google Scholar]
- Shen, Y.J.; Shen, Y.; Goetz, J.; Brenning, A. Spatial-temporal variation of near-surface temperature lapse rates over the Tianshan Mountains, central Asia. J. Geophys. Res. Atmos. 2016, 121, 14006–14017. [Google Scholar] [CrossRef]
- Xia, G.; Zhou, L.; Freedman, J.M.; Roy, S.B.; Harris, R.A.; Cervarich, M.C. A case study of effects of atmospheric boundary layer turbulence, wind speed, and stability on wind farm induced temperature changes using observations from a field campaign. Clim. Dyn. 2015, 46, 2179–2196. [Google Scholar] [CrossRef]
- Liu, N.; Zhao, X.; Zhang, X.; Zhao, J.; Wang, H.; Wu, D. Heterogeneous warming impacts of desert wind farms on land surface temperature and their potential drivers in Northern China. Environ. Res. Commun. 2022, 4, 105006. [Google Scholar] [CrossRef]
Disclaimer/Publisher’s Note: The statements, opinions and data contained in all publications are solely those of the individual author(s) and contributor(s) and not of MDPI and/or the editor(s). MDPI and/or the editor(s) disclaim responsibility for any injury to people or property resulting from any ideas, methods, instructions or products referred to in the content. |
© 2025 by the authors. Licensee MDPI, Basel, Switzerland. This article is an open access article distributed under the terms and conditions of the Creative Commons Attribution (CC BY) license (https://creativecommons.org/licenses/by/4.0/).

