Abstract
As grids decarbonize and end-use sectors electrify, the rapid penetration of artificial intelligence (AI) and hyperscale data centers reshapes the electrical load profile and power quality requirements. This leads not only to higher consumption but also coincident demand in constrained urban nodes, steeper ramps and tighter power quality constraints. The article investigates to what extent a compute-additionality covenant can reduce resource inadequacy (LOLE) at an acceptable $/kW-yr under realistic grid constraints, tying interconnection/capacity releases to auditable contributions (ELCC-accredited firm-clean MW in-zone or verified PCC-level services such as FFR/VAR/black-start). Using two worked cases (mature market and EMDE context) the way in which tranche-gated interconnection, ELCC accreditation and PCC-level services can hold LOLE at the planning target while delivering auditable FFR/VAR/ride-through performance at acceptable normalized costs is illustrated. Enforcement relies on standards-based telemetry and cybersecurity (IEC 61850/62351/62443) and PCC compliance (e.g., IEEE/IEC). Supply and network-side options are screened with stage-gates and indicative ELCC/PCC contributions. In a representative mature case, adequacy at 0.1 day·yr−1 is maintained at ≈$200 per compute-kW-yr. A covenant term sheet (tranche sizing, benefit–risk sharing, compliance workflow) is developed along an integration roadmap. Taken together, this perspective outlines a governance mechanism that aligns rapid compute growth with system adequacy and decarbonization.
1. Introduction
The global energy system is being reshaped by the imperative to decarbonize, by rapid electrification and deep decarbonization and by the emergence of AI-enabled technologies [1]. IEA projects that electricity consumption by data centers could approach ~945 TWh by 2030, with AI as a major driver, representing just under 3% of global electricity in the base case and growing at ~15% per year from 2024 to 2030 [2]. Consistent with this uncertainty, demand is treated parametrically rather than deterministically, using PUE bands [1.10–1.30] combined with low/central/high compute-growth scenarios to bound outcomes, anchored in the empirical spread between best-in-class hyperscale operations (fleet PUE ~1.09) and the sectoral average (~1.58) [2,3]. Figure 1 summarizes the parametric AI/data-center demand envelope to 2030 and 2035, combining low/central/high compute growth with the PUE bands [1.10–1.30] defined above, and anchoring the central 2030 point to the IEA’s ~945 TWh estimate.
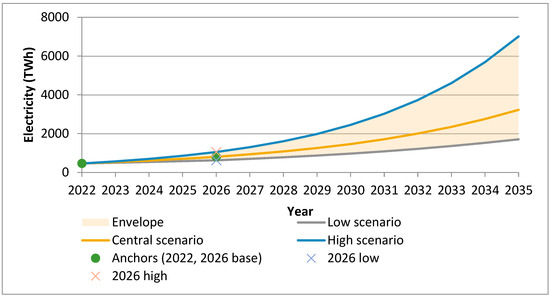
Figure 1.
AI/data-center electricity demand envelope (all electricity quantities are AC site energy) by 2030 and 2035. Envelope is scenario-based. Orange and blue ‘×’ symbols and green circle mark external anchor points (base year and 2026 low/central/high) used to calibrate the scenarios. The shaded envelope interpolates between them given the PUE band. (check Supplementary Note S1).
In parallel, decarbonization strategies are favoring electrification as the primary route to mitigate GHG emissions. This includes road transport shifts from internal combustion to electromobility, buildings’ transition towards electric heating and cooling, and the electrification of industrial processes that were once reliant on direct fossil combustion [4]. The consequence is an increase not only in aggregate consumption but in the coincidence of load growth with urban nodes and industrial clusters, where hosting capacity, fault-level margins and power-quality tolerances are already binding. In this paper, a “symbiosis/paradox” lens is adopted. AI is simultaneously: (i) an increasingly dominant, locationally concentrated consumer of electricity and (ii) a force-multiplier capable of accelerating discovery, engineering and deployment of clean, reliable power. In this manner a lagged but governable feedback loop between demand and supply is created. Operationally, this implies that voltage-regulation bands, harmonic-distortion limits and ride-through behavior at the point of common coupling (PCC) must be treated as first-order constraints (IEEE 519-2022 [5]; EN 50160:2022 [6]; IEC 61000-4-34 + A1:2009 + A2:2025 [7]).
AI and robotics are expected to play a significant part in the growing demand for electricity. The growth of data centers driven by cloud services, machine-learning workflows and pervasive IoT connectivity is reshaping the demand profile, since high-performance computing and advanced analytics are typically operated on a round-the-clock basis, with tight requirements for voltage regulation, harmonics control and ride-through capability. According to recent analyses, the compound annual growth rate of data-center energy consumption may approach 15% over the next decade in the IEA base case, with AI as the dominant driver [8,9]. Such growth reflects not only electricity used behind the meter but also induced needs for grid stabilization, reactive-power support and backup capacity, in order to satisfy reliability criteria. In jurisdictions with explicit adequacy targets (e.g., LOLE ≤ 0.1 day·yr−1), accredited capacity contributions are assessed via ELCC to ensure that incremental compute does not degrade reliability [10]. As a result, demand forecasting has to be coupled with explicit modeling of the power-electronics interface, which includes UPS behavior, inverter set-points, fault-ride-through and fast-frequency response, since these elements condition the net load seen by the system operator and determine the extent to which flexibility can be sourced locally without degrading power quality. Accordingly, procurement and design for large data centers should be framed in terms of services (e.g., FFR, primary/secondary VAR, black-start contribution where applicable) as well as energy, with compliance demonstrated against PCC-level power-quality standards.
At the same time, while developed economies benefit from advanced grid infrastructure and integrated portfolios of renewables and flexibility assets, emerging markets and developing economies (EMDEs) face a dual challenge. Rapid urbanization and industrialization in parts of sub-Saharan Africa and Asia are expected to accelerate demand growth, yet access to affordable capital and specialized technical expertise remains constrained. Countries in these regions must scale both capacity and resilience under tight fiscal conditions and with limited institutional capabilities [11]. Consequently, investments in modern grid architectures, which include transmission backbones, primary and secondary substations and digital protection schemes, together with energy storage and renewable generation, become critical policy imperatives. As is clear, sequencing is important, with renewable deployments located near load, reinforcement of high-factor transmission corridors and targeted storage for peak shaving and contingency cover so that delivery risk is controlled. The scale of the challenge is underscored by current access metrics (~600 million Africans without electricity access) and the investment gap identified by IEA/ESMAP [12,13]. A complementary priority for EMDEs is to develop local manufacturing and maintenance capability for priority technologies so that dependence on imported equipment does not become a binding risk during scale-up.
Even as wind and solar expand rapidly, their intermittency necessitates additional flexibility at multiple timescales. Investments in storage in the form of lithium-ion batteries for fast response, longer-duration pumped hydro storage and hydrogen-based options are increasing [14]. Yet, several solutions remain at relatively low technology readiness levels when benchmarked against widely deployed solutions, which sustains uncertainty around meeting peak demand without recourse to fossil-fuel-based backup. It is therefore the case that demand-side measures, which included load shifting, response aggregation and controlled curtailment of non-critical processes, are required as complements, and that interconnection, dynamic line rating and advanced voltage-VAr control are deployed to raise effective hosting capacity in the near term while maintaining system security. In parallel, AI methods, which include surrogate modeling, active learning and closed-loop lab automation, can compress design–build–test–learn cycles for selected options with system value (e.g., EGS/CPG near load centers, HTS urban backbones, CSP + TES for evening ramps and perovskite–Si tandems), provided that governance links incremental compute to open telemetry, testbeds and milestone-based funding.
Furthermore, governments are enacting measures intended to accelerate the energy transition. These measures include capital subsidies for renewable installations, carbon-pricing mechanisms and regulatory reforms that facilitate grid modernization. Integrated policy frameworks underscore that robust transitions depend on aligning economic incentives with technological progress while preserving reliability and affordability [15]. In practice, this alignment is operationalized through transparent evaluation, measurement and verification (M&V) of delivered system services (e.g., IPMVP Core Concepts 2022 (EVO 10000-1:2022)-consistent baselining [16]) and through procurement that explicitly values flexibility. Where interconnection backlogs are material, process reforms (e.g., cluster-study approaches and readiness screens) are critical complements to zone-level resource adequacy [17,18]. To make the symbiosis operational, two coupling mechanisms are emphasized: (i) conditional interconnection/permitting for large compute loads tied to verifiable additionality of firm-clean capacity or certified grid-service portfolios in the same zone, and (ii) open-data requirements (with privacy safeguards) for data centers’ level telemetry, to improve grid-operations models and evaluate learned controllers.
For operators, the near-term part of the paradox is tangible. Dense compute clusters are required to be supported by continuous thermal management and high-density power distribution, while the UPS/inverter subsystem is set to control regimes whose set-points, harmonic performance, short-circuit behavior and ride-through characteristics condition the available hosting capacity. At the same time, these parameters ought to be specified in order to ensure compliance with voltage regulation, flicker limits, EMC and fault-ride-through thresholds under a steady state and contingency operation [19,20,21,22].
What is not yet known in definite terms is the expansion in the use of robots. Recent industry commentaries have suggested that autonomous machines may diffuse across manufacturing, logistics and selected services at scale, thereby creating a distributed yet synchronous demand class whose coincidence factors and duty cycles are still uncertain. In this paper, robotics demand is treated as an upper-bound stress class, separate from core data-center loads, and is developed with bounded S-curve adoption, duty-cycle assumptions and power-draw distributions in Section 3.
At the same time, it is acknowledged that AI and robotics do not solely act as additional loads. Significant opportunities are provided to reduce consumption in conventional sectors when data and control are embedded within advanced energy management systems. In industrial settings, AI-driven predictive maintenance has been shown to optimize plant operation, reduce unplanned outages and lower energy wastage by anticipating degradation and scheduling interventions at non-disruptive windows [23]. In the buildings sector, smart control systems that learn occupancy and thermal inertia adjust HVAC operation dynamically and deliver measurable savings relative to static set-point control with field and meta-analytic evidence spanning ~5–20% HVAC/whole-building savings [24,25,26,27]. Realized system benefits, however, depend on baselines being established credibly, on rebound effects being constrained and on the separation between energy-aware inference at the edge and energy-intensive training in the cloud being made explicit, so that the net effect on the grid is understood. In practice, this requires measurement and verification of delivered services, disclosure of duty cycles for AI workloads and co-siting or contractual coupling with a clean and flexible power supply, so that local hosting capacity is respected. These requirements double as the “governance layer” that can channel AI’s acceleration capabilities toward technologies with near-term system value.
Finally, the implications for grid operators and policymakers are high, since the dual nature of AI, acting both as an efficiency enabler and as an increasing consumer, must be reflected in planning standards, interconnection procedures and procurement signals. Grid modernization programs are therefore required to account for the additional load imposed by data-center clusters and robotic operations, while regulatory frameworks need to be structured in a way to incentivize energy-efficient AI architectures and to promote timely investments in renewable generation and flexibility, so that the carbon footprint of digital demand is contained. It is well established that the integration of distributed energy resources with intelligent load-management systems provides a pathway by which supply and demand can be balanced in real time with reduced curtailment, improved hosting capacity and enhanced resilience [28]. It becomes an imperative to bring into the mainstream interoperability standards, transparent telemetry, contracts that value fast-frequency response, voltage support and ride-through capability, as well as cybersecurity requirements, so that digital loads participate in system services rather than free-ride on them. In conditional interconnection tied to additionality, service-based procurement, and open testbeds constitute the practical mechanisms that bind incremental compute to measurable system value.
To summarize, as AI-enabled computation and robotics expand, new electricity requirements are introduced at precisely the nodes where power-quality tolerances are tightest, yet complementary reductions are unlocked when predictive maintenance and smart control are deployed within credible baselines. Since the demand shock and the acceleration benefits will potentially unfold in different time scales, ~1–5 years for grid adequacy and power-electronics operability versus ~5–15 years for AI-accelerated hardware and materials, the central policy task has to be the governance of this lagged feedback so that near-term stress finances and, at the same time, de-risks medium-term solutions. Whether the balance resolves to an AI net burden or a net benefit will depend on disciplined interface design, on data-center and robotics operations being aligned with a clean and flexible supply, and on policy frameworks that embed intelligent demand as an active participant in secure, low-carbon system operation. Accordingly, we pose the following research questions to guide the analysis: Under a planning target of LOLE = 0.1 day·yr−1, to what extent can tranche-gated interconnection of compute load, conditioned on PCC compliance and provision of FFR/VAR, maintain system adequacy (ΔELCC, ΔLOLE) and at what normalized cost (USD per compute-kW-yr) across mature and EMDE contexts? (SQ1) What accredited firm-clean capacity (ELCC) and PCC-level services (FFR/VAR/ride-through) per MW of compute are required to hold a zonal LOLE constant? (SQ2) What telemetry resolution and cybersecurity architecture (IEC 61850 [29]/IEC 62443 [30]) are necessary for auditable enforcement at an acceptable compliance cost? Which tranche-release and cost-sharing structures minimize interconnection delays without degrading power quality? The remainder of the paper therefore proceeds in two parts: AI as burden and AI as accelerator, joined by a governance layer that makes the “symbiosis/paradox” visible, measurable and financeable.
To reconcile rapid growth in compute load with net-zero and system-adequacy constraints, a compute-additionality covenant is proposed to be established between large compute providers and system operators (see Section 4.3). Interconnection capacity for hyperscale clusters (~50–100+ MW) is released in tranches, conditional on: (i) provision of verifiable, PCC-level grid services—fast frequency response/inertial contribution, dynamic VAR support and voltage regulation, fault-ride-through—demonstrated within IEEE 519-2022, EN 50160:2022 and IEC 61000-4-34:2005 + A1:2009 + A2:2025 limits; and/or (ii) underwriting effective load-carrying capability (ELCC)-accredited firm, clean capacity within the same capacity zone, so that loss of load expectation is not degraded relative to the counterfactual. Compliance relies on open, timestamped IEC 61850 (series), telemetry with IEC 62443 (series), cyber-hardening and settlement-grade M&V, so that performance and payment are aligned and auditable. At the same time, the covenant internalizes hosting-capacity and protection-upgrade costs through a transparent tariff, giving regulators a tractable mechanism to align compute expansion with reliability and decarbonization objectives. In effect, generic “green PPAs” are upgraded to system-adequacy commitments. To clarify how the proposed covenant relates to familiar instruments, Table 1 compares it with green PPAs and carbon pricing, along enforceability and adequacy linkages.

Table 1.
Covenant vs. green PPAs vs. carbon pricing.
The key contributions of the paper are as follows: (i) in terms of sustainability, the tranche-gated additionality with community-benefit earmarks, in order to protect adequacy and equity, (ii) in terms of computing the schedulability together with standards-based telemetry/cyber (IEC 61850/62351/62443) for auditable enforcement, and (iii) in terms of renewables, the ELCC-accredited firm-clean build and PCC services tied to capacity accreditation together with LOLE targets. The rest of the paper is developed as follows: Section 2 sets out the modeling stack and the methods flowchart, Section 3 develops the scenario inputs and deterministic reports with the Monte Carlo results, Section 4 formalizes the covenant’s PCC/ELCC tests and the governance workflow, Section 5 summarizes technology screening and cost–risk bands and Section 6 concludes with policy design, together with implementation guidance. Supplementary Notes S1–S4 provide equations, parameter tables and reproducible excel workbooks, in order to ensure transparency and repeatability.
2. Methods
This section sets out the modeling framework, which underpins both the probabilistic demand envelope and the evaluation of the compute-additionality covenant. Benchmarked base demand, compute-growth trajectories, PUE distributions, the training–inference mix, robotics adoption, coincidence factors and regional modifiers are integrated into a correlated Monte Carlo engine in order to generate hourly time-series realizations of load and technology performance. Afterwards, these traces are subjected to two screening layers, namely: (i) a system-adequacy screen which estimates marginal ELCC and the induced shift in LOLE/LOLP; and (ii) a PCC-compliance screen which tests harmonics (THD), voltage/flicker and ride-through behavior, fast-frequency-response sizing, and interconnection constraints under standards-based telemetry and cybersecurity. Costs and risks are then normalized to common units ($/kW-yr, $/MWh-yr), with explicit accounting for audit/telemetry burden, downtime penalties and benefit–risk sharing, yielding decision metrics—ΔELCC, ΔLOLE, PCC violations avoided, interconnection delays mitigated and cost per avoided LOLE hour—with uncertainty bands. Implementation details, equations and reproducible workbooks are provided in Supplementary Note S4. Figure 2 presents the transition framework, linking current constraints to covenant-based pathways and the target state aligned with adequacy and PCC obligations, while Figure 3 summarizes the pipeline from scenario inputs through Monte Carlo synthesis, adequacy/PCC screens and cost normalization for decision metrics.
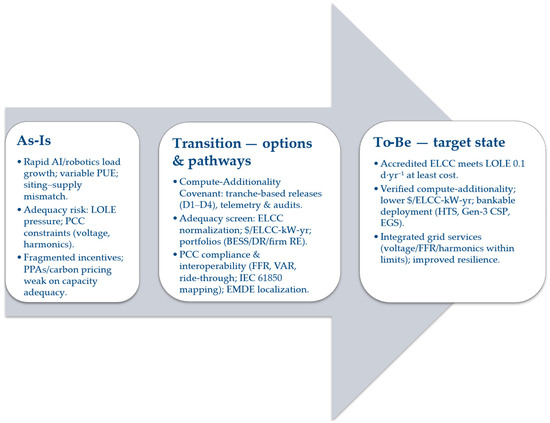
Figure 2.
Transition framework linking current constraints to covenant-based pathways and the target state, aligned with adequacy and PCC obligations.
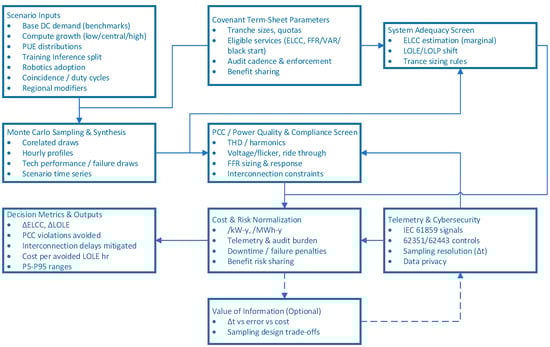
Figure 3.
Methods flowchart for the compute-additionality evaluation.
2.1. Demand Model: Compute vs. Robotics, Training vs. Inference, and PUE
2.1.1. Structure and State Variables
The total digital electricity is decomposed into (i) data-center compute, which is split into training and inference, parameterized by a time-varying mix ϕt ϵ [0, 1] (share of training in total compute energy at year t) and (ii) robotics (industrial arms—I, AMR/AGV—M, humanoids—H). The model enforces a common 2024 baseline, back-solved from a 2030 anchor (IEA total) [8], ensuring visual and analytic consistency across deterministic and probabilistic views.
Computation of baseline and trajectories
Eanchor,2030 denotes the IEA 2030 total. The 2024 baseline is as follows:
Deterministic low/central/high paths apply constant CAGRs glow, gcentral, ghigh:
Training vs. inference split
The annual compute energy is split by ϕt
Hourly load shapes and map energy to power, allowing distinct coincidence factors (e.g., training more schedulable, inference more demand-coupled). These profiles feed adequacy and PCC analyses.
Power Usage Effectiveness (PUE)
Site energy is adjusted using a PUE random variable centered on best-practice operations:
with PUEi calculated using a triangular distribution over [puemin, puemax] with mode puemode.
2.1.2. Robotics Energy
Installed units for each class k ϵ {I,M,H} follow a logistic function:
and annual energy (TWh/year) is as follows:
Central (deterministic) pair with uncertainty ranges in Section 2.4. The adoption baselines are calibrated to public industrial/AMR statistics and laboratory-reported power envelopes for humanoids. See Supplementary Note S2 for more details. Unless stated otherwise, all electricity quantities are reported as AC site energy at the facility boundary. Data-center totals, therefore, include PUE (cooling/auxiliaries), while robotics totals refer to AC energy at the charger and include conversion/charging overheads (device-side DC loads are not reported).
2.2. Resource-Adequacy Pathway: ELCC/LOLE
2.2.1. Reliability Target and Metrics
A planning reliability target of LOLE = 0.1 day/year (“1 in 10” criterion) is adopted [31].
2.2.2. ELCC Calculation
The effective load-carrying capability (ELCC) of a portfolio, R, is the horizontal shift in demand at the reliability target after adding R:
Incremental ELCC is calculated for (i) covenant-backed firm-clean capacity (e.g., CSP + TES, storage, geothermal) and (ii) accredited demand-side flexibility (FFR, ride-through curtailment windows), bundled with compute interconnections. ELCC is estimated using a probabilistic stack (sequential Monte Carlo for weather/outages) [32].
2.3. PCC Services and Compliance
2.3.1. Targeted Services and Minimum Performance
Obligated services at the point of common coupling (PCC) are specified, against standards and grid-code products:
- Fast frequency response (FFR): sub-second to 10 s response envelopes. These are mapped to existing procurement products (e.g., dynamic containment/regulation/moderation) to define set-points, deadbands and durations for data-center-sited inverters/BESS or controllable UPS [33].
- Voltage/VAR support and harmonics: steady-state voltage quality per EN 50160. Harmonic current/voltage limits at the PCC per IEEE 519-2022. Reactive capability must be demonstrated across operating ranges.
- Ride-through and immunity to dips: compliance demonstrated by IEC 61000-4-34 class tests (≥16 A per phase equipment), including 2025 Amendment 2 updates.
2.3.2. Telemetry, Cyber, and Data Formats
- Telemetry and semantics: IEC 61850 logical nodes and MMS/GOOSE/sampled values for event-speed signaling. Sub-second data are retained for FFR verification, with 1 s to 10 s aggregation for settlement [34].
- Cybersecurity: defense-in-depth per ISA/IEC 62443 across zones/conduits. Protocol-level security aligned with IEC 62351 [35] (esp. parts 5–6 for legacy telecontrol and 61850 security).
- Measurement class: power-quality measurements consistent with IEC 61000-4-30 Class A [36] and IEEE 1159-2019 [37] for monitoring practice and PQDIF exchange, where applicable.
2.3.3. Verification and M&V
Performance claims (e.g., delivered FFR MW, kvar at power-factor set-points, harmonic compliance) are audited via:
- Sampling plans and event tests (scheduled dispatch and disturbance-triggered).
- Measurement chain documented with Class-A requirements.
- Settlement baselines consistent with IPMVP Core Concepts/FEMP M&V guidance (uncertainty and regression-based adjustments for conditions).
Detailed test procedures, planning/compatibility thresholds, and IEC 61850/IEEE C37.118 [38] telemetry mappings for all PCC criteria are consolidated in Appendix A.
2.4. Uncertainty Approach
2.4.1. Parameter Priors and Draws
Uncertain inputs are represented with transparent priors:
- Compute: Triangular distribution is utilized.
and
- Training share: φt evolves via a bounded random walk towards φ∞, with annual step in boundaries [0, 1].
- Robotics: for each k ϵ {I,M,H}, fleet scale sk, active power , active hours hk are based on a triangular distribution. Adoptions Nk(t) follow the logistic central path with optional stochastic Kk, rk, t0.k sensitivities.
- Adequacy: weather-year resampling, unit FORs, and correlated renewable availability; storage round-trip efficiency and duration as scenario parameters.
Triangular inverse transform was used in MS Excel for a draw U~U(0,1) with (a, b, c) = (min, mode, max):
2.4.2. Correlations and Propagation
Rank–correlation coupling is allowed between: (i) compute growth g and PUE improvement (negative correlation), (ii) training share ϕt and FFR headroom (positive) and (iii) humanoid fleet size and hours hH (positive). Each Monte Carlo trial combines demand, robotics, and adequacy states to form an hourly net load and resource availabilities. Risk metrics are computed per trial.
2.4.3. Reporting and Visualization
For each year, t, the empirical uncertainty band is calculated:
Check Supplementary Note S3 for more information.
2.5. Value-of-Information (VoI) for Telemetry Resolution
Telemetry resolution is evaluated as a design variable, using a value-of-information (VoI) lens. Let Δt denote the sampling granularity (e.g., sub-second vs. 1 s). For a given covenant tranche, the decision loss L(Δt) aggregates (i) enforcement misclassification costs, i.e., undetected non-compliance or false fails on PCC/FFR tests that distort ELCC crediting and curtailment decisions and (ii) system-model error propagated into adequacy metrics (ΔLOLE, ΔELCC). The incremental cost of tighter telemetry C(Δt) includes metering/communications CAPEX, OPEX for storage and audit, together with cybersecurity/privacy overhead.
The expected value of moving from Δt1 to Δt2 is defined as the following:
A positive VoI justifies higher-resolution telemetry. Otherwise, coarser sampling is preferred. Practically, Δt is mapped to detection performance (ROC curves) for events of interest (e.g., fast-frequency-response windows, voltage excursions, harmonics estimation), and the avoided penalties, avoided wrongful credits/curtailments, together with reductions in interconnection delays that are attributable to faster, lower-error compliance testing, are monetized. Finally, this creates a stage-gate for telemetry design: the covenant specifies a baseline Δt and permits an upgrade whenever VoI > 0, under local cost and risk parameters, in order to ensure transparent, auditable decisions. This approach treatment follows decision analytic VoI [39] and adapts sensor-selection results in graphical models (Krause and Guestrin) [40] to grid telemetry, consistent with information-theoretic approaches to PMU design in power systems [41].
3. Scenarios and a Probabilistic Electricity-Demand Envelope for AI Compute and Robotics
The concept behind this section is to formalize the envelope of plausible electricity demand that is attributable to AI-intensive digital infrastructure, together with emerging robotic systems over 2024–2035. Section 2 details the model construction and the outcomes are synthesized here, in order to delineate credible lower-to-upper bounds (P10–P90) that are decision-useful for resource adequacy, capacity expansion planning and power-system risk management. The envelope is built by coupling (i) a compute-centric demand model anchored to an externally benchmarked 2030 waypoint and parameterized by compounded growth and data-center efficiency (PUE), with (ii) a robotics load model spanning industrial arms, autonomous mobile robots (AMRs) and early humanoids, via adoption and duty-cycle dynamics. Together, these components define an integrated AI–automation demand surface.
Two principles govern this interpretation. First is power versus energy. Annual electricity is reported (TWh yr−1), while intra-annual load shapes (peaks, ramps) that further condition system impacts are treated implicitly through PUE and duty-cycle assumptions. Second, irreducible growth is addressed. Even under conservative parameter draws for growth and utilization, the lower bound rises materially above today’s aggregate, implying that the net effect of AI deployment is to increase electricity consumption under any credible scenario. Efficiency gains shift trajectories but do not reverse the sign of change.
The compute module compounds a baseline demand with a triangular growth draw, together with a PUE draw (triangular 1.1–1.3, mode 1.2), anchored in 2030 to a sectoral electricity waypoint used in the Methods Section to ensure external consistency (anchor: 945 TWh for data-center electricity in 2030), while preserving uncertainty around the pathway to and beyond that point. Robotics loads are computed bottom-up from fleet-size trajectories (logistic adoption for industrial arms and humanoids; empirically grounded growth for AMRs) and duty-cycle × power draws, with Monte Carlo variation in scale, active power, hours and charging/overheads. Parameter sets for adoption plateaus and slopes, as well as duty cycles by class, are provided in Section 2 and in Supplementary Notes S2 and S3.
The results indicate that robotics adds a persistent and growing “edge-AI” load, which is non-trivial in absolute terms, and strategically important due to its spatial distribution (factories, logistics hubs and, later, commercial/residential environments). In the central path, aggregate robotics electricity rises from ≈19.3 TWh in 2024 to ≈33.0 TWh in 2030 and ≈43.5 TWh in 2035. The envelope broadens over time: P10–P90 spans ≈28.7–54.4 TWh in 2030 and ≈38.2–71.6 TWh in 2035. The composition is dominated by industrial arms; AMRs contribute a rising share, whereas humanoids remain de minimis through 2030 under conservative utilization assumptions. These values reflect realistic duty cycles, together with charging losses. As a result, they remain robust to plausible efficiency improvements in actuators, power electronics and path-planning, as seen in Figure 4. Projections beyond 2035 are characterized by high speculation. As such, and in order not to influence the 2024–2035 envelope, Appendix B “Robotics Beyond 2035” documents a non-normative boundary case, compiling public projections, together with order-of-magnitude energy accounting, to provide a more holistic view of how things could evolve in the future.
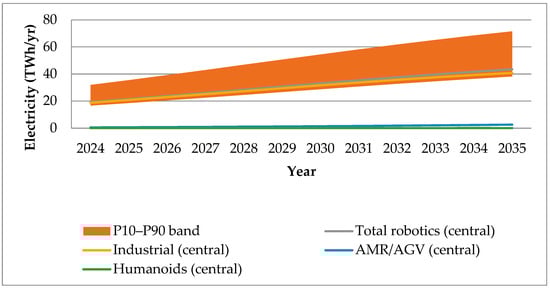
Figure 4.
Projected robotics electricity demand by class (central with P10–P90 band), 2024–2035 (robotics totals are AC at charger and include conversion/charging overheads) (check Supplementary Note S2).
Robotics are integrated with compute, the total AI-intensive digital electricity demand expands across all percentiles of the distribution:
- 2024 baseline (central): ≈428 TWh (≈409 TWh compute + ≈19 TWh robotics).
- 2030: central ≈978 TWh; P10–P90 ≈873–1327 TWh—i.e., ~2.0× (P10) to ~3.1× (P90) the
- 2024 baseline, with the anchor respected.
- 2035: central ≈1944 TWh; P10–P90 ≈1569–3407 TWh—i.e., ~3.7× to ~8.0× 2024.
Two features are noticeable. First, the lower bound is monotone increasing. Even the P10 draw approximately doubles the 2024 demand by 2030, and nearly quadruples it by 2035, given conservative utilization and efficiency assumptions. Second, the distribution is right-skewed. The tail risk reflects correlated high adoption with slower-than-assumed PUE improvements (or rising auxiliary loads such as cooling for high rack-power densities), thereby raising the upper-percentile outcomes, as presented in Figure 5.
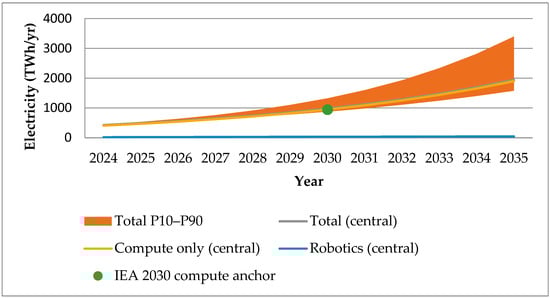
Figure 5.
Projected robotics electricity demand by class (central with P10–P90 band), 2024–2035 (AC site, compute includes PUE, robotics totals are AC at charger and include conversion/charging overheads) (check Supplementary Note S3).
The conclusion that AI increases electricity demand does not rely on a single assumption, but it follows from the joint structure of the system:
- Scale effects dominate efficiency effects. Even with optimistic PUE improvements, service demand (compute tokens, model training runs, inference call-volumes and embodied AI in robots) scales faster than unit-energy intensity declines, and a canonical rebound/Jevons dynamic in digital services is reinforced by rapid model-capability gains.
- Robotics and “AI at the edge” externalize energy use from data centers to millions of devices with non-coincident duty cycles and heterogeneous charging/overheads, creating an additive load floor that is largely orthogonal to hyperscale efficiency measures.
- The 2030 compute anchor ensures that the central trajectory is calibrated to sectoral benchmarks. Monte Carlo draws perturb the pathway and not the direction of travel. As a result, every credible percentile rises, relative to 2024.
Finally, from a power-system perspective, the envelope implies the following:
- Capacity expansion: accelerated clean generation with firming resources, to meet a materially higher electricity budget by the early-to-mid 2030s;
- Grid-aware siting: co-location of compute with low-marginal-cost, low-carbon supply, grid-constrained nodes and thermal-host opportunities to valorize waste heat;
- Flexibility and demand response: exploiting schedulable AI workloads (training, batch inference) and robotic duty-cycle buffers to provide contingent curtailment and ancillary services;
- Standards and disclosure: mandatory reporting of PUE-like metrics and robotics energy intensity per task-hour, in order to reduce informational asymmetry and to enable procurement, which prices externalities.
4. The AI-Driven Breakthrough Paradigm
While artificial intelligence is altering current operational practices in the power sector, at the same time, it is impacting the research and commercialization pathways of new energy technologies. These two interrelating dimensions can be the foundation of a real disruption in the evolution of the power sector. In this paper, “breakthrough paradigm” is used to denote the coupling of (i) AI-enabled closed-loop discovery (self-driving labs, active learning, Bayesian optimization) with (ii) bankable diffusion into grids via interface standards and service accreditation. The path towards artificial general intelligence (AGI) and the prospect of artificial superintelligence (ASI) are considered as catalysts for research and development in low-TRL domains, where experimental iteration, material exploration and control-system tuning have historically been time-consuming. It has been argued that recent progress in large language models (LLMs) and multi-agent architecture signal systems has allowed them to be capable of a broad range of cognitive tasks at near-human level, with non-trivial reasoning and pattern recognition already demonstrated [42]. The current paradigm follows distinct steps. Initially, new technologies (e.g., computation, materials, control, etc.) are conceived in laboratories, and as these technologies mature through successive iterations, they climb the TRL scale before real-world pilots are deployed, and eventually, these technologies are commercialized. This paper’s contribution focuses on making those steps auditable by specifying guardrails, telemetry and procurement triggers that link accelerated R&D to grid-operational value.
4.1. Approaching AGI and the Prospect of ASI
Considering AGI as an accelerator, it is recognized that the convergence of compute, data availability and refined algorithms has enabled automated generation of hypotheses, high-throughput simulation and optimization across large design spaces. The consequence is that candidate materials, converter topologies and plant configurations can be screened in orders of magnitude faster than traditional workflows, and that digital-twin environments can be kept in line with experimental campaigns, so that uncertainty is reduced in each cycle [42]. In low-TRL areas, iteration has been constrained by the time constants of fabrication, instrumentation and diagnostic feedback. Under an AGI-assisted reality, multi-physics surrogate models and inverse-design kernels coupled with lab automation (“self-driving labs”) tune process parameters continuously, with objective functions that embed manufacturability, reliability and interface compatibility, rather than single-metric efficiency [43,44,45]. It has further been suggested that, as AGI systems mature, recursive self-improvement could be induced, thereby opening a path toward ASI capacities that would compress development timelines considerably. Such a trajectory would mobilize discovery at rates that are incompatible with conventional standards of verification [46].
Moving beyond AGI to ASI, the implications need to be treated cautiously, since acceleration without appropriate governance would externalize the risk to critical infrastructure. It becomes a necessity to ensure that risk management and assurance (safety envelopes, data provenance, model-risk controls, auditability) are built into research platforms from inception (NIST AI RMF 1.0 (2023) [43], EU AI Act). Furthermore, measurement and verification are specified for learned controllers before field exposure, and cyber-physical interfaces are hardened so that failure modes induced by distribution shifts or adversarial inputs are contained (e.g., IEC 62443-2-4:2023 for IACS security; NERC guidelines for inverter-based resource performance [10]) [42,46]. In practice, this means that learned policies, e.g., grid control, electrolyzer dispatch or inverter droop, are coupled with supervisory logic, rollback mechanisms are provided during commissioning and telemetry with sufficient temporal granularity is streamed for post-event analysis. When controllers are destined for grid-connected assets, early prototypes should target grid-code-adjacent performance envelopes aligned with IEEE 1547-2018 (DER interconnection) [47], IEEE 2800-2022 (transmission-level IBR interconnection) [48] and ENTSO-E grid-forming guidance. The need for proper regulation of ASI is self-evident. Regulatory guardrails that can be utilized include disclosure of training boundaries, constraints on autonomous experimentation with hazardous materials, and explicit coupling of research on compute with a clean and flexible supply, so that the energy cost of discovery does not erode decarbonization goals.
4.2. Innovation Spillovers: From Lab to Grid
The historical record of innovation spillovers provides the pathway by which laboratory breakthroughs become bankable infrastructure [49]. It has been observed that materials that were first developed for aerospace and defense, such as carbon-fiber composites, advanced alloys and ceramics, were subsequently redeployed to lower mass and raise durability in wind and solar hardware, thereby extending lifetimes and trimming balance-of-system costs. Control and data architectures that optimized robotic manufacturing lines were adapted to grid operations. The same families of algorithms that aligned throughput and quality on factory floors were repurposed to balance variable renewable generation, detect anomalies on feeders and dispatch distributed energy resources so that net demand could be shaped inside network constraints [28]. In parallel, an AI-enabled experimental design, which includes high-throughput screening, active learning and Bayesian optimization, has migrated from pharma to energy materials (catalysts, solid-state electrolytes, photo-absorbers), shrinking cycle time from candidate identification to prototype validation [44,45,46].
In the past, knowledge transfer has depended on structured collaboration between research centers, equipment manufacturers, system operators and regulators. Funding instruments that require co-development across disciplines, open data repositories that lower replication barriers and pre-competitive consortia that settle on interoperable interfaces have been used to move inventions across the “valley of death” at speed [49]. Under an AGI-assisted paradigm, these mechanisms are extended. Lab protocols are formalized so that results are reproducible across facilities, metadata standards are enforced for simulation and experiment linkage and interface specifications for power electronics (e.g., grid-forming controls, fault-ride-through behavior, harmonic emission limits) are embedded in early prototypes so that later compliance with grid codes is not treated as an afterthought. It follows that demonstration plants are instrumented to expose service delivery (i.e., fast frequency response, voltage support, inertia-like behavior), so that value can be procured transparently and so that operating envelopes are known to planners. Where telemetry crosses organizational boundaries, the communications stack should align with IEC 61850 (series) (utility automation) and be protected per IEC 62443-2-4:2023 (IACS cybersecurity) [50].
Finally, the operability conditions for absorbing AGI-enabled breakthroughs into the grid are crucial. Siting, interconnection and market participation must be aligned so that technologies emerging from accelerated pipelines do not stall at the point of connection. Programs that integrate DERs with intelligent load management and the procureability of fast services (FFR/VAR/fault ride-through) provide the bridge from prototype to revenue. Policy is then required to value flexibility explicitly, to license data flows necessary for verification while protecting security and commercial sensitivities and to sequence backbone transmission, storage and secure low-carbon additions, so that the arrival of new options is matched by system-level absorptive capacity. It is therefore the case that roadmaps incorporate AGI-accelerated R&D as a contingent supply, with procurement triggers tied to demonstrated performance, rather than forward claims, and that the energy budget of discovery itself is accounted for when planning research compute.
To summarize, the breakthrough paradigm that can be brought forward by AI presents a dual narrative. On the one hand, the approach to AGI and the possibility of a step toward ASI offers to compress development cycles for low-TRL energy technologies through automated hypothesis generation, rapid simulation and closed-loop experimentation. On the other hand, the well established logic of innovation spillovers shows how laboratory advances become grid assets once transfer mechanisms, interface standards and economic signals are aligned. Realization requires verifiable guardrails (risk management, M&V, cybersecurity), early embedding of grid-code-consistent behavior in prototypes and service-based procurement that rewards measurable contributions to stability and adequacy. If these elements are advanced in a harmonized manner, the combined effect of the accelerated discovery and robust diffusion can be mobilized to deliver clean, reliable power at the scales demanded by a digital and electrified economy.
4.3. Coupling Mechanisms and Guardrails
To convert acceleration into system value, coupling mechanisms are required at the point where AI demand meets infrastructure. Conditional interconnection and permitting for large compute clusters should be tied to the verifiable additionality of firm-clean capacity or certified grid-service portfolios (fast-frequency response, reactive support, black-start) in the same interconnection zone. For controllers and plant-level policies, conformance should be demonstrated against the relevant interconnection standard (IEEE 1547-2018 or IEEE 2800-2022) and the evolving ENTSO-E grid-forming specifications, with staged exposure and rollback during commissioning. Open, privacy-preserving telemetry from campuses enables surrogate models and learned controllers to be evaluated against real disturbances before full exposure, ensuring that acceleration does not erode operability.
Governance must embed model-risk management and auditability for learned policies used in grid control, electrolyzer dispatch or inverter droop. Commissioning should include rollback mechanisms and post-event analysis under standardized M&V. Cyber-physical security and data governance should align with IEC 62443-2-4:2023 (IACS) and with the NIST AI RMF for model lifecycle risk controls. Within the EU, the AI Act establishes obligations for high-risk systems that will apply to grid-facing AI controls. In practice, these guardrails convert AGI-assisted discovery into bankable assets by aligning accelerated prototypes with grid-code compliance and procurement pathways from the outset.
5. Technology Portfolio for Scaling Clean, Reliable Power: Status, Integration and System Value
The transition from paradigm to praxis is investigated by examining specific technology families through a common evaluative lens that prioritizes the system value over headline efficiency. In detail, the aspects considered are as follows:
- Grid services and temporal value. These include dispatchability, ramping capability and grid-forming behavior under contingencies.
- Scalability and manufacturability. This includes supply chain depth, siting constraints and deployable modularity at standard voltages and footprints.
- Technology readiness and credible cost trajectories. This aspect is anchored in demonstrated milestones, learning rates and bankable delivery risk, rather than speculative performance.
- Integration complexity at the power-electronics and controls interface. This includes protection coordination, harmonic emissions, fault-ride-through settings and interoperability, with state estimation and market dispatch.
- Governance, measurement and verification, and risk.
The technologies investigated in the next sections are organized into three major categories:
- Generation and storage.
- Direct conversion.
- Transmission and system infrastructure.
The concept behind this section is to move from paradigm to praxis by stress-testing technology families against a system-value rubric which prioritizes accredited adequacy (ELCC), deliverable PCC-level services and integration risk over headline efficiency. Within generation and storage, CSP + TES and EGS/CPG equipped with supercritical CO2 cycles are evaluated for multi-hour dispatchability, fast ramping capability and bankable learning trajectories. At the same time, high-yield yet variable options (perovskite–Si tandems, high-altitude wind) are assessed for energy contribution and grid-forming behavior, noting that ELCC is a function of storage, hybridization and siting. In direct conversion, photoelectrochemical pathways are treated as solar-to-molecule routes, which can decouple electricity and fuel balancing while introducing distinct balance-of-plant and M&V considerations. Afterwards, within transmission and system infrastructure, HTS corridors are examined for urban hosting-capacity relief and power-quality gains, alongside cryogenic availability and protection-coordination challenges. Finally, frontier options (e.g., fusion, space-based PV) are tracked as a long-dated option value rather than near-term adequacy. In order to ensure transparency, detailed appraisals covering indicative ELCC/FFR/VAR attributes, manufacturability and cost trajectories, PCC integration complexity (harmonics, ride-through, interoperability) and governance/M&V risks, are presented in Appendix C.
6. Policy, Economic and Grid Implications
Innovative technologies, such as high-temperature superconducting (HTS) transmission systems, introduce a new class of options for energy supply and delivery, promising to relax structural constraints that have traditionally governed generation, transport and end-use. At the same time, their effective deployment has to rely on a policy and regulatory framework that recognizes the specific risks of low technology readiness level (TRL) solutions and, accordingly, provides the required economic signals and institutional support for early uptake. Concepts at very low TRL are scoped, as the research tracks with clear decision gates. For options already demonstrated at distribution or transmission voltages (e.g., 10 kV/40 MVA HTS with series SFCL in Essen [51]), certification pathways, service accreditation and market access are specified.
Figure 6 presents the integration logic. An AI-driven demand shock is translated, via a compute-additionality covenant, into interconnection and capacity-tranche levers, technology gates and PCC-level services and auditable outcomes aligned with ELCC and IEC/IEEE standards. The concept behind the covenant is to map a set of inputs into a set of mechanisms. The inputs are compute capacity (MW), PUE/duty-cycle assumptions, the zone’s ELCC quota (α) and PCC obligations (FFR coefficient, minimum power factor) and the telemetry/audit cadence. These inputs are mapped, namely, to tranche-gated interconnection, together with cost-/benefit sharing, to the delivery of PCC services (fast-frequency response, dynamic VAR/voltage support, ride-through) through technology gates, and to verification/governance aligned with IEEE 519, EN 50160, IEC 61000-4-34, IEC 61850 and IEC 62443 with IPMVP-consistent M&V. Finally, the mapping yields auditable outputs in the form of ΔELCC and LOLE status, relative to the 0.1 day·yr−1 planning criterion, PCC-compliance rates, normalized costs ($/ELCC-kW-yr; $/compute-kW-yr) and tranche releases. Finally, Figure 7 presents a visual map summarizing inputs (compute MW, α, PCC thresholds, telemetry cadence), mechanisms (tranche-gated interconnection; technology gates; governance via IEEE/IEC/ISA with IPMVP M&V), and outputs (ΔELCC/LOLE vs. 0.1 day·yr−1; PCC compliance; normalized cost per ELCC-kW and compute-kW; tranche releases).
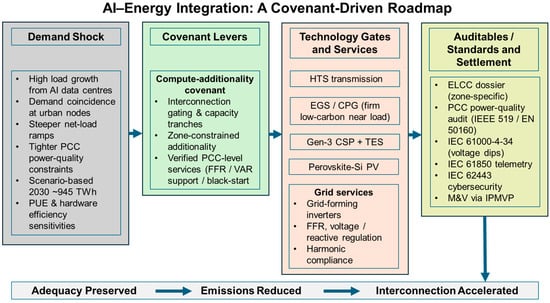
Figure 6.
Covenant-driven roadmap from AI/data-center demand to auditable system value.
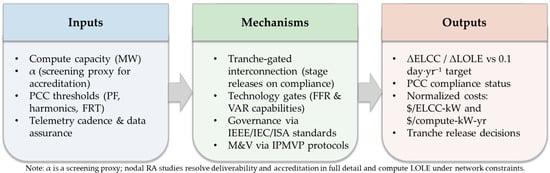
Figure 7.
Causal map: Inputs → Mechanisms → Outputs.
6.1. Investment and Regulatory Frameworks
The introduction of low-TRL energy systems necessitates substantial, multi-year investments that bridge laboratory proof-of-concept to commercial demonstration, since component reliability, manufacturability and field performance are still evolving; therefore, public authorities and private actors ought to co-design instruments that de-risk capital allocation and, in parallel, accelerate learning. Public–private partnerships (PPPs) have repeatedly proven to be effective vehicles for this purpose, as they apportion risk across entities with complementary mandates and the cost of capital structures, while keeping an innovation pipeline aligned with explicit performance targets. Afterwards, and in order to transform pilot outcomes into bankable assets, contingent support—through milestone-based grants, innovation tax credits and government-backed concessional loans—has to be combined with access to standardized power purchase agreements and long-tenor offtake contracts that stabilize revenue streams during the fragile early years of deployment. Where assets deliver services (FFR, VAR, black-start) in addition to energy, contracts should pay for verified service delivery under recognized M&V frameworks (e.g., IPMVP Core Concepts 2022 (EVO 10000-1:2022)) and publish service-quality telemetry to reduce verification costs over time.
Regulation, which was predominantly optimized around conventional assets, needs to evolve to reflect the operational particularities of novel options, such as HTS systems that operate under cryogenic regimes with distinct safety and maintenance requirements [52]. For HTS corridors, certification should explicitly cover cryostat integrity, quench detection/limiting logic, protection selectivity with superconducting fault-current limiters (SFCLs), electromagnetic compatibility at the point of common coupling, and cyber-secure controls (e.g., IEC 61850 (series), ISA/IEC 62443 (series)). It is therefore essential to update siting, interconnection and grid-code provisions so that technology-specific criteria are explicitly recognized. Queue-management reforms (e.g., such as the cluster studies and readiness screens under FERC Order No. 2023) should be mirrored in TSO/DSO practice to bring accelerated pilots to connection without displacing mature projects [17,18]. Clear certification pathways which cover materials characterization, cryostat integrity, quench protection, electromagnetic compatibility and cyber-secure control interfaces, will improve considerably investor and insurer confidence and, at the same time, reduce transaction costs for project developers. Finally, regulatory sandboxes can be used as controlled environments where performance, reliability and market interactions are observed under real operating conditions before full codification, while tariff structures are adjusted to reflect the system-level value (loss reductions, stability support, resilience) of these disruptive assets (e.g., Ofgem’s Energy Regulation Sandbox) [53].
6.2. Integrating Disruptive Innovations into Existing Energy Systems
When inserting breakthrough technologies into meshed grids that were engineered for conventional thermal generation and resistive lines, system operators have to prioritize resilience, cybersecurity and operational adaptability. HTS cables, by virtue of near-lossless transmission and high current densities, can relieve corridor congestion in dense urban settings. However, cryogenic balance-of-plant transients, quench behavior and protection coordination with SFCLs must be integrated into protection schemes and operational planning so that dynamic load sharing is maintained over a broad envelope of contingencies [52]. A disciplined KPI set for pilots should include mean time between cryo maintenance, quench detection-to-isolation time, planned/unplanned downtime, and corridor ampacity vs. XLPE for a fixed right-of-way. At the same time, supervisory control and data acquisition (SCADA) layers and energy management systems (EMS) should incorporate state estimators and model-based diagnostics that account for cryogenic transients, ensuring that preventative maintenance can be scheduled without jeopardizing network security. Where telemetry spans asset owners and system operators, the communications stack should align with IEC 61850 (series) for utility automation, and be protected as per the IEC 62443-2-4:2023 for IACS cybersecurity.
For space-based photovoltaics (SBPVs), recent in-orbit demonstrations (Caltech SSPD-1, 2023–2024) have validated key subsystems, including wireless power transfer in space and a detectable beam to Earth, placing SBPVs on a transparent research track with measurable milestones, rather than in speculative territory [54]. If matured, SBPVs would present non-synchronous injections with distinctive siting, spectrum allocation and safety considerations. The space elevator concept, if paired with orbital solar arrays and high-capacity power transfer mechanisms, introduces intermittent but potentially very large injections at designated nodes. Grid architectures will thus have to accommodate variable, non-synchronous inflows, whose temporal profiles differ from terrestrial wind and solar. Early grid-integration studies should therefore focus on interconnection standards for non-traditional sources, beam availability statistics, and interaction with demand-side electro-intensive assets (e.g., electrolyzers) to absorb surplus. Demand-side management (DSM) schemes, spanning flexible industrial loads, electro-thermal storage and hydrogen production have to be co-optimized with these supply side innovations, so that spillage is minimized and ancillary services are procured in a cost-effective manner.
From an economic perspective, the appraisal cannot be restricted to initial capital outlays; rather, it has to internalize long-run benefits arising from reduced electrical losses, an improved security of supply, deferred network reinforcements and lower greenhouse gas emissions. Cost–benefit analysis (CBA) should explicitly value stacked revenues from ancillary services, incorporate reliability metrics (ELCC for capacity accreditation) and run sensitivity bands for manufacturing yield, O&M, and interconnection lead-times documented in current queue analyses. Cost–benefit analysis therefore must include externalities such as environmental impact, air-quality co-benefits and distributional effects on vulnerable consumers, while sensitivity testing captures the uncertainty envelopes that are inherent in low-TRL trajectories. Finally, policy decisions should be informed by multi-criteria assessments that weigh technical perquisites, financial risk, institutional readiness and societal acceptance, since only coherent integration with existing infrastructures will deliver a resilient, sustainable energy future.
6.3. Coupling Compute Growth to System Value
A compute-additionality covenant has to be adopted, whereby interconnection capacity for data centers is released in tranches at the zone level (T–D interface/grid-supply point) and phased with either of the following:
- Verified delivery of local services (FFR, VAR, black-start) meeting PCC-level power-quality standards (IEEE 519-2022; EN 50160:2022; IEC 61000-4-34:2005+ A1:2009+ A2:2025);
- Contracted firm-clean MW entering service in the same zone, with accredited ELCC.
Procurement ought to pay for delivered services such as FFR, VAR and black-start from data centers and proximate pilots, not energy alone, so incentives match operator needs and learning accelerates where the system is most stressed.
Interconnection process reforms (cluster studies, readiness screens, alternative transmission evaluations) should be leveraged to couple data centers’ build-out to grid-enhancing investments (advanced conductors, DLR, topology optimization). M&V should follow IPMVP-consistent methods, with open, privacy-preserving telemetry (IEC 61850 (series) models), cyber-secured per IEC 62443 (series) and standardized reporting to enable controller validation and post-event diagnostics. Regulatory sandboxes at candidate nodes should license data flows for verification, codify telemetry formats and standardize M&V for accelerated pilots (EGS, HTS, CSP + TES, perovskites), keeping acceleration, interconnection and market participation on a single auditable track and turning the paradox into an investable program (with queue data transparency and performance-based triggers for tranche releases).
Operationalizing the compute-additionality covenant in sub-Saharan Africa (SSA) has to pair interconnection tranche releases with a financing stack that lowers the cost of capital and ring-fences currency risk. At the same time, sequencing ought to align disbursements with verifiable service delivery so that near-term stress finances durable assets. Recent analysis indicates that, by 2030, Africa’s energy investment must double to >USD 200 billion per year, with ~USD 25 billion per year for access alone [55]. Practical instruments to close bankability gaps at the grid supply (GS) node include IDA/IFC standardized documentation and partial-risk guarantees proven under scaling solar [56], MIGA political risk and currency inconvertibility cover [57], and local currency hedging, which includes long tenor, inflation-linked swaps, through TCX [58]. For early-stage de-risking and preparation, AfDB’s SEFA, the Alliance for Green Infrastructure in Africa (AGIA) and Mission 300 by World Bank and AfDB can supply concessional/blended capital and wraps to move clean-firm and flexibility assets (e.g., EGS; CSP + TES) to bankability [59,60]. Under the covenant, tranche-release conditions should bind data center clusters to (i) verified PCC-level service delivery (e.g., FFR/VAR/black-start via standardized M&V) and (ii) ELCC-accredited clean-firm MW in the same zone; a defined share of proceeds should be earmarked for distribution upgrades and last-mile connections in surrounding communities to advance SDG7.
To ensure durability and local value capture, localization must be sequenced toward capabilities with high employment elasticity and low cost-uplift risk while prioritizing O&M training, testing/commissioning and spares/assembly before heavy-manufacturing mandates. Peer-reviewed evidence from South Africa’s REIPPPP and cross-country comparisons shows that rigid local content rules can raise project costs without securing durable supply chains [61,62]. Accordingly, the covenant should condition localization on credible vendor plans and accredited workforce programs and quality systems, and measure outcomes in uptime/service quality, rather than nominal spend. A two-node pilot template can de-risk replication:
- Designate one urban GS point and one coastal node as regulatory sandboxes;
- Finance interconnection-tied clean-firm additions with concessional tranches and MIGA/IDA wraps, overlay TCX hedges for local currency revenues and procure campus-plus-pilot services under standardized M&V;
- Publish 24 month telemetry and settlement records to establish lender-grade performance baselines;
- Reserve a defined percentage of each tranche for feeder reinforcement and mini-grid interties in adjacent underserved communities, consistent with the Mini-Grids for Half a Billion People playbook [63].
6.4. Covenant Term Sheet
In order to operationalize the “compute-additionality covenant” as a contractible, auditable mechanism, the roles and responsibilities, trance mechanics, benefit–risk sharing and a standards aligned compliance workflow are required. They are presented in the form of a term sheet.
- A. Roles and responsibilities
- A1. Compute provider (service delivery and ELCC underwriting)
- Obligation portfolio: deliver either (i) PCC-level services meeting accredited set-points (FFR, dynamic VAR/voltage regulation, harmonic limits, ride-through) or (ii) ELCC-accredited firm-clean capacity inside the same capacity/BA zone, or a hybrid that meets the zone’s reliability target.
- ELCC underwriting: commit to an (typical α = 0.6–1.0, depending on baseline LOLE and coincidence factors). Demonstrate deliverability and accreditation method (ELCC or equivalent capacity credit) recognized by the ISO/RTO/DSO.
- Telemetry and M&V: provide IEC 61850-structured telemetry at specified resolutions. Maintain settlement-grade records. Enable audit sampling and event replays.
- Curtailment and remediation: Accept automated curtailment rights (see also D3) if out of compliance. fund remediation per the clause below.
- A2. ISO/TSO/DSO (accreditation, tranche governance)
- Accreditation: define resource accreditation tests (ELCC/FFR/VAR/ride-through) and approve covenant-eligible resources; publish methods and seasonal updates.
- Tranche governance: administer tranche release (capacity blocks) upon verified compliance, manage queue priority and readiness screens and execute claw-backs for non-performance.
- System data: provide locational hosting capacity, short-circuit levels and PQ envelopes to parameterize obligations.
- A3. Regulator (tariff, sandbox oversight)
- Tariffing: approve cost-reflective tariffs for protection upgrades/hosting capacity enhancements and a covenant surcharge/credit reflecting delivered services and ELCC.
- Sandbox: authorize regulatory sandboxes (time-bounded, with exit criteria) to pilot telemetry and accreditation innovations. Require periodic public reporting.
- A4. Community (planning participation, impact benefits)
- Participation: formal role in siting consultations. Right to review non-sensitive performance summaries and local upgrade plans.
- Benefit pathways: eligibility for last-mile connections, distribution upgrades, workforce programs and DER enablement, funded via the benefit-sharing clause.
- B. Tranche mechanics
- B1. Tranche size and staging
- Block size: e.g., 25–50 MW per tranche (HV/MV dependent). Initial tranche is limited (e.g., 25 MW) in weak grids.
- Staging: T0_00 “provisional energization” ≤25 MW for on-site commissioning. Subsequent tranches are contingent on verified performance.
- B2. Release triggers (any one or hybrid)
- PCC-services path: demonstrate, over a rolling 90 day window, ≥X MW FFR within Y s, dynamic VAR capability [−Q, +Q] across load range, THD within IEEE 519-2022 limits and ride-through per IEC 61000-4-34 A2. Pass n disturbance/event tests.
- ELCC path: Procure/underwrite Z MW ELCC-accredited firm-clean capacity in-zone sufficient to hold LOLE constant. Submit the ISO’s ELCC letter.
- Hybrid: Weighted combination achieving the same LOLE target.
- B3. Audit cadence
- Settlement: monthly
- Conformance audit: quarterly
- Annual re-accreditation: full test suite.
- Data retention: raw sub-second buffers ≥30 days; 1 s aggregates ≥24 months (see C2).
- B4. Remediation and claw-back
- Cure period: 30–60 days after first material breach. During cure, tranche cap reduced to last verified level.
- Financials: performance bond or LC sized to 90 day replacement cost of obligations. Forfeiture funds immediate substitute resources.
- Claw-back: sustained non-performance (>2 consecutive audits) triggers tranche revocation and queue reversion.
- C. Benefit–risk sharing clause
- C1. Earmarked upgrades
- Allocation: 10–20% of the covenant-related interconnection proceeds (or an equivalent recurring contribution) earmarked for distribution upgrades and last-mile electrification within the host municipality/feeder group.
- Prioritization: projects that increase hosting capacity (e.g., advanced VVC, DLR sensors, protection upgrades) and connect unserved/underserved loads.
- C2. Transparency for bankability
- Public telemetry summaries: publish 24 month rolling settlement-grade time series at aggregated granularity (e.g., 1 min/5 min), including delivered FFR MW, kvar range, PQ compliance rates, and availability factors.
- Lender packages: provide secure data rooms with hashed IDs, audit trails, and attestations from the ISO/DSO and an independent verifier, to enable non-recourse financing of obligation portfolios.
- C3. Community impact
- Set-asides: define MW or € set-asides for community DER pilots (e.g., feederside BESS co-optimized for PQ/FFR), with M&V plans and a reporting template aligned to IPMVP/FEMP concepts.
- D. Compliance workflow (testing → approval)
- D1. Pre-connection conformance
- Design dossier: single-line diagrams, inverter/UPS settings, IEC 61850 data models (logical nodes, reports/GOOSE/SV), cybersecurity zones/conduits per ISA/IEC 62443.
- Bench tests and factory acceptance: PQ immunity (IEC 61000-4-34), harmonic filters, FFR latency; certificate pack.
- Site acceptance tests (SAT): staged energization, disturbance injections, ride-through, harmonic scan; Class-A measurement chain (IEC 61000-4-30) documented.
- D2. Provisional connection (T0 tranche)
- Provisional window: 30–90 days to accumulate evidence runs; telemetry streamed to ISO/DSO historian in IEC 61850 (MMS reports for 1 s aggregates; GOOSE/SV for sub-second events).
- Pass criteria: meet PCC specs over ≥95% of intervals; complete n commanded FFR set-point tests; no PQ violation exceeding EN 50160/IEEE 519 limits.
- D3. Full approval and ongoing monitoring
- Connection approval: release next tranche(s) per Section B.
- Sampling and audits: quarterly ISO/DSO audits; blind event replays; spot harmonic campaigns.
- Automated controls: if a material deviation is detected, ISO/DSO may curtail up to the non-compliant tranche share until a successful re-test.
- D4. Privacy-preserving telemetry
- Minimization: publish only aggregated performance metrics. Hash device IDs.
- Access control: role-based access. Cryptographic signing/time-stamping for audit logs; IEC 62351/IEC 62443 controls for transport and device security.
- Data sharing: research access via differentially private aggregates or k-anonymized datasets, governed by ethics and data-sharing agreements.
- E. Parameterization for mature vs. emerging grids
- Tranche size: mature grids 50 MW. Emerging grids 10–25 MW initial, with ramp-up contingent on PQ outcomes.
- ELCC ratio α: mature 0.6–0.8. Emerging 0.8–1.0 (until LOLE stabilizes).
- Audit cadence: mature quarterly. Emerging bi-monthly in first year.
- Benefit earmark: mature 10–15%. Emerging 15–20% with explicit feeder-level upgrades and connections.
Furthermore, covenant schedules (term, tranche calendar, cure periods), definitions (e.g., how FFR MW are measured) and appendices (telemetry schema, test scripts) should be annexed to the PPA/interconnection agreement to ensure contract enforceability and consistent accreditation by the system operator.
Finally, in order to parameterize tranche pricing and the covenant’s risk screen, within-technology cost–risk bands for four enabling options—CSP + TES (Gen3), EGS/CPG with scCO2 cycles, HTS urban backbones (cables + SFCL), and perovskite–Si tandem PV (2T/4T)—are compiled based on recent public benchmarks (See Appendix D, Figure A1, Figure A2, Figure A3 and Figure A4). These bands serve as priors for sensitivity tests and stage-gate thresholds and are not intended for cross-technology magnitude comparisons.
6.5. Case Studies
6.5.1. Purpose and Scope
The concept behind this section is to operationalize the proposed compute-additionality covenant through two illustrative, non-site-specific examples: namely, a mature market and an emerging sub-Saharan Africa (SSA) context. In both cases, the same screening logic is applied, i.e., PCC-level service obligations together with an ELCC-anchored adequacy quota, under transparent parameters drawn from the literature. Full equations, parameterization and reproducible spreadsheets are provided in Supplementary Note S4 and in the accompanying workbook. The aim is not to optimize a particular site, but to demonstrate how a covenant can be parameterized, audited and stress-tested for adequacy and power-quality outcomes within realistic policy bands.
6.5.2. Mature Market Case Study
A 200 MW compute campus is examined, connected to a mature grid operating with a PF floor of 0.98, an FFR obligation equal to 0.15 MW per MW of compute and an adequacy quota of α = 0.7 (policy band 0.6–0.8). The design couples a 230 MW/4 h BESS with 35 MW geothermal; standard CRFs and FOM are used, while an ancillary adder reflects PCC-level FFR/VAR enablement. Results indicate that adequacy passes at the central α and that service obligations are fulfilled with linear, auditable sizing, referenced to compute demand. Derived costs are reported per compute kW-yr and per ELCC-kW-yr. The inputs are presented in Table 2 and the results in Table 3.
Table 2.
Inputs.
Table 3.
Results for a mature economy.
See Supplementary Note S4 (Table S3) for a consolidated summary of FFR/VAR delivery, ELCC targets/actuals, ΔELCC, normalized costs, and LOLE adequacy for both scenarios.
6.5.3. Emerging Markets and Developing Economies (EMDEs) Case Study
A 25 MW compute campus is considered in EMDE context under the same PCC obligations and with α = 0.9 (policy band 0.8–1.0). The configuration employs a 30 MW/4 h BESS, together with 6 MW of demand response (DR); BESS financing reflects blended concessional terms (WACC = 6%). At the central α, the design passes adequacy with lower normalized costs than the mature case, while the PCC obligations remain transparent and enforceable. Sensitivity to higher α is examined via firm-clean backfill in the supplementary workbook. The inputs are presented in Table 4 and the results in Table 5.
Table 4.
Inputs for SSA country.
Table 5.
Results for developing country.
See Supplementary Note S4 (Table S3) for a consolidated summary of FFR/VAR delivery, ELCC targets/actuals, ΔELCC, normalized costs, and LOLE adequacy for both scenarios.
6.5.4. Discussion of Case Study Results
The core mechanics of the covenant are applicable across contexts. In both cases, the PCC obligations scale linearly with compute (FFR and dynamic VAR headroom), thereby offering clear measurement points for compliance. Adequacy is governed by an ELCC quota. Under the central α, the mature system carries headroom (181 MW ELCC versus a 140 MW target), whereas the SSA baseline exactly meets its quota (22.5 MW vs. 22.5 MW). Normalized costs are lower in the SSA case (187 $/kW-yr; 208 $/ELCC-kW-yr), owing to smaller scale, the DR contribution and concessional financing. Raising the quota to α = 1.0 in SSA triggers firm-clean backfill (≈2.78 MW at κ = 0.9), increasing the compute-normalized cost to ~241 $/kW-yr while preserving adequacy by construction. Finally, the ancillary adder is modest relative to total costs, but material for PCC readiness underlines the value of auditable grid services alongside capacity accreditation. A consolidated outcomes summary is provided in Supplementary Note S4 (Table S3).
7. A Roadmap for Future Research and Commercialization
The transition from exploratory research to market-ready systems is inherently interdisciplinary and requires an explicit roadmap that aligns scientific agendas, funding instruments and staged demonstrations; at the same time, the management of uncertainty—technical, economic and regulatory—has to be embedded from the outset so that learning is codified and investment signals are preserved. Accordingly, the pathway is organized into transparent stage-gates that couple technology readiness levels (TRLs) to manufacturing readiness levels (MRLs) and to integration readiness at the grid edge (IRL): laboratory proof (TRL 3–4) → prototype in a relevant environment (TRL 5–6) with formal MRL assessments → pre-certified field pilots (TRL 7–8) with IRL metrics explicitly tied to interconnection and market participation. Funding and scale-up have to be synchronized with these gates through de-risking instruments (e.g., EU Innovation Fund, U.S. DOE Title 17/LPO and ARPA-E SCALEUP), so that tranche releases are indexed to verified performance and safety milestones, rather than forward claims, which would help towards disciplined learning and bankability. Anchoring the TRL–MRL–IRL stage-gates introduced above, Table 6 translates the portfolio into auditable checkpoints, mapping each technology’s present maturity to 2025–2030 bankability gates and 2030–2035 scaling outcomes, while specifying operator-facing services, indicative ELCC contributions, pilot KPIs, and the dominant risks that shape deployment priority.
Table 6.
What solves what, by when?
7.1. Coordinated Research Agendas and Funding Priorities
A comprehensive research agenda must span materials science, structural engineering, cryogenics, power systems and information technologies, because binding constraints in disruptive technologies often reside at the interfaces between subsystems, rather than within any single domain. Coordinated programs, structured around shared testbeds and open data policies, enable faster replication of results and reduce the probability of design dead-ends. This coordination is reinforced when funding calls specify performance metrics and field-validation milestones that are relevant to commercial use-cases. In practice, multi-institution testbeds (e.g., NREL’s ARIES) should host hardware-in-the-loop campaigns that exercise converter controls, communications stacks and cyber-physical responses under realistic disturbances before site deployment [64]. Key priorities therefore include the following:
- EGS/closed-loop geothermal: fracture-network creation, circulation stability and induced-seismicity monitoring following recent field tests;
- PV tandems: perovskite–Si durability pathways (thermal/humidity/UV) with field-relevant degradation models and bankability data;
- HTS cable systems: improved cryostat reliability, quench detection/mitigation logic, device terminations and SFCL coordination;
- EMS/DSSE: architectures that integrate AI-assisted forecasting, fault localization and secure actuation with standardized substation/data models (IEC 61850 (series));
- In general, program calls should require publishable telemetry schemas and reference controller implementations and minimum viable certification test plans to reduce downstream transaction costs.
In parallel, research on grid modernization has to advance smart-grid functionalities including phasor measurement, adaptive protection, wide-area control, and standardized cybersecurity frameworks that are capable of resisting coordinated attacks without degrading system observability. Establishing collaborative research centers and innovation hubs concentrates specialized equipment and talent (e.g., metrology labs, cryogenic facilities, high-voltage halls) and, at the same time, provides neutral fora where utilities, manufacturers and regulators converge to define test procedures and pre-certification steps. Afterwards, codified knowledge should be transferred into modular design tool chains that are accessible to planners and project developers, so that feasibility screening, siting and interconnection studies can be executed consistently across jurisdictions. Ground cyber-physical safety in EN IEC 62443 (series) [65] (with cross-references to NIST SP 800-82 Rev.3 (2023) [66]) apply EN ISO/IEC 27019:2024 [65] and EN/IEC 62351 (series) for power-system controls, and align interface profiles to IEC 61850 (series) logical nodes to ensure interoperable, auditable event records, consistent with NIS2 and the EU Network Code on Cybersecurity.
7.2. Transition Pathways and Pilot Demonstrations
Because low-TRL technologies carry legitimate doubts about scalability and field robustness, transition pathways must be organized around pilot plants and demonstrations that expose systems to real-world stresses and operational complexity. For HTS corridors, replicated urban pilots (building on Essen’s 10 kV/40 MVA AmpaCity link with integrated SFCL) should report a minimal KPI set (e.g., quench detection-to-isolation time, cryo O&M hours per km-year, failure rates of rotating equipment, and corridor ampacity vs. XLPE for a fixed right-of-way), with third-party verification. For geothermal reservoirs, staged EGS programs should progress from short duration to extended circulation with quantified injectivity/thermal drawdown. Where wireless power or space-based solar concepts are pursued, they should remain on research tracks with subsystem milestones and safety cases before any grid interconnection studies are initiated.
These pilots perform a second function: they build stakeholder confidence by converting abstract performance claims into measured outcomes that lenders, insurers and regulators can interrogate. Public–private consortia are therefore essential, since they pool resources, share risks and align the demonstration environment with realistic operating conditions; procurement should reward learning: e.g., by indexing tranche releases to verified performance metrics, so that feedback loops remain explicit and the pace of iteration is preserved. Finance should be laddered:
- Grant-funded for TRL 5–6 prototyping;
- Grant or concessional/first-of-a-kind debt via EU Innovation Fund or Title 17/LPO at TRL 7–8;
- Commercial debt/equity post-certification.
Each step has to be contingent on KPI attainment and safety sign-off. Finally, lessons from other sectors (wind, solar, geothermal) confirm that iterative testing, transparent data and early engagement with affected communities accelerate acceptance and shorten the path to bankability.
Techno-economic evaluation must accompany each stage, using deterministic and probabilistic (Monte Carlo) analyses to quantify sensitivity to capital costs, failure rates, load growth and policy parameters; environmental impact assessments should be run in parallel so that design choices internalize lifecycle burdens and do not externalize risks to ecosystems or public health. Recommendations include the following:
- ISO 14040:2006 + AMD 1:2020/ISO 14044:2006+ AMD 1:2017 + AMD 2:2020-conformant LCA for pilots and product lines [67];
- Resource-adequacy accreditation using reliability metrics (LOLE/ELCC) to score a firm contribution of flexible assets;
- Uncertainty bands reflecting the manufacturing yield, interconnection lead-times and O&M learning.
At the same time, standardization bodies should be engaged early to codify test methods and safety margins, thereby reducing future re-design cycles and avoiding stranded R&D. For grid-facing equipment, pre-normative work should be coordinated through IEC/CEN-CENELEC/IEEE/CIGRE working groups, so that emerging practices (e.g., HTS cable and SFCL testing, IEC 61850 (series) profiles) are captured in technical brochures and standards updates before mass procurement.
To summarize, an actionable roadmap to commercialization integrates coordinated research agendas with targeted funding, focused pilot demonstrations and progressive regulatory codification. If these elements are aligned—through clear metrics, risk-sharing instruments and open, verifiable learning—then disruptive energy technologies can transition from laboratories to operational grids in a manner that preserves reliability and affordability, while contributing materially to decarbonization and system resilience. Finally, by embedding uncertainty management and stakeholder engagement throughout, the pathway remains adaptable to evidence, which is the necessary condition for durable, large-scale adoption. Stage-gate rigor, secure/open telemetry, and accreditation-based procurement can turn today’s prototypes into tomorrow’s bankable, grid-integrated assets.
8. Conclusions and Future Outlook
The convergence of artificial intelligence with low technology readiness level (TRL) innovations delineates a conditionally credible pathway to satisfy the escalating energy demands of the coming decades; at the same time, it reframes system design and operation from component-by-component optimization to integrated, evidence-driven orchestration. The present paper has traversed a wide spectrum of emergent options—advanced concentrated solar power coupled with next-generation thermal storage, enhanced/closed-loop geothermal, perovskite–Si tandems, high-temperature superconducting (HTS) urban backbones, artificial photosynthesis and space-based solar power—whose joint consideration suggests that the global energy infrastructure can be reconfigured towards architectures that are sustainable, resilient and equitable, provided that deployment is guided by explicit performance metrics and staged validation with verifiable system services and capacity accreditation.
Artificial intelligence has already altered the cadence of research and the practice of operation and maintenance, since data-centric methods shorten iteration cycles, improve fault prognosis and allow real-time optimization at multiple temporal and spatial scales. When this capability is applied to low-TRL technologies—many of which were, until recently, confined to controlled laboratory settings—lead times from invention to fielded systems can be reduced, because design hypotheses are confronted early, with operational data and models updated in situ. Afterwards, as electrification and digitalization increase aggregate demand and load variability, AI-enabled forecasting, dispatch and predictive maintenance can be embedded within energy management systems (EMS) to preserve reliability while absorbing novel supply and conversion pathways, so that the combined portfolio can meet and, in specific contexts, exceed present energy service requirements with lower environmental burdens.
This transformation, however, cannot be expected to unfold in isolation from policy and finance. It has to be anchored by proactive, coordinated instruments that de-risk early deployment and translate experimental success into bankable assets. Targeted programs—such as ARPA-E in the United States and Horizon 2020 in Europe—have already demonstrated that mission-oriented calls, milestone-based grants and public–private partnerships effectively compress time-to-demonstration and crowd-in private capital by sharing technical and market risks. It follows that regulatory frameworks should codify clear certification pathways, standard interconnection prerequisites and transparent tariff rules for emergent assets, so that lenders and insurers can price risk and off-takers can commit to long-tenor contracts; such measures are expected to support the continuity of learning-by-performing across successive project cohorts.
Integrating disruptive options into existing grids remains a primary engineering challenge. High-temperature superconducting (HTS) transmission promises near-lossless transport and high current densities in constrained corridors, but it imposes cryogenic balance-of-plant, quench protection and distinctive protection coordination that system operators have to internalize (as shown in the Essen 10 kV/40 MVA HTS link with a series SFCL and associated protection studies). For space-based photovoltaics (SBPVs), recent in-orbit demonstrations (Caltech SSPD-1) validated key subsystems (wireless power transfer in space; detectable beam to Earth). SBPVs should therefore remain on a transparent research track with subsystem milestones and safety cases before any grid interconnection is contemplated. At the same time, grid architectures will have to evolve towards smart, cyber-secure platforms with wide area measurement, adaptive protection and model-based control, where AI tools support anomaly detection and corrective action under fast ramps and contingencies. Demand-side management, electro-thermal storage and hydrogen production can then be co-optimized with these supply-side innovations to minimize spillage and enhance resilience. Capacity accreditation for flexible assets should be computed via reliability metrics (ELCC/LOLE) to make contributions bankable in resource-adequacy planning and markets.
The role of interdisciplinary research is, under these conditions, decisive. A coordinated roadmap, which aligns research agendas, shared testbeds, pilot demonstrations and commercialization strategies, has to be established so that technical, regulatory and economic uncertainties are exposed early and addressed iteratively. Collaborative research centers and innovation hubs concentrate on specialized infrastructure and foster repeatable, open-data experiments; industry consortia translate findings into standards, test methods and pre-certification protocols; regulators operate sandboxes in which operational behavior is observed before full codification. Such alignment ensures that the trajectory of technology maturation is matched by an agile institutional environment, and that distributional outcomes are considered explicitly, so benefits are equitably shared across regions and consumer classes.
Looking forward, the opportunity set is large, but so are the requirements for disciplined execution. Next-generation photovoltaic architectures, enhanced geothermal systems and artificial photosynthesis can be combined with AI-assisted decision-making to yield a low-carbon, fault-tolerant energy system that meets future demand growth without compromising quality of service. Uncertainty will persist, e.g., in costs, in performance learning rates and in public acceptance, yet this uncertainty can be managed through staged pilots, transparent data and probabilistic appraisal, so that scale-up proceeds as evidence accumulates. Finally, the coupling of planning models with operational data will allow planners to update siting, sizing and dispatch rules in near-real time, thereby closing the loop between strategy and field performance.
The concept behind this article is to advance a contracting and accreditation mechanism, rather than to perform a full resource-adequacy or production-cost study. Therefore, the results are based on stylized scenarios and screening-level equations instead of nodal simulations. Consequently, network congestion, commitment/dispatch effects, and deliverability under transmission constraints are not estimated and could shift realized adequacy and costs. The probabilistic demand envelope (compute + robotics) reflects parameter and structural uncertainty (e.g., PUE distributions, training/inference splits, duty cycles), whereas regional transferability is bounded by heterogeneity in market design, institutional capacity, interconnection backlogs and tariff structures. Quantitative outputs are contingent on portfolio composition, weather-year selection and outage correlations, siting/deliverability and the capacity-accreditation method adopted by the system operator. These factors limit external validity beyond the specific case constructions presented here. Covenant performance is conditioned on telemetry access, cybersecurity and privacy compliance and auditability at the PCC, including Class-A power-quality metrology (IEC 61000-4-30) and secure telemetry per IEC 61850/IEC 62443. Deviations from these assumptions can bias PCC-compliance inference and settlement. Claims regarding interconnection-delay mitigation are procedural (tranche-gating plus readiness screens) and depend on institutional adoption. No queue-time model is estimated. At the same time, the referenced technology pathways (e.g., Gen-3 CSP with TES, EGS/CPG, HTS) carry TRL/MRL/IRL risks, cost-dispersion and supply chain constraints, which could shift ELCC and cost outcomes. Learning rates and supply chain shocks could materially re-rank options. In this paper, α has been used as a screening proxy. In nodal resource adequacy studies, deliverability, accreditation and ELCC are resolved under network constraints, and LOLE is computed with nodal contingencies. Finally, AI “acceleration” effects, together with potential rebound, are only approximated here. Net system benefits ought to be verified through pilots with measured LOLE/ELCC deltas and documented compliance costs. To summarize, these limitations frame the covenant as a decision framework to be validated, and not as a guarantee of adequacy or cost recovery.
To summarize, while the magnitude of future energy needs is daunting, the joint application of AI and select low-TRL technologies provides a practical route to deliver sustainable and equitable outcomes. A compute-additionality covenant, service-based procurement, interconnection reform and secure/open telemetry are necessary conditions for progress; robust standards, cybersecurity and grid modernization are the operational means by which integration will be secured. If these elements are aligned, through clear metrics, accountable governance and open, verifiable learning, then the energy system that emerges will not only respond to today’s constraints but will also empower future generations to thrive in a cleaner and more resilient world. The policy task is thus to ensure that near-term stress from digital demand finances and de-risks the medium-term solutions that AI helps accelerate, making the symbiosis visible, measurable and financeable.
Supplementary Materials
The following supporting information can be downloaded at: https://www.mdpi.com/article/10.3390/su17219444/s1. The file Supplementary Note S1—Scenario construction for Figure 1 is available from the link below, including the spreadsheet for the development of the graph. The file Supplementary Note S2—Estimating Robotics Electricity Demand presents the analysis and forecasting for robotics load, including the spreadsheet for the Monte-Carlo simulation and development of the graph in Figure 4. The file Supplementary Note S3—Probabilistic Demand presents the analysis and forecasting for all AI relevant load, including the spreadsheet for the Monte-Carlo simulation and development of the graph for Figure 5. The file Supplementary Note S4—Worked Zone Case: Methods, Equations, and Reproducible Workbook presents in detail the two case studies of this manuscript, including a reproducible workbook for all calculations.
Funding
This research received no external funding.
Institutional Review Board Statement
Not applicable.
Informed Consent Statement
Not applicable.
Data Availability Statement
No new data were created.
Acknowledgments
During the preparation of this manuscript, the author used ChatGPT 5 for the purpose of a final linguistic and editorial check before submission, as well as Perplexity for an advanced internet search. The author has reviewed and edited the output and takes full responsibility for the content of this publication.
Conflicts of Interest
The authors declare no conflicts of interest.
Abbreviations
The following abbreviations are used in this manuscript:
| 2T/4T | Two-Terminal/Four-Terminal |
| AGV | Automated Guided Vehicle(s) |
| AI | Artificial Intelligence |
| AMR | Autonomous Mobile Robot(s) |
| AWES | Airborne Wind Energy Systems |
| BA | Balancing Authority |
| BESS | Battery Energy Storage System |
| BOM | Bill of Materials |
| BOS | Balance of System |
| Brayton (scCO2) | Supercritical CO2 Brayton Cycle |
| CAPEX/OPEX | Capital/Operating Expenditure |
| CPG | CO2-Plume Geothermal |
| CRF | Capital Recovery Factor |
| CSP | Concentrating Solar Power |
| DER | Distributed Energy Resources |
| DLR | Dynamic Line Rating |
| DR | Demand Response |
| DSO | Distribution System Operator |
| EGS | Enhanced Geothermal Systems |
| ELCC | Effective Load-Carrying Capability |
| EMDEs | Emerging Markets and Developing Economies |
| EMS | Energy Management System |
| ENA | Energy Networks Association (UK) |
| ENTSO-E | European Network of Transmission System Operators for Electricity |
| ESMAP | Energy Sector Management Assistance Program |
| ETS | Emissions Trading System |
| FEMP | Federal Energy Management Program |
| FFR | Fast Frequency Response |
| FOM | Fixed Operations and Maintenance |
| FOR | Forced Outage Rate |
| FORGE | Frontier Observatory for Research in Geothermal Energy |
| FRT | Fault Ride-Through |
| G3P3 | Generation 3 Particle Pilot Plant |
| Gen3 (CSP) | Generation-3 CSP |
| GEO | Geostationary Earth Orbit |
| GFM/GFL | Grid-Forming/Grid-Following |
| GOOSE | Generic Object-Oriented Substation Event |
| HJT | Heterojunction (solar cell) |
| HTS | High-Temperature Superconductor |
| HV/MV/LV | High/Medium/Low Voltage |
| IBR | Inverter-Based Resource |
| IEA | International Energy Agency |
| IPMVP | Intl. Performance Measurement and Verification Protocol |
| IRL | Integration Readiness Level |
| ISO | Independent System Operator |
| ITO | Indium Tin Oxide |
| JET | Joint European Torus |
| KPI | Key Performance Indicator |
| LCOE | Levelized Cost of Electricity |
| LEO | Low Earth Orbit |
| LOLE | Loss of Load Expectation |
| LOLP | Loss of Load Probability |
| M&V | Measurement and Verification |
| MMS | Manufacturing Message Specification |
| MRL | Manufacturing Readiness Level |
| MRV | Measurement, Reporting and Verification |
| MTBM | Mean Time Between Maintenance |
| NERC | North American Electric Reliability Corporation |
| NIF | National Ignition Facility |
| NOTAM | Notice To Air Missions |
| NREL | National Renewable Energy Laboratory |
| O&M | Operations and Maintenance |
| PCC | Point of Common Coupling |
| PF | Power Factor |
| PID | Potential-Induced Degradation |
| Plt | Long-Term Flicker Severity Index |
| PMU | Phasor Measurement Unit |
| PPA | Power Purchase Agreement |
| PQ | Power Quality |
| PQDIF | Power Quality Data Interchange Format |
| Pst | Short-Term Flicker Severity Index |
| PUE | Power Usage Effectiveness |
| PV | Photovoltaics |
| RA | Resource Adequacy |
| REBCO | Rare-Earth Barium Copper Oxide |
| REC | Renewable Energy Certificate |
| ROC | Receiver Operating Characteristic |
| ROCOF | Rate of Change of Frequency |
| RTE (efficiency) | Round-Trip Efficiency |
| RTO | Regional Transmission Organization |
| RVC | Rapid Voltage Change |
| SBPVs | Space-Based Photovoltaics |
| SCADA | Supervisory Control and Data Acquisition |
| scCO2 | Supercritical CO2 |
| SFCL | Superconducting Fault Current Limiter |
| Si | Silicon |
| SoC | State of Charge |
| SPC | Statistical Process Control |
| SSA | Sub-Saharan Africa |
| SV | Sampled Values (IEC 61850) |
| TCO | Transparent Conductive Oxide |
| tCO2e | Metric Tons of CO2 equivalent |
| TDD | Total Demand Distortion |
| TES | Thermal Energy Storage |
| THDV | Total Harmonic Distortion of Voltage |
| TLP | Traffic-Light Protocol |
| TOPCon | Tunnel Oxide Passivated Contact |
| TRL | Technology Readiness Level |
| TSO | Transmission System Operator |
| UPS | Uninterruptible Power Supply |
| VAR | Volt-Ampere Reactive |
| VoI | Value of Information |
| VVC | Volt/VAR Control |
| WACC | Weighted Average Cost of Capital |
| XLPE | Cross-Linked Polyethylene |
Appendix A. Standards, Telemetry, and PCC Compliance Crosswalk (Tests, Thresholds, Audit Channels)
The following table presents a PCC compliance crosswalk that aligns each requirement with (i) the governing/measurement standard, (ii) the test, (iii) a representative pass/fail threshold (planning/compatibility levels) and (iv) the telemetry channel to be audited. These are expressed with IEC 61850 logical nodes, so enforcement is machine-auditable.
| Requirement at PCC | Governing/Measurement Standard | Test and Evaluation Window | Representative Pass/Fail Threshold (Planning/Compatibility Level) | Telemetry ch annel (IEC 61850/PMU) |
| Harmonic voltage distortion (THDV, individual Vh) | Limits: IEEE 519-2022; measurement: IEC 61000-4-7 spectral method; aggregation: IEC 61000-4-30 Class A | Continuous PQ logging with 10 min aggregation using Class A instrument | Typical planning level for ≤69 kV: THDV ≤ 5%; individual Vh bands per 519 (e.g., ≤3% for most systems). | MHAU (harmonic voltage), MMXU.V (RMS); store 10 min bins |
| Harmonic current emission (TDD, Ih) | Limits: IEEE 519-2022 Table (by ISC/IL); measurement: IEC 61000-4-7; aggregation: IEC 61000-4-30 | Periodic compliance test at full representative load; 10 min windows | TDD bands at PCC (illustrative): ISC/IL < 20 → ≤5%; 20–50 → ≤8%; 50–100 → ≤12%; 100–1000 → ≤15%; >1000 → ≤20% (with per-order limits). | MHAI (harmonic current), MMXU.I (RMS); 10 min bins |
| Flicker (short-/long-term) | Compatibility: EN 50160; flicker meter: IEC 61000-4-15; aggregation: IEC 61000-4-30 | Continuous flicker measurement (Class-compliant meter) | Pst (10 min) and Plt (2 h) typically ≤ 1.0 for ≥95% of the week at PCC (jurisdiction-specific). | MFLK (flicker), MMXU.V; 10 min Pst, 2 h Plt |
| Rapid voltage changes (RVC)/step changes | Definitions/compatibility: EN 50160 (+ local grid code); engineering practice: ENA P28 (UK) | Step change test during large load transitions; RVC detection per method | Typical planning levels: 3–5% step change (normal), ≤10% infrequent events; confirm with local code. | MMXU.V (RMS), IEC 61000-4-30 Class A RVC flag |
| Voltage unbalance (negative sequence) | Compatibility: EN 50160 (10 min means) | Continuous 10 min mean negative-sequence tracking | ≤2% for ≥95% of the week (some networks allow up to 3% in exceptional cases). | MSQI (sequence components), MMXU.V |
| Fast frequency response (FFR) at PCC | Measurement of f/ROCOF: IEEE C37.118.1 (PMU); service spec per local ISO/RTO | Inject a standard frequency step/ramp; verify active-power response vs. spec | Example covenant criterion: ≥X% of contracted FFR delivered ≤1 s after. | Δf |
| Voltage dip immunity/ride-through (load-side) | IEC 61000-4-34 (equipment > 16 A/phase) test levels | Factory/field immunity test at specified residual-voltage/time profiles | Pass if performance meets the class/test-level matrix without nuisance trip; document UPS/ride-through behavior (IEC Webstore). | Test report; site log via MMXU.V, event recorder |
Below is a list of all standards and frameworks referenced in the manuscript.
| Standard/Framework | Latest Edition | Scope |
| EN 50160 | 2022 (A1:2025) | Public LV/MV voltage characteristics (flicker, unbalance, dips). |
| IEC 61000-4-34 | 2005 (A1:2009; A2:2025) | Voltage dip/short-interruption immunity tests for >16 A/phase equipment. |
| IEC 61850 (series) | Core parts updated 2010–2024 | Substation/data-center telemetry and semantics; SCL modeling and logical nodes. |
| IEC 62351 (series) | Major parts 2018–2025 | Cybersecurity for power-system communications (incl. 61850). |
| IEEE Std 1547 | 2018 | DER interconnection requirements (ride-through, voltage/frequency). |
| IEEE Std 2800 | 2022 | Interconnection of transmission-connected inverter-based resources (IBR). |
| IEEE Std 519 | 2022 | Harmonic limits at the PCC; power-quality compliance for large loads. |
| IPMVP® Core Concepts (EVO 10000-1) | 2022 | Measurement and verification of efficiency/flexibility services for settlement. |
| ISA/IEC 62443 (series) | Key parts: 3-3:2013; 3-2:2020; 4-1:2018; 4-2:2019; 2-4:2023 | Security levels, risk assessment, component/system requirements, service providers. |
| ISO 14040/14044 | 14040:2006 (A1:2020); 14044:2006 (A1:2017; A2:2020) | LCA principles and requirements for environmental accounting. |
| ISO/IEC 27019 | 2024 | Information-security controls tailored to the energy-utility domain (OT). |
| NERC Reliability Guideline: BPS-Connected IBR Performance | 2018 | Good practice guidance on IBR behavior and studies. |
| NIST AI RMF 1.0 | 2023 | AI risk-management framing referenced for governance alignment. |
| NIST SP 800-82 Rev.3 | 2023 | OT/ICS security guidance used alongside 62443/27019. |
Appendix B. Robotics Beyond 2035
Elon Musk, the CEO of Tesla, predicted that there will be 10 billion humanoid robots by 2040, costing between 20 and 25,000 USD each [68]. At the same time, Sam Altman, the CEO of OpenAI predicted in an essay that the key to an exponential increase in robots lies in the achievement of having robots that can build other robots [69]. Early robot prototypes are reported to operate at a low-consumption baseline of 100–500 W, with short bursts during strenuous tasks. For example, experimental treadmill trials for the DURUS humanoid robot reported ~350 W while walking [70]. Cassie, a biped with a non-humanoid torso has been reported to consume ~100 W when standing and ~300 W when walking, while it is equipped with a ~5 h battery bank [71]. Tesla has stated that the Tesla Optimus humanoid robot’s 2.3 kWh battery can provide a full day’s power for the robot [72]. If Elon Musk’s prediction is considered, the aggregate energy would be estimated to approach ~8350 TWh per annum in 2040, which is about double the current electricity consumption of the USA. While these figures are speculative, they provide a key insight in the revolution of the power systems that needs to take place globally to accommodate this future beyond 2035.
Appendix C. Technologies Investigation
Appendix C complements Section 3 into a transparent, criterion-driven assessment. For each technology family, i.e., A.1 generation and storage (CSP + TES; EGS/CPG with sCO2; perovskite–Si tandems; high-altitude wind), A.2 direct conversion (photoelectrochemical routes) and A.3 transmission and system infrastructure (HTS corridors), the following are reported: (i) grid services and temporal value (dispatchability, ramp rates, grid-forming behavior); (ii) scalability/manufacturability (supply chain depth, siting constraints, modularity at standard voltages/footprints); (iii) technology readiness and credible cost trajectories (demonstrated milestones, learning rates, delivery risk); (iv) integration complexity at the power-electronics and controls interface (protection coordination, harmonic performance, FRT, interoperability with state estimation/market dispatch); and (v) governance, measurement and verification and risk (telemetry, accreditation, sampling and auditability).
Appendix C.1. Generation and Storage
Appendix C.1.1. Concentrated Solar Power Plus Thermal Energy Storage (TES)
Advanced CSP plants with multi-hour molten-salt or particle TES supply controllable solar heat that is dispatched through steam Rankine or supercritical CO2 Brayton power blocks to cover the evening ramp. At the same time, the system value is realized as accredited firm capacity, measurable curtailment reduction at co-sited PV hubs, and voltage/frequency support, when synchronous machines or grid-forming controls are implemented at the power block. Gen3 pathways, which include particle receivers operating at ≥700 °C with higher-temperature TES and compact Brayton turbomachinery, extend operating envelopes and improve round-trip efficiency, thereby strengthening the case for evening and shoulder periods where residual demand peaks. In markets where policy support is intermittent, deployment remains gated by bankability and standardized accreditation, yet recent programmatic results and guidance indicate a credible trajectory for dispatchable solar heat to contribute materially to flexibility services [73,74].
Cost/availability bands are site-specific, where high-direct normal irradiation (DNI) locations with tractable land and interconnection deliver the strongest LCOE trajectories, while water management, receiver O&M, and salt/particle handling determine achievable availability. Annual technology baseline ranges prepared by NREL reflect cost decline with improved heliostat fields, selective coatings and higher-temperature cycles [75].
AI levers ought to be embedded from design throughout operations:
- Heliostat-field layout and aiming for optimization;
- Soiling/fouling prediction tied to robotic cleaning schedules;
- Real-time dispatch that co-optimizes thermal inventory with market signals to preserve TES state-of-charge for critical ramps.
Risks cluster around receiver durability, TES life, and site water constraints. Stage-gates should be defined by demonstrating ≥50 MW net with ≥6–10 h TES, ≥95% availability over at least two summers, verified derate factors, TES round-trip efficiency and an independent effective load-carrying capability (ELCC) dossier, suitable for capacity accreditation. AI acceleration is operationalized as
which refers to the design-build-test cycle time and AI cost-effectiveness as
Under the Supplementary Note S4 normalization (Steps 2–7) a one to two percentage-point gain in TES round-trip efficiency or the heliostat-field capacity factor produces a first-order uplift in accredited ELCC at the planning margin, thereby lowering $/ELCC-kW-yr. The template equations to compute these deltas are provided in Supplementary Note S4.
On top of this, particle-receiver pilots de-risk materials, seals and handling at relevant flux/temperature, which will, in practice, ensure repeatable availability before scale-up [75,76,77,78].
Appendix C.1.2. Advanced Geothermal Systems with Supercritical CO2 Cycles and Enhanced Geothermal Energy Extraction (EGS/CPG)
Advanced geothermal systems spanning enhanced geothermal systems (EGS) and CO2-plume geothermal (CPG) coupled with supercritical CO2 (scCO2) cycles, offer firm, low-carbon capacity sites near demand, provided development is disciplined by risk governance and explicit capacity accreditation. Technical credibility has been strengthened with Utah FORGE’s paired-well stimulation and nine-hour circulation, confirming injector–producer connectivity in hot, low-permeability granite, while ATB-2024 revised cost/performance inputs, reflecting learning in drilling, completions and surface conversion [75,79]. Foundational analyses motivate scCO2 by documenting thermophysical advantages over water in suitable reservoirs and the feasibility of CPG architectures that advect heat via a mobile plume [80,81].
Resource assessment and well architecture define performance. EGS engineers injector–producer doublets (or multi-laterals) through hydraulic stimulation, to create conductive networks with sustainable pressure and temperature drawdown, while closed-loop variants trade higher drilling precision for lower geochemical uncertainty. CPG repurposes depleted or saline formations, injecting CO2 to establish a low-viscosity, low-density plume that can reduce parasitic pumping relative to water under favorable conditions [80,81]. At the surface, scCO2 Brayton cycles can yield higher conversion efficiency and compact, modular turbomachinery, versus steam Rankine, at comparable resource temperatures, although materials, sealing and control strategies must be validated across transients [82]. Selection is a site-specific optimization across gradient, stress regime, mineralogy, wellbore stability, legacy wells and surface integration.
Capacity accreditation should translate physical potential into ELCC via co-simulation of the reservoir and plant (thermal drawdown, flow maintenance), forced-outage statistics, temperature-dependent conversion (notably for scCO2) and nodal deliverability; pilot-specific P50/P95 studies, initialized with ATB parameters and anchored in site evidence, are recommended [75]. Induced seismicity governance in the form of baseline seismology, real-time microseismic traffic-light protocols with pressure-rate caps and operational geomechanics must adaptively manage risk. The FORGE circulation test illustrates de-risking connectivity within limits [79].
AI can compress the design–build–test–learn loop: learning-based drilling and completions, Bayesian optimization of stimulation under geomechanical constraints, and physics-informed surrogates for surveillance sustain flow while respecting hazard thresholds, with environmental co-benefits (reduced water use, lower lift power, potential storage) that are contingent on robust MMV and standardized KPIs. Finally, staged gates, including season-scale connectivity, seismic thresholds per injected MWh, validated reservoir–surface co-models, independent ELCC and O&M evidence, will heavily support bankability. With FORGE-class learning, ATB-aligned trajectories and AI-enabled workflows, EGS/CPG can supply firm, clean capacity within current planning horizons. Consistently, AI acceleration is measured as
and AI cost-effectiveness as
Using the normalization presented in Supplementary Note S4 (Steps 2–7), marginal improvements in sustained flow (and/or reduced lift power), together with scCO2-cycle conversion efficiency, translate—locally—into higher accredited ELCC and lower $/ELCC-kW-yr. The template equations are provided in S4.
Appendix C.1.3. Perovskite–Silicon Tandem Photovoltaics
Perovskite–Si tandems constitute the most credible near-term step-change in photovoltaic conversion, since independently verified research cells have reached 34.85% [83] and pilot-scale modules have demonstrated mid-20% efficiencies, indicating a practical route from laboratory champions to fieldable product [84]. At the same time, system value is realized at plant scale through higher energy yield per area, balance of system (BOS) relief where space is scarce, and reduced land/cable intensity. Still, these benefits are accessible only if durability and factory yield clear bankability gates. Two architectures are mainly in scope: monolithic two-terminal (2T) stacks, with a wide-gap perovskite deposited on high-efficiency Si (tunnel oxide passivated contact—TOPCon or heterojunction—HJT), and four-terminal (4T) mechanical stacks that remove current matching constraints at the cost of optical and packaging complexity.
Durability and bankability hinge on passing IEC-class reliability with margin (damp–heat 85/85, thermal cycling, humidity–freeze, UV, PID), demonstrating post-stabilization degradation ≤0.5–0.6%/year, and providing explicit lead containment under breakage. Principal risks include ion migration and phase segregation in mixed-halide wide-gap absorbers; interface-mediated recombination and sputter damage in the recombination layer, moisture/oxygen ingress, UV-induced defect generation, thermo-mechanical stress across perovskite/transport/Si interfaces and lead leakage [85,86]. Bankability requires ≥2 summers of field data with ≤0.6%/y stabilized degradation at module level under IEC-conformant BOM. A credible stack, therefore, combines Br-rich wide-gap compositions with cation engineering, diffusion barriers and benign interlayers, plus transparent electrodes that survive lamination.
Factory yield is the current bottleneck, not physics. High-throughput solution and hybrid vapor deposition must hold tight windows for thickness, stoichiometry and crystallinity, without pinholes or residual solvents. Low plasma and thermal budgets protect transport layers and recombination contacts. Inline metrology (PL/EL imaging, dark/illuminated IV, reflectance) with SPC detects drift. Packaging preserves TCO/ITO conductivity.
AI can compress learning with a closed-loop recipe search, informatics-guided passivation, physics-informed prognostics and virtual metrology for anomaly detection [87]. Finally, explicit commercialization markers apply:
- IEC pass across the full BOM;
- Stabilized module efficiency, delivering an LCOE advantage versus best-in-class Si at equal BOS;
- ≥2 summer field data with ≤0.6%/year slope;
- Independent yield assessments;
- Bankable 25 year warranties with lead containment provisions;
- Second source supply for key layers.
To summarize, conservative stack engineering, repeatable yield and AI-assisted control will ensure tandem advantages translate into deployable capacity in BOS-dominated markets (e.g., rooftops, façades, canopies).
Appendix C.1.4. High-Altitude Wind Energy Harvesting
High-altitude wind energy is examined as a complementary pathway that can be coupled with compact, high-capacity corridors, since stronger and more persistent winds are accessed by tethered airborne wind energy systems (AWES) that operate crosswind to raise apparent wind and specific power. Kites and drone-based platforms are deployed to altitudes typically above 100 m, where shear reduces surface-layer turbulence, and closed-loop flight control is used to maintain aero-structural stability, while maximizing traction force and cycle efficiency [88]. Availability is driven by autonomous flight control robustness, all-weather operating envelopes (icing, precipitation, shear), and airspace governance, where NOTAM procedures, sense-and-avoid, and exclusion cylinders are coordinated with aviation authorities.
Siting and sequencing are aligned with use cases where conventional turbines are constrained by hub-height logistics or land-use conflict. Modular AWES clusters are arrayed with short setbacks and low foundations with a minimal ground footprint, and interconnection is via medium-voltage feeders that can be paralleled with storage or HTS bottleneck relief, where this is justified by losses. Lifecycle cost is determined by tether replacement intervals, airframe overhaul, and ground station maintenance, with learning effects expected in airframe manufacture and flight-control software, while environmental interactions (e.g., avian corridors, acoustic signatures, visual impact) are addressed through altitude stratification and adaptive operations [88].
Summarizing, AWES provides access to high, stable wind resources through tethered flight and closed-loop control, with conversion chains that can be tuned to satisfy distribution-level operability and power-quality requirements. The principal challenges are located at the interface, which includes tether mechanics, autonomous control, airspace integration, and grid-code compliance. When these challenges are surpassed, high-altitude wind can be sequenced as a modular complement to solar and conventional wind in geographically constrained networks.
Appendix C.1.5. Photoelectrochemical (PEC) Pathways
Artificial photosynthesis is a pathway in which sunlight is converted to storable chemical energy, rather than directly to electricity. Engineered photoelectrochemical cells (PECs) are configured so that semiconductor absorbers harvest photons and drive redox reactions at fluid–solid interfaces, with hydrogen and carbon-based fuels produced as chemical bonds that can be stored, transported and later reconverted to electricity or process heat, while product separation, gas management and Faradaic-efficiency accounting are treated as first-order design variables, rather than residuals [89]. The efficiency and durability envelope is raised through materials and interface engineering; heterojunction photoelectrodes and nanostructured surfaces are employed to enhance charge separation and suppress recombination, catalytic layers are deposited to lower overpotentials and improve kinetics at both hydrogen- and oxygen-evolving interfaces and protective coatings are used to decouple electronic performance from corrosive electrolytes, thereby extending operating life without sacrificing optical coupling [90]. It follows that tandem configurations are screened to capture a broader solar spectrum while maintaining sufficient photovoltage for unassisted operation, that electrolyte composition and pH are chosen to balance kinetics with materials stability, and that balance-of-plants (pumps, sensors, valving and safety interlocks) are integrated to meet hydrogen handling codes and to prepare fuel streams for downstream conditioning, compression or synthesis.
Finally, system-level operability is derived in terms of how PEC production is coupled with renewable portfolios and end uses; solar-to-chemical output is measured and verified on a lower-heating-value basis, storage is sized to firm variability and reconversion via fuel cells or turbines is interfaced through grid-forming or grid-following power electronics, so that voltage support, ride-through and ramping requirements are satisfied when fuels are dispatched. Siting and sequencing are then aligned with water availability, electrolyte management and safety setbacks, and with proximity to off-takers for hydrogen or carbon products.
To summarize, PECs provide a direct solar-to-fuel route, in which semiconductor design, catalytic interfaces and fluid management jointly determine efficiency and stability; while scale-up and long-term durability remain gating factors, advances in heterojunctions, surface modifications and system integration support inclusion as a prospective, carbon-neutral conversion option in next-generation portfolios [89,90].
Appendix C.2. Transmission and System Infrastructure
High-Temperature Superconducting (HTS) Transmission Systems
Urban pilots have demonstrated that high-temperature superconducting transmission can be operated on real networks with integrated protection and acceptable availability. The 1 km, 10 kV, 40 MVA AmpaCity link in Essen was operated with a superconducting fault-current limiter in series, and was used to replace a 110-kV corridor, thereby validating compact, high-power-density ducts, low thermal envelopes and coordinated protection in a constrained city center [51,91]. In parallel, recent programs have extended the concept to multi-function urban corridors and to data-center applications, where high continuous loads and tight power-quality tolerances prevail, so that cable, cryogenics, terminations and protection are treated as an integrated asset class, rather than as bespoke items.
Scale-up pathways are aligned with use cases where conventional reinforcement is spatially or thermally constrained, or where long-run losses dominate economics. Urban underground corridors, inter-substation backbones and high-availability feeders for data-center clusters are prioritized, and regulated pilot programs with transparent M&V are favored so that cryogenic reliability, protection selectivity and total cost of ownership can be evidenced prior to wide rollout. For remote renewable integration, offshore wind landfalls and long-distance collectors, the near-lossless property of HTS is screened against cryogenic logistics and repairability. Procurement is then structured to value delivered services, such as loss reduction, fault-level management via embedded limiters and thermal headroom, that unlock hosting capacity, rather than headline conductor efficiency alone.
To summarize, HTS transmission offers very low resistive losses and exceptional power density that have been demonstrated on real grids, yet bankable deployment is decelerated by cryogenic reliability, protection coordination and lifecycle cost.
Appendix C.3. Long-Term Technologies Able to Act as a Disruptive Paradigm Shift
Beyond methodological considerations, this long-term track acts as a portfolio hedge to the preceding stress-test on robotic electricity demand, which examines an asymmetric, near-term upside in load. By acknowledging both ends, the risk of demand overshoot and the possibility that ASI compresses discovery-to-deployment cycles, a strategic optionality is preserved without mixing speculation with planning. The following paradigms are treated as real options and advance only upon meeting explicit, auditable gates. This symmetric treatment converts debate into risk management while keeping the near-term roadmap disciplined and ELCC-anchored.
Appendix C.3.1. Nuclear Fusion
Recently, independently verified milestones have confirmed fusion as a scientific breakthrough while underscoring the distance to grid-relevant demonstration. The National Ignition Facility first achieved—and later repeated—fusion ignition in December 2022, with multi-MJ yields [92], and JET’s 2023–2024 deuterium–tritium campaigns delivered a 69 MJ record over five seconds before shutdown [93]. Yet, translating proofs to plants hinges on engineering: magnetic confinement must pair high-field REBCO magnets with blankets that both breed tritium and survive divertor heat fluxes while mitigating neutron-induced swelling/embrittlement and enabling remote handling [94,95]. Inertial schemes must close the triangle of target cost and fabrication, repetition rate and overall driver efficiency; even with ignition, chamber clearing, debris management and thermal smoothing are pivotal [92,96]. Hybrid magneto-inertial concepts promise lower driver energy via pre-magnetization and liner compression, but require coupled optimization of topology, hydrodynamics and synchronization, plus evidence that shielding and recirculating power preserve net-electric margins [97]. Across pathways, bankable availability demands closed fuel-cycle control (tritium self-sufficiency and minimal inventories), qualified heat-exchanger lifetimes and credible conversion (steam Rankine or He/CO2 Brayton) that behaves predictably at the grid interface. Accordingly, fusion is treated as a post-2035 option, pending engineering demonstrators that expose operability, reliability and lifecycle economics at plant scale.
Appendix C.3.2. Space-Based Photovoltaics (SBPVs) and Wireless Energy Transfer
Early spaceflight experiments now anchor SBPV feasibility, while delineating formidable system-level hurdles. Caltech’s SSPD-1 (2023–2024) demonstrated key elements of in-orbit power generation and wireless transfer, including detectable beamed power on Earth [54]. In parallel, ESA’s SOLARIS and a 2024 NASA study outline technology gaps, safety envelopes, spectrum governance and costs, motivating the placement of SBPV on a long-run research track, rather than pre-mid-century grid commitments [98]. Above clouds and night, orbital arrays harvest quasi-continuous irradiance ~10–15% higher than terrestrial levels, with vacuum operation and broadened spectral access boosting conversion [99]. System design turns on end-of-life performance under radiation and micrometeoroids, precision pointing and structural dynamics and mass-to-power ratios that govern the launch and assembly cadence. Orbit choices trade coverage, link budget, and collision risks: GEO favors continuous service at higher aperture and transmitter power; LEO favors modular fleets with complex ground scheduling. Power beaming via microwaves or lasers hinges on phased-array control—dynamic steering, amplitude/phase coherence, and sidelobe suppression—and on high-efficiency rectennas (>80%) and robust grid-side power electronics [100,101,102]. Ultimately, aperture area, transmitter power and ground rectenna infrastructure dominate lifecycle cost; current evidence supports SBPV as a long-term option under sustained R&D.
Appendix C.3.3. Other Frontier Disruptors
Beyond nuclear fusion and HTS, several very low-TRL options ought to be monitored, since they extend the feasible design space and, at the same time, target firm or high-value services under extreme conditions: thermophotovoltaic heat engines now exceed 40% conversion at >2000 °C [103], superhot-rock geothermal using gyrotron millimeter-wave drilling could unlock ≥400 °C resources for dispatchable power [104], magnetohydrodynamic direct conversion revisits seeded-plasma generators with modern magnets, electrodes and controls [105], salinity-gradient power via pressure-retarded osmosis/reverse electrodialysis remains niche but can use existing water infrastructure [106] and space elevators (carbon-nanotube-tethered systems with laser-powered climbers) would radically lower orbital logistics and could, in principle, enable space-based energy architectures [107]. Across these candidates, AI-accelerated material discovery, closed-loop control and self-driving laboratories can compress design–build–test–learn cycles, so that maturation timelines are shortened and extreme upper-bound demand can be met without conflating speculation with the plan.
Appendix D. Cost–Risk Bands for Enabling Technologies
Figure A1, Figure A2, Figure A3 and Figure A4 report low–high cost bands per technology, using recent public benchmarks [108,109,110].
Units are technology-specific, $/kW (CSP, EGS/CPG), $M per mile (HTS urban cables, inclusive of cryogenics/SFCL in the cited case), and $/Wdc (tandem PV), so the panels are for a within-technology uncertainty appraisal and not cross-technology comparisons. The two-band format captures (i) 2022 to 2030 scenario deltas or wire/efficiency sensitivities (CSP, HTS, PV) and (ii) siting/depth dispersion (near-field vs. deep EGS), providing actionable priors for tranche sizing, contingency allowances and stage-gate KPIs. Site conditions, learning rates, financing and integration risks can shift realizations.

Figure A1.
CSP + TES (Gen3)—CAPEX bands.
Figure A1.
CSP + TES (Gen3)—CAPEX bands.


Figure A2.
EGS/CPG with scCO2 cycles—OCC bands.
Figure A2.
EGS/CPG with scCO2 cycles—OCC bands.


Figure A3.
HTS urban backbones (cables + SFCL)—per-mile system cost bands.
Figure A3.
HTS urban backbones (cables + SFCL)—per-mile system cost bands.


Figure A4.
Perovskite–Si tandem PV (2T/4T).
Figure A4.
Perovskite–Si tandem PV (2T/4T).

References
- Kyriakarakos, G. Artificial Intelligence and the Energy Transition. Sustainability 2025, 17, 1140. [Google Scholar] [CrossRef]
- International Energy Agency (IEA). Energy and AI; IEA: Paris, France, 2025; Available online: https://www.iea.org/reports/energy-and-ai (accessed on 5 August 2025).
- Google. Growing the Internet While Reducing Energy Consumption. Available online: https://datacenters.google/efficiency (accessed on 5 August 2025).
- Donnellan, D.; Lawrence, A.; Bizo, D.; Judge, P.; O’Brien, J.; Davis, J.; Smolaks, M.; Williams-George, J.; Weinschenk, R. Uptime Institute Global Data Center Survey 2024; Uptime Institute: New York, NY, USA, 2024. [Google Scholar]
- Khalid, M. Smart grids and renewable energy systems: Perspectives and grid integration challenges. Energy Strategy Rev. 2024, 51, 101299. [Google Scholar] [CrossRef]
- IEEE Std 519-2022; IEEE Standard for Harmonic Control in Electric Power Systems. IEEE: Piscataway, NJ, USA, 2022.
- EN 50160:2022 + A1:2025; Voltage Characteristics of Electricity Supplied by Public Electricity Networks. CENELEC: Brussels, Belgium, 2025.
- IEC 61000-4-34:2005 + AMD1:2009 + AMD2:2025; Electromagnetic Compatibility (EMC)—Part 4-34: Testing and Measurement Techniques—Voltage Dips, Short Interruptions and Voltage Variations Immunity Tests for Equipment with Mains Current More Than 16 A per Phase. IEC: Geneva, Switzerland, 2025.
- Keefe, T.L.; Hardin, K.; Nagdeo, J. 2025 Power & Utilities Industry Outlook; Deloitte Insights: New York, NY, USA, 2024; Available online: https://www.deloitte.com/us/en/insights/industry/power-and-utilities/power-and-utilities-industry-outlook.html (accessed on 5 August 2025).
- NERC. Reliability Guideline-BPS-Connected Inverter-Based Resource Performance; NERC: Atlanta, GA, USA, 2018. [Google Scholar]
- Rabbi, M.F.; Popp, J.; Máté, D.; Kovács, S. Energy Security and Energy Transition to Achieve Carbon Neutrality. Energies 2022, 15, 8126. [Google Scholar] [CrossRef]
- International Energy Agency (IEA). Clean Energy Investment for Development in Africa—Status and Opportunities; IEA: Paris, France, 2024. [Google Scholar]
- International Energy Agency (IEA). Africa Energy Outlook 2022; IEA: Paris, France, 2022; Available online: https://www.iea.org/reports/africa-energy-outlook-2022 (accessed on 5 August 2025).
- Le Coq, C.; Bennato, A.R.; Duma, D.; Lazarczyk, E. Flexibility in the Energy Sector; CERRE—Centre on Regulation in Europe: Brussels, Belgium, 2025; Available online: https://cerre.eu/publications/flexibility-in-the-energy-sector/ (accessed on 5 August 2025).
- Castrejon-Campos, O.; Aye, L.; Hui, F.K.P. Making policy mixes more robust: An integrative and interdisciplinary approach for clean energy transitions. Energy Res. Soc. Sci. 2020, 64, 101425. [Google Scholar] [CrossRef]
- EVO 10000-1:2022; International Performance Measurement and Verification Protocol: Core Concepts (IPMVP). Efficiency Valuation Organization (EVO): Washington, DC, USA, 2016.
- Federal Energy Regulatory Commission (FERC). Explainer on the Interconnection Final Rule. Available online: https://www.ferc.gov/explainer-interconnection-final-rule (accessed on 5 August 2025).
- Rand, J.; Manderlink, N.; Gorman, W.; Wiser, R.H.; Seel, J.; Kemp, J.M.; Jeong, S.; Kahrl, F. Queued Up: 2024 Edition—Characteristics of Power Plants Seeking Transmission Interconnection as of the End of 2023; Lawrence Berkeley National Laboratory: Berkeley, CA, USA, 2024. Available online: https://emp.lbl.gov/publications/queued-2024-edition-characteristics (accessed on 5 August 2025).
- Ding, Y.; Shi, T. Sustainable LLM Serving: Environmental Implications, Challenges, and Opportunities. In Proceedings of the 2024 IEEE 15th International Green and Sustainable Computing Conference (IGSC), Austin, TX, USA, 2–3 November 2024; pp. 37–38. [Google Scholar]
- Patterson, D.; Gonzalez, J.; Le, Q.; Liang, C.; Munguia, L.-M.; Rothchild, D.; So, D.; Texier, M.; Dean, J. Carbon Emissions and Large Neural Network Training. arXiv 2021, arXiv:2104.10350. Available online: https://arxiv.org/abs/2104.10350 (accessed on 5 August 2025). [CrossRef]
- Patterson, D.; Gonzalez, J.; Hölzle, U.; Le, Q.; Liang, C.; Munguia, L.-M.; Rothchild, D.; So, D.R.; Texier, M.; Dean, J. The carbon footprint of machine learning training will plateau, then shrink. Computer 2022, 55, 18–28. [Google Scholar] [CrossRef]
- Henderson, P.; Hu, J.; Romoff, J.; Brunskill, E.; Jurafsky, D.; Pineau, J. Towards the Systematic Reporting of the Energy and Carbon Footprints of Machine Learning. arXiv 2020, arXiv:2002.05651. Available online: https://arxiv.org/abs/2002.05651 (accessed on 5 August 2025).
- Molęda, M.; Małysiak-Mrozek, B.; Ding, W.; Sunderam, V.; Mrozek, D. From corrective to predictive maintenance—A review of maintenance approaches for the power industry. Sensors 2023, 23, 5970. [Google Scholar] [CrossRef] [PubMed]
- Merabet, G.H.; Essaaidi, M.; Haddou, M.B.; Qolomany, B.; Qadir, J.; Anan, M.; Al-Fuqaha, A.; Abid, M.R.; Benhaddou, D. Intelligent building control systems for thermal comfort and energy-efficiency: A systematic review of artificial intelligence-assisted techniques. Renew. Sustain. Energy Rev. 2021, 144, 110969. [Google Scholar] [CrossRef]
- Pang, Z.; O’Neill, Z.; Chen, Y.; Zhang, J.; Cheng, H.; Dong, B. Adopting occupancy-based HVAC controls in commercial building energy codes: Analysis of cost-effectiveness and decarbonization potential. Appl. Energy 2023, 349, 121594. [Google Scholar] [CrossRef]
- Lin, G.; Casillas, A.; Sheng, M.; Granderson, J. Performance evaluation of an occupancy-based hvac control system in an office building. Energies 2023, 16, 7088. [Google Scholar] [CrossRef]
- Munankarmi, P.; Maguire, J.; Jin, X. Occupancy-Based Controls for an All-Electric Residential Community in a Cold Climate. In Proceedings of the 2022 IEEE Power & Energy Society General Meeting (PESGM), Denver, CO, USA, 17–21 July 2022; pp. 1–5. [Google Scholar]
- Kumar, N.M.; Chand, A.A.; Malvoni, M.; Prasad, K.A.; Mamun, K.A.; Islam, F.; Chopra, S.S. Distributed energy resources and the application of AI, IoT, and blockchain in smart grids. Energies 2020, 13, 5739. [Google Scholar] [CrossRef]
- IEC 61850:2025 SER; Communication Networks and Systems for Power Utility Automation—All Parts. IEC: Geneva, Switzerland, 2010–2025.
- ISA/IEC 62443 Series of Standards; Security for Industrial Automation and Control Systems. ISA: Research Triangle Park, NC, USA; IEC: Geneva, Switzerland, various years.
- Zhao, F.; Zheng, T.; Litvinov, E. Decomposition and Optimization in Constructing Forward Capacity Market Demand Curves. Optimization Online. 2016. Available online: http://www.optimization-online.org/DB_FILE/2016/05/5449.pdf (accessed on 5 August 2025).
- Ibanez, E.; Milligan, M. Comparing resource adequacy metrics and their influence on capacity value. In Proceedings of the 2014 International Conference on Probabilistic Methods Applied to Power Systems (PMAPS), Durham, UK, 7–10 July 2014; pp. 1–6. [Google Scholar]
- Greenwood, D.M.; Lim, K.Y.; Patsios, C.; Lyons, P.; Lim, Y.S.; Taylor, P. Frequency response services designed for energy storage. Appl. Energy 2017, 203, 115–127. [Google Scholar] [CrossRef]
- Kumar, S.; Abu-Siada, A.; Das, N.; Islam, S. Toward a substation automation system based on IEC 61850. Electronics 2021, 10, 310. [Google Scholar] [CrossRef]
- IEC 62351 series of standards; Power Systems Management and Associated Information Exchange—Data and Communications Security. IEC: Geneva, Switzerland, various years.
- IEC 61000-4-30:2015 + Amd.1:2021; Electromagnetic Compatibility (EMC)—Part 4-30: Testing and Measurement Techniques—Power Quality Measurement Methods. IEC: Geneva, Switzerland, 2021.
- IEEE Std 1159-2019; IEEE Recommended Practice for Monitoring Electric Power Quality. IEEE: Piscataway, NJ, USA, 2019.
- IEEE Std C37.118.2-2024; IEEE Standard for Synchrophasor Data Transfer for Power Systems. IEEE: Piscataway, NJ, USA, 2024.
- Howard, R.A. Information value theory. IEEE Trans. Syst. Sci. Cybern. 1966, 2, 22–26. [Google Scholar] [CrossRef]
- Krause, A.; Guestrin, C. Optimal Nonmyopic Value of Information in Graphical Models: Efficient Algorithms and Theoretical Limits; Technical Report CMU-CALD-05-100; School of Computer Science, Carnegie Mellon University: Pittsburgh, PA, USA, 2005; Available online: http://reports-archive.adm.cs.cmu.edu/anon/cald/CMU-CALD-05-100.pdf (accessed on 5 August 2025).
- Johnson, T.; Moger, T. A critical review of methods for optimal placement of phasor measurement units. Int. Trans. Electr. Energy Syst. 2021, 31, e12698. [Google Scholar] [CrossRef]
- Bubeck, S.; Chandrasekaran, V.; Eldan, R.; Gehrke, J.; Horvitz, E.; Kamar, E.; Lee, P.; Lee, Y.T.; Li, Y.; Lundberg, S. Sparks of artificial general intelligence: Early experiments with gpt-4. arXiv 2023, arXiv:2303.12712. [Google Scholar] [CrossRef]
- National Institute of Standards and Technology (NIST). Artificial Intelligence Risk Management Framework (AI RMF 1.0); NIST: Gaithersburg, MD, USA, 2023. Available online: https://nvlpubs.nist.gov/nistpubs/ai/NIST.AI.100-1.pdf (accessed on 5 August 2025).
- Volk, A.A.; Abolhasani, M. Performance metrics to unleash the power of self-driving labs in chemistry and materials science. Nat. Commun. 2024, 15, 1378. [Google Scholar] [CrossRef] [PubMed]
- Shahriari, B.; Swersky, K.; Wang, Z.; Adams, R.P.; De Freitas, N. Taking the human out of the loop: A review of Bayesian optimization. Proc. IEEE 2015, 104, 148–175. [Google Scholar] [CrossRef]
- Lu, C.; Lu, C.; Lange, R.T.; Foerster, J.; Clune, J.; Ha, D. The ai scientist: Towards fully automated open-ended scientific discovery. arXiv 2024, arXiv:2408.06292. [Google Scholar] [CrossRef]
- IEEE Std 1547-2018; IEEE Standard for Interconnection and Interoperability of Distributed Energy Resources with Associated Electric Power Systems Interfaces. IEEE: Piscataway, NJ, USA, 2018.
- IEEE Std 2800-2022; IEEE Standard for Interconnection and Interoperability of Inverter-Based Resources (IBRs) Interconnecting with Associated Transmission Electric Power Systems. IEEE: Piscataway, NJ, USA, 2022.
- Perez, C. Technological revolutions and financial capital: The dynamics of bubbles and golden ages. In Technological Revolutions and Financial Capital; Edward Elgar Publishing: Cheltenham, UK, 2002. [Google Scholar]
- Stemmle, M.; Merschel, F.; Noe, M. AmpaCity Project—World’s First Superconducting Cable and Fault Current Limiter Installation in a German City Center. In Research, Fabrication and Applications of Bi-2223 HTS Wires; World Scientific: Singapore, 2020; pp. 263–278. [Google Scholar] [CrossRef]
- Larbalestier, D.C.; Jiang, J.; Trociewitz, U.A.; Kametani, F.; Scheuerlein, C.; Dalban-Canassy, M.; Matras, M.; Chen, P.; Craig, N.; Lee, P. Isotropic round-wire multifilament cuprate superconductor for generation of magnetic fields above 30 T. Nat. Mater. 2014, 13, 375–381. [Google Scholar] [CrossRef] [PubMed]
- Schneiders, A. Regulatory Sandboxes in the Energy Sector: Are They Key to the Transition to a Net Zero Future? In Proceedings of the BIEE—Energy for a Net Zero Society 2021, Oxford, UK, 13–14 September 2021; British Institute of Energy Economics (BIEE): Oxford, UK, 2021. Available online: https://discovery.ucl.ac.uk/id/eprint/10161899/ (accessed on 29 September 2025).
- Perkins, R. Space Solar Power Project Ends First In-Space Mission with Successes and Lessons. Caltech News. 2024. Available online: https://www.caltech.edu/about/news/space-solar-power-project-ends-first-in-space-mission-with-successes-and-lessons (accessed on 29 September 2025).
- International Energy Agency (IEA). Financing Clean Energy in Africa; IEA: Paris, France, 2023; Available online: https://iea.blob.core.windows.net/assets/aeadbc3e-5020-4c83-bcfe-6a00d1aca49c/CleanenergyinvestmentfordevelopmentinAfrica.pdf (accessed on 5 August 2025).
- IFC. Scaling Solar in Africa; IFC: Washington, DC, USA, 2023. [Google Scholar]
- Mathiasen, K.; Aboneaaj, R. MIGA: The Little Engine That Should; Center for Global Development: Washington, DC, USA, 2023. [Google Scholar]
- Fink, C.; Lankes, H.P.; Sacchetto, C. Mitigating foreign exchange Risk in local currency lending in fragile states; Technical Report for International Growth Centre (IGC); IGC: London, UK, June 2023. [Google Scholar]
- Amoah, M. Bridging the Energy Access Divide: A Policy Gap Analysis of 12 African National Energy Compacts Under Mission 300; Payne Institute for Public Policy, Colorado School of Mines: Golden, CO, USA, 2025; Available online: https://payneinstitute.mines.edu/bridging-the-energy-access-divide-a-policy-gap-analysis-of-12-african-national-energy-compacts-under-mission-300/ (accessed on 5 August 2025).
- Serbouk, M.B.; Noui, E. Exploring Sustainable Bank Financing in Algeria: A Content Analysis of Interviews, Reports, and Websites from Selected Banks. S. Afr. J. Econ. Manag. Sci. 2025, 9, 574–597. [Google Scholar] [CrossRef]
- Ettmayr, C.; Lloyd, H. Local content requirements and the impact on the South African renewable energy sector: A survey-based analysis. S. Afr. J. Econ. Manag. Sci. 2017, 20, a1538. [Google Scholar] [CrossRef]
- Bazilian, M.; Cuming, V.; Kenyon, T. Local-content rules for renewables projects don’t always work. Energy Strategy Rev. 2020, 32, 100569. [Google Scholar] [CrossRef]
- ESMAP. Mini Grids For Half A Billion People—Market Outlook and Handbook for Decision Makers; ESMAP World Bank Group: Washington, DC, USA, 2022. [Google Scholar]
- Kurtz, J.; Hovsapian, R. ARIES: Advanced Research on Integrated Energy Systems Research Plan; National Renewable Energy Laboratory (NREL): Golden, CO, USA, 2021; ISO/IEC: Geneva, Switzerland, 2024. [Google Scholar]
- ISO/IEC 27019:2024; Information Security, Cybersecurity and Privacy Protection—Sector-Specific Guidance Based on ISO/IEC 27002 for the Energy Utility Industry. ISO/IEC: Geneva, Switzerland, 2024.
- Stouffer, K.; Pease, M.; Tang, C.; Zimmerman, T.; Pillitteri, V.; Lightman, S.; Hahn, A.; Saravia, S.; Sherule, A.; Thompson, M. Guide to Operational Technology (OT) Security. 2023. Available online: https://nvlpubs.nist.gov/nistpubs/SpecialPublications/NIST.SP.800-82r3.pdf (accessed on 5 August 2025).
- ISO 14040:2006; Environmental Management—Life Cycle Assessment—Principles and Framework. ISO: Geneva, Switzerland, 2006.
- Reuters. Elon Musk: 10 Billion Humanoid Robots by 2040 at $20K–$25K Each. 29 October 2024. Available online: https://www.reuters.com/technology/elon-musk-10-billion-humanoid-robots-by-2040-20k-25k-each-2024-10-29/ (accessed on 29 September 2025).
- Altman, S. The Gentle Singularity. 2025. Available online: https://blog.samaltman.com/the-gentle-singularity (accessed on 5 August 2025).
- Mikołajczyk, T.; Mikołajewski, D.; Kłodowski, A.; Łukaszewicz, A.; Mikołajewska, E.; Paczkowski, T.; Macko, M.; Skornia, M. Energy Sources of Mobile Robot Power Systems: A Systematic Review and Comparison of Efficiency. Appl. Sci. 2023, 13, 7547. [Google Scholar] [CrossRef]
- Hurst, J. Building Robots That Can Go Where We Go. IEEE Spectrum. 2019. Available online: https://spectrum.ieee.org/building-robots-that-can-go-where-we-go (accessed on 5 August 2025).
- Koetsier, J. Tesla Bot Optimus: Everything We Know So Far. Forbes. 2022. Available online: https://www.forbes.com/sites/johnkoetsier/2022/10/01/tesla-bot-optimus-everything-we-know-so-far/ (accessed on 5 August 2025).
- IEA. Renewables 2024—Analysis and Forecast to 2030; IEA: Paris, France, 2024. [Google Scholar]
- Mehos, M.; Turchi, C.; Vidal, J.; Wagner, M.; Ma, Z.; Ho, C.; Kolb, W.; Andraka, C.; Kruizenga, A. Concentrating Solar Power Gen3 Demonstration Roadmap; National Renewable Energy Lab. (NREL): Golden, CO, USA, 2017. [Google Scholar]
- Mirletz, B.; Vimmerstedt, L.; Avery, G.; Sekar, A.; Stright, D.; Akindipe, D.; Cohen, S.; Cole, W.; Duffy, P.; Eberle, A. Annual Technology Baseline: The 2024 Electricity Update; National Renewable Energy Laboratory (NREL): Golden, CO, USA, 2024. [Google Scholar]
- Ho, C.K.; Albrecht, K.J.; Yue, L.; Mills, B.; Sment, J.; Christian, J.; Carlson, M. Overview and design basis for the Gen 3 Particle Pilot Plant (G3P3). AIP Conf. Proc. 2020, 2303, 030020. [Google Scholar] [CrossRef]
- Ho, C.K.; Sment, J.; Albrecht, K.; Mills, B.; Schroeder, N.; Laubscher, H.; Gonzalez-Portillo, L.F.; Libby, C.; Pye, J.; Gan, P.G. Gen 3 Particle Pilot Plant (G3P3)—High-Temperature Particle System for Concentrating Solar Power (Phases 1 and 2); Sandia National Lab.(SNL-NM): Albuquerque, NM, USA, 2021. [Google Scholar]
- Laubscher, H.F.; Maldonado, L.G.; Alvarez, F.; McLaughlin, L.P.; Schroeder, N.R.; Albrecht, K.J.; Sment, J.N.; Plewe, K.E. Controls and Operational Strategy for Gen 3 Particle Pilot Plant. In Proceedings of the ASME 2023 17th International Conference on Energy Sustainability, Long Beach, CA, USA, 10–12 July 2023; ASME: New York, NY, USA, 2023. Paper No. ES2023-123601. p. V001T005A011. [Google Scholar] [CrossRef]
- McClure, M.W. Preliminary Analysis of Results from the Utah FORGE Project. In Proceedings of the 50th Workshop on Geothermal Reservoir Engineering (WGR 50), Stanford, CA, USA, 10–12 February 2025; Stanford University: Stanford, CA, USA, 2025. SGP-TR-227. Available online: https://pangea.stanford.edu/ERE/db/GeoConf/papers/SGW/2025/Mcclure.pdf (accessed on 29 September 2025).
- Randolph, J.B.; Saar, M.O. Coupling carbon dioxide sequestration with geothermal energy capture in naturally permeable, porous geologic formations: Implications for CO2 sequestration. Energy Procedia 2011, 4, 2206–2213. [Google Scholar] [CrossRef]
- Adams, B.M.; Kuehn, T.H.; Bielicki, J.M.; Randolph, J.B.; Saar, M.O. A comparison of electric power output of CO2 Plume Geothermal (CPG) and brine geothermal systems for varying reservoir conditions. Appl. Energy 2015, 140, 365–377. [Google Scholar] [CrossRef]
- DiPippo, R. Geothermal power plants: Evolution and performance assessments. Geothermics 2015, 53, 291–307. [Google Scholar] [CrossRef]
- Green, M.A.; Dunlop, E.D.; Yoshita, M.; Kopidakis, N.; Bothe, K.; Siefer, G.; Hao, X.; Jiang, J.Y. Solar cell efficiency tables (version 66). Prog. Photovolt. 2025, 33, 795–810. [Google Scholar] [CrossRef]
- National Renewable Energy Laboratory (NREL). Best Research-Cell Efficiency Chart. Available online: https://www.nrel.gov/pv/cell-efficiency.html (accessed on 28 June 2025).
- Zhang, D.; Li, D.; Hu, Y.; Mei, A.; Han, H. Degradation pathways in perovskite solar cells and how to meet international standards. Commun. Mater. 2022, 3, 58. [Google Scholar] [CrossRef]
- Torrence, C.E.; Libby, C.S.; Nie, W.; Stein, J.S. Environmental and Health Risks of Perovskite Solar Modules: Case for Better Test Standards and Risk Mitigation Solutions. iScience 2023, 26, 105807. [Google Scholar] [CrossRef] [PubMed]
- Bansal, N.K.; Mishra, S.; Dixit, H.; Porwal, S.; Singh, P.; Singh, T. Machine learning in perovskite solar cells: Recent developments and future perspectives. Energy Technol. 2023, 11, 2300735. [Google Scholar] [CrossRef]
- Cherubini, A.; Papini, A.; Vertechy, R.; Fontana, M. Airborne Wind Energy Systems: A review of the technologies. Renew. Sustain. Energy Rev. 2015, 51, 1461–1476. [Google Scholar] [CrossRef]
- Walter, M.G.; Warren, E.L.; McKone, J.R.; Boettcher, S.W.; Mi, Q.; Santori, E.A.; Lewis, N.S. Solar water splitting cells. Chem. Rev. 2010, 110, 6446–6473. [Google Scholar] [CrossRef]
- Zhang, B.; Sun, L. Artificial photosynthesis: Opportunities and challenges of molecular catalysts. Chem. Soc. Rev. 2019, 48, 2216–2264. [Google Scholar] [CrossRef]
- Herzog, F.; Kutz, T.; Stemmle, M.; Kugel, T. Cooling unit for the AmpaCity project–One year successful operation. Cryogenics 2016, 80, 204–209. [Google Scholar] [CrossRef]
- Brunton, G.; Wonterghem, B.B. National ignition facility update. In Proceedings of the 2023 NIF User Group Meeting, Livermore, CA, USA, 21–23 February 2023. [Google Scholar]
- Kappatou, A.; Baruzzo, M.; Hakola, A.; Joffrin, E.; Keeling, D.; Labit, B.; Tsitrone, E.; Vianello, N.; Wischmeier, M.; Balboa, I. Overview of the third JET deuterium-tritium campaign. Plasma Phys. Control Fusion. 2025, 67, 045039. [Google Scholar] [CrossRef]
- Wesson, J.; Campbell, D.J. Tokamaks; Oxford University Press: Oxford, UK, 2011; Volume 149. [Google Scholar]
- Helander, P.; Sigmar, D.J. Collisional transport in magnetized plasmas; Cambridge University Press: Cambridge, UK, 2005; Volume 4. [Google Scholar]
- Lindl, J. Development of the indirect-drive approach to inertial confinement fusion and the target physics basis for ignition and gain. Phys. Plasmas 1995, 2, 3933–4024. [Google Scholar] [CrossRef]
- Slutz, S.A.; Vesey, R.A. High-gain magnetized inertial fusion. Phys. Rev. Lett. 2012, 108, 025003. [Google Scholar] [CrossRef]
- Rodgers, E.; Sotudeh, J.; Mullins, C.; Hernandez, A.; Gertsen, E.; Joseph, N.; Le, H.; Smith, P. Space based solar power. In Proceedings of the AIAA Aviation Forum and Ascend 2024, Las Vegas, NV, USA, 29 July–2 August 2024; p. 4944. [Google Scholar]
- Mankins, J. The Case for Space Solar Power; Virginia Edition Publishing: Houston, TX, USA, 2014. [Google Scholar]
- Glaser, P.E. An overview of the solar power satellite option. IEEE Trans. Microw. Theory Technol. 2002, 40, 1230–1238. [Google Scholar] [CrossRef]
- Wang, C.; Wang, Y.; Lian, P.; Xue, S.; Xu, Q.; Shi, Y.; Jia, Y.; Du, B.; Liu, J.; Tang, B. Space phased array antenna developments: A perspective on structural design. IEEE Aerosp. Electron. Syst. Mag. 2020, 35, 44–63. [Google Scholar] [CrossRef]
- Surender, D.; Khan, T.; Talukdar, F.A.; Antar, Y.M. Rectenna design and development strategies for wireless applications: A review. IEEE Antennas Propag. Mag. 2021, 64, 16–29. [Google Scholar] [CrossRef]
- LaPotin, A.; Schulte, K.L.; Steiner, M.A.; Buznitsky, K.; Kelsall, C.C.; Friedman, D.J.; Tervo, E.J.; France, R.M.; Young, M.R.; Rohskopf, A. Thermophotovoltaic efficiency of 40%. Nature 2022, 604, 287–291. [Google Scholar] [CrossRef]
- Pearce, R.; Pink, T. Drilling for Superhot Geothermal Energy: A Technology Gap Analysis; Cascade Institute: Victoria, BC, Canada, 2024. [Google Scholar]
- Kayukawa, N. Open-cycle magnetohydrodynamic electrical power generation: A review and future perspectives. Prog. Energy Combust. Sci. 2004, 30, 33–60. [Google Scholar] [CrossRef]
- Lin, S.; Wang, Z.; Wang, L.; Elimelech, M. Salinity gradient energy is not a competitive source of renewable energy. Joule 2024, 8, 334–343. [Google Scholar] [CrossRef]
- Raitt, D. Space Elevator Architectures. Quest 2021, 28, 17–26. [Google Scholar]
- National Renewable Energy Laboratory. Concentrating solar power | Electricity | 2024 Annual Technology Baseline (ATB). 2024. Available online: https://atb.nrel.gov/electricity/2024/concentrating_solar_power (accessed on 5 August 2025).
- National Renewable Energy Laboratory. Geothermal | Electricity | 2024 Annual Technology Baseline (ATB). 2025. Available online: https://atb.nrel.gov/electricity/2024/geothermal (accessed on 5 August 2025).
- Electric Power Research Institute. Summary report: Technical analysis and assessment of resilient technologies for the electric grid: High-temperature superconductivity. 2017. Available online: https://restservice.epri.com/publicdownload/000000003002011527/0/Product (accessed on 5 August 2025).
- Cordell, J.J.; Woodhouse, M.; Warren, E.L. Technoeconomic analysis of perovskite/silicon tandem solar modules. Joule 2025, 9, 101781. [Google Scholar] [CrossRef]


Disclaimer/Publisher’s Note: The statements, opinions and data contained in all publications are solely those of the individual author(s) and contributor(s) and not of MDPI and/or the editor(s). MDPI and/or the editor(s) disclaim responsibility for any injury to people or property resulting from any ideas, methods, instructions or products referred to in the content. |
© 2025 by the author. Licensee MDPI, Basel, Switzerland. This article is an open access article distributed under the terms and conditions of the Creative Commons Attribution (CC BY) license (https://creativecommons.org/licenses/by/4.0/).