Article

Evaluating the Risk of Population Exposure and Socio-Cultural Shifts in Ethnic Tibetan Areas Under Future Extreme Climate Change

1
School of Foreign Languages, Yunnan University, Kunming 650500, China
2
Key Laboratory of Atmospheric Environment and Processes in Boundary Layer in the Low-Latitude Plateau Region, Department of Atmospheric Science, School of Earth Science, Yunnan University, Kunming 650500, China
3
Department of Atmospheric and Oceanic Sciences, University of Colorado Boulder, Boulder, CO 80303, USA
*
Author to whom correspondence should be addressed.
Sustainability 2025, 17(21), 9437; https://doi.org/10.3390/su17219437
Submission received: 18 September 2025 / Revised: 18 October 2025 / Accepted: 20 October 2025 / Published: 23 October 2025
(This article belongs to the Section Air, Climate Change and Sustainability)

Abstract

Under global warming, the frequency and intensity of extreme climate events have markedly increased. As one of the most climate-sensitive and ecologically fragile regions in the world, the Tibetan Plateau faces mounting environmental and demographic challenges. This study integrates multi-model ensemble simulations from the Coupled Model Intercomparison Project Phase 6 (CMIP6) with population projection data from the Shared Socioeconomic Pathways (SSPs) under the high-emission scenario (SSP5-8.5). Three extreme climate indices—very wet days precipitation (R95p), warm days (TX90p), and consecutive dry days (CDDs)—were analyzed to assess future changes in climate extremes (2021–2100) and their relationships with demographic dynamics across Tibetan ethnic areas. The results indicate that, under high-emission conditions, both R95p and TX90p increase significantly, while CDDs slightly decreases, though drought risks remain pronounced in central regions. Over the same period, the total population is projected to decline by nearly 60%, with substantial differences in climate risk exposure across groups: working-age adults and less-educated individuals experience the highest exposure before mid-century, followed by a decline, whereas the elderly and highly educated populations will show continuously increasing exposure, stabilizing by the end of the century. The transformation of population patterns is reshaping socio-cultural structures, highlighting the need for culturally adaptive governance to ensure the sustainability of Tibetan ethnic communities. These findings enhance our understanding of the coupled interactions among climate change, population dynamics, and cultural transitions, providing a scientific basis for integrated adaptation strategies to promote sustainable development across the Tibetan Plateau.

1. Introduction

Over the past century, the warming of global land, atmosphere, and oceans has been unprecedented and is unequivocally driven by human activities [1]. Global surface temperature was 1.09 [0.95 to 1.20] °C higher in 2011–2020 than 1850–1900 [1]. During this period, climate change induced by anthropogenic activities has altered precipitation patterns across more than 75% of the global land area [2]. The increasing frequency and intensity of extreme weather events—such as heatwaves, heavy rainfall, droughts, and floods—are well-documented consequences of global warming [3,4,5]. These extremes increasingly threaten agricultural production, ecosystem stability, socioeconomic development, and public health worldwide [6,7,8,9]. Addressing climate change and adapting to its impacts have thus become urgent global priorities. In this context, this study focuses on the Tibetan Plateau, aiming to explore the relationship between extreme climate events and population dynamics under future warming scenarios.
A major societal consequence of climate change is the rise in involuntary migration driven by environmental stress. An increasing number of studies have employed demographic and econometric approaches to examine the short- to medium-term impacts of climate variability on human mobility [10,11,12]. The environmental migration framework [13] elucidates the complex linkages among environmental shocks, social vulnerability, institutional constraints, and migration trends, providing a theoretical basis for understanding the mechanisms through which climate change drives population movements. Existing evidence consistently indicates that climate change is reshaping global population patterns, particularly in regions characterized by high agricultural dependence, weak infrastructure, and pronounced social vulnerability [14,15]. In such regions, extreme droughts often lead to crop failure and drinking water shortages, forcing rural populations to migrate toward urban centers or ecologically more favorable areas [16]. Similarly, recurrent floods—such as those in Pakistan—have destroyed settlements and infrastructure, resulting in large-scale temporary or permanent displacement [17]. Meanwhile, the continued rise in global sea level poses a long-term threat to low-lying coastal zones, with projections suggesting that by the end of this century, more than one billion people living in coastal regions could be affected, triggering extensive forced migration [18].
As one of the most climate-sensitive regions in the world, the Tibetan Plateau (TP) is warming at approximately twice the global average rate. This accelerated warming has profound implications for regional ecosystems and may perturb the climate system across Asia and beyond [19,20]. The rapid retreat of glaciers and permafrost thaw are already transforming water resources, agricultural productivity, and ecosystem stability [21,22]. Meanwhile, the frequency and intensity of extreme climatic events—including droughts, heatwaves, and heavy rainfall—have markedly increased across the Plateau [23,24,25]. Severe droughts exacerbate water scarcity and grassland degradation, undermining pastoral livelihoods and threatening traditional nomadic systems [26], whereas intensified rainfall and flooding accelerate soil erosion, agricultural loss, and environmental degradation [27].
Under sustained climatic and environmental pressures, the human–environment relationship on the Tibetan Plateau has undergone profound transformation. Population density across the Plateau remains extremely low and spatially uneven—vast northern areas are nearly uninhabited, accounting for roughly 14% of the total area—while population growth is primarily concentrated in the eastern and southern parts of Qinghai Province and the central–eastern valleys of Tibet [28]. In recent decades, urbanization has accelerated markedly along valley corridors, with the rate of urban land expansion surpassing that of population growth in many regions, forming distinct spatial agglomeration patterns [29]. According to the Lhasa Municipal Bureau of Statistics, the city’s permanent population increased by 55.14% between 2010 and 2021, highlighting Lhasa’s strong centripetal role in regional urbanization. Distinct differences exist between the alpine pastoral zones and the valley agricultural regions in terms of economic structure, ecological carrying capacity, and climate vulnerability. Studies have shown that the overall ecosystem vulnerability of the Tibetan Plateau ranges from severe to very severe, exhibiting a clear spatial gradient—ecosystem vulnerability index (EVI) values increase gradually from the southeast to the northwest, with environmental factors exerting a stronger influence than socioeconomic variables [30]. This pronounced climate change directly amplifies the inherent climate sensitivity of livelihood systems in the mountainous plateau environment. In alpine pastoral areas, traditional animal husbandry remains highly dependent on grassland ecosystems, where shifts in temperature and precipitation patterns, along with extreme events such as snow disasters, directly impact forage yield and quality, thereby threatening livestock survival. Similarly, in agricultural valleys, farming activities are profoundly affected by changing thermal conditions and altered spatiotemporal distribution of water resources. Facing intensifying climatic and ecological pressures, a growing number of herders are being compelled to abandon their unsustainable subsistence pastoralism, transitioning instead to settled lifestyles and alternative livelihoods. This shift has generated spontaneous migration flows directly driven by climatic and environmental changes [31]. Overall, the intertwined processes of climate warming, ecological vulnerability, and population redistribution have created a complex coupled system, profoundly influencing the socio-ecological evolution and sustainable development trajectory of the Tibetan Plateau.
Despite extensive research on either climate change or population dynamics, systematic investigations of the coupled evolution of climate and population—along with their ethnic socio-cultural feedbacks—remain limited for the Tibetan Plateau, a region highly sensitive to both climatic and anthropogenic influences. This study integrates multi-model ensemble outputs from the Coupled Model Intercomparison Project Phase 6 (CMIP6) and population projections under the high-emission Shared Socioeconomic Pathway (SSP5-8.5). We quantitatively assess future spatiotemporal variations in extreme climate events and demographic changes, and explore the coupled responses of different age and education groups under extreme climate scenarios and their associated socio-cultural implications. By elucidating these linkages, the study provides a novel perspective on the intertwined evolution of climate, population, and culture, offering a scientific foundation for climate adaptation strategies and sustainable development in high-altitude regions.

2. Data and Methods

2.1. Data Description

This study employed a set of temperature- and precipitation-related extreme climate indices, as defined by the Expert Team on Climate Change Detection and Indices (ETCCDI), to analyze the spatiotemporal characteristics of extreme climate events in the Tibetan region from 2021 to 2100. These indices were derived from Coupled Model Intercomparison Project Phase 6 (CMIP6) simulations. We selected eight models under the high-emission scenario SSP5-8.5 (using the r1i1p1f1 realization) for analysis. Given the relatively small spatial scale of the study area, models from various modeling centers worldwide were chosen, with priority given to those with higher spatial resolution to minimize errors during interpolation. Detailed model information is provided in Table 1. The data were obtained from the Copernicus Climate Change Service at: https://cds.climate.copernicus.eu (accessed on 8 October 2024).
The population projection data used in this study were obtained from a publicly available dataset published in Scientific Data [32]. This dataset provides provincial-level population projections for China under five Shared Socioeconomic Pathways (SSPs) from 2010 to 2100, disaggregated by sex, age, and educational attainment, and includes gridded population maps at 1 km spatial resolution. The projections were generated using a recursive multidimensional cohort-component model, based on the 2010 national census as the baseline. Population structure was simulated year by year, incorporating urbanization rates to estimate the urban-rural split, and ultimately producing spatially explicit population distributions. The dataset has been widely used in climate impact assessments, health risk analysis, socioeconomic policy planning, and resource allocation studies, and serves as the foundational demographic input for this research.
The projection model incorporates several key socioeconomic driving factors: (1) fertility rate (TFR) assumptions based on each SSP scenario; (2) mortality rate (LE) assumptions reflecting healthcare and public health improvements; (3) education progression rate (PR) indicating the transition probabilities to higher education levels; (4) interprovincial migration rates, defined by regional economic disparities and policy trends; and (5) urbanization trajectories, modeled using sigmoid functions to estimate future urbanization levels for each province. Urban and rural populations are further differentiated spatially using urban land use fractions and allocated to high-resolution grids.
It is important to note that the population projection model does not explicitly incorporate climate variables as drivers. Therefore, in this study, exposure to climate risk is assessed by spatially overlaying future population distributions with projected climate scenarios, rather than simulating population responses to climate stressors. Under the SSP5-8.5 scenario adopted in this study, the projections assume a development pathway characterized by rapid economic growth, strong technological advancement, and high fossil fuel consumption. Fertility remains low, mortality declines rapidly due to improvements in healthcare, higher education expands significantly, interprovincial migration intensifies, and urbanization progresses quickly. The resulting population distribution provides a representative view of future demographic trends in Tibet under a high-emission scenario, offering a robust foundation for subsequent climate exposure analyses. The population projection data can be accessed at: https://doi.org/10.6084/m9.figshare.c.4605713 (accessed on 10 March 2025).

2.2. Description of Methods

To comprehensively analyze the impacts of future extreme climate change on population dynamics and social vulnerability, this study established an integrated analytical framework comprising three core components: climate feature analysis, statistical correlation analysis, and exposure assessment. Specifically, the framework (1) analyzes the spatiotemporal variations in extreme high temperature (Warm Days Index, TX90p), extreme precipitation (Very Wet Days Precipitation, R95p), extreme drought (Consecutive Dry Days, CDD), and population distribution; (2) quantitatively evaluates the statistical relationships between future extreme climate events and population changes; and (3) assesses population exposure across different age and educational groups to identify the differentiated risks faced by various social groups under future extreme climate scenarios.
The extreme climate indices (TX90p, R95p, and CDD) used in this study follow the standard definitions established by the Expert Team on Climate Change Detection and Indices (ETCCDI) [33,34], which have been widely employed to quantify changes in temperature and precipitation extremes in global and regional climate assessments.
The primary variables and their corresponding measurement units used in this study are summarized in Table 2.
To ensure the comparability and consistency among different climate model datasets, all model outputs were resampled to a uniform spatial resolution of 0.1° × 0.1° using bilinear interpolation. Bilinear interpolation is a commonly used method for resampling gridded data. It estimates the value at a target location by taking a weighted average of the four surrounding grid points, with the weights determined by the relative distances along the longitudinal (x) and latitudinal (y) directions. This method enables smooth and continuous spatial transitions and is well-suited for aligning datasets with different spatial resolutions [35]. After temporal alignment and unit standardization, multi-model ensemble averaging was applied to reduce random errors and enhance the robustness of the results. This approach is a well-established statistical technique widely employed in climate modeling and projection studies to extract the common climate signal shared among multiple models and to improve the reliability of future scenario analyses [36].
x ¯ = 1 N i = 1 N x i
where xi represents the output of the i-th model, and N is the total number of models, which is 8 in this study.
To quantitatively examine the relationship between future extreme climate change and population dynamics, this study employed the non-parametric Spearman’s rank correlation coefficient (ρ) to assess the monotonic association between the two variables. This method does not require the data to follow a normal distribution and is particularly suitable for identifying potential nonlinear relationships between extreme climate indices and population variations. A two-tailed significance test with a confidence level of α = 0.05 was applied to determine the statistical significance of the correlation.
In this study, population exposure was adopted as a key analytical metric to capture the combined effects of population distribution and climate hazard intensity, thereby reflecting the potential risk levels under future climate change. The exposure was quantified as the product of population and hazard intensity, providing an integrated measure of the overall impact of extreme climate events on human populations across different spatial and temporal scales [37], as expressed by the following equation.
E i , t = P i , t × H i , t
where Ei,t denotes the population exposure in region i at time t, Pi,t represents the population size in region i at time t, and Hi,t indicates the intensity of the climate hazard factor (such as R95p, TX90p, or CDD) in the same region and time period.

3. Results

3.1. Time Series of Extreme Climate and Population in the Tibetan Region

To reveal the evolving characteristics of population and extreme climate under climate change in the Tibetan region, this study adopted the high-emission scenario SSP5-8.5 to analyze trends in extreme climate indices and population changes between 2021 and 2100. The extreme climate indicators—R95p, TX90p, and CDD—are presented as solid lines in the figures. To quantify the trends of these extreme climate events, a linear regression model was fitted to the annual data, with the regression results depicted as dashed lines. The slopes of the trends were calculated to assess the rate of change in extreme events over time, thereby elucidating future changes in extreme climate and population dynamics.
During the period from 2021 to 2100, the Tibetan region exhibited a significant increasing trend in R95p (Figure 1a), with a slope of 2.852. By the end of the century (2100), R95p had increased by 111.13% compared to its 2021 level (Table 3), indicating a rise in the frequency of extreme precipitation events. This increase heightens the risk of flooding, posing challenges to ecosystems, agricultural production, and infrastructure security. Similarly, TX90p showed a significant upward trend (Figure 1b), with a slope of 0.751. By 2100, TX90p had increased by 332.12% relative to 2021 (Table 3), suggesting a substantial rise in the frequency of extreme high-temperature events. This trend is expected to accelerate glacier melt, disrupt the spatiotemporal distribution of water resources, and have profound impacts on the ecological environment and human health. In contrast, CDD displayed a slight decreasing trend (Figure 1c), with a slope of −0.076. By 2100, CDD had decreased by 19.88% compared to 2021, indicating a potential alleviation of drought conditions, possibly associated with increased extreme precipitation and enhanced regional water cycle intensity. However, the population showed a pronounced declining trend (Figure 1d), with a slope of −0.028. It is projected that by 2100, the population will have decreased by 58.85% compared to 2021 (Table 3), suggesting sustained population loss in the Tibetan region. This demographic trend may be attributed to intensified extreme climate conditions in high-altitude areas, deteriorating living environments, limited economic development, and out-migration to lower-altitude or more climatically suitable regions.
In summary, future climate change in the Tibetan region is characterized by a significant increase in the frequency and intensity of extreme precipitation and high-temperature events. Although drought conditions may moderate, the exacerbation of extreme weather events is likely to have far-reaching implications for ecosystems, socioeconomic structures, and population distribution patterns.

3.2. Spatial Distribution of Extreme Climate and Population Changes in the Tibetan Region

3.2.1. Population

Under the SSP5–8.5 high-emission scenario, the spatial and temporal characteristics of population distribution in the Tibetan region were analyzed for three periods: the early (2021–2040), mid (2041–2060), and late (2081–2100) stages (Figure 2a–c). The population exhibits a pronounced spatial concentration, following a clear “dense-south and sparse-north” pattern. High population density is mainly concentrated in the southeastern valley regions, particularly along the Yarlung Tsangpo River and its tributaries, where the terrain is relatively gentle, elevation is lower, and hydrothermal conditions are favorable. In contrast, the western and northern high-altitude areas (e.g., Ngari and Nagqu) are sparsely populated due to harsh environmental constraints. This “south-dense and north-sparse, valley-concentrated” distribution pattern is closely related to the plateau’s complex topography, climatic conditions, and human habitat suitability [28,38]. Temporally, the population within Tibet’s settlement areas shows an overall trend of “increase followed by decline.” In the mid period, population concentration in the southeastern valleys intensifies slightly, and the inhabited area expands marginally, whereas in the late period, total population decreases, but the overall spatial configuration remains stable, with most inhabitants still concentrated in the southeastern valleys.

3.2.2. Extreme Precipitation

After ensemble averaging of eight high-resolution models, the spatial and temporal characteristics of extreme precipitation in the Tibetan region under the SSP5-8.5 high-emission scenario were illustrated for three periods: the early (2021–2040), mid (2041–2060), and late (2081–2100) stages (Figure 3a–c). A significant increasing trend in R95p was observed across the region, peaking in the late period. Spatially, R95p values were higher in the southeast and lower in the northwest. During the early and mid periods, the northern areas exhibited slower growth rates, whereas by the late period, R95p values in the southern region exceeded 800 mm. The spatial extent of extreme precipitation events expanded markedly, exposing larger areas to high-intensity rainfall and heightening regional climate risks.
To quantitatively analyze the relationship between future R95p and population changes across Tibet, data were uniformly interpolated to a 0.1° × 0.1° spatial resolution using bilinear interpolation. Spearman’s rank correlation analysis was then conducted between R95p and population data at each grid cell to reveal the spatial characteristics of their temporal correlation.
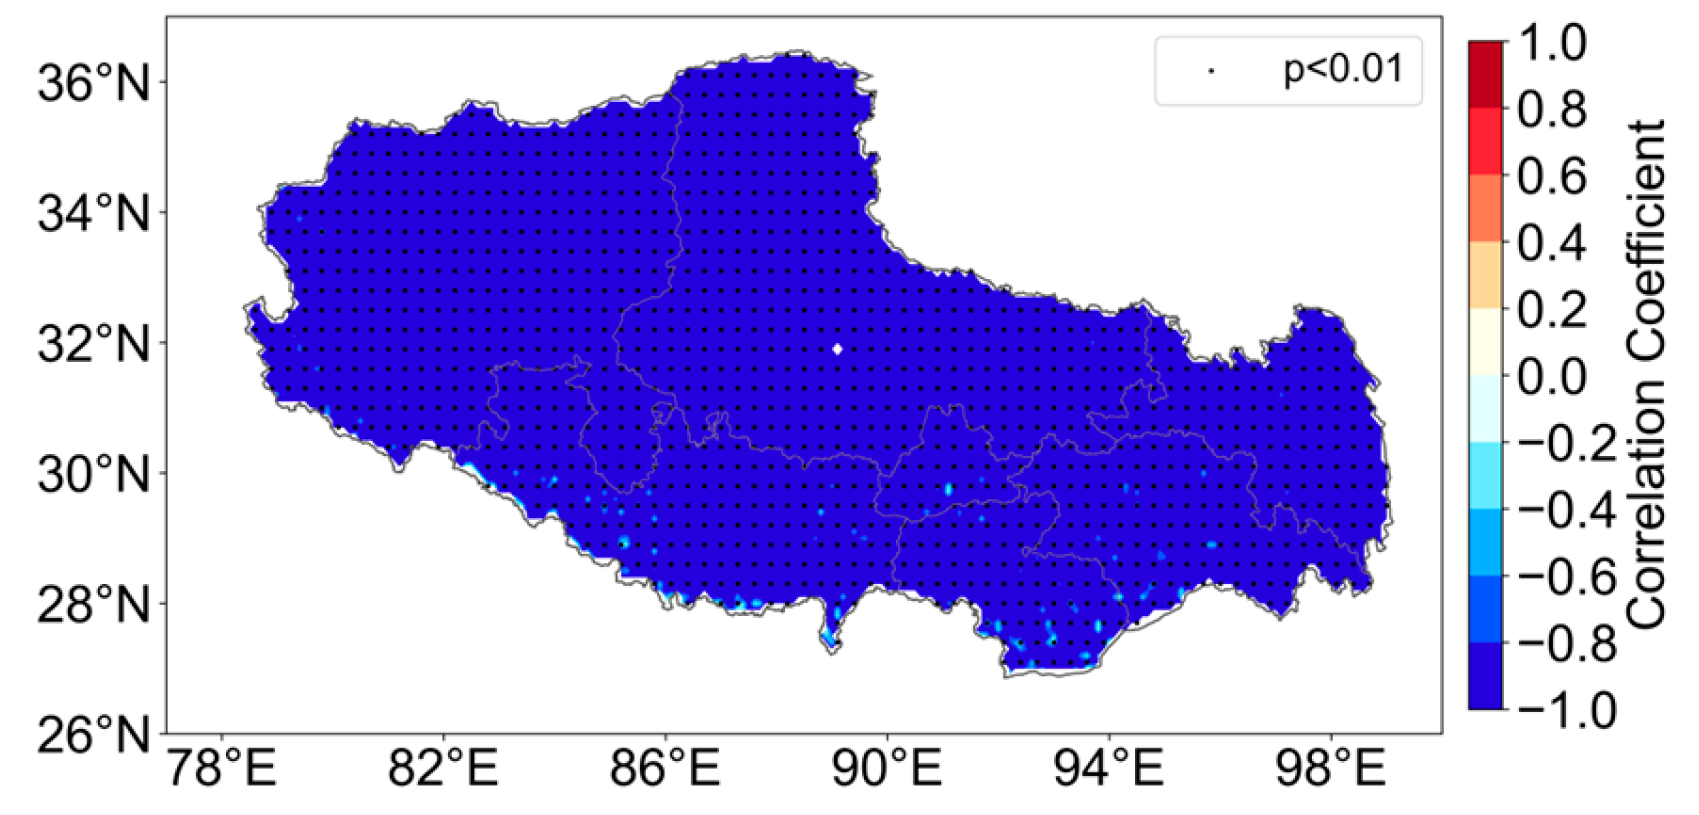
Under the high-emission scenario (SSP5–8.5) (Figure 4), a statistically significant and strong negative correlation is observed between future extreme precipitation intensity (R95p) and population across the Tibetan region, with overall correlation coefficients ranging from −0.8 to −1.0 (p < 0.01). In the more densely populated southeastern areas, the coefficients range between −0.4 and −0.8, indicating a moderate-to-strong negative relationship, whereas the correlation is even stronger in sparsely populated rural regions. Given the ecological fragility of Tibet, intensified extreme precipitation may lead to agricultural yield reduction and diminished livelihood security, thereby indirectly promoting population mobility and reshaping demographic patterns. This finding is consistent with previous evidence that rainfall shocks can influence migration decisions by altering livelihood conditions [39].

3.2.3. Extreme High Temperature

Under the SSP5-8.5 scenario (Figure 5a–c), TX90p showed a pronounced increasing trend across Tibet. During the early period, TX90p values were relatively low, with most regions experiencing extreme heat days on 10–30% of days annually. By the mid-period, TX90p values had risen significantly, particularly in eastern and southwestern regions, where the frequency of extreme heat events increased to 30–50% of days. In the late period, TX90p increased substantially, exceeding 70% across most areas, and even surpassing 80% in parts of the east and southwest, indicating more frequent extreme heat events.
The same bilinear interpolation and Spearman’s correlation methods were used to examine the relationship between TX90p and population. Under the high-emission scenario (SSP5–8.5) (Figure 6), TX90p and population in the Tibetan region exhibit a statistically significant strong negative correlation, with coefficients ranging from −0.8 to −1.0 (p < 0.01). In Tibet, the increasing frequency of extreme heat events may suppress population growth by undermining public health, agricultural productivity, and water security, thereby reducing local livability—particularly in areas with high heat exposure or climatic sensitivity. This finding is consistent with previous empirical evidence showing that temperature increases significantly raise the probability of out-migration and stimulate both international and rural-to-urban migration in middle-income countries [40,41].

3.2.4. Extreme Drought

Under the SSP5-8.5 scenario (Figure 7), the spatial distribution of consecutive dry days (CDD) in Tibet showed significant heterogeneity, with an overall decreasing trend over time. Areas with high CDD values were concentrated in central Tibet, where drought duration persisted for over 70 days annually, indicating severe arid conditions. In contrast, the southeastern region, with relatively abundant precipitation, had lower CDD values of only 20–35 days. Over time, CDD decreased across most of Tibet, suggesting increased precipitation and shortened drought duration. By the end of the century, the extent of areas with CDD > 70 days in central Tibet had noticeably reduced, though drought challenges remained severe in these regions.
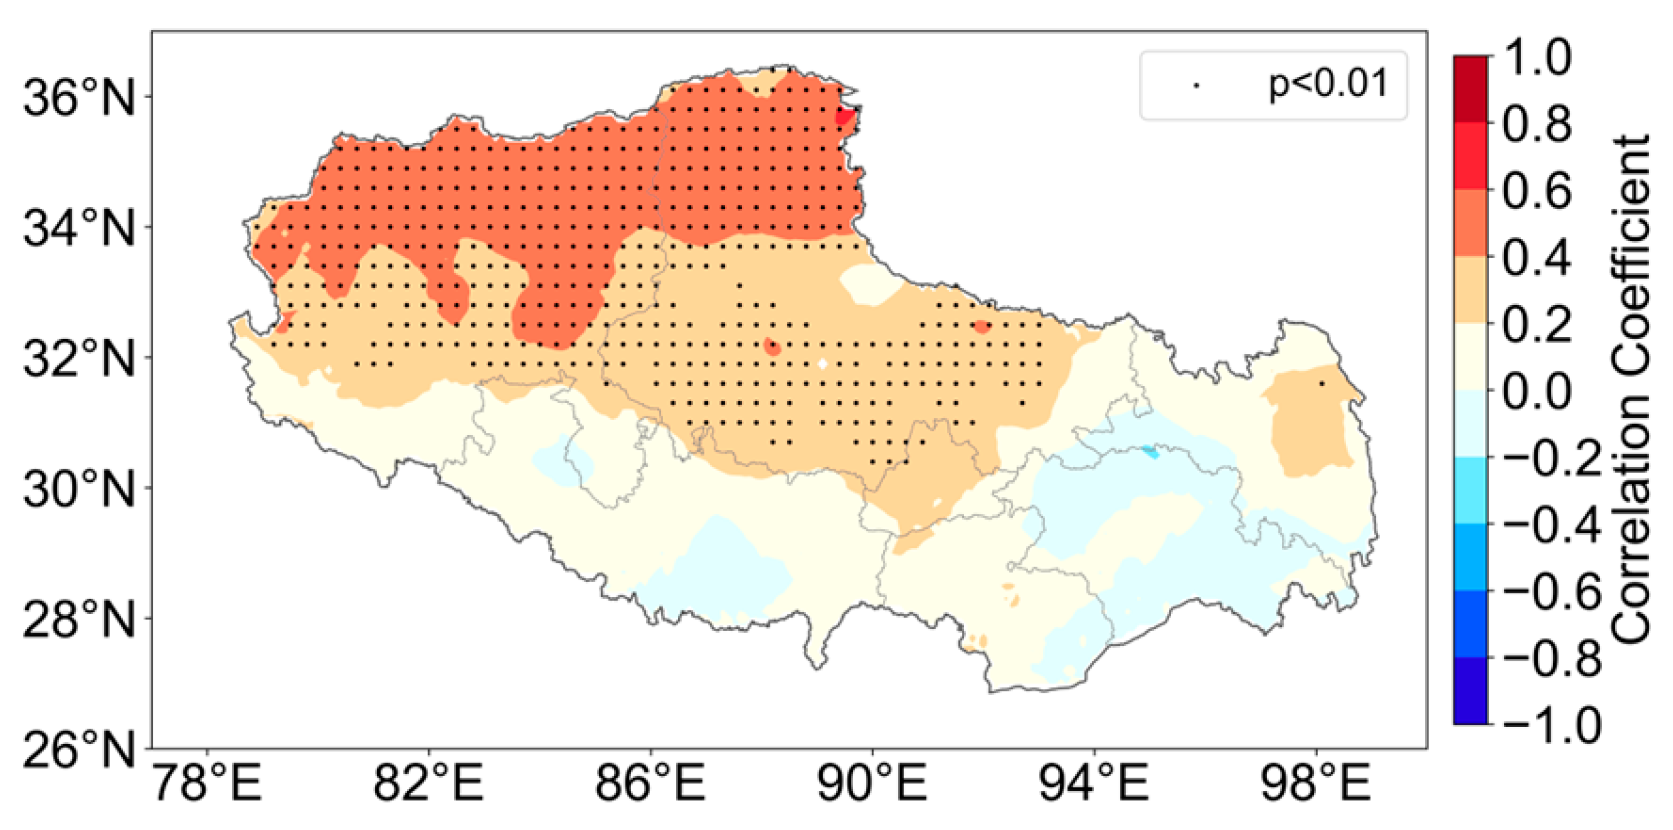
The correlation between CDD and population was analyzed using the same spatial interpolation and statistical methods. Under the SSP5-8.5 scenario (Figure 8), a significant positive correlation between CDD and population was observed in northern and central Tibet. The correlation coefficients ranged from 0.4 to 0.6 in the north and 0.2 to 0.4 in the central region (p < 0.01). Although drought conditions have somewhat alleviated, the continued population decline in these areas may be attributed to non-climatic factors such as ecological vulnerability, limited economic opportunities, and inadequate infrastructure, which outweigh the benefits of improved climatic livability. In contrast, in the more densely populated southeastern region, no significant correlation was found between CDD and population, likely due to relatively stable precipitation conditions, lower drought severity, and limited variation in CDD, which together minimize its direct influence on population distribution patterns.

3.3. Exposure of Different Demographic Groups to Extreme Climate Risks

From 2021 to 2100, the exposure of different age groups to extreme climate events in Tibet exhibited pronounced temporal variations (Figure 9). Here, exposure is defined as the product of population (persons) and the intensity of extreme climate indices—R95p (mm), TX90p (%), and CDD (days)—representing the population-weighted magnitude of climate hazards. The middle-aged and working-age population (15–64 years) reached peak exposure to both R95p and TX90p around 2040, followed by a gradual decline, with fitted slopes of −4.94 × 10⁶ persons·mm yr−1 and −1.48 × 10⁵ persons·% yr−1, respectively. In contrast, exposure to CDD showed a continuous decreasing trend (−1.56 × 10⁶ persons·days yr−1), likely linked to an average annual net out-migration of approximately 30,900 working-age individuals. The youth group (0–14 years) experienced declining exposure across all three indices, with slopes of −1.53 × 10⁶ persons·mm yr−1 for R95p, −1.35 × 10⁵ persons·% yr−1 for TX90p, and −3.55 × 10⁵ persons·days yr−1 for CDD, reflecting both reduced fertility rates and family migration. In contrast, the elderly population (≥65 years) showed persistent increases in exposure, with slopes of +5.28 × 10⁶ persons·mm yr−1, +1.00 × 10⁶ persons·% yr−1, and +4.40 × 10⁵ persons·days yr−1, stabilizing after approximately 2080. This pattern highlights the combined effects of population aging and the “left-behind” phenomenon. Overall, migration is reshaping the intergenerational distribution of climate risk by altering population age structure. Although the out-migration of the working-age population may moderately reduce total exposure, risks are increasingly concentrated among the elderly, thereby amplifying social vulnerability and adaptive pressure in the Tibetan region.
Between 2021 and 2100, the exposure of populations with different educational attainment levels to extreme climate events in Tibet exhibited distinct temporal patterns, jointly shaped by demographic transitions and migration dynamics (Figure 10). Here, exposure refers to the product of population (persons) and the intensity of extreme climate indices—R95p (mm), TX90p (%), and CDD (days)—representing the population-weighted magnitude of climate hazards. At the beginning of the century, the low-education group (illiterate, primary, and junior high school) bore the highest exposure, with fitted slopes of −6.95 × 10⁶ persons·mm yr−1 for R95p, −4.55 × 10⁵ persons·% yr−1 for TX90p, and −1.84 × 10⁶ persons·days yr−1 for CDD. Although their exposure began to decline around 2040, this group remained the primary bearer of climate risk during the first half of the century, largely due to population decline (approximately −36,900 persons yr−1) and sustained labor outmigration. The medium-education group (high school and vocational college) displayed relatively stable exposure levels, with slight increases in R95p (+1.47 × 10⁶ persons·mm yr−1) and TX90p (+3.67 × 10⁵ persons·% yr−1) and a minor decrease in CDD (−5.89 × 10³ persons·days yr−1), while total population size remained nearly constant (+592 persons yr−1). In contrast, the high-education group (bachelor’s degree and above) showed continuous and substantial increases in exposure across all three indices (R95p: +4.10 × 10⁶ persons·mm yr−1; TX90p: +7.77 × 10⁵ persons·% yr−1; CDD: +3.45 × 10⁵ persons·days yr−1), stabilizing toward the late 21st century. This upward trend can be attributed to expanding educational attainment and the influx of highly educated individuals into urbanized and economically developed areas. Overall, while the low-education population remains the principal bearer of climate risk during the first half of the century, the burden gradually shifts toward the high-education group as educational levels improve and demographic structures evolve. These findings underscore the need for future adaptation policies to not only mitigate the vulnerabilities of low-education populations but also address the emerging exposure and adaptive challenges faced by highly educated groups in the context of a changing climate.

3.4. Socio-Cultural Implications of Climate and Demographic Change in Tibet

The population projections analyzed in this study are based on socioeconomic and demographic drivers—including fertility, mortality, education, interprovincial migration, and urbanization—but do not explicitly include climate variables. Therefore, the results should be interpreted as coexistence patterns between demographic evolution and climate risk exposure, rather than causal evidence of climate-induced migration.
Different social groups exhibit heterogeneous exposure to extreme climate risks. In the early 21st century, working-age adults and individuals with lower education levels bear the highest exposure, whereas in later decades, exposure increases substantially among elderly and highly educated groups. This shift implies that holders of traditional knowledge—mainly the elderly—are more likely to remain in high-risk areas [42], while those capable of relocation face cultural adaptation challenges, jointly weakening overall cultural resilience.
Historically, Tibetan ethnic societies have been shaped by agriculture and pastoralism, forming closely connected kinship and territorial networks. As climate extremes intensify, some residents—especially working-age adults—may relocate from pastoral and agricultural zones to urban or agriculturally favorable regions. However, such movements are primarily socioeconomic adaptations rather than direct climatic responses. Consequently, rural depopulation and aging may weaken traditional livelihoods and threaten the continuity of intangible ethnic cultural heritage—such as agricultural rituals, pastoral customs, and folk festivals—closely linked to land, religion, and seasonal rhythms [43].
At the same time, urbanization and resettlement promote economic growth but may accelerate cultural homogenization. Migrants entering multi-ethnic urban environments often encounter strong mainstream influences, particularly among younger generations, leading to diminished ethnic language use, erosion of traditional clothing and dietary customs, and fluid identity perceptions [44]. Although ecological migration and rural revitalization policies have improved livelihoods, their limited cultural sensitivity may inadvertently weaken migrants’ cultural agency and heritage awareness [45].
To achieve sustainable and culturally inclusive adaptation, future policies should integrate cultural protection within migration governance. Community-based participatory planning can ensure that cultural and religious facilities—such as heritage workshops and ethnic language classrooms—are incorporated into resettlement site design. Moreover, livelihood and cultural adaptation programs—such as vocational training that includes traditional handicrafts and the promotion of eco-cultural tourism—can strengthen both economic resilience and cultural continuity in a changing climate among migrant populations. Promoting a culture-sensitive approach to climate governance is essential for maintaining the sustainability of Tibetan socio-cultural systems.

4. Discussion

This study analyzed the relationship between extreme climate characteristics and population changes in the Tibetan region based on ensemble-averaged extreme climate indices from eight CMIP6 models and population data under Shared Socioeconomic Pathways (SSPs). The results indicate significant increases in the frequency and intensity of R95p and TX90p events, consistent with the findings of the IPCC Sixth Assessment Report (AR6), which concluded that extreme climate events have increased markedly worldwide and are projected to intensify further under continued global warming [1]. This trend poses ongoing challenges to ecosystem stability and human habitability.
Against the backdrop of global warming, the surface warming rate of the Tibetan Plateau is significantly higher than the global average, leading to an increasing trend in extreme precipitation events [46,47]. Meanwhile, the continued retreat of the cryosphere—such as accelerated glacier melt and reduced snow cover—has markedly altered regional energy budgets and balance processes, amplifying the frequency of extreme high-temperature events [48]. In addition, increased instability in the East Asian monsoon, westerlies, and South Asian monsoon systems has exacerbated interannual climate variability, thereby elevating the risk of extreme droughts and floods across the Tibetan Plateau [49,50]. Although the consecutive dry days (CDDs) index shows an overall decreasing trend, likely due to enhanced precipitation intensity and regional water cycle activity [19,51], certain parts of the central and northern regions still experience prolonged drought conditions, indicating that local drought risks remain non-negligible.
Against this backdrop, profound transformations have occurred in the population patterns and socio-demographic structure of Tibet. In the densely populated southeastern region, strong negative correlations between R95p, TX90p, and population change suggest that intensified climatic extremes may have diminished regional livability and, to some extent, shaped localized migration dynamics. Conversely, in several central and northern areas, a positive association between CDD and population implies that the alleviation of drought conditions may have facilitated population retention. Nevertheless, the combined influences of ecosystem degradation, land use constraints, and persistent climatic stress are likely to lead to continued and spatially heterogeneous population migration across the region.
Climate change has increasingly been recognized as a key driver of human mobility, with environmental stressors influencing migration through multifaceted socio-economic and institutional pathways. In agriculturally dependent drylands—such as those in Southern Europe, South Asia, Africa, and South America—drought and aridity have been identified as major triggers of internal migration [52]. Moreover, rising temperatures, recurrent droughts, and frequent floods can indirectly shape migration patterns by undermining livelihoods and interacting with governance capacity and developmental inequality [53]. At the global scale, migration dynamics are jointly governed by climatic and economic gradients, with low-latitude and low-income countries facing stronger outward migration pressures under high-warming scenarios [54]. Empirical evidence further shows that drought events during the growing season substantially increase migration from Central America to the United States, primarily due to agricultural yield loss as a direct driver [55]. Similarly, in the Peruvian Andes, climate-induced vulnerability among smallholder farmers is deeply intertwined with multi-scalar power relations, market access, and policy bias, underscoring the socio-political inequalities underlying both climate adaptation and migration [56].
However, migration is not solely determined by natural factors; it is also profoundly influenced by socioeconomic development levels, infrastructure capacity, policy orientation, and governance systems [57,58]. On the one hand, economically developed or well-infrastructured regions possess stronger climate adaptation capacities and can mitigate climate impacts through engineering measures and social support systems, thereby slowing migration trends. On the other hand, national strategies and regional policies (e.g., ecological migration, rural revitalization, and plateau urban development plans) may also guide population redistribution to some extent, and may even mask or alter the effects of climatic factors.

5. Conclusions

Based on multi-model ensemble simulations from the Coupled Model Intercomparison Project Phase 6 (CMIP6) and population projection data under Shared Socioeconomic Pathways (SSPs), this study analyzed future extreme climate events and their relationship with demographic changes in the Tibetan region. The main conclusions are as follows:
(1) Under a high-emission scenario, R95p and TX90p in the Tibetan region increased by 111.13% and 332.12%, respectively, indicating a substantial rise in the frequency and intensity of extreme climate events; although CDD decreased by 19.88%, drought risks remained high in central regions.
(2) By 2100, the population of the Tibetan region is projected to decline by 58.85%.
(3) R95p and TX90p showed significant negative correlations with population change, indicating that regions experiencing more frequent extreme precipitation and heat events tended to experience population decline. CDDs exhibited a positive correlation with population change in some arid regions, suggesting that although drought conditions have slightly alleviated, regional livability has not substantially improved, and population decline continues.
(4) Climate risk exposure across age and education dimensions in Tibet exhibited significant differences: working-age adults and low-education groups faced the highest risks in the first half of the century, which gradually declined thereafter; in contrast, exposure among the elderly and highly educated groups continued to increase, stabilizing in the late 21st century.
This study demonstrates that total population in the Tibetan ethnic region is significantly correlated with the spatiotemporal evolution of extreme climate events. It should be emphasized that this correlation does not imply a direct causal relationship; rather, it reflects the long-term interaction between climatic exposure and social vulnerability. The study further highlights that population movement plays an important role in driving socio-cultural transformation, underscoring the need for culturally adaptive governance to enhance the sustainability of Tibetan communities and their cultural systems. These findings deepen the understanding of the multidimensional linkages among climate, population, and culture, and provide a scientific foundation for developing regional adaptation strategies that integrate demographic scale, structural change, and cultural preservation. It should be noted that the population projections used in this study are primarily driven by socioeconomic and demographic factors—including fertility, mortality, educational attainment, interprovincial migration rates, and urbanization processes—without explicitly incorporating climatic variables as dynamic drivers. Future research should integrate climate exposure and livelihood risk assessments into population projection frameworks to more comprehensively elucidate how climatic stressors and socioeconomic processes jointly shape population evolution, migration behavior, and cultural resilience in high-altitude and other climate-sensitive regions.

Author Contributions

J.C. and B.C. developed the idea. J.C., X.Z., B.C., T.L. and G.L. performed the analysis. J.C. and B.C. drafted the manuscript. All authors have read and agreed to the published version of the manuscript.

Funding

This work was supported by the National Natural Science Foundation of China (No. 42175046), Key Fund Project of Basic Research of Yunnan Province (No. 202501AS070065), and the National Scientific and Technological Infrastructure “Earth System Numerical Simulation Facility” (https://cstr.cn/31134.02.EL, accessed on 19 October 2025).

Institutional Review Board Statement

Not applicable.

Informed Consent Statement

Not applicable.

Data Availability Statement

The data from eight models (r1i1p1f1 test members) under the SSP5-8.5 scenario are available at https://cds.climate.copernicus.eu (accessed on 19 October 2025); the future population distribution patterns in Yunnan Province using global 1 km resolution population data under the SSP5-8.5 scenario can be freely accessed at https://doi.org/10.6084/m9.figshare.c.4605713 (accessed on 19 October 2025).

Conflicts of Interest

The authors declare no competing interests.

References

  1. IPCC. Climate Change 2021: The Physical Science Basis. Contribution of Working Group I to the Sixth Assessment Report of the Intergovernmental Panel on Climate Change; Masson-Delmotte, V., Zhai, P., Pirani, A., Connors, S.L., Péan, C., Berger, S., Caud, N., Chen, Y., Goldfarb, L., Gomis, M.I., et al., Eds.; Cambridge University Press: Cambridge, UK; New York, NY, USA, 2021; in press. [Google Scholar] [CrossRef]
  2. Zhang, W.; Zhou, T.; Wu, P.; Song, L.; Cao, L. Anthropogenic amplification of precipitation variability over the past century. Science 2024, 385, 427–432. [Google Scholar] [CrossRef] [PubMed]
  3. IPCC. Climate Change 2013: The Physical Science Basis. Contribution of Working Group I to the Fifth Assessment Report of the Intergovernmental Panel on Climate Change; Stocker, T.F., Qin, D., Plattner, G.-K., Tignor, M., Allen, S.K., Boschung, J., Nauels, A., Xia, Y., Bex, V., Midgley, P.M., Eds.; Cambridge University Press: Cambridge, UK; New York, NY, USA, 2013; p. 1535. [Google Scholar] [CrossRef]
  4. Stott, P.A.; Stone, D.A.; Allen, M.R. Human contribution to the European heatwave of 2003. Nature 2004, 432, 610–614. [Google Scholar] [CrossRef] [PubMed]
  5. Raymond, C.; Matthews, T.; Horton, R.M. The emergence of heat and humidity too severe for human tolerance. Sci. Adv. 2020, 6, eaaw1838. [Google Scholar] [CrossRef]
  6. Saleem, A.; Anwar, S.; Nawaz, T.; Fahad, S.; Saud, S.; Rahman, T.; Khan, M.; Nawaz, T. Securing a sustainable future: The climate change threat to agriculture, food security, and sustainable development goals. J. Umm Al-Qura Univ. Appl. Sci. 2025, 11, 595–611. [Google Scholar] [CrossRef]
  7. Shao, H.; Zhang, Y.; Gu, F.; Shi, C.; Miao, N.; Liu, S. Impacts of climate extremes on ecosystem metrics in southwest China. Sci. Total Environ. 2021, 776, 145979. [Google Scholar] [CrossRef]
  8. Frame, D.J.; Rosier, S.M.; Noy, I.; Harrington, L.J.; Carey-Smith, T.; Sparrow, S.N.; Stone, D.A.; Dean, S.M. Climate change attribution and the economic costs of extreme weather events: A study on damages from extreme rainfall and drought. Clim. Change 2020, 162, 781–797. [Google Scholar] [CrossRef]
  9. Bell, J.E.; Brown, C.L.; Conlon, K.; Herring, S.; Kunkel, K.E.; Lawrimore, J.; Luber, G.; Schreck, C.; Smith, A.; Uejio, C. Changes in extreme events and the potential impacts on human health. J. Air Waste Manag. Assoc. 2018, 68, 265–287. [Google Scholar] [CrossRef]
  10. Gray, C.; Wise, E. Country-specific effects of climate variability on human migration. Clim. Change 2016, 135, 555–568. [Google Scholar] [CrossRef]
  11. Marchiori, L.; Maystadt, J.F.; Schumacher, I. The impact of weather anomalies on migration in sub-Saharan Africa. J. Environ. Econ. Manag. 2012, 63, 355–374. [Google Scholar] [CrossRef]
  12. Hunter, L.M.; Murray, S.; Riosmena, F. Rainfall patterns and U.S. migration from rural Mexico. Int. Migr. Rev. 2013, 47, 874–909. [Google Scholar] [CrossRef]
  13. Black, R.; Adger, W.N.; Arnell, N.W.; Dercon, S.; Geddes, A.; Thomas, D. The effect of environmental change on human migration. Glob. Environ. Change 2011, 21, S3–S11. [Google Scholar] [CrossRef]
  14. García-Hernández, C. Disaster, demographics, and vulnerability: Interrogating the long-term effects of an extreme weather event. Geogr. Res. 2022, 60, 549–562. [Google Scholar] [CrossRef]
  15. Gu, X.; Chen, P.; Fan, C. Socio-demographic inequalities in the impacts of extreme temperatures on population mobility. J. Transp. Geogr. 2024, 114, 103755. [Google Scholar] [CrossRef]
  16. Hermans, K.; McLeman, R. Climate change, drought, land degradation and migration: Exploring the linkages. Curr. Opin. Environ. Sustain. 2021, 50, 236–244. [Google Scholar] [CrossRef]
  17. Kamal, A. Climate, floods, and migration in Pakistan. Int. Migr. 2023, 61, 349–352. [Google Scholar] [CrossRef]
  18. Hauer, M.E.; Fussell, E.; Mueller, V.; Burkett, M.; Call, M.; Abel, K.; Wrathall, D. Sea-level rise and human migration. Nat. Rev. Earth Environ. 2020, 1, 28–39. [Google Scholar] [CrossRef]
  19. Yao, T.; Bolch, T.; Chen, D.; Gao, J.; Immerzeel, W.; Piao, S.; Su, F.; Thompson, L.; Wada, Y.; Wang, L.; et al. The imbalance of the Asian water tower. Nat. Rev. Earth Environ. 2022, 3, 618–632. [Google Scholar] [CrossRef]
  20. Sun, Y.; Hu, T.; Zhang, X. Anthropogenic influence on altitudinally amplified temperature change in the Tibetan Plateau. Environ. Res. Lett. 2024, 19, 054012. [Google Scholar] [CrossRef]
  21. Yao, T.; Xue, Y.; Chen, D.; Chen, F.; Thompson, L.; Cui, P.; Koike, T.; Lau, W.K.-M.; Lettenmaier, D.; Mosbrugger, V.; et al. Recent Third Pole’s rapid warming accompanies cryospheric melt and water cycle intensification and interactions between monsoon and environment. Bull. Am. Meteorol. Soc. 2019, 100, 423–444. [Google Scholar] [CrossRef]
  22. Yang, M.; Wang, X.; Pang, G.; Wan, G.; Liu, Z. The Tibetan Plateau cryosphere: Observations and model simulations for current status and recent changes. Earth-Sci. Rev. 2019, 190, 353–369. [Google Scholar] [CrossRef]
  23. Ding, J.; Cuo, L.; Zhang, Y.; Zhang, C.; Liang, L.; Liu, Z. Annual and seasonal precipitation and their extremes over the Tibetan Plateau and its surroundings during 1963–2015. Atmosphere 2021, 12, 620. [Google Scholar] [CrossRef]
  24. Zhang, J.; Zhao, T.; Zhou, L.; Ran, L. Historical changes and future projections of extreme temperature and precipitation along the Sichuan–Tibet Railway. J. Meteorol. Res. 2021, 35, 402–415. [Google Scholar] [CrossRef]
  25. Liu, L.; Gou, X.; Wang, X.; Yang, M.; Wei, S.; Pang, G.; Qie, L.; Li, Y.; Wang, Q.; Wang, T.; et al. Increases in extreme climatic events over the northeastern Tibetan Plateau and their association with atmospheric circulation changes. Atmos. Res. 2024, 304, 107410. [Google Scholar] [CrossRef]
  26. Huang, K.; Zhang, Y.; Zhu, J.; Liu, Y.; Zu, J.; Zhang, J. The influences of climate change and human activities on vegetation dynamics in the Qinghai–Tibet Plateau. Remote Sens. 2016, 8, 876. [Google Scholar] [CrossRef]
  27. Zhao, W.; Cheng, Y.; Jian, J.; Jiao, J.; Cheng, C.; Li, J.; Chen, T. Water erosion changes on the Qinghai–Tibet Plateau and its response to climate variability and human activities during 1982–2015. Catena 2023, 229, 107207. [Google Scholar] [CrossRef]
  28. Li, L.; Zhang, Y.; Liu, L.; Wang, Z.; Zhang, H.; Li, S.; Ding, M. Mapping changing population distribution on the Qinghai–Tibet Plateau since 2000 with multi-temporal remote sensing and point-of-interest data. Remote Sens. 2020, 12, 4059. [Google Scholar] [CrossRef]
  29. Yin, C.; Zhu, A.L.; Zhou, Q.; Meng, F.; Chen, R.; Liu, F.; Chen, Q.; Guo, X. Rapid urban expansion and potential disaster risk on the Qinghai–Tibetan Plateau in the 21st century. Landsc. Ecol. 2024, 39, 35. [Google Scholar] [CrossRef]
  30. Li, H.; Song, W. Spatiotemporal distribution and influencing factors of ecosystem vulnerability on the Qinghai–Tibet Plateau. Int. J. Environ. Res. Public Health 2021, 18, 6508. [Google Scholar] [CrossRef]
  31. Næss, M.W. Climate change, risk management and the end of nomadic pastoralism. Int. J. Sustain. Dev. World Ecol. 2013, 20, 123–133. [Google Scholar] [CrossRef]
  32. Chen, Y.; Guo, F.; Wang, J.; Cai, W.; Wang, C.; Wang, K. Provincial and gridded population projection for China under shared socioeconomic pathways from 2010 to 2100. Sci. Data 2020, 7, 83. [Google Scholar] [CrossRef]
  33. Klein Tank, A.M.G.; Zwiers, F.W.; Zhang, X. Guidelines on Analysis of Extremes in a Changing Climate in Support of Informed Decisions for Adaptation; Technical Report WCDMP No. 72, WMO-TD No. 1500; World Meteorological Organization: Geneva, Switzerland, 2009. [Google Scholar]
  34. Zhang, X.; Alexander, L.; Hegerl, G.C.; Jones, P.; Klein Tank, A.; Peterson, T.C.; Trewin, B.; Zwiers, F.W. Indices for monitoring changes in extremes based on daily temperature and precipitation data. Wiley Interdiscip. Rev. Clim. Change 2011, 2, 851–870. [Google Scholar] [CrossRef]
  35. Wilby, R.L.; Wigley, T.M.L. Downscaling general circulation model output: A review of methods and limitations. Prog. Phys. Geogr. 1997, 21, 530–548. [Google Scholar] [CrossRef]
  36. Tebaldi, C.; Knutti, R. The use of the multi-model ensemble in probabilistic climate projections. Philos. Trans. R. Soc. A Math. Phys. Eng. Sci. 2007, 365, 2053–2075. [Google Scholar] [CrossRef]
  37. Lange, S.; Volkholz, J.; Geiger, T.; Zhao, F.; Vega, I.; Veldkamp, T.; Reyer, C.P.O.; Warszawski, L.; Huber, V.; Jägermeyr, J.; et al. Projecting exposure to extreme climate impact events across six event categories and three spatial scales. Earth’s Future 2020, 8, e2020EF001616. [Google Scholar] [CrossRef]
  38. Zhang, H.; Fu, J.; Li, F.; Chen, Q.; Ye, T.; Zhang, Y.; Yang, X. Fine-scale population mapping on the Tibetan Plateau using ensemble machine learning methods and multisource data. Ecol. Indic. 2024, 166, 112307. [Google Scholar] [CrossRef]
  39. Gray, C.L.; Mueller, V. Natural disasters and population mobility in Bangladesh. Proc. Natl. Acad. Sci. USA 2012, 109, 6000–6005. [Google Scholar] [CrossRef] [PubMed]
  40. Cattaneo, C.; Peri, G. The migration response to increasing temperatures. J. Dev. Econ. 2016, 122, 127–146. [Google Scholar] [CrossRef]
  41. Bohra-Mishra, P.; Oppenheimer, M.; Hsiang, S.M. Nonlinear permanent migration response to climatic variations but minimal response to disasters. Proc. Natl. Acad. Sci. USA 2014, 111, 9780–9785. [Google Scholar] [CrossRef]
  42. Li, J.; Han, F. Strong ethics and flexible actions: The properties of traditional ecological knowledge (TEK) as key resources for socio-ecological resilience to the impacts of climate change—A case study of Baojiatun, Yunnan–Guizhou Plateau karst area, southwest China. Ecol. Soc. 2022, 27, 31. [Google Scholar] [CrossRef]
  43. Liu, Y.; Song, Y. The role of Chinese folk ritual music in biodiversity conservation: An ethnobiological perspective from the Lingnan region. J. Ethnobiol. Ethnomed. 2025, 21, 6. [Google Scholar] [CrossRef]
  44. Gordon, A.E.; Ogbu, A.I. Endangered identity: Causes and consequences of dialects’ extinction in Nigeria. Int. J. Res. Innov. Soc. Sci. 2025, 9, 1449–1457. [Google Scholar] [CrossRef]
  45. Yang, Y. Integrating cultural heritage into climate displacement law: The Carteret islanders case. Int. Environ. Agreements Polit. Law Econ. 2025. [Google Scholar] [CrossRef]
  46. You, Q.; Wu, F.; Shen, L.; Pepin, N.; Jiang, Z.; Kang, S. Tibetan Plateau amplification of climate extremes under global warming of 1.5 °C, 2 °C and 3 °C. Glob. Planet. Change 2020, 192, 103261. [Google Scholar] [CrossRef]
  47. Ma, M.; Tang, J.; Ou, T.; Chen, D. Subdaily extreme precipitation and its linkage to global warming over the Tibetan Plateau. J. Geophys. Res. Atmos. 2023, 128, e2023JD039062. [Google Scholar] [CrossRef]
  48. Kang, S.; Xu, Y.; You, Q.; Flügel, W.A.; Pepin, N.; Yao, T. Focus on climate change on the Tibetan Plateau. Environ. Res. Lett. 2010, 5, 015101. [Google Scholar] [CrossRef]
  49. Zhang, C.; Tang, Q.; Chen, D.; van der Ent, R.J.; Liu, X.; Li, W.; Haile, G.G. Moisture Source Changes Contributed to Different Precipitation Changes over the Northern and Southern Tibetan Plateau. J. Hydrometeorol. 2019, 20, 217–229. [Google Scholar] [CrossRef]
  50. Liu, R.; Wang, X.; Wang, Z. Atmospheric moisture sources of drought and wet events during 1979–2019 in the Three-River Source Region, Qinghai–Tibetan Plateau. Theor. Appl. Climatol. 2022, 149, 487–499. [Google Scholar] [CrossRef]
  51. Guo, X.; Tian, L. Spatial Patterns and Possible Mechanisms of Precipitation Changes in Recent Decades over and around the Tibetan Plateau in the Context of Intense Warming and Weakening Winds. Clim. Dyn. 2022, 59, 2081–2102. [Google Scholar] [CrossRef]
  52. Hoffmann, R.; Abel, G.; Malpede, M.; Muttarak, R.; Percoco, M. Drought and aridity influence internal migration worldwide. Nat. Clim. Change 2024, 14, 1245–1253. [Google Scholar] [CrossRef]
  53. Almulhim, A.I.; Alverio, G.N.; Sharifi, A.; Shaw, R.; Huq, S.; Mahmud, M.J.; Ahmad, S.; Abubakar, I.R. Climate-Induced Migration in the Global South: An In-Depth Analysis. Npj Clim. Action 2024, 3, 47. [Google Scholar] [CrossRef]
  54. Yang, X.; Chen, D.; Wahab, I.; Burman, A. Evidence of Climate and Economic Drivers Affecting Migration in an Unequal and Warming World. Commun. Earth Environ. 2025, 6, 782. [Google Scholar] [CrossRef]
  55. Linke, A.; Leutert, S.; Busby, J.; Duque, M.; Shawcroft, M.; Brewer, S. Dry growing seasons predicted Central American migration to the US from 2012 to 2018. Sci. Rep. 2023, 13, 18400. [Google Scholar] [CrossRef]
  56. Paerregaard, K. Adaptive Migration: Climate Change, Climate Migration, and Climate Adaptation in Peru’s Highlands Communities. Iberoam. Nord. J. Lat. Am. Caribb. Stud. 2024, 53, 20–30. [Google Scholar] [CrossRef]
  57. Burzyński, M.; Deuster, C.; Docquier, F.; de Melo, J. Climate Change, Inequality, and Human Migration. J. Eur. Econ. Assoc. 2022, 20, 1145–1197. [Google Scholar] [CrossRef]
  58. Łukaniszyn-Domaszewska, K.; Mazur-Włodarczyk, K.; Łukaniszyn, M. Unveiling the Interrelations Between Migration, Climate Change, and Energy Transitions in the Context of Socioeconomic Disparities. Energies 2025, 18, 1625. [Google Scholar] [CrossRef]
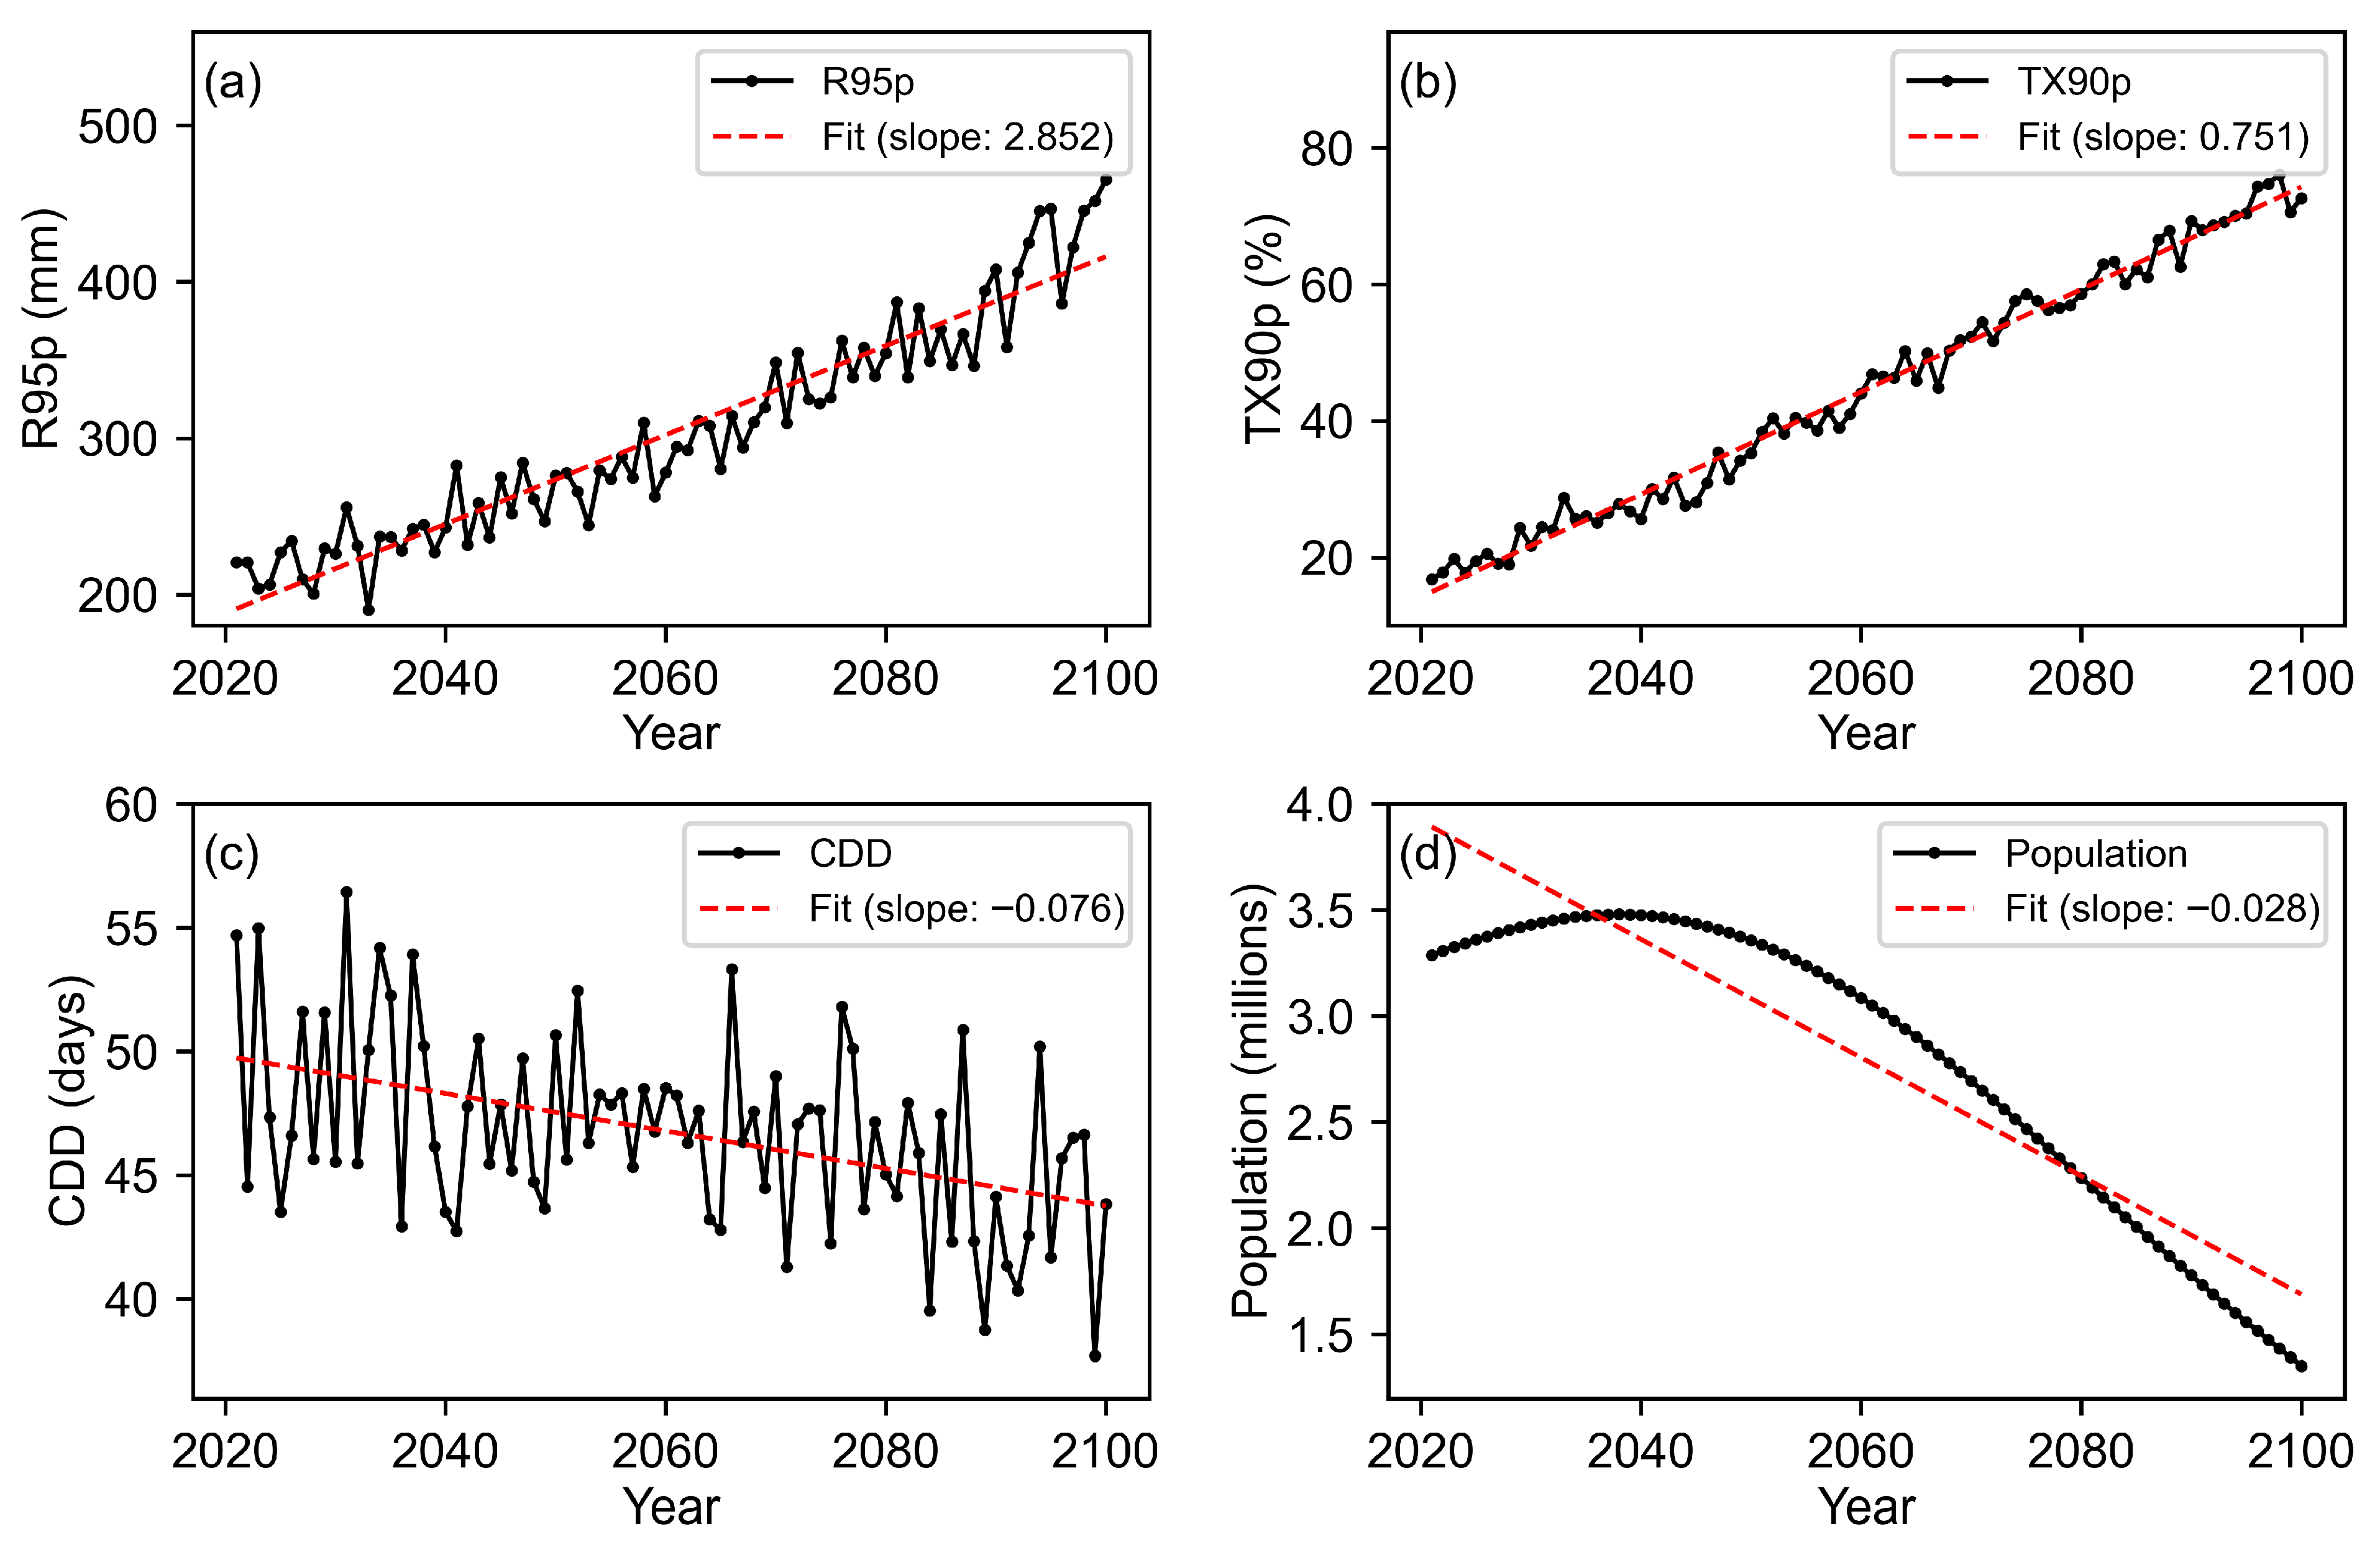
Figure 1. Trends and fitted analyses of extreme climate indices and population in the Tibet region, (a) R95p, (b) TX90p, (c) CDD, (d) Population (unit: million persons).
Sustainability 17 09437 g001
Figure 2. Spatial distribution of population in the Tibet region under the SSP5–8.5 high-emission scenario. (a) 2021–2040, (b) 2041–2060, (c) 2081–2100 (Unit: persons).
Sustainability 17 09437 g002
Figure 3. Spatial distribution and projected trends of future R95p in the Tibet region. (a) 2021–2040, (b) 2041–2060, (c) 2081–2100 (Unit: mm).
Sustainability 17 09437 g003
Figure 4. Spatial distribution of Spearman’s rank correlation between future R95p and population in Tibet. Dotted areas indicate statistical significance at p < 0.01.
Sustainability 17 09437 g004
Figure 5. Spatial distribution and trends of future TX90p in the Tibet region: (a) 2021–2040, (b) 2041–2060, (c) 2081–2100 (Unit: %).
Sustainability 17 09437 g005
Figure 6. Spatial distribution of Spearman’s rank correlation between future TX90p and population in the Tibet region. Dotted areas indicate statistical significance at p < 0.01.
Sustainability 17 09437 g006
Figure 7. Spatial distribution and projected trends of future CDD in the Tibet region. (a) 2021–2040, (b) 2041–2060, (c) 2081–2100 (Unit: days).
Sustainability 17 09437 g007
Figure 8. Spatial distribution of Spearman’s rank correlation between future CDD and population in the Tibet region. Dotted areas indicate statistical significance at p < 0.01.
Sustainability 17 09437 g008
Figure 9. Trends in population exposure to extreme climate events across different age groups in Tibet from 2021 to 2100. (a) Exposure to R95p; (b) Exposure to TX90p; (c) Exposure to CDD; (d) Population size of each age group. The vertical axis in panels (ac) represents population exposure, defined as the product of population (persons) and the corresponding climate index (R95p in mm, TX90p in %, and CDD in days), with units of persons·mm, persons·%, and persons·days, respectively. Panel (d) shows total population (million persons). Age groups are indicated by blue (youth), green (middle-aged), and orange (elderly). In panels (ac), solid lines represent exposure values calculated from population by age group and climate indices, whereas in panel (d), solid lines represent the total population of each age group. Dashed lines indicate the fitted linear trends over the study period.
Sustainability 17 09437 g009
Figure 10. Trends in population exposure to extreme climate events across different education levels in Tibet from 2021 to 2100. (a) Exposure to R95p; (b) Exposure to TX90p; (c) Exposure to CDD; (d) Population size for each education level. The vertical axis in panels (ac) represents population exposure, expressed as the product of population (persons) and the respective climate index (R95p in mm, TX90p in %, and CDD in days). Panel (d) shows total population (million persons). Educational groups are represented by blue (low education), green (medium education), and orange (high education). In panels (ac), solid lines represent exposure values calculated from population by education level and climate indices, whereas in panel (d), solid lines represent the total population of each education group. Dashed lines indicate the fitted linear trends over the study period.
Sustainability 17 09437 g010
Table 1. CMIP6 models employed in this study.
ModelCountry/Region of OriginHorizontal Resolution (Latitudinal × Longitudinal)
BCC-CSM2-MRChina1.125° × 1.125°
EC-Earth3Europe0.7031° × 0.7031°
GFDL-ESM4United States1.25° × 1°
INM-CM5-0Russia2° × 1.5°
MIROC6Japan1.40625° × 1.40625°
MPI-ESM1-2-HRGermany0.9375° × 0.9375°
MRI-ESM2-0Japan1.125° × 1.125°
NorESM2-MMNorway1.25° × 0.9375°
Table 2. Definitions and measurement units of primary variables used in this study.
Variable (Full Name)DefinitionUnit
TX90p
(Warm Days Index)
Percentage of days when the daily maximum temperature exceeds the 90th percentile of the reference period (1981–2010), representing the frequency of extremely warm days.%
R95p
(Very Wet Days Precipitation)
Annual total precipitation from days when daily precipitation exceeds the 95th percentile of the reference period (1981–2010), indicating the intensity of very wet days.mm
CDD
(Consecutive Dry Days)
Maximum number of consecutive days in a year with daily precipitation less than 1 mm, reflecting drought persistence.days
P
(Population)
Total population within each grid or region at year t.persons
Table 3. Comparison of Changes in Extreme Climate Indices and Population in the Tibet Region from 2021 to 2100.
Indicator (Unit)20212100Change Rate (%)
R95p (mm)220.46465.45111.13
TX90p (%)16.8172.64332.12
CDD (days)54.7143.83−19.88
Population (million persons)3.291.35−58.85
Disclaimer/Publisher’s Note: The statements, opinions and data contained in all publications are solely those of the individual author(s) and contributor(s) and not of MDPI and/or the editor(s). MDPI and/or the editor(s) disclaim responsibility for any injury to people or property resulting from any ideas, methods, instructions or products referred to in the content.