Abstract
Traditional multi-criteria decision-making (MCDM) methods face problems in sustainable product design evaluation, including weak semantic expression, single weight modeling, and insufficient ranking robustness. To address these issues, this paper proposes an evaluation framework based on Trapezoidal Intuitionistic Fuzzy (TrIF), named TrIF-DEC, which integrates Decision-Making Trial and Evaluation Laboratory (DEMATEL), Entropy, and Combined Compromise Solution (CoCoSo). Firstly, design criteria across four dimensions—social, economic, technological, and environmental—are identified based on sustainability considerations. Then, TrIF is used to capture the fuzziness and hesitation in expert judgments. The DEMATEL and Entropy methods are combined to extract causal relationships between criteria and quantify data variation, enabling the collaborative weighting of subjective and objective factors. Finally, multi-strategy integrated ranking is performed through TrIF-CoCoSo to enhance decision stability. An empirical case study on nursing bed design demonstrates the effectiveness of the proposed framework. Results demonstrate that TrIF-DEC can systematically integrate uncertainty information with multidimensional sustainability goals, providing reliable support for complex product design evaluation.
1. Introduction
As global climate change intensifies and resource constraints tighten, the green transformation of manufacturing industry has shifted from a policy-driven initiative to a core driver of global industrial chain restructuring [1,2]. Driven by both carbon neutrality goals and circular economy strategies, Sustainable Design is no longer just an additional consideration in product development but has become a strategic fulcrum for reshaping corporate innovation paradigms and competitive advantages. Its goal is to systematically balance environmental impact, economic feasibility, and social value throughout the product lifecycle—from raw material acquisition, manufacturing, and use to end-of-life recycling [3]. To achieve this complex, multi-dimensional, and full-cycle goal, a key question must be addressed: how to scientifically and accurately evaluate the sustainability performance of design solutions? The rationality and scientific nature of evaluation methods not only provide a reliable basis for design decisions but also promote the integration of sustainable concepts into the entire product development process. Therefore, establishing a scientific, practical, and operational evaluation system is crucial for the effective transformation of sustainable design from theory to practice.
Multi-Criteria Decision-Making (MCDM) methods, as the mainstream tool for product design evaluation, offer a pathway to solve the above challenges. In existing research, various approaches have been proposed. Zhong et al. [4] combined Entropy and VlseKriterijumska Optimizacija I Kompromisno Resenje (VIKOR) for system evaluation of In-Vehicle Head-Up Display designs, focusing on the objective nature of evaluation data and the compromise optimization advantages of VIKOR in handling conflicting criteria. Bian et al. [5] combined Eigenvector and Analytic Hierarchy Process (AHP) to perform a systematic evaluation of product design, using Camping Lights as an example. Its result demonstrated the advantages of AHP in constructing hierarchical decision structures. Anwesa et al. [6] explored the use of Quality Function Deployment and the Six Sigma method to provide a simple, effective, and cost-efficient approach to sustainable product design evaluation, using the Automobile Exhaust System as a case study. While such studies have achieved positive results in specific areas, they either rely too heavily on expert subjective judgment, which is susceptible to cognitive biases and limitations in experience [7], or rely excessively on objective data, neglecting the priority and causal relationships between key criteria, resulting in evaluation outcomes that deviate from actual needs [8]. Moreover, traditional real numbers fail to precisely capture the fuzziness and hesitation in linguistic evaluations when processing expert opinions, which directly lead to information loss and decision biases in the evaluation process [9]. For instance, expressions like “low environmental friendliness” or “moderately low social acceptance” imply multi-dimensional cognitive states such as “support” “oppose” and “hesitation”, but a single real number such as 5 or 6 points cannot contain all of them.
Regarding these issues, researchers have introduced fuzzy logic or rough sets to manage uncertainty, and hybrid weighting mechanisms to balance subjective and objective factors. Wang et al. [10] combined Entropy and Fuzzy Technique for Order Preference by Similarity to Ideal Solution (TOPSIS) to evaluate capsule coffee machines, using fuzzy numbers to handle uncertainty in expert judgment. Narayanamoorthy et al. [11] employed Intuitionistic Fuzzy—Entropy and the VIKOR method to evaluate robot designs. In addition, Song et al. [12] incorporated Rough sets to capture the semantic meaning of evaluation information, and employed Best-Worst Method for subjective weighting and Criteria Importance Through Intercriteria Correlation for objective weighting in determining criteria weights, ultimately using TOPSIS to assess the Washing Machine. Although these methods have made progress in weight allocation and the acquisition of evaluation semantics, most studies fail in considering the causal logic and structural interdependencies among criteria, and they remain insufficiently flexible when expressing the hesitation intervals in expert evaluations [13]. Additionally, traditional MCDM methods such as TOPSIS and VIKOR, while widely used, are sensitive to extreme values and weight perturbations, leading to unstable ranking results in the early design stages when data is sparse and uncertainty is high [14,15]. In summary, the existing literature reveals a persistent gap. A comprehensive solution is yet to be developed that can simultaneously (1) capture the full spectrum of uncertainty and hesitation in expert judgments, (2) systematically integrate both the causal relationships among criteria and their data-driven discriminative power for weight determination, and (3) ensure stable ranking outcomes.
To address these challenges, this paper proposes an evaluation framework based on Trapezoidal Intuitionistic Fuzzy (TrIF), named TrIF-DEC, which integrates Decision-Making Trial and Evaluation Laboratory (DEMATEL), Entropy, and Combined Compromise Solution (CoCoSo). Specifically, the framework begins by using the KJ method (named after its creator, Jiro Kawakita) to systematically gather expert opinions and construct a sustainability criteria system across four dimensions: social, economic, technological, and environmental. TrIF are then introduced to more precisely capture the fuzziness and hesitation in linguistic evaluations, offering a high-fidelity modeling approach for expert judgments. Next, DEMATEL is used to reveal the causal relationships between criteria and generate subjective weights, while the Entropy method calculates the objective weights based on quantitative data. The results are then combined to form a comprehensive weight that integrates both subjective and objective factors. Finally, the CoCoSo is used to integrate multi-perspective evaluation strategies for scheme ranking, enhancing the robustness and resilience of the ranking results. Through the structural integration of multiple methods and innovative modeling of evaluation uncertainties, this framework provides full-process support for design decision-making. To clearly present the methodological choices made in this study, Table 1 outlines the key similarities and differences in modeling approaches across relevant studies, thereby clarifying the research gap that our work bridges. The main contributions of this research are as follows:

Table 1.
Relevant literature in the field of design evaluation.
- Introduction of TrIF to improve the precision of expert linguistic evaluations, effectively capturing fuzziness and hesitation in judgments.
- Proposal of a combined weighting mechanism integrating TrIF-DEMATEL and entropy weighting, preserving causal logic while accounting for data-driven characteristics.
- Integration of TrIF-CoCoSo for robust ranking, improving the reliability of decision results.
The remainder of this paper is organized as follows: Section 2 reviews the practical progress of sustainable product design, along with the current studies on combined weighting and MCDM methods; Section 3 elaborates on the modeling process of the TrIF-DEC framework. In Section 4, a case study on nursing bed design is presented to validate the framework’s effectiveness, including comparison and sensitivity analysis. Section 5 provides an overall evaluation of the experimental results, discussing the practical implications, limitations, and future directions of this research; In Section 6, we conclude the study and discuss the main contributions of this work.
2. Literature Review
2.1. Sustainability in Product Design
Against the backdrop of increasing global resource constraints and environmental pressures, sustainability in product design has become a focal point for both industry and academia [20,21]. Studies in this area have explored various pathways to achieve sustainability goals from multiple perspectives, such as process optimization, material innovation, and system design, providing important theoretical and methodological support for sustainable product design.
In the product design process, the selection and optimization of manufacturing processes have a direct impact on sustainability. Barbara et al. [22] compared different manufacturing processes, focusing on sustainability, and proposed methods for evaluating and optimizing manufacturing processes based on sustainability criteria. At the same time, Mehrpouya et al. [23] discussed the application of additive manufacturing (3D printing) in product design, highlighting its significant advantages in material saving, waste reduction, and shortened production cycles, which contribute to the achievement of green production goals. Uzair et al. [24] summarized past research contributions on selection strategies of manufacturing process and proposed a general resource selection method that considers the application domain, DFM/DFAM guidelines, and three design criteria (function, cost, and environment). These studies show that a well-planned manufacturing path and technological innovation can not only enhance economic benefits but also reduce environmental impacts, providing technical support for sustainability.
Sustainability and recycling of materials are also the basis for achieving product sustainability. Milošev et al. [25] pointed out that in the face of growing demand for engineering metals, it is essential to shift from traditional linear models to a circular economy model of “reduce-reuse-recycle”. Zarandi et al. [26] developed an expert system for sustainable product design material selection, which supports the preliminary material screening task and significantly saves time and costs in the LCE evaluation process. In addition, in the field of medical devices, the use of innovative polymers and recycling technologies has been shown to significantly reduce environmental burdens [27]. These studies highlight the critical role of material strategies and circular design in building sustainable product systems.
Based on the optimization of processes and materials, systematic design thinking further expands the dimensions of sustainable product design. Rachael et al. [28] proposed an improved sustainable product design process that helps project teams identify sustainable design strategies and explore design directions. Dahmani et al. [29] proposed a “smart circular product design” framework that combines ecological design and Industry 4.0, emphasizing the achievement of product ecological efficiency through multidimensional collaboration. Similarly, Han et al. [30] developed a set of sustainability assessment criteria for product design, evaluating the environmental impact of products comprehensively from material selection, production processes, use stage to the end of life cycle. These criteria and frameworks offer scientific evaluation tools for companies in product development process.
Product design is closely related to sustainability, involving the collaborative integration of multiple aspects, such as process optimization, material innovation, and system design. However, existing research mainly focuses on environmental and technological dimensions, with less attention given to comprehensive consideration of economic and social factors. Therefore, this study constructs an evaluation criteria system for product design based on the four dimensions of sustainability: economic, environmental, social, and technological, aiming to provide companies with more comprehensive and scientific decision-making support.
2.2. Weighting Methods for Criteria
In complex decision-making, the accuracy of multi-criteria evaluation highly depends on the scientific allocation of criteria weights, which fundamentally involves scaling the relative importance or discriminative power of criteria onto a cardinal scale for mathematical aggregation [31]. The methods for obtaining these weights vary primarily in their source of information, ranging from direct human preference to intrinsic data structure.
Traditional and expert-driven methods often rely on direct value judgments from decision-makers. Established techniques like Swing Weighting, as well as structured methods like the Analytic Hierarchy Process (AHP) and the Delphi method, convert qualitative preferences into quantitative weights. These methods effectively reflect subjective intentions and domain knowledge. For instance, Jaemin et al. [32] used a literature review and the Delphi method to determine the product decision domain, further ranking sixteen evaluation factors within a fuzzy hierarchical model. Similarly, Kaustov et al. [33] combined AHP with fuzzy extension analysis to calculate the weights of corresponding design standards and sub-criteria. However, such preference-based approaches can be susceptible to cognitive bias and group interference, at times lacking stability and repeatability.
In contrast, data-driven or objective weighting methods derive weights by mathematically analyzing the decision matrix itself, under the logic that a criterion’s capacity to differentiate between alternatives—measured through its data variation—is a proxy for its importance. The entropy method, for example, measures the amount of discriminatory information in the data and has been widely applied due to its computational simplicity. Sahoo et al. [34] used it to optimize the multi-criteria evaluation of electric wheelchairs, effectively identifying key functional dimensions. Yu et al. [35] combined the entropy method with CRITIC and TOPSIS to analyze young people’s preferences for wicker furniture design. While methods like entropy and CRITIC objectively reflect the discriminative power of criteria, a common critique is that they often overlook the interdependence and causal effects between them.
To capture both preferential and data-driven insights while mitigating their respective limitations, researchers have increasingly explored hybrid methods. Koksalmis [36] proposed a combination based on objective weights and subjective ratings, using a geometric mean consensus index for medical decisions. Hasan et al. [37] introduced a framework using historical data and hierarchical structures to assign attribute values. Although valuable, many such hybrid approaches rely on arithmetic weighting and fail to deeply explore the intrinsic structural relationships and dynamic influence mechanisms between criteria.
It is precisely this gap that the DEMATEL method addresses, having gained attention for its unique advantages in identifying causal relationships and influence intensity within complex systems [38]. By constructing a direct influence matrix, DEMATEL distinguishes between causal and effect-based criteria, thereby revealing the core drivers of an evaluation system. When this structural analysis is integrated with the data-driven information content captured by the entropy method [39]. A more robust synthesis is achieved. Therefore, the DEMATEL-entropy hybrid method proposed in this study not only reconciles the strengths of structural modeling and data variation analysis but also provides a more systematic and scientific pathway for weight determination in complex multi-criteria decision-making.
2.3. MCDM in Design Evaluation
Design evaluations often face challenges such as multiple objectives, conflicting criteria, and information uncertainty, especially when dealing with user preferences, expert judgments, and fuzzy perceptions [40]. In such cases, traditional single evaluation methods often fail to ensure the scientific and robust nature of decision-making. In this context, Multi-Criteria Decision Making (MCDM) has become a core tool to support design optimization due to its ability to systematically handle multi-dimensional information.
Experts typically rely on MCDM methods to address these uncertainties and make more precise evaluations. Suttipong et al. [41] proposed a generalized AHP technique combined with latent factors, such as gender, age, health status, and occupation, to prioritize consumer preferences for OTOP products targeted at elderly consumers. Govindan et al. [42] combined ANP-DEMATEL (DANP) with the Preference Ranking Organization Method for Enrichment Evaluation (PROMETHEE) to build a hybrid MCDM model for assessing optimal green manufacturing practices. Additionally, Chen et al. [43] explored the impact of entropy on the TOPSIS decision-making method, demonstrating how entropy can enhance attributes with high data diversity and weaken those with low data diversity in decision-making. These studies show that classic MCDM methods can effectively integrate quantitative and qualitative criteria, providing structured solutions for complex design problems.
However, subjective judgments and environmental uncertainties in the design process often lead to imprecise or semantically ambiguous evaluation information. To address this, scholars introduced fuzzy set theory and its extensions into MCDM. Yuan et al. [44] combined Q-layer orthogonal fuzzy sets with COPRAS to handle the fuzziness of attribute weights and apply objective weight distribution to improve decision accuracy. Wang et al. [17] used Grey Relational Analysis (GRA) to comprehensively evaluate the priority of evaluation criteria and then applied intuitionistic fuzzy VIKOR to evaluate rattan lamp design alternatives. Meanwhile, Li et al. [45] further proposed a group decision-making model based on trapezoidal intuitionistic fuzzy sets, effectively addressing expert opinion conflicts and information gaps, significantly improving the fusion capability of multi-source fuzzy data. Fuzzy set theory and its extensions have gradually evolved in studies, compensating for the uncertainty of expert evaluations during the assessment process.
Beyond handling static uncertainty, recent research trends are bridging fuzzy set theory with sequential or dynamic decision models to better capture the evolving nature of design preferences and scenarios. For instance, fuzzy Markov decision processes have been developed to manage multi-stage decisions under fuzzy cost or reward information, offering a framework for modeling dynamic design evaluation processes [46].
With the maturation of the method system, various emerging MCDM models have been widely applied in design evaluation, such as EDAS [47], VIKOR [48], and CoCoSo [49]. Among these, EDAS focuses on the deviation of evaluation values from the average solution, VIKOR emphasizes compromise optimality, and the CoCoSo method has gained widespread attention in recent years for its excellent overall performance. It combines the weighted product model with the power mean operator, considering both the independence and interrelationship of criteria, while maintaining stable ranking ability even when criteria conflict. By integrating trapezoidal intuitionistic fuzzy theory with the CoCoSo method, a flexible and efficient approach for processing uncertainty and fuzzy data in multi-criteria decision tasks is provided. Therefore, this study adopts the TrIF-CoCoSo method to select the optimal design scheme.
3. Proposed Framework
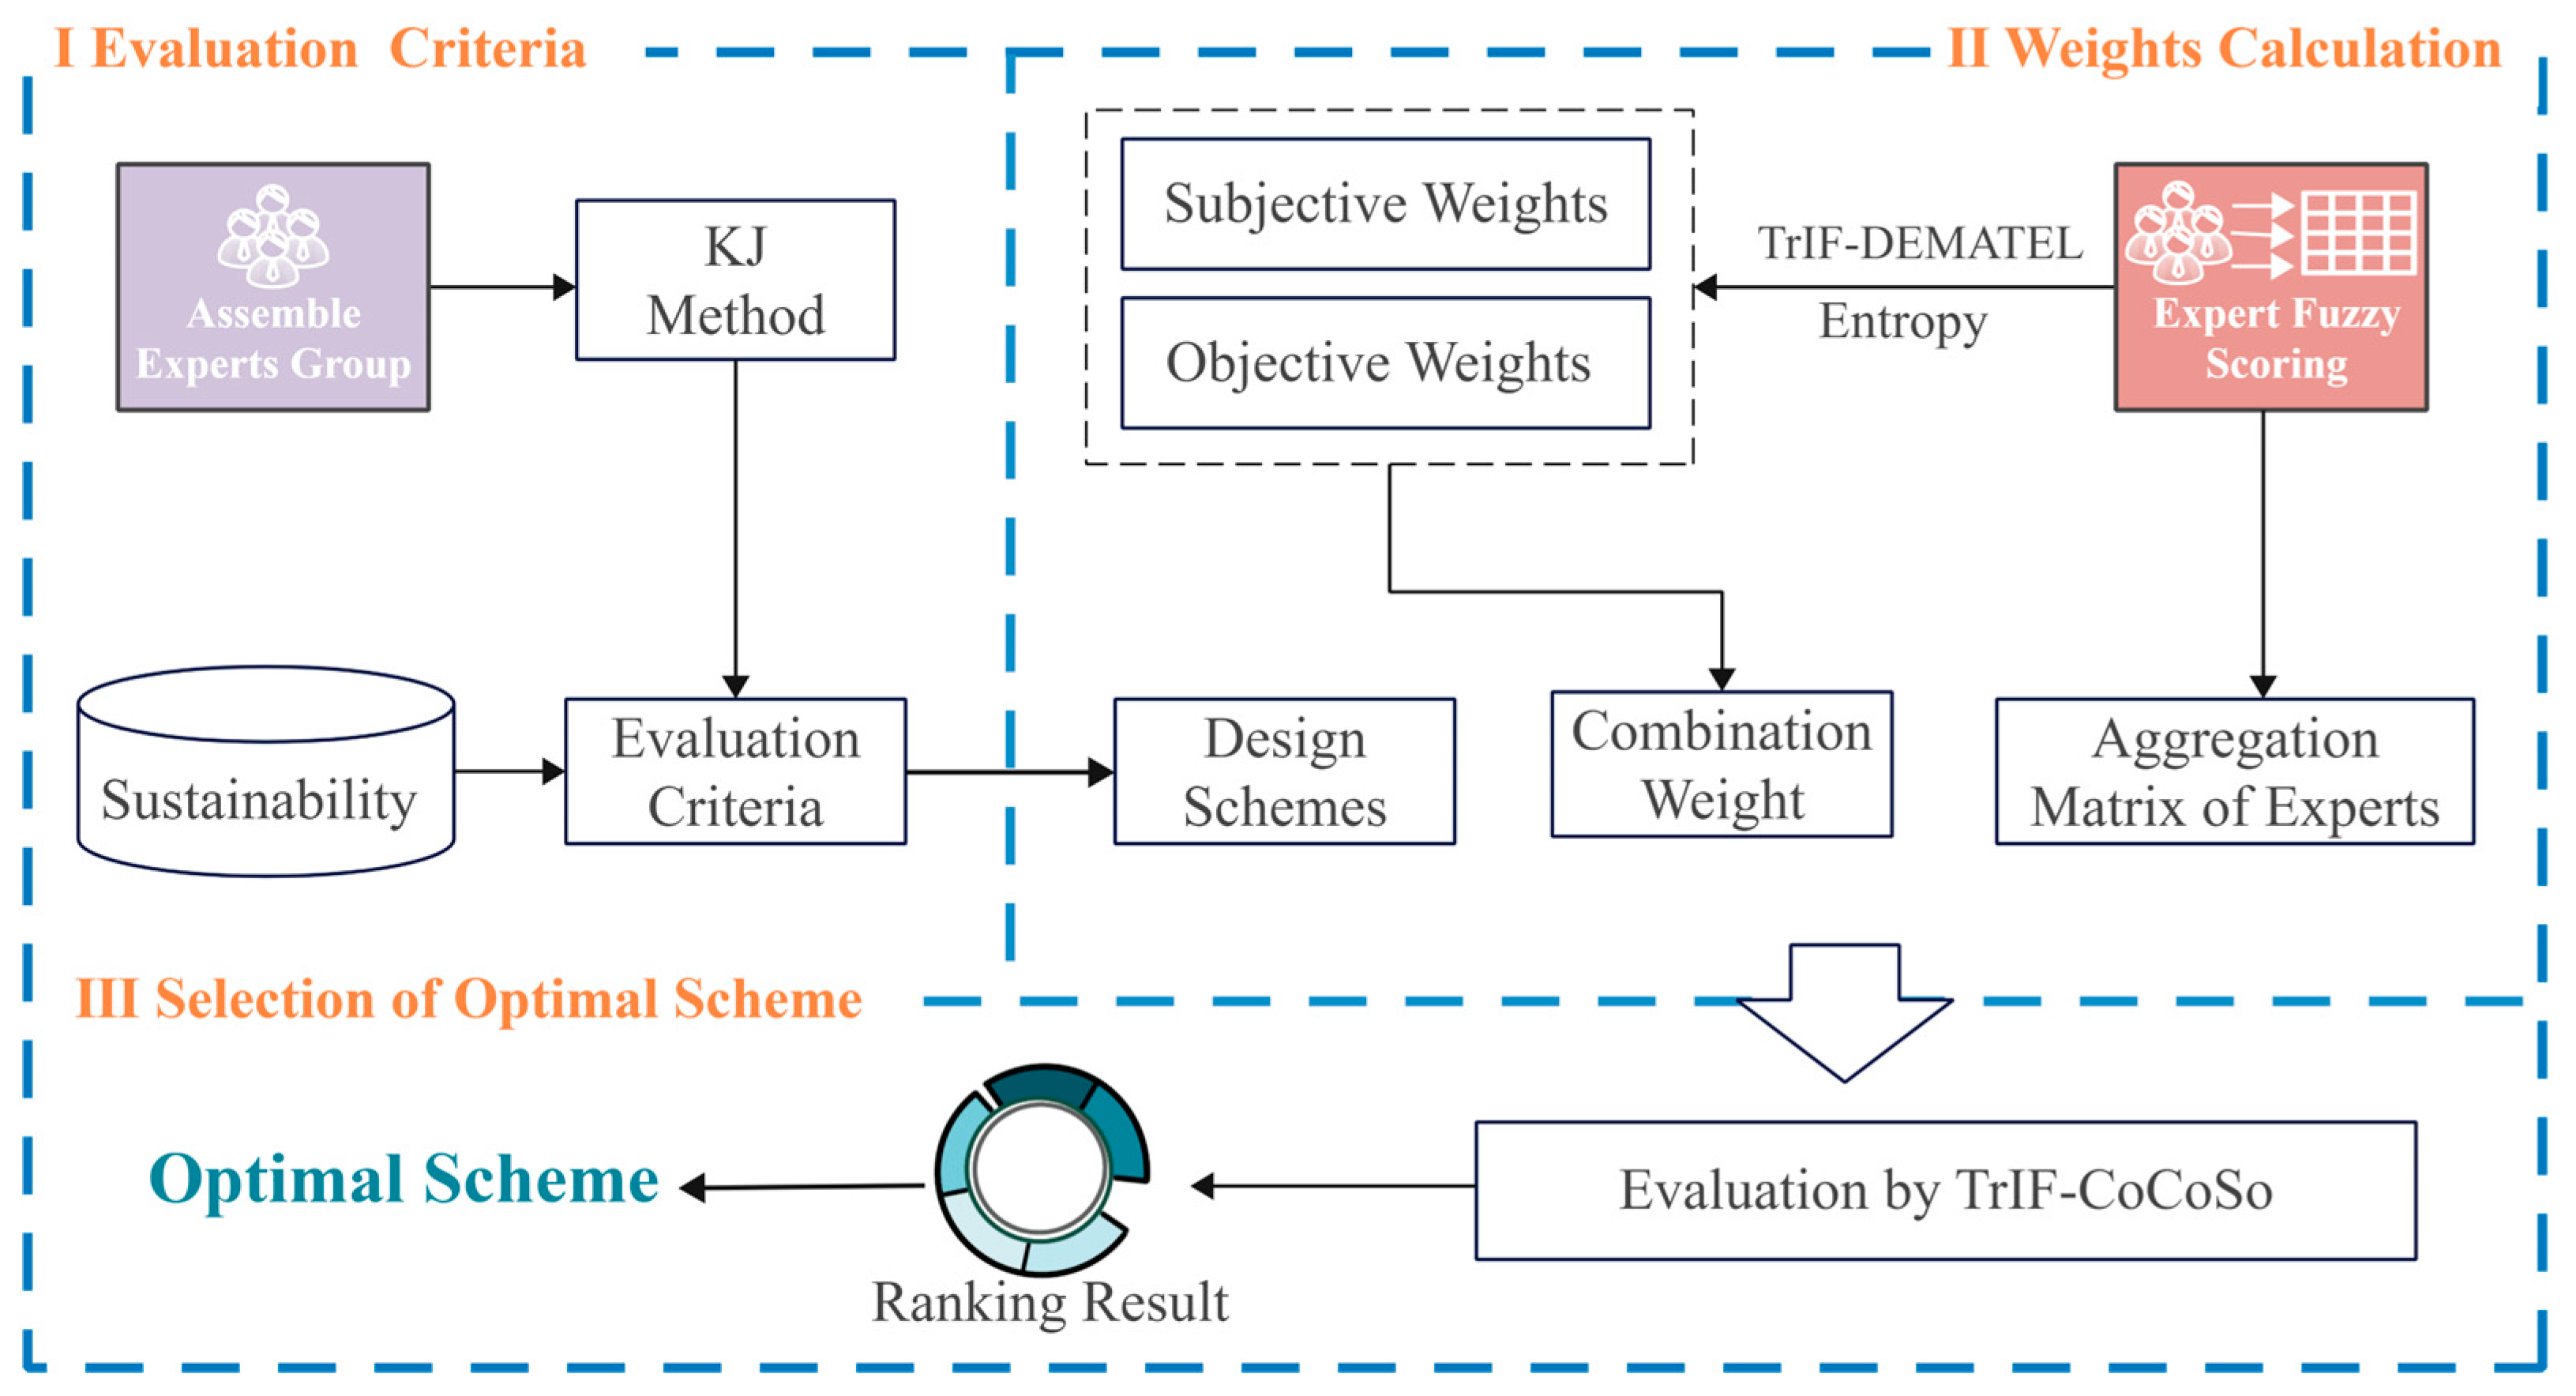
The integrated decision-making approach proposed in this paper consists of three main components: (1) identification of sustainability evaluation criteria. (2) Combination weighting by integrating TrIF-DEMATEL and entropy method, and (3) evaluation of schemes through TrIF-CoCoSo. Firstly, under the conditions of prioritizing user needs and focusing on product sustainability, key design criteria are identified from the expert panel through the KJ method. These criteria serve as the basis for design development. Next, the TrIF-DEMATEL method is used to quantify the subjective weights of the criteria, and the entropy method is applied to generate the objective weights, resulting in the comprehensive weights of the criteria. Finally, the TrIF-CoCoSo method is employed to rank the de-sign schemes. Figure 1 illustrates the systemic framework, showing how these components work together. This framework provides a systematic evaluation process, supporting the evaluation of sustainable design alternatives.
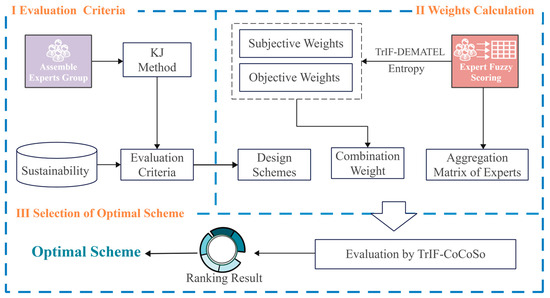
Figure 1.
Proposed framework. (Orange text: steps of proposed framework, Blue text: optimal design scheme).
3.1. Trapezoidal Intuitionistic Fuzzy Set Theory
Intuitionistic fuzzy sets (IFS), introduced by Atanassov in 1986 [50], extend classical fuzzy sets by incorporating both membership and non-membership functions, along with a degree of hesitation. These features enable IFS to better represent uncertainty, making them particularly suitable for situations where information is vague or contradictory [51]. Trapezoidal Intuitionistic Fuzzy Numbers (TrIFNs), an extension of IFS, integrate a staircase-shaped membership function into the fuzzy number representation [52]. This function is defined by four parameters: the lower bound, lower plateau, upper plateau, and upper bound. TrIFNs have been shown to effectively capture more complex uncertainties, providing decision-makers with smoother and more precise models.
Following are fundamental definitions and concepts of IFS theory [53,54]:
Definition 1.
Consider X as a fixed set. Then, an IFS A in X is defined as
In Equation (1), and are defined in a way that . The number denotes membership degree and signifies non-membership degree of element to set A. is hesitance level of to A and , which are determined according to Definition (1) as follows:
Definition 2.
A TrIFN A with parameters is represented as in R which are a set of real numbers. To obtain membership and non-membership functions of A, Equations (3) and (4) can be used.
Consider and in a TrIFN A, then, it changes to an intuitionistic triangular fuzzy number. Consider and as TrIFNs and on the basis of Nehi and Maleki [55], the following properties are correct:
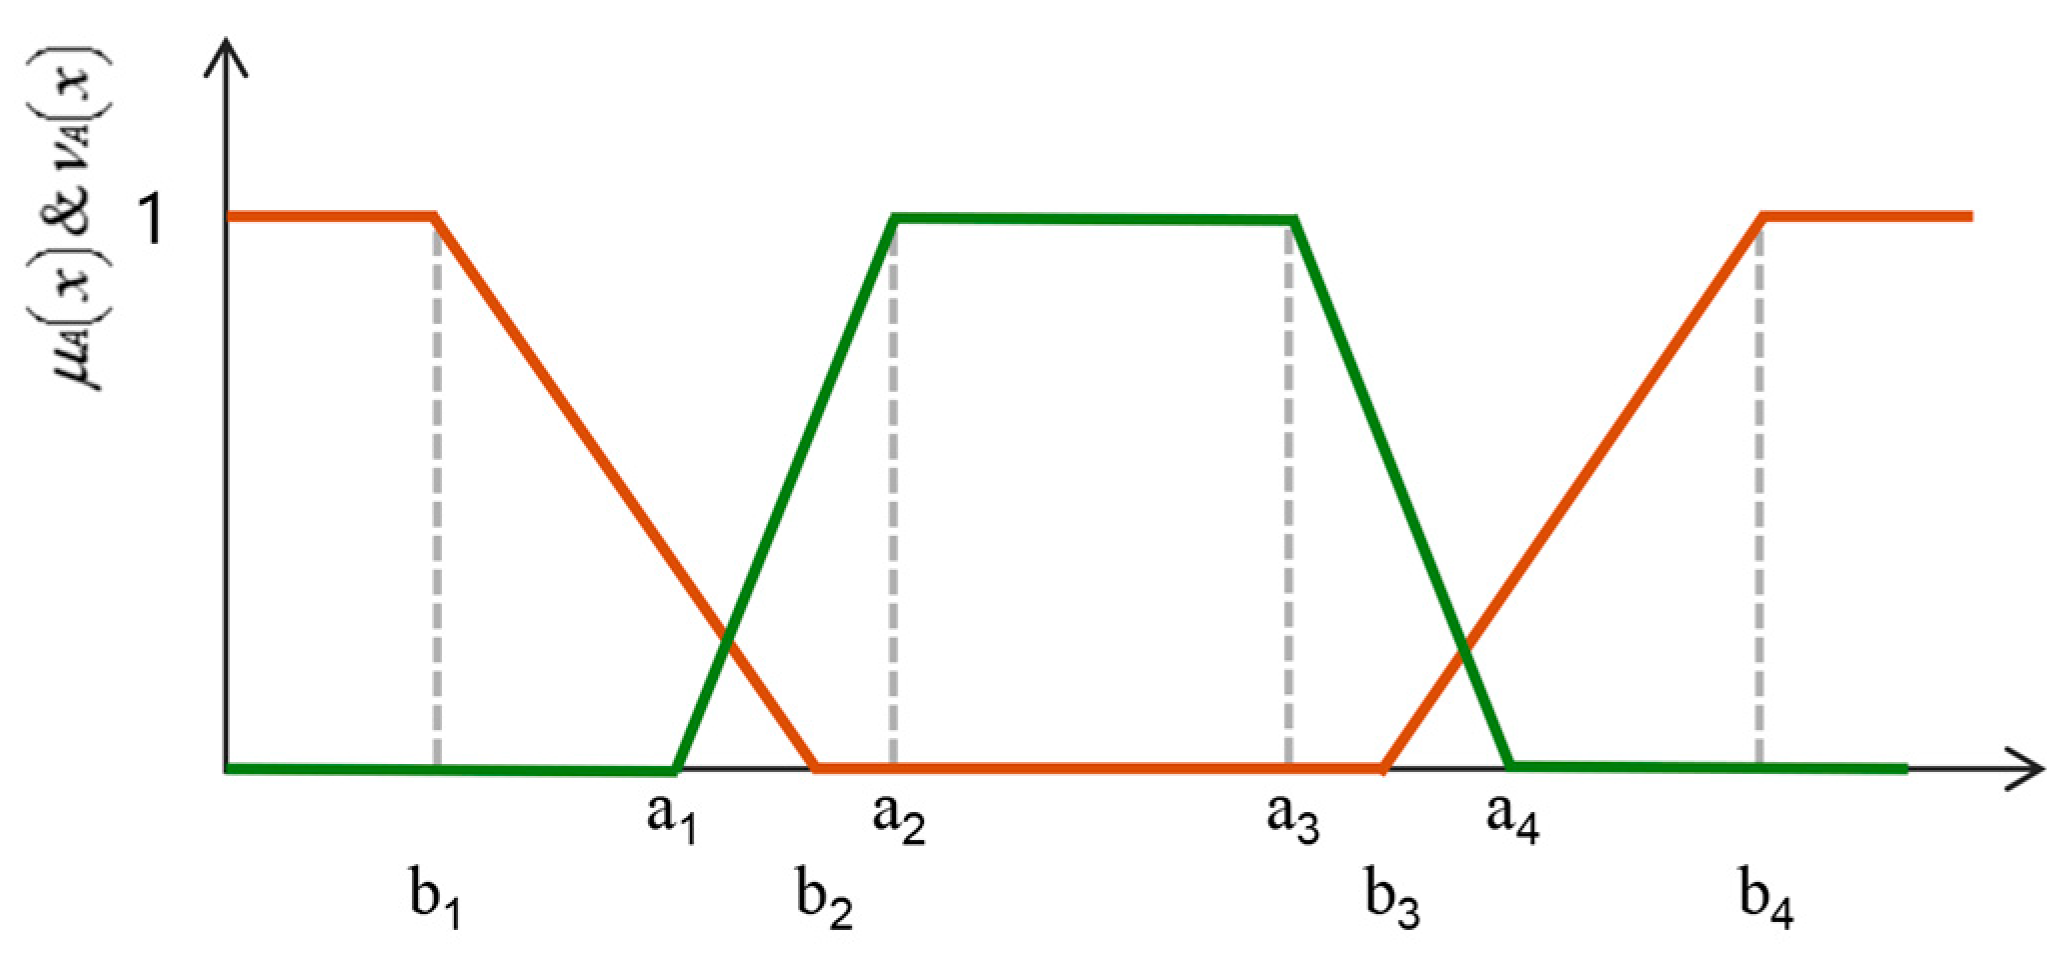
The membership and non-membership functions of a TrIFN are illustrated in Figure 2.
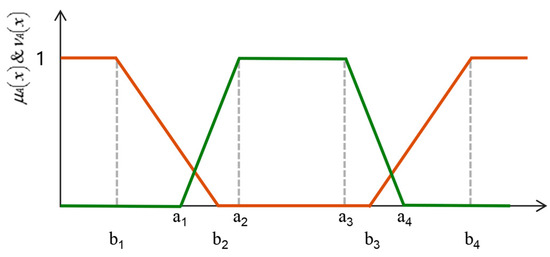
Figure 2.
Membership functions of an intuitionistic trapezoidal fuzzy number. (The red line is , and the green line is ).
Theorem 1.
Suppose
be a TrIFN in R is a set of real numbers. On the basis of Equation (7), expected value is calculated when .
3.2. Subjective Weighting Through DEMATEL
DEMATEL, initially introduced by Gabus and Fontela in 1972 [7,56], is a powerful tool for visualizing and modeling the cause-and-effect structure within a system. This method helps to identify and evaluate the interdependence among various factors in multi-criteria decision-making (MCDM) problems [57]. By constructing an influence matrix based on expert judgment, DEMATEL allows for the determination of direct and indirect relationships between factors, offering valuable insights into the most influential and critical elements in the decision-making process [58,59].
The procedure of DEMATEL method consists of the following steps [53,60]:
- Developing a matrix of direct relations. Experts generate a direct relation matrix (total number of criteria is n) by making pair-wise comparisons between criteria. Each element of matrix shown by is a number that represents the influence level of criterion i on j. The averaged matrices A for all experts’ opinions are calculated by getting average scores of H experts as follows where is the importance weight of kth expert.
- Normalizing the matrix of direct relations. To calculate normalized initial influences matrix Equations (9) and (10) are applied:
- Producing a total relation matrix. Equation (11) can compute the total relation matrix (T). The identity matrix is shown by I in Equation (11).
- Generating a causal diagram. D and R which are sum of rows and sum of columns, respectively, are computed by applying Equations (12)–(14):
represents a horizontal axis vector termed “Prominence”, reflecting the relative importance of each criterion. By subtracting from , a vertical axis is formed, named “Relation” is made. Typically, if (D − R) > 0, the criterion belongs to the cause group; If (D − R) < 0, it belongs to the effect group. Cause factors warrant primary attention as they influence the entire system, and their performance directly impacts the achievement of overall objectives. Effect factors tend to be impacted by others, which cause factors in effect group unsuitable to be key factors [61].
3.3. Objective Weighting by Entropy Method
Entropy weight method is an objective weight method based on the concept of information entropy [8,62], which measures uncertainty or disorder in a system. By calculating the entropy for each criterion, this method assigns higher weights to criteria with less uncertainty (i.e., those that provide more concentrated information) and lower weights to those with greater uncertainty (i.e., those that provide more dispersed information) [8]. This approach eliminates subjective bias in weight assignment, making it particularly effective for handling multi-criteria decision-making problems where the criteria exhibit varying degrees of uncertainty [63,64]. The entropy weight method offers a systematic, data-driven way to allocate weights and enhance the decision-making process [65].
The steps to obtain the objective weight can be summarized as follows [66]:
Step 1: Normalize the actual performance data.
where denotes the normalized value of alternative about . means the crisp value of alternative with respect to . represents the total number of evaluated alternatives.
Step 2: Calculate the entropy value of criterion.
where ln () is logarithm based on e. Given the properties of , the normalization factor ensures that belongs to the interval .
Step 3: Compute the objective weight of criterion.
3.4. Integrating of Objective and Subjective Weights
To describe the preference of each decision maker, we introduce the weight preference factor α to generate the comprehensive weight of criterion by integrating the objective and subjective weights.
where α is [0, 1] and determines the relative importance of objective and subjective weights.
3.5. Application of CoCoSo in Design Scheme Evaluation
CoCoSo is designed to evaluate and rank decision alternatives based on multiple conflicting criteria, providing a systematic approach to derive a compromise solution [49]. This method is particularly effective in scenarios where decision-makers must consider a variety of factors, often involving conflicting objectives or uncertain information [67,68]. By combining normalization and weighted aggregation techniques, CoCoSo generates a comprehensive evaluation of each alternative, allowing decision-makers to identify the most balanced and optimal choice [69]. To obtain the final ranking, steps involved in CoCoSo are stated as below [70]:
Step 1: Form the initial decision matrix (X) based on the performance rating of each alternative against each criterion.
Step 2: Normalize the performance ratings to develop the normalized decision matrix (N).
Step 3: Compute sum of the weighted comparability sequences () and sum of the power weight of the comparability sequences () for each alternative (considering as the weight assigned to criterion/response).
Step 4: Compute two appraisal score strategies to determine relative weights of the alternatives.
where represents the arithmetic mean of WSM and WPM scores, denotes the total of the relative WSM and WPM scores with respect to the best alternative, provides a balanced compromise between WSM and WPM models, and λ is a constant (usually 0.5) that may be varied depending on the preference of the decision maker.
Step 5: Calculate the overall assessment value () and rank the alternatives based on their values.
Here combines the metrics , and to provide an overall assessment value for each alternative. The alternatives are ranked in decreasing order of such that the best alternative has the highest value.
4. Case Study
To validate the proposed TrIF-DEC framework and demonstrate its applicability in real-world sustainable product design, a case study on medical nursing beds is conducted. Nursing beds are representative of high-impact medical devices due to their long service life, frequent use in healthcare settings, and complex interactions among users, caregivers, and maintenance staff. These characteristics, combined with significant material and energy consumption over their lifecycle, make them a suitable candidate for multi-dimensional sustainability assessment.
4.1. Sustainability Criterion Identification
A structured criterion identification process was conducted using the KJ method (also known as the affinity diagramming technique), which facilitates the synthesis of diverse insights into a coherent conceptual framework. The process involved a multidisciplinary workshop with 22 participants, including clinicians (n = 3), nurses (n = 6), product designers (n = 5), and patients or caregivers (n = 8), ensuring balanced representation across technical, clinical, operational, and user perspectives.
Participants were first provided with background materials on sustainable design principles and lifecycle considerations of medical devices. They then individually generated statements related to sustainability in nursing bed design, responding to prompts such as:
- “What economic factors affect its long-term usability?”
- “What makes a nursing bed environmentally responsible?”
- “How can it better support patient well-being and caregiver efficiency?”
- “How does technological features achieve optimal functional performance?”
A total of 38 statements were collected and transcribed onto individual cards. Through a collaborative sorting process, participants grouped similar ideas into clusters based on thematic affinity. These clusters were then labeled and refined through discussion, ultimately consolidating into four overarching dimensions: economic, environmental, social, and technological. Redundant or overlapping items were merged (e.g., “ease of repair” and “service accessibility” → “maintainability”), and key concepts emphasized by multiple stakeholders were retained.
After iterative refinement, a final set of 12 core criteria was established as shown in Table 2, forming a comprehensive and stakeholder-informed foundation for subsequent evaluation.

Table 2.
Evaluation criteria.
4.2. Nursing Bed Design
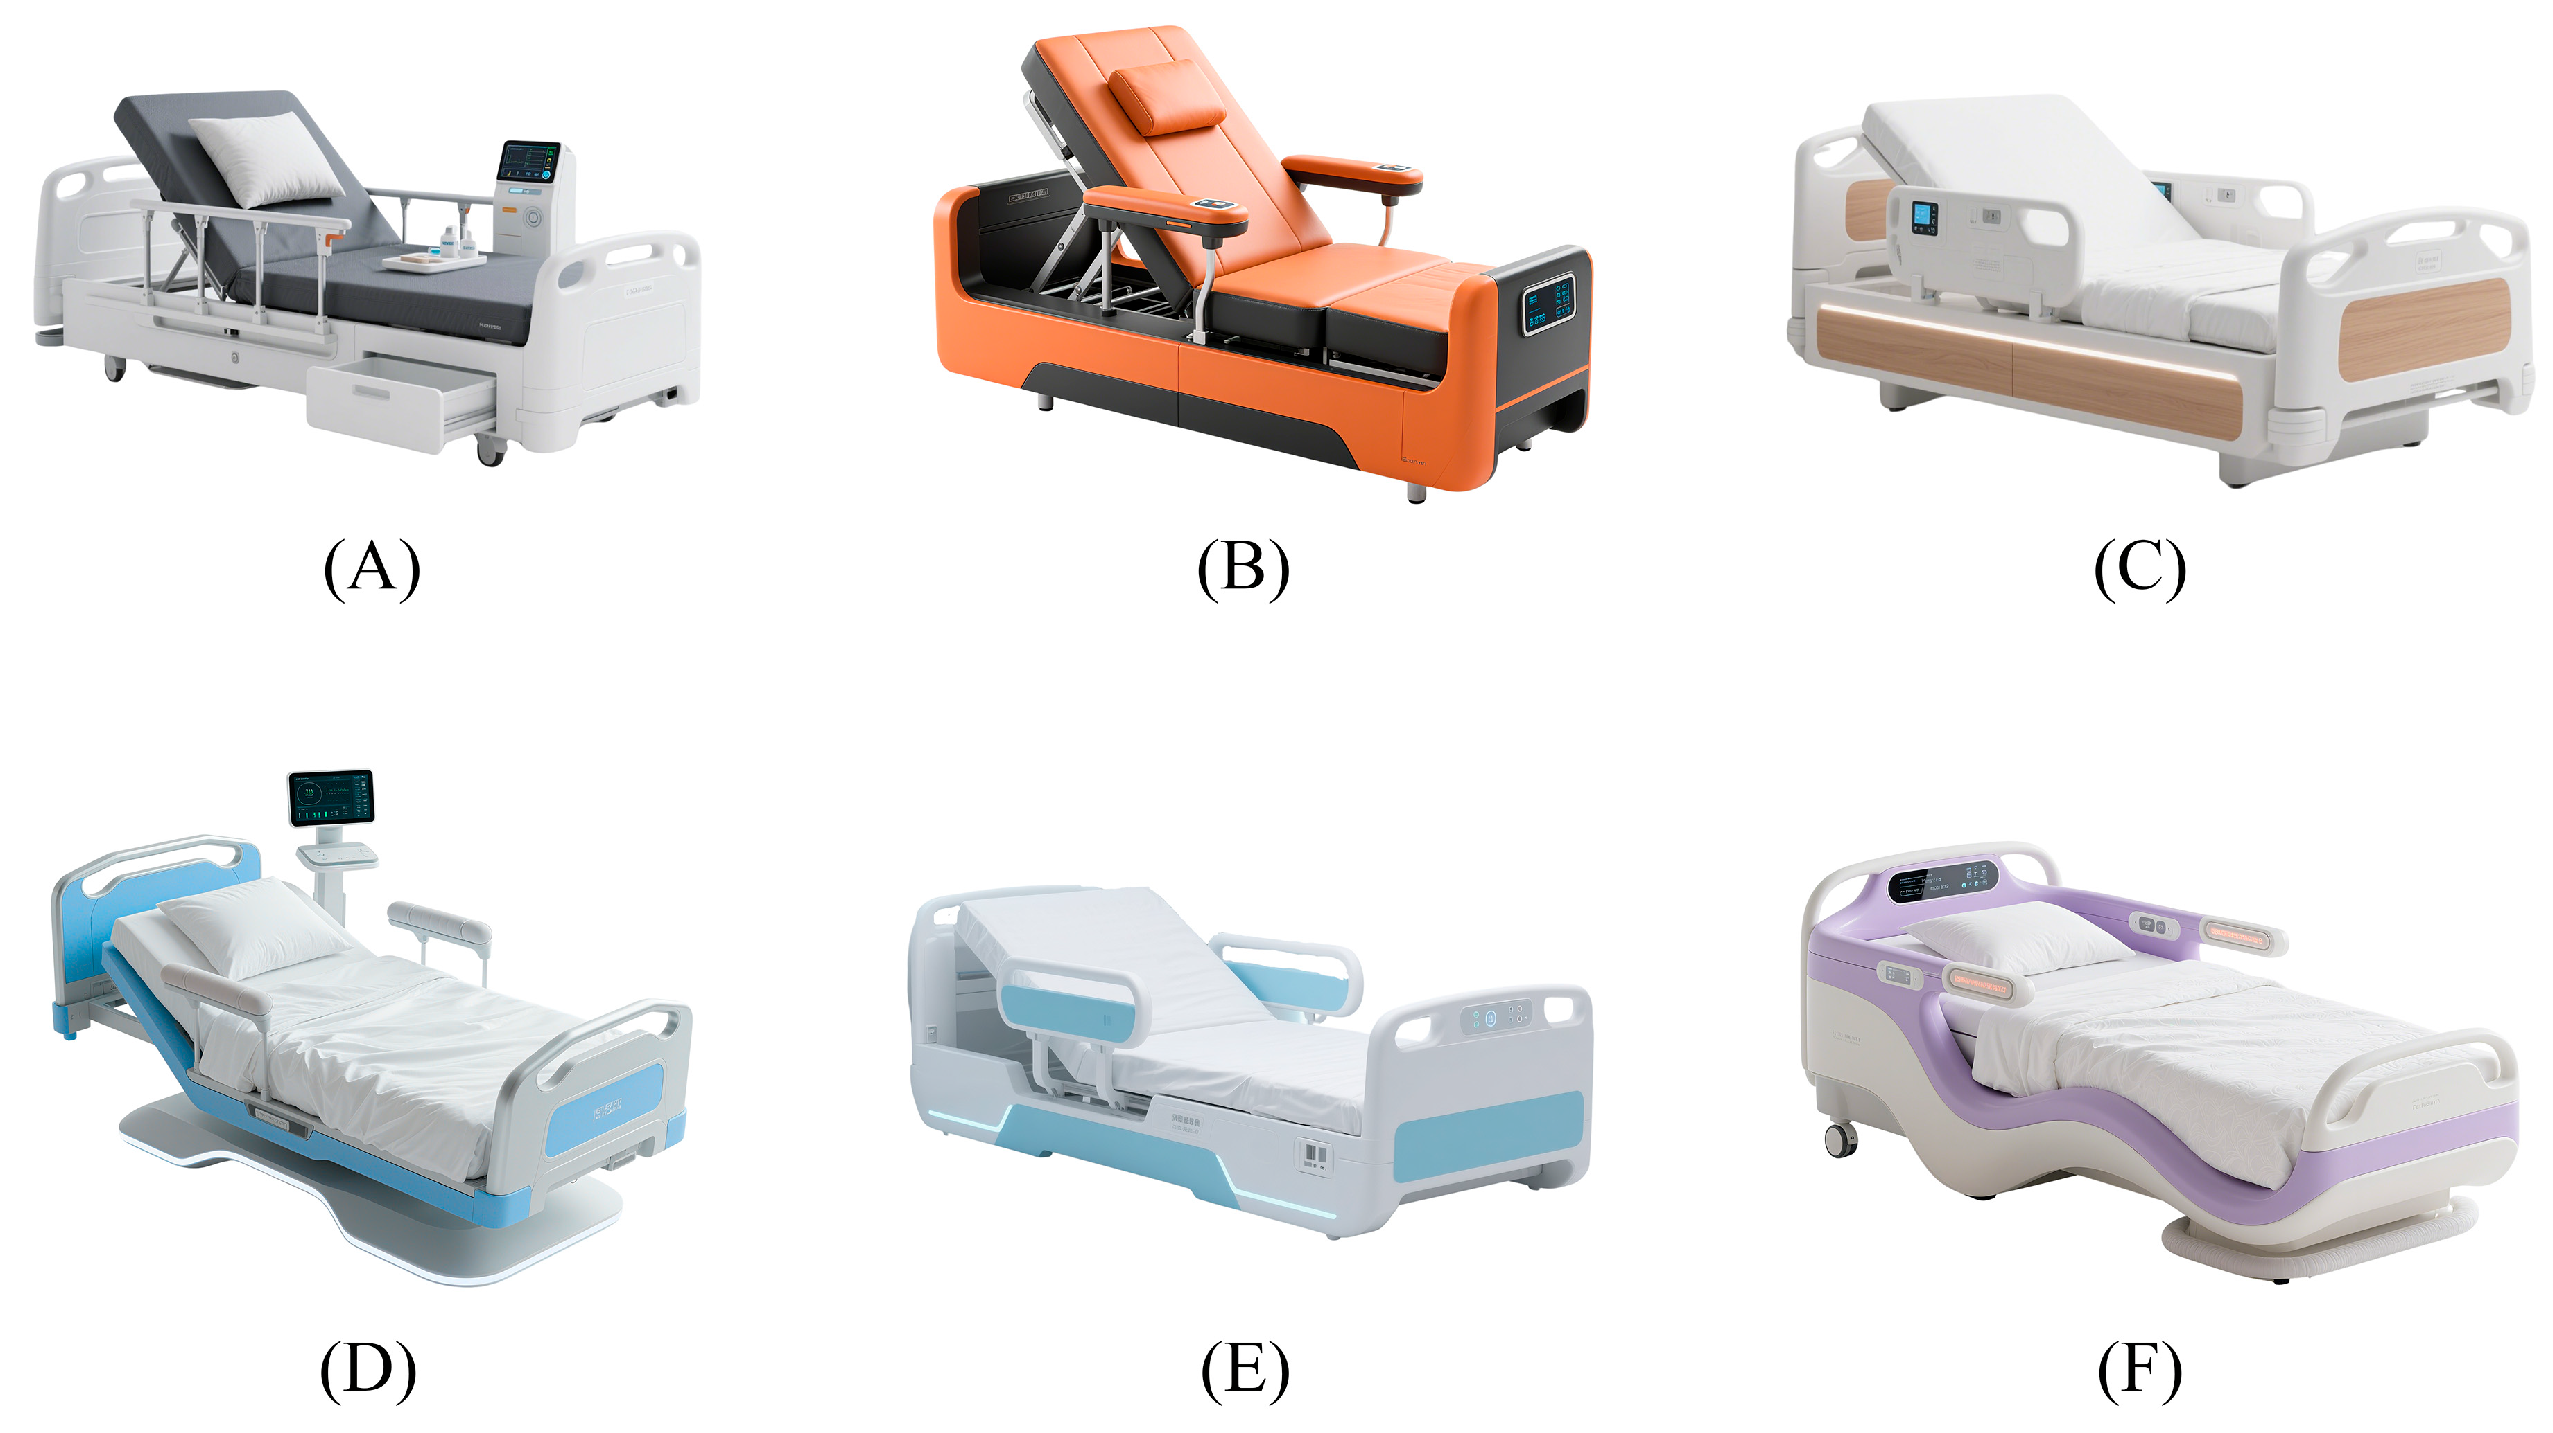
The interviews with experts revealed several shortcomings in the nursing beds currently used in healthcare settings, which include high costs, poor recyclability, and the lack of real-time monitoring functions. Such shortcomings not only affect the long-term usability and sustainability of the beds but also limit patient satisfaction and the efficiency of nursing staff to some extent. In response to these challenges, the expert panel proposed several improvement suggestions. Based on these recommendations and the sustainable design criteria gathered from the research, we designed six nursing bed schemes, as shown in Figure 3.
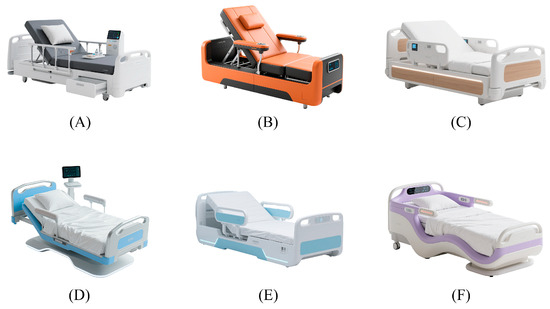
Figure 3.
Six design schemes for nursing bed (A–F).
Schemes A and B focus on intelligence and patient autonomy. By integrating smart terminals to display vital signs and nursing information in real time, and with electric adjustments to accommodate various postures, these designs enhance patient experience while optimizing energy efficiency.
Scheme C and D emphasize comfort and safety, with color schemes that highlight medical functionality and help alleviate anxiety. Operational barriers are reduced by modular design, making these beds suitable for general hospital wards and elderly care environments. With the modular design, components of the bed can be disassembled and replaced when no longer needed, thereby reducing waste and improving maintenance and upgrading efficiency.
Schemes E and F prioritize simplicity and user-friendliness, with a modern style and strong functionality, making them suitable for various medical settings. The flat surfaces of the beds make it easier to clean, thereby reducing the risk of bacterial buildup. At the same time, they are easy for healthcare staff to operate, improving overall care efficiency.
4.3. Subjective and Objective Weighting and Comprehensive Weight Calculation
4.3.1. Derivation of Subjective Weights Through the TrIF-DEMATEL
Six experts from the expert panel were invited to score on the causal relationships and influences among twelve design criteria. The experts with medical care experience ensured that the weighting data calculated by the DEMATEL method aligns with the practical needs of daily medical environments. To reduce the impact of uncertainty and enhance the accuracy of the evaluation results, a seven-level linguistic scale was used, as shown in Table 3 [53].

Table 3.
Linguistic values of TrIFN for linguistic terms regarding the degree of influence.
First, the linguistic scores from the experts were collected via a questionnaire. Due to space limitations, only the linguistic score results from Expert 1 are presented, as shown in Table 4. TrIFN effectively represents the uncertainty in expert assessments. Based on the linguistic scale, the linguistic scores were converted into TrIFN score matrixes.

Table 4.
Linguistic evaluation matrix of Expert 1.
Next, through Equation (7), the TrIFN scores were transformed into the Expected Crisp Value, resulting in an Expected Crisp Value matrix for each expert. Assuming equal weights for each expert, the aggregated Expected Crisp Value matrix was then obtained, as shown in Table 5.

Table 5.
Aggregation matrix of Experts’ Expected crisp value.
The above matrix was normalized, and the comprehensive impact matrix T was derived by Equation (10). Through Equations (11)–(13), we further calculated the impact degree D, the affected degree R, the centrality (D + R), and the causality (D − R) for each criterion, ultimately obtaining the subjective weights Wsub, as shown in Table 6.

Table 6.
Subjective weights by DEMATEL.
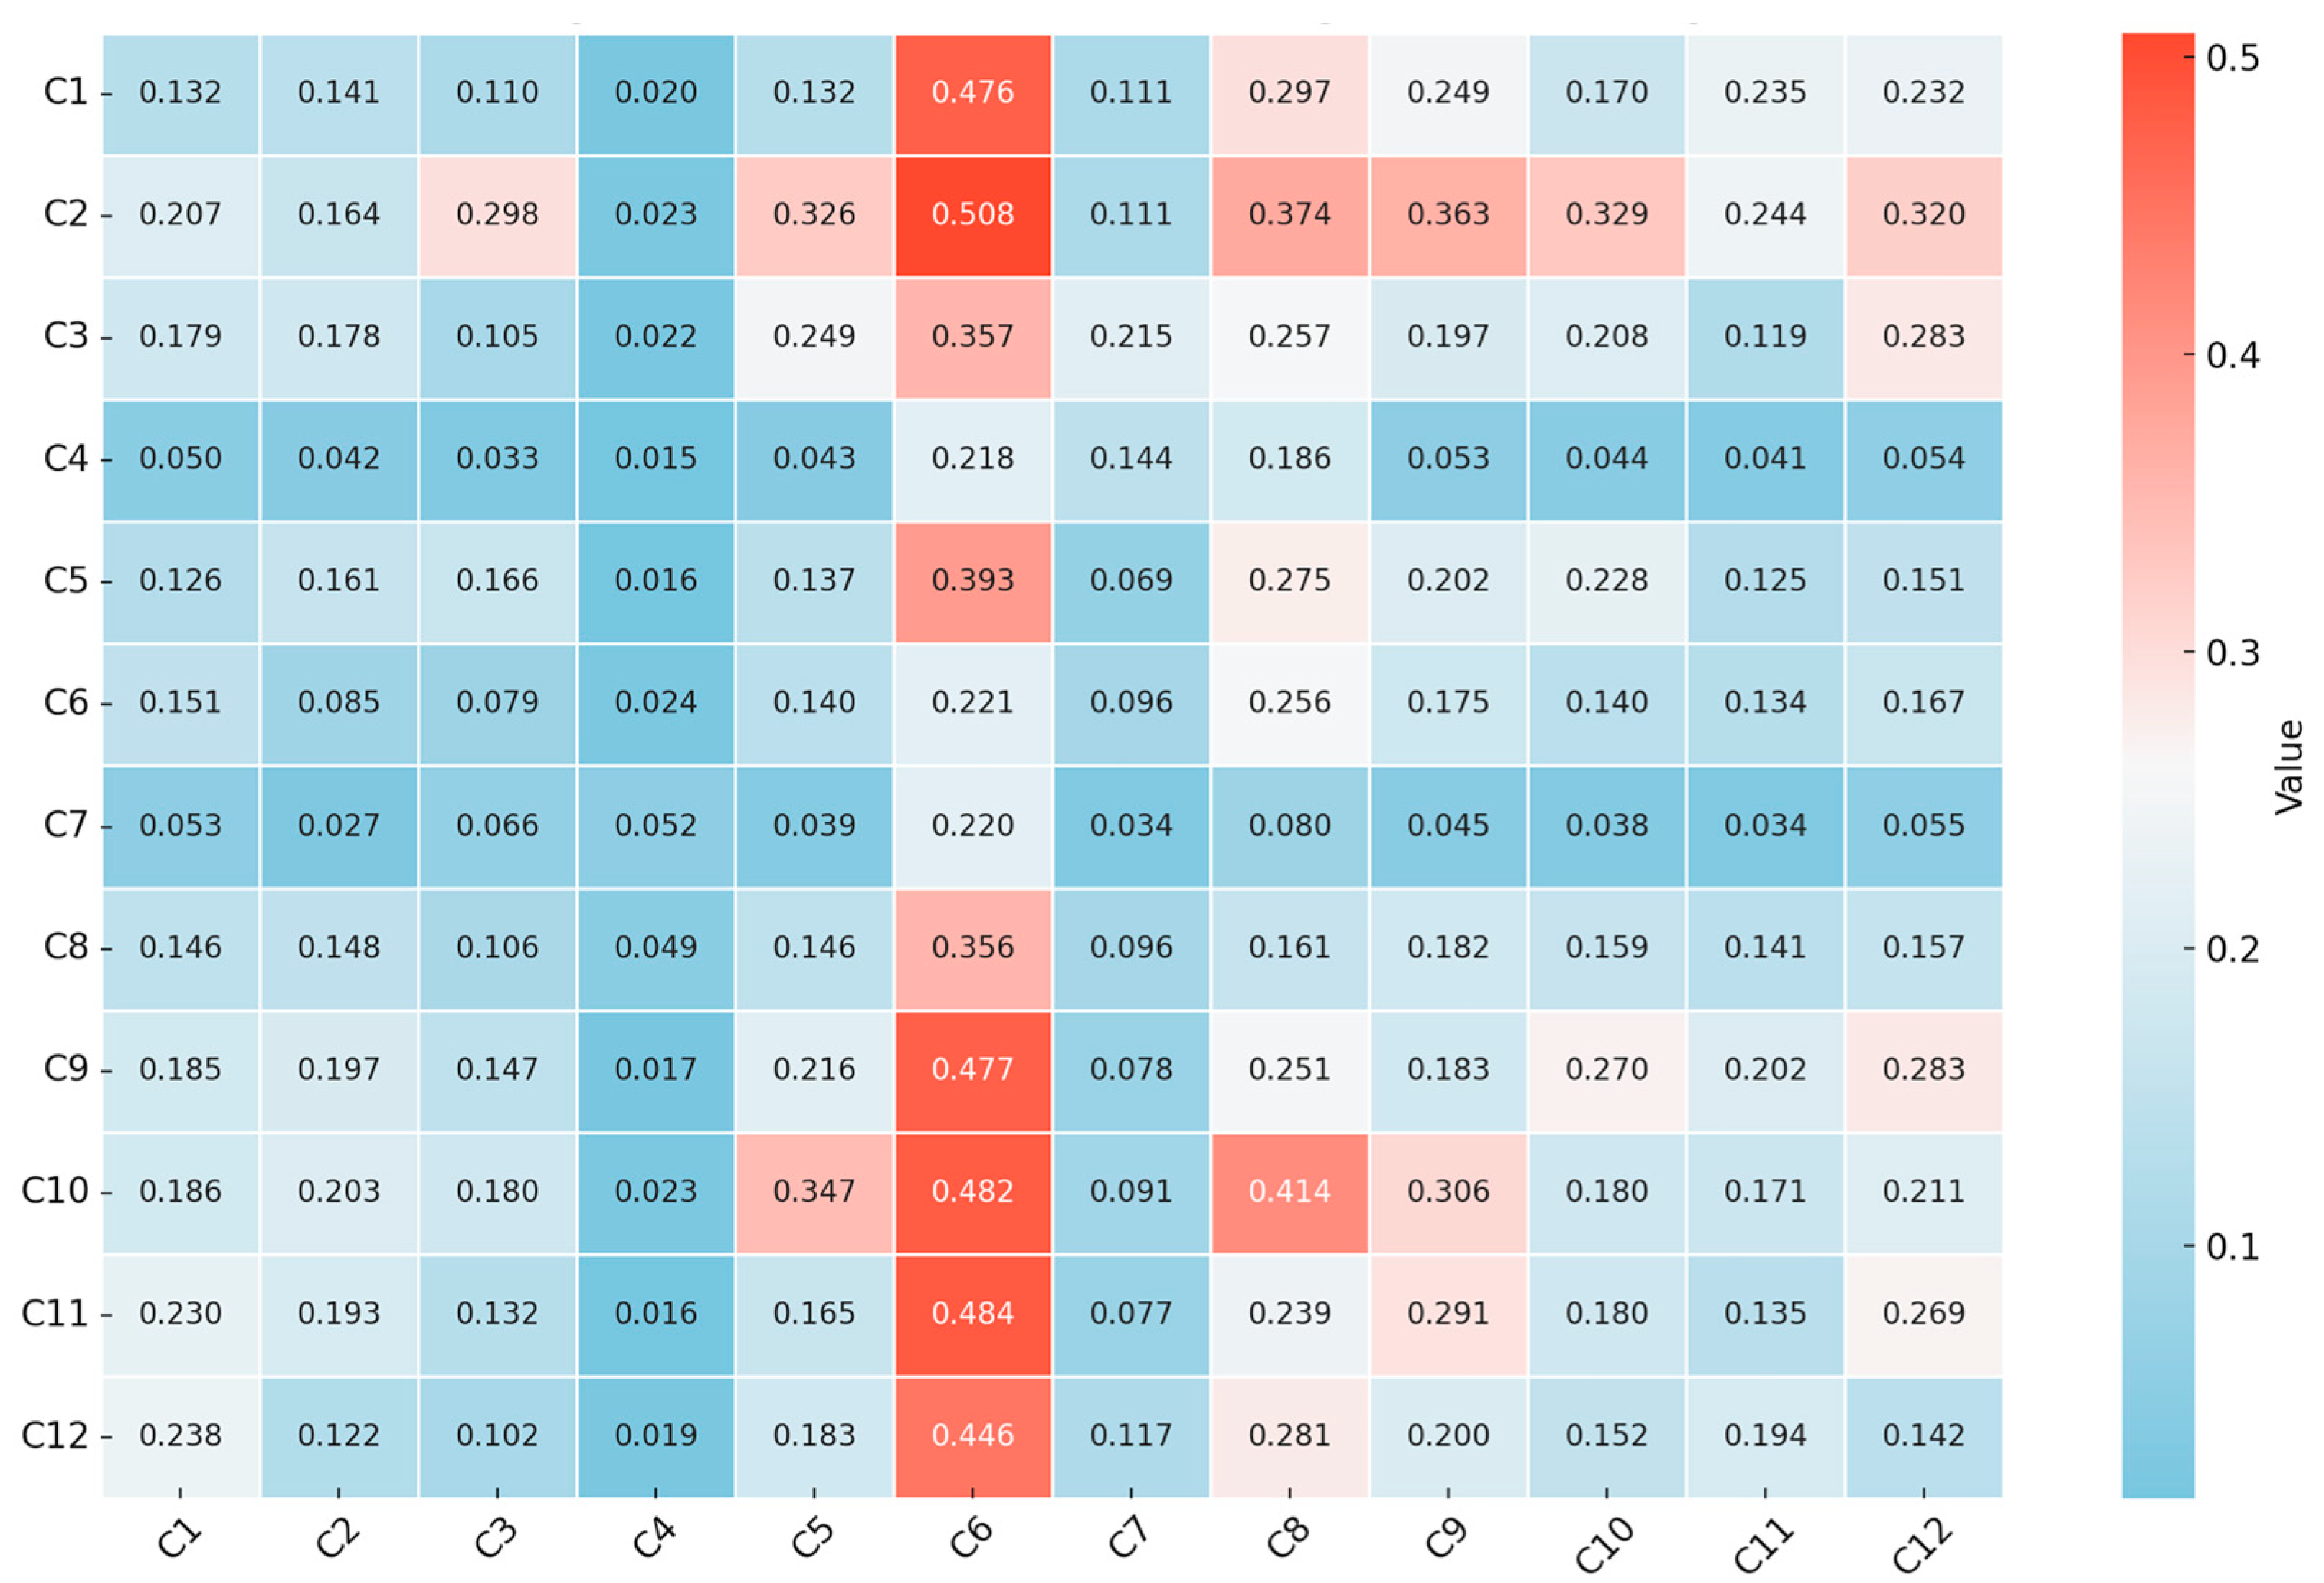
Figure 4 shows the heatmap of the total influence matrix between criteria derived from the DEMATEL method, where each cell value represents the impact of one criterion on another. Red shades indicate stronger positive impacts, while blue shades represent weaker impacts. The figure reveals strong positive causal relationships between certain criteria, especially the impact of C2, C10, and C11 on C6, which are predominantly shown in red (with values of 0.508, 0.482 and 0.484, respectively, among the highest in the matrix). Some criteria have weaker influences on others, such as C5, C9, and C11 on C4, represented by blue regions in the heatmap (all with influence values below 0.02). This implies that C6 is a core outcome factor highly driven by C1, C2, and C9, while C4 remains relatively independent of changes in other criteria.
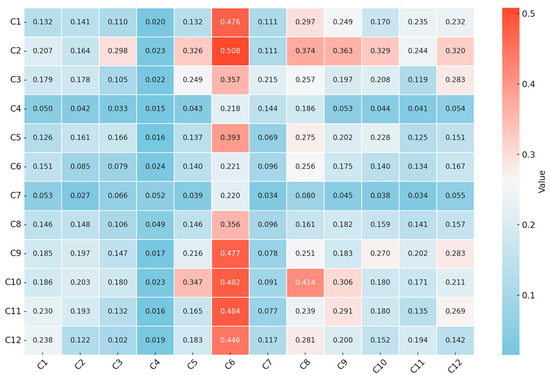
Figure 4.
Heatmap of the total influence matrix between criteria.
4.3.2. Objective Weights Calculated by Entropy Method
In this stage, we invited three designers with extensive product design experience and two healthcare professionals with over five years of nursing experience from the expert panel to evaluate the 12 design criteria of the six proposed schemes. The evaluation process utilized a seven-level linguistic scale (adopted from [53], Table 7), where VG represents the highest performance for a given criterion, and VB represents the lowest.

Table 7.
Linguistic values of TrIFN for linguistic terms regarding scheme performance rating.
Based on the scores from the five experts, an expert evaluation matrix was constructed, as shown in Table 8, which was then converted into a TrIFN score matrix. Through Equation (7), the experts’ expected crisp value matrix was obtained, as shown in Table 9. After standardizing the data, the entropy values for criteria were calculated by Equation (15). The resulting information entropy values, information utility values, and objective weights are shown in Table 10. The results indicated that the top three criteria were C6, C4, and C7, with objective weights of 19.2314%, 15.3940%, and 10.7639%, respectively. These criteria have the most significant impact on the overall system. In contrast, the criteria with lower ranks include C8 (Wobj = 2.9503%) and C10 (Wobj = 1.3224%), which have relatively small weights and weaker influence on the system. The results highlight the differences among the criteria, providing valuable insights for identifying key factors and guiding decision-making optimization.

Table 8.
Aggregation matrix of experts’ linguistic evaluation.

Table 9.
Aggregation matrix of Experts’ Expected crisp value of schemes.

Table 10.
Objective weights by entropy method.
4.3.3. Comprehensive Weight Calculation
After multiple rounds of surveys, the preferences of experts for each criterion gradually converged. To balance subjective judgments with objective data on an equal footing, the weight preference factor α was set to 0.5 as a principled baseline. The robustness of this choice was subsequently validated through an extensive sensitivity analysis (see Section 4.5.2), which confirmed the stability of the ranking outcomes against variations in α. By Equation (19), the comprehensive weights shown in Table 11 were derived under the condition of α = 0.5.

Table 11.
Comprehensive weights.
Based on the comprehensive weights with α = 0.5 (Table 11), the study draws the following conclusions: the comprehensive weight (Wcom) shows that criterion C6 (Comfort) dominates as the core decision factor with an absolute advantage of 15.9%. Both its subjective (0.1257) and objective (0.1923) weights are the highest, highlighting its dual importance in both expert knowledge and data representation. Criteria C9 (User-friendliness) (9.36%) and C12 (Adjustability) (9.19%) form the second tier of key criteria. Together, these three criteria account for 34.5% of the total weight, driving the preferred direction for the final choice. Although C4 (Renewable materials) has the second-highest objective weight (15.39%), its subjective weight (0.0243) is extremely low, resulting in a comprehensive weight of only 8.91% (ranked 4th), which reveals the experts’ significant underestimation of real data differences. In contrast, C10 (Health monitoring) has the lowest objective weight (1.32%), and despite having a relatively high subjective weight (9.75%) ranked 5th, its final comprehensive weight (5.54%) remains the lowest. This outcome validates the dual correction effect of the subjective–objective fusion mechanism: it both suppresses subjective overestimation of certain criteria through objective data and relies on expert cognition to compensate for strategic values not captured by the data. However, the cognitive conflict surrounding C4 highlights the need for further verification of data representativeness and expert judgment to enhance the robustness of the overall decision-making system.
4.4. Ranking Schemes Through TrIF-CoCoSo
Combining the obtained evaluation and comprehensive weights, the TrIF-CoCoSo method was used to evaluate and rank the above six design schemes.
Step 1: TrIFN evaluation matrixes were constructed based on the linguistic rating scale (Table 7) and the experts’ linguistic evaluation data (Table 8).
Step 2: The expected crisp value score matrix for each expert was obtained by converting TrIFN to expected crisp value through Equation (7). Assuming the same weight for each expert, the above expected crisp value matrixed was aggregated to obtain the aggregated score matrix, as shown in Table 9.
Step 3. According to Equation (21) in CoCoSo method, the obtained comprehensive weights (Table 11) and the expected crisp value matrix (Table 9) were used to obtain the weighted performance matrix, as shown in Table 12.

Table 12.
Aggregation matrix of weighting Expected crisp value of schemes.
Step 4: Based on Equations (22)–(25), the weighted sum results (Si), weighted product results (Pi), and the final comprehensive score (Ki) were calculated, and the schemes were ranked, as shown in Table 13.

Table 13.
Ranking of schemes.
According to the comprehensive ranking results shown in Table 13 (scheme C > E > D > A > F > B), scheme C significantly leads due to its overall advantages across various criteria, especially in key criteria such as the use of renewable materials, safety, and user-friendliness. This confirms that its design achieves multi-objective collaborative optimization. Although schemes D and E rank in the second tier, both exhibit certain structural weaknesses. Specifically, scheme D demonstrates considerable technical advancement in health monitoring and automation control but suffers from weakened maintainability. Scheme E, while excelling in user-friendliness and durability, shows weaker consideration for recyclability and automation control. Furthermore, Scheme B, with its excessive focus on intelligent technology, neglects fundamental performance such as durability, resulting in an imbalance across multiple criteria and the lowest overall performance.
4.5. Comparative Experiments and Sensitivity Analysis
4.5.1. Comparative Experiments
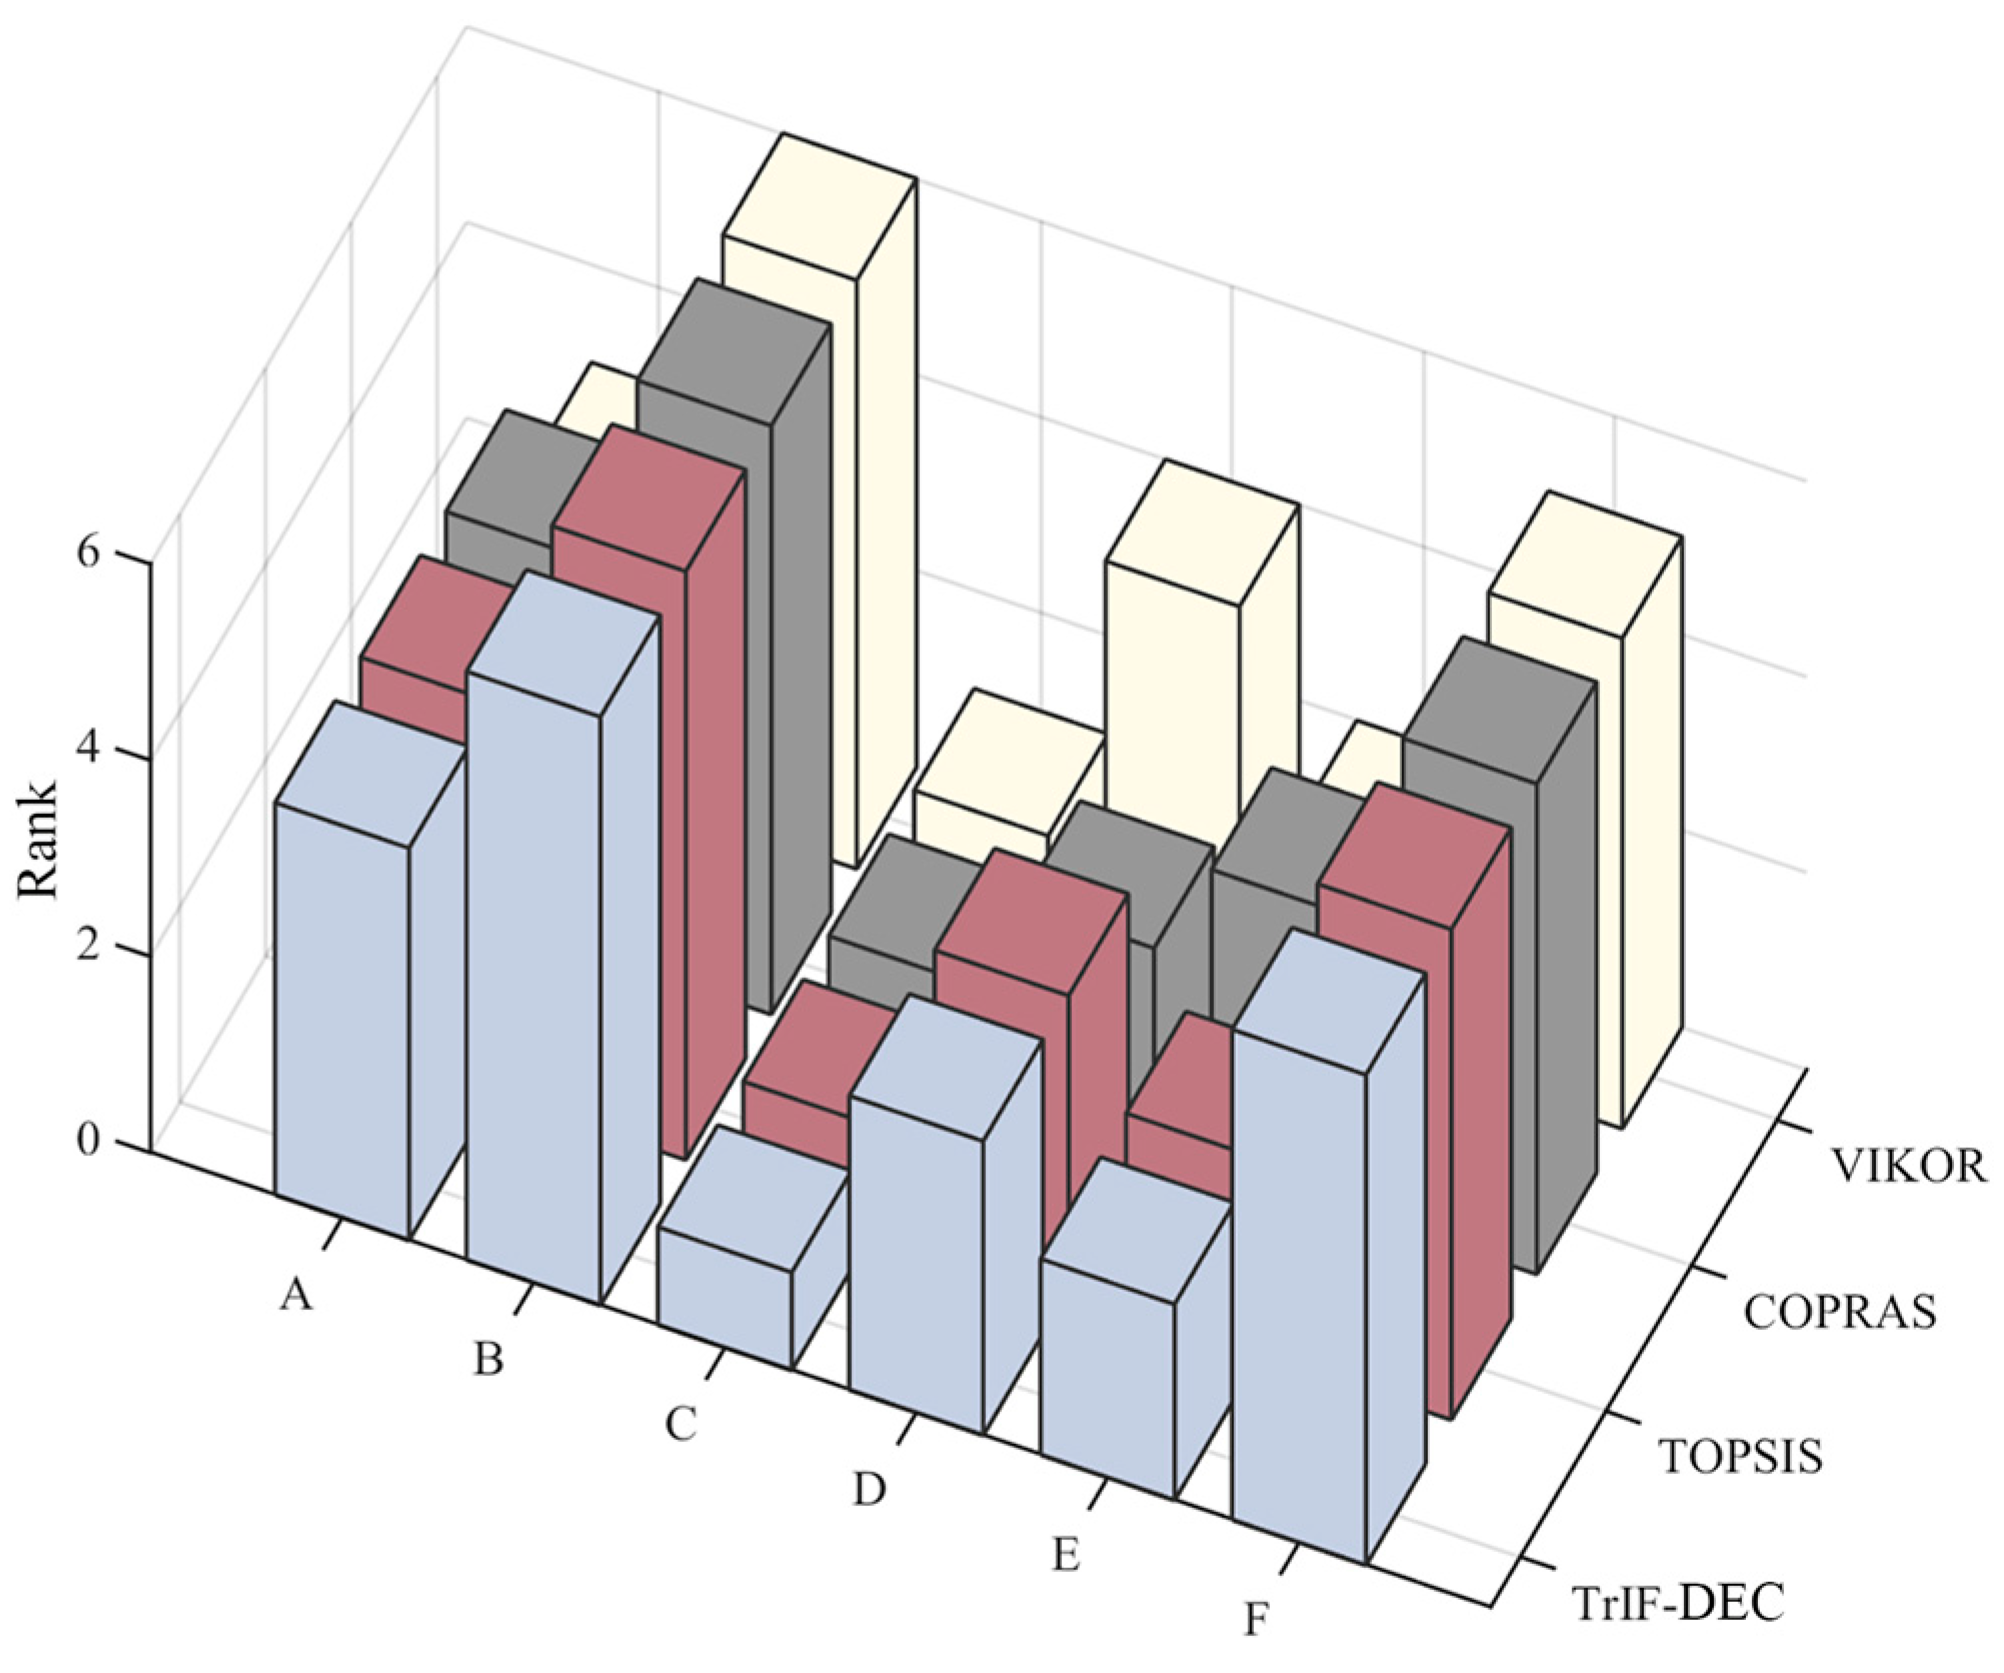
To verify the stability and effectiveness of the TrIF-DEC framework proposed in this study, we compared it with three common MCDM methods: TOPSIS [60], VIKOR [61] and COPRAS [62]. All methods were adjusted to handle the same comprehensive weights (Table 11) and scoring data (Table 9) for a fair comparison. Table 14 presents the ranking results for all methods, and Figure 5 visually illustrates the evaluation outcomes.

Table 14.
Comparison of different methods of ranking.
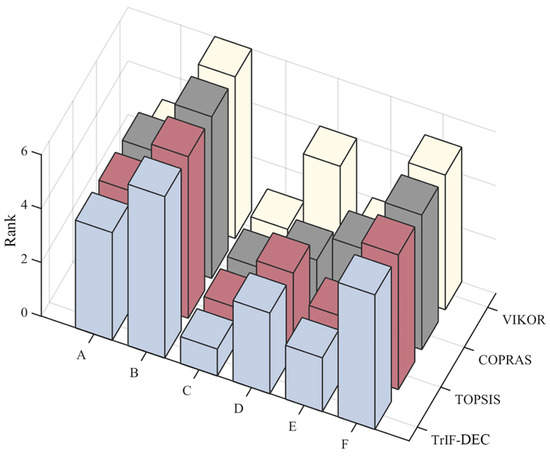
Figure 5.
Comparison of scheme rankings using different MCDM methods.( Blue cubes: VIKOR, Orange cubes: COPRAS, Gray cubes: TOPSIS, Yellow cubes: THF-DEC.).
As directly evidenced in Figure 5, the comparison results show a high degree of consistency in the rankings across all four methods, demonstrating the stability and reliability of the results. Scheme C received the highest score and ranked first among all methods, reflecting its significant advantages in comprehensive performance. Schemes D, E, and A exhibited minimal ranking variation, while scheme F consistently ranked fifth and scheme B remained in the last position.
Although the scoring methods for each approach differ, the final results are largely consistent. TOPSIS evaluates alternatives based on their distance to the ideal and negative ideal solutions. In this calculation, scheme C has the highest relative closeness to the positive and negative ideal solutions and ranks first, while scheme B ranks last. VIKOR balances group effects (S) and individual regret (R), calculating the compromise ratio (Q) for ranking alternatives. The result is QC < QE < QA < QD < QF < QB, with scheme C again ranking first. Furthermore, COPRAS ranks the alternatives by maximizing and minimizing attributes, with the overall benefit value (Gi) used for ranking. The higher the Gi value, the better the alternative. Scheme C has the highest Gi (GC = 0.928208), followed by GD > GE > GA > GF, with scheme B having the smallest Gi (GB = 0.600015).
Through comparison, the TrIF-DEC framework demonstrates clear reliability in evaluating schemes. By capturing uncertainty in real-world problems using TrIFN and combining weighted sum and weighted product strategies, the framework provides a comprehensive evaluation of schemes from multiple dimensions, eliminating bias that may arise from single-strategy methods. Therefore, the method is characterized by comprehensiveness, robustness, and broad applicability. It is suitable not only for schemes where design criteria are relatively independent but also for cases where strong correlations exist between criteria, making it versatile in various decision-making contexts.
4.5.2. Sensitivity Analysis
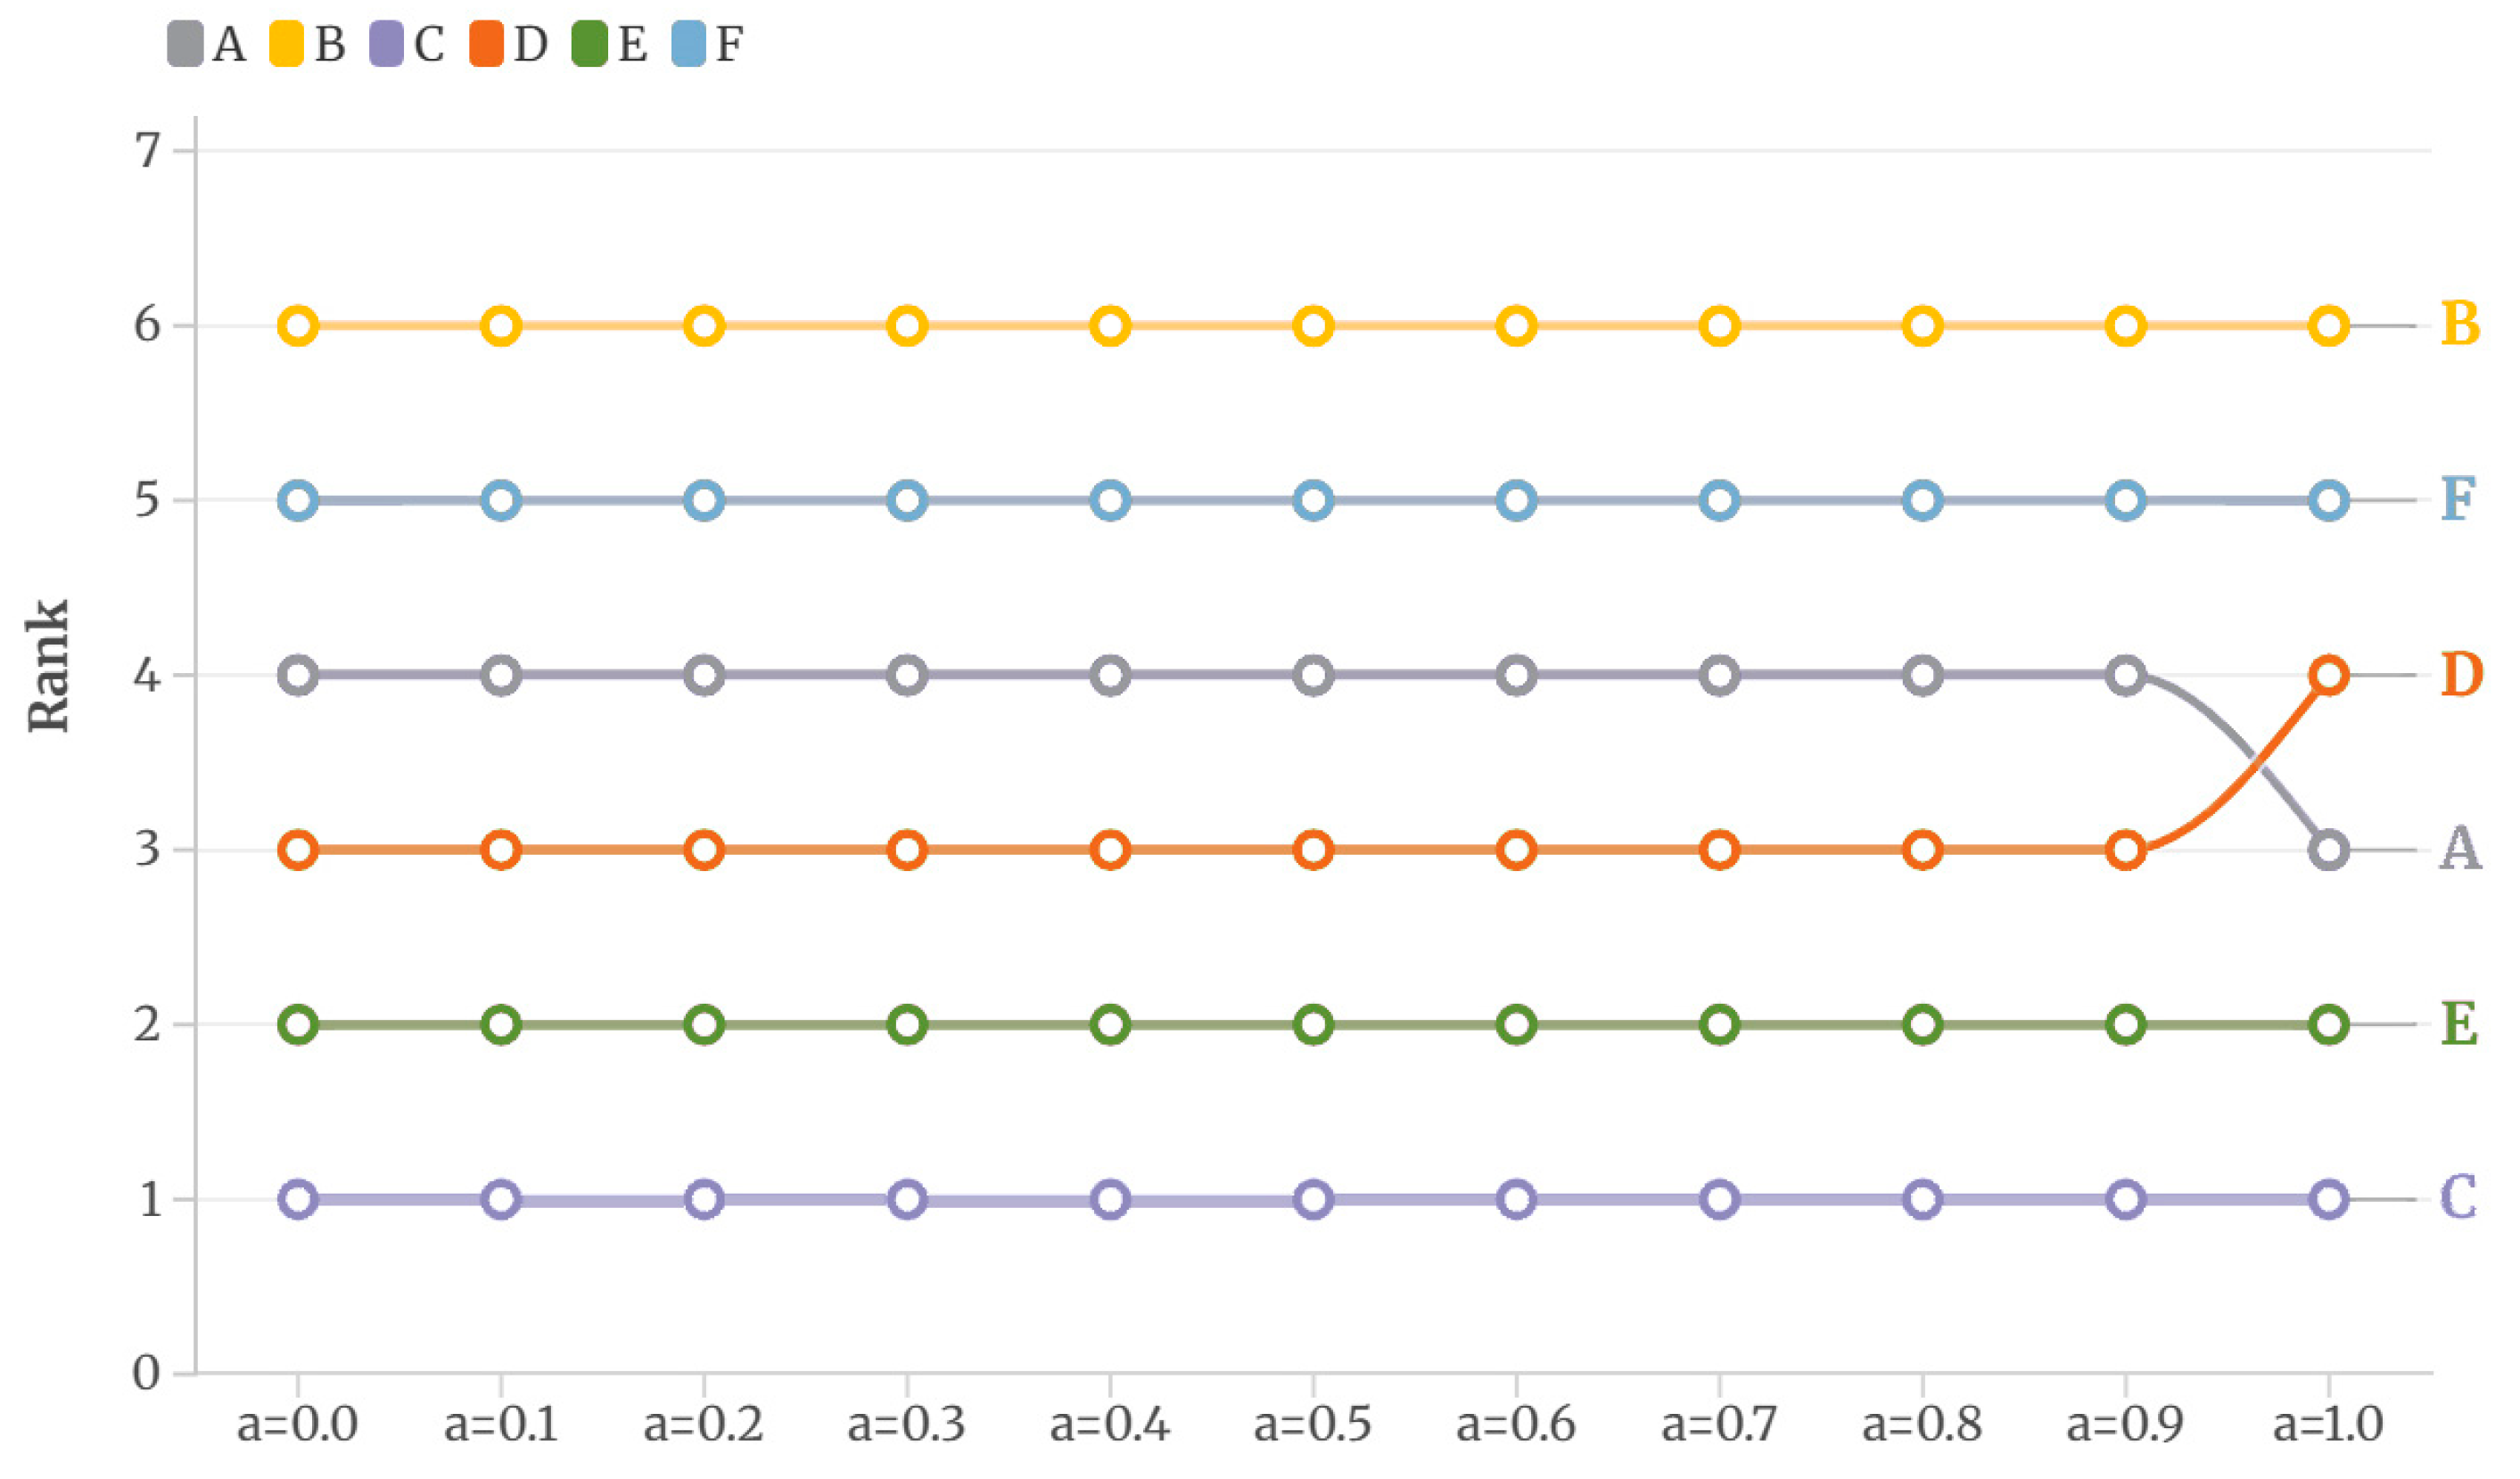
To examine the impact of weight preference factor α on the final ranking of design schemes, this study conducted a sensitivity analysis by adjusting α within the range of 0 to 1, with a step size of 0.1, to observe changes in the allocation of subjective and objective weights. This factor reflects the trade-off between the subjective preferences of relevant stakeholders and objective conditions in the decision-making process. Figure 6 illustrates the changes in the rankings of schemes under different values of α.
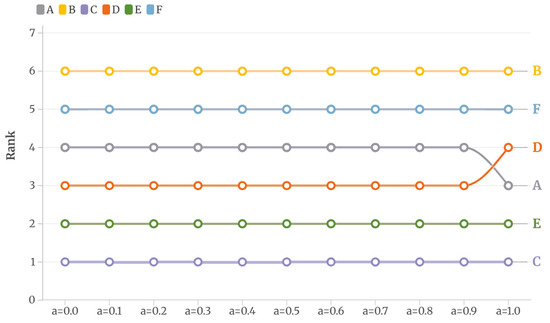
Figure 6.
Changes in scheme rankings with different weight preference factors.
From the sensitivity analysis, it is evident that regardless of changes in the weight preference factor α, schemes C and E consistently remain in the top two positions, reflecting their outstanding overall performance. Schemes A and D maintain stable rankings in third and fourth place, with a single ranking crossover occurring only between α = 0.9 and α = 1.0. Meanwhile, schemes F and B consistently rank fifth and sixth. This demonstrates that even with variations in the balance of subjective and objective weights, the proposed TrIF-DEC framework maintains consistency in its evaluation results. This robust performance validates the effectiveness and reliability of the method in evaluating nursing bed design options.
5. Discussion
5.1. Evaluation of Experimental Results
Sustainable product design has evolved from an orientation solely on environmental concerns to a comprehensive strategy integrating economic, social, technological, and environmental dimensions. It has become a core pathway of industrial green transformation. By introducing fuzzy environments to capture the uncertainties in evaluation and combining subjective–objective integrated weighting with stable evaluation method (CoCoSo), this study aims to optimize the evaluation process of product sustainable design. Focusing on nursing beds, a high-impact product category, the results of this study show that the TrIF-DEC framework successfully identifies scheme C as the optimal solution, which excels in comfort, renewable material utilization, and user-friendliness. It further highlights that, for the sustainable design of nursing beds, experts and users place greater emphasis on user experience and environmentally friendly materials, which consequently have higher importance.
The comparison with existing MCDM methods demonstrates a significant degree of consistency in the evaluation results. This experiment compared TrIF-DEC with three mainstream MCDM methods, including TOPSIS, VIKOR, and COPRAS. All methods used the same comprehensive weights and scoring data to ensure consistency and fairness in evaluation conditions. The experimental results show that scheme C consistently ranks first across all methods, while Designs F and B remain in the fifth and sixth positions, respectively. This outcome not only confirms the scientific validity of the TrIF-DEC evaluation but also validates its compatibility with mainstream methods.
Furthermore, sensitivity analysis further confirms the stability of the evaluation results. The analysis systematically adjusted the weight preference factor α (ranging from 0 to 1, with a step size of 0.1) to examine the impact of changes in the distribution of subjective and objective weights on ranking results. It shows that, regardless of changes in α, the rankings for all schemes remained stable, except for a single crossover between schemes A and D in the range of α = 0.9 to α = 1.0. This finding strongly demonstrates the robustness of the TrIF-DEC framework to changes in weight configuration, providing decision-makers with reliable confidence in the robustness of evaluation.
5.2. Significance and Broader Implications
The TrIF-DEC framework proposed in this study not only offers theoretical innovation but also introduces a new pathway for sustainable product design in practice.
On a theoretical level, this study provides a systematic methodology that addresses core methodological gaps in sustainable design evaluation. It introduces a structured approach to model semantic ambiguity and hesitation in expert judgments, moves beyond the subjective–objective dichotomy in weighting through a causal-data hybrid mechanism, and enhances decision robustness under uncertainty via multi-strategy aggregation. Collectively, these elements form an integrated framework that effectively reconciles and balances the often-conflicting demands of uncertainty modeling, weighting justification, and ranking stability, thereby establishing a systematic and reliable decision-making architecture for complex sustainability assessments.
In the field of medical device design, the framework provides scientific decision-making support for the development of high-impact medical products, such as nursing beds. This directly translates into reduced operational costs for healthcare institutions, improved patient satisfaction, and a reduction in the environmental impact. Furthermore, the structural design of the TrIF-DEC framework endows it with powerful cross-domain transferability, allowing it to be seamlessly applied to the evaluation of complex products, such as smart robotics, smart homes, and new energy vehicles, with minor adjustments or customizations to the criteria set. This flexibility underscores its potential as a general-purpose tool for sustainable evaluation across the manufacturing and technology sectors.
For companies, the framework effectively addresses the imbalance in traditional design evaluation, which often prioritizes economic factors over social aspects or technical factors over environmental concerns. By integrating four-dimensional evaluation criteria—social, economic, technological, and environmental—it enables companies to systematically assess the sustainability performance throughout the product lifecycle at the conceptual stage, helping to avoid cost overruns and environmental issues in later design phases. This proactive assessment capability is crucial for strategic resource allocation and long-term risk management. Particularly for small and medium-sized enterprises (SMEs), especially those focused on design-driven innovation, the TrIF-DEC framework structures complex multi-criteria decision-making processes, making it comprehensible even for decision-makers without a technical background.
Beyond being an evaluation tool, TrIF-DEC acts as a catalyst for shifting design thinking from simply “meeting functional requirements” to “creating sustainable value.” It bridges the critical gap between decision theory and sustainable product practice, offering a replicable and scalable framework that further contributes to the green transformation of the manufacturing industry. By providing a concrete methodology, it lowers the barrier to adopting systematic sustainability assessments, thereby promoting their wider adoption and potentially accelerating industry-wide practices towards more sustainable outcomes.
5.3. Limitations and Future Directions
Although the proposed framework has demonstrated robust performance in product evaluation, particularly in the case of sustainable nursing bed design, its application still has limitations. The primary limitation stems from the fragility of the input data: the relatively small size and potential lack of diversity in the expert evaluation team may limit the representativeness of the subjective judgments and introduce systematic cognitive biases [71]. This raises concerns about the generalizability of the derived subjective weights beyond the specific expert context of this study. At the same time, the entropy method is highly sensitive to the quality of empirical data [65], and incomplete or noisy data will directly weaken the objectivity of the weights. Consequently, the robustness of our hybrid weighting mechanism is contingent upon the quality and scale of the underlying data set. The sensitivity of the final weight to the parameter α will be significantly amplified when expert consensus is lacking. Second, the multi-criteria evaluation strategy in CoCoSo (e.g., conflicts between weighted sum and weighted product rankings) may lead to a decrease in the interpretability of the results, which is beyond the understanding of non-technical decision-makers [72]. While this did not critically impact the ranking stability in our case, it presents a potential barrier for practical adoption. Third, the current validation relies solely on a single case study in the domain of sustainable healthcare product design. While this application demonstrates the framework’s feasibility, it does not provide sufficient evidence of its adaptability across different product categories, industrial sectors, or cultural contexts. This limits the external validity and broader applicability of the proposed approach.
To address the above limitations and improve the applicability of the framework, future research can be explored in the following two directions:
- (1)
- To improve data quality, future research can introduce multi-source data fusion technology, such as an adaptive weight adjustment mechanism based on machine learning, to reduce the impact of data noise and expert opinion bias on the results. Furthermore, expanding the size and diversity of the expert panel, along with employing more sophisticated verification methods, such as expert rating aggregation models based on consistency checks, can be used to reduce weight fluctuations caused by insufficient expert consensus.
- (2)
- The multi-criteria strategy of the CoCoSo method can be simplified by adopting a weighted average method or a decision tree-based model to reduce conflicts between strategies and improve the interpretability of the results. At the same time, a graphical decision support system can be combined to present the complex multi-criteria evaluation process through intuitive charts, making it easier for non-technical decision-makers to understand.
- (3)
- Future studies should validate the framework across multiple case studies involving diverse product types (e.g., consumer electronics, sustainable packaging, or public infrastructure) and varied stakeholder contexts. Such cross-domain applications would not only test the robustness of the hybrid weighting mechanism but also enhance the framework’s generalizability and practical relevance in real-world design scenarios.
6. Conclusions
The evaluation of sustainable product design is frequently challenged by semantic ambiguity in expert judgments, imbalanced weight assignment, and ranking instability. In response, this study developed the TrIF-DEC framework, an integrated approach that leverages TrIF with DEMATEL, Entropy, and CoCoSo methods. The empirical validation through a nursing bed design case study confirmed the framework’s effectiveness, a finding robustly supported by consistent results from comparative analysis with TOPSIS, VIKOR, and COPRAS, and stability under sensitivity testing.
This research makes distinct contributions by demonstrating how the TrIF-DEC framework systematically addresses the identified challenges. Firstly, the use of TrIF enables a superior capture of the fuzziness and hesitation inherent in expert linguistic assessments. Secondly, the hybrid DEMATEL-Entropy weighting mechanism uniquely bridges causal relationship analysis with data-driven dispersion metrics, producing a more balanced and justified criterion importance. Finally, the integration with CoCoSo provides a multi-strategy ranking procedure that enhances the robustness and reliability of the final decision. Beyond methodological innovation, the study delivers a practical and actionable decision-support tool, underpinned by a four-dimensional sustainability criteria system (social, economic, technological, environmental), for evaluating complex products like medical devices.
Notwithstanding these contributions, the study has limitations, primarily regarding the dependency on the quality of expert input and empirical data, and its validation within a single product domain. Future research should focus on integrating data fusion techniques to mitigate bias, enhancing the interpretability of the decision output for non-experts, and applying the framework across diverse product categories and industrial contexts to further establish its generalizability.
In summary, by seamlessly integrating advanced uncertainty modeling, holistic weighting, and stable ranking, the TrIF-DEC framework offers a scientifically grounded and practically viable pathway for advancing sustainable product design evaluation, thereby contributing to the broader goal of industrial green transformation.
Author Contributions
Conceptualization, W.X.; methodology, W.X.; software, W.X.; validation, X.C. and R.Q.; Investigation, W.X. and R.Q.; resources, Y.L.; writing—original draft preparation, W.X. and X.C.; writing—review and editing, R.Q.; visualization, Y.L.; supervision, W.X.; funding acquisition, X.C. All authors have read and agreed to the published version of the manuscript.
Funding
This research is supported by the Social Sciences 14th Five-Year Plan Fund of Jiangxi Province (Grant No. 22YS29D); the 2025 Jiangxi Provincial Planning Project of Education Science (Grant No. 2025GYB082); and the Jiangxi Provincial Planning Special Project of Education Science (Grant No. 2025ZX187).
Institutional Review Board Statement
Not applicable.
Informed Consent Statement
Not applicable.
Data Availability Statement
The raw data supporting the conclusions of this article will be made available by the authors on request.
Conflicts of Interest
The authors declare no conflicts of interest.
References
- Tao, J.; Yu, S. Product Life Cycle Design for Sustainable Value Creation: Methods of Sustainable Product Development in the Context of High Value Engineering. Procedia CIRP 2018, 69, 25–30. [Google Scholar] [CrossRef]
- He, B.; Luo, T.; Huang, S. Product sustainability assessment for product life cycle. J. Clean. Prod. 2019, 206, 238–250. [Google Scholar] [CrossRef]
- Mengistu, A.T.; Dieste, M.; Panizzolo, R.; Biazzo, S. Sustainable product design factors: A comprehensive analysis. J. Clean. Prod. 2024, 463, 142260. [Google Scholar] [CrossRef]
- Zhong, X.; Cheng, Y.; Yang, J.; Tian, L. Evaluation and Optimization of In-Vehicle HUD Design by Applying an Entropy Weight-VIKOR Hybrid Method. Appl. Sci. 2023, 13, 3789. [Google Scholar] [CrossRef]
- Bian, Z.; Zhang, Y.; Lin, H.; Zhu, Y.; Zhang, J. Integrating Sustainability into Biologically Inspired Design: A Systematic Evaluation Model. Biomimetics 2025, 10, 111. [Google Scholar] [CrossRef] [PubMed]
- Kar, A.; Rai, R.N. QFD-based hybrid neutrosophic MCDM approach with Six Sigma evaluation for sustainable product design in Industry 4.0. Kybernetes 2025, 54, 3238–3266. [Google Scholar] [CrossRef]
- Gabus, A.; Fontela, E. World Problems, an Invitation to Further Thought Within the Framework of DEMATEL; Battelle Geneva Research Centre: Geneva, Switzerland, 1972; Volume 1, pp. 12–14. [Google Scholar]
- Zhu, Y.; Tian, D.; Yan, F. Effectiveness of entropy weight method in decision-making. Math. Probl. Eng. 2020, 2020, 3564835. [Google Scholar] [CrossRef]
- Beg, I.; Rashid, T. Group decision making using intuitionistic hesitant fuzzy sets. Int. J. Fuzzy Log. Intell. Syst. 2014, 14, 181–187. [Google Scholar] [CrossRef]
- Wang, T. A Novel Approach of Integrating Natural Language Processing Techniques with Fuzzy TOPSIS for Product Evaluation. Symmetry 2022, 14, 120. [Google Scholar] [CrossRef]
- Narayanamoorthy, S.; Geetha, S.; Rakkiyappan, R.; Joo, Y.H. Interval-valued intuitionistic hesitant fuzzy entropy based VIKOR method for industrial robots selection. Expert Syst. Appl. 2019, 121, 28–37. [Google Scholar] [CrossRef]
- Song, W.; Niu, Z.; Zheng, P. Design concept evaluation of smart product-service systems considering sustainability: An integrated method. Comput. Ind. Eng. 2021, 159, 107485. [Google Scholar] [CrossRef]
- Singh, M.K. Application of Triangular Fuzzy Numbers in Taking Optimal Decision. In Decision Making in Inventory Management; Shah, N.H., Mittal, M., Cárdenas-Barrón, L.E., Eds.; Springer: Singapore, 2021; pp. 219–230. [Google Scholar]
- Singh, A.; Malik, S.K. Major MCDM Techniques and their application-A Review. IOSR J. Eng. 2014, 4, 15–25. [Google Scholar] [CrossRef]
- Yazo-Cabuya, E.J.; Ibeas, A.; Herrera-Cuartas, J.A. Integration of Sustainability in Risk Management and Operational Excellence through the VIKOR Method Considering Comparisons between Multi-Criteria Decision-Making Methods. Sustainability 2024, 16, 4585. [Google Scholar] [CrossRef]
- Xie, X.-H.; Xu, Y.; Guo, S.; Zhu, H.; Yan, H. Evaluation and Decision of a Seat Color Design Scheme for a High-Speed Train Based on the Practical Color Coordinate System and Hybrid Kansei Engineering. Systems 2024, 12, 316. [Google Scholar] [CrossRef]
- Wang, T.; Yang, L.; Liu, L. Integrating GRA with intuitionistic fuzzy VIKOR model to explore attractive design solution of wickerwork cultural and creative products. J. Eng. Des. 2025, 36, 52–86. [Google Scholar] [CrossRef]
- Li, M.; Zhang, J. Integrating Kano model, AHP, and QFD methods for new product development based on text mining, intuitionistic fuzzy sets, and customers satisfaction. Math. Probl. Eng. 2021, 2021, 2349716. [Google Scholar] [CrossRef]
- Chen, Z.; Zhong, P.; Liu, M.; Ma, Q.; Si, G. A novel integrated MADM method for design concept evaluation. Sci. Rep. 2022, 12, 15885. [Google Scholar] [CrossRef]
- Desing, H.; Braun, G.; Hischier, R. 108 The resource reduction index–evaluating product design’s contribution to a sustainable circular economy. In Proceedings of the 20th European Round Table on Sustainable Consumption and Production, Graz, Austria, 8–10 September 2021. [Google Scholar] [CrossRef]
- Panuju, A.Y.T.; Martinus, M.; Riszal, A.; Kobayashi, H. Sustainable design implementation–Measuring environmental impact and user responsibility. Int. J. Autom. Technol. 2022, 16, 814–823. [Google Scholar] [CrossRef]
- Linke, B.; Garcia, D.; Kaur, G.; Ghadamli, F. Sustainable Process Planning for Subtractive and Additive Manufacturing Unit Processes. In Proceedings of the International Manufacturing Science and Engineering Conference, Blacksburg, VA, USA, 27 June–1 July 2016; p. V003T008A012. [Google Scholar]
- Mehrpouya, M.; Vosooghnia, A.; Dehghanghadikolaei, A.; Fotovvati, B. The benefits of additive manufacturing for sustainable design and production. In Sustainable Manufacturing; Elsevier: Amsterdam, The Netherlands, 2021; pp. 29–59. [Google Scholar]
- Khaleeq uz Zaman, U.; Siadat, A.; Rivette, M.; Baqai, A.A.; Qiao, L. Integrated product-process design to suggest appropriate manufacturing technology: A review. Int. J. Adv. Manuf. Technol. 2017, 91, 1409–1430. [Google Scholar] [CrossRef]
- Milošev, I.; Scully, J.R. Challenges for the corrosion science, engineering, and technology community as a consequence of growing demand and consumption of materials: A sustainability issue. Corrosion 2023, 79, 988–996. [Google Scholar] [CrossRef]
- Zarandi, M.H.F.; Mansour, S.; Hosseinijou, S.A.; Avazbeigi, M. A material selection methodology and expert system for sustainable product design. Int. J. Adv. Manuf. Technol. 2011, 57, 885–903. [Google Scholar] [CrossRef]
- Vienken, J.; Boccato, C. Do medical devices contribute to sustainability? The role of innovative polymers and device design. Int. J. Artif. Organs 2024, 47, 240–250. [Google Scholar] [CrossRef] [PubMed]
- Gould, R.K.; Bratt, C.; Lagun Mesquita, P.; Broman, G.I. Integrating Sustainable Development and Design-Thinking-Based Product Design. In Technologies and Eco-innovation towards Sustainability I: Eco Design of Products and Services; Hu, A.H., Matsumoto, M., Kuo, T.C., Smith, S., Eds.; Springer: Singapore, 2019; pp. 245–259. [Google Scholar]
- Dahmani, N.; Benhida, K.; Belhadi, A.; Kamble, S.; Elfezazi, S.; Jauhar, S.K. Smart circular product design strategies towards eco-effective production systems: A lean eco-design industry 4.0 framework. J. Clean. Prod. 2021, 320, 128847. [Google Scholar] [CrossRef]
- Han, J.; Jiang, P.; Childs, P.R. Metrics for measuring sustainable product design concepts. Energies 2021, 14, 3469. [Google Scholar] [CrossRef]
- Odu, G. Weighting methods for multi-criteria decision making technique. J. Appl. Sci. Environ. Manag. 2019, 23, 1449–1457. [Google Scholar] [CrossRef]
- Cho, J.; Lee, J. Development of a new technology product evaluation model for assessing commercialization opportunities using Delphi method and fuzzy AHP approach. Expert Syst. Appl. 2013, 40, 5314–5330. [Google Scholar] [CrossRef]
- Chakraborty, K.; Mondal, S.; Mukherjee, K. Analysis of product design characteristics for remanufacturing using Fuzzy AHP and Axiomatic Design. J. Eng. Des. 2017, 28, 338–368. [Google Scholar] [CrossRef]
- Sahoo, S.; Choudhury, B. Optimal selection of an electric power wheelchair using an integrated COPRAS and EDAS approach based on Entropy weighting technique. Decis. Sci. Lett. 2022, 11, 21–34. [Google Scholar] [CrossRef]
- Yu, S.; Zhu, Y.; Liu, F.; Zhong, Z.; Sun, J. AHP-CRITIC-TOPSIS-based Analysis of the Influence of Young People’s Preferences on the Design of Funan Wicker Home Products. BioResources 2024, 19, 8216–8237. [Google Scholar] [CrossRef]
- Koksalmis, E.; Hancerliogullari Koksalmis, G.; Kabak, O. A Combined Method for Deriving Decision Makers’ Weights in Group Decision Making Environment: An Application in Medical Decision Making. In Industrial Engineering in the Big Data Era; Springer International Publishing: Cham, Switzerland, 2019; pp. 503–513. [Google Scholar]
- Hasan, M.Z.; Hossain, S.; Uddin, M.S.; Islam, M.S. A generic approach for weight assignment to the decision making parameters. Int. J. Adv. Comput. Sci. Appl. 2019, 10, 512–519. [Google Scholar] [CrossRef]
- Alinezhad, A.; Khalili, J. New Methods and Applications in Multiple Attribute Decision Making (MADM); Springer: Berlin/Heidelberg, Germany, 2019; Volume 277. [Google Scholar]
- Więckowski, J.; Sałabun, W. Supporting multi-criteria decision-making processes with unknown criteria weights. Eng. Appl. Artif. Intell. 2025, 140, 109699. [Google Scholar] [CrossRef]
- Caisucar, M.; Gaonkar, R.S.P. Uncertainty Identification in New Product Development. Ind. Eng. J. 2018, 10, 41–45. Available online: https://www.academia.edu/104566831/Uncertainty_Identification_in_New_Product_Development (accessed on 22 August 2025). [CrossRef]
- Suttipong, R.; Phanphet, S.; Wangmai, A.; Reungsri, S.; Chattinnawat, W. Extended AHP Approach with Latent Factor and Stratum in Prioritizing and Positioning of OTOP Thailand’s Program for Elderly Market. Int. J. Glob. Optim. Its Appl. 2022, 1, 22–31. [Google Scholar] [CrossRef]
- Govindan, K.; Kannan, D.; Shankar, M. Evaluation of green manufacturing practices using a hybrid MCDM model combining DANP with PROMETHEE. Int. J. Prod. Res. 2015, 53, 6344–6371. [Google Scholar] [CrossRef]
- Chen, P. Effects of the entropy weight on TOPSIS. Expert Syst. Appl. 2021, 168, 114186. [Google Scholar] [CrossRef]
- Rong, Y.; Li, Q.; Pei, Z. A novel q-rung orthopair fuzzy multi-attribute group decision-making approach based on Schweizer-Sklar operations and improved COPRAS method. In Proceedings of the 4th International Conference on Computer Science and Application Engineering, Sanya, China, 22–24 October 2020; pp. 1–6. [Google Scholar]
- Li, X.; Chen, X. Multi-criteria group decision making based on trapezoidal intuitionistic fuzzy information. Appl. Soft Comput. 2015, 30, 454–461. [Google Scholar] [CrossRef]
- De-Jesús-Hernández, S.; Cruz-Suárez, H.; Montes-de-oca, R. Discounted Markov Decision Processes with Fuzzy Costs. Kybernetika 2025, 61, 58–78. [Google Scholar] [CrossRef]
- Ghorabaee, M.K.; Zavadskas, E.K.; Amiri, M.; Turskis, Z. Extended EDAS method for fuzzy multi-criteria decision-making: An application to supplier selection. Int. J. Comput. Commun. Control. 2016, 11, 358–371. [Google Scholar] [CrossRef]
- Kirişci, M.; Demir, I.; Şimşek, N.; Topaç, N.; Bardak, M. The novel VIKOR methods for generalized Pythagorean fuzzy soft sets and its application to children of early childhood in COVID-19 quarantine. Neural Comput. Appl. 2022, 34, 1877–1903. [Google Scholar] [CrossRef]
- Yazdani, M.; Zarate, P.; Kazimieras Zavadskas, E.; Turskis, Z. A combined compromise solution (CoCoSo) method for multi-criteria decision-making problems. Manag. Decis. 2019, 57, 2501–2519. [Google Scholar] [CrossRef]
- Atanassov, K.T. Intuitionistic fuzzy sets. Fuzzy Sets Syst. 1986, 20, 87–96. [Google Scholar] [CrossRef]
- Li, D.-F. Multiattribute decision making models and methods using intuitionistic fuzzy sets. J. Comput. Syst. Sci. 2005, 70, 73–85. [Google Scholar] [CrossRef]
- Nayagam, V.L.G.; Jeevaraj, S.; Dhanasekaran, P. An improved ranking method for comparing trapezoidal intuitionistic fuzzy numbers and its applications to multicriteria decision making. Neural Comput. Appl. 2018, 30, 671–682. [Google Scholar] [CrossRef]
- Govindan, K.; Khodaverdi, R.; Vafadarnikjoo, A. Intuitionistic fuzzy based DEMATEL method for developing green practices and performances in a green supply chain. Expert Syst. Appl. 2015, 42, 7207–7220. [Google Scholar] [CrossRef]
- Ye, J. Expected value method for intuitionistic trapezoidal fuzzy multicriteria decision-making problems. Expert Syst. Appl. 2011, 38, 11730–11734. [Google Scholar] [CrossRef]
- Nehi, H.; Maleki, H. Intuitionistic Fuzzy Numbers and It’s Applications in Fuzzy Optimization Problem. In Proceedings of the 9th WSEAS International Conference on Systems, Athens, Greece, 11–13 July 2005; WSEAS: Athens, Greece, 2005; pp. 1–5. [Google Scholar]
- Ganus, A.; Fontela, E. Perceptions of the World Problematique: Communication Procedure, Communicating with Those Bearing Collective Responsibility. DEMATEL Report No. 1; Battelle Geneva Research Center: Geneva, Switzerland, 1973. [Google Scholar]
- Si, S.-L.; You, X.-Y.; Liu, H.-C.; Zhang, P. DEMATEL technique: A systematic review of the state-of-the-art literature on methodologies and applications. Math. Probl. Eng. 2018, 2018, 3696457. [Google Scholar] [CrossRef]
- Tzeng, G.-H.; Chiang, C.-H.; Li, C.-W. Evaluating intertwined effects in e-learning programs: A novel hybrid MCDM model based on factor analysis and DEMATEL. Expert Syst. Appl. 2007, 32, 1028–1044. [Google Scholar] [CrossRef]
- Nguyen, P.-H.; Tsai, J.-F.; Nguyen, T.-T.; Nguyen, T.-G.; Vu, D.-D. A grey MCDM based on DEMATEL model for real estate evaluation and selection problems: A numerical example. J. Asian Financ. Econ. Bus. 2020, 7, 549–556. [Google Scholar] [CrossRef]
- Vafadarnikjoo, A.; Mobin, M.; Allahi, S.; Rastegari, A. A hybrid approach of intuitionistic fuzzy set theory and DEMATEL method to prioritize selection criteria of bank branches locations. In Proceedings of the International Annual Conference of the American Society for Engineering Management, Boise, ID, USA, 24–27 September 2015. [Google Scholar]
- Lin, R.-J. Using fuzzy DEMATEL to evaluate the green supply chain management practices. J. Clean. Prod. 2013, 40, 32–39. [Google Scholar] [CrossRef]
- Shannon, C.E. A mathematical theory of communication. Bell Syst. Tech. J. 1948, 27, 379–423. [Google Scholar] [CrossRef]
- Garg, H.; Agarwal, N.; Tripathi, A. Entropy based multi-criteria decision making method under fuzzy environment and unknown attribute weights. Glob. J. Technol. Optim. 2015, 6, 13–20. [Google Scholar]
- Sitorus, F.; Brito-Parada, P.R. A multiple criteria decision making method to weight the sustainability criteria of renewable energy technologies under uncertainty. Renew. Sustain. Energy Rev. 2020, 127, 109891. [Google Scholar] [CrossRef]
- Mukhametzyanov, I. Specific character of objective methods for determining weights of criteria in MCDM problems: Entropy, CRITIC and SD. Decis. Mak. Appl. Manag. Eng. 2021, 4, 76–105. [Google Scholar] [CrossRef]
- Li, H.; Wang, W.; Fan, L.; Li, Q.; Chen, X. A novel hybrid MCDM model for machine tool selection using fuzzy DEMATEL, entropy weighting and later defuzzification VIKOR. Appl. Soft Comput. 2020, 91, 106207. [Google Scholar] [CrossRef]
- Rasoanaivo, R.G.; Yazdani, M.; Zaraté, P.; Fateh, A. Combined Compromise for Ideal Solution (CoCoFISo): A multi-criteria decision-making based on the CoCoSo method algorithm. Expert Syst. Appl. 2024, 251, 124079. [Google Scholar] [CrossRef]
- Popović, M. An MCDM approach for personnel selection using the CoCoSo method. J. Process Manag. New Technol. 2021, 9, 78–88. [Google Scholar] [CrossRef]
- Peng, X.; Zhang, X.; Luo, Z. Pythagorean fuzzy MCDM method based on CoCoSo and CRITIC with score function for 5G industry evaluation. Artif. Intell. Rev. 2020, 53, 3813–3847. [Google Scholar] [CrossRef]
- Chatterjee, S.; Chakraborty, S. A Comparative Study on Combined Compromise Solution (CoCoSo)-based optimization of drilling of aluminium metal matrix composites in fuzzy environments. Int. J. Interact. Des. Manuf. (IJIDeM) 2024, 18, 4737–4763. [Google Scholar] [CrossRef]
- Mach, K.J.; Mastrandrea, M.D.; Freeman, P.T.; Field, C.B. Unleashing expert judgment in assessment. Glob. Environ. Change 2017, 44, 1–14. [Google Scholar] [CrossRef]
- Gul, M. Emergency department ergonomic design evaluation: A case study using fuzzy DEMATEL-focused two-stage methodology. Health Policy Technol. 2019, 8, 365–376. [Google Scholar] [CrossRef]
Disclaimer/Publisher’s Note: The statements, opinions and data contained in all publications are solely those of the individual author(s) and contributor(s) and not of MDPI and/or the editor(s). MDPI and/or the editor(s) disclaim responsibility for any injury to people or property resulting from any ideas, methods, instructions or products referred to in the content. |
© 2025 by the authors. Licensee MDPI, Basel, Switzerland. This article is an open access article distributed under the terms and conditions of the Creative Commons Attribution (CC BY) license (https://creativecommons.org/licenses/by/4.0/).

