Article

Railway Architectural Heritage in Jilin Province: Spatiotemporal Distribution and Influencing Factors

1
Graduate School, Jilin Jianzhu University, Changchun 130118, China
2
Department of Architecture and Design, Politecnico di Torino, 10125 Torino, Italy
*
Author to whom correspondence should be addressed.
Sustainability 2025, 17(21), 9398; https://doi.org/10.3390/su17219398
Submission received: 24 August 2025 / Revised: 25 September 2025 / Accepted: 14 October 2025 / Published: 22 October 2025

Abstract

The railway architectural heritage in Jilin Province, as a significant component of Northeast China’s modern railway network, demonstrates how construction techniques, cultural integration, and social transformation have evolved throughout different historical periods. In this study, we conducted a systematic survey of 474 railway heritage buildings along the province’s main line. In order to quantitatively classify the spatiotemporal distribution characteristics of the heritage sites, we used five key Geographic Information System (GIS) methods—kernel density estimation, nearest neighbour index, spatial autocorrelation, standard deviational ellipses, and mean centre analysis—along with information entropy, relative richness, and the Bray–Curtis dissimilarity index. We continued our binary logistic regression using four prerequisite parameters—location, structure, architecture, and function—which contribute to the prerequisite, fundamental, and driving factors of architectural heritage. We concluded that local culture shapes geopolitics, population migration triggers economic conservation, and design trends carry ideology. These three factors intertwine to influence architecture and spatial patterns. Compared with previous studies, this research fills the gap concerning the architectural characteristics of towns at various lower-and mid-level stations, as well as the construction activities during the affiliated land period. This study provides a systematic framework for analysing railway heritage corridors and supports their sustainable conservation and reuse.

1. Introduction

The development of railway architectural heritage in Jilin Province is rooted in the modern railway network of Northeast China, which originated from the historical rivalry between the China Eastern Railway and the South Manchuria Railway. In the late 19th century, the Russian Empire sought to expand into the Far East to secure ice-free ports and enlarge its sphere of influence. To this end, it advanced into the interior of Northeast China, interfered in Korean affairs, and extended its territorial reach. Through the establishment of railway stations, Russia expanded its military control and trade routes, while gradually promoting population relocation, resource exploitation, and cultural penetration [1]. However, a decisive shift occurred after the Russo–Japanese War, when Japan seized Russia’s rights in South Manchuria, took comprehensive control of Manchuria’s socio-economic order, and established a systematic colonial development regime [2]. As a result, during this period, it is evident that a corridor of modern historical architectural heritage with profound cultural connotations and distinctive diversity was formed, including economic and trade activities, industry and agriculture, mining and forestry, as well as technological development and ideological currents [2,3].
In recent years, some heritage sites have been threatened by demolition or abandonment due to urban renewal and upgrades to the railway network. Many railway heritage sites have not received adequate protection or attention, resulting in the destruction of heritage without proper documentation. Reasons for this include destruction during wars, spontaneous demolition by the public and unauthorised renovations and expansions [4]. Nevertheless, the railway architecture of Jilin Province carries the historical memory of transportation integration and industrial development in Northeast Asia. In order to prevent the gradual disappearance of these resources, it is necessary to explore the most effective approaches to their sustainable protection. This will involve avoiding a fragmented, piecemeal approach to preservation and ultimately establishing a comprehensive protection strategy and system.
In the contemporary era, the preservation, adaptation and sustainable development of railway heritage have become pivotal subjects in academic research and policy discourse across a range of disciplines, including geography and architecture. The International Committee for the Conservation of the Industrial Heritage (TICCIH) has long acknowledged railway heritage as a component of industrial heritage. The 2003 Charter of Lower Tagil provided an explicit definition of industrial heritage, emphasising its characteristics of ‘process-oriented’, ‘dynamic’ and ‘integration of science and humanity’ [5]. Looking back, the international preservation of railway heritage began in the 1970s. As railway facilities were phased out during the post-industrial era, their cultural and technical value gradually gained societal recognition. Revitalisation through tourist trains and “rolling museums” not only highlighted the technical, aesthetic and cultural significance of railway heritage but also spurred the development of cultural tourism and creative industries. Concurrently, the introduction of the ‘cultural route’ concept underscored the unique role of railway heritage in regional cultural exchange [6]. In contrast, China’s railway heritage conservation commenced relatively late. However, since the introduction of relevant policies in 2006, successive measures have been enacted, including the Interim Measures for the Protection and Management of Railway Cultural Relics, the National Industrial Heritage List, and the China Industrial Heritage Register. Research and practical initiatives have been undertaken along routes such as the China-Eastern Railway, the Yunnan Vietnam Railway, and the Jiaozhou Jinan Railway.
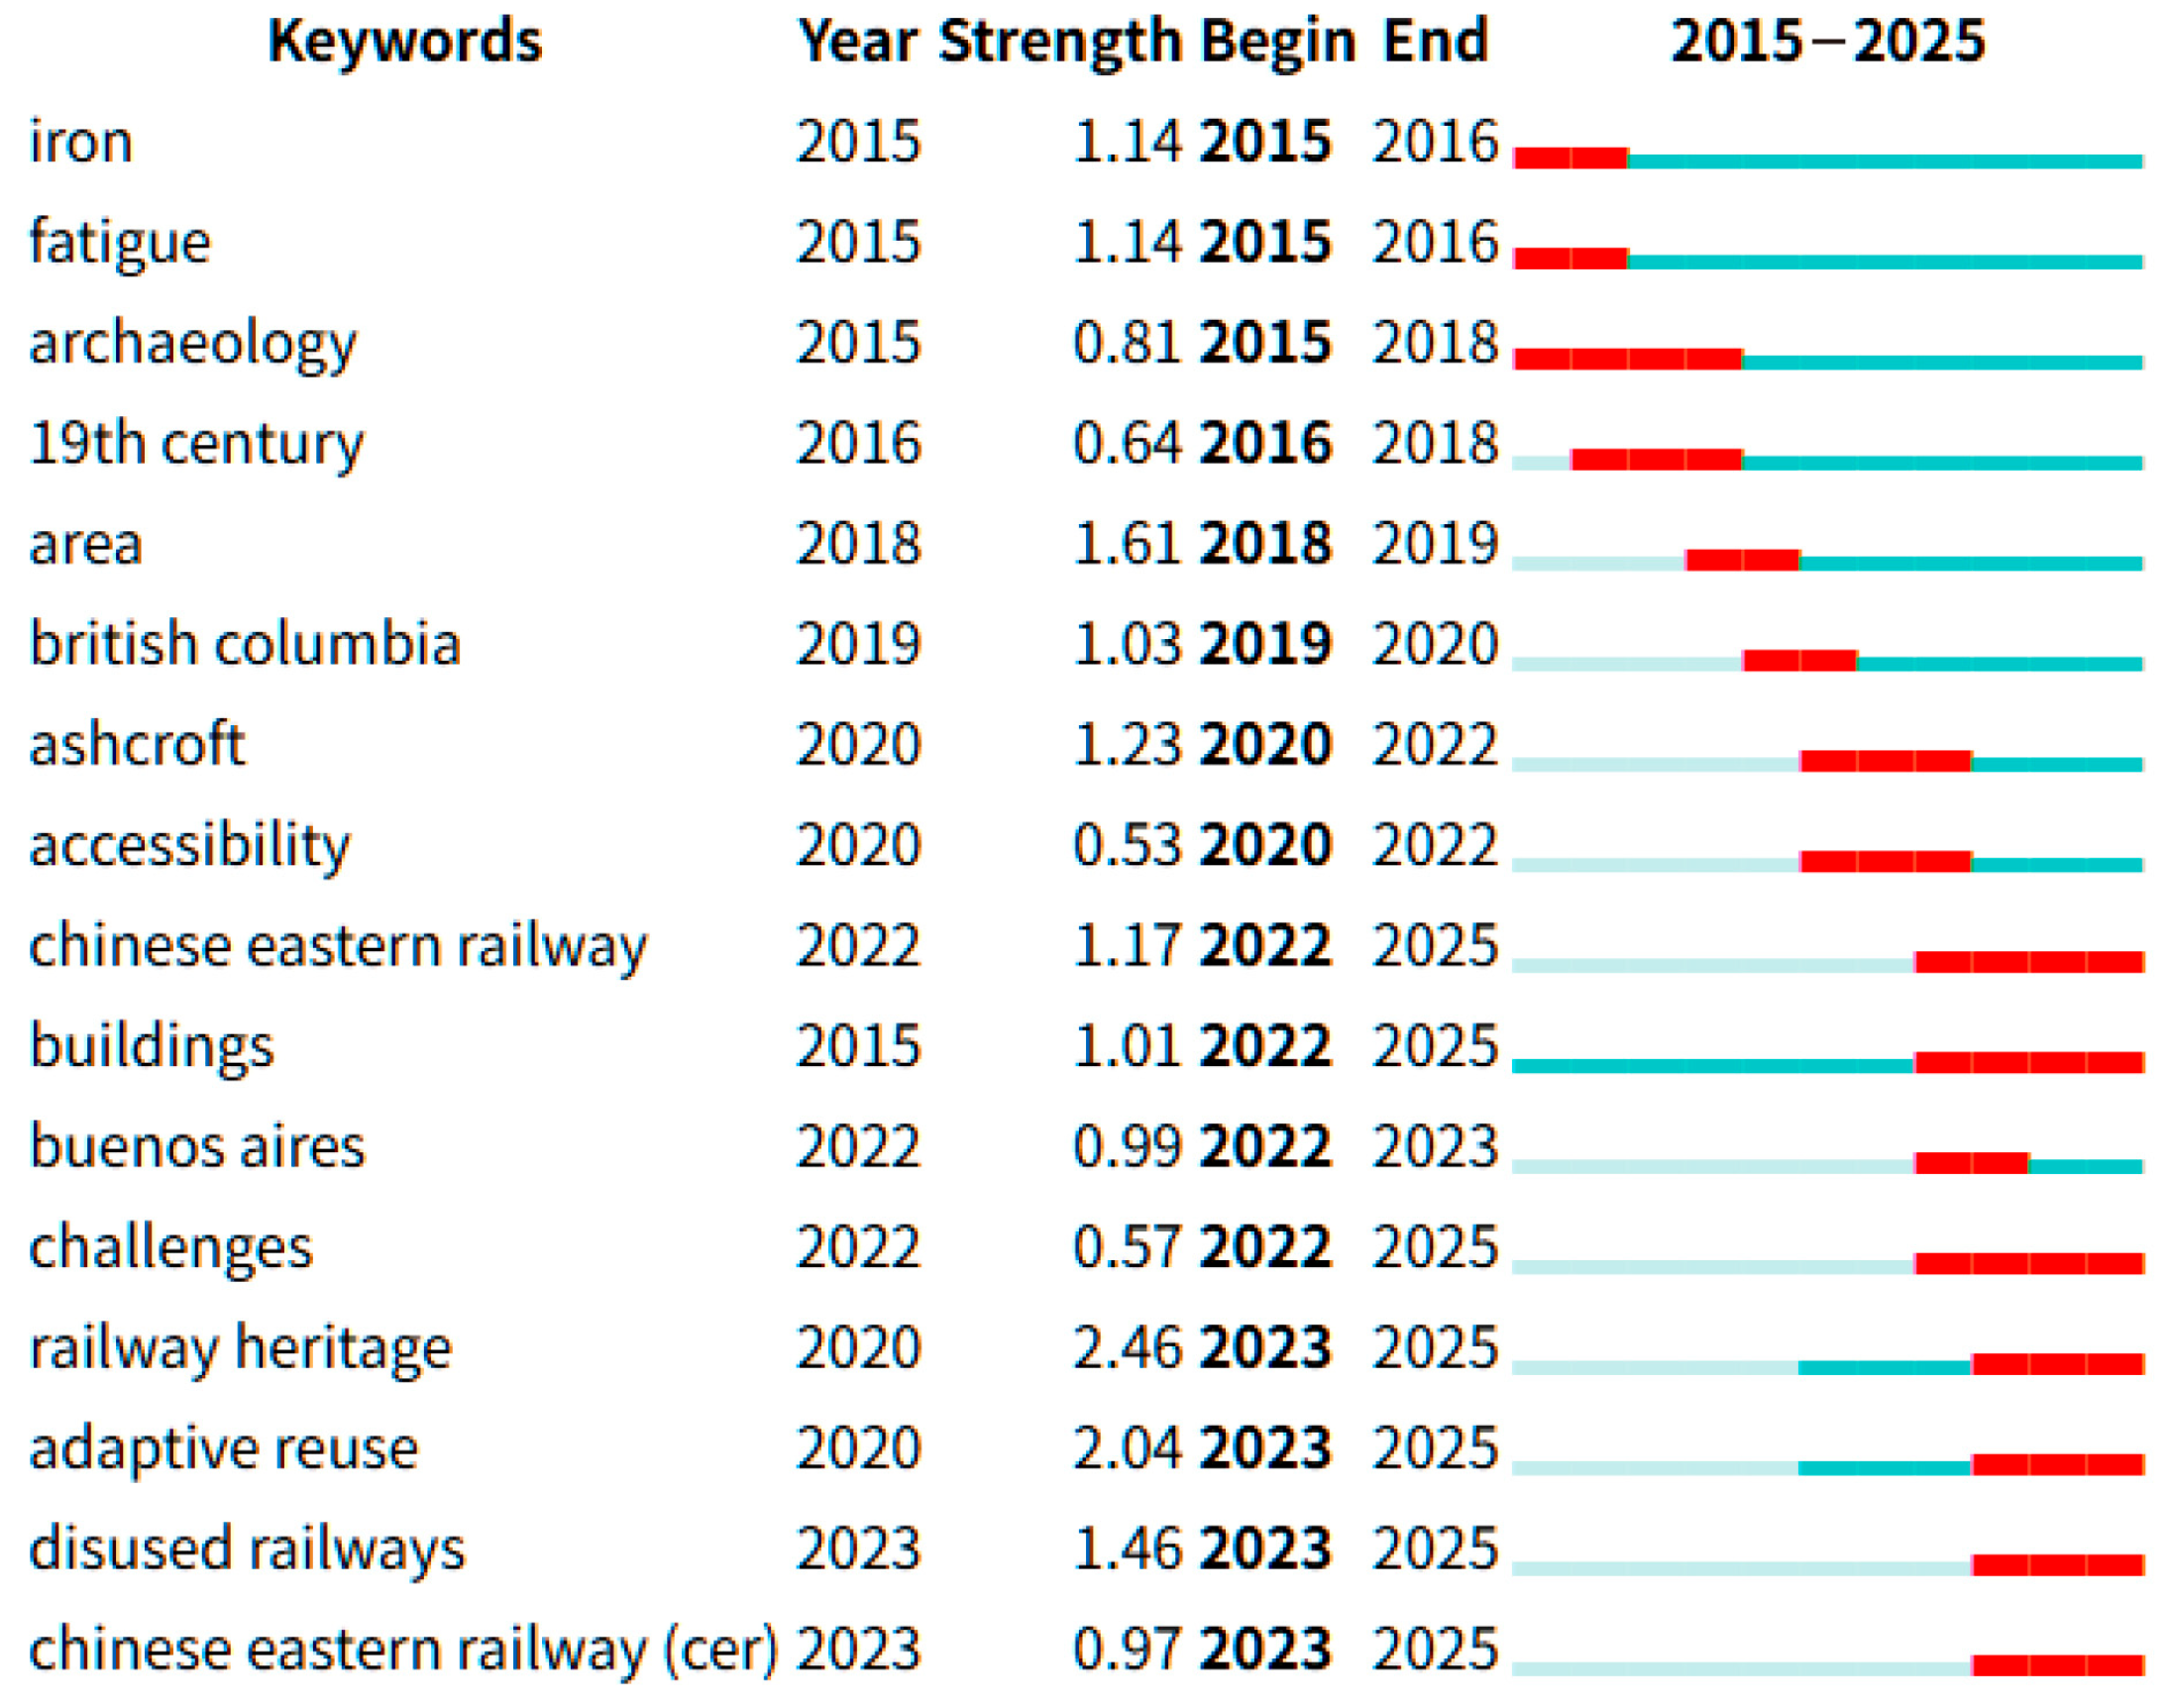
We conducted a thematic search on ‘railway heritage’ using Citespace 6.4R1 software to statistically analyse the co-occurrence (see Figure 1) and keyword clustering networks of keywords over the past decade (see Figure 2) [7]. Examining the various keywords associated with this theme, we found that scholars primarily focus on micro-static conservation approaches. Research focuses on architectural value assessments [8,9,10,11], reuse models [12] and renewal strategies [13,14], emphasising a shift from ‘static preservation’ to ‘living regeneration’. From the perspective of tourism or cultural heritage corridors, scholars predominantly explore tourism development models [15,16,17], the construction of cultural tourism corridors [18,19,20] and cultural tourism coupled with railway networks [21,22]. This deepens the spatial coordination between monotonous architectural heritage and various natural and cultural elements.
Nevertheless, these studies also exhibit certain shortcomings. In the context of research subjects, investigations frequently concentrate exclusively on the heritage of a single railway or a particular category, such as industrial buildings or military structures, and thereby lack a comprehensive perspective [8,23]. Within the domains of modern urban planning history [24] and architectural history [25], the colonial dependency period remains a relatively under-researched area. The concept of dependency extends to various domains, including planning, architecture, function, and construction projects. However, extant research has predominantly focused on these aspects individually, neglecting to address their interconnectivity; examining these connections is crucial to ensure comprehensive understanding. The field of architectural studies encompasses a broad range of disciplines, including historical culture [26], construction techniques [27], and materials and craftsmanship [28,29]. In contrast, planning research is generally focused on developmental history or functional layouts. Consequently, it is difficult to comprehensively analyse or factorise the interwoven mechanisms driving the evolutionary history of dependencies in a dynamic manner. Research on railway ancillary areas in Northeast China is predominantly centred on major cities such as Changchun, Harbin, Dalian, and Shenyang [3,30], with scant detailed or independent studies of towns and rural areas hosting smaller stations. Concurrently, Japanese colonial-era architecture, extensively distributed across rural areas, remains uncollected and unstudied, with research limited to buildings in towns along the South Manchuria Railway’s mid-to-late operational period [31]. In terms of methodology, AHP [8], TOPSIS [32], MCDM [33] and MCR [20] are the models used most frequently in corridor assessments and decision-making. This approach, however, fails to address the highly differentiated and diverse nature of railway heritage corridors. Regarding dynamic techniques, HBIM [34,35] and GIS technologies [36,37,38] have been used to analyse spatiotemporal distribution patterns, dynamic mechanisms, and influencing factors within heritage research. GISs have predominantly been applied in two specific domains: traditional villages [39,40,41] and tangible/intangible heritage [42,43,44,45,46,47]. Within these domains, spatiotemporal evolution analyses have been conducted which focus on hydrology, vegetation cover, and topography, and subsequently the relevant techniques including kernel density, standard deviation ellipses, spatial autocorrelation, and geographic detector models, have been integrated. With regard to visual quantification analysis, the methods employed thus far, including fractal dimensions and information entropy [48], have only approached the complex and diverse aesthetic value of railway architectural heritage from a geometric visual perspective. Consequently, a review of historical studies reveals that the establishment of early railway heritage occurred as part of a gradual process of ideological implementation through heritage activities. This process was inseparable from the imposition of colonial policies and economic–trade interactions. Arguably, examining influencing factors solely through the lens of the spatiotemporal distribution of railway heritage is inadequate. Furthermore, railway construction was primarily a forced implementation driven by colonial intentions, while central Jilin Province, being a plain area, experienced relatively fewer natural constraints.
In the present study, we intend to address these gaps in the literature, as evidenced by our analysis and discussion of previous research. The initial step is to trace the construction activities of colonial subjects by using small-scale evidence to infer broader patterns. The examination of individual site constructions will allow us to extrapolate urban development, thereby addressing a gap in the research concerning the planning layouts and functional transformations of small-to-medium-sized sites. This will reveal the influence of military, trade, and political factors on the railway heritage corridor’s spatial evolution during this period. The present study focuses on the architectural and planning characteristics of early Russian and Japanese colonial structures, with a view to addressing the gap concerning building styles and layout planning in towns or rural areas associated with small-to-medium-sized sites. This will elucidate how design trends and ideological factors shaped the intrinsic evolution of the heritage corridor’s human environment. In this study, a comprehensive suite of techniques is employed to present and analyse the dynamic evolution and influencing factors of the railway heritage corridor from both temporal and spatial perspectives.
To address the complex issues mentioned above, a comprehensive analytical framework that is multi-temporal, multi-dimensional, and multi-factorial needs to be established. The purpose of this framework is to clarify the spatial distribution and evolutionary patterns of railway architectural heritage resources. By doing so, the driving mechanisms and influencing factors that are multi-layered and multifaceted can be traced. The objectives of this study are: (1) From a corridor-scale perspective, the following should be explored: The overall spatial pattern characteristics at the macro corridor level; The dynamic trends of temporal evolution at the meso station area level; And the distributional features of categorical differences at the micro architectural level. (2) GIS technology should be employed to deconstruct and analyse spatio-temporal dimensions, explaining complex overall heritage spatial relationships, station area development drivers, and architectural style distributions. (3) To discern variations in architectural style amidst complex ideological and design trends, it is essential to employ information entropy, relative richness calculations, and Brewer-Curtis differences. (4) We selected a binary Logistic regression model to construct factor discrimination criteria, identify the prerequisite factors, basic factors, and driving factors that influence the distribution results, and establish the final influencing factors. Obviously, the ultimate aim of this process is to provide valuable guidance for sustainable development.

2. Materials and Methods

2.1. Theoretical Derivation and Significance

Our study of the spatiotemporal distribution patterns and underlying causes of railway heritage in Jilin Province serves to extend the theory of cultural routes. This research not only deepens the interdisciplinary exchange between transport geography and heritage studies, but also provides new material evidence for re-examining the modern and contemporary historical development of Northeast China.
The significance of this theoretical framework is threefold: Firstly, the integrated application of spatial statistics and multidimensional indicators establishes a generalisable analytical pathway for understanding the distribution patterns of railway heritage. Secondly, the employment of quantitative modelling to reveal the interplay between cultural, economic and ideological factors overcomes the limitations of previous single-discipline or -factor explanations. Thirdly, the present study extends beyond major railway hubs to encompass stations in small and medium-sized towns, thus providing systematic grounds for holistic regional conservation and reuse. Consequently, this research contributes to the theoretical underpinnings of railway heritage studies by transitioning from descriptive analysis to explanatory mechanisms. In addition, it provides a practical operational framework for the sustainable conservation and utilisation of heritage corridors.

2.2. Study Area

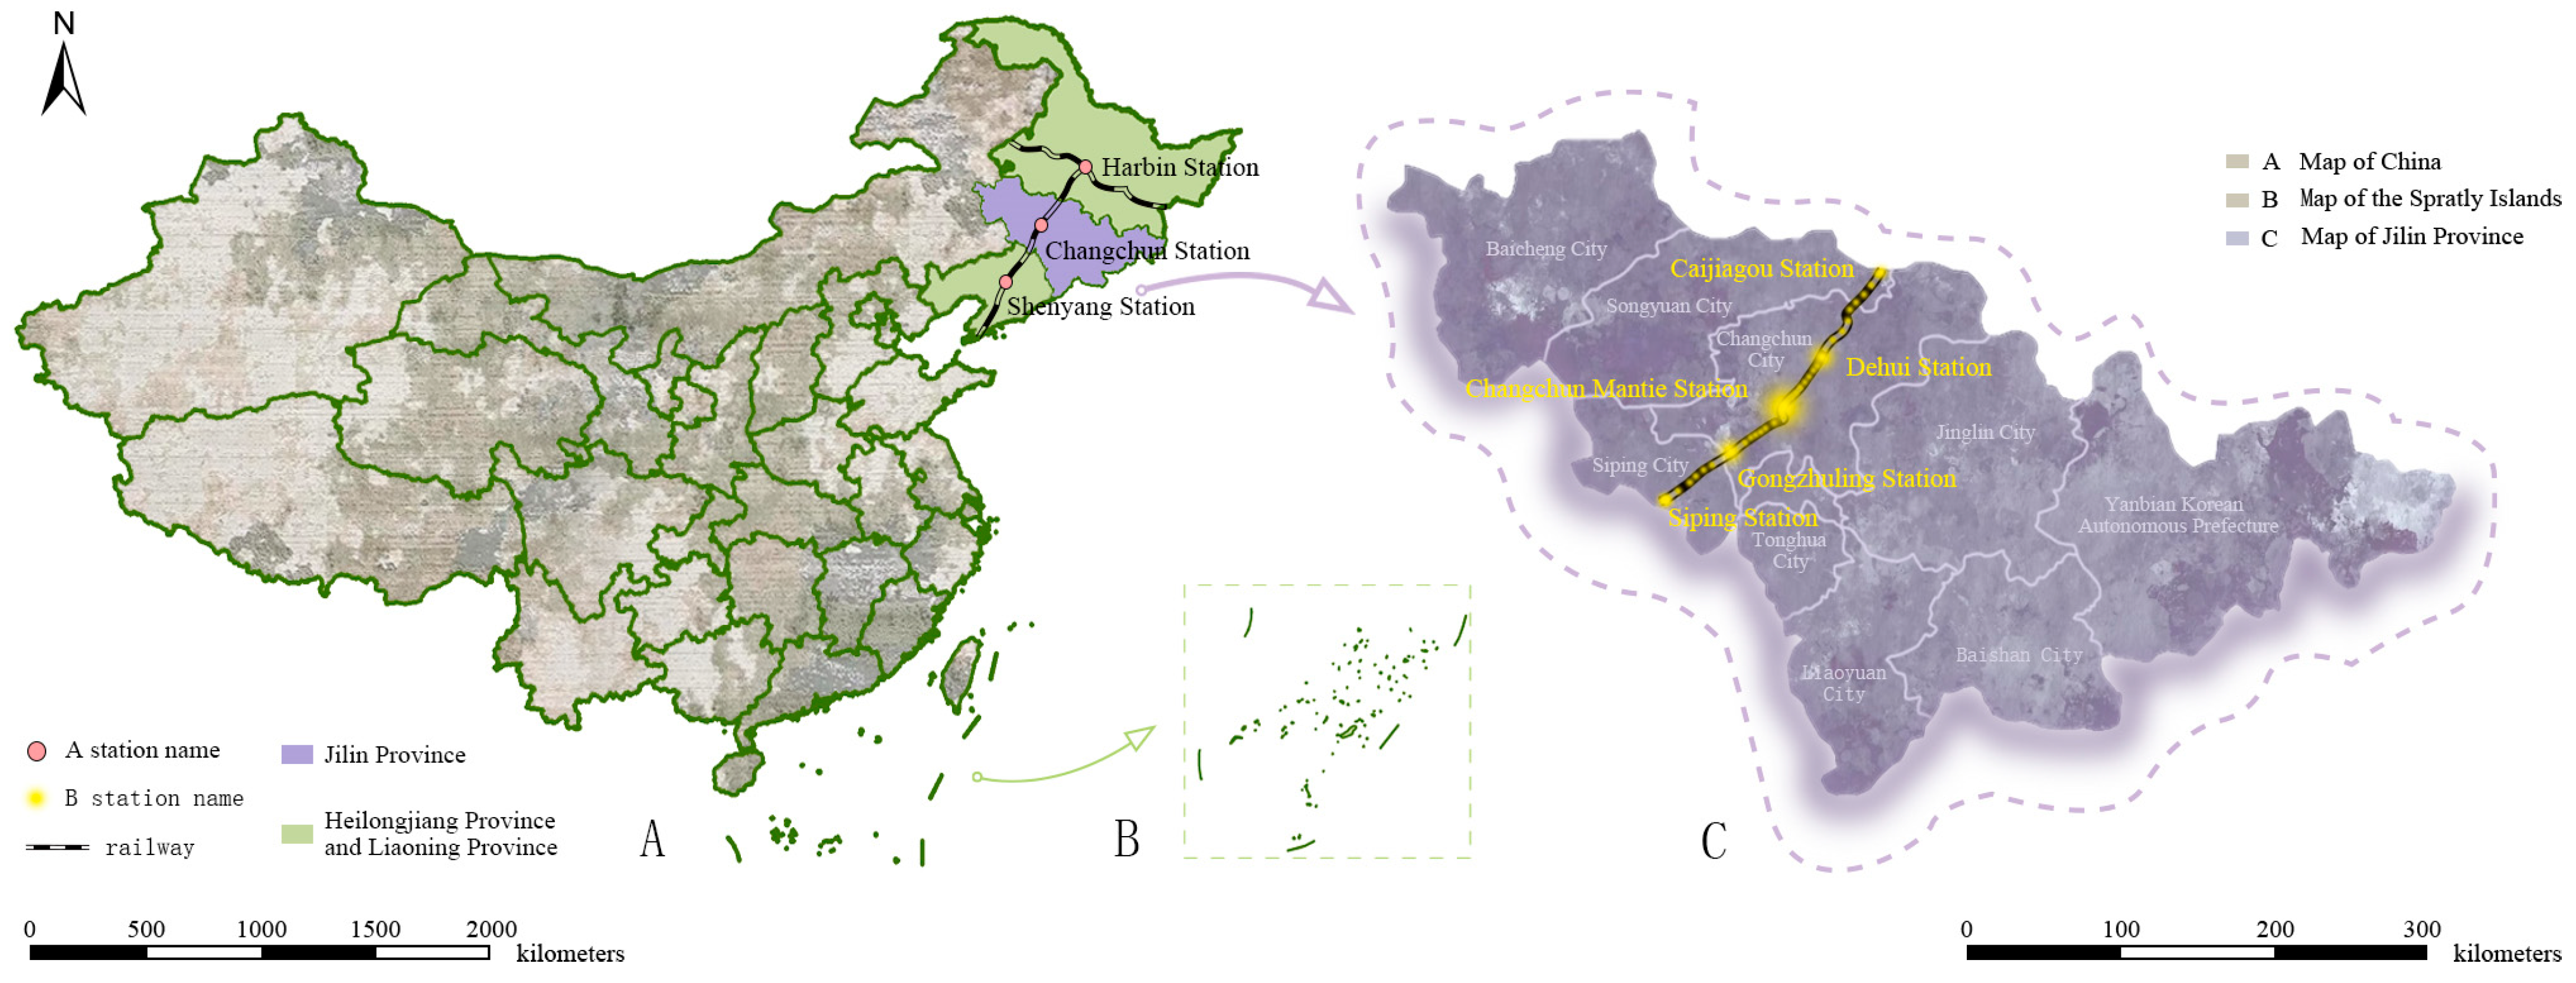
From the perspective of the entire railway line, the Chinese Eastern Railway forms a ‘T’ shape (see Figure 3A), with a total length of 2489 km [49,50]. The line extends westward to Manzhouli, eastward to Suifenhe, and southward to Lushun, primarily passing through Harbin Station, Changchun Station, and Shenyang Station. Following the Japanese severance of railway rights and the renaming of the line as the South Manchuria Railway, Changchun was designated as the boundary point between the Chinese Eastern Railway and the South Manchuria Railway [51,52,53]. Consequently, the railway within Jilin Province marked the onset of modernisation for its major cities, with the primary branch line extending over 250 km, traversing northward from Caijiagou Station at the border with Heilongjiang Province to Siping Station at the border with Liaoning Province (see Figure 3C). With regard to population distribution, only Changchun, Dehui, Gongzhuling and Siping demonstrate relatively dense concentrations, while the remaining townships exhibit a more balanced population spread. The region is characterised by a temperate continental monsoon climate, which is typified by distinct seasons. The region experiences prolonged and harsh winters, with temperatures frequently dipping below −20 °C, while summers are characterised by warm and rainy conditions, with precipitation occurring predominantly between June and August. The region under discussion is located on the eastern edge of the Songliao Plain, and the terrain is predominantly flat, with localised terraces and hills. The topography of the region is predominantly characterised by extensive plains, with a paucity of substantial rivers. The sole exception is the Songhua River, which traverses the railway network. This geographical context is conducive to the efficient integration of trunk line junctions and linear station distribution.
This study first divides the time frame into distinct periods. The research team reviewed the construction activities related to the Russian-Japanese railway heritage sites and the relevant policies enacted during this period. Based on this analysis, the historical evolution of the concessionary areas in Jilin Province can be divided into three distinct periods: The first period was defined as the initial construction phase under the Russian Empire (1898–1905). According to the provisions of the Charter of the Chinese Eastern Railway Company, construction of the railway officially commenced in 1898. However, due to the outbreak of the Russo-Japanese War in 1904 and Russia’s defeat in the war, construction was abruptly halted; The second period was the Russian-Japanese expansion and construction phase (1905–1917). In 1905, following the signing of the Treaty of Portsmouth between Russia and Japan, the lease rights for the section from Kuanchengzi to Lushun were transferred to Japan. After the Russian Revolution of 1917, Manchuria experienced an immigration wave, leading to the construction of numerous new buildings; The third period was the comprehensive construction phase under Russian and Japanese rule (1918–1930). In 1919, the Chinese government formally reclaimed the rights to the China-Eastern Railway, and construction was halted following the 18 September Incident in 1931.
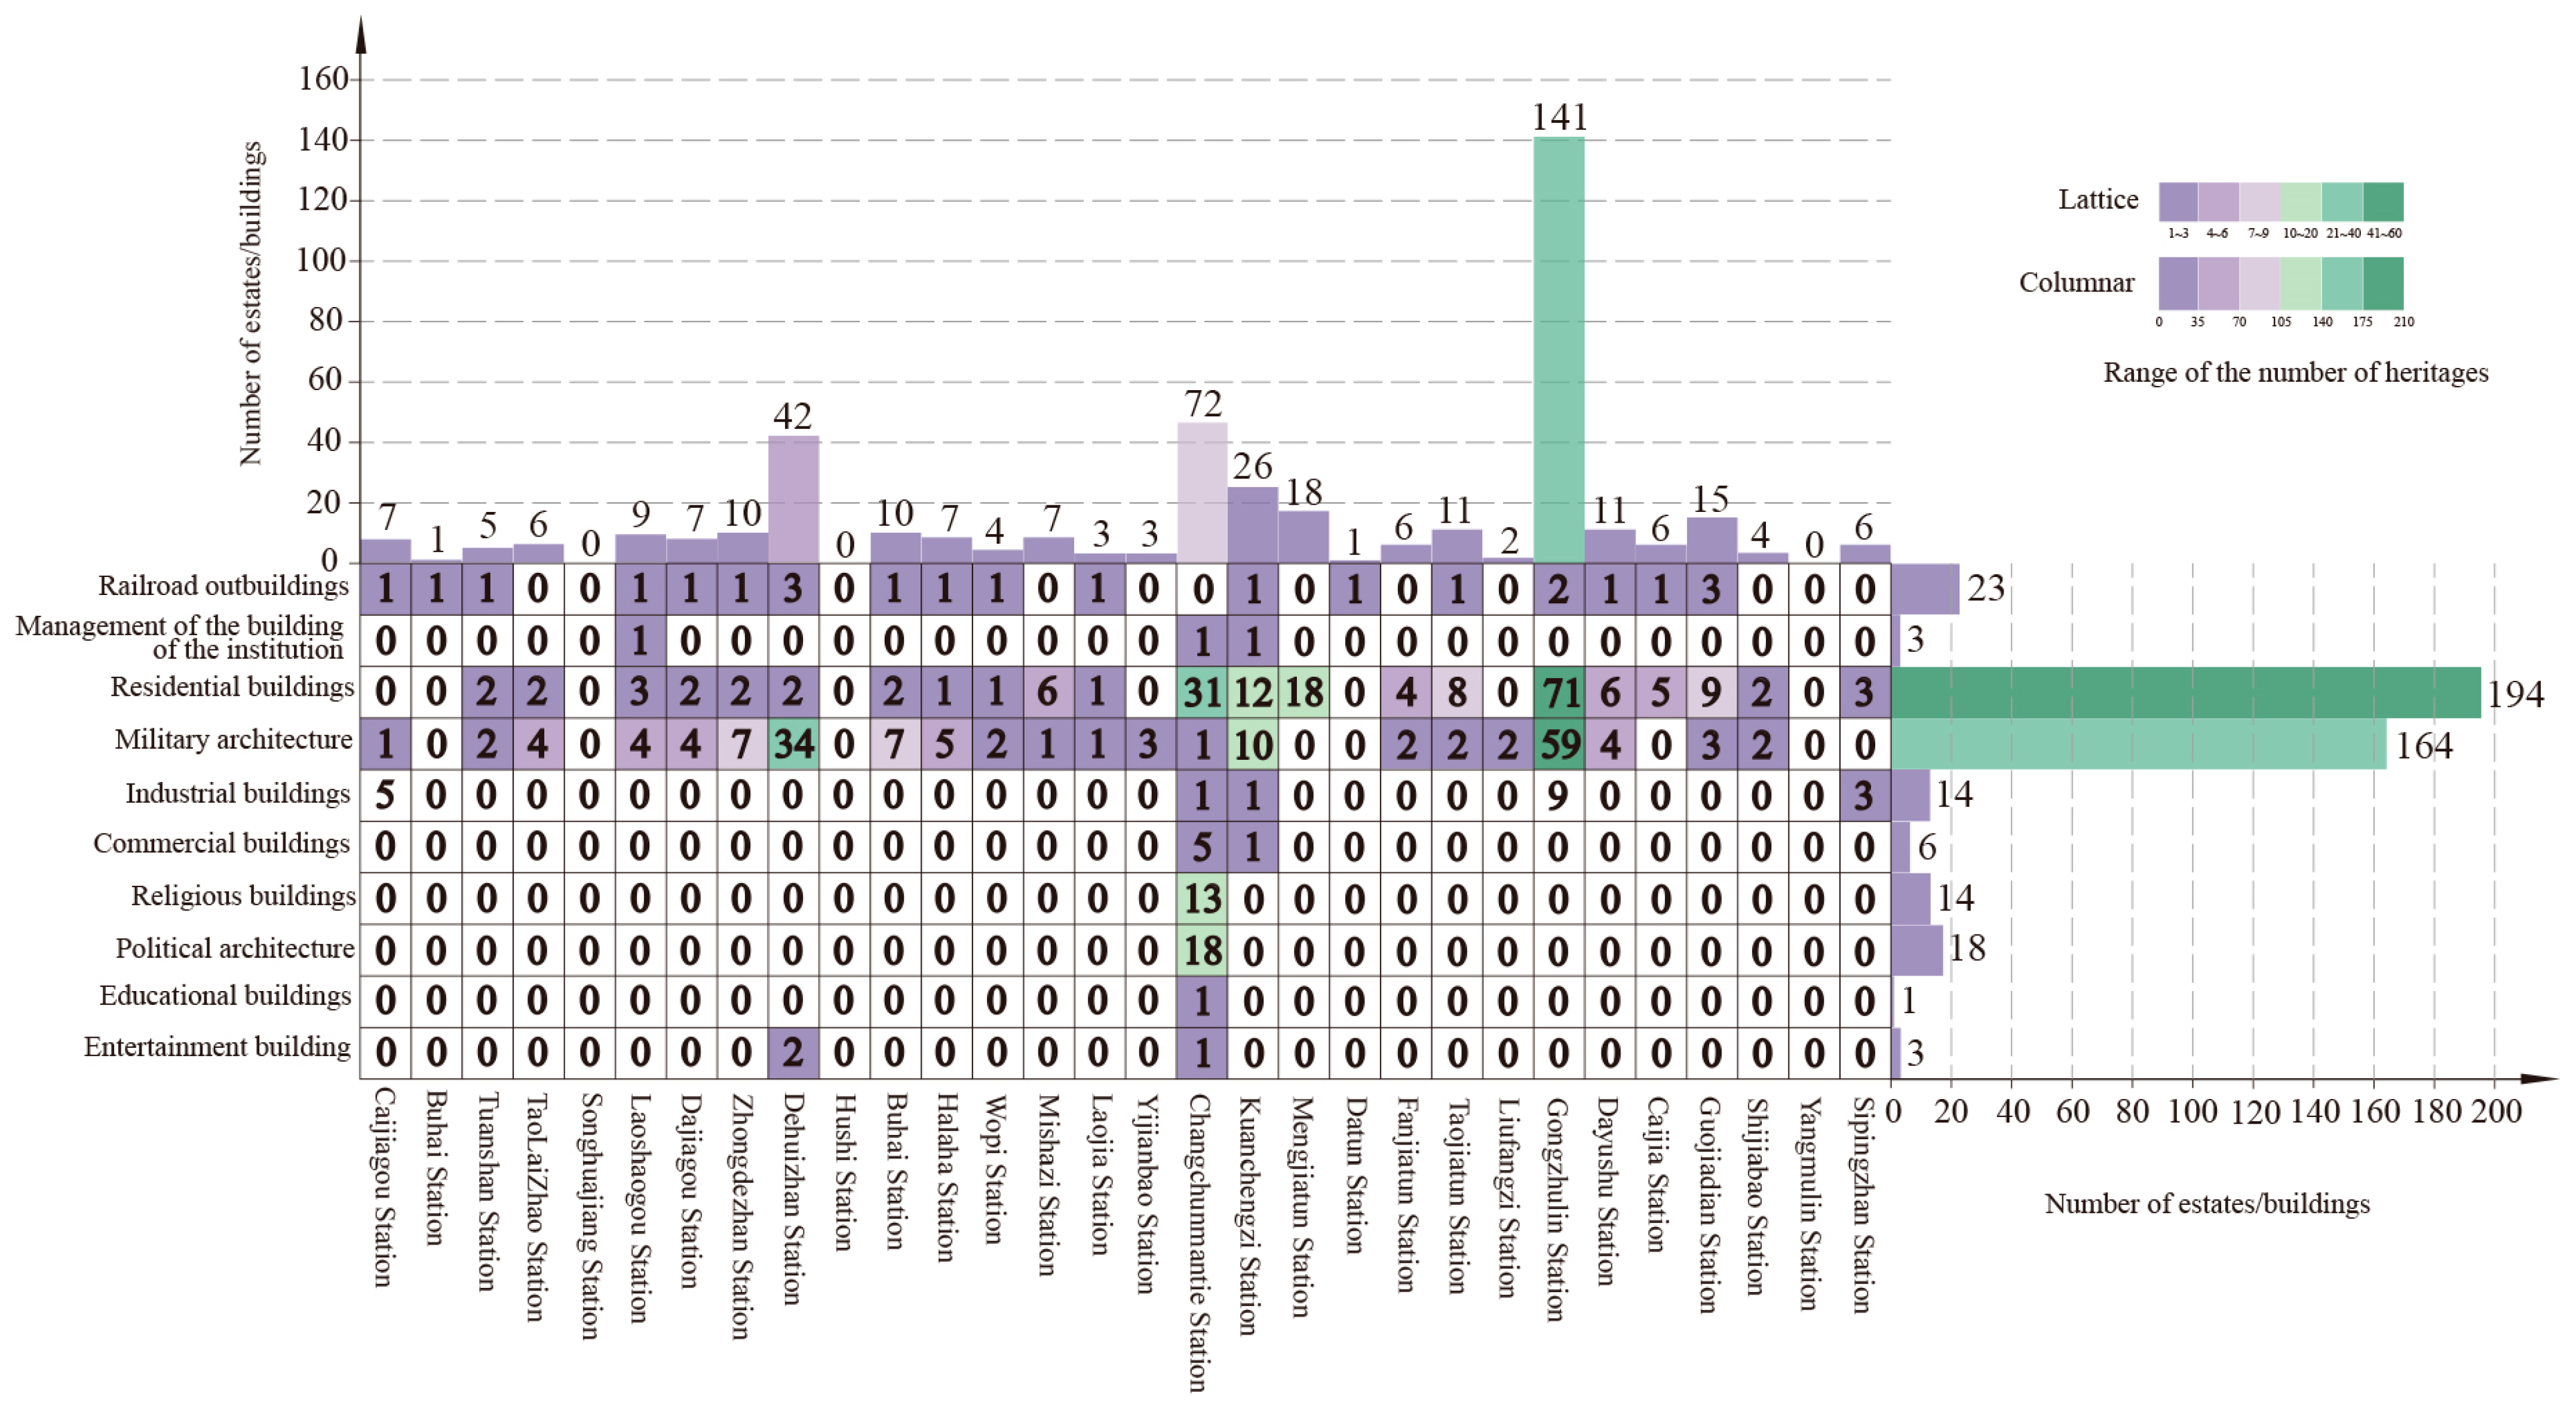
In addition to delineating the temporal scope, we also defined the spatial boundaries. The spatial station network of the railway extends from Caijiagou Station in the north to its southern terminus at Siping Station. A survey of historical records revealed a total of 42 stations. However, field investigations have shown that only 30 of these stations have retained their original structures. The remaining 12 buildings have been demolished, resulting in the loss of their architectural heritage; consequently, they fall outside the spatial scope of this study. The spatial scope was subdivided as follows: the stations encompassed four county-level cities and one prefecture-level city. The section passing through Fuyu City comprises six stations, extending from Caijiagou Station to Songhua River Station. The section passing through Dehui City comprises ten stations, extending from Laoshaogou Station to Laojia Station. The section within Changchun City covers four stations, from Yijianbao Station to Datun Station. The section traversing Gongzhuling City runs from Fanjia Tun Station to Dayushu Station, comprising a total of five stations. The section traversing Siping City runs from Caijia Station to Siping Station, comprising a total of five stations. Following the categorisation of the station heritage corridor’s resources (see Table 1) [54], the statistical data on the number of buildings per category (see Figure 4) was then utilised to delineate the spatial scope, encompassing 474 buildings of varying types.

2.3. Data Sources

Multi-source spatio-temporal data, building façade data and latitude-longitude data were obtained from investigation reports or related books, such as the Investigation Report on the Changchun Section of the Middle East Railway Branch Line [55], Research on the Siping Section of the Middle East Railway Branch Line [56] and Research on the Architecture of the Middle East Railway in Jilin Province [57]. Further work involved combining actual field research, photography and surveying to construct a database, as well as collecting historical maps, architectural images and ancient texts, primarily Japanese colonial-era records related to Manchuria such as The Complete History of the Administration of the Manchurian Railway Affiliated Territories [58], The Journal of the Manchurian Architectural Association and Russian publications such as The Great Album of the Middle East Railway [59] and Architectural Art Corridor: Tracing the Old Buildings of the Middle East Railway [60]. These materials are preserved in the Local Chronicles and Archives Departments of the Jilin and Heilongjiang Provincial Libraries. Furthermore, a summary of the sources and usage of the relevant geographic information layer data has been provided (see Table 2). Through field research and interviews with residents, the latitude and longitude of the buildings surveyed were determined and marked in OMAP. In ArcGIS 10.8, the geographic coordinates were converted to WGS1984 and the spatial characteristics of heritage changes were recorded. Finally, regression analysis was conducted using SPSS 29 to identify the influencing factors, once the indicators for each case had been determined.

2.4. Research Methods

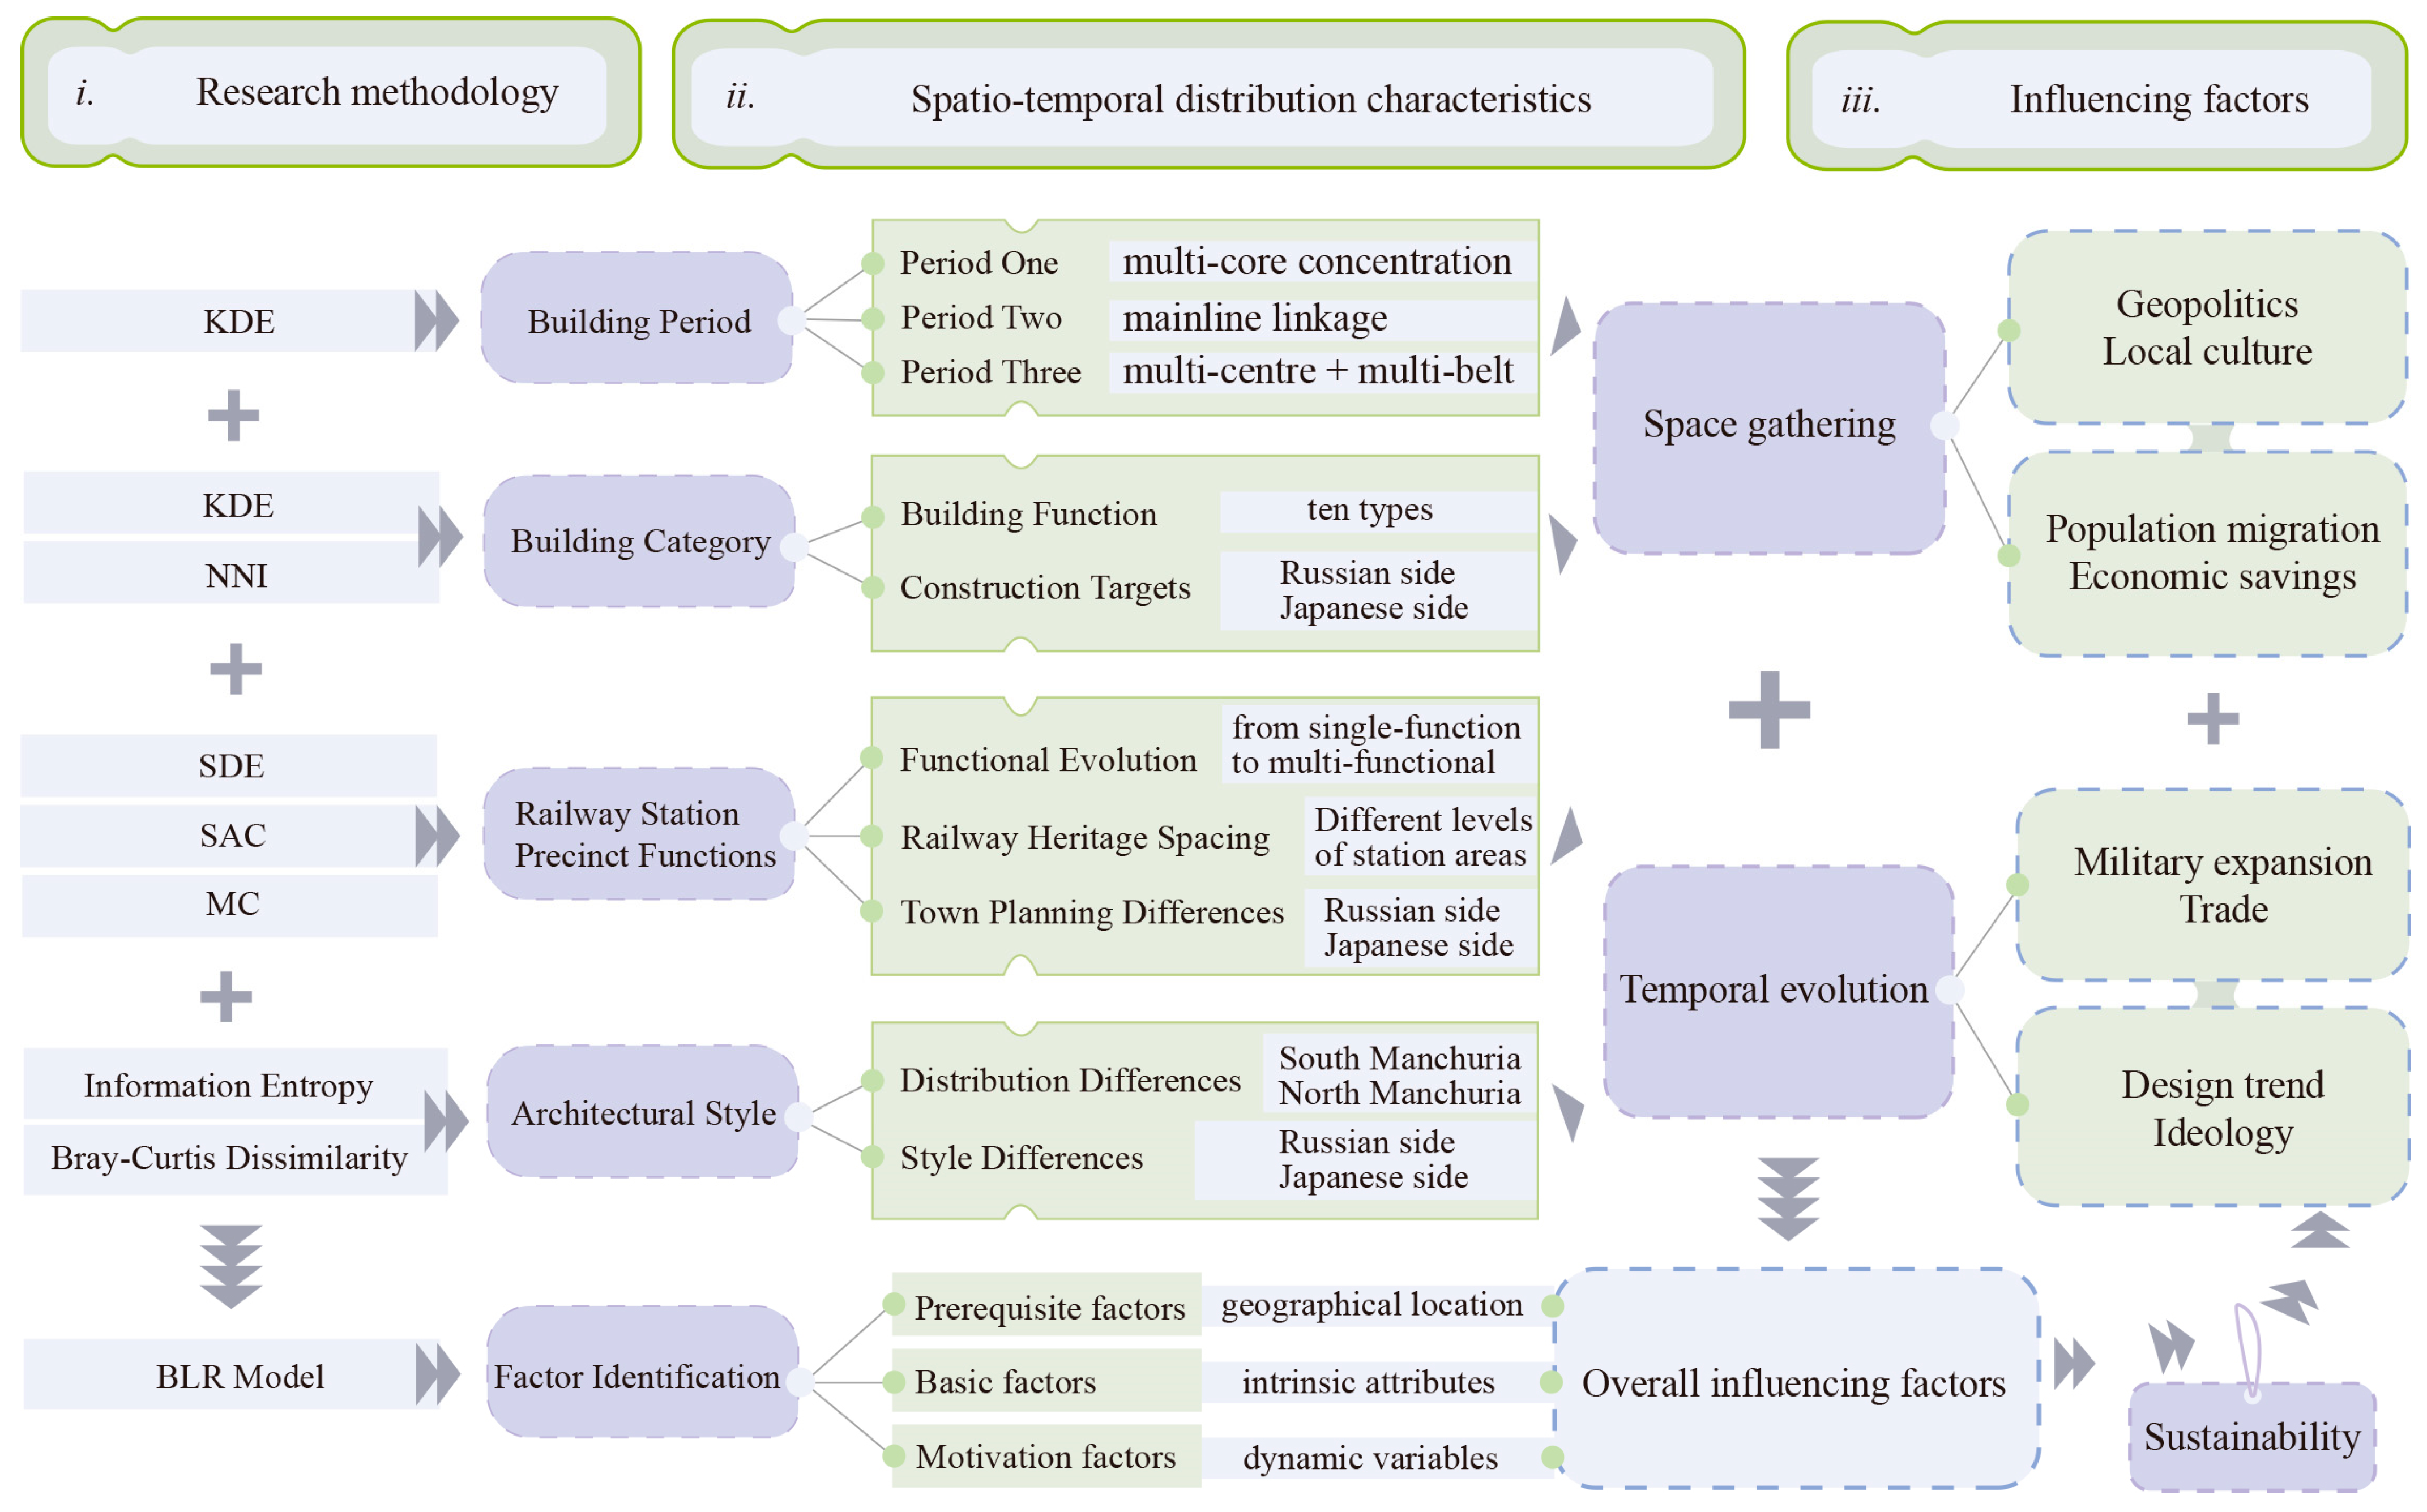
To obtain and validate the required data, the team conducted early-stage literature review, field surveys, and resident interviews. These preliminary efforts laid a solid basis for the finalized research framework (see Figure 5).

2.4.1. Spatial Dimension Analysis

Kernel Density Estimation (KDE) was applied to evaluate the spatial distribution density and clustering degree of railway architectural heritage sites [61,62]. A higher KDE value indicates a denser concentration of heritage sites within the corresponding area and a stronger spatial clustering tendency.
f x = 1 n   h i = 1 n k x x i h
In Equation (1), n represents the total number of railway architectural heritage sites; h is the bandwidth, which determines the spatial range over which an individual heritage site influences the surrounding density. The term k x x j n denotes the kernel function, where the i-th heritage site x i serves as the center. The distance between location x   and   x i is calculated using h x x i , and then transformed through the kernel function. This process reflects the weight of x i ’s contribution to the density at location x , with closer distances generally yielding higher contributions.
The average nearest neighbor (NNI) index is used to analyze the spatial distribution pattern of architectural heritage points [46,63]. When R > 1 the distribution is dispersed; when R = 1 , it is uniform; and when R < 1 , it is random.
R = r a r e ,   r a = Σ = 1 n n ,   r e = 1 2 n A
In Equation (2), R represents the ratio of the observed mean distance to the theoretical mean distance. Here, r a is the observed mean distance, which reflects the actual degree of clustering by averaging the distances from all points to their nearest neighbors. r e is the theoretical mean nearest neighbor distance under a completely random distribution, serving as the benchmark for “random distribution.” The term n A denotes the theoretical density of heritage points, where A is the geographic area over which the heritage sites are distributed.

2.4.2. Temporal Dimension Analysis

The Standard Deviational Ellipse (SDE) method is used to analyze the dispersion characteristics of a dataset. Based on the spatial locations of the point data, the distribution centroid is first calculated, from which the major and minor axes of the ellipse are constructed [63,64]. The length of the major axis indicates the primary orientation of the sample points, while the minor axis represents the minimum direction of dispersion. The size of the ellipse area reflects the degree of spatial dispersion: a smaller area indicates that the distribution is more concentrated and closer to the centroid.
Mean Center (MC) analysis is primarily applied to determine the directional movement and displacement of the centroid of heritage points over different historical periods [37]. This enables tracking of spatial shifts in the distribution pattern through time.
X = i = 1 n M i X i i = 1 n M i ,   Y = i = 1 n M i Y i i = 1 n M i
In Equation (3), X and Y represent the longitude and latitude of the centroid of heritage points within a specific time period; X i and Y i denote the longitude and latitude of each railway architectural heritage site in Jilin Province within that time period; M i refers to the attribute value of the heritage site (e.g., count or weight) in the same time period; indicates a specific time interval.
Moran’s I index is a widely used measure of global spatial autocorrelation, which serves to characterize the clustering or dispersion patterns of research objects across space [43].
I = n Σ = 1 n Σ j = 1 n w i j z i z j W Σ = 1 n z i 2
In Equation (4), n denotes the total number of research units, while z i and z j represent the standardized observed values (e.g., quantity, level, scale) of each railway heritage site in Jilin Province relative to the overall mean. w i j indicates the elements of the spatial weight matrix of railway heritage sites, reflecting the spatial neighborhood relationship between site and site j (commonly defined by contiguity or distance). W represents the sum of all elements in the spatial weight matrix. Based on this formula, a positive Moran’s I value (>0) suggests that the railway heritage sites exhibit spatial clustering, potentially forming “hot spots.” A negative value (<0) indicates a dispersed distribution and negative spatial correlation, while a value close to zero implies an approximately random spatial pattern.
Information entropy (H), originally applied in statistics and information theory, is used to measure the degree of uncertainty or disorder within an information system [65,66]. For Jilin’s railway architectural heritage, it can be applied to assess the richness of heritage types. A higher H value indicates that the architectural facades contain more abundant and diverse information, whereas a lower value suggests a more homogeneous composition.
H = i = 1 n p i log 2 p i
In Equation (5), n represents the total number of heritage categories, and p i denotes the proportion of the i-th heritage category. In the measurement of architectural façade language, H serves to quantify the total amount of information conveyed by the façade elements.
The Bray–Curtis dissimilarity (BC), commonly applied in ecology and geography, is used to measure differences in element composition between two samples or regions [67,68]. Prior to its application, the relative abundance metric is introduced to describe the commonness or rarity of elements within a sample. This metric is based on the proportion P of each element relative to the total quantity in the sample.
B C = P x i P y i P x i + P y i
In Equation (6), P x i and P y i represent the proportion of the -th type of heritage in regions X and Y respectively. A higher B C value indicates greater differences in the categories of heritage façade elements, whereas a lower value suggests higher similarity.

2.4.3. Overall Dimension Analysis

In this study, the binary logistic regression model was employed to investigate the factors influencing the determination of whether a railway architectural heritage site in Jilin Province is of Japanese origin [69,70]. Railway architectural heritage samples within Jilin Province were selected, and each building’s classification—“Japanese architecture” or “non-Japanese architecture”—was encoded as a discrete variable (1 = Japanese architecture, 0 = non-Japanese architecture). The binary logistic regression model assumes a linear relationship between the explanatory variables (e.g., architectural features, construction period) and the log-odds of the outcome ( Y i = 1 ), ensuring that the fitted probabilities remain within the range of 0 to 1.
log P i 1 P i = α + k = 1 k β κ X k , i
In Equation (6), P i represents the probability that Y i = 1 ; Y i denotes the observed classification status of the architectural heritage (for N total samples); α is the intercept term; k indexes the exogenous variables (e.g., architectural style elements, construction period, where k = 1… k ); β k is the regression coefficient of the k -th variable; and x k represents the k -th exogenous variable. Due to the properties of the logit link function, the regression coefficient ( β k ) the odds ratio for the estimated coefficient can be obtained, enabling quantitative interpretation of the variable’s effect.

3. Results

3.1. Spatial Clustering Characteristics

3.1.1. Spatial Analysis of Heritage in Different Periods

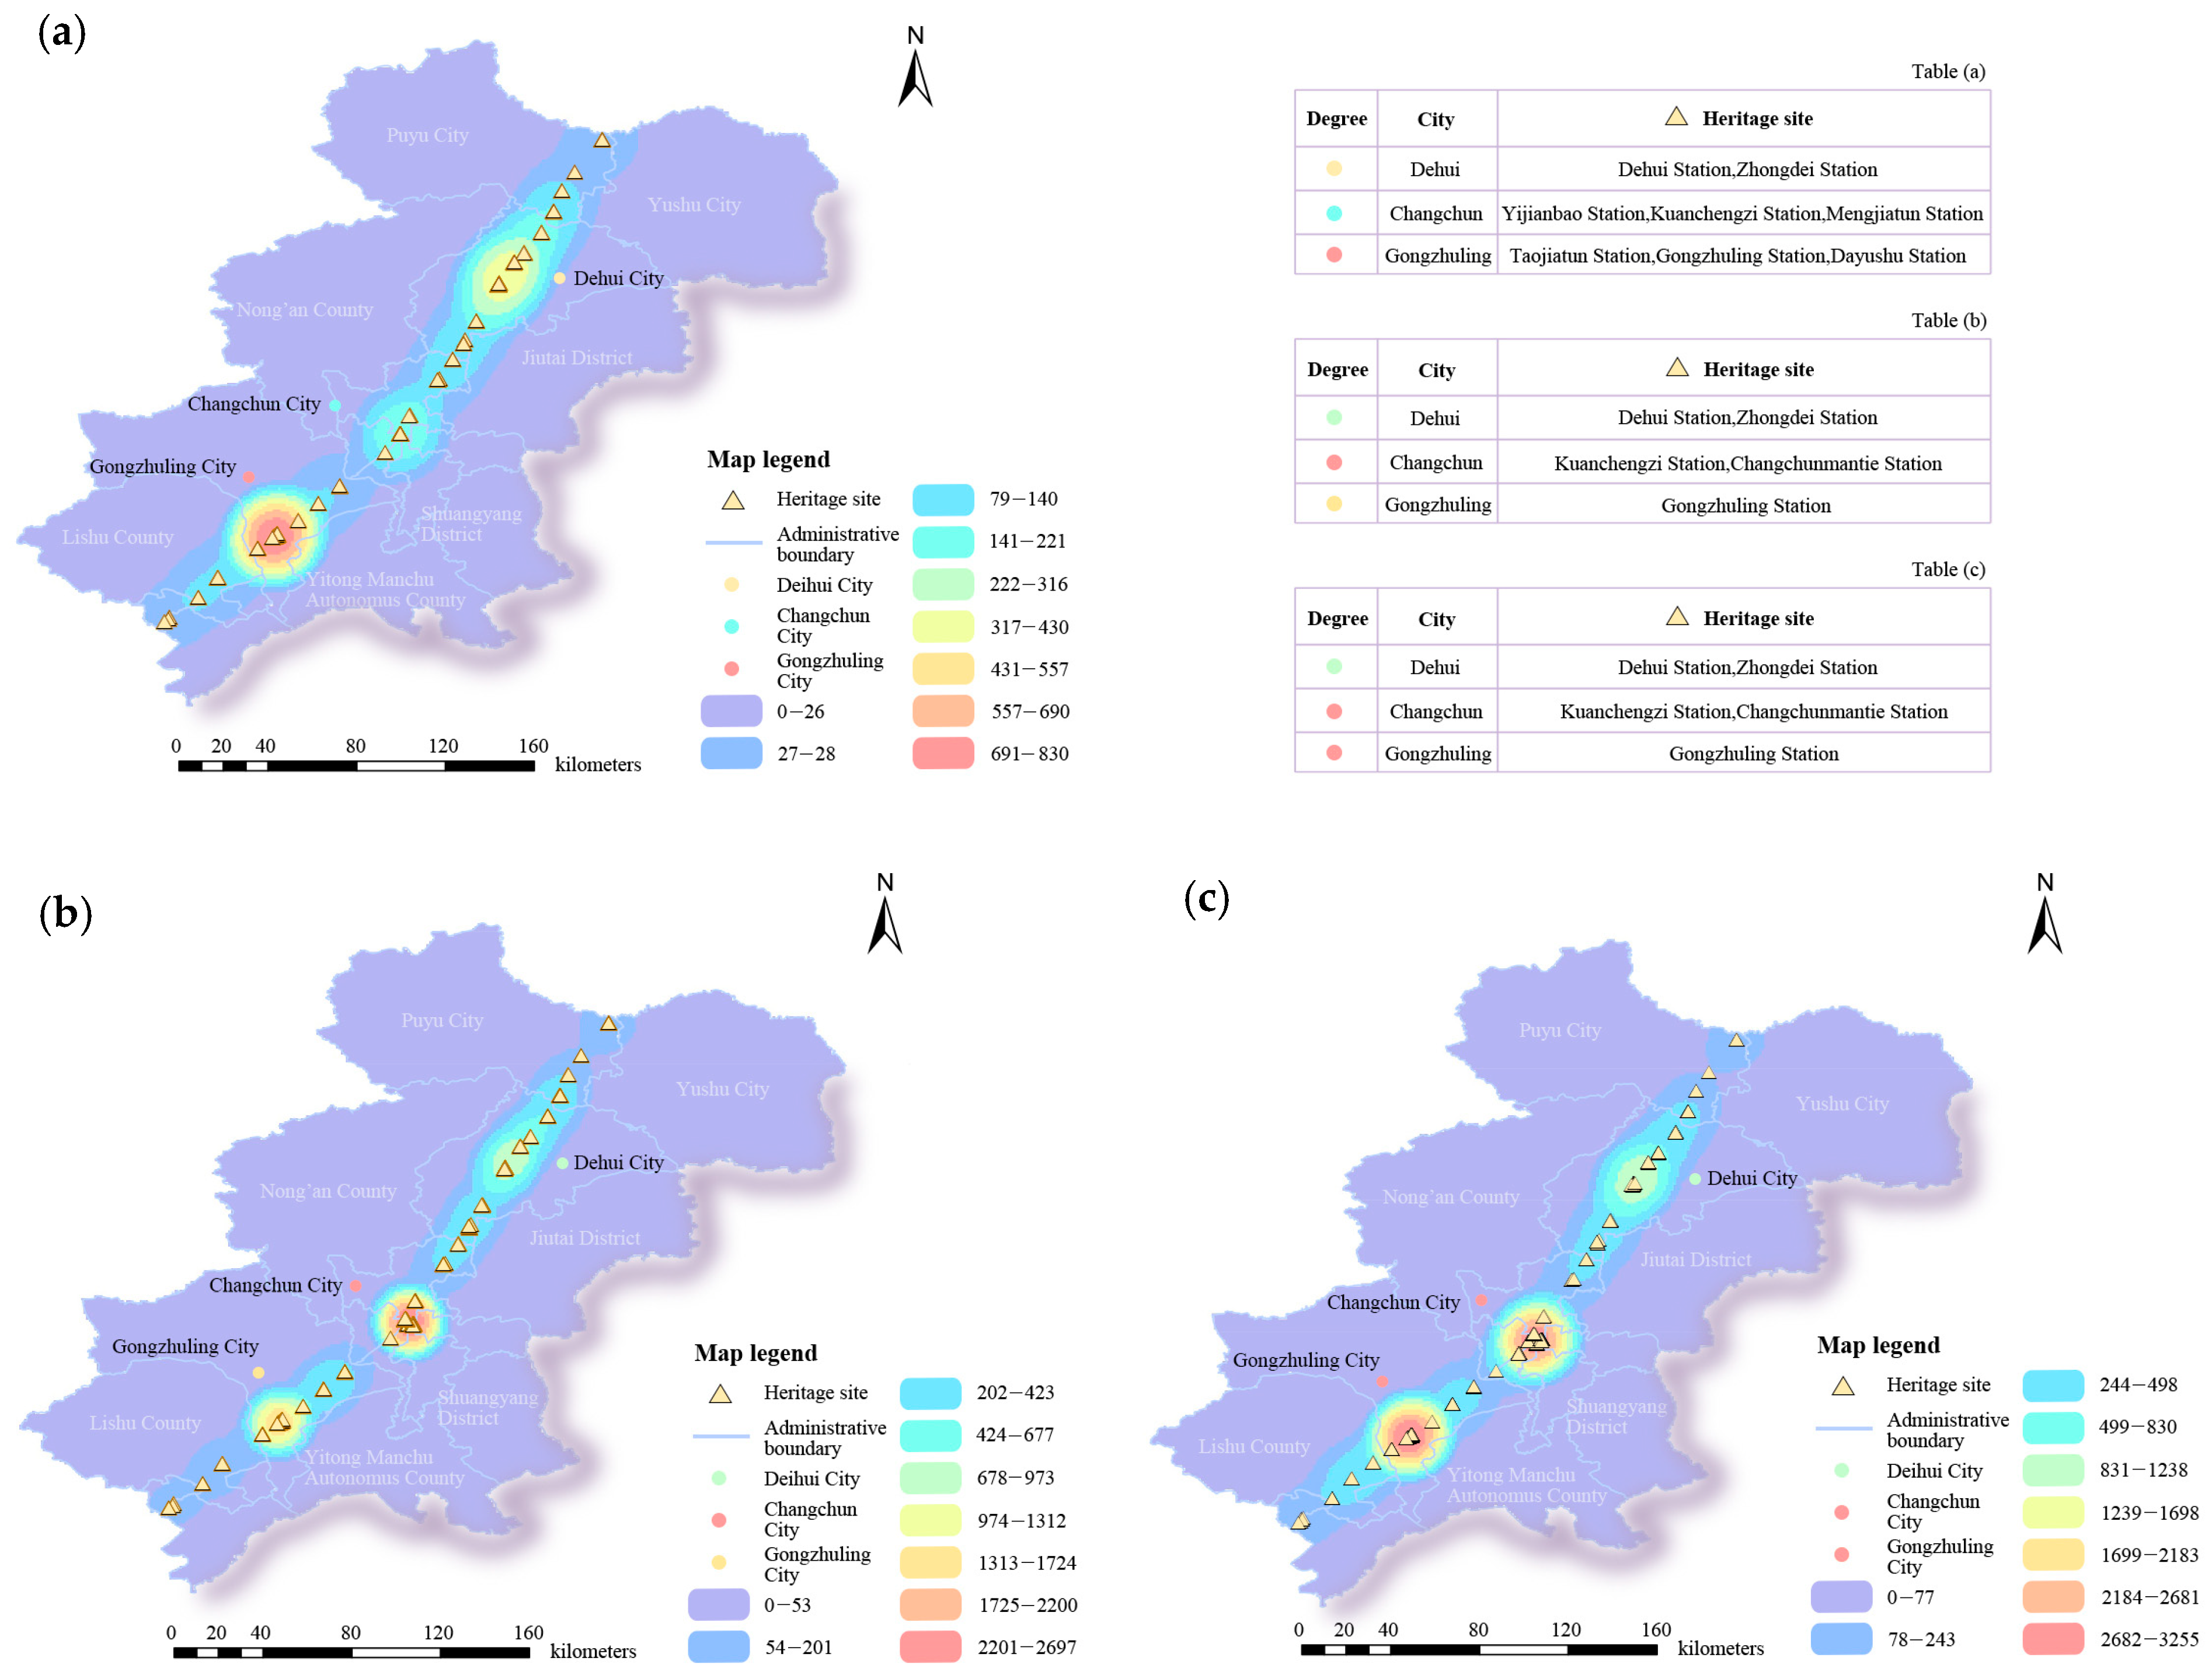
This study divided the historical development into three periods in order to trace the evolution of the architectural heritage, analyse its overall distribution pattern and identify its characteristics and underlying reasons. A total of 474 buildings were estimated using kernel density estimation (see Figure 6). The selection of building materials displayed a similar pattern to the overall distribution.
Throughout the evolution process, the spatial layout of the buildings exhibits distinct, phased characteristics, evolving from a ‘scattered distribution’ pattern to an ‘axis-based integration’ pattern. The results indicate that the first period (see Figure 6a) exhibited a ‘dual core + scattered extension’ pattern, with high-density zones concentrated around Gongzhuling Station (MAX = 862.997359) and Dehui Station (MAX = 827.002398). Meanwhile, Kuanchengzi Station (MAX = 549.689037) served as a medium-density point and the KD values of all other stations were below 500, indicating low overall density and sparse distribution. In the second period (see Figure 6b), the pattern shifted to a ‘single core + weak strip-like extension’ configuration. The KD value at Changchun Station increased significantly to 2694.275927, forming the sole ultra-high-density core. Gongzhuling Station (MAX = 1310.435013) and Dehui Station (MAX = 1599.722534) were distributed along the strip axis to form secondary high-density nodes. Medium-density stations primarily included Kuanchengzi (MAX = 862.287231) and Liu Fangzi (MAX = 1081.885123). The spatial centre of gravity shifted southward along the main railway axis, exhibiting a distinct expansion trend. During the third period (see Figure 6c), the pattern evolves into a ‘multi-core + strong strip extension’, with Changchun Station’s KD value significantly increasing to 2694.275927 to form the sole ultra-high-density core. Gongzhuling Station (MAX = 1310.435013) and Dehui Station (MAX = 1599.722534) are distributed along the strip axis, forming secondary high-density nodes. Medium-density stations primarily include Kuanchengzi (MAX = 862.287231) and Liu Fangzi (MAX = 1081.885123). The spatial centre of gravity shifts southward from the north, exhibiting a distinct expansion trend along the main railway axis.
The formation of this spatial pattern is driven by multiple factors. During the first period, the distribution of heritage sites was influenced by military construction under the Russian Empire. Initially, they were distributed around railway nodes and exhibited weak systemic coherence. During the second period, following Japan’s occupation of the annexed territories, the Japanese authorities restructured their annexation strategy. Military-affiliated residential areas and worker zones were systematically laid out along the railway lines and the main street network system was established. This reinforced the guiding role of the railway town axis. In the third period, the functional differentiation of stations was significantly enhanced under the combined influence of strengthened urban functions and the role of the railway hub. The high-end supporting facilities at Gongzhuling Station were upgraded and its management functions strengthened. During the same period, Dehui Station and Changchun Station took on residential and transport functions, forming dense axes through spatial nodes and demonstrating a development logic in which military and administrative integration and functional clustering coexist.
In addition to the above, the evolution of building materials progressed in tandem with changes to the spatial layout. In the first period, structures were primarily made of brick, stone and wood, showing the local material sourcing characteristics of the Russian period. During the second period, structures began to incorporate a combination of brick, stone, wood and concrete, highlighting technological integration during the transition period of the Japanese occupation. In the third period, structures predominantly adopted brick and concrete, marking the standardisation of architecture and the maturity of engineering systems. Therefore, the overall emphasis on adapting to local conditions in material selection was evident in both the Russian and Japanese periods.

3.1.2. Spatial Analysis of Different Heritage Categories

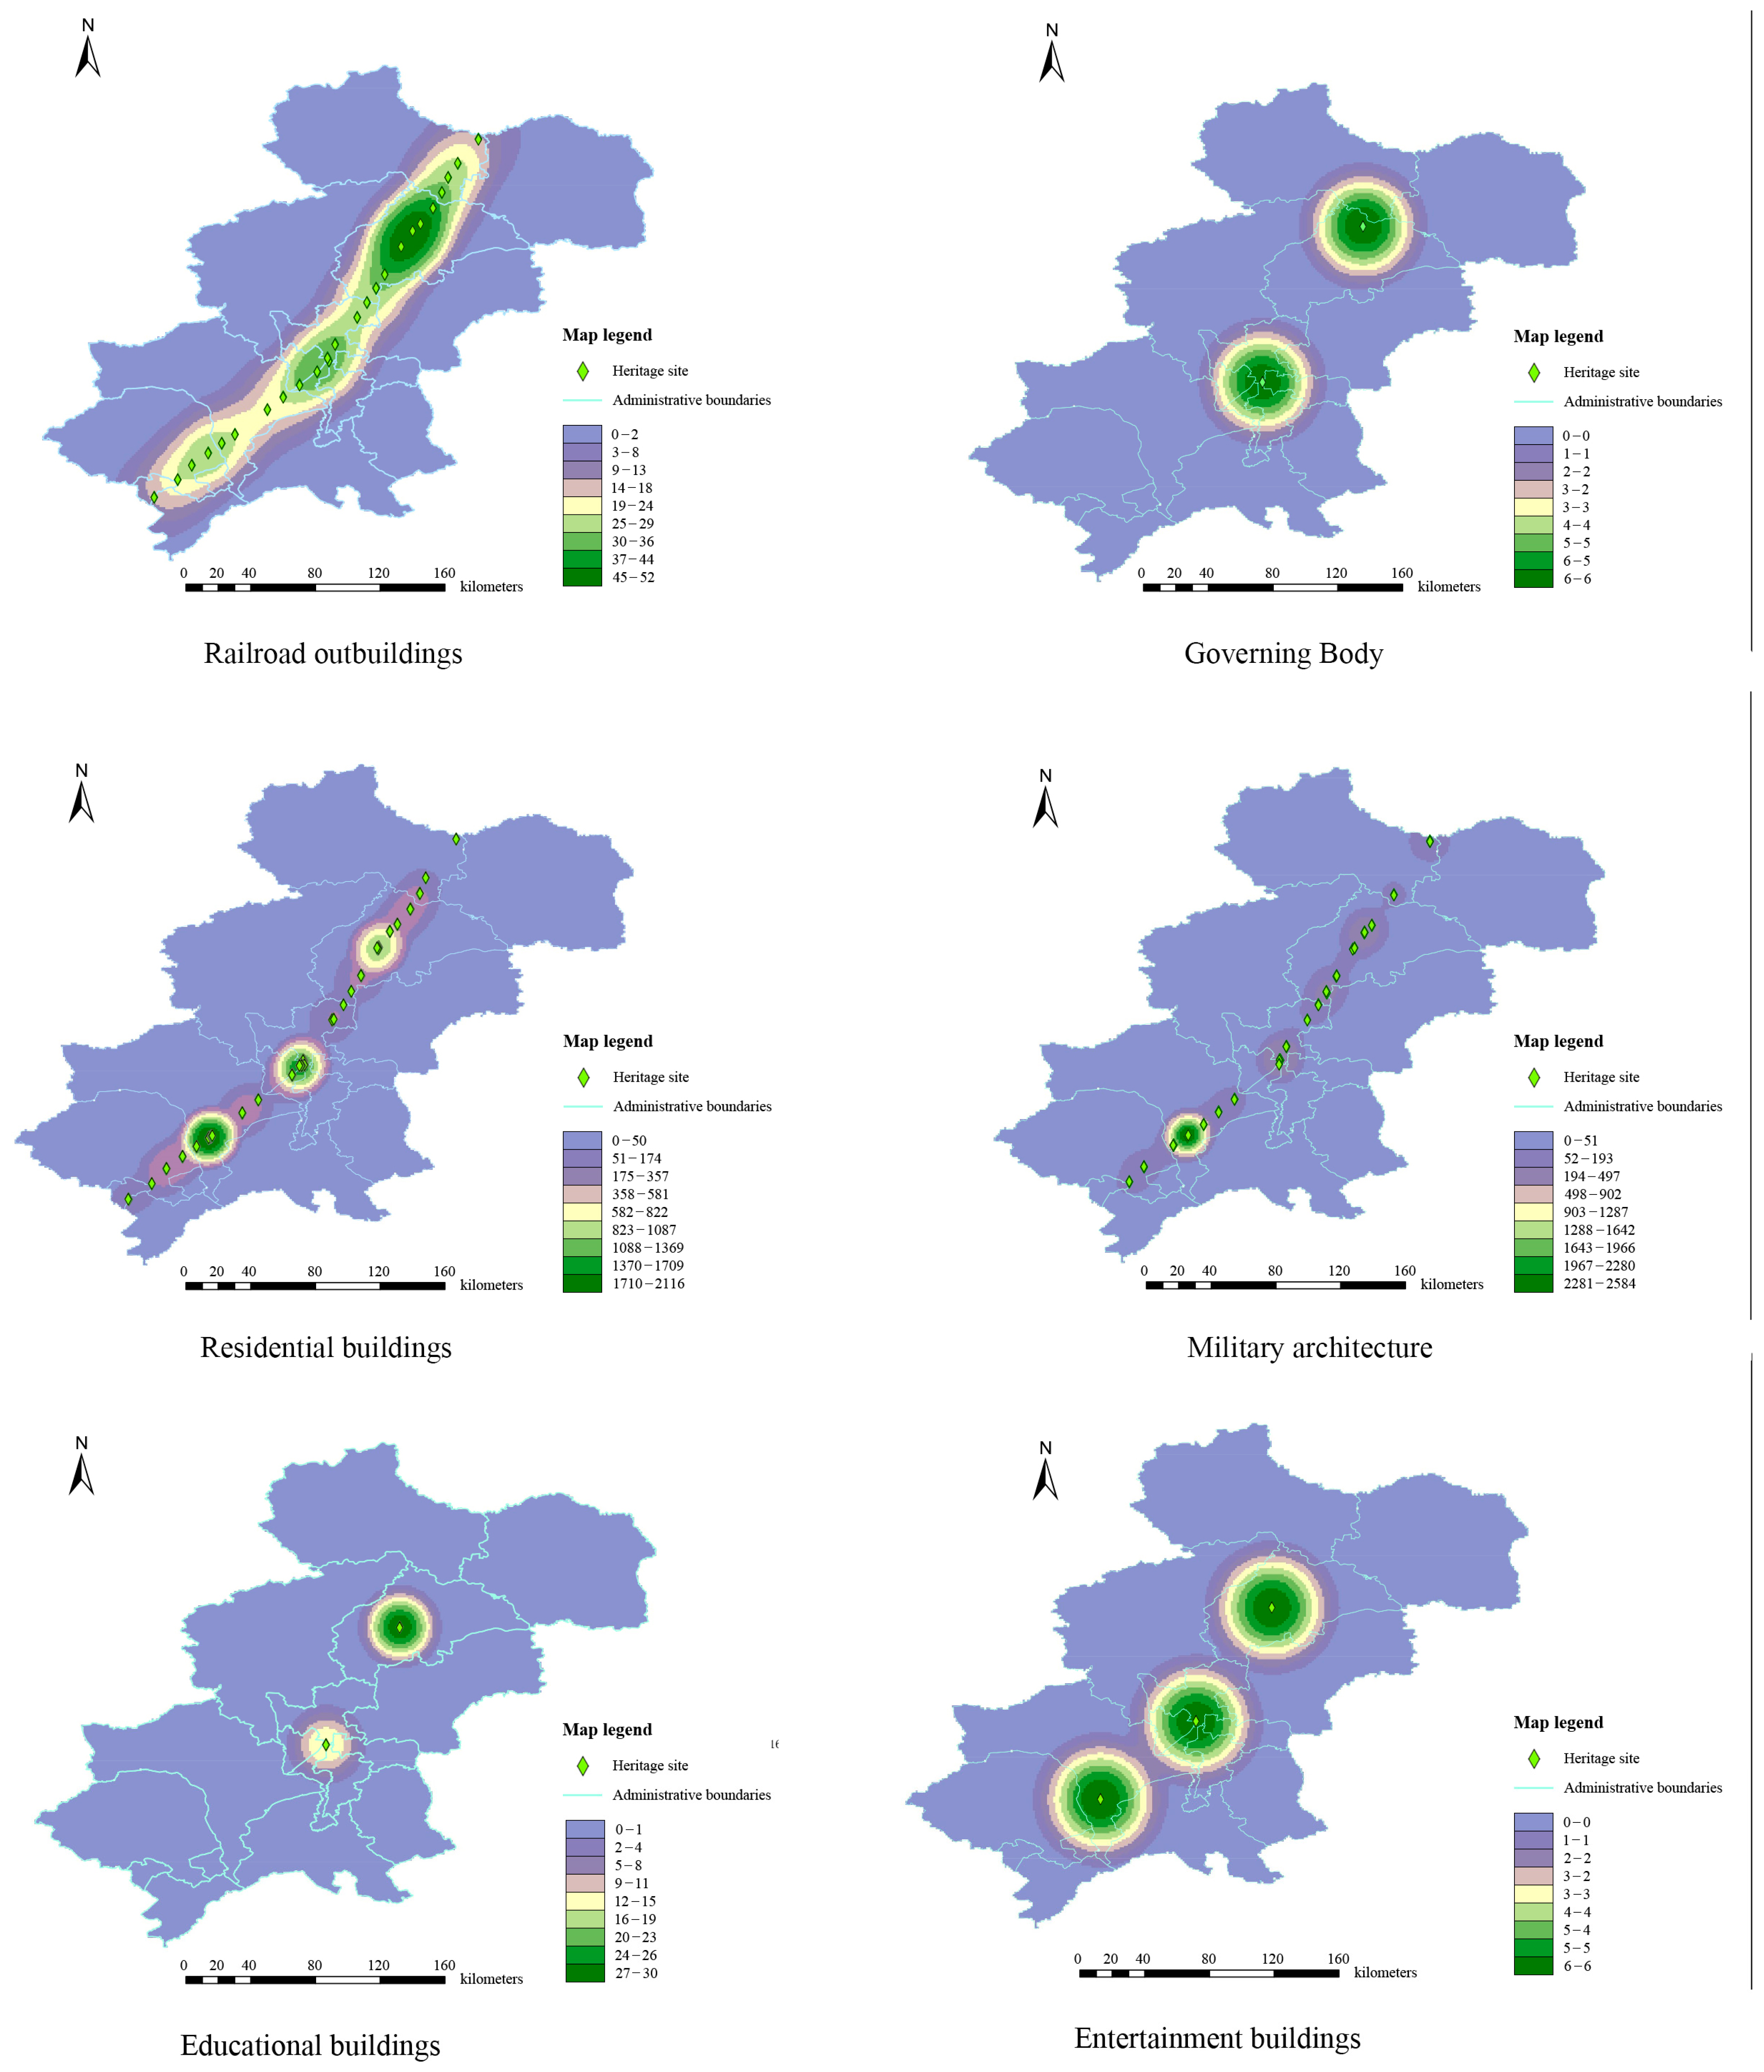
A total of ten distinct categories of architectural heritage were evaluated through the utilisation of density analysis. The results indicate that four categories of architectural heritage did not form distinct clusters: industrial buildings, commercial buildings, political buildings, and religious buildings. In other categories, the predominant pattern was identified as ‘clusters as the main feature and cluster belts as the secondary feature’. This observation pertained to categories such as railroad outbuildings, residential buildings, and military buildings. In contrast, administrative buildings, educational buildings, and entertainment buildings exhibited a ‘scattered cluster’ pattern. The following conclusions are thus drawn: (1) Railroad outbuildings their spatial logic of reliance on railway layouts and linear extension; (2) Residential buildings align with the pattern of urban residential spaces expanding outward in a gradient from inner to outer areas; (3) Military buildings tend to cluster in areas associated with strategic locations, while cluster belts are distributed along military defence axes or transportation corridors, reflecting the military function’s demand for spatial control and connectivity.
The average nearest neighbour index was used to analyse the spatial distribution patterns of different building types and objects. Proximity analysis was performed using indicators such as the average observation distance, the expected average distance, the nearest neighbour ratio, the Z-score and the p-value. The results of the study are as follows (see Table 3):
Firstly, Figure 7 shows that military buildings (z = −20.286984, p = 0.000000), industrial buildings (z = −5.771030, p < 0.01) and all buildings exhibit highly clustered distribution patterns across different building types. This clearly indicates their functional concentration and the spatial logic of industrial clusters. In other words, such buildings often rely on specific locations, such as military bases or industrial parks, and exhibit a clustered spatial layout. When we trace back to the historical causes, we find that Gongzhuling was designated a military stronghold during the early Russian colonial period and the initial phase of Japanese occupation. According to historical records, the Grain Refinement Institute and the Agricultural Experiment Station were constructed during the second period, while the Gongzhuling Station, though superficially designated as a grain distribution centre, actually served as a military logistics hub for troop deployment to the battlefield, further reinforcing the concentrated distribution of military and industrial buildings.
Secondly, the ratio of residential, railway-related, commercial, and political buildings to their nearest neighbours approached 1, with a p-value greater than 0.05, indicating a random spatial distribution pattern. Residential buildings gradually expanded with population migration, while Railroad outbuildings were continuously added due to functional requirements. Commercial and political buildings emerged in Changchun in the second and third periods. As the terminus where lines converged, the Kuanchengzi Station became a crucial site for interactions, negotiations, and rivalry among China, Japan, and Russia. The construction of the ‘Changchun Station’ by the Japanese between the Russian City and the old city of Changchun isolated Russian forces in the northwest corner of Changchun. With the intensification of trade and increasing population movement, commercial buildings were added to this intersection and Changchun began to emerge as a potential political centre for Manchukuo.
Finally, administrative, religious, educational and recreational buildings were distributed extremely sparsely, with extremely high nearest neighbour ratios. Administrative buildings were distributed between Changchun and Laoshaogou, with consulates forming the core of Changchun’s administrative institutions. Laoshaogou Station, situated at the intersection of the Songhua River and the railway, saw frequent water and land transportation, forming a distribution pattern dominated by trade-related administrative institutions. Religious buildings were only constructed in Changchun and Dehui. The West Hongwanji Temple complex in Changchun, for example, was built by Japan primarily to serve Japanese expatriates, military and political personnel, and colonisers. It facilitated ideological penetration in tandem with military expansion through the propagation of Japanese Buddhist sectarian ideas. In contrast, the Orthodox Church in Dehui was exclusively for Russian employees of the China-Eastern Railway and their families, fulfilling their religious needs. Entertainment buildings were constructed slightly earlier than educational buildings. As the number of immigrants increased, they were gradually built in key towns, reflecting an increasingly dispersed distribution pattern.
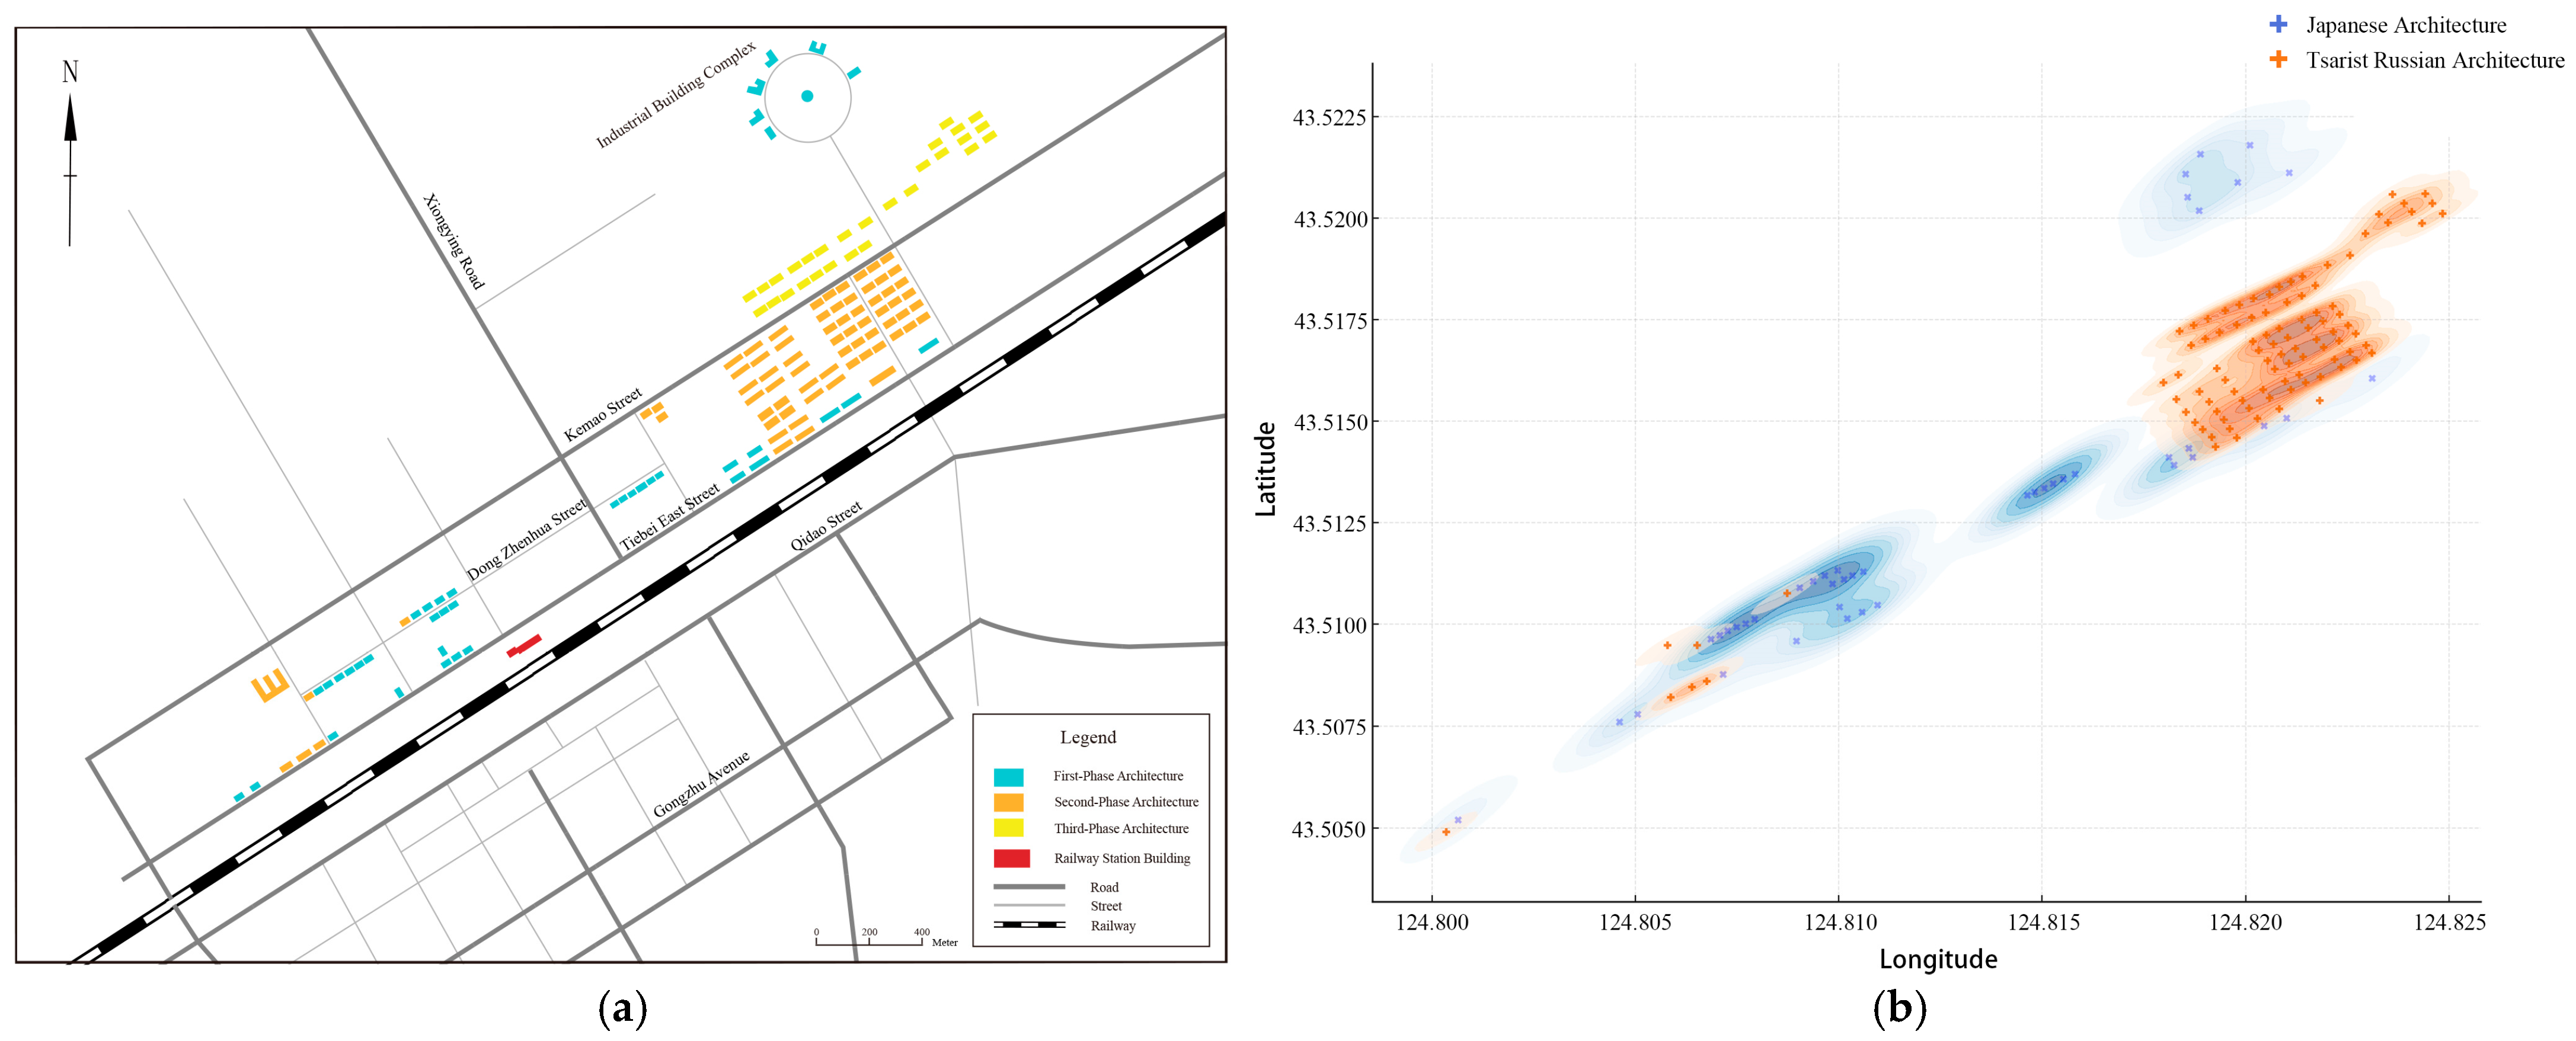
In the course of the study of various architectural objects, the Gongzhuling Station, which was constructed on a larger scale, was selected for analysis in order to ascertain the differences between the buildings originally constructed by the Russian Empire and those newly built after Japan took over. A combination of historical maps and field research was undertaken to create three heritage distribution maps for different periods (see Figure 8a). The disappeared heritage sites from the census report were then combined to create a nuclear density heat map for Japan and the Russian Empire (see Figure 8b). The results (see Table 4) demonstrate that both types of heritage sites are distributed in a clustered manner. Russian-era buildings are distinguished by their linear arrangement in strip-like or enclosed clusters, exhibiting a reduced nearest neighbour ratio. In the Russian Empire, the primary focus was on the development of the railway hub, with the planning of the area undertaken according to functional zones. Conversely, the larger distances between buildings suggest relatively spacious intervals between individual structures, which is indicative of the European urban planning style, with its emphasis on landscape, views, and military defence space. When compared with Japan’s results, Japan exhibits a higher nearest neighbour ratio, more extreme Z values, and denser individual structures, showing a greater emphasis on land use efficiency and compact urban development. This phenomenon may also be attributed to the centralisation of military and administrative functions during Japan’s colonial era, a strategy that aimed to enhance the efficiency of management and control.

3.2. Temporal Evolution Characteristics

3.2.1. Evolution of Functional Composition in Station Areas

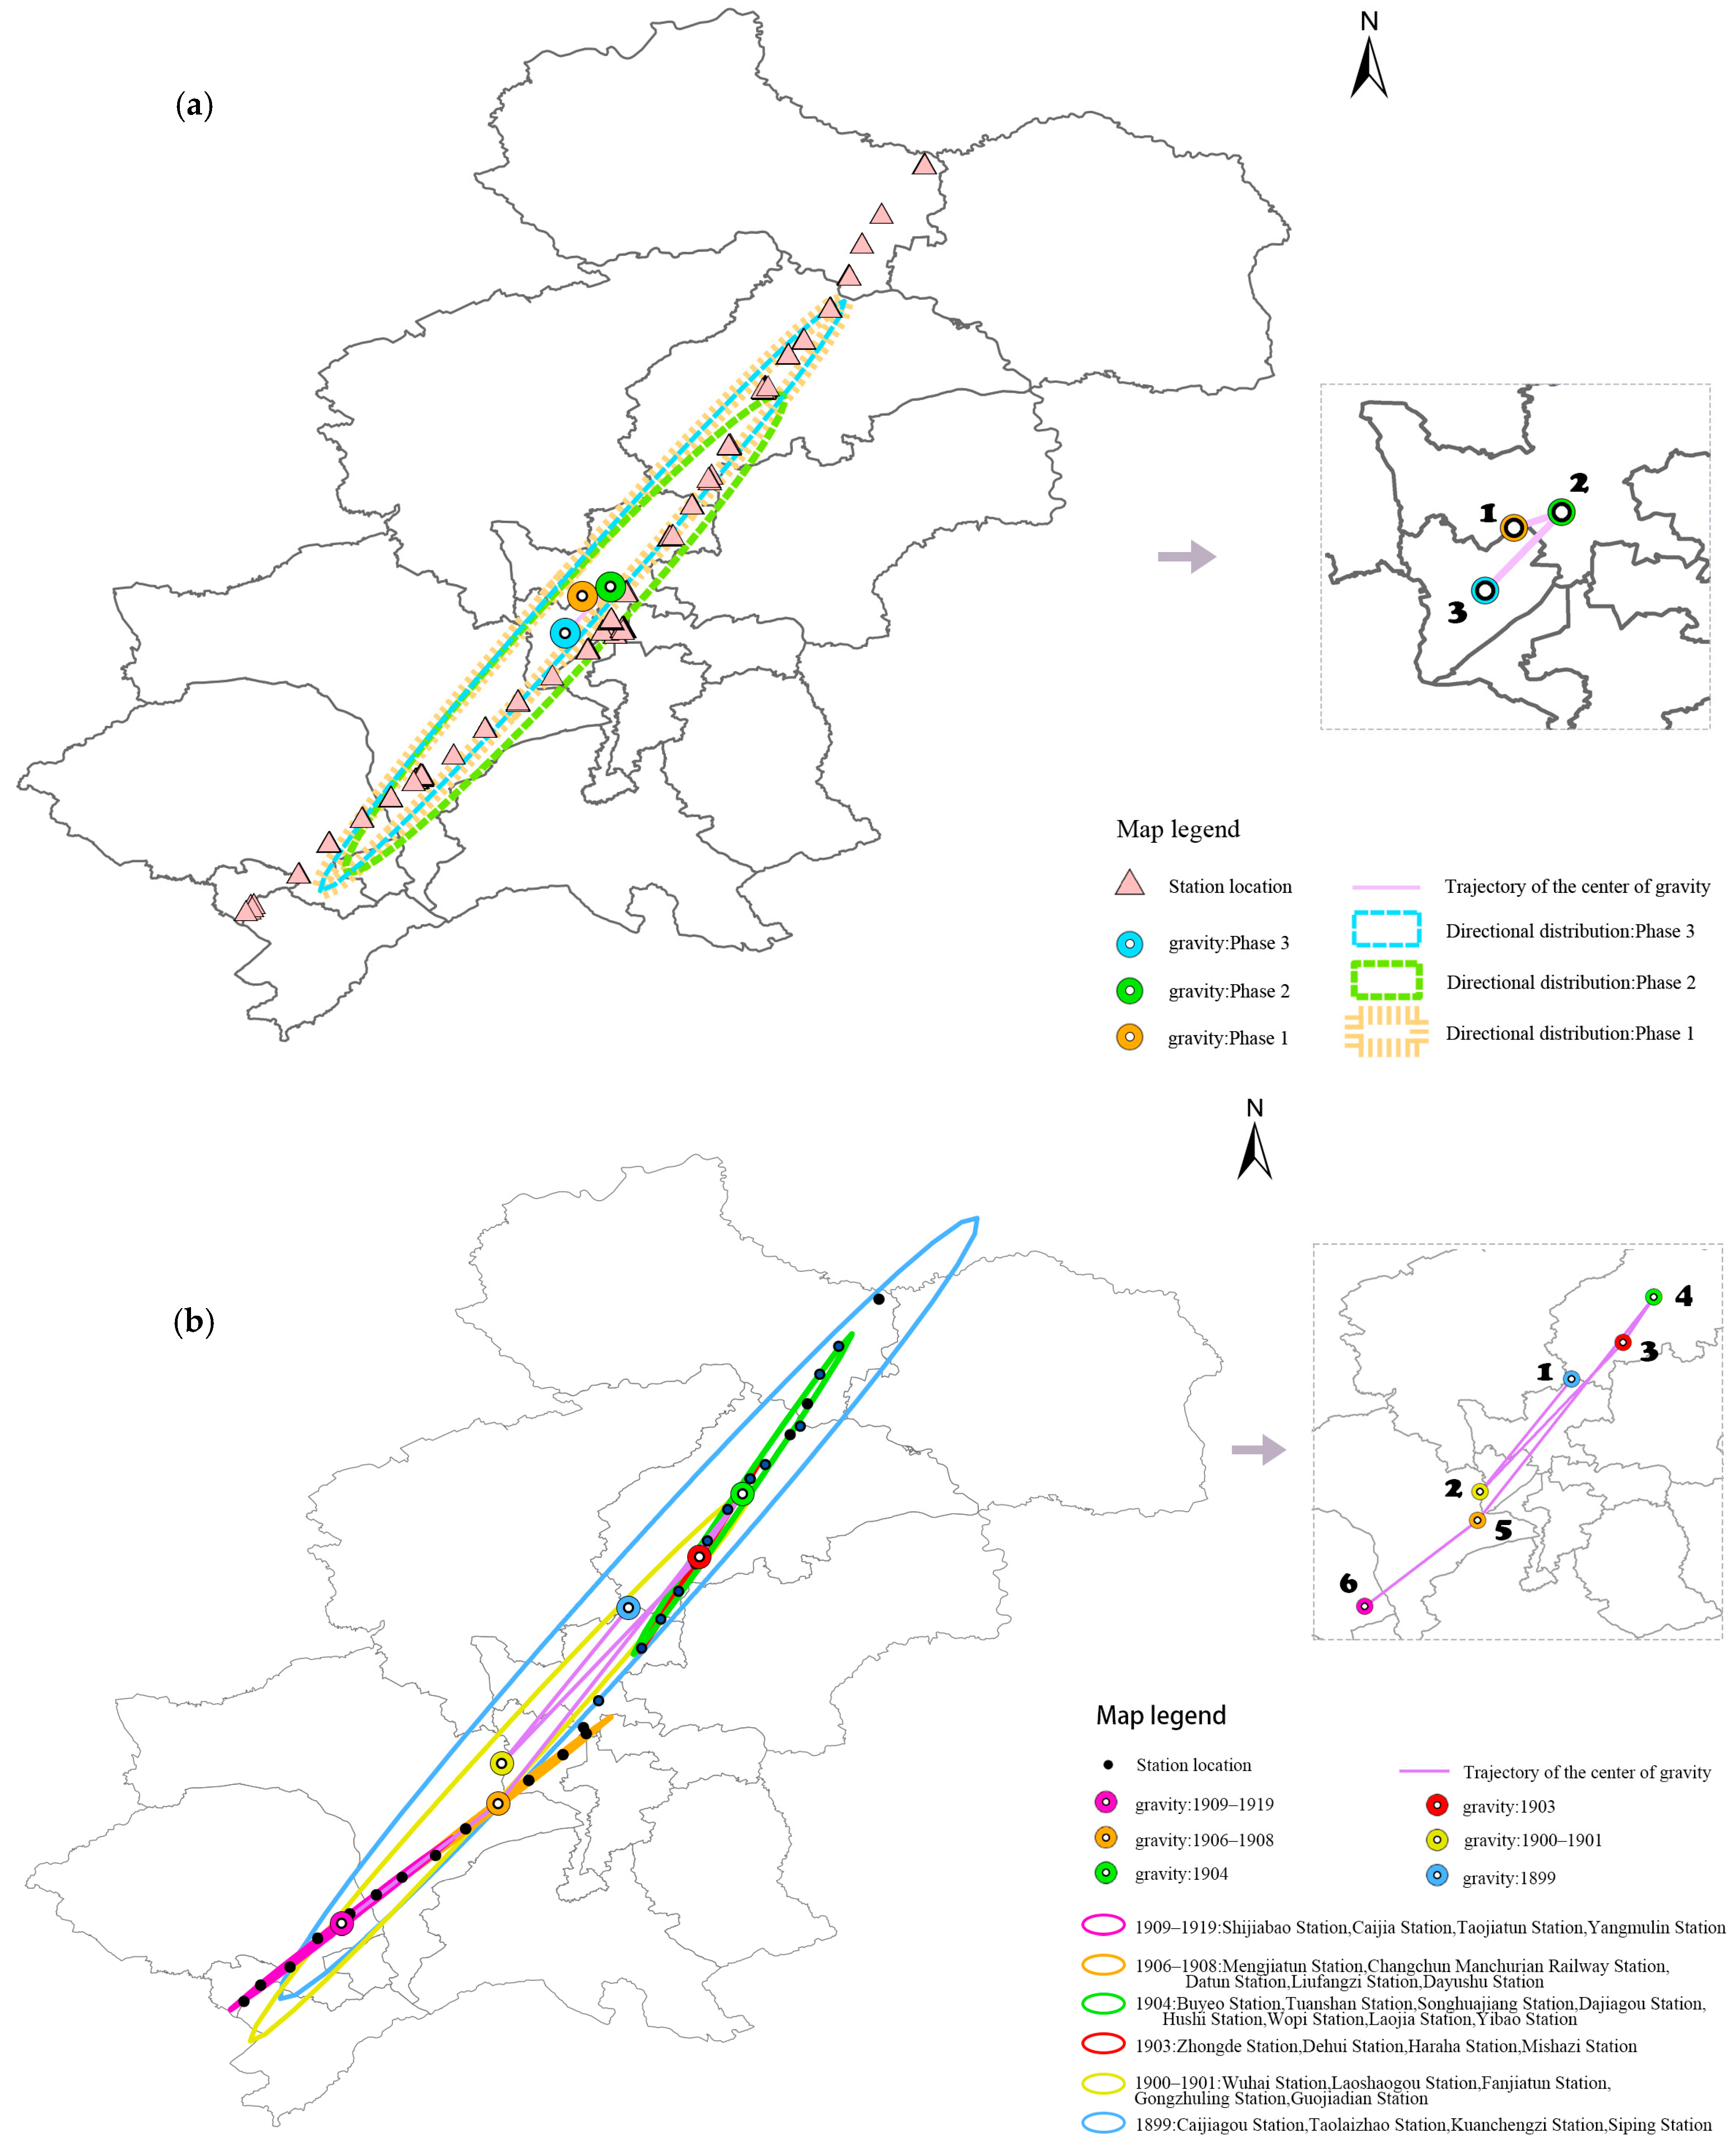
The evolution of three periods of architectural heritage and six stages of station construction was mapped using standard deviation ellipses and centre of gravity analysis.
From the perspective of different periods of architectural heritage (see Figure 9a), the overall centre of the heritage shifted firstly from the junction towards the north, and then towards the south. The rotation angle for all three periods was found to be between 41 and 42 degrees, demonstrating relative stability. This finding suggests that the overall distribution direction of the Jilin railway heritage has consistently exhibited a tendency towards the northeast-southwest direction, reflecting the continuity of the transportation development orientation centred on railways. In the second period, the ellipse had the largest area (0.23951). Although its perimeter was shorter, the degree of lateral (X-axis) dispersion increased significantly (0.090425), resulting in a flatter and wider elliptical shape. This indicates that during this stage the distribution range of railway heritage expanded in the east–west direction, forming a more pronounced trend of horizontal extension.
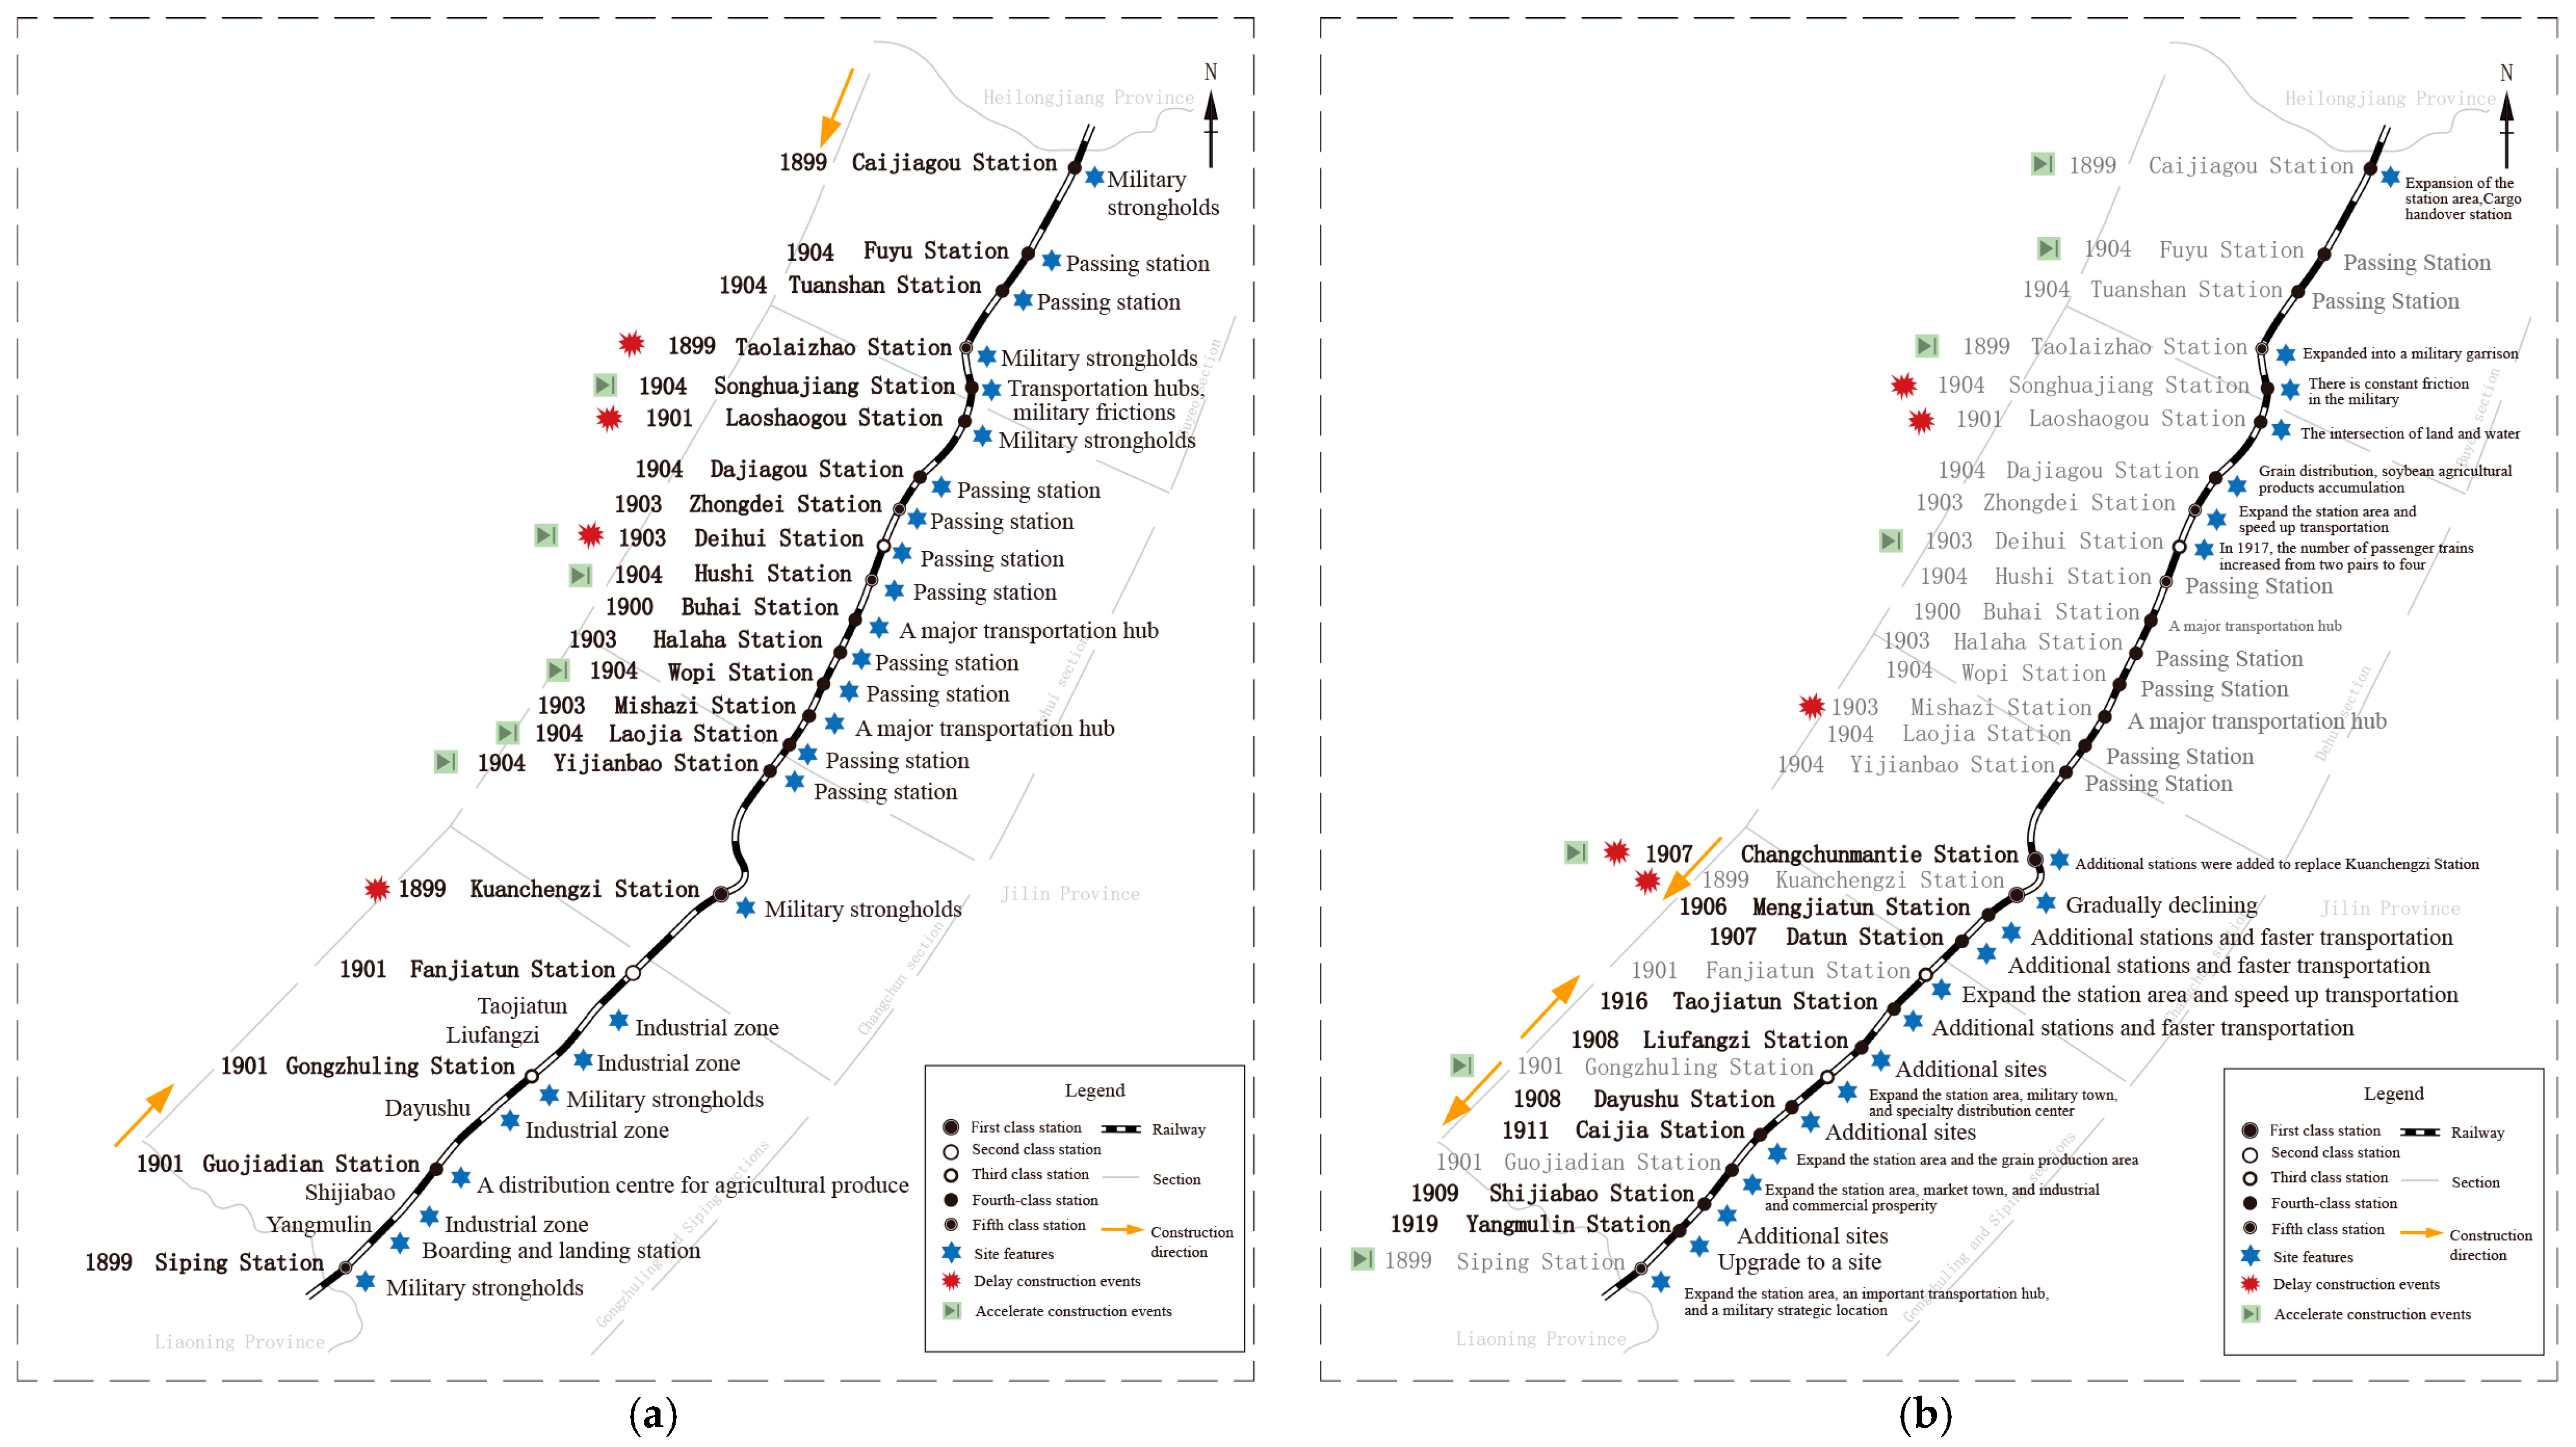
As illustrated in Figure 9b, the largest elliptical area in terms of distribution range is observed in the first stage of station construction (0.502042). In 1898, the chief engineer of the Chinese Eastern Railway divided the main line into several sections for construction, with the initial design of the four stations based on distance rather than grade. The construction process was initiated from both extremities towards the centre, with the northern segment being subdivided into separate components for the purpose of construction. In contrast, the southern segment was planned with greater consideration. Accordingly, each station was established at an interval of 60 Chinese miles and categorised into five distinct grades, ranging from high to low. In the subsequent phase, the ellipse underwent a slight contraction, signifying the onset of a period characterised by functional specialisation or regional prioritisation. In the third and fourth phases, the area underwent a substantial reduction to a small ellipse (0.003–0.02), indicating an increased concentration and directionality of new stations. In the fifth and sixth phases, although the area underwent slight expansion, it remained at a low value, indicating that new stations were mostly small in scale and well-planned. However, due to factors such as war, resource plundering, local civilian resistance, Red Beard bandit uprisings, the Boxer Rebellion, and epidemic outbreaks, additional functions were added and stations were expanded to enhance transportation efficiency. The aforementioned factors have been identified as both catalysts for the acceleration and deceleration of the development of station areas and the construction of buildings. These have been categorised and summarised in Figure 10.
In summary, based on the different data presented across three distinct periods, the following characteristics and causes have been identified: During the first period, construction was conducted exclusively by the Russian Empire, with station functions primarily focused on military transportation. The station establishment exhibited characteristics of a small number of evenly distributed concurrent points and a gradual increase in scattered points. In addition to the incremental expansion of standard designs, a diversification of functional building complexes emerged, with some exceeding the original station grade in scale. The original facilities and station area scales of fourth- and fifth-class stations far exceeded the standard specifications, as evidenced by the fifth-class Zhongde Station, which was equipped with a water tower. In the second period, Russia and Japan engaged in distinct construction endeavours. The development of sanatorium-type functions by Russian stations, in conjunction with the deployment of significant military forces at stations in proximity to Changchun and the Songhua River, signifies an enhancement in military strategic functions. Of these, the Taolai Zhao Station functioned as a sanatorium-type station, while the Dajiagou Station served as a distribution hub for agricultural products. Japan constructed new stations or expanded existing Russian stations, driven by the exploitation of mineral resources and the export of grain and other goods. Consequently, new facilities were constructed, including small warehouses, locomotive sheds, and railway yards. The stations were reclassified based on their original structures. The five stations constructed by Russia were designated as large stations, the work areas as small stations, and additional passenger platforms were added. The construction scale of the small stations was limited, with functions added as required. Consequently, during the second period, Japanese stations were established with compensatory functional additions at evenly spaced points, characterised by multi-point continuous expansion. In the third period, functional conversions and divisions of labour at stations were carried out separately by Russia and Japan. In consequence of population growth, emphasis underwent a shift towards living supplies, and stations originally built for military transportation gradually declined until 1930. During this period, Russian stations exhibited the characteristics of upgraded residential areas and clear functional division. Conversely, Japanese stations in South Manchuria placed a higher priority on the exploitation of agricultural products, forests, and minerals. The functional characteristics of Japanese station construction were multi-point resource exploitation and trade.

3.2.2. Distance Analysis of Railway Heritage

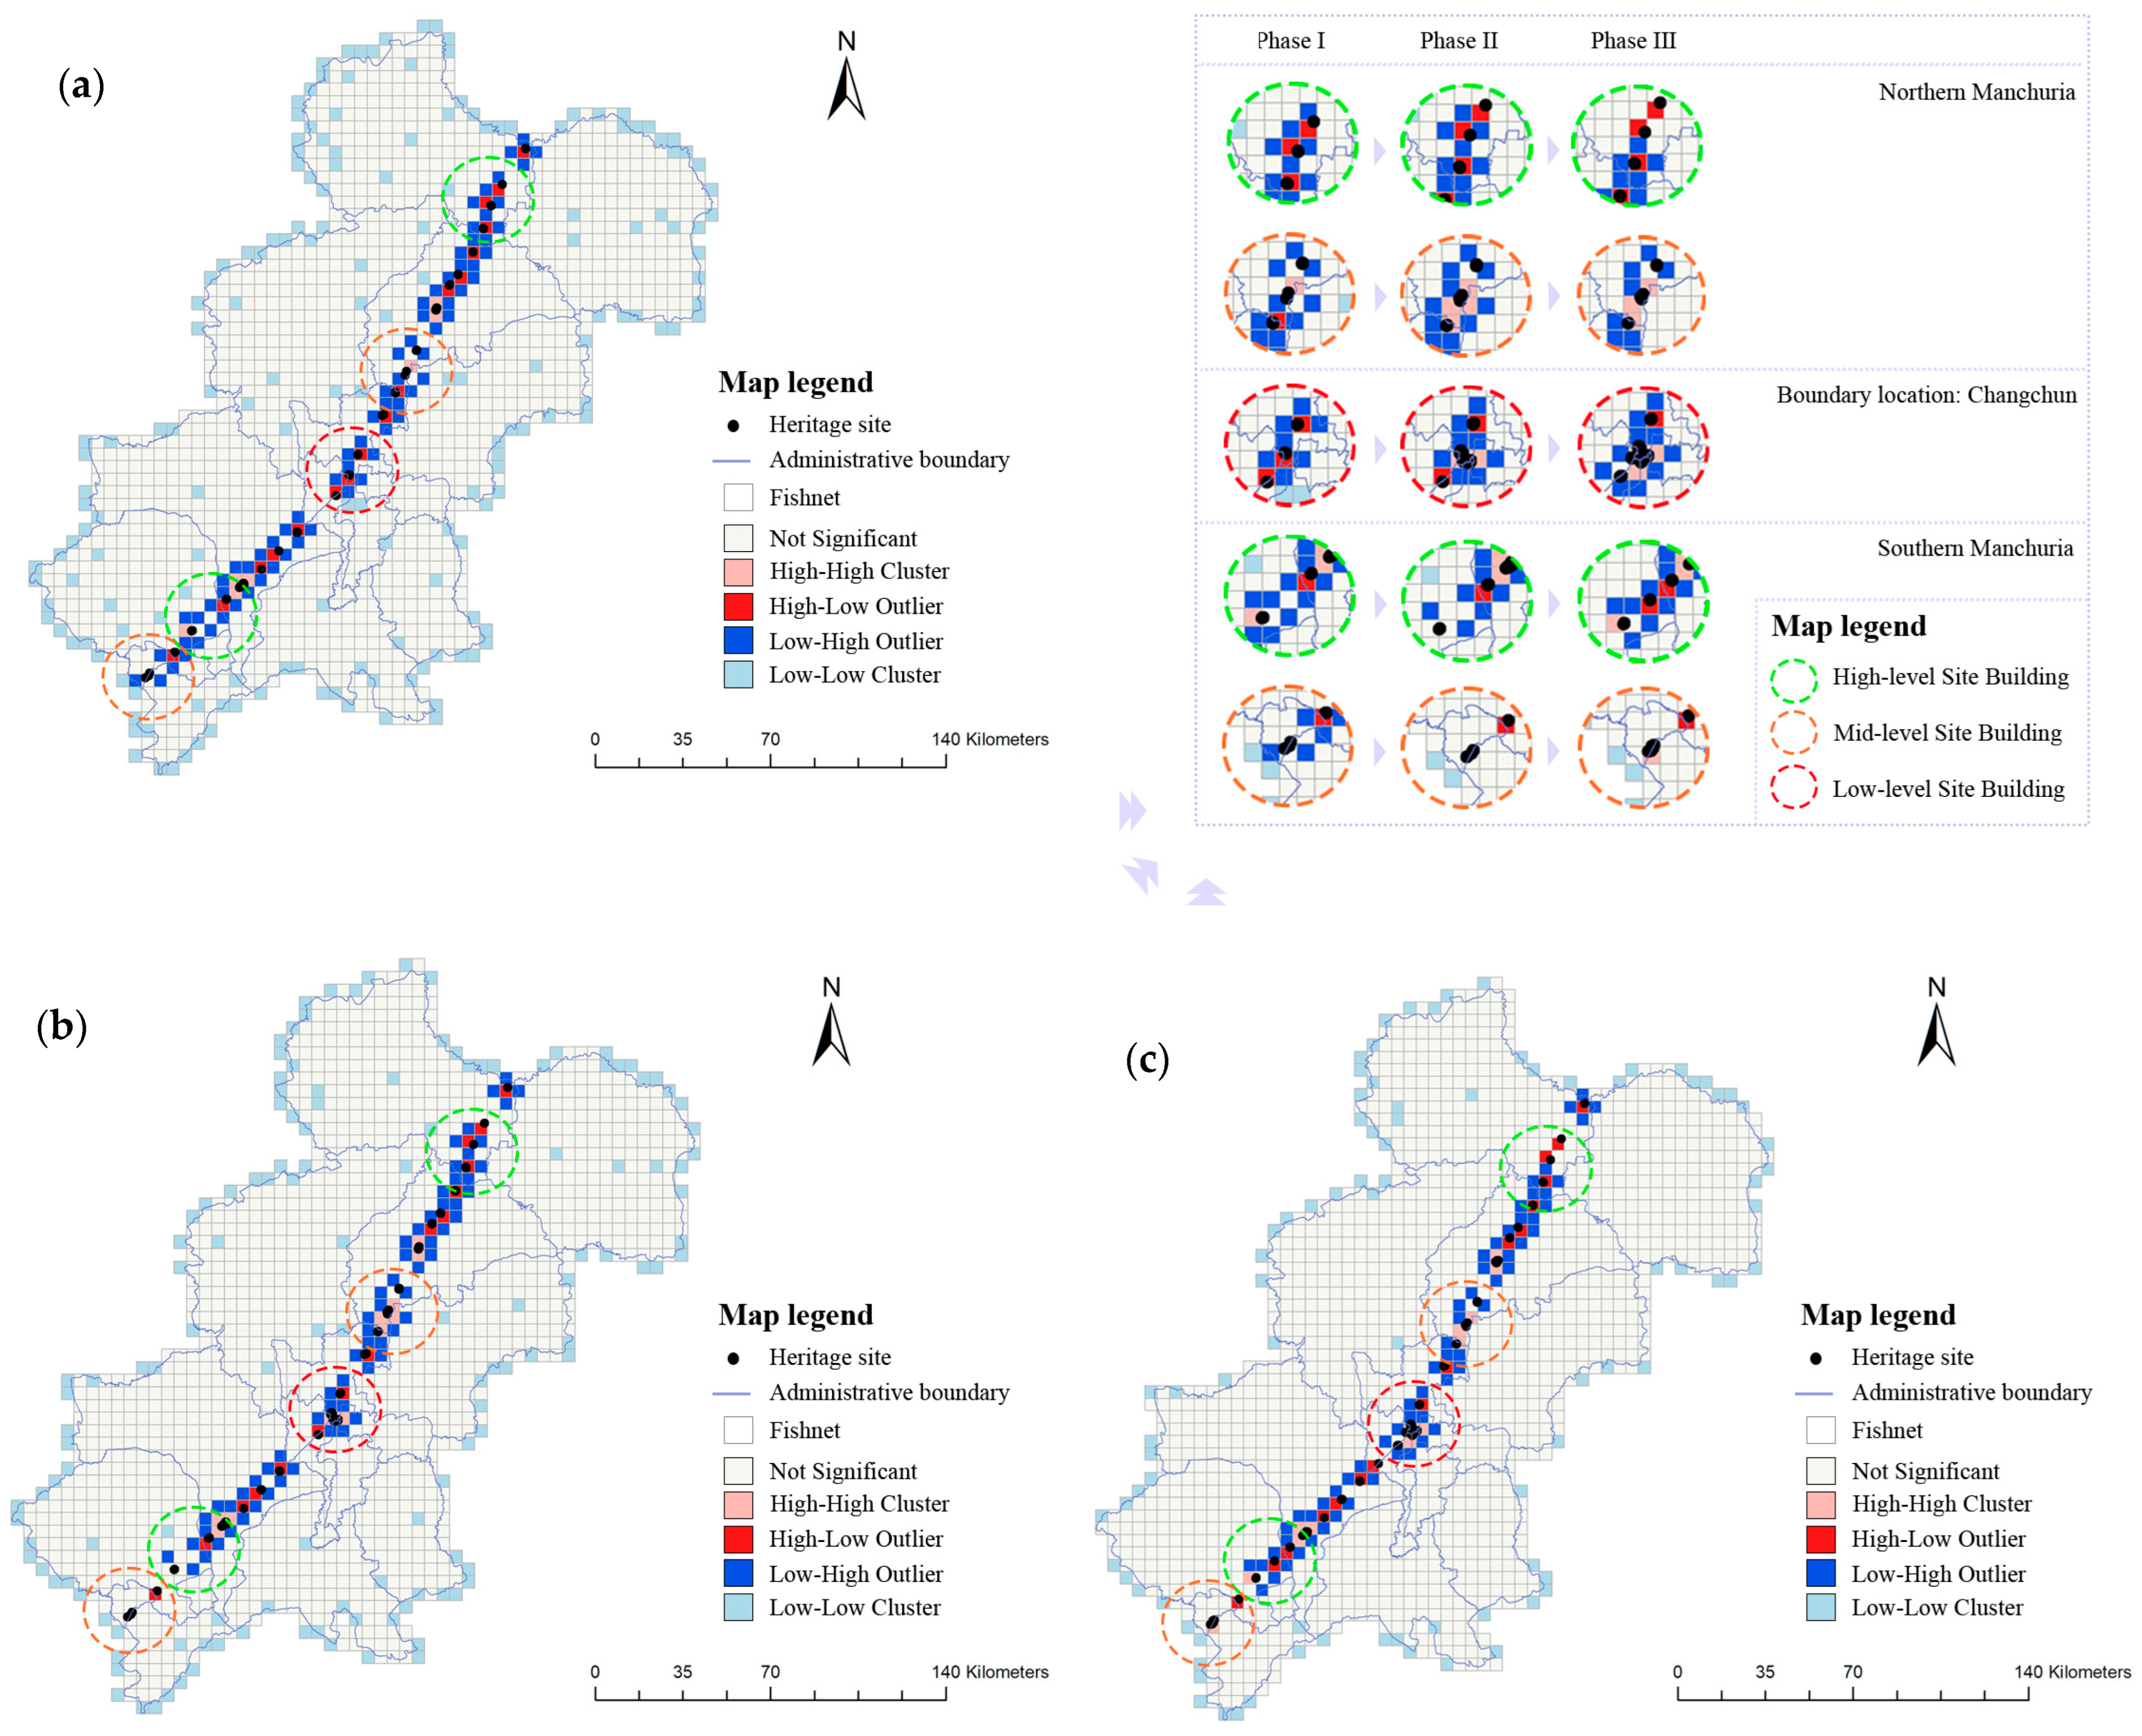
The temporal evolution of distances between railway heritage sites was examined, with clustering or dispersion characteristics analysed across three distinct time periods and variations in distances between different railway heritage sites distributed across high-, medium-, and low-grade stations. The Moran’s I indices for periods I, II, and III were 0.132226, 0.204739, and 0.099250, respectively, all with p-values of 0.000000, indicating clustered patterns. Subsequently, cluster distribution mapping was employed for the purposes of clustering and outlier analysis (see Figure 11). Sites not enclosed within circles exhibited no significant changes in clustering patterns, remaining consistently low-grade. For the remaining elements, Phase I primarily demonstrated low-value anomalies surrounding high-value points, suggesting an isolated distribution of railway heritage. However, Phases II and III exhibited relatively stable high–high clustering. The area centred on Changchun Station, a high-grade station located at the boundary, exhibited low–low clustering or low-value anomalies across all phases. This suggests that, despite its function as a north–south transport hub, the station plays a transitional role within the heritage pattern. Conversely, the Southern Manchuria region predominantly exhibited low–low clusters and low–high anomalies across all three phases, with heritage evolving from scattered to scaled aggregation.
Collectively, this pattern reveals the close linkage between the spatial distribution of railway heritage and regional functional positioning, policy frameworks, and strategic development objectives. In the aftermath of Russia’s defeat in the Russo–Japanese War, a modest surge in Russian immigration was observed in Jilin Province following the October Revolution. However, the subsequent imposition of restrictions on the scope of Russian-controlled territories resulted in urban functions remaining at a rudimentary level. Expansion was primarily constrained to lateral growth along railway lines. Japan, as the transient victor, adopted Western planning and construction systems, thereby demonstrating greater sophistication and long-term vision.

3.2.3. Architectural Style Evolution Analysis

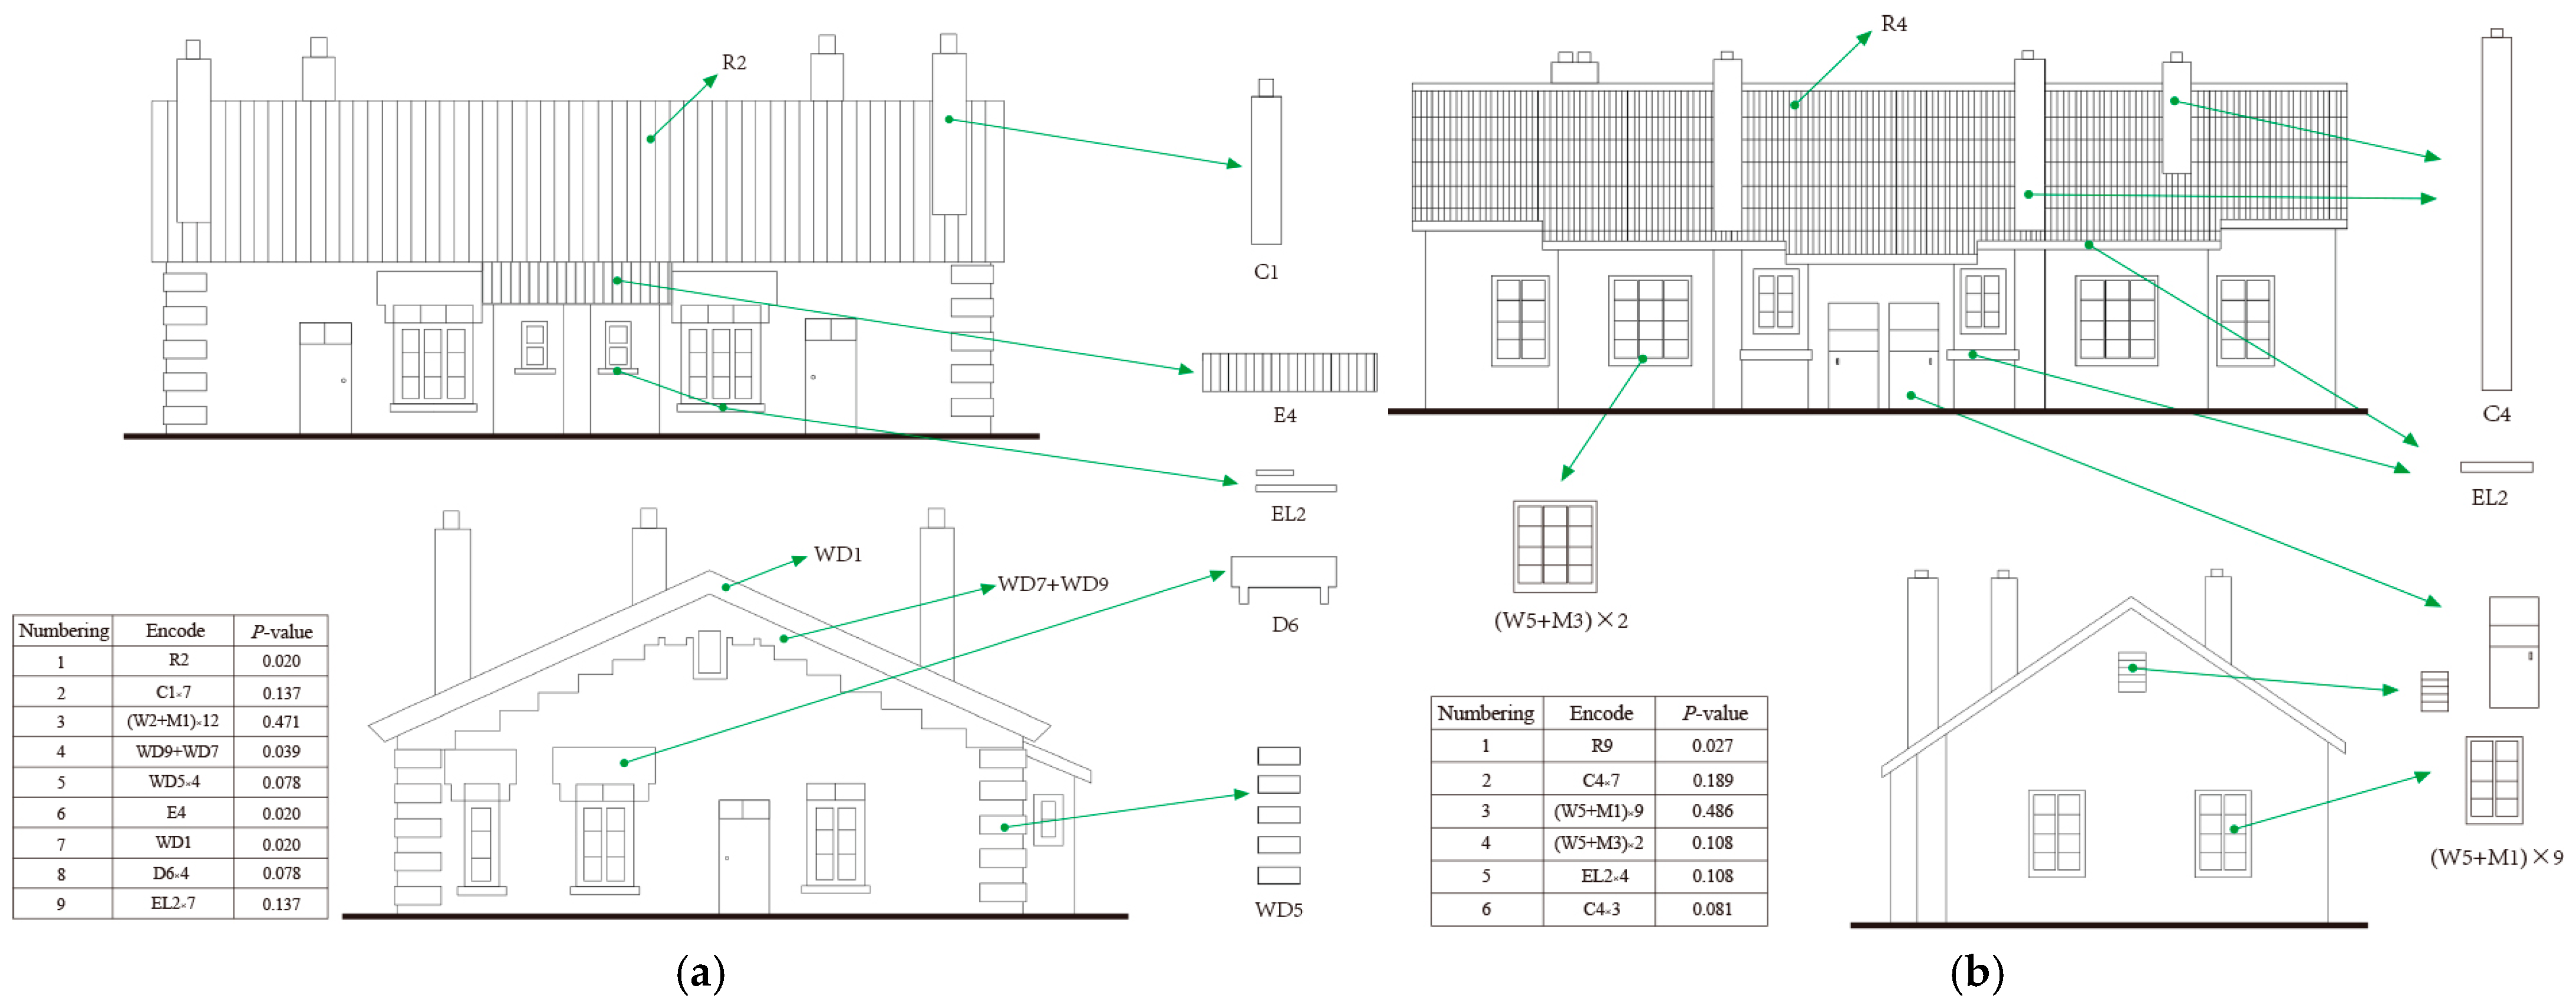
The relationship between Russia and Japan in Jilin Province was characterised by tension for a considerable period. During the period in which architectural trends and ideologies were surging in both the Russian Empire and Japan, a diverse array of architectural styles emerged. In the study of railway architectural heritage styles, the approach of encoding architectural façade language can be referenced. Architectural elements can be regarded as vocabulary, and their reasonable combination conveys meaning [48]. Consequently, when studying railway architectural heritage, it is necessary to deconstruct the facade language, encode common architectural elements as independent ‘events’ (see Table 5), and classify them according to architectural characteristics such as roofs and walls (see Figure 12). This methodology facilitates the calculation of the ratio P of a single language element to the total number of facade elements, thereby enabling the construction of a meaning analysis system for railway architectural heritage.
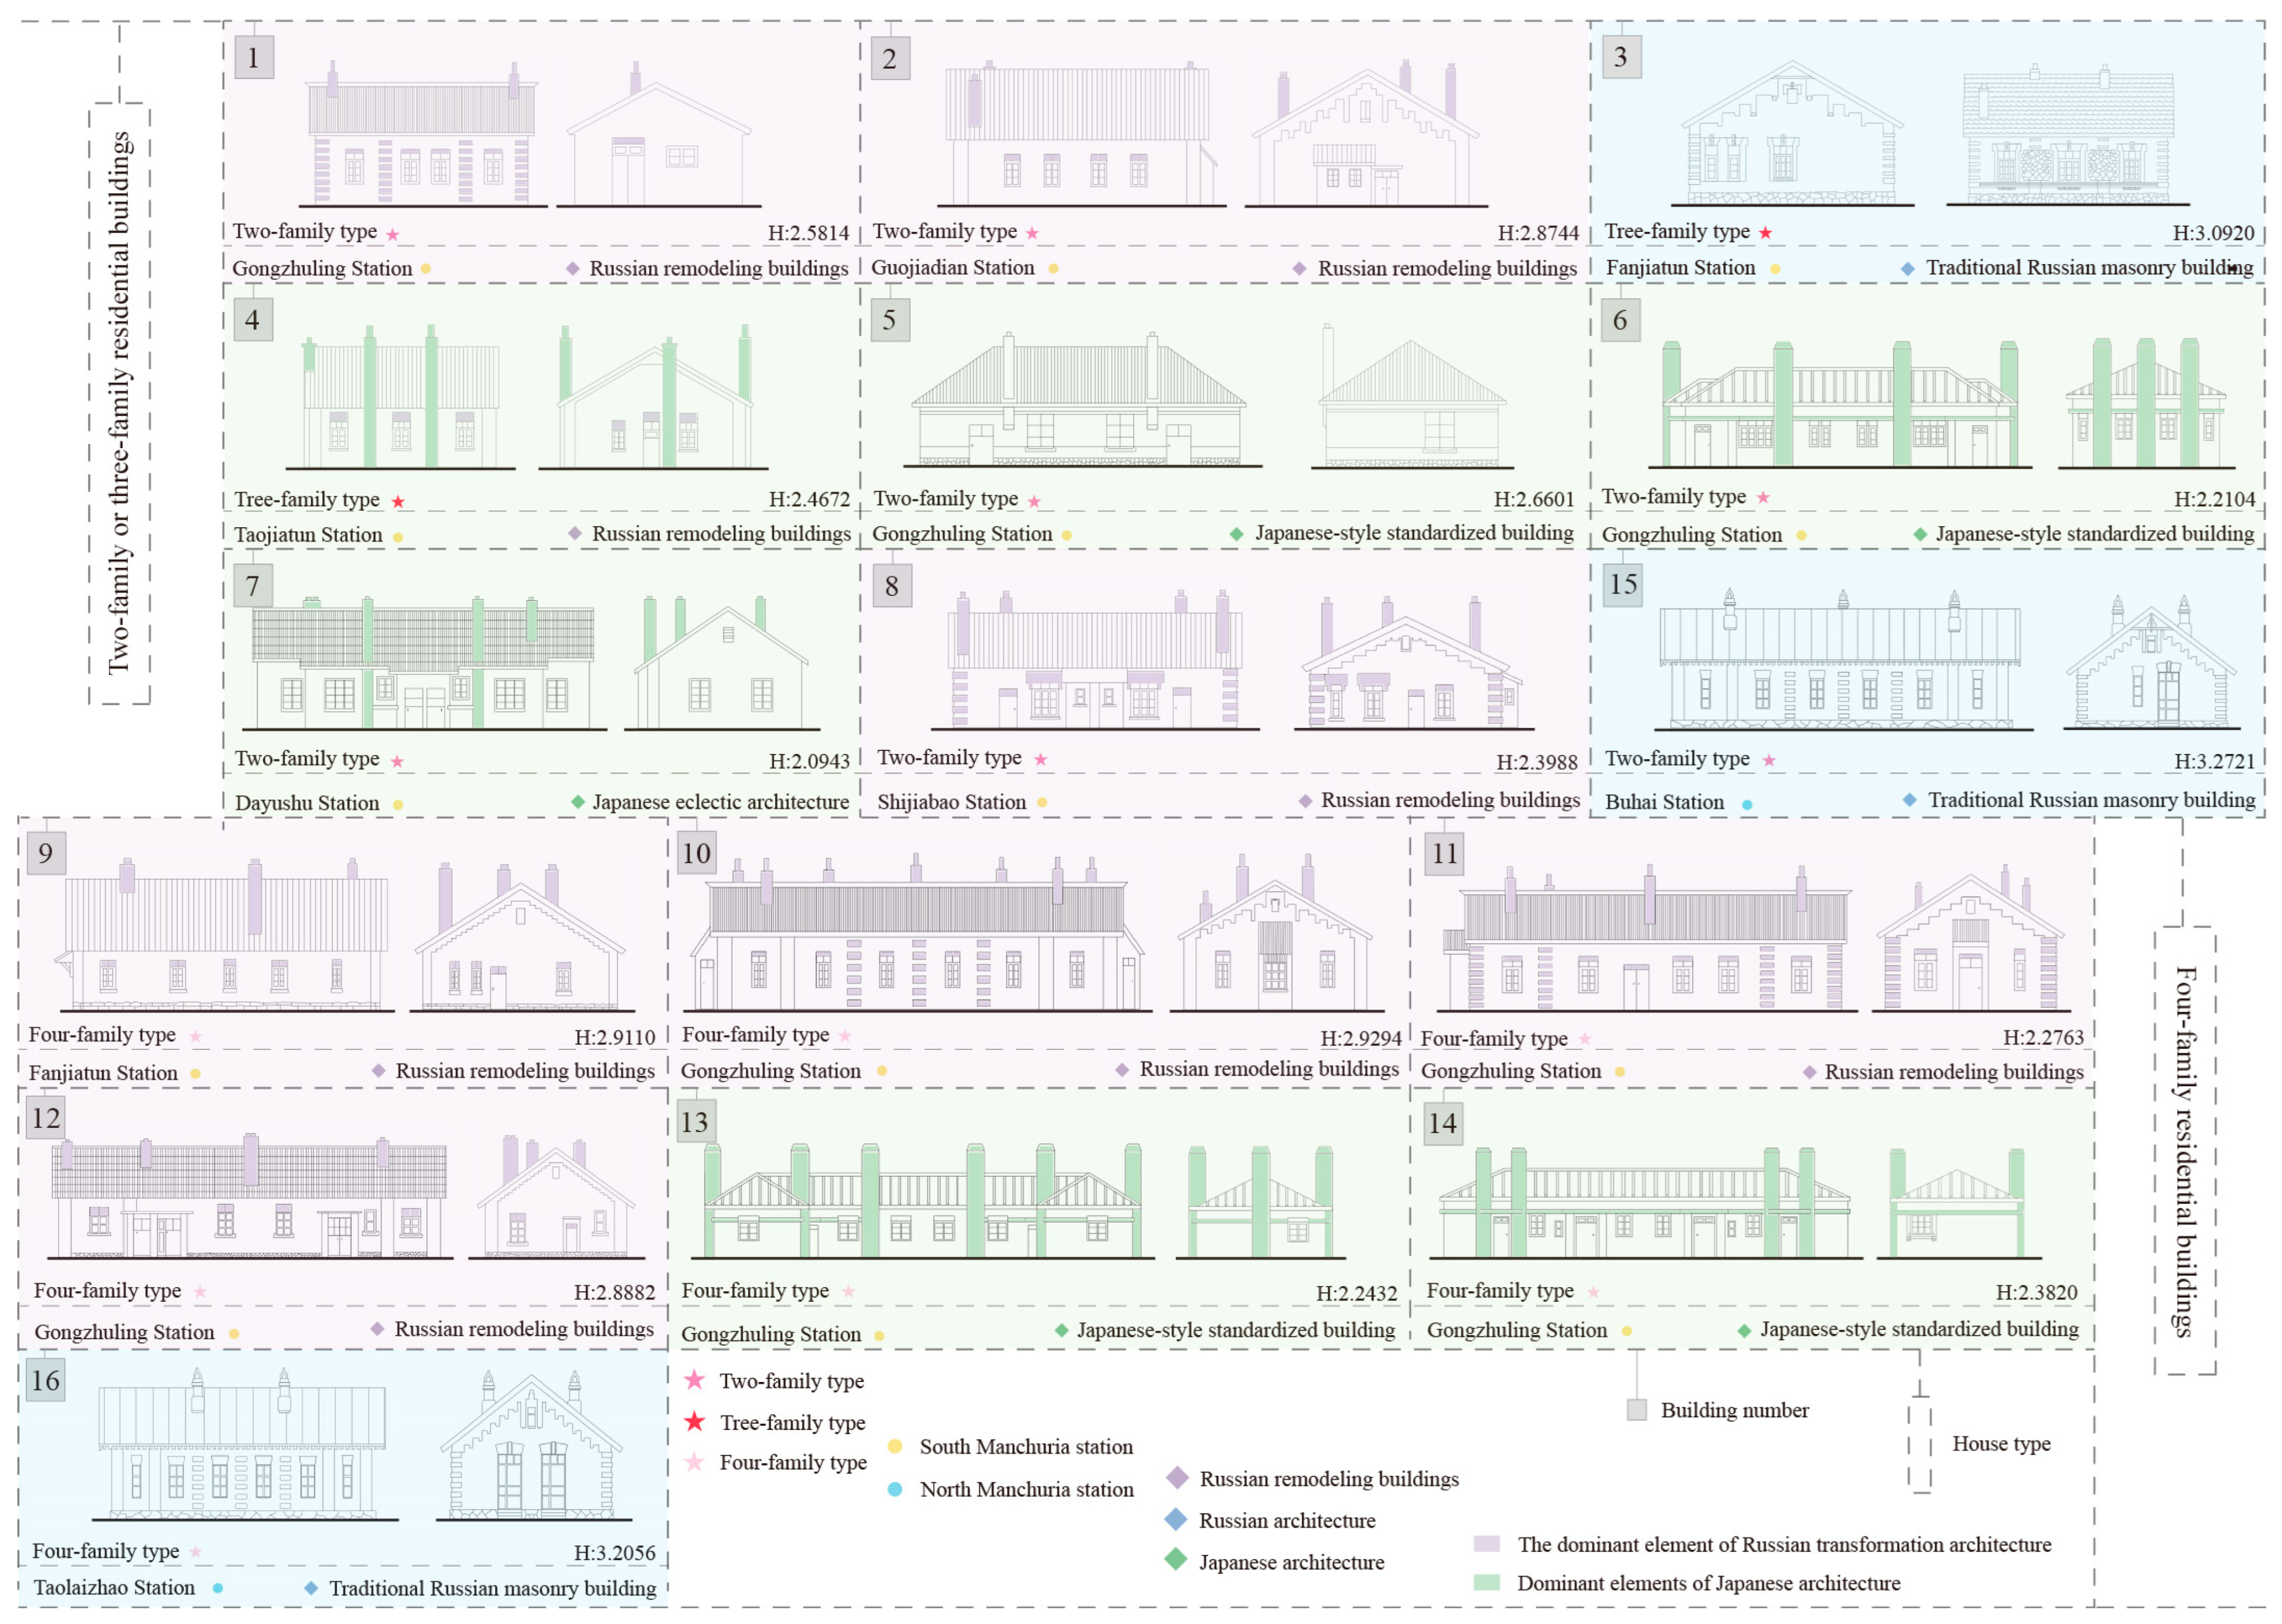
The selection of study subjects was based on the coding framework, with the selection process informed by relevant survey reports for the Changchun and Siping sections [55,56]. In selecting building types, the following criteria were considered: barracks and residential buildings are predominant, with barracks being group buildings whose structural integrity is poorly preserved, and with traces of bunkhouse and stables having disappeared; among residential buildings, there are only four high-end residential buildings, independent residential buildings, and apartment-style station master residences combined. However, the absence of independent residential buildings in Japan during its early period rendered it challenging to establish a reference point with the Russian Empire. In multi-unit buildings, Japanese barracks and employee housing were combined, while in Jilin Province, only Russian barracks were present, with no residential buildings. Single-storey buildings were the dominant feature, with a limited number of multi-storey buildings. In selecting styles, the following factors were given full consideration: early temporary dwellings and traditional Japanese houses have disappeared and cannot be studied; there are few examples of classical revival styles in residential architecture, and the remaining styles are chaotic. Therefore, single-storey residential buildings with two, three, and four households were selected as the research subjects, with the geographical scope covering South Manchuria and North Manchuria. Finally, the architectural language was encoded, the P-value was calculated, and information entropy [65] was introduced to measure the overall compositional characteristics of the buildings (see Table 6). This resulted in the formation of a sample spectrum (see Figure 13).
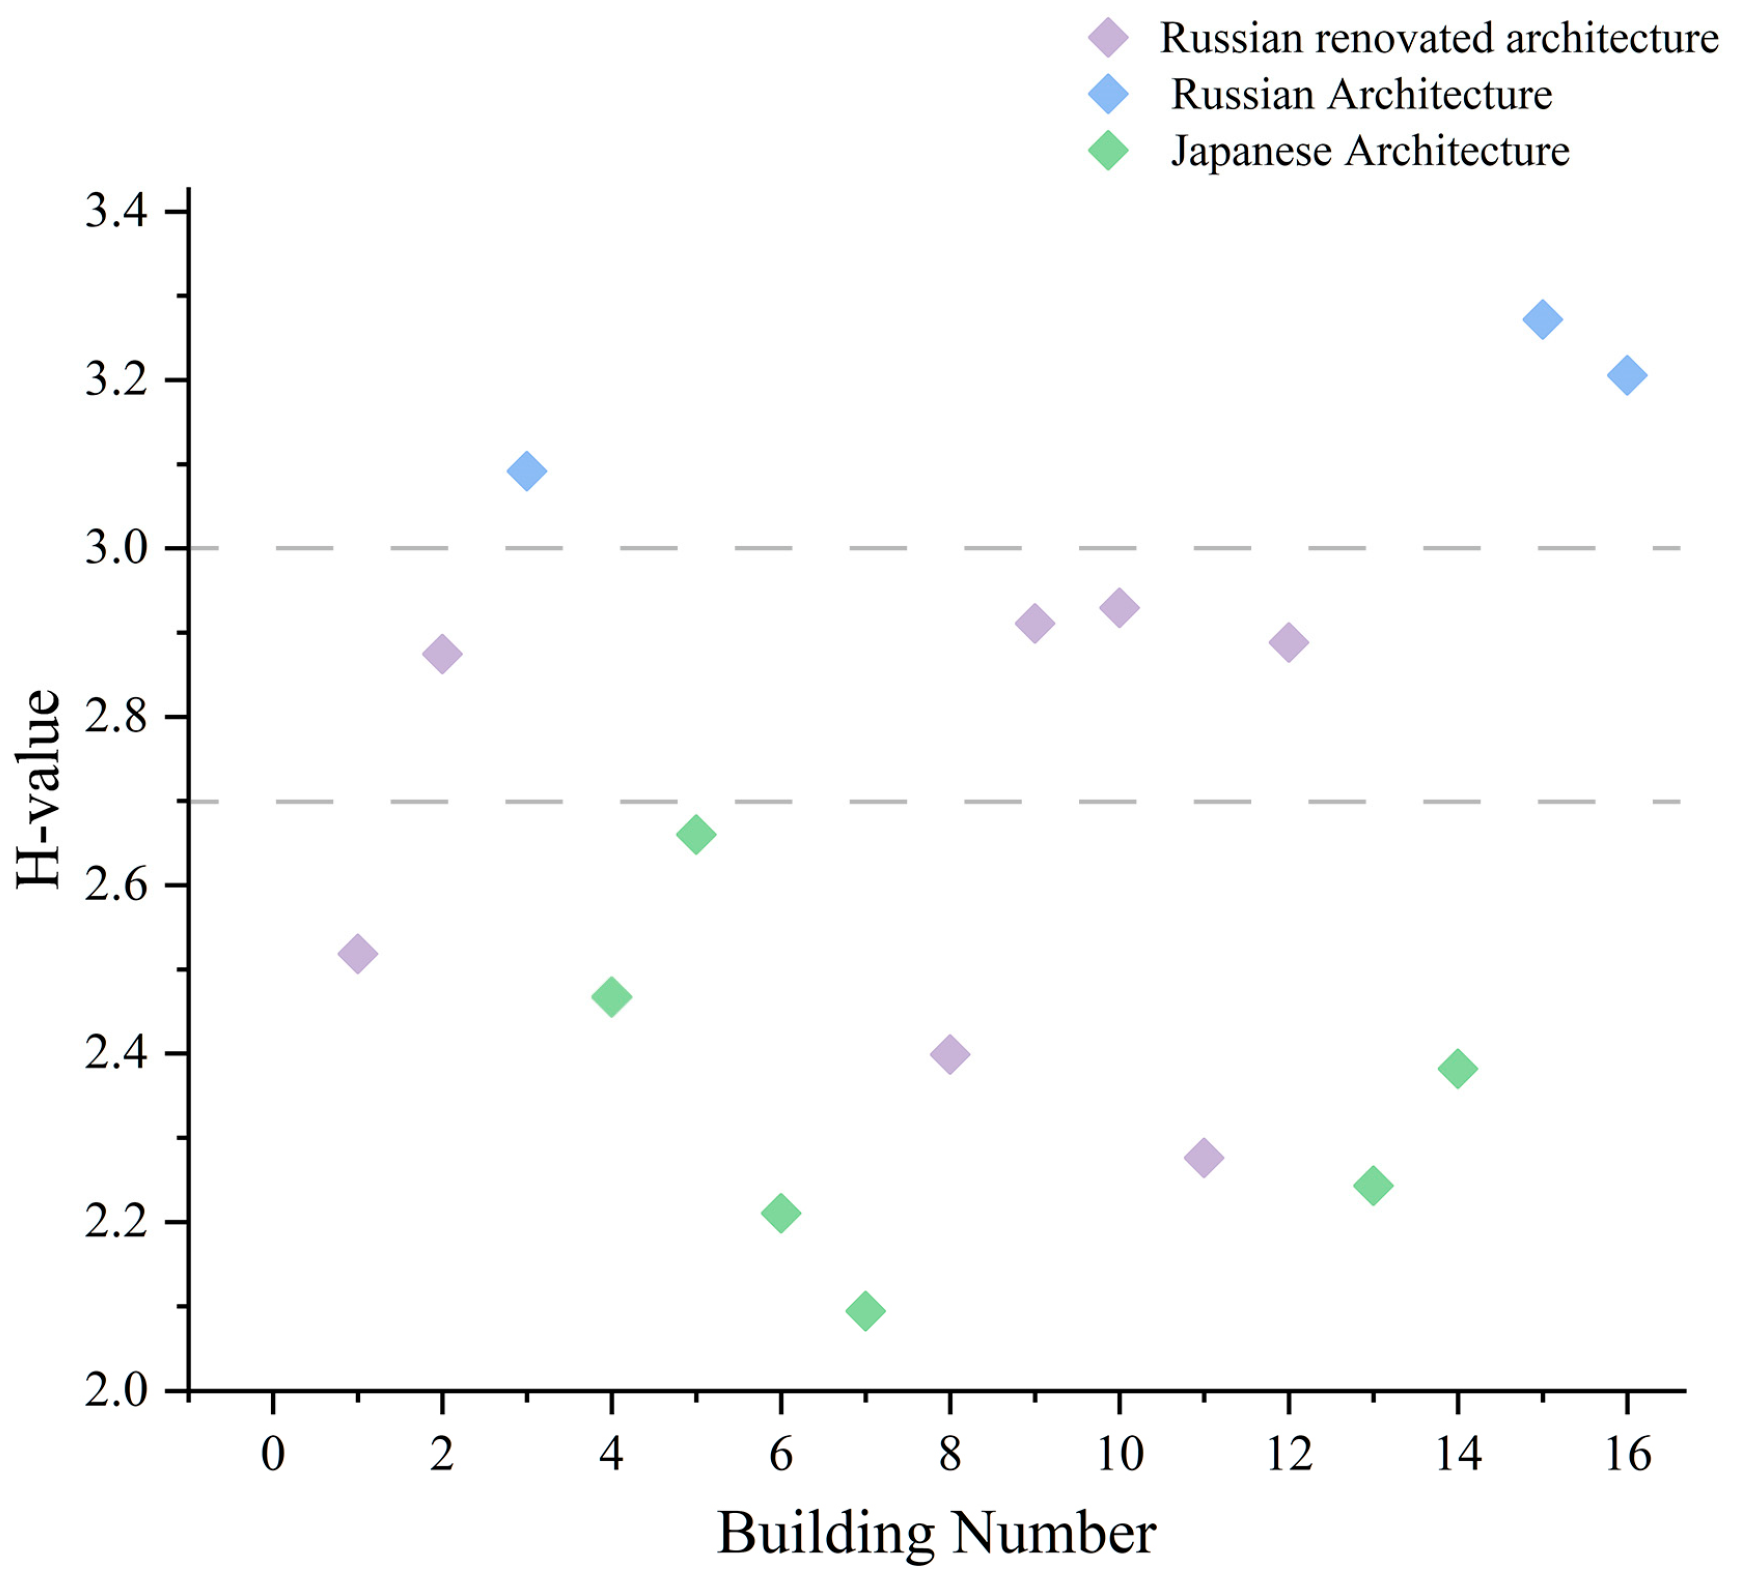
The results of entropy value calculations (see Figure 14) indicate that H > 3.0 corresponds to Russian architecture, with a total of 3 buildings, suggesting that traditional Russian brick and stone architecture places greater emphasis on decorative richness. Building No. 3 is located in the southern section of Changchun, while Nos. 15 and 16 are in the northern section, with the H values in the northern section significantly higher than those in the southern section. This methodology can be employed to analyse the originality and standardisation of the architecture. Some of the construction workers who were employed during the Russian era were Russian nationals, while others were recruited from impoverished farmers in the North China region and lacked professional training. Despite the initial northern section having been constructed using standardised methods, the masonry techniques were rudimentary. While the decorative elements were intricate, they incorporated Chinese decorative elements (e.g., Chinese-style floral patterns at the ends of eaves boards instead of Russian geometric swirl patterns). By contrast, the southern section was constructed with more comprehensive planning, incorporating clearer and more standardised site distances, functions, building forms, and layouts. The buildings demonstrate greater standardisation in construction, though the masonry techniques are more flexible, and the decorative standards are unified. The preceding description provides a comprehensive overview of the construction in North Manchuria. In contrast, in South Manchuria, buildings with H values between 2.0 and 2.7 are exclusively Japanese-style structures, indicating that the Japanese placed greater emphasis on the functionality of buildings and the simplicity of the facade. Among these five buildings, Building No. 5 has the highest H value at 2.6601. Despite its classification as a two-family bungalow, it exhibits characteristics reminiscent of Russian wall foundations, incorporates Chinese symmetrical aesthetics and modernist decorative lines, and geometrically remodels Japanese straight chimneys. This results in a design language that can be described as more chaotic and with a higher entropy value. Despite incorporating various stylistic elements, these are grounded in necessary functional requirements, and the building’s exterior remains clean and orderly. H values between 2.0 and 3.0 are indicative of Japanese-style renovations of Russian buildings, with higher H values between 2.7 and 3.0, specifically buildings numbered 2, 9, 10, and 12. This observation indicates that during the renovation process, these structures incorporated a substantial amount of Japanese elements, including stone eaves overhang and recessed window sill, with all added elements serving a functional purpose. Buildings with H values ranging from 2.2 to 2.7 are also classified as Russian-style buildings that have undergone renovation in a Japanese style. However, the Japanese modifications primarily involve the covering of decorative or exposed walls with plaster, such as the use of plaster strips to cover arch decorations, the application of cement texture to walls, or the use of sanded plaster to cover window sills.
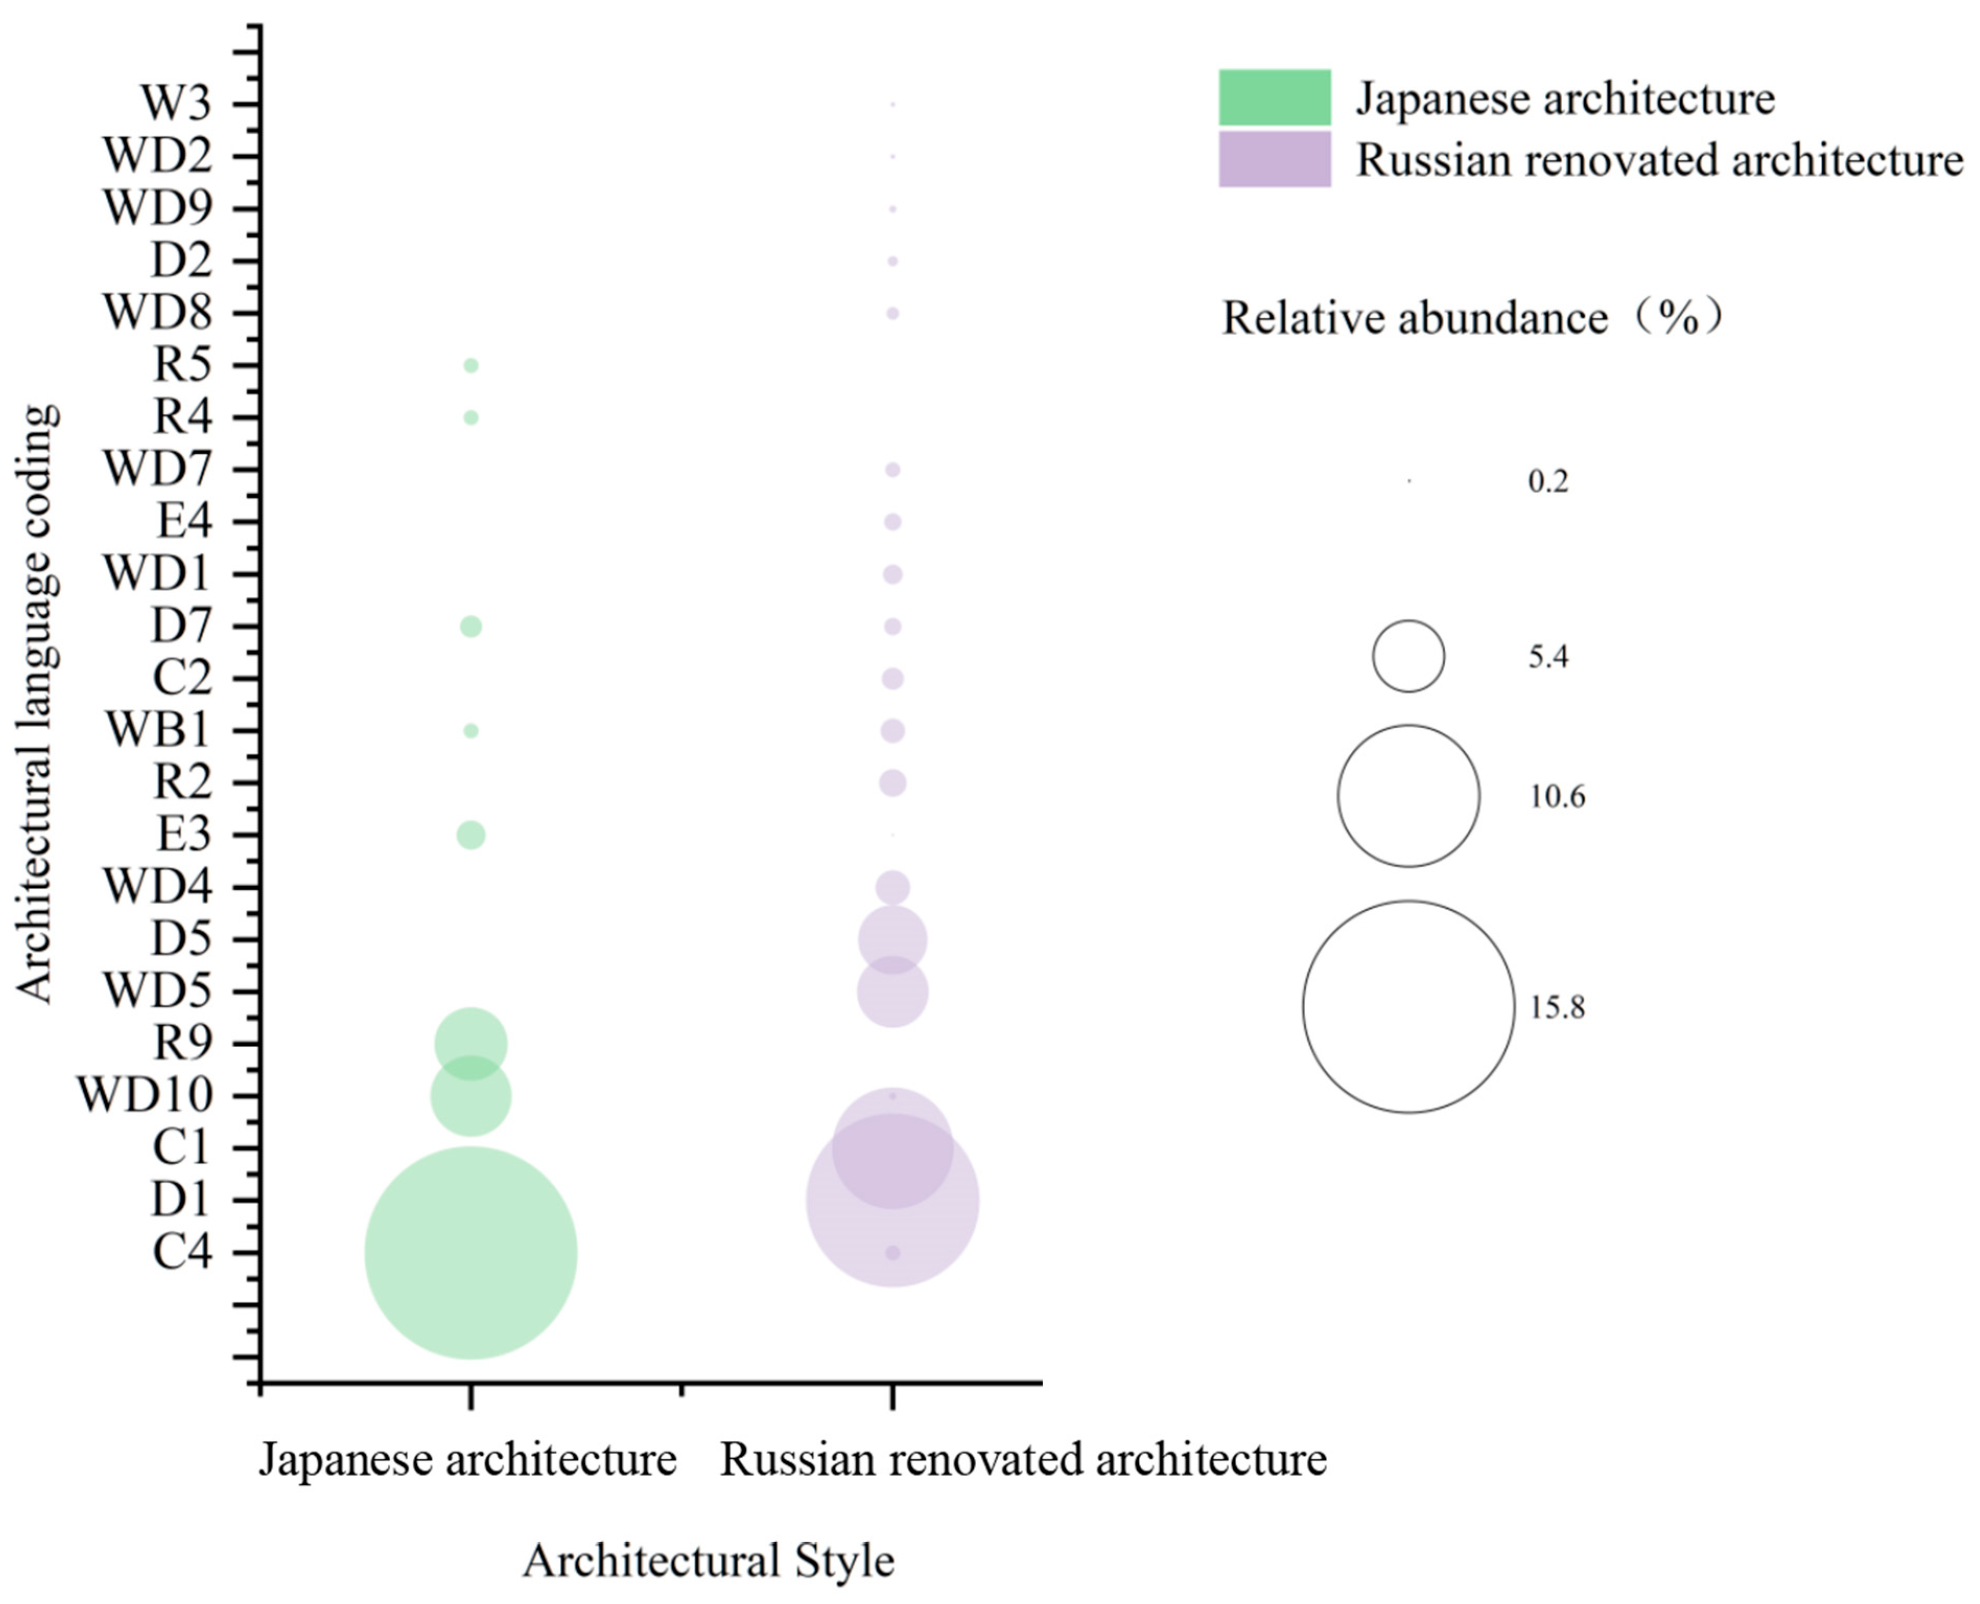
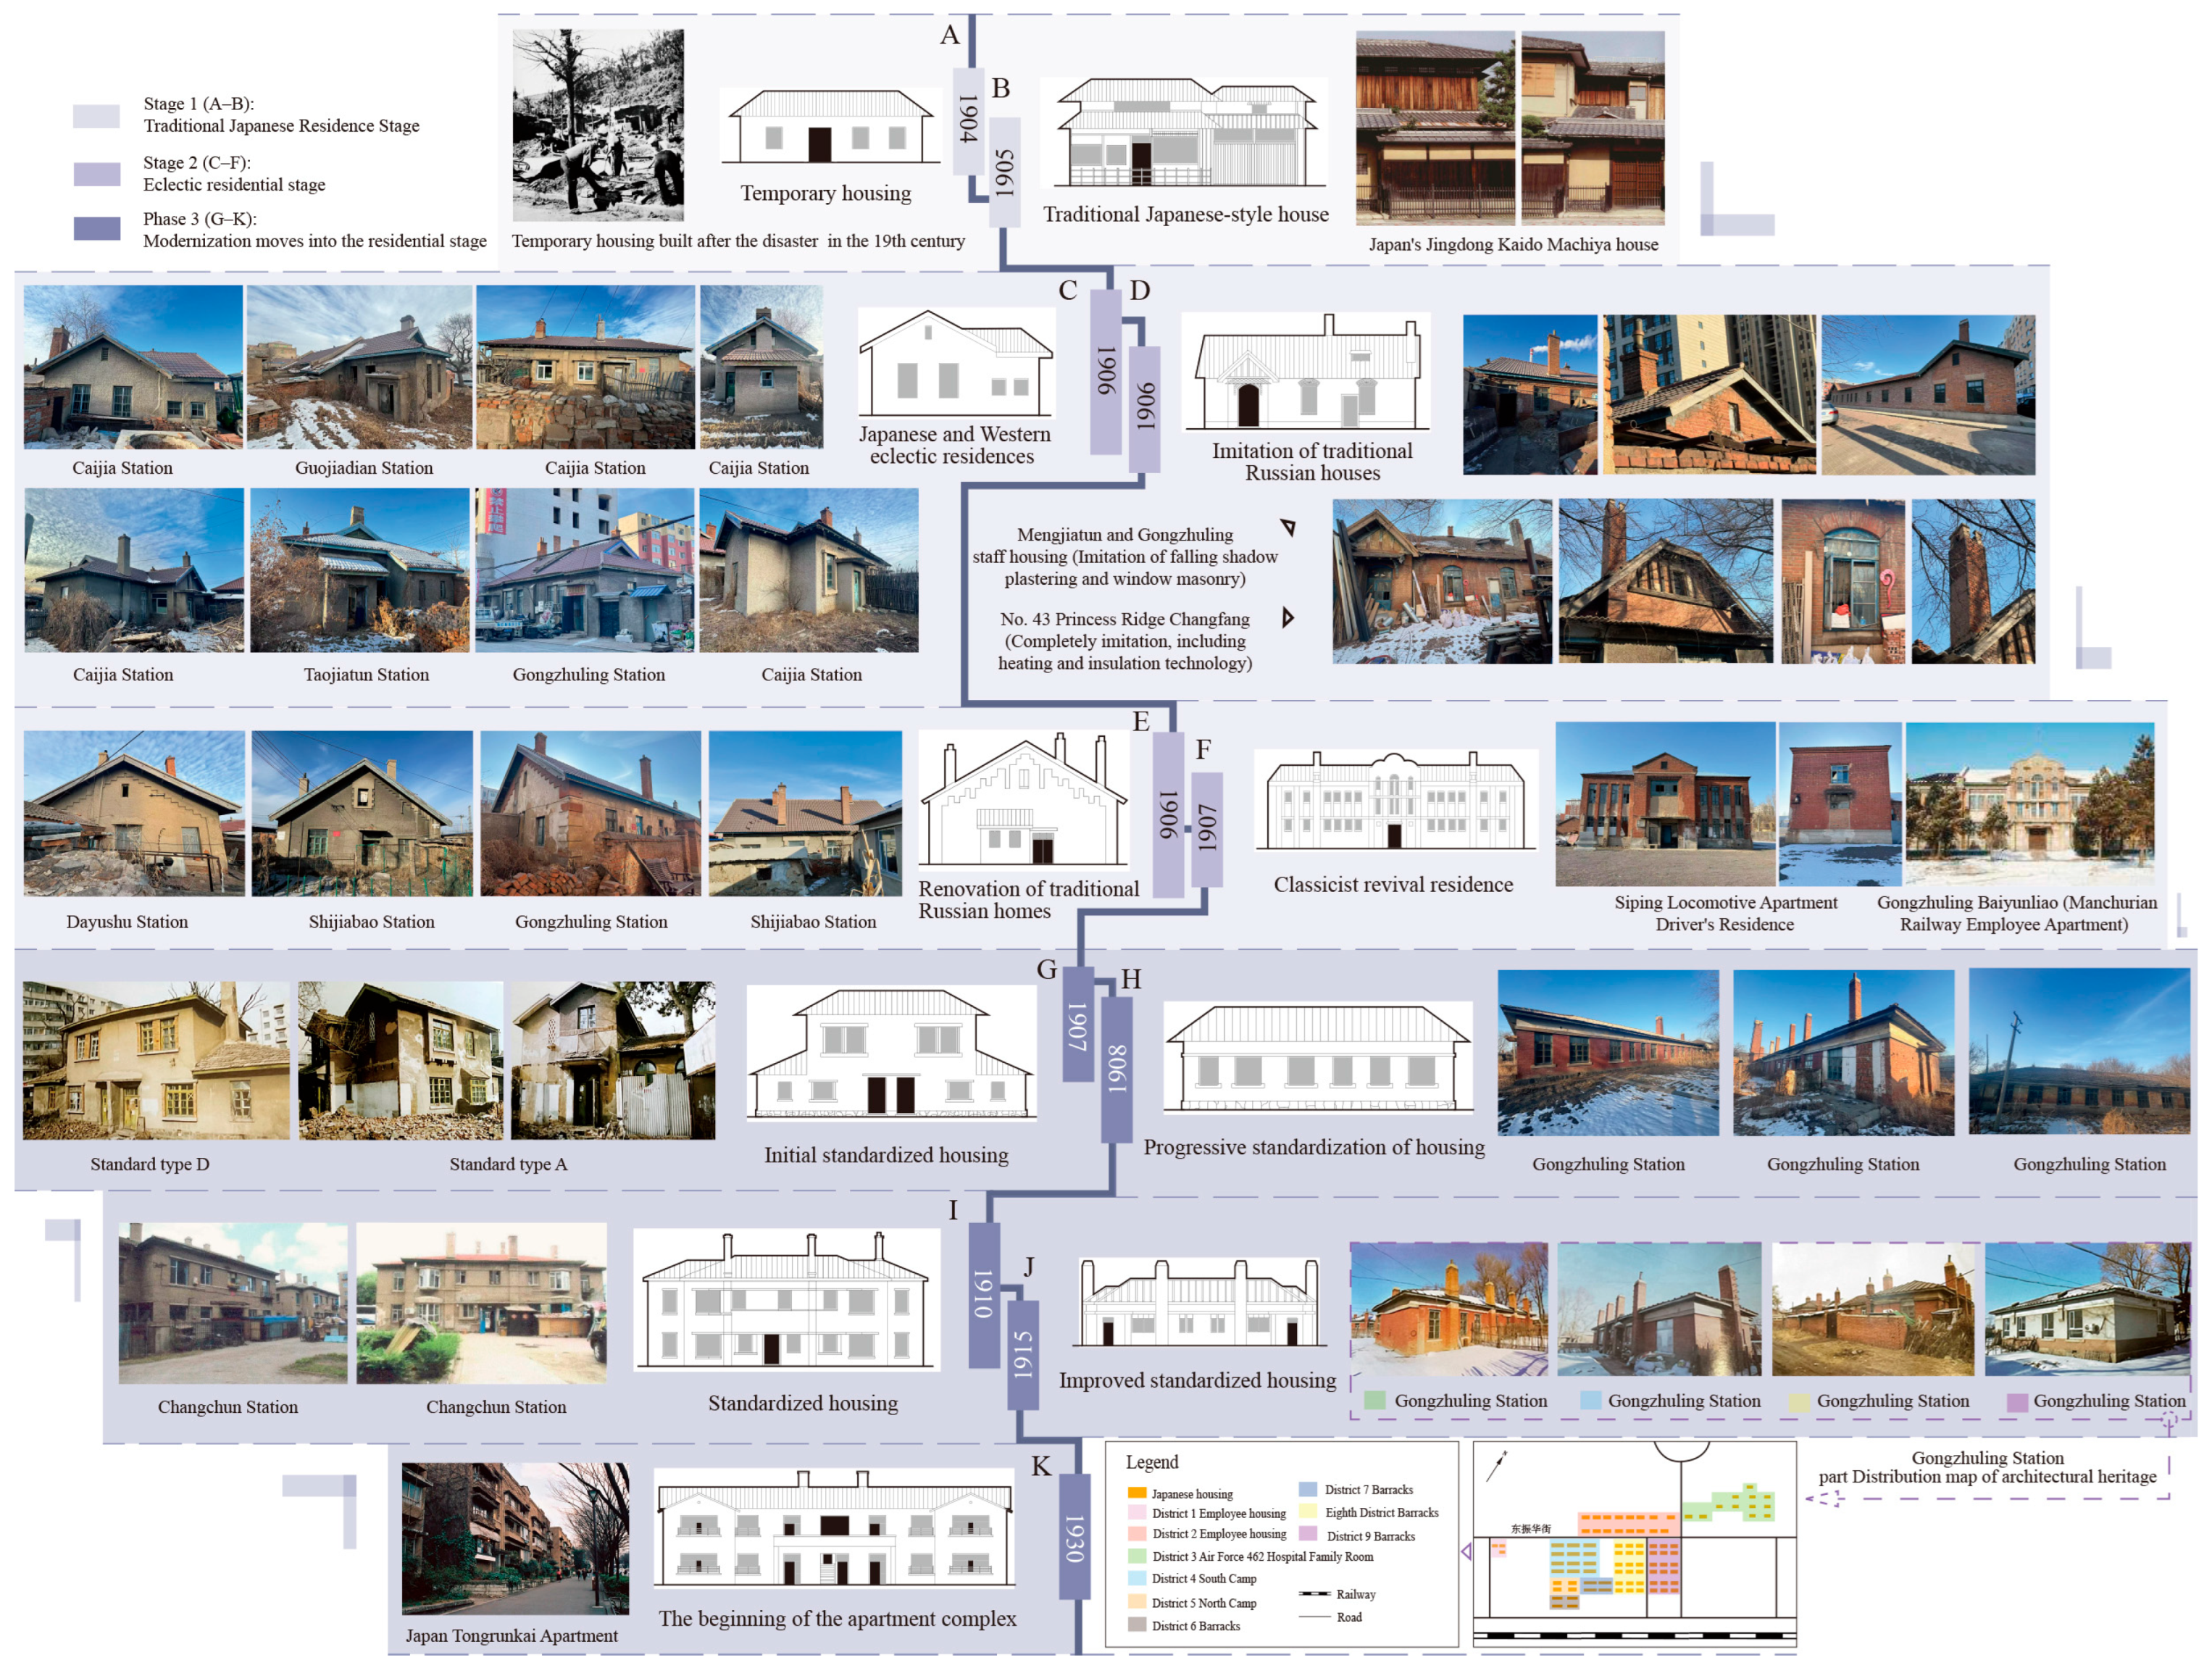
In the final stage of the study, 23 key and rare architectural elements were selected for relative richness calculations [48], yielding P-values (see Figure 15). The Bre-Curtis coefficient, a measure of similarity or dissimilarity between two groups, ranges from 0, indicating perfect similarity, to 1, denoting perfect dissimilarity [67,68]. The calculated BC value of approximately 0.92, near 1, suggests significant differences in the utilisation of architectural elements between Japanese-style and renovated Russian-style buildings. It is evident that Japanese renovations introduced a substantial number of novel and distinctive architectural elements, whilst concomitantly effecting significant modifications to the original elements. The elements employed in Japanese and Russian-style buildings differ significantly. The prevalent elements in Japanese-style buildings are C4 (15%), WD10 (6%), and E3 (2.2%), while in Japanese-modified Russian buildings, the dominant elements are D1 (12.8%), WD5 (6%), and C1 (9.0%). By calculating the samples and summarising the patterns, we use this as a reference to clarify the stylistic evolution of architectural construction activities by Japanese colonisers during the colonial period (see Figure 16), thereby identifying the reasons for the extreme disparity in the distribution of northern and southern architectural styles.

3.3. Overall Influencing Factors

3.3.1. Research Criteria

The research variables for this stage have been summarised based on literature related to value assessment [8,70]. From the standpoint of railway construction, the central part of Jilin Province is a barren plain, and the railway traverses this region, exhibiting minimal correlation with hydrology, topography, vegetation coverage, and other environmental factors. The veracity of trade and economic data, as well as population data from the period when the land was an annexed territory, is challenging to substantiate; consequently, these were excluded from the factor selection. Thereafter, we referenced the various indicators for evaluating the value of railway architectural heritage, analysed the distribution characteristics of architectural heritage, and selected four case criteria to assess heritage buildings at different levels (see Table 7).
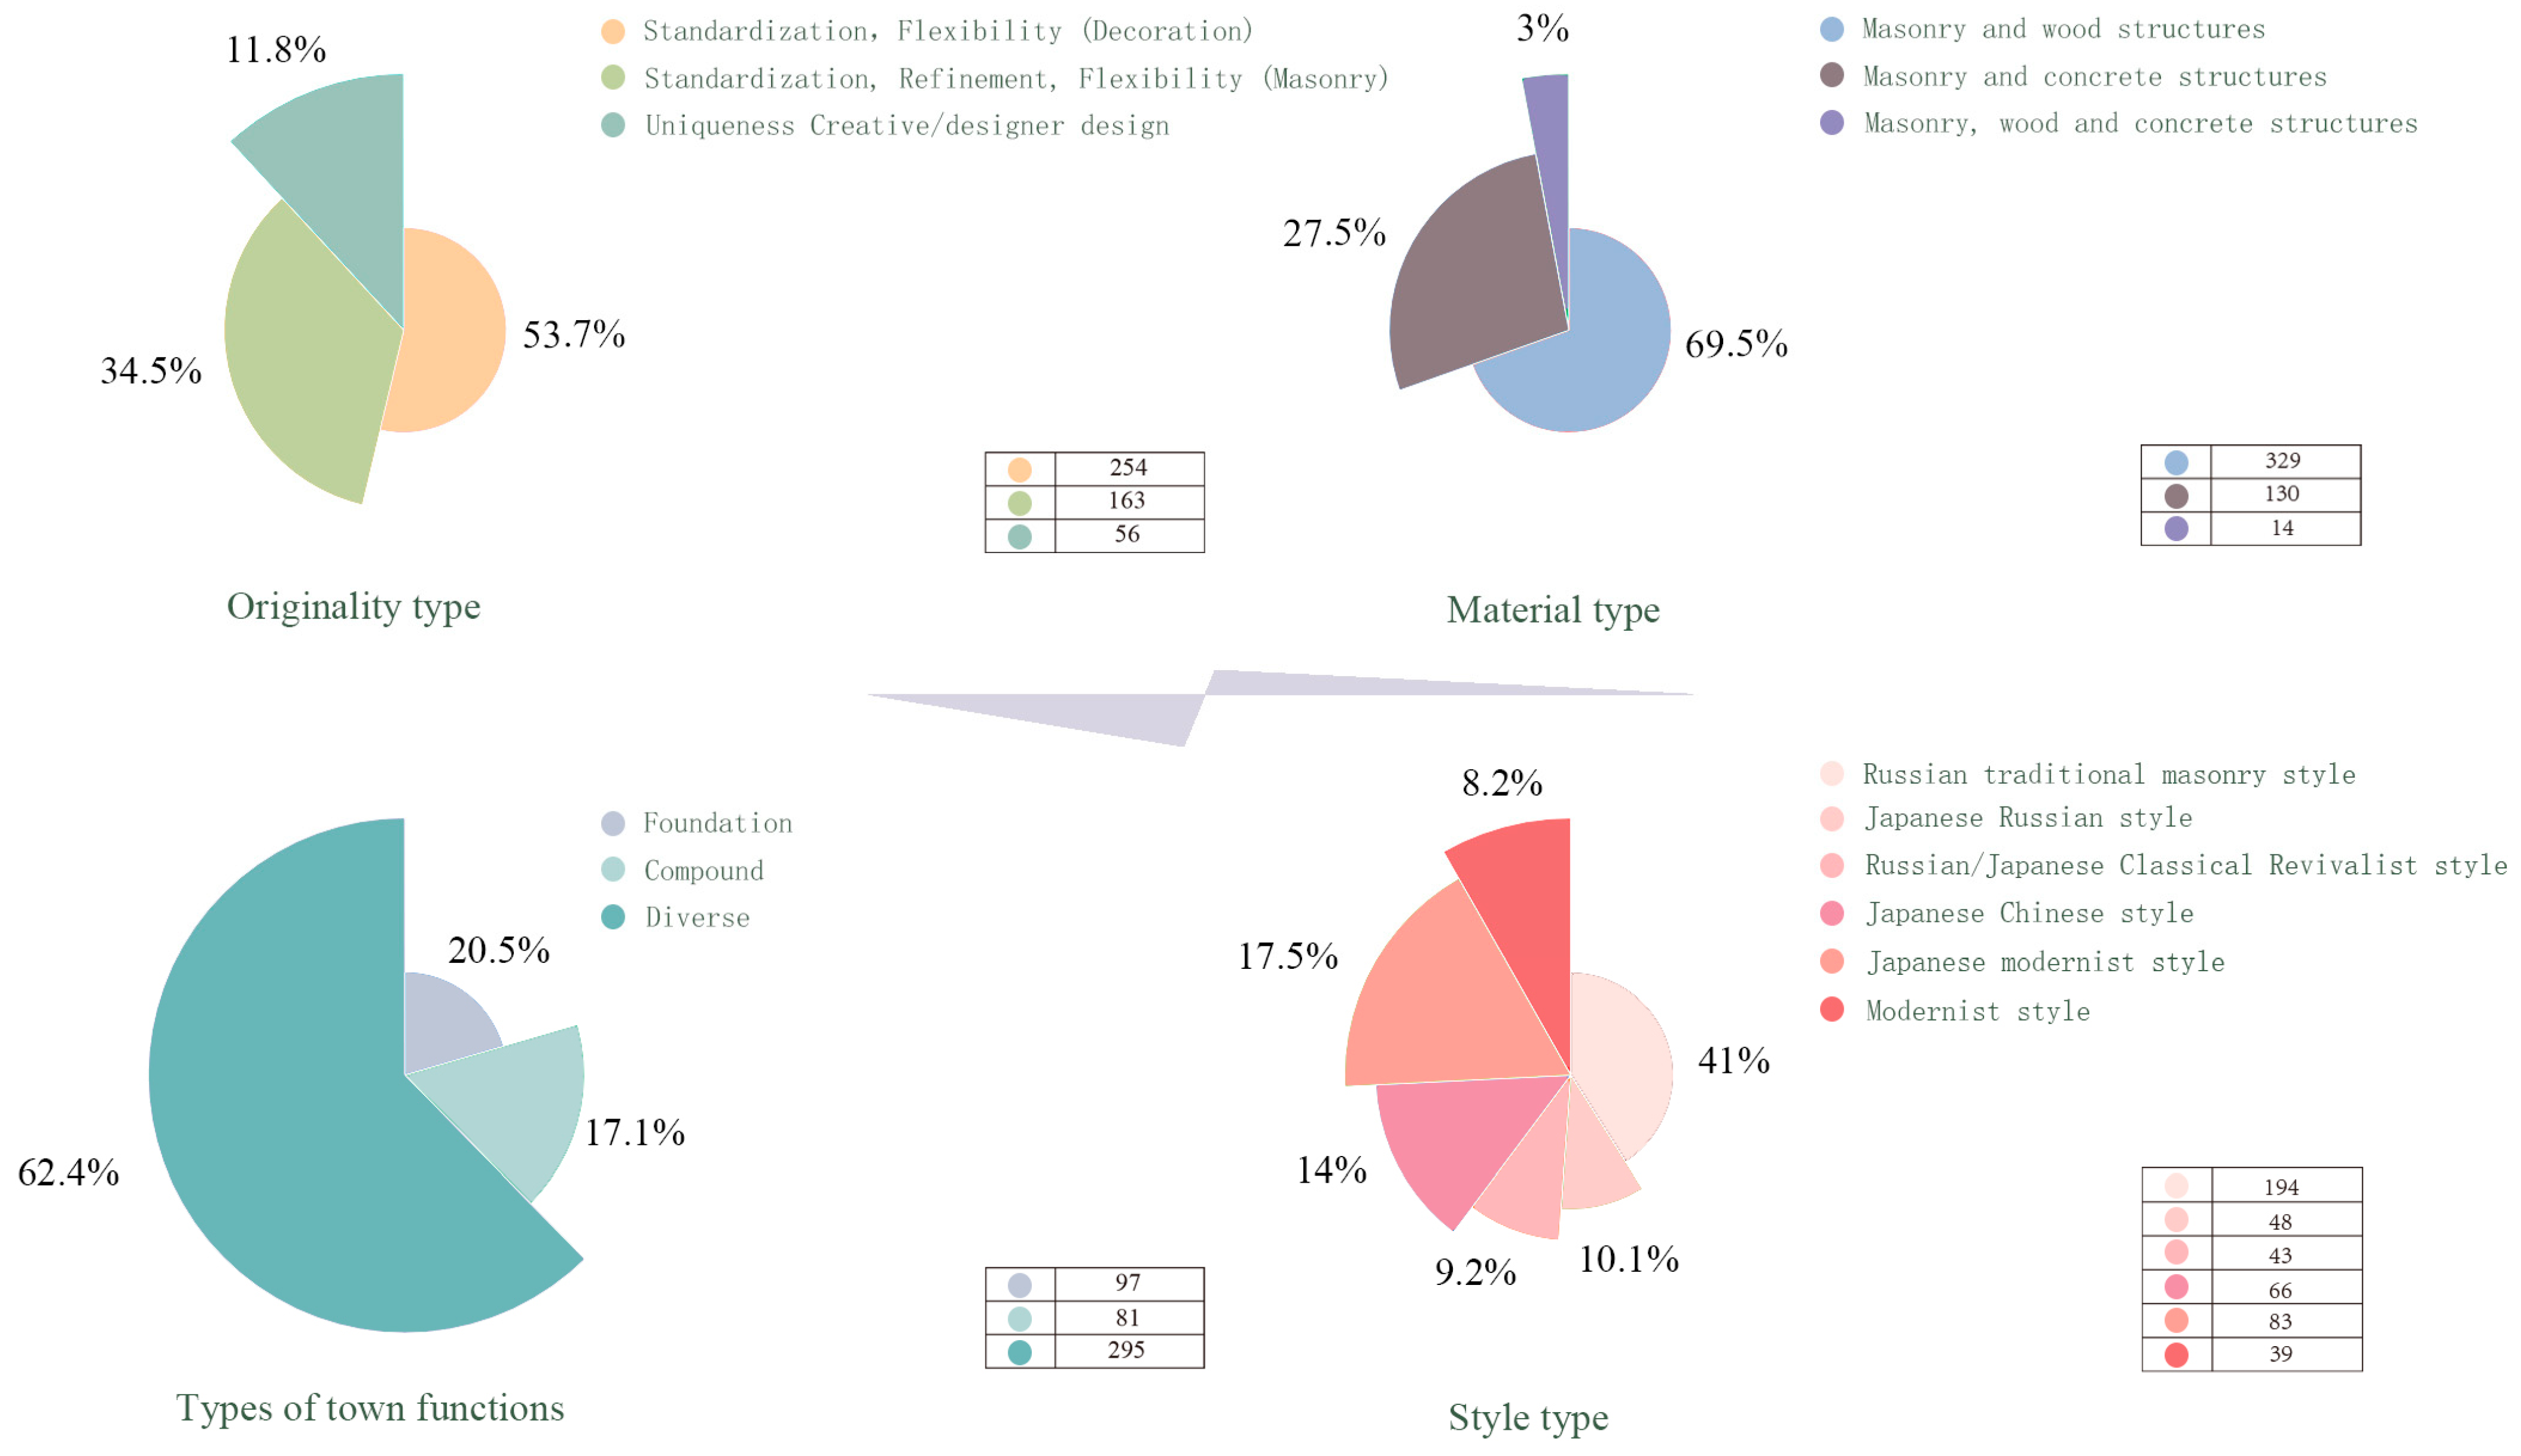
The construction of the concessionary areas was initiated by Russia and later occupied by Japan. From a phased perspective, Changchun functioned as the political centre of the Japanese-established Manchukuo. Accordingly, the variable “Japanese architecture or not” was defined as a binary dependent variable, with the identification status treated discretely (1 = Japanese, 0 = non-Japanese). Given that all 474 buildings under study were either Japanese or Russian in origin, the value of 0 simultaneously denotes Russian architecture. In this binary framework, 0 and 1 correspond to “no” and “yes”. The evaluation scores of the other variables were assigned on scales ranging from 1–3 or 1–6. The nominal variables were further summarized (see Table 8), and their relative proportions illustrated by means of a rose chart (see Figure 17).
To refine the evaluation framework, several criteria were operationalized with graded scores. For distance from the political center, buildings located within 70 km of the Changchun South Manchuria Railway Station were assigned a score of 3, those within 140 km a score of 2, and those beyond 140 km a score of 1. For distance from the Sino-Russian border, buildings within 140 km of the boundary between Jilin Province and Heilongjiang Province were scored 3, those within 280 km scored 2, and those beyond 280 km scored 1. With respect to material selection, structures composed of brick and timber were scored 1, those combining brick and concrete scored 2, while buildings integrating brick, timber, and concrete scored 3. In terms of originality, standardized constructions with only decorative flexibility were scored 1, those incorporating flexible masonry patterns and clear layouts were scored 2, and buildings exhibiting uniqueness, creativity, or architectural design were scored 3. Finally, stylistic evolution was classified across six phases: the initial stage, characterized by traditional Russian brick-and-stone buildings (score 1); the accumulation stage, marked by Japanese adaptations of Russian forms (score 2); the expansion stage, involving explorations of Russian or Japanese neoclassical revivals (score 3); the integration stage, combining Japanese and Chinese stylistic features (score 4); the transitional stage, reflecting Japanese gradual adoption of modernist tendencies (score 5); and the breakthrough stage, defined by a full embrace of modernism (score 6).

3.3.2. Binary Logistic Regression Analysis

In order to provide further validation of the rationality of the model design and the robustness of the regression results, this paper has designed multiple variable combination models based on the original scoring data for comparative analysis. The AIC was utilised as the evaluation metric for model quality [70], whilst multicollinearity diagnostics were also conducted (see Table 9). Following the exclusion of the four variables of originality level, standardisation, multiple-purpose use of a single room, and relocation to other areas, the VIF values for all remaining variables ranged between 1.259 and 3.966. These values were well below the threshold of 10, with the lowest tolerance value being 0.252 (Style Evolution), which still exceeded 0.1. This further indicates an absence of severe multicollinearity. This finding suggests that there are no significant multicollinearity issues present. In order to achieve a satisfactory balance between model fit and parsimony, the final model that demonstrated optimal fitting (see Table 10) was selected for analysis. The validation process yielded an AIC value of 112.882 and a BIC value of 150.314. The Hosmer-Lemeshow goodness-of-fit test was employed to assess model fit. In this instance, the p-value exceeds 0.05 (χ2 = 6.248, p = 0.511 > 0.05), thereby providing support for the original hypothesis. This finding suggests that the model successfully passes the HL test, thereby demonstrating adequate goodness of fit.
The p-value is a pivotal metric in determining the significance of independent variables. When p < 0.05, the independent variable is considered to exert a significant influence on the dependent variable. Consequently, the distribution pattern exerts a substantial positive influence on the classification of a building as Japanese architecture, while border, stage of development, and purpose have been identified as significant negative influences. The OR value is indicative of the multiple effect of the independent variable on the probability of the dependent variable occurring. The OR value for ‘style evolution’ is 8.468. In the transition of architecture from the nascent stage of style evolution to the transformative or breakthrough stage, under constant conditions, the probability of the architecture in question being of Japanese origin is shown to increase by 8.468 times the initial probability. This indicates the presence of a strong positive driving force. Consequently, as the style approaches the later stage, the probability of meeting the characteristics of Japanese architecture increases exponentially.
The Wald χ2 statistic, derived from the Wald test, is used to assist in determining the significance of independent variables. A larger value indicates a higher likelihood of rejecting the null hypothesis that the coefficient of the independent variable equals zero. When values are identical or close, the p-value, regression coefficient, and odds ratio (OR) are further considered to provide refined interpretation and ensure logical consistency. In instances where values are either identical or analogous, it is imperative to undertake further analysis. This should be conducted by examining the p-value, regression coefficients, and odds ratio (OR) values, in order to ensure logical consistency. Despite the fact that the value of ‘Distance to the Border Line’ (Wald χ2 = 17.63) is lower than that of ‘style evolution’, due to its ‘extremely prominent negative influence’ (OR = 0.019, with a very strong inhibitory effect), the ‘special influence direction’ should be prioritised. However, the core remains the significance supported by the Wald χ2 value, so ‘Distance to the Border Line’ is ranked first. Therefore, the ranking of these factors’ influence from highest to lowest is as follows: Distance to the Border Line, Style Evolution, distribution pattern, Period Experienced, Material Selection, Distance from political center and Functional Complexity Degree of the Town Where Located.

3.3.3. Determination of Influencing Factors

As demonstrated by the preceding data analysis, the factors influencing the spatio-temporal distribution pattern of railway architectural heritage are categorised into three distinct groups: prerequisite factors, foundational factors, and driving factors.
Firstly, prerequisite factors refer to the prior constraints imposed by the geographical location of the research object, representing relatively stable initial conditions during the formation of the research object and exerting a foundational influence on subsequent factors. In this study, the geographical factors of ‘Distance from political center’ and ‘Distance to the Border Line’ are examined. The border line is a pre-existing geographical location, predating the architectural structures under study. The study found that this factor had a significant influence on the determination of whether a structure was Japanese (p = 0.000, OR = 0.005), thereby establishing a geographical threshold for the distribution of Japanese architecture. Although the ‘Distance from political center’ showed weak statistical significance (p = 0.06), as an inherent geographical environmental factor, it provided a prior spatial context for determining architectural attributes. The ‘priority of geographical location’ is a foundational constraint for identifying Japanese architecture, defining the spatial boundaries within which subsequent factors can exert their influence.
Secondly, foundational factors encompass the basic attributes of the research object itself or its environment, providing support and limitations for the influence of other factors.’ Functional Complexity Degree of the Town Where Located’ reflects the environmental characteristics of the building’s surroundings, exerting a subtle influence on architectural development; ‘Material Selection’ (OR = 7.212, p = 0.029. The results of the study indicate a strong correlation between ‘Period Experienced’ (OR = 0.076, p = 0.000) on the intrinsic attributes of the building. These findings suggest that these factors form the foundational dimensions for identifying Japanese architecture and limit the scope of dynamic factors such as stylistic evolution.
Finally, driving factors are dynamic variables that propel the development of the research object and generate result differences, serving as the core drivers for determining Japanese architectural attributes. The analysis revealed that ‘Style Evolution’ (OR = 8.812, p = 0.000) and ‘Distribution Pattern’ (OR = 5.672, p = 0.000) emerged as the primary positive driving forces, with style advancement and spatial distribution compatibility enhancing the probability of an architectural entity being classified as ‘Japanese architecture’.
A thoroughgoing analysis reveals that three intertwining factors—indigenous culture, population migration and design ideologies—jointly shaped the evolution of architectural forms and spatial configurations at various levels. Firstly, indigenous culture, serving as a deep-rooted foundation, not only influenced regional spatial expression and aesthetic orientation but also subtly shaped geopolitical structures. Through the localised expression of architectural symbols and spatial arrangements, indigenous cultures serve to reinforce regional identity and political boundary awareness, thereby transforming built environments into material carriers of geopolitical significance. Secondly, population migration played a pivotal role in the construction of railway infrastructure and the transformation of society. The phenomenon of large-scale migration gave rise to a series of agglomeration effects in both the supply of labour and the demand for consumer goods, thereby catalysing rapid urban expansion. Concurrently, the restructuring of resource allocation and living patterns has been shown to engender economic efficiency and enhanced spatial utilisation. Within this process, population movement not only transformed economic structures but directly shaped the diversification and stratification of spatial patterns. Thirdly, design ideologies functioned as direct channels for ideological expression. The introduction of architectural styles, planning concepts, and spatial orders reflected the expression of power and social concepts of specific historical periods. The manner in which design ideologies have been employed to render architecture and space as explicit symbols of ideology has been influenced by a number of factors. These include, but are not limited to, colonial-era imported designs and localised adaptations under nationalist frameworks. In summary, it is evident that indigenous culture, population migration, and design ideologies do not exist in isolation. Instead, they intertwine and coexist within the relationship between geopolitics, economic development, and social concepts, collectively driving the formation and evolution of architectural forms and spatial configurations.

4. Discussion

Firstly, the selection of Geographic Information System (GIS) technology, logistic regression analysis, information entropy, and the Brewer-Curtis diversity index as methodologies for examining the uniqueness and diversity of railway architectural heritage in Jilin Province is entirely justified. The primary function of Geographic Information System (GIS) technology is to facilitate the intuitive depiction of the geographical distribution characteristics and clustering patterns of heritage sites. This provides the essential spatial foundation for analysing their spatio-temporal evolution. Secondly, the information entropy method is utilised to assess the diversity and complexity of railway architectural heritage in terms of style and typology. This approach reflects the structural equilibrium and evolutionary trends of the heritage system. Finally, the Brewer-Curtis diversity index, a common tool in community ecology and diversity studies, when applied to architectural heritage analysis, enables quantitative comparison of stylistic and characteristic variations across different regions or periods. This finding suggests that cultural exchange, institutional change, and design ideologies have a significant impact on heritage patterns. Furthermore, the employment of logistic regression analysis is well-suited to the examination of correlations and influence levels between heritage distribution and multidimensional drivers, thereby facilitating the effective identification of the operational mechanisms of natural environments, economic development, and social change in heritage formation. Consequently, the integrated application of these methodologies not only reveals the aggregation and differentiation of Jilin Province’s railway heritage at the spatial pattern level but also explains its diverse drivers at the mechanism level and depicts its evolutionary trajectory at the stylistic level, achieving multidimensional systematic analysis.
Secondly, in comparison with extant research on railway heritage, this study not only continues the conventional methodological approach of analysing heritage spatial patterns but also conducts an in-depth segmentation of these patterns. This encompasses architectural structures across all tiers of stations, considering factors such as station area, functionality and proximity to railway heritage. Concurrently, quantitative indicators from the fields of ecology and information theory have been introduced, enabling a more refined characterisation of the stylistic evolution and regional variations within railway heritage. For instance, while earlier studies chiefly concentrated on characterising the spatial distribution and clustering of heritage sites, this research employs multi-method cross-validation to further elucidate the underlying socio-dynamic mechanisms that shape heritage patterns. These include the geopolitical shaping role of local culture, the economic economies of scale brought about by population migration, and the ideological functions carried by design trends. The study found that the distinctiveness of Jilin Province’s railway heritage manifests not only in its typological diversity and stylistic evolution but also in its profound coupling with regional socio-economic transformations and historical contexts. Furthermore, in contrast to other research subjects, such as traditional villages, which are formed through natural environments, including hydrology and topography, along with demographic and economic factors, and employ geographically weighted regression models to explain the spatio-temporal evolution, this approach does not fully integrate the resulting spontaneous local heritage culture into its explanatory framework. Instead, it remains largely confined to a macro level. Central Jilin Province is a plain region where railway heritage constitutes a colonial legacy rather than a spontaneous indigenous cultural manifestation. The interpretative framework utilised in this study encompasses a multidimensional approach, extending beyond the conventional macro-level analysis of corridor patterns to encompass meso-level functional transformations of station areas over time, as well as micro-level alterations in architectural character. This analytical framework serves to expand the theoretical framework of railway heritage research, whilst concurrently providing a novel analytical paradigm for heritage conservation and adaptive reuse in comparable regions.
It is imperative to acknowledge that GIS technology is contingent on the accuracy and completeness of data. However, historical heritage data frequently exhibits deficiencies or inconsistencies, which can result in biased spatial analysis outcomes. Secondly, although logistic regression analysis can reveal relationships between multiple drivers and heritage distribution, its linear assumptions and variable selection may oversimplify complex socio-historical processes, making it difficult to fully capture non-linear or latent interactive effects. Thirdly, while information entropy is a measure of diversity, it offers limited reflection of qualitative dimensions such as heritage value hierarchies and cultural significance, exhibiting a certain tendency towards abstraction. Finally, while the Brewer-Curtis diversity index is well-suited for measuring interregional variation, it should be noted that its outcomes are highly sensitive to sample segmentation and classification criteria. It is therefore possible for differing approaches to yield divergent conclusions. In general, the aforementioned methods provide quantitative analytical advantages. However, to achieve a more comprehensive understanding of the historical context and social significance of railway heritage, qualitative research and interdisciplinary approaches must be employed. This integration is imperative for delivering a more profound and comprehensive interpretation of the mechanisms underpinning heritage evolution.

5. Conclusions

The present paper corroborates the hypothesis that railway architectural heritage in Jilin Province is highly consistent in terms of spatiotemporal organisation, typological structure, and driving mechanisms. This conclusion is based on comprehensive evidence from GIS technology, information entropy, the Bray–Curtis difference index, and logistic regression methods. The geographical framework under scrutiny is characterised by a hierarchical ‘corridor–node–hinterland’ network model, which is overlaid with a regional gradient: ‘Northern Manchuria–border area (Changchun)–Southern Manchuria’. Across distinct historical phases, an evolutionary sequence can be seen: ‘point distribution–axial linkage–core response’. The following conclusions and forward-looking assessments can be summarised, drawing upon the extensive spatial and typological details revealed in this research:
1.
The spatial configuration of railway stations in Jilin Province has undergone an evolution from an aggregation to a dispersion pattern. The proximity index and kernel density analyses reveal a ‘multi-nuclear concentration’ in the first phase, ‘serial connection’ along trunk lines in the second phase, and a ‘multi-centre + multi-belt’ network in the third phase. The architectural conception of the period was characterised by the establishment of a hierarchical system, with functional buildings assuming a central role. This system was predicated on the presence of military and industrial facilities, with residential and ancillary structures serving as transitional elements.
2.
The spatial axes of Jilin’s railway heritage exhibit dynamic migration. Standard deviation ellipses and centre-of-gravity analysis reveal a sequential shift in station centres from the south-central region towards the northeast and southwest, consistently unfolding along the northeast–southwest axis. Changes in ellipse area and rotation angle are indicative of the functional transition of the railway network from concentrated supply to expansive coverage.
3.
The spatial clustering patterns evidence disparities at a regional level in Jilin’s railway heritage. Spatial autocorrelation and clustering analyses reveal significant clustering. However, lower-tier stations in Northern Manchuria underwent a gradual densification process, while Changchun Station primarily fulfilled transitional functions through clustered arrangements. The region of Southern Manchuria underwent a transition from dispersed settlements to a more concentrated form of organisation.
4.
The typological styles of Jilin’s railway architecture manifest north–south differentiation. Information entropy and relative richness indices reveal that Russian-era structures in Northern Manchuria possess high entropy values and ornate decoration, while Southern Manchurian stations demonstrate strong standardisation alongside diverse craftsmanship. Renovations of Japanese origin have been observed to enhance stylistic integration, in contrast to modernist new stations which exhibit lower entropy values, indicative of functional minimalism.
5.
The probability of preserving Jilin’s railway heritage is influenced by typological and institutional factors. Logistic regression indicates that the historical period and the repurposing status are key variables. The stylistic evolution and morphological complexity of the artefacts are significant factors in determining their preservation likelihood. Stations in proximity to the former Japanese puppet state border are imbued with an implicit institutional weight and thus merit priority conservation.
6.
The comprehensive driving mechanism of Jilin’s railway heritage exhibits multi-layered characteristics. The foundational distribution pattern is established by local culture and geopolitics; population migration and economic efficiency drive hinterland expansion; military expansion and trade interactions shape strategic nodes; and design trends and ideologies manifest spatially through stylistic evolution. Collectively, these factors establish a distribution mechanism that is both diverse and complex.
While acknowledging the limitations of current methodologies, future research may be expanded in the following areas. Firstly, the integrity and accuracy of railway heritage information should be enhanced through multi-source data integration (such as historical archives, remote sensing imagery, socio-statistical data, and oral histories). This will improve the reliability of spatial analysis outcomes. Secondly, the introduction of more sophisticated spatial econometric models and machine learning approaches may be considered to overcome the linear assumptions of logistic regression, thereby revealing the underlying non-linear mechanisms and multi-factor interactions governing heritage distribution. Thirdly, in analysing heritage styles and cultural values, deep learning image recognition and natural language processing techniques could be combined to automate the extraction and quantitative description of architectural style characteristics and historical contexts. This would overcome the abstract limitations of traditional information entropy and difference index methods. Ultimately, it is imperative that future research places greater emphasis on interdisciplinary and comparative studies. This would not only serve to deepen theoretical frameworks at the intersection of architecture and geography, but also to explore commonalities and differences in heritage evolution across distinct historical contexts through comparisons with railway heritage in other regions. The application of these extensions will facilitate research on the railway architectural heritage of Jilin Province, thereby enabling the revelation of its spatio-temporal evolution patterns and socio-cultural significance on both a broad scale and in depth. This, in turn, will provide a more comprehensive scientific basis for the conservation and utilisation of heritage. In the context of conservation management measures, future approaches to railway heritage should consider the implementation of zoned and tiered protection, with these measures being based on distribution patterns. Building upon extant research, typical case studies should be introduced to explore differentiated conservation strategies, enhancing efficiency in identification, oversight, and intervention. It is imperative that a sophisticated, tiered and categorised protection mechanism is implemented to ensure the effective management of heritage. This mechanism should involve the classification of heritage into three distinct zones: core, axis, and peripheral zones. This approach will facilitate a layered intervention strategy, ensuring the comprehensive and coordinated management of heritage assets. The integration of ‘transport + culture + community’ should be encouraged in order to stimulate the potential for living heritage transmission. Concurrently, emphasis should be placed on local cultural expression and regional identity reconstruction, propelling railway heritage from static preservation towards cultural revitalisation to achieve sustainable reproduction of historical spaces.

Author Contributions

Conceptualization: Z.W.; investigation: R.H. and Z.W.; methodology: Z.W.; writing—original draft: R.H. and Z.W.; review and editing: R.H. All authors have read and agreed to the published version of the manuscript.

Funding

This research was funded by the Key Science and Technology Project of Jilin Provincial Department of Education (JJKH20240370KJ).

Institutional Review Board Statement

Not applicable for studies not involving humans or animals.

Informed Consent Statement

Informed consent was obtained from all subjects.

Data Availability Statement

Data are contained within the article.

Acknowledgments

We would like to thank the anonymous reviewers for their constructive and supportive feedback.

Conflicts of Interest

The authors declare no conflict of interest.

Abbreviations

KDEKernel Density Estimation
SDEStandard Deviational Ellipse
SACSpatial Autocorrelation
MCMean Center
HInformation Entropy
BCBray–Curtis Dissimilarity

References

  1. Liu, D.; Xia, S. Cultural Heritage of China Eastern Railway Architecture; Harbin Institute of Technology Press: Harbin, China, 2020. [Google Scholar]
  2. Cheng, W. Modern Railway-Affiliated Properties; Shanghai Academy of Social Sciences Press: Shanghai, China, 2008. [Google Scholar]
  3. Li, B. Urban planning process and characteristics of properties affiliated to the Chinese Eastern Railway. Tongji Univ. J. Soc. Sci. Ed. 1997, 1, 91–96. [Google Scholar]
  4. Gao, F. Research on Value Evaluation of China Eastern Railway Industrial Heritage from the Perspective of Heritage Corridor Theory. Master’s Thesis, Harbin Institute of Technology, Harbin, China, 2018. [Google Scholar]
  5. Douet, J. Industrial Heritage Re-Tooled: The TICCIH Guide to Industrial Heritage Conservation; Routledge: Oxfordshire, UK, 2016. [Google Scholar]
  6. Orbaşli, A.; Woodward, S. A railway ‘route’ as a linear heritage attraction: The Hijaz Railway in the Kingdom of Saudi Arabia. J. Herit. Tour. 2008, 3, 159–175. [Google Scholar] [CrossRef]
  7. Ding, X.; Cui, Y.; Chen, Z.; Zhang, H. Energy efficiency in biophilic architecture: A systematic literature review and visual analysis using CiteSpace and VOSviewer. Buildings 2024, 14, 3800. [Google Scholar] [CrossRef]
  8. Qiao, W.; Pang, S.; Guo, M. Cultural Heritage Evaluation Based on Analytic Hierarchy Process and Fuzzy Control: Case Study of the South Manchuria Railway in China. Buildings 2025, 15, 102. [Google Scholar] [CrossRef]
  9. Chen, Y.; Dong, Q.; Zhang, L.; Shao, L.; Tang, Y. Using natural language processing to identify and evaluate heritage value for buffer zone delineation in Hengdaohezi Town. Npj Herit. Sci. 2025, 13, 262. [Google Scholar] [CrossRef]
  10. Martínez-Corral, A.; Cárcel-Carrasco, J.; Fonseca, F.C.; Kannampallil, F.F. Urban–spatial analysis of European historical railway stations: Qualitative assessment of significant cases. Buildings 2023, 13, 226. [Google Scholar] [CrossRef]
  11. Merciu, F.C.; Păunescu, C.; Dorobanţu, M.; Merciu, G.-L. Assessing the value of railway heritage for sustainable development: The case study of the Oraviţa–Anina Railway, Romania. Sustainability 2022, 14, 13262. [Google Scholar] [CrossRef]
  12. Socal, A.J.S.; Ribeiro, M. Preserving railway heritage through revitalisation for tourism use: A study of the railway stations of Canela and Passo Fundo, Brazil. Pasos Rev. Tur. Patrim. Cult. 2023, 21, 289–305. [Google Scholar]
  13. Mahdadi, N. The Railway Network of Sétif, Algeria: Industrial Heritage in Search of Recognition. Ind. Archaeol. Rev. 2025, 47, 15–31. [Google Scholar] [CrossRef]
  14. Carvalho, C.; Sousa, A.; Silva, A.; Mendes, M.P. User Perceptions and Conservation Practices: A Case Study of Maintenance Strategies at S. Bento Railway Station. Buildings 2024, 14, 3855. [Google Scholar] [CrossRef]
  15. Sang, K.; Lin, G. A system for measuring the satisfaction of railway heritage tourism: The case of Yunnan–Vietnam Railway. Environ. Res. Infrastruct. Sustain. 2021, 1, 015001. [Google Scholar] [CrossRef]
  16. Senes, G.; Ferrario, P.S.; Riva, F.; Fumagalli, N.; Corsini, D.; Donati, A.; Contestabile, L.; Fondi, S.; Rovelli, R. Active Tourism and Intermodality: Railway Stations as Soft Mobility Hubs—An Assessment Framework for Italy. Land 2025, 14, 380. [Google Scholar] [CrossRef]
  17. Boente, C.; Romero-Macías, E.; Delgado-Domínguez, A.; Sierra, C. Unveiling the Legacy of the Nineteenth Century Riotinto Mining Railway: From Historic Heritage to Thriving Tourist Attraction. Geoheritage 2024, 16, 33. [Google Scholar] [CrossRef]
  18. Lin, Z.; Li, B. Circuit theory-based cultural heritage corridor network development in Qin River Basin. Npj Herit. Sci. 2025, 13, 385. [Google Scholar] [CrossRef]
  19. Guan, J.; Hu, J.; Li, B. How to restore ecological impacts from wind energy? An assessment of Zhongying Wind Farm through MSPA-MCR model and circuit theory. Ecol. Indic. 2024, 163, 112149. [Google Scholar] [CrossRef]
  20. Yao, L.; Gao, C.; Zhuang, Y.; Yang, H.; Wang, X. Exploring the spatiotemporal dynamics and simulating heritage corridors for sustainable development of industrial heritage in Foshan City, China. Sustainability 2024, 16, 5605. [Google Scholar] [CrossRef]
  21. Zhang, S.; Liu, J.; Pei, T.; Chan, C.-S.; Wang, M.; Meng, B. Tourism value assessment of linear cultural heritage: The case of the Beijing–Hangzhou Grand Canal in China. Curr. Issues Tour. 2023, 26, 47–69. [Google Scholar] [CrossRef]
  22. Rivera-Pabón, T. Railway Networks and Industrial Heritage in the Urban-Territorial Configuration of Pereira: Intermediate City of the Coffee Cultural Landscape. Territorios 2021, 44, 239–269. [Google Scholar] [CrossRef]
  23. Liu, F.; Lu, Z.; Wang, Y. Research on the Spatiotemporal Distribution of Railway Architectural Heritages Based on Heritage Database—Taking the Jinqin Section of the Peking–Mukden Railway as an Example. Sustainability 2024, 16, 2466. [Google Scholar] [CrossRef]
  24. Liu, W. Research on the Architectural Culture of Modern Changchun City Railways. Master’s Thesis, Jilin University, Changchun, China, 2012. [Google Scholar]
  25. Liu, J. Research on the Historical Development of Modern Changchun City. Master’s Thesis, Tsinghua University, Beijing, China, 2006. [Google Scholar]
  26. Chen, Y. Analysis of the Phenomenon of Cultural Integration in the Architecture of the Chinese Eastern Railway. Master’s Thesis, Harbin Institute of Technology, Harbin, China, 2018. [Google Scholar]
  27. Si, D. Research on the Technical Characteristics and Development Evolution of Modern Architecture of the Chinese Eastern Railway. Ph.D. Thesis, Harbin Institute of Technology, Harbin, China, 2020. [Google Scholar]
  28. Wang, R. Study on the Morphological Characteristics of Stone Structures in the Architecture of the Chinese Eastern Railway. Master’s Thesis, Harbin Institute of Technology, Harbin, China, 2013. [Google Scholar]
  29. Zhang, S.; Liu, D. The History and Information Decoding of Bricks Used in Modern Architecture of Northeast China. Archit. J. 2019, 2, 112–119. [Google Scholar]
  30. Shen, H. Study on the Spatial Morphological Types of Towns Along the Chinese Eastern Railway Trunk Line. Master’s Thesis, Harbin Institute of Technology, Harbin, China, 2014. [Google Scholar]
  31. Lei, J. A Study on the Historic Buildings in the Concessions of the South Manchuria Railway. Ph.D. Thesis, Harbin Institute of Technology, Harbin, China, 2012. [Google Scholar]
  32. Liu, F.; Lu, Z.; Qiang, W. An innovative approach to post-occupancy evaluation of architectural heritages in the Peking-Mukden railway. Herit. Sci. 2024, 12, 383. [Google Scholar] [CrossRef]
  33. Salehipour, M.; Kazemi, N.; Jokar Arsanjani, J.; Firozjaei, M.K. Developing a Multi-Criteria Decision Model to Unlock Sustainable Heritage Tourism Potential. Sustainability 2025, 17, 3703. [Google Scholar] [CrossRef]
  34. Rebec, K.M.; Deanovič, B.; Oostwegel, L. Old buildings need new ideas: Holistic integration of conservation-restoration process data using Heritage Building Information Modelling. J. Cult. Herit. 2022, 55, 30–42. [Google Scholar] [CrossRef]
  35. Merciu, F.C.; Păunescu, C.; Merciu, G.L.; Cioacă, A.E. Using 3D Modeling to Promote Railway Heritage. The Railway Station of Curtea De Argeş Municipality as Case Study. J. Appl. Eng. Sci. 2021, 11, 121–126. [Google Scholar] [CrossRef]
  36. Chi, L.; Zhong, L.; Zhang, S.; Zhang, T. Spatial-temporal pattern of cultural heritage along the Sichuan Tibet railway and influencing factors. Npj Herit. Sci. 2025, 13, 301. [Google Scholar] [CrossRef]
  37. Gao, Y.; Tan, G.; Zhu, J.; Chen, Z. Spatial distribution and determinants of Third Front built heritage: Insights from West Hubei Province, China. Npj Herit. Sci. 2025, 13, 304. [Google Scholar] [CrossRef]
  38. Li, D.; Tang, J.; Hu, Q.; Dong, M.; Chithpanya, S. Spatiotemporal Urban Evolution Along the China–Laos Railway in Laos Determined Using Multiple Sources of Remote-Sensed Landscape Indicators and Interpretable Machine Learning. Land 2024, 13, 2094. [Google Scholar] [CrossRef]
  39. Bao, W.; Liu, Y. Spatial Characteristics and Influencing Factors of Traditional Villages Distribution in the Yellow River Basin. Sustainability 2025, 17, 4834. [Google Scholar] [CrossRef]
  40. Chen, Y.; Li, R. Spatial distribution and type division of traditional villages in Zhejiang Province. Sustainability 2024, 16, 5262. [Google Scholar] [CrossRef]
  41. Liu, X.; Yuan, L.; Tan, G. Identification and Hierarchy of Traditional Village Characteristics Based on Concentrated Contiguous Development—Taking 206 Traditional Villages in Hubei Province as an Example. Land 2023, 12, 471. [Google Scholar] [CrossRef]
  42. Wang, X.; Zhang, J.; Cenci, J.; Becue, V. Spatial distribution characteristics and influencing factors of the world architectural heritage. Heritage 2021, 4, 2942–2959. [Google Scholar] [CrossRef]
  43. Nie, X.; Xie, Y.; Xie, X.; Zheng, L. The characteristics and influencing factors of the spatial distribution of intangible cultural heritage in the Yellow River Basin of China. Herit. Sci. 2022, 10, 121. [Google Scholar] [CrossRef]
  44. Liao, Y.; Cenci, J.; Zhang, J. Chinese modern architectural Heritage resources: Perspectives of spatial distribution and influencing factors. ISPRS Int. J. Geo-Inf. 2023, 12, 358. [Google Scholar] [CrossRef]
  45. Fu, J.; Mao, H. Study on the spatiotemporal distribution patterns and influencing factors of cultural heritage: A case study of Fujian Province. Herit. Sci. 2024, 12, 324. [Google Scholar] [CrossRef]
  46. Liu, R.; Meng, D.; Wang, M.; Gong, H.; Li, X. Analysis of Spatiotemporal Dynamics and Driving Mechanisms of Cultural Heritage Distribution Along the Jiangnan Canal, China. Sustainability 2025, 17, 5026. [Google Scholar] [CrossRef]
  47. Tang, H.; Li, W.; Yan, X. Spatiotemporal Evolution Characteristics and Influencing Factors of Cross-Regional Tourism Corridors: A Tourism Geography Perspective. Sustainability 2025, 17, 1126. [Google Scholar] [CrossRef]
  48. Zhang, L.; Duan, Z.; Liu, F.; Zhang, Q. Analyzing the Architectural Style of Railway Stations Based on Geometry and Visual Complexity: Case Studies of Liaoning Terminal and Beijing Railway Station on the Peking–Mukden Railway. Nexus Netw. J. 2024, 26, 789–810. [Google Scholar] [CrossRef]
  49. Wang, C.C. The Chinese Eastern Railway. Ann. Am. Acad. Political Soc. Sci. 1925, 122, 57–69. [Google Scholar] [CrossRef]
  50. Bakich, O. Origins of the Russian community on the Chinese Eastern Railway. Can. Slavon. Pap. 1985, 27, 1–14. [Google Scholar] [CrossRef]
  51. Matsusaka, Y.T. Japan’s South Manchuria Railway Company in Northeast China, 1906–1934. In Manchurian Railways and the Opening of China: An International History; Routledge: Oxfordshire, UK, 2015; pp. 37–58. [Google Scholar]
  52. Manchurian Railways and the Opening of China; ME Sharpe: Armonk, NY, USA, 2010.
  53. Ginsburg, N.S. Manchurian railway development. Far East. Q. 1949, 8, 398–411. [Google Scholar] [CrossRef]
  54. Sande, T.A. Industrial Archeology: A New Look at the American Heritage; Penguin Books: New York, NY, USA, 1976. [Google Scholar]
  55. Changchun Cultural Relics Protection Research Institute. Investigation Report on the Changchun Section of the China Eastern Railway; Jilin Literature and History Publishing House: Changchun, China, 2012. [Google Scholar]
  56. Siping Municipal Cultural Relics Administration Committee. Investigation and Research on the Siping Section of the China Eastern Railway; Jilin Literature and History Publishing House: Changchun, China, 2013.
  57. Wang, X. Research on China Eastern Railway Architecture in Jilin Province; Jilin Literature and History Publishing House: Changchun, China, 2016. [Google Scholar]
  58. Keiji, I. Complete History of the Operation of Properties Affiliated to the Manchurian Railway Along the Route; Manchuria Daily News Agency: Shenyang, China, 1939. [Google Scholar]
  59. China Eastern Railway Album; China Eastern Railway Engineering Bureau: Harbin, China, 1905.
  60. Wu, G. Architectural Art Gallery: Tracing Old Buildings of the China Eastern Railway; Heilongjiang People’s Publishing House: Harbin, China, 2008; p. 264. [Google Scholar]
  61. Weglarczyk, S. Kernel density estimation and its application. ITM Web Conf. 2018, 23, 00037. [Google Scholar] [CrossRef]
  62. Florentina-Cristina, M.; George-Laurenţiu, M.; Andreea-Loreta, C.; Constantin, D.C. Conversion of industrial heritage as a vector of cultural regeneration. Procedia-Soc. Behav. Sci. 2014, 122, 162–166. [Google Scholar] [CrossRef]
  63. Kint, V.; van Meirvenne, M.; Nachtergale, L.; Geudens, G.; Lust, N. Spatial methods for quantifying forest stand structure development: A comparison between nearest-neighbor indices and variogram analysis. For. Sci. 2003, 49, 36. [Google Scholar] [CrossRef]
  64. Zhao, Z.; Zhao, Z.; Zhang, P. A new method for identifying industrial clustering using the standard deviational ellipse. Sci. Rep. 2023, 13, 578. [Google Scholar] [CrossRef]
  65. Shannon, C.E. A mathematical theory of communication. Bell Syst. Tech. J. 1948, 27, 379–423. [Google Scholar] [CrossRef]
  66. Lee, J.H.; Ostwald, M.J. Mathematical beauty and Palladian architecture: Measuring and comparing visual complexity and diversity. Front. Archit. Res. 2024, 13, 729–740. [Google Scholar] [CrossRef]
  67. Hardersen, S.; La Porta, G. Never underestimate biodiversity: How undersampling affects Bray-Curtis similarity estimate sand a possible countermeasure. Eur. Zool. J. 2023, 90, 660–672. [Google Scholar] [CrossRef]
  68. Nisar, M.A.; Ross, K.E.; Brown, M.H.; Bentham, R.; Xi, J.; Hinds, J.; Jamieson, T.; Leterme, S.C.; Whiley, H. The composition of planktonic prokaryotic communities in a hospital building water system depends on both incoming water and flow dynamics. Water Res. 2023, 243, 120363. [Google Scholar] [CrossRef] [PubMed]
  69. Hosmer, D.W., Jr.; Lemeshow, S.; Sturdivant, R.X. Applied Logistic Regression; John Wiley & Sons: Hoboken, NJ, USA, 2013. [Google Scholar]
  70. Aydın, E.Ö.; Tepe, E.; Balcan, C. Identification of determinants during the registration process of industrial heritage using a regression analysis. J. Cult. Herit. 2022, 58, 23–32. [Google Scholar] [CrossRef]
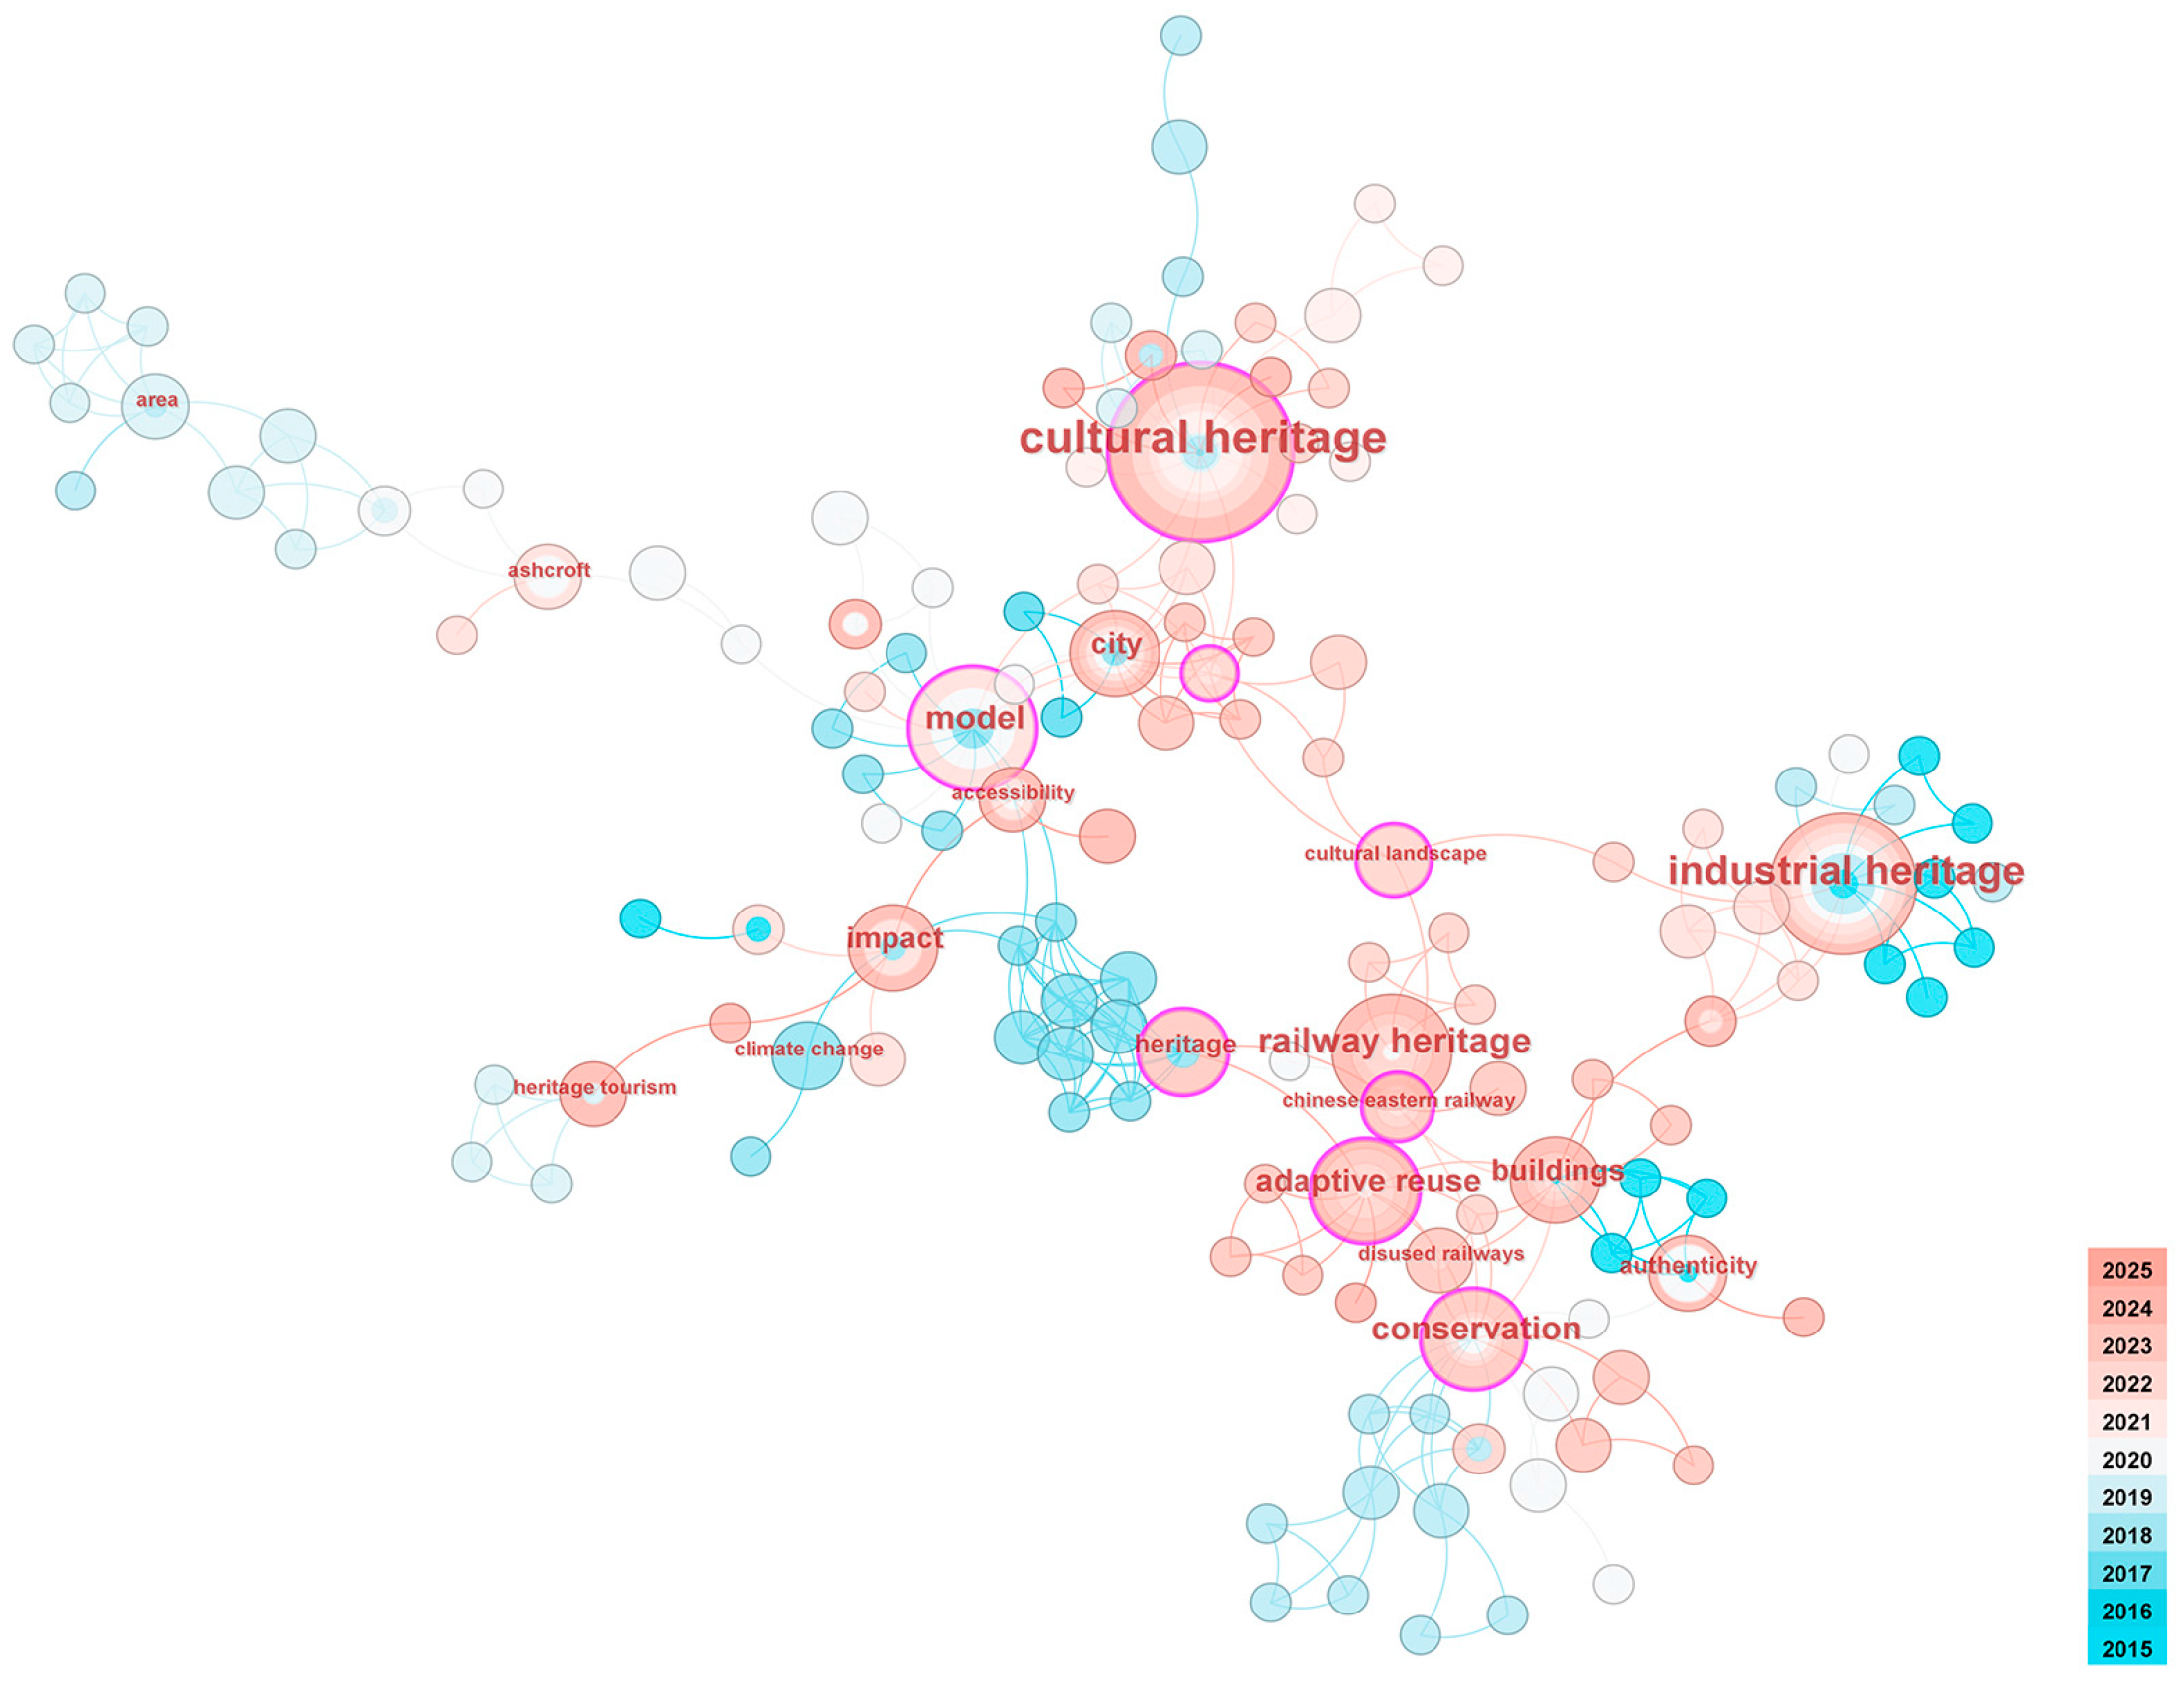
Figure 1. The co-occurrence network of keywords.
Sustainability 17 09398 g001
Figure 2. Top 16 keywords with the strongest citation bursts.
Sustainability 17 09398 g002
Figure 3. Spatial extent of the railway network in Jilin Province.
Sustainability 17 09398 g003
Figure 4. Statistics of Railway Architectural Heritage in Jilin Province.
Sustainability 17 09398 g004
Figure 5. Research framework.
Sustainability 17 09398 g005
Figure 6. Evolution of the overall spatial patterns of railway architectural heritage in different periods. (a) Period I; (b) Period II; (c) Period III.
Sustainability 17 09398 g006
Figure 7. Clustering patterns of different categories of railway architectural heritage.
Sustainability 17 09398 g007
Figure 8. Distribution of heritage buildings at Gongzhuling Station. (a) Distribution of heritage buildings across the three periods; (b) Kernel density heatmaps of Japanese and Russian heritage buildings.
Sustainability 17 09398 g008
Figure 9. Standard deviation ellipse distribution characteristics. (a) Orientation of architectural heritage distribution in different periods; (b) Orientation of station-type architectural heritage distribution in different construction stages.
Sustainability 17 09398 g009
Figure 10. Station construction. (a) Russian construction period (1899–1904); (b) Japanese construction period (1905–1931).
Sustainability 17 09398 g010
Figure 11. Cluster distribution in three periods. (a) Period I; (b) Period II; (c) Period III.
Sustainability 17 09398 g011
Figure 12. Schematic diagram of architectural façade coding. (a) Russian-modified architecture; (b) Japanese eclectic architecture.
Sustainability 17 09398 g012
Figure 13. Sample Atlas of Architectural Heritage.
Sustainability 17 09398 g013
Figure 14. Comparative Information Entropy of Sample Buildings.
Sustainability 17 09398 g014
Figure 15. Comparison of Architectural Style Element Richness.
Sustainability 17 09398 g015
Figure 16. Stylistic evolution of construction activities by Japanese colonizers during the concession period.
Sustainability 17 09398 g016
Figure 17. Description of Nominal Variables.
Sustainability 17 09398 g017
Table 1. Classification of Heritage Corridor Resources.
Heritage Corridor ResourcesMain TypeMedium TypeSubcategory
Rail heritage resourcesFunctionally related heritageRailway engineeringRailroad bridges, canal bridges, tunnels, trains
Railroad outbuildingsStation building, locomotive parking garage, locomotive maintenance warehouse, cargo storage warehouse
StructureWater towers, platform canopies
Governing BodyConsulates, office rooms
Historically relevant heritageResidential buildingsOrdinary staff housing (2 to 4 households, 6 households), high-level official housing (detached), apartment housing, and collective housing
Military architectureBarracks (2 to 6 households), Shogun
Barracks (detached)
Industrial buildingsIndustrial plants, agricultural test sites, power plants
Commercial buildingsPost office, consumer mix (shopping mall), hotel
Religious buildingsChurches, temple complexes
Political architecturePseudo-royal palace complex
Educational buildingsSchool, library
Entertainment buildingClub
Ancillary buildings and
facilities
Bathrooms, toilets, storage rooms,
blockhouse, pumps
Railroad Heritage
Ancillary Resources
Space-related
resources
Natural landscape
resources
Water systems, woodlands, grasslands, farmlands that the railway crosses or passes through
Cultural landscape
resources
Scenic spots within 30 km on both sides of the railway
Village landscape
resources
Traditional villages on both sides of the railway
Table 2. Sources of heritage-related geographic information data.
Data LayerSpatial Resolution/ScaleData TypeData Provider/Source
Base Map——VectorJilin Provincial Fundamental Geographic Information Center
https://www.webmap.cn/store.do?method=store&storeId=95
(accessed on 20 July 2025)
Digital Elevation Model (DEM)30 mRasterNational Earth System Science Data Center
https://www.geodata.cn
(accessed on 20 July 2025)
Hydrography (Rivers/Water Bodies)1:250,000VectorNational Earth System Science Data Center
https://www.geodata.cn
(accessed on 20 July 2025)
Administrative Boundaries1:100,000–1:250,000VectorNational Fundamental Geographic Information Center
https://www.webmap.cn
(accessed on 20 July 2025)
Population Density1 km × 1 kmRasterJilin Provincial Bureau of Statistics
http://tjj.jl.gov.cn
(accessed on 24 July 2025)
Land Use/Land Cover10–30 mRasterChina Land Use Database
https://www.resdc.cn/
(accessed on 20 July 2025)
Road and Railway Network1:10,000–1:50,000VectorJilin Provincial Department of Transportation
http://jtyst.jl.gov.cn/
(accessed on 20 July 2025)
Remote Sensing Imagery (Satellite/Aerial)10/30 mRasterUSGS Landsat - Daten
https://earthexplorer.usgs.gov
(accessed on 20 July 2025)
Cultural Heritage Sites——VectorLocal survey reports + field mapping + Cultural and Tourism Department databases (Jilin Provincial Department of Culture and Tourism http://whhlyt.jl.gov.cn, accessed on 12 July 2025; Heilongjiang Provincial Department of Culture and Tourism https://wlt.hlj.gov.cn, accessed on 12 July 2025; China Intangible Cultural Heritage Digital Museum https://www.ihchina.cn, accessed on 12 July 2025)
Table 3. Nearest Neighbor Index and Distribution Patterns of Different Building Types.
TypologyArchitectureAverage ObservationTypologyArchitectureAverage ObservationTypology
cohesionResidential buildings8322.39767573.61201.0988681.0008390.316905
Military buildings170.01253300.41140.051513−20.2869840.000000
Industrial buildings342.42021767.13910.193771−5.7710300.000000
All buildings101.02411956.99870.051622−39.4587160.000000
randomizationRailroad outbuildings8322.39767573.61201.0988681.0008390.316905
Commercial buildings280.4774272.26841.0301500.1412850.887645
Political buildings33.377529.93891.1148541.5536850.120260
DiscretionAdministrative buildings113,452.2441168.4099673.6672081819.8941860.000000
Religious buildings5706.72531542.44233.69979820.0035850.000000
Educational buildings28,357.25111009.214128.09835089.7913200.000000
Entertainment building72,898.763811,573.19016.29893417.5582020.000000
Table 4. Nearest Neighbor Index of Architectural Heritage by Different Builders.
TypologyAverage Observation Distance (m)Expected Average Distance (m)Nearest Neighbor RatioZ-Scorep-Value
Originally Built by Tsarist Russia46.986798.35420.477729−7.0649900.000000
Following the Japanese Additions35.900659.73080.601039−9.0950540.000000
Table 5. Encoding of architectural language elements.
Architectural ElementCodeFormArchitectural ElementCodeForm
RoofR1Single-slope roofDoor and Window
Decoration
D1Flat arch
R2Double-slope roofD2Arched arch
R3Three-slope roofD3Right-angled hanging ear style
R4Four-slope roofD4Concave-convex hanging ear style
R5Multi-slope roofD5Keystone
R6Xieshan roofD6Plaster-covered decoration
R7Hard hill roofD7Circular arc concave decoration
R8Stepped eave roofD8Geometric block decoration
R9Long-short slope roofDoor and Window ShapeM1Long and short rectangular window or door
Wall
Decoration
WD1BargeboardM2Flat rectangular window
WD2RodM3Square flat window
WD3Gable plateM4High window
WD4Plastered tiger-head stoneM5Old tiger window
WD5Braided stoneRain porchRP 1Wooden rain porch
WD6Straight grain drop shadowRP2Hollow carved wooden rain porch
WD7Stepped drop shadowRP 3Reinforced concrete rain porch
WD8Hanging belt grain drop shadowRP 4Brick and tile rain porch
WD9Patterned grain drop shadowChimneyC1Russian-style rectangular chimney
WD10Decorative linesC2Russian-style triangular chimney
WallW1Blue brick/red brick belt window or door wallC3Japanese-style rectangular chimney
W2Plastered belt window or door wallC4Japanese-style straight tube chimney
W3Stone decorative wallStepsS1Single-layer steps
W4Alternating blue and red brick decorative wallS2Multi-layer steps
W5Tokyo old red brick wallOthersEL1Geometric component
Wall BaseWB1Stone wall baseEL2Geometric block
Table 6. Architectural Language Coding.
Building NumberArchitectural Language CodingH-Value
1R2, C1, W1 + M1, W2 + M1 + M2, D1, WD1, WD52.5184
2R2, C1, W1 + M1, W2 + M1, D1, D5, WD7, WD8, RP 4, RP 32.8744
3R2, C1, W4 + M1, W3, D1, D5, D4, D8, WD6, WD7, WD8, WD9, WD5, EL1, WD10, WD2, WD1, WB13.0920
4R2, C46, W2 + M1, C4, D1, WD1, WD62.4672
5R4, C3, W5 + M1, W5 + M2, D7, WB1, WD10, EL22.6601
6R5, C4, W5 + M1, W5 + M2, WD10, C42.2104
7R9, C4, W5 + M1, W5 + M3, EL2, C42.0943
8R2, C1, M5 + M1, W5 + M3, EL2, C42.3988
9R2, C1, W1 + M1, D1, D5, WB1, WD4, WD6, WD7, WD1, RP 12.9110
10R2, C1, W5 + M1, W5 + M2, D1, RP 4, WD5, WD4, WD8, WD7, WD6, WD1, EL22.9294
11R2, C1, W1 + M1, D1, RP 4, WD1, WD7, WD52.2763
12R2, C1, W2 + M1, W2 + M2, D7, D1, D5, WB1, WD4, WD6, WD72.8882
13R5, C4, W5 + M3, W5 + M1, C4, WD102.2432
14R4, C4, W5 + M1, W5 + M2, C4, WD10, RP 3, EL22.3820
15R2, C2, W1 + M1, W4 + M1, D1, WD4, WD5, WB1, WD10, WD8, WD9, WD1, WD2, D5, S23.2721
16R2, C2, W1 + M1, D2, D1, D5, WD4, WD5, WB1, WD10, WD8, WD9, WD1, S23.2056
Table 7. Variable Description.
VariableDescription
Location Criteria
Distance from political
center
Distance to Changchun Station (1 for far, 2 for relatively close, 3 for close)
Distance to the Border LineDistance to the junction of Jilin Province and Heilongjiang Province (1 for far, 2 for relatively close, 3 for close)
Whether Relocated to Other PlacesWhether the building location needs to be relocated due to function replacement or political needs (0 for no, 1 for yes)
Structural Criteria
Material SelectionTraditional as 1, Composite as 2, Diverse as 3
Architectural Criteria
Period Experienced1 for experiencing the third period, 2 for experiencing the second and third periods, 3 for experiencing the first, second and third periods
Originality DegreeLow as 1, Medium as 2, High as 3
Whether Standardized0 for no, 1 for yes
Style EvolutionInitial period as 1, Accumulation period as 2, Expansion period as 3, Integration period as 4, Transformation period as 5, Breakthrough period as 6
Whether Repurposed0 for no, 1 for yes
Functional criteria
Whether One House for Multiple Uses0 for no, 1 for yes
Functional Complexity
Degree of the Town Where Located
Basic as 1, Composite as 2, Diverse as 3
Table 8. Description of Nominal Variables.
Nominal VariablesDescription
Material typeBrick and wood structure, brick and concrete structure, brick, wood and concrete structure
Originality typeStandardization + flexibility (decoration), standardization + sophistication + flexibility (masonry), uniqueness + creativity/designed by a designer
Style typeRussian—style traditional masonry (Early Stage of Traditional Construction), Japanese + Russian (Hybrid Renovation Stage), Russian/Japanese + Classical Revivalism (Imitative Confusion Stage), Japanese + Chinese (Combined Creation Stage), Japanese + Modern (Modern Progressive Stage), Modern (Modern Entry Stage)
Function type of the town where it is locatedTrain operation supply point, military heavy town, grain collection point, economic and trade point, agricultural test point, grain collection and processing point, tourist and military convalescent point
Table 9. Collinearity diagnostics of the linear regression analysis.
ItemVIFTolerance
Distance from political center1.2590.794
Distance to the Border Line1.9170.522
Period Experienced1.4920.670
Material Selection2.1630.462
Style Evolution3.9660.252
Distribution Pattern1.3010.769
Whether Repurposed2.2040.454
Functional Complexity Degree of the Town Where Located2.2460.445
Table 10. Final Model Results.
ItemRegression
Coefficient
Standard
Error
z-ValueWald χ2p-ValueOR Value
Distance from political center1.6430.6022.7297.4490.0065.172
Distance to the Border Line−3.9450.939−4.20317.6630.00.019
Material Selection1.9760.9072.1784.7460.0297.212
Period Experienced−2.5830.697−3.70513.7270.00.076
Style Evolution2.1360.4135.16626.6920.08.468
Distribution Pattern1.0210.4492.2775.1830.0232.776
Whether Repurposed−4.6761.14−4.10316.8370.00.009
Functional Complexity Degree of the Town Where Located0.5490.4991.1011.2120.2711.732
Disclaimer/Publisher’s Note: The statements, opinions and data contained in all publications are solely those of the individual author(s) and contributor(s) and not of MDPI and/or the editor(s). MDPI and/or the editor(s) disclaim responsibility for any injury to people or property resulting from any ideas, methods, instructions or products referred to in the content.