Abstract
Liuyang, the primary fireworks manufacturing base in the world, is demonstrating potential metals pollution risks. In this study, 163 soil samples were collected in Liuyang City, China, for source apportionment, pollution assessment and health risk evaluation using self-organizing map, positive matrix factorization and statistical methods. Geostatistical analysis confirmed high contamination risks from Hg, Cd, Pb, and As. Samples were classified into four groups based on contamination characteristics. Pollution sources included irrigation water, fireworks enterprises, and fireworks packaging material. Cluster 1 exhibited uniformly low metals concentrations, with sampling points widely distributed across the study area. Cluster 2 samples were concentrated in the central and northern regions. The average concentration of Cr was the highest, with irrigation water contributing the most to Cr at 74%. The contribution of fireworks companies and packaging materials was 14% and 12%, respectively. Cluster 3 displayed elevated Hg and Pb levels with distinct spatial banding, where fireworks enterprises contributed 49% (Hg) and 47% (Pb), while packaging materials accounted for 37% (Hg) and 39% (Pb). Cluster 4, gathered in the southeast, showed the highest Cd and As concentrations, with fireworks companies contributing the most with 73% and 82%, respectively. Risk assessment demonstrated that children experienced greater non-carcinogenic risks from oral and dermal exposure to As, Hg, Pb, Cr, and Cd, while adults faced higher inhalation risks for Cr and Cd. Carcinogenic risks exceeded safety thresholds, with children (4.1 × 10⁻⁹–2.0 × 10⁻⁴) more vulnerable than adults (2.9 × 10⁻¹²–1.4 × 10⁻⁴). Asdult carcinogenic risks via ingestion dominated, whereas Cr posed greater risks for children through inhalation.
1. Introduction
Soil is commonly used as a major site for industrial and agricultural activities [1,2]. With rapid economic development, metals contaminants are discharged into ecosystems and ultimately accumulate in soils as poorly soluble compounds [3,4,5,6]. Moreover, anthropogenic activities are the main drivers of metals contamination in soil [7,8].
Numerous statistical approaches have been established to evaluate the environmental and public health impacts of contaminants. These include the geo-accumulation index (Igeo), the factor evaluation method, the Nemero evaluation method and the ecological risk index [9]. Continuous accumulation and bioavailability of pollutants have shown the deleterious effects of metals on most organisms through the food chain, leading to a variety of health risks [10]. The evaluation of heavy metal health risks typically considers three primary exposure pathways, including oral ingestion, dermal contact, and inhalation [11].
Methods for pollution source identification include multivariate statistical analysis, machine learning, stable isotope method, receptor modeling, and chemical mass balance modeling [12,13]. In multivariate statistical approaches, dimensionality reduction techniques like principal component analysis (PCA), factor analysis (FA), and hierarchical cluster analysis (HCA) are commonly employed in environmental pollution studies. These methods effectively project high-dimensional data onto lower-dimensional spaces for visualization and interpretation [14,15,16]. However, highly complex pollution data lead to limitations in the utilization of linear methods, which may develop erroneous clustering results.
Neural networks have been widely employed to identify intrinsic connections and have gradually developed as a high-performance prediction method [17]. The self-organizing map (SOM) represents an unsupervised machine learning technique capable of clustering and visualizing nonlinear data structures. Increasingly, this method has found application in analyzing intricate datasets from environmental monitoring systems [18]. By analyzing groundwater chemistry data from mining sites, the sources and genesis processes of sulfate in groundwater have been identified [19,20]. Meanwhile, SOM could be used to investigate the migration process and enrichment of pollutants at the site scale and regional scale, providing scientific support for pollution management [21]. In order to quantitatively characterize the pollutant sources, most scholars have introduced the positive matrix factorization (PMF) model [22,23]. The integrated application of SOM and PMF enables quantitative estimation of individual pollution source contributions to heavy metal concentrations [24,25]. Through the combined application of SOM and PMF, the study uncovered the dynamic evolution of hydrochemical properties and pollution origins in coal mining regions [26,27,28]. Given significant variations in emission profiles across sources and differential toxicity among metals, control strategies must prioritize sources based on associated human health risks [29].
The output value of Liuyang fireworks accounts for more than 70% of the global market [30]. The business scope of the enterprise includes the production of fireworks and the production of packaging materials, and raw materials. However, the emission of pollutants poses environmental and public health risks. Wastewater and metal dust generated during the production and discharge of fireworks may pollute soil and water bodies through surface runoff and deposition [31]. Meanwhile, Liuyang serves as a vital agricultural production base, where surface water is extensively utilized for crop irrigation [32,33]. Therefore, source apportionment and risk assessment of metals in the soil of Liuyang City’s fireworks production aggregation area is urgent [34,35].
Current research examining the spatial patterns, pollution origins, and health risks of metals contamination in Liuyang’s soils remains inadequate. In this work, machine learning and multivariate statistical methods were used to (1) characterize the contamination level of metals in soil in Liuyang, (2) identify the contamination sources and quantify the contribution of each factor to metals contamination, and (3) evaluate the health risk of metals contamination in soil.
2. Materials and Methods
2.1. Study Area
Liuyang, a county-level city in Hunan Province, falls under the administrative jurisdiction of Changsha City. The area is situated in northeast Hunan Province, bordering the mid-reaches of the Yangtze River Plain (113°10′24″–114°14′58″ E, 27°51′20″–28°34′06″ N). The total area is 5007 km2 (Figure 1). Liuyang’s climate is humid subtropical monsoon, featuring abundant sunshine, warmth, and precipitation. The region experiences mean yearly temperatures between 15 and 23 °C. The annual precipitation is between 1400 and 1800 mm [36]. Liuyang City is characterized by remarkable geomorphological features, with the terrain high in the northeast and sloping down to the southwest. Meanwhile, there are various types of landforms, with a large proportion of mountains and hills. Liuyang City possesses abundant water resources, primarily sourced from the Liuyang River and its tributaries. Furthermore, the flat area of the Liuyang River basin serves as a crucial agricultural zone in this region [37]. It is remarkable that Liuyang is the world-famous hometown of fireworks, producing 480,000 boxes of fireworks annually.
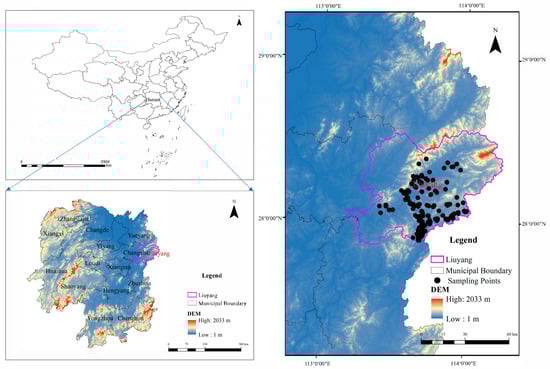
Figure 1.
Map of the study area and spatial arrangement of sampling sites.
2.2. Sampling and Analysis
This work mainly focused on the source apportionment and risk assessment of Cd, Pb, As, Hg, and Cr. Firstly, it was found that the pollution risks of Cd, Pb, Zn, and Cu were relatively high in the Liuyang and Xiangjiang river basins by consulting relevant references [35,38], but Zn and Cu mines were not involved in fireworks production areas. Meanwhile, considering the fireworks production process, Cd, Pb, As, and Hg were the key focus components. In the preliminary investigation, it was found that the concentration of Cr exceeded the standard by collecting irrigation water samples. Therefore, the final focus was on Cd, Pb, As, Hg, and Cr.
Soil sample collection was conducted in the study area in 2023, totaling 163 sets. The sampling points were mainly concentrated near the enterprises of fireworks and related products in Liuyang City (Figure 1). There were more than 20 fireworks enterprises in Jili Town, Dayao Town, Wenjia City Town, Jingang Town, and Chengtanjiang Town in Liuyang City. Therefore, encrypted sampling was conducted in these five towns. Surface soil samples (0–20 cm depth) were obtained by removing surface vegetation. At each sampling location, three replicate subsamples were combined to create a homogenized composite sample (1.0–1.5 kg), which was immediately sealed in pre-cleaned polyethylene bags. In the laboratory, samples were air-dried, passed through a nylon sieve, and subjected to acid digestion (HNO3-HF-HClO4). Metal concentrations (As, Pb, Cd, Cr) were quantified using inductively coupled plasma mass spectrometry (Agilent 7900, Agilent, Santa Clara, CA, USA), while Hg levels were measured via atomic fluorescence spectrometry (AFS-8200, Enping Sounder Intelligent Technology Co., Ltd., Enping, China). Quality assurance/quality control (QA/QC) protocols included analysis of method blanks, duplicate samples, and certified reference materials (GSS-3, GBW07403) obtained from China’s National Research Center. The relative standard deviation was within 5%. Sample recovery was 93–105%.
Twenty-six irrigation water samples were systematically collected across the study area (see Figure S1). Immediately after collection, each sample was vacuum-filtered using 0.45 µm membranes and transferred to acid-washed HDPE bottles. Samples were maintained at 4 °C in dark conditions during transport and storage prior to analysis. Trace metal concentrations (As, Hg, Pb, Cd, and Cr) were measured by high-resolution inductively coupled plasma mass spectrometry (ICP-MS). All procedures from field sampling to laboratory analysis complied with the technical specifications for water quality monitoring established by China’s Ministry of Ecology and Environment. To ensure analytical accuracy, parallel sample analysis was implemented. Furthermore, all samples exhibited a charge balance error (CBE) within ± 5%, confirming that data quality requirements were met for each measured parameter.
2.3. Self-Organizing Maps
SOM is a class of unsupervised learning models inspired by biological neural systems, the core of which lies in the automatic discovery of hidden patterns in the data through self-organization, competitive learning, and topology preservation mechanisms [39,40]. Competitive learning involves neurons choosing to respond to input patterns through the Winner-Takes-All mechanism. The topology structure ensures that high-dimensional data retains spatial relationships in low-dimensional mappings, as shown in Kohonen’s topological mapping theorem [41]. SOM employs a two-dimensional grid structure, and training is achieved by a three-stage algorithm for selecting the best matching unit (BMU), the neighborhood function, and the weight update, whose convergence relies on a monotonically decreasing learning rate and neighborhood radius (Figure S2).
The optimal neuron count may be determined through empirical guidelines, such as the recommended formula 5, where n represents the sample size [42]. Network architectures ranging from 3 × 3 to 10 × 10 neuronal configurations were implemented during training. The optimal SOM topology was typically identified through integration with K-means clustering, where the Davies-Bouldin index served as a key metric for determining cluster quantity [4]. SOM processing was performed through the implementation of the specialized Toolbox 2.0 in MATLAB’s 2021a version.
2.4. Positive Matrix Factorization
PMF model employs an iterative weighted least squares algorithm with non-negative constraint optimization [43,44]. The decomposition process is weighted by measurement uncertainties (Unc), with convergence achieved when the objective function Q reaches its global minimum. Required inputs comprise: (1) a concentration matrix of target elements, and (2) their corresponding uncertainty matrix.
xi,j: Measured concentration of element j in sample i (mg/kg)
gi,k: Contribution of factor k to sample i (dimensionless)
fk,j: Concentration of element j in factor k (mg/kg)
ei,j: Residual error for element j in sample i
ui,j: Uncertainty of xi,j, calculated as:
Unc represents the relative measurement uncertainty of the analyzed parameters; MDL is the detection limit of the method (mg/kg); C denotes the concentration of target analytes in the monitoring dataset (mg/kg); τ is the error fraction, which is derived from recovery rates during chemical analysis.
2.5. Health Risk Assessment
Residential exposure to contaminated soils through ingestion, dermal contact and inhalation may induce carcinogenic and non-carcinogenic effects. The USEPA-derived risk assessment framework was applied to evaluate heavy metal toxicity in exposed populations [45,46] (https://www.epa.gov/risk/human-health-risk-assessment) (accessed on 18 April 2025).
where , and reflect the ADIs of metals (mg/kg/day) by ingestion, dermal contact and inhalation, respectively. represents the content of metals in the surface soil. (mg/day) represents the ingestion rate in surface soil. (m3/day) represents the inhalation rate in surface soil. denotes exposure frequency, measured in per day/year. signifies the duration of exposure, quantified in years. denotes the dermal contact area (cm2). denotes the dermal adherence coefficient in kg/m2/day. denotes the dermal absorption factor. denotes the particulate emission coefficient in m3/kg. denotes individual body mass in kg. represents the mean time per day.
Further, the hazard quotient (), hazard index () and models were employed to assess the non-cancer and cancer hazard of As, Hg, Pb, Cd, and Cr in the contaminated site [45,47].
where , and represent the of metals by ingestion, dermal contact, and inhalation, respectively. is the reference dose. assesses the entire non-cancer hazard posed by all the detected metals. > 10 indicates severe chronic risk. > 1 demonstrates a high probability of adverse health effects in humans. < 1 indicates no significant risk of adverse health effects [46].
where is carcinogenic risk. is the carcinogenicity intensity factor (kg·d)/mg.
2.6. Geo-Accumulation Index
The geo-accumulation index () is proposed by Muller to depict the possible accumulation patterns of different metals [48,49]. The is a valuable method for assessing the enrichment of metals levels above background values of the soil environment [48]. The index has been extensively adopted in the environmental risk evaluations of soil contamination [50]. The is calculated by the equation below:
where represents the content of metals in each sample, and represents the geochemical background level of different metals [48]. In the research, the background values of As, Cr, Pb, and Hg from Henan Province were used. The common factor 1.5 is utilized to calibrate for the natural variation of different metals resulting from human activities [48]. Heavy metal pollution levels are shown below: ≤ 0 represents unpolluted. 0 < ≤ 1 represents unpolluted to moderately polluted. 1< ≤ 2 represents moderately polluted. 2 < ≤ 3 represents moderately to highly polluted. 3 < ≤ 4 represents highly polluted. 4 < ≤ 5 represents highly to extremely polluted. > 5 represents extremely polluted [51].
2.7. Potential Ecological Risk Index
The potential ecological risk index is evaluated based on the toxicity of heavy metal(loid)s. The calculation formula is shown below [52].
where is the potential ecological risk index of heavy metal(loid)s. is the measured content of heavy metal(loid)s. is the background value of heavy metal(loid)s. is the toxicity factor for heavy metal(loid)s. is the potential ecological risk comprehensive index of heavy metal(loid)s. Based on the value of and , the risk level is as follows: < 40 represents a low risk level. 40 < < 80 represents a moderate risk level. 80 < < 160 represents a considerable risk level. 160 < < 320 represents a high risk level. > 320 represents a significant risk level. < 150 represents a low risk level. 150 < < 300 represents a moderate risk level. 300 < < 600 represents a considerable risk level. > 600 represents a high risk level.
2.8. Data Processing and Statistical Analysis
Statistical analyses were performed using SPSS (v25.0) and Microsoft Excel (v2016). Correlation analyses (Pearson’s r) were conducted in Origin (v2021) and R (v4.1.0), while spatial distributions were mapped using ArcGIS (v10.2).
3. Results and Discussion
3.1. Pollution Assessment and Ecological Risk Assessment
Variability in soil metal concentrations (Hg, Pb, Cr, Cd, and As) was quantified through geostatistical analysis, while basic statistical measures are summarized in Table 1. The average concentrations of Hg, Pb, Cr, Cd, and As were 0.230 mg/kg, 81.42 mg/kg, 40.83 mg/kg, 0.24 mg/kg and 19.44 mg/kg. The concentrations of Hg, Pb, Cd, and As were 1.98, 2.74, 1.90, and 1.24 times higher than background values, respectively. Cd, Pb, Cr, and As were highly variable with 44.06%, 51.29%, 43.44%, and 92.92% respectively. Hg was moderately variable with 33.05%. Anthropogenic sources, particularly agronomic activities and industrial effluents, were postulated as significant drivers of metallic soil pollution [30].

Table 1.
Basic parameters of metals in soil.
The was used to evaluate the pollution of metals in the soil. Figure 2 showed the distribution characteristics of . The of As, Cd, and Pb were high, spanning four levels. The of As, Cd, and Pb in some samples were greater than 2, indicating that As, Cd, and Pb were in the moderate to highly contaminated range. The of Hg in some samples was greater than 1, indicating moderate pollution. Based on the average of Cd, Pb, Cr, As, and Hg, the contamination levels of the soil were ranked: Pb > Hg > Cd > As > Cr (Figure 2).
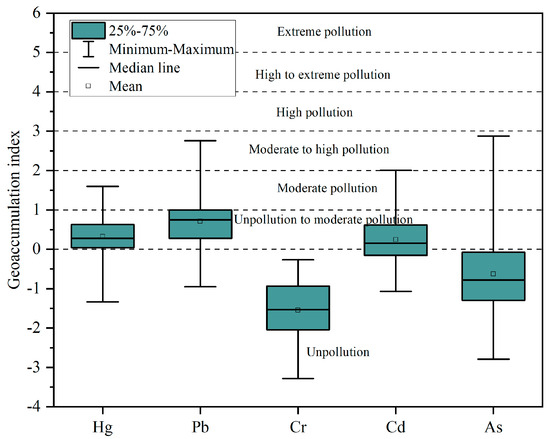
Figure 2.
Distribution of geo-accumulation index of metals in soil.
The potential ecological risk index (RI) was employed to evaluate the ecological risk posed by metals in the soil of Liuyang. The RI of five metals followed the order: Hg > Cd > Pb > As > Cr (Figure 3). The ecological risk of the Xiangjiang River showed that the risk of Pb and Cd was higher, and the risk of Cr was lower [35]. The results were consistent with Liuyang. Due to the production of fireworks enterprises, the risk of Hg was the highest. The RI of Cr exhibited a low risk level. For Hg, 3% of samples were classified as low risk, 57% as moderate risk, 38% as considerable risk, and 2% as high risk. Regarding Cd, 20% of samples were low risk, 64% moderate risk, 14% considerable risk, and 2% high risk. For Pb, 99% of samples were low risk, while only 1% fell into the moderate risk. For As, 98% of samples were low risk, with the remaining 2% being moderate risk. The comprehensive ecological risk index (RI) ranged from 75.56 to 381.84, with 52% of samples categorized as low risk, 47% as moderate risk, and 1% as considerable risk (Figure 3). The ecological risks of metals in this work originated from anthropogenic activities. Usually, the high risks of Ni, Mn, Co, and V are derived from natural processes in the Xiangjiang River [35].
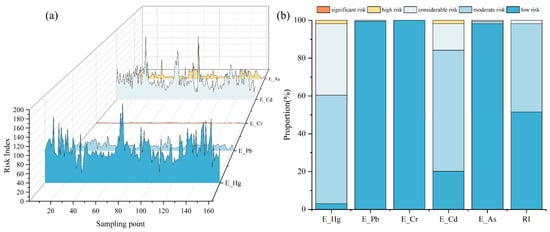
Figure 3.
(a) Distribution of ecological risk indices for different metals in the Liuyang area, (b) Proportion of ecological risks contributed by different metals in the Liuyang area.
3.2. Cluster Analysis with SOM
The correlation analysis between different components could define the interdependence of metals in soil. Figure 4 shows the correlation between Hg, Pb, Cr, Cd, and As in soil. According to the Pearson correlation coefficient, Hg and Pb showed a positive correlation (R = 0.466), indicating that the potential sources of Hg and Pb could be common. Cd and As showed a positive correlation (R = 0.470), which suggested that there were similar potential sources of Cd and As. However, the absence of correlation between Cr and other metals implies differential pollution pathways and source contributions.
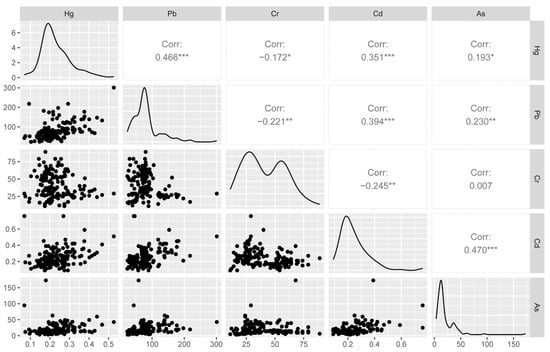
Figure 4.
The relationship of metals in soil. The number of * represents statistical significance. * represents p less than 0.05. ** represent p less than 0.01. *** represent p less than 0.001.
The concentrations of metals in soil were analyzed by using the SOM to produce a weight distribution pattern (Figure 5). The neurons’ structure with 9 × 7 was considered to have the most concentrated information and produced the best results (Table S2). The weights of the variables were shown on the corresponding mapping plots. In these maps, yellow and blue represent the importance of the weighted variables, with the yellow being more important. Based on the distribution of weight, the analogous distribution characteristics of Pb and Hg were consistent with a common source attribution for both elements. The comparable distribution patterns of Pb and Hg suggested common anthropogenic origins for both metals. The weight distribution of chromium differed significantly from other metals (Hg, Pb, Cd, and As), implying separate origin pathways.
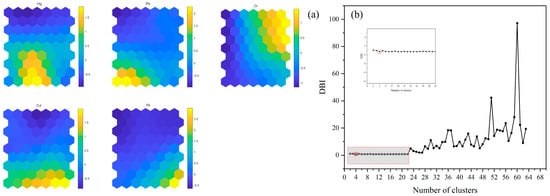
Figure 5.
(a) Weight distribution of different metals, where yellow represents high weight and blue represents low weight. (b) Distribution of DBI.
In order to determine cluster boundaries and the number of cluster centers, the results of the SOM need to be interpreted in conjunction with the K-means method [53]. The Davies–Bouldin Index (DBI) was calculated for the number of cluster centers from 2 to 63 (Figure 5b). When the DBI value was smaller, the number of clustering centers was optimal [41]. It was concluded that soil samples could be classified into four groups.
3.3. Analysis of Pollution Components for Each Cluster
Samples in neurons were described as sampling points in soil. Within the SOM architecture, adjacent neural nodes clustered samples with similar properties, whereas samples assigned to distant nodes showed increasing compositional dissimilarity following topological distance metrics [54].
Soil samples from Liuyang were categorized into four distinct groups through K-means cluster analysis (Figure 6). The mathematical characteristics of the components in each cluster were counted to investigate the typical pollution characteristics of different clusters (Table 2). In the first cluster, the average concentration of each metal was relatively low, indicating that the samples in the first cluster were less polluted. In the second cluster, Cr exhibited the highest average concentration at 58.69 mg/kg. The distinctive feature of Cluster 3 was the peak concentrations of Hg and Pb, reaching 0.315 mg/kg and 131.08 mg/kg, respectively. The fourth cluster was dominated by Cd and As, reaching 0.39 mg/kg and 53.38 mg/kg, respectively.
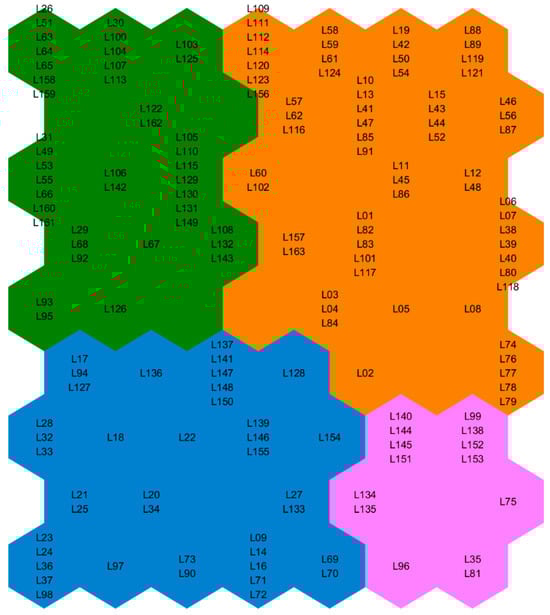
Figure 6.
Distribution of clustering centers for metals. The orange represents Cluster 1. The pink represents Cluster 2. The blue represents Cluster 3. The green represents Cluster 4.
Table 2.
Statistical analysis in different groups.
3.4. Source Interpretation and Driving Factors with Multiple Methods
Fireworks production and agricultural activity contributed to metal contamination in soil [55]. In order to verify the relationship between the number of fireworks enterprises in different townships and pollution characteristics, the distribution of fireworks enterprises in the townships where the soil sample points were located was investigated (Figure 7). By geospatial analysis, each cluster was superimposed with the distribution of fireworks enterprises. Meanwhile, the land use types were investigated. The land use types of Wenjiashi Town, Chentanjiang Town, Dayao Town, Yanghua Town, Jingang Town, Hehua subdistrict, Jili subdistrict, Gejia Town, Chengchong Town, Guankou subdistrict, Yongan Town, Zhentou Town, and Taipingqiao Town were industrial land. The land use types of Yanxi Town, Dahu Town, Guandu Town, Chunkou Town, Chima Town, Xijiang Town, Shegang Town, Longfu Town, Gaoping Town, Zhonghe Town, Gugang Town and Sankou Town were agricultural land. The land use types of other towns were Woodland. It could provide help for pollution source identification.
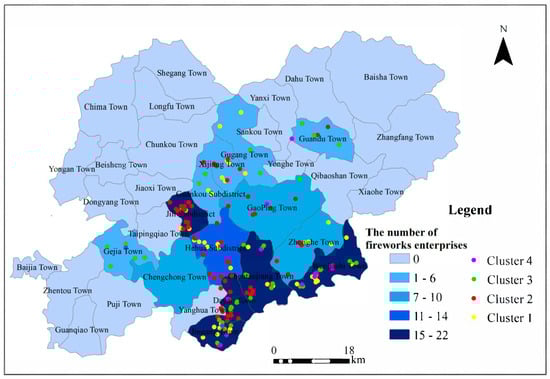
Figure 7.
Distribution of samples in different clusters.
The analysis revealed that Cluster 1 exhibited widespread spatial distribution across the entire study area. Moreover, these samples were less contaminated. The second cluster was mainly located in the central and northern regions, with a high level of agricultural and industrial activity. The third cluster was distributed along strips with some regionalization, and the number of fireworks enterprises was higher in these areas. The fourth cluster exhibited a concentrated spatial pattern in the southeastern sector of the study region, correlating with high-density firework manufacturing zones. Collectively, the data demonstrated significantly elevated concentrations of Cd, As, Hg, and Pb in areas with concentrated fireworks manufacturing activities. Therefore, there was a relationship between fireworks enterprises and metal pollution. Moreover, a comprehensive evaluation of fireworks production facilities’ role in metals contamination requires quantitative analysis. Previous studies have mainly focused on the impact of fireworks on air quality and the characteristics of particulate matter [56,57]. Meanwhile, experiment results showed that bacteria from fireworks soil could remove Cd (II) by biosorption. It could provide an important pathway for the remediation of Cd in the fireworks sites [58]. However, there has been a lack of research on the impact of fireworks production on soil quality.
3.5. Quantitative Analysis of Pollution Sources
The PMF receptor model quantified contamination sources for As, Cd, Cr, Pb, and Hg in Liuyang’s soils. Multiple factor solutions (3–6 factors) were examined with 25 iterations to validate source resolution. It was found that the measured and predicted values were best fitted when the number of factors was 3. The fitting coefficients (R2) for Hg, Pb, Cr, Cd, and As were 0.74, 0.76, 0.99, 0.72, and 0.99, respectively, which indicated that the results could provide statistically valid quantification of pollution source contributions for all target metals (Figures S4–S8).
With a dominant loading of 74%, Cr showed significantly greater contribution to Factor 1 than other metals. It was indicated that Factor 1 is highly correlated with Cr. SOM analysis revealed elevated chromium concentrations in Cluster 2, with corresponding sampling sites predominantly located in zones of agricultural and industrial activity. Previous studies have shown that there was high-intensity agricultural activity in these areas [59]. By testing the component concentrations of the irrigation water, it was identified that the concentration of Cr exceeded the criteria for Class III water (Table S3). Strong chelation and adsorption interactions resulted in pronounced chromium retention in the topsoil. Factors 2 and 3 contributed 12% and 14% to Cr, respectively. Therefore, it was concluded that Factor 1 was irrigation water (Figure 8).
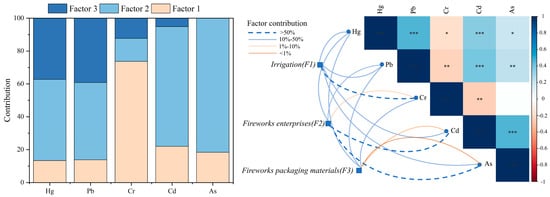
Figure 8.
The distribution of the contribution of factors. The number of * represents statistical significance. * represents p less than 0.05. ** represent p less than 0.01. *** represent p less than 0.001. For Factor 2, the loadings of Cd and As were higher with contributions of 73% and 82%, respectively. Combined with the clustering results, it could be revealed that the fourth group exhibited elevated levels of Cd and As concentrations. Samples belonging to the fourth cluster showed pronounced geographical aggregation, particularly concentrated in the southeastern sector of the investigation area. Meanwhile, it was known that the number of fireworks enterprises in the southeast is the largest. Generally, the production and wastewater discharge of fireworks factories could lead to the contamination of Cd and As. Related studies have indicated that fireworks production could lead to pollution from particulate matter and metals [56,60]. Therefore, it was identified that Factor 2 was fireworks enterprises.
Hg (37%) and Pb (39%) emerged as the primary drivers of Factor 3, with loadings exceeding those of other elements. The third cluster exhibited significantly higher mean concentrations of Hg and Pb compared to other clusters, with maximum values reaching 0.527 and 301 mg/kg, respectively. The spatial distribution of the sample points showed a strip-like pattern. One region was along the area of Jingang Town–Dayao Town–Chengtanjiang Town–Wenjiashi Town. The other area was along Gejia Town–Guankou Street–Gugang Town–Guandu Town. Moreover, the land use types of most towns were industrial land. The first delineated zone, identified as a fireworks manufacturing cluster, exhibited significant anthropogenic influences from pyrotechnic activities, contributing 49% and 47% to Hg and Pb loads, respectively. The other striped area was distributed mainly with fireworks packaging material production factories, contributing 37% and 39% to Hg and Pb. Research has shown that there were some lead mines in Hunan Province. Therefore, mining could bring potential metal pollution [61,62]. However, there has been no mining activity in these two belt areas. Therefore, it was determined that Factor 3 is the fireworks packaging material production plant.
The source contributions were further quantified using Absolute Principal Component Scores–Multiple Linear Regression (APCS/MLR), yielding results consistent with those obtained from PMF (Figures S9 and S10). Compared to APCS/MLR, stable isotope was a more direct quantification method [43]. However, the cost is also higher. The consistency of these two analytical approaches strengthened the validity of the source apportionment, offering a robust scientific basis for precise regional pollution management measures.
3.6. Health Risk Assessment of Metals
Using the USEPA health risk assessment model and China’s technical guidelines for soil contamination of construction land, the carcinogenic and non-carcinogenic risks of metals were analyzed (Tables S4 and S5) [46]. The hazard quotient (HQ) results (Table S6) indicated that children faced higher health risks than adults through oral ingestion and dermal contact, whereas adults had greater inhalation-related HQs. For children, As, Hg, Pb, Cr, and Cd via oral intake posed the most significant risks. In adults, As, Hg, and Pb are primarily entered through ingestion, while Cr and Cd exposures were mainly via inhalation.
Among adults, As had the highest average hazard index (HI), followed by Cr > Pb > Cd > Hg. For children, As also ranked highest in average HI, followed by Pb > Cr > Hg > Cd. The non-carcinogenic risk values for metals in adults and children ranged from 7.47 × 10⁻⁴ to 3.17 and 8.91 × 10⁻⁴ to 3.53, respectively. Thus, the HI exceeded the safety threshold (HI > 1) for adults and children. Moreover, children faced higher non-carcinogenic risks from metals compared to adults.
Additionally, the carcinogenic risks (CR) of As, Cr, and Cd exposure were quantified for both populations (Table S7). In children, As enters the body mainly through ingestion, while inhalation dominates for Cr and Cd. For adults, oral ingestion contributed most to the carcinogenic risks of As and Cr. CR measurements showed adult exposures between 2.92 × 10⁻¹² and 1.42 × 10⁻⁴, compared to children’s range of 4.13 × 10⁻⁹ to 2.04 × 10⁻⁴. Among adults, As posed a higher carcinogenic risk than Cr and Cd, whereas Cr exhibited a higher risk than As and Cd in children. Furthermore, the aggregate carcinogenic risk values for metals surpassed the threshold range of 1.00 × 10⁻⁶ to 1.00 × 10⁻⁴, demonstrating significant adverse health impacts. Notably, children faced higher carcinogenic risks than adults. It was also consistent with the health risk outcomes of most contaminated sites [23].
Fireworks could deposit metals into soil, air, and water. Therefore, it posed a threat to human health. They can also bioaccumulate, such as in soil bacteria, mosses, fish, and mammals. The bioaccumulation of metals in food could then be transmitted to humans and directly affect the health status of other groups [63]. Therefore, future research could focus on the migration and accumulation of metals to plants in order to comprehensively assess health risks.
4. Conclusions
- (1)
- The mean concentrations of Hg, Pb, Cd, and As exceeded background values by factors of 1.98, 2.74, 1.90, and 1.24, respectively. The RI ranged from 75.56 to 381.84, with risk levels distributed as follows: 52% low risk, 47% moderate risk, and 1% considerable risk.
- (2)
- SOM and K-means clustering classified the soil samples into four distinct clusters. Cluster 1 showed extensive spatial coverage across the study region with consistently lower pollution levels. Cluster 2 was concentrated in the central and northern regions, correlating with areas of concentrated agricultural and industrial activities. Cluster 3 displayed a strip-like distribution with localized clustering, coinciding with a higher density of fireworks enterprises. Cluster 4 showed a distinct spatial concentration in the southeastern sector of the study region, where fireworks production facilities were densely concentrated. Notably, the presence of clustered fireworks manufacturing was associated with significantly elevated levels of Cd, As, Hg, and Pb. Three potential pollution sources were quantified: Cr (74%), Cd (22%), As (18%), Pb (14%), and Hg (13%) originated from irrigation water; As (82%), Cd (73%), Hg (49%), Pb (47%), and Cr (14%) derived from fireworks enterprises; Pb (39%), Hg (37%), Cr (12%), and Cd (5%) from fireworks packaging material.
- (3)
- Children were more vulnerable than adults to harmful health impacts through oral ingestion and dermal contact exposure, while adults faced higher inhalation risks. For children, the greatest threats came from ingesting As, Hg, Pb, Cr, and Cd. In adults, As, Hg, and Pb primarily entered through oral ingestion, whereas Cr and Cd exposure is mainly via inhalation. The CR values ranged from 2.92 × 10⁻¹² to 1.42 × 10⁻⁴ for adults and 4.13 × 10⁻⁹ to 2.04 × 10⁻⁴ for children, exceeding acceptable thresholds. Among adults, As presented the greatest carcinogenic threat, with Cr and Cd ranking second and third, respectively. In contrast, Cr presented a greater risk than As and Cd in children. Collectively, the carcinogenic risk exposure was significantly greater in children compared to adults.
- (4)
- In future research, it is essential to focus on the morphological characteristics of metals and the distribution characteristics of metals at different depths. This will enable more precise pollution prevention and control.
Supplementary Materials
The following supporting information can be downloaded at: https://www.mdpi.com/article/10.3390/su17219404/s1, Figure S1: The distribution of groundwater sampling points; Figure S2: The flowchart of the method; Figure S3: The concentrations distribution of metals, (a) The distribution of As concentration, (b) The distribution of Cd concentration, (c) The distribution of Cr concentration, (d) The distribution of Hg concentration, (e) The distribution of Pb concentration; Figure S4: The comparison of observed concentration and predicted concentration for As; Figure S5: The comparison of observed concentration and predicted concentration for Cd; Figure S6: The comparison of observed concentration and predicted concentration for Cr; Figure S7: The comparison of observed concentration and predicted concentration for Hg; Figure S8: The comparison of observed concentration and predicted concentration for Pb; Figure S9: The contribution of metals for PMF; Figure S10: The contribution of metals for APCS-MLR; Table S1: The list of abbreviations; Table S2: Data normalization for SOM quality measures (QE and TE) of different map size in the surface soil; Table S3: The values of different components in irrigation water; Table S4: Exposure parameters for the heavy metals; Table S5: Parameters for the metals; Table S6: Hazard quotient and hazard index for adults; Table S7: Carcinogenic risk for each heavy metal for adults; Text S1: Spatial distributions of metals.
Author Contributions
Conceptualization, Y.Z.; methodology, Y.Z.; software, Y.Z.; validation, Y.J., Y.C. and J.S.; formal analysis, Y.Z. and Y.J.; investigation, Y.Z. and Y.J.; writing—original draft preparation, Y.Z.; writing—review and editing, Y.Z.; supervision, Y.J., Y.C. and J.S.; funding acquisition, Y.Z. All authors have read and agreed to the published version of the manuscript.
Funding
This research was funded by Research and Engineering Demonstration of Radioactive Contamination Monitoring for Mine Water at Tarangol Mine, Hangjin Energy—Supporting Monitoring Technology Development (S930023113).
Institutional Review Board Statement
Not applicable.
Informed Consent Statement
Not applicable.
Data Availability Statement
The raw data supporting the conclusions of this article will be made available by the authors on request.
Conflicts of Interest
The authors declare no conflict of interest.
References
- Fang, S.; Hua, C.; Yang, J.; Liu, F.; Wang, L.; Wu, D.; Ren, L. Combined pollution of soil by heavy metals, microplastics, and pesticides: Mechanisms and anthropogenic drivers. J. Hazard. Mater. 2025, 485, 136812. [Google Scholar] [CrossRef]
- Xue, S.; Korna, R.; Fan, J.; Ke, W.; Lou, W.; Wang, J.; Zhu, F. Spatial distribution, environmental risks, and sources of potentially toxic elements in soils from a typical abandoned antimony smelting site. J. Environ. Sci. 2023, 127, 780–790. [Google Scholar] [CrossRef]
- Shi, J.; Zhao, D.; Ren, F.; Huang, L. Spatiotemporal variation of soil heavy metals in China: The pollution status and risk assessment. Sci. Total Environ. 2023, 871, 161768. [Google Scholar] [CrossRef] [PubMed]
- Zhang, Y.; Zhang, Q.; Chen, W.; Shi, W.; Cui, Y.; Chen, L.; Shao, J. Hydrogeochemical analysis and groundwater pollution source identification based on self-organizing map at a contaminated site. J. Hydrol. 2023, 616, 128839. [Google Scholar] [CrossRef]
- Fei, X.; Lou, Z.; Xiao, R.; Ren, Z.; Lv, X. Source analysis and source-oriented risk assessment of heavy metal pollution in agricultural soils of different cultivated land qualities. J. Clean. Prod. 2022, 341, 130942. [Google Scholar] [CrossRef]
- Hu, B.; Shao, S.; Ni, H.; Fu, Z.; Hu, L.; Zhou, Y.; Min, X.; She, S.; Chen, S.; Huang, M.; et al. Current status, spatial features, health risks, and potential driving factors of soil heavy metal pollution in China at province level. Environ. Pollut. 2020, 266, 114961. [Google Scholar] [CrossRef] [PubMed]
- Luo, X.; Wu, C.; Lin, Y.; Li, W.; Deng, M.; Tan, J.; Xue, S. Soil heavy metal pollution from Pb/Zn smelting regions in China and the remediation potential of biomineralization. J. Environ. Sci. 2023, 125, 662–677. [Google Scholar] [CrossRef] [PubMed]
- Xiang, M.; Li, Y.; Yang, J.; Lei, K.; Li, Y.; Li, F.; Zheng, D.; Fang, X.; Cao, Y. Heavy metal contamination risk assessment and correlation analysis of heavy metal contents in soil and crops. Environ. Pollut. 2021, 278, 116911. [Google Scholar] [CrossRef] [PubMed]
- Shamsunnahar Setu, V.S. Impacts of non-ferrous metal mining on soil heavy metal pollution and risk assessment. Sci. Total Environ. 2025, 969, 178962. [Google Scholar] [CrossRef]
- Ning, X.; He, L.; Long, S.; Wang, S. Bioavailability, migration and driving factors of As, Cd and Pb in calcareous soil amended with organic fertilizer and manganese oxidizing bacteria in arid northwest China. J. Hazard. Mater. 2025, 489, 137528. [Google Scholar] [CrossRef]
- Deng, J.; Yu, J.; Zhang, B.; Zhao, H.; Zhao, Z.; Chen, Y.; Pu, S. Source-pathway-sink analysis and health risk zoning of heavy metal groundwater pollution in karst chemical park. Environ. Pollut. 2025, 382, 126716. [Google Scholar] [CrossRef]
- He, S.; Li, P.; Su, F.; Wang, D.; Ren, X. Identification and apportionment of shallow groundwater nitrate pollution in Weining Plain, northwest China, using hydrochemical indices, nitrate stable isotopes, and the new Bayesian stable isotope mixing model (MixSIAR). Environ. Pollut. 2022, 298, 118852. [Google Scholar] [CrossRef] [PubMed]
- Zhang, Y.; Liu, Y.; Zhou, A.; Zhang, L. Identification of groundwater pollution from livestock farming using fluorescence spectroscopy coupled with multivariate statistical methods. Water Res. 2021, 206, 117754. [Google Scholar] [CrossRef] [PubMed]
- Goldrich-Middaugh, G.M.; Johnson, K.; Ma, L.; Engle, M.A.; Fleming, S.W.; Ricketts, J.W.; Sullivan, P.L. Critical zone controls on stream chemistry: Lessons from multiple machine learning methods and irregular data across large watersheds. J. Hydrol. 2025, 660, 133319. [Google Scholar] [CrossRef]
- Jin, L.; Ye, H.; Shi, Y.; Li, L.; Liu, R.; Cai, Y.; Li, J.; Li, F.; Jin, Z. Using PCA-APCS-MLR model and SIAR model combined with multiple isotopes to quantify the nitrate sources in groundwater of Zhuji, East China. Appl. Geochem. 2022, 143, 105354. [Google Scholar] [CrossRef]
- Proshad, R.; Kormoker, T.; Al, M.A.; Islam, S.; Khadka, S.; Idris, A.M. Receptor model-based source apportionment and ecological risk of metals in sediments of an urban river in Bangladesh. J. Hazard. Mater. 2022, 423, 127030. [Google Scholar] [CrossRef]
- Zhao, W.; Ma, J.; Liu, Q.; Dou, L.; Qu, Y.; Shi, H.; Sun, Y.; Chen, H.; Tian, Y.; Wu, F. Accurate Prediction of Soil Heavy Metal Pollution Using an Improved Machine Learning Method: A Case Study in the Pearl River Delta, China. Environ. Sci. Technol. 2023, 57, 17751–17761. [Google Scholar] [CrossRef]
- Diao, Z.; Ping, X.; Zhang, X.; Hui, B.; Zhu, F.; Zhang, Y.; Wang, J.; Yu, Y.; Zhang, L.; Hui, W.; et al. Seasonal characteristics, source apportionment and ecological risk assessment of priority and emerging contaminants using passive samplers in the coastal water. J. Hazard. Mater. 2025, 493, 138398. [Google Scholar] [CrossRef]
- Qu, S.; Shi, Z.; Wang, G.; Han, J. Application of multiple approaches to investigate hydraulic connection in multiple aquifers system in coalfield. J. Hydrol. 2021, 595, 125673. [Google Scholar] [CrossRef]
- Yan, Z.; Li, Z.; Li, P.; Zhao, C.; Xu, Y.; Cui, Z.; Sun, H. Hydrochemical assessments and driving forces of water resources in coal mining areas: A case study of the Changhe River Basin, Shanxi. Environ. Earth Sci. 2023, 82, 447. [Google Scholar] [CrossRef]
- Du, J.; Jia, C.; Ding, Y.; Yang, X.; Feng, K.; Wei, M. Advancing wetland groundwater pollution zoning: A novel integration of Monte Carlo health risk modeling and machine learning. J. Hazard. Mater. 2025, 494, 138412. [Google Scholar] [CrossRef]
- Cao, M.; Tang, Q.; Gai, N.; Ma, S.; Liu, J.; Wang, F. Contamination characteristics, source apportionment, and risk assessment of heavy metals and metalloids in the soil-crop-human system within the typical high geological background region of the Yangtze River Delta. J. Environ. Manag. 2025, 391, 126443. [Google Scholar] [CrossRef]
- Zhang, W.; Xin, C.; Du, W.; Yu, S. Health risk assessment of heavy metals based on source analysis and Monte Carlo in the Lijiang River Basin, China. Ecol. Indic. 2025, 176, 113620. [Google Scholar] [CrossRef]
- Kim, K.-H.; Yun, S.-T.; Yu, S.; Choi, B.-Y.; Kim, M.-J.; Lee, K.-J. Geochemical pattern recognitions of deep thermal groundwater in South Korea using self-organizing map: Identified pathways of geochemical reaction and mixing. J. Hydrol. 2020, 589, 125202. [Google Scholar] [CrossRef]
- Wang, S.; Li, G.; Ji, X.; Wang, Y.; Xu, B.; Tang, J.; Guo, C. Machine learning-driven assessment of heavy metal contamination in the impounded lakes of China’s South-to-North Water Diversion Project: Identifying spatiotemporal patterns and ecological risks. J. Hazard. Mater. 2024, 480, 135983. [Google Scholar] [CrossRef] [PubMed]
- Yan, Y.; Zhang, Y.; Sun, Z.; Xie, Z.; Yao, R.; Chen, S.; Uddin, M.G.; Pu, Y.; Yang, C.; Wang, Y.; et al. Using unsupervised machine learning and positive matrix factorization models to drive groundwater chemistry and associated health risks in a coal-mining rural region. J. Hydrol. 2025, 661, 133691. [Google Scholar] [CrossRef]
- Cui, H.; Duan, L.; Pan, H.; Liu, T. Geochemical pattern, quality and driving forces of multi-layer groundwater in a high-capacity mining area basin: A comprehensive analysis based on the interweaving of multiple factors. J. Hydrol. 2025, 660, 133376. [Google Scholar] [CrossRef]
- Zhang, K.; Li, M.; Qu, S.; Zhao, Y.; Duan, L.; Yang, X.; Li, D.; Liao, Z.; Yu, R. Spatio-seasonal variability of source contributions to water quality in a large irrigation drainage lake basin based on the entropy weighted quality index, positive matrix factorization, and isotopic tracers. Environ. Pollut. 2025, 382, 126670. [Google Scholar] [CrossRef] [PubMed]
- Chen, K.; Liu, Q.; Yang, T.; Ju, Q.; Hou, X.; Gao, W.; Jiang, S. Groundwater pollution source identification and health risk assessment in the North Anhui Plain, eastern China: Insights from positive matrix factorization and Monte Carlo simulation. Sci. Total Environ. 2023, 895, 165186. [Google Scholar] [CrossRef]
- Li, X.; Tan, H.; Luo, M.; Wu, X.; Huang, X.; Zhou, S.; Shen, L.; He, Y.; Liu, Y.; Hu, L. Exposure to firework chemicals from production factories in pregnant women and risk of preterm birth occurrence in Liuyang, China. J. Toxicol. Environ. Health 2018, 81, 154–159. [Google Scholar] [CrossRef]
- Zhou, L.; Meng, Y.; Vaghefi, S.A.; Marras, P.A.; Sui, C.; Lu, C.; Abbaspour, K.C. Uncertainty-based metal budget assessment at the watershed scale: Implications for environmental management practices. J. Hydrol. 2020, 584, 124699. [Google Scholar] [CrossRef]
- Yang, Y.; Zhou, J.; Guo, T.; Ding, H.; Liu, X. Source analysis of heavy metal pollution in farmland soil in a mining area based on a small watershed scale. J. Agro-Environ. Science. 2023, 42, 1956–1963. [Google Scholar] [CrossRef]
- Wang, L.; Guo, Z.; Xiao, X.; Chen, T.; Liao, X.; Song, J.; Wu, B. Heavy metal pollution of soils and vegetables in the midstream and downstream of the Xiangjiang River, Hunan Province. J. Geogr. Sci. 2008, 18, 353–362. [Google Scholar] [CrossRef]
- Zhang, K.; Yang, X.; Wu, Y.-J.; Wu, B.-J.; Kuang, X.-L. Pollution Characteristics and Ecological Risk Assessment of Heavy Metals in Surface Sediments in Changsha-Zhuzhou-Xiangtan Reach, Xiang Jiang River, China. J. Agric. Resour. Environ. 2015, 32, 60–65. [Google Scholar] [CrossRef]
- Zhang, K.; Peng, B.; Yang, X. Contamination and Risk of Heavy Metals in Sediments from Zhuzhou, Xiangtan and Changsha Sections of the Xiangjiang River, Hunan Province of China. Sustainability 2023, 15, 14239. [Google Scholar] [CrossRef]
- Ruan, Y.-L.; Liu, C.-S.; Wang, G.-Q.; Bao, Z.-X.; Wang, Y. Characteristics of Land Use Change and Its Relationship with Key Hydrological Factors in the Liuyang River Basin. Water Sav. Irrigation. 2024, 53–59. [Google Scholar] [CrossRef]
- Fang, M.-L.; Wang, R.; Yan, Y.-N.; Chen, S. Study on Water Footprint of Main Crop Production in Liuyang City, A Typical Agricultural Area in Central China. Resour. Environ. Yangtze Basin 2022, 31, 2308–2317. Available online: https://yangtzebasin.whlib.ac.cn/EN/10.11870/cjlyzyyhj202210018 (accessed on 18 April 2025).
- Fang, X.; Peng, B.; Wang, X.; Song, Z.; Zhou, D.; Wang, Q.; Qin, Z.; Tan, C. Distribution, contamination and source identification of heavy metals in bed sediments from the lower reaches of the Xiangjiang River in Hunan province, China. Sci. Total Environ. 2019, 689, 557–570. [Google Scholar] [CrossRef] [PubMed]
- Kohonen, T. Essentials of the self-organizing map. Neural Networks. 2013, 37, 52–65. [Google Scholar] [CrossRef] [PubMed]
- Licen, S.; Astel, A.; Tsakovski, S. Self-organizing map algorithm for assessing spatial and temporal patterns of pollutants in environmental compartments: A review. Sci. Total Environ. 2023, 878, 163084. [Google Scholar] [CrossRef]
- Melo, D.S.; Gontijo, E.S.J.; Frascareli, D.; Simonetti, V.C.; Machado, L.S.; Barth, J.A.C.; Moschini-Carlos, V.; Pompêo, M.L.; Rosa, A.H.; Friese, K. Self-Organizing Maps for Evaluation of Biogeochemical Processes and Temporal Variations in Water Quality of Subtropical Reservoirs. Water Resour. Res. 2019, 55, 10268–10281. [Google Scholar] [CrossRef]
- Wang, Z.; Xiao, J.; Wang, L.; Liang, T.; Guo, Q.; Guan, Y.; Rinklebe, J. Elucidating the differentiation of soil heavy metals under different land uses with geographically weighted regression and self-organizing map. Environ. Pollut. 2020, 260, 114065. [Google Scholar] [CrossRef] [PubMed]
- Wang, Y.; Li, Y.; Yang, S.; Liu, J.; Zheng, W.; Xu, J.; Cai, H.; Liu, X. Source apportionment of soil heavy metals: A new quantitative framework coupling receptor model and stable isotopic ratios. Environ. Pollut. 2022, 314, 120291. [Google Scholar] [CrossRef]
- Mao, H.; Wang, G.; Liao, F.; Shi, Z.; Zhang, H.; Chen, X.; Qiao, Z.; Li, B.; Bai, Y. Spatial variability of source contributions to nitrate in regional groundwater based on the positive matrix factorization and Bayesian model. J. Hazard. Mater. 2023, 445, 130569. [Google Scholar] [CrossRef]
- Jahandari, A.; Abbasnejad, B. Environmental pollution status and health risk assessment of selective heavy metal(oid)s in Iran’s agricultural soils: A review. J. Geochem. Explor. 2024, 256, 107330. [Google Scholar] [CrossRef]
- Meng, F.; Liu, D.; Bu, T.; Zhang, M.; Peng, J.; Ma, J. Assessment of pollution and health risks from exposure to heavy metals in soil, wheat grains, drinking water, and atmospheric particulate matter. J. Environ. Manag. 2025, 376, 124448. [Google Scholar] [CrossRef] [PubMed]
- Erickson, B.E. US EPA to reassess health risks of glyphosate. Chem. Eng. News 2022, 100, 15. [Google Scholar] [CrossRef]
- Liu, G.; Shi, Y.; Guo, G.; Zhao, L.; Niu, J.; Zhang, C. Soil pollution characteristics and systemic environmental risk assessment of a large-scale arsenic slag contaminated site. J. Clean. Prod. 2020, 251, 119721. [Google Scholar] [CrossRef]
- Müller, G. Index of geoaccumulation in sediments of the Rhine River. GeoJournal 1969, 2, 108–118. [Google Scholar]
- Liu, J.; Wang, J.; Xiao, T.; Bao, Z.A.; Lippold, H.; Luo, X.; Yin, M.; Ren, J.; Chen, Y.; Linghu, W. Geochemical dispersal of thallium and accompanying metals in sediment profiles from a smelter-impacted area in South China. Appl. Geochem. 2018, 88, 239–246. [Google Scholar] [CrossRef]
- Dai, L.; Wang, L.; Li, L.; Liang, T.; Zhang, Y.; Ma, C.; Xing, B. Multivariate geostatistical analysis and source identification of heavy metals in the sediment of Poyang Lake in China. Sci. Total Environ. 2018, 621, 1433–1444. [Google Scholar] [CrossRef]
- Aftab, A.; Aziz, R.; Ghaffar, A.; Rafiq, M.T.; Feng, Y.; Saqib, Z.; Rafiq, M.K.; Awan, M.A. Occurrence, source identification and ecological risk assessment of heavy metals in water and sediments of Uchalli lake—Ramsar site, Pakistan. Environ. Pollut. 2023, 334, 122117. [Google Scholar] [CrossRef]
- Guo, G.; Li, K.; Zhang, D.; Lei, M. Quantitative source apportionment and associated driving factor identification for soil potential toxicity elements via combining receptor models, SOM, and geo-detector method. Sci. Total Environ. 2022, 830, 154721. [Google Scholar] [CrossRef]
- Haselbeck, V.; Kordilla, J.; Krause, F.; Sauter, M. Self-organizing maps for the identification of groundwater salinity sources based on hydrochemical data(Article). J. Hydrol. 2019, 576, 610–619. [Google Scholar] [CrossRef]
- Zhang, J.; Liu, Z.; Tian, B.; Li, J.; Luo, J.; Wang, X.; Ai, S.; Wang, X. Assessment of soil heavy metal pollution in provinces of China based on different soil types: From normalization to soil quality criteria and ecological risk assessment. J. Hazard. Mater. 2023, 441, 129891. [Google Scholar] [CrossRef] [PubMed]
- Liu, Z.; Zheng, K.; Bao, S.; Cui, Y.; Yuan, Y.; Ge, C.; Zhang, Y. Estimating the spatiotemporal distribution of PM2.5 concentrations in Tianjin during the Chinese Spring Festival: Impact of fireworks ban. Environ. Pollut. 2024, 361, 124899. [Google Scholar] [CrossRef]
- ten Brink, H.; Otjes, R.; Weijers, E. Extreme levels and chemistry of PM from the consumer fireworks in the Netherlands. Energy-Res. Cent. Netherlands. Atmos. Environ. 2019, 212, 36–40. [Google Scholar] [CrossRef]
- Kumar, R.R.; Sahu, S.; Agharwal, J.R. Biosorption of cadmium (II) ions by the cadmium tolerant bacteria isolated from the chemical exposed soil of fireworks industry(Article). J. Pure Appl. Microbiol. 2012, 6, 781–787. [Google Scholar]
- Shen, H.; An, R.; Shi, H.; Liu, X.; Zhang, A. Heavy Metal Pollution and Influencing Factors of Agricultural Land in a Typical Watershed in Hunan Province. Res. Environ. Sci. 2021, 34, 715–724. [Google Scholar] [CrossRef]
- Wang, F.; Wang, X.; Liu, D.; Liu, H. Comprehensive safety risk evaluation of fireworks production enterprises using the frequency-based ANP and BPNN. Heliyon 2023, 9, e21724. [Google Scholar] [CrossRef]
- Cao, J.; Xie, C.-Y.; Hou, Z.-R. Spatiotemporal distribution patterns and risk characteristics of heavy metal pollutants in the soil of lead–zinc mines. Environ. Sci. Eur. 2022, 34, 1–14. [Google Scholar] [CrossRef]
- Ding, H.; Liu, J.; Liu, Q.; Guo, L.; Hang, Q.; Zhang, Y.; Jia, J.; Tao, T.; Liu, Q.; Ding, C. Risk assessment and source tracing of heavy metals in major rice-producing provinces of Yangtze River Basin. J. Hazard. Mater. 2024, 480, 136206. [Google Scholar] [CrossRef] [PubMed]
- Bateman, P.W.; Gilson, L.N.; Bradshaw, P. Not just a flash in the pan: Short and long term impacts of fireworks on the environment. Pac. Conserv. Biol. 2023, 29, 396–401. [Google Scholar] [CrossRef]


Disclaimer/Publisher’s Note: The statements, opinions and data contained in all publications are solely those of the individual author(s) and contributor(s) and not of MDPI and/or the editor(s). MDPI and/or the editor(s) disclaim responsibility for any injury to people or property resulting from any ideas, methods, instructions or products referred to in the content. |
© 2025 by the authors. Licensee MDPI, Basel, Switzerland. This article is an open access article distributed under the terms and conditions of the Creative Commons Attribution (CC BY) license (https://creativecommons.org/licenses/by/4.0/).