Abstract
Cooking liquor (CL) from marine species processing has been reported to include a wide range of valuable constituents. In this study, the chemical composition of CL from octopus (Octopus vulgaris) processing, with and without a filtration process, was analysed. Regarding non-filtered CL, values of 15.30, 0.29, 8.85 and 174.53 g·L−1 CL for protein, lipids, ash, and total volatile base-nitrogen (TVB-N), respectively, were detected. The most abundant fatty acids (FAs) (g·100 g−1 total FAs) were C16:0 (37.8), C18:0 (20.8), and C22:6ω3 (13.4). Values of 0.40 and 2.10 were obtained for polyunsaturated FA/saturated FA and ω3 FA/ω6 FA ratios. Macroelement content varied from 0.036 (Ca) to 1.81 (Na) g·L−1 CL. For microelements, values ranged between 0.0015 (Co) and 1.95 (As) mg·L−1 CL. Industrial filtration of CL led to decreased values of protein, lipid, ash, TVB-N, and C22:5ω3; in contrast, an increased presence of C14:0, C18:1ω9, C20:1ω9, and C22:1ω9 was detected. Filtration led to a ca. 50% decrease in macroelement presence. For microelements, this process led to losses of 20–40% (Ba, Pb), 40–60% (As, Fe, Mn), 60–70% (Co, Zn), and 84% (Cd). This study provides a first comprehensive characterisation of octopus cooking liquor as a potential source of bioactive compounds.
1. Introduction
Seafood is known to be rich in highly valuable protein (i.e., essential amino acids) and lipid (i.e., ω3 fatty acids, FAs, and lipophilic vitamins) constituents [1,2]. Furthermore, as living in a mineral-rich medium, marine organisms accumulate macro- and microelements from the diet and the marine medium and incorporate them in their tissues and organs [3,4]. However, as a consequence of marine species processing, the seafood industry gives rise to a great quantity of discards and waste substrates that include many nutritional and healthy constituents (proteins, lipids, vitamins, and minerals) [5,6]. Consequently, great attention is accorded nowadays to their recovery, taking into account commitments for circular economy, environmental sustainability and for being used in pharmaceutical and nutraceutical industries [7,8].
Among undervalued seafood by-products, wastewaters generated by processing have also been reported to include valuable constituents [9,10]. However, wastewater resulting from seafood processing is considered an important source of pollution due to its high organic matter content and potential pathogen presence. Treating this wastewater is considered crucial to prevent environmental damage and protect public health. Therefore, a wide range of physico-chemical [11,12] and biological [13,14] processing strategies have been developed in order to remove inconvenient constituents from wastewater and provide a sustainable recovery of valuable biomolecules.
Octopus species constitute a popular seafood that is commonly commercialised in a wide range of products [15,16]. Notably, octopus species represent nutritional seafood, including highly nutritious and medicinal products [17,18,19]. However, octopus processing gives rise to a wide range of by-products, including nutritional and functional values, which constitute a promising possibility for the use and integrated exploitation of bioactive molecules [20,21]. Among octopus processing by-products, cooking liquor (CL) or juice has acquired the interest of technologists and nutritionists. Thus, previous research regarding this abundant valueless by-product accounts for the extraction of some valuable constituents such as proteins, polyphenols [22] and peptone [23]. Meantime, an antihypertensive behaviour [24] and antioxidant properties in in vitro [25] and seafood [26,27] systems have been reported. However, an integrative study focused on the chemical composition of octopus CL has not been conducted up to now. Contrary to this, and based on the commercial interest of tuna canning, great efforts for employing wastewaters from seafood processing have been addressed to tuna canning juices [28,29,30].
Therefore, the present study focused on the possible recovery and subsequent use of the liquor waste substrate resulting from octopus (Octopus vulgaris) cooking. For it, proximate composition, the fatty acid (FA) profile, and levels of phospholipids (PLs), volatile amines, and minerals (macro- and microelements) present in the octopus CL were determined. Special attention was accorded to biomolecules that can be employed in nutraceutical and pharmaceutical industries [31,32,33]. Additionally, the effect of an industrial filtration procedure for partial elimination of chemical compounds from the CL was analysed. Different kinds of treatments have been described for wastewaters resulting from seafood processing [34,35,36] according to EU policies regarding the current circular economy [37,38]. In such studies, the effect on physical properties and inorganic chemical components has been addressed. On the contrary, previous research regarding the effect on bioactive molecules such as PLs, ω3 FAs, tocopherols, and proteins can be considered negligible.
2. Materials and Methods
2.1. Octopus, Cooking, Filtration and CLs
Commercial octopus CL (filtered and non-filtered) was facilitated by Frigoríficos Rosa de los Vientos S. L. (Marín, Pontevedra, Spain).
Octopus specimens were obtained near the Galician Atlantic coast (NW Spain). Once in the factory, non-edible parts were excised. Then, mantle and arms were subjected to the cooking process (ca. 98 °C). Part of the resulting cooking water was taken and considered as non-filtered CL. On the other side, part of the resulting cooking water was subjected to the filtration process. For this, a 1 mm thickness single-layer stainless steel filter was employed. The resulting liquor was taken and considered as filtered CL. Both CLs were placed in vacuum-sealed bottles protected from light, transported to our laboratory and kept refrigerated (4 °C) before being employed.
The study was carried out in triplicate (n = 3). For this, three different samples of each kind of CL were analysed independently. In the present study, filtration was chosen as wastewater treatment in agreement with its everyday use in industry as being convenient, practical, and low-cost.
2.2. Proximate Composition Analysis
Moisture value was assessed as the weight difference in both CLs (1–2 mL) before and after 4 h at 105 °C [39]. Results were expressed as g water·L−1 CL.
The lipid fraction was extracted from both CLs according to the Bligh and Dyer [40] method; this method employs a single-phase solubilisation of lipids using a chloroform-methanol (1:1) mixture. For quantitative purposes, the Herbes and Allen [41] procedure was applied. Results were calculated as g·L−1 CL. Throughout the study, lipid extracts were stored under a nitrogen atmosphere at −40 °C.
Protein content in both CLs was determined by employing the Kjeldahl method [39] with a conversion factor of 6.25. Results were calculated as g protein·L−1 CL.
Ash content was measured in both CLs according to the AOAC [39] method by heating the CL at 550 °C. Results were calculated as g ash·L−1 CL.
2.3. PL and Total Volatile Base-Nitrogen (TVB-N) Values
PLs were quantified by measuring the organic phosphorus in the total lipid extracts according to the Raheja et al. [42] method, which is based on a complex formation with ammonium molybdate. For quantitative purposes, different quantities (0, 5, 10, 20, 40, 60, 80, 100, 130, and 150 μL) of a 1,2-dipalmitoyl-rac-glycero-3-phosphocholine (DPPC) solution in chloroform (15.3 mg/5 mL) were employed as a standard. The validity range was 16.1–483.0 μg DPPC, and the R2 value of the analytical procedure was 0.9995. Results were calculated as g PLs·kg−1 lipids.
Total volatile base-nitrogen (TVB-N) content in both CLs was determined according to the Aubourg et al. [43] procedure. For it, CL was diluted and basified with 20% NaOH and titrated with 10 mM HCl. Results were calculated as mg TVB-N·L−1 CL.
2.4. Analysis of the FA Profile
In order to obtain the fatty acid methyl esters (FAMEs) from both CLs, lipid extracts were methylated and transmethylated by employing acetyl chloride in methanol. Then, an established procedure was employed for the Gas–Liquid chromatography analysis (Perkin-Elmer 8700 chromatograph, Madrid, Spain) [44]. Thus, a fused silica capillary column SP-2330 (0.25 mm i.d. × 30 m, Supelco, Inc., Bellefonte, PA, USA) was used, the temperature programme being as follows: increased from 145 to 190 °C at 1.0 °C·min−1 and from 190 °C to 210 °C at 5.0 °C·min−1; held for 13.5 min at 210 °C. Nitrogen at 10 psig was employed as carrier gas, detection being performed with a flame ionisation detector at 250 °C. A programmed temperature vaporiser injector was used in the split mode (150:1), being heated from 45 to 275 °C at 15 °C·min−1.
For the qualitative analysis, peaks obtained were identified by comparison to the retention times of standard mixtures (Qualmix Fish, Larodan, Malmo, Sweden; FAME Mix, Supelco, Inc., Bellefonte, PA, USA). Automatic integration of peak areas was carried out, C19:0 FA being employed as an internal standard for quantitative purposes. Content of each FA was expressed as g·100 g−1 total FAs. Individual FA values were employed to calculate values (g·100 g−1 total FAs) corresponding to FA groups (saturated FAs, STFAs; monounsaturated FAs, MUFAs; polyunsaturated FAs, PUFAs; total ω3 FAs and total ω6 FAs) and ratios (PUFAs/STFAs; total ω3 FAs/total ω6 FAs).
2.5. Analysis of Macro- and Microelements
The presence of six macroelements (Ca, K, Mg, Na, P, and S) and nine microelements (As, Ba, Cd, Co, Cu, Fe, Mn, Pb, and Zn) was assessed in the CL substrates according to a procedure based on US-EPA 3050B [45] and in agreement with previous research [46]. About 1.5–2.0 g of liquid sample was introduced in a Teflon digestion flask with 4 mL of 69% nitric acid (TMA) Hiperpur and 4 mL of H2O2 (for ultra-trace analysis). CL substrates plus six blanks and six certified reference materials (0.30–0.35 g) were digested in a microwave oven (Mars-Xpress CEM Corp., Matthews, NC, USA). Once the digestion was completed, solutions were transferred to 50 mL flasks, the volume being filled with Milli-Q water. A clean ISO 5 laminar flow cabinet (Cruma 670 FL, Barcelona, Spain) was used for sample handling. The determination of macro- and microelement concentrations in digested samples was carried out using a 7900 Agilent ICP-MS operated in the He mode for all elements except for Cd, Ba and Pb (no-gas/standard mode was used). For the ICP-MS determination, an inert sample introduction system was used.
The analytical assessment was carried out using external calibration with a multi-elemental standard. In order to correct for instrumental drift and matrix effects, Ge, Rh and Ir were employed as internal standards. Blanks (1 per 10 samples) were prepared by employing the above-described digestion procedure; therefore, results presented here are blank-corrected and always accounted for <1% of element concentrations in the samples. Accuracy of the analytical procedures was ensured using DORM-5 (Fish Protein Certified Reference Material) from NRC (National Research Council Canada), which was digested and analysed in the same batch as the samples, showing good recovery percentage with the certified concentrations (Table 1). The limits of detection, expressed as 3·SD-blank, are shown in Table 1. Quantification results are expressed as g·L−1 CL (macroelements) and mg·L−1 CL (microelements).

Table 1.
Recovery percentage of certified reference material (DORM-5, NRC) and limit of detection (LOD) of the analytical procedures for the assessment of macro- and microelements *.
2.6. Statistical Analysis
Data (n = 3) obtained from the different chemical analyses from both CLs were subjected to one-way ANOVA to investigate differences resulting from the filtration process (Statistica version 6.0, 2001; Statsoft Inc., Tulsa, OK, USA) and differences among the FA groups. Comparison of means was carried out by using a least-squares difference (LSD) method. Differences were considered significant for a confidence interval at the 95% level (p < 0.05).
3. Results and Discussion
3.1. Proximate Composition
Proximate composition of CLs is depicted in Table 2. Values of ca. 974.37, 15.30, 0.29, and 8.85 g·L−1 CL were detected in non-filtered CL for moisture, proteins, lipids, and ash, respectively. As a result of the filtration process, the content of proteins, lipids, and ash in the CL depicted a remarkable decrease (p < 0.05); in contrast, the moisture value showed an increase (p < 0.05). According to range values described previously for edible [47] and non-edible [5,7] marine substrates, values found for protein contents in both CLs are found convenient for a sustainable recovery with different functional uses such as peptone [23] and antioxidant compound [30,48] production from enzymatic hydrolysates, and functional and nutraceutical applications in general [31,32,33].
Table 2.
Proximate composition (g·L−1 cooking liquor) and phospholipid (PL; g·kg−1 lipids) and total volatile base-nitrogen (TVB-N; mg·L−1 cooking liquor) values in filtered and non-filtered cooking liquor *.
Previous research accounts for the proximate analysis of octopus cooking drips. Thus, Soto et al. [49] detected lower values for the protein content (i.e., 10.70 g·L−1) than in the present case. Contrary to the current study, higher values than in the current study were obtained by Oh et al. [24] for proteins, lipids and ash (7.4, 0.7, and 4.9 g·100 mL−1, respectively) in octopus dripping as a result of cooking; accordingly, moisture levels (86.2 g·100 mL−1) were found lower than in the present work. Recently, lower protein and higher lipid values were detected by Méndez et al. [50] in CL resulting from octopus cooking (8.2 and 1.9 g·L−1, respectively).
Previous studies account for the proximate composition of cooking drips resulting from the processing of other marine invertebrate species. Thus, Soto et al. [49] detected values (g·L−1) of 3.25 and 11.12 for proteins and carbohydrates, respectively, in mussel wastewater resulting from the cooking process. Wastewater obtained from oyster canning depicted a proximate composition of 80.2, 6.8, 0.6, and 10.4 (g·100 mL−1) for moisture, proteins, lipids, and ash, respectively [24]. Furthermore, cooking drips from shrimp (Penaueus vannamei) processing revealed values of 3.09, 3.93, and 0.73 (g·L−1) for proteins, ash, and total carbohydrates, respectively [51].
Regarding fish species, Ahn and Kim [28] indicated values of 93.2, 4.0, not detected, and 2.1 g·100 mL−1 (moisture, proteins, lipids, and ash, respectively) in cooking wastewater obtained from skipjack tuna. For the same fish species, values of 71.8, 18.2, 0.6, and 8.7 g·100 mL−1 were detected for moisture, proteins, lipids, and ash, respectively [24]. Bechtel [52] analysed the proximate composition of wastewater resulting from pollock/cod and salmon processing; as a result, freeze-dried wastewater revealed values (g·100 g−1) of 70.5–86.2 and 82.1 (proteins), 2.6–18.4 and 1.8 (lipids), 9.9–13.9 and 10.6 (ash), and 3.4–4.7 and 5.8 (moisture), respectively. Recently, fishery effluents from crinude sardine (Opisthonema libertate) and tuna (Thunnus albacares) cooking showed values (% dry weight) of 47.9 and 56.5 (proteins), 3.3 and 1.0 (lipids), and 48.8 and 42.5 (ash), respectively [53].
To the best of our knowledge, no previous research accounts for the effect of a filtration process on the proximate composition of octopus CL. However, data regarding other marine invertebrate species have been described. Kim et al. [22] compared the composition of wastewater resulting from oyster processing (harvesting, cleaning, and boiling) to that of a hot-water oyster extract. Thus, wastewater resulting from processing showed lower moisture values but higher protein and ash presence; however, no effect was detected for lipid and glycogen values. On the contrary, the use of ultrafiltration led to an increased presence (g·100 g−1) of proteins (from 0.094 to 0.301) and ash (from 0.06 to 0.11) in shrimp wastewater [54]. Recently, wastewater resulting from shrimp processing was subjected to an ultrafiltration-diafiltration process [12]; as a result of this combined process, a content decrease (g·100 g−1) of ash (from 0.38 to 0.32) and crude protein (from 1.69 to 1.48) was observed.
3.2. Determination of PL and TVB-N Values
The study of the PL presence in the CL was considered important as this lipid group is present in cell membranes and plays decisive roles in living bodies. Additionally, recent studies have described PL molecules as better vectors of ω3 PUFA compounds than other lipid classes like triacylglycerols, methyl esters or waxes so that nutritional and pharmaceutical industries have accorded great attention to their extraction from natural sources [55,56].
Table 2 indicates values obtained in the present work for PLs in both CLs. Unfortunately, both in filtered and non-filtered CLs, no PL presence could be detected in the corresponding lipid fraction (see limit of methodological sensitivity in the Materials and Methods section). No previous studies have analysed or described the presence of PL compounds in wastewater resulting from the cooking of octopus or any other marine species. As an explanation for the current absence, it could be argued that PL compounds include highly unsaturated fatty acids, which are highly susceptible to being oxidised and/or hydrolysed during the heating treatment [44,57].
Food proteins are reported to be damaged during marine species processing as a result of different damage pathways (i.e., activity of spoilage bacteria and endogenous enzymes and thermal degradation), leading to the formation of a wide variety of nitrogen-containing volatile amine compounds. The presence of such volatile compounds has proved a straight relationship with stability and sensory acceptability (i.e., odour) of the corresponding substrate [43,58,59]. As a thermal treatment is concerned in the present case (i.e., octopus cooking), most formation of volatile amine compounds would be expected to be produced by thermal breakdown [60,61]. In order to assess the content of such amine compounds, the TVB-N index has been found highly valuable [58]. According to this interest, this index was studied in the present work. Thus, Table 2 indicates that non-filtered CL showed a 174.53 mg·L−1 value. Furthermore, a notable decrease (p < 0.05) of the TVB-N presence could be observed as a result of the filtration process. Notably, values detected in both kinds of CLs remain below the acceptability limit (i.e., 35 mg TVB-N·100 g−1 sample) reported for fishery species [60].
Previous related research has been focused on the evaluation of the ammonia-nitrogen value of cooking drips resulting from marine species processing. The concentration of nitrogen in wastewater resulting from marine species processing has been reported to vary based on the type and amount of species processed [61]. High ammonia concentrations are often observed due to the high protein content of marine species (i.e., 15–20 g·100 g−1 wet tissue), but also because of the high blood and slime content in wastewater drips. Therefore, large values for total soluble-nitrogen (21–471 mg nitrogen·L−1) and ammonia-nitrogen (3.2–1059 mg ammonia·L−1) have been described [9].
Regarding invertebrate marine species, Kim et al. [62] compared the composition of wastewater resulting from oyster processing (harvesting, cleaning, and boiling) to that of a hot-water oyster extract. As a result, wastewater resulting from processing showed higher levels of TVB-N (from 5.2 to 6.9 mg·100 mL−1), trimethylamine (from 15.6 to 40.4 mg·100 mL−1), free amino acids (from 762.2 to 1173.0 mg·100 mL−1), and peptides (from 94.1 to 1059 mg·100 mL−1). In the case of prawn processing water, a seasonal study (January–June) indicated a value range of 26–52 ammonia-nitrogen·L−1 [63].
Regarding fish species, Prasertsan et al. [64] detected values of 703 mg ammonia-nitrogen·L−1 in tuna wastewater as a result of the cooking process; notably, such values decreased to 41 mg·L−1 in waters resulting from the canning process. During a biodegradability study, Veiga et al. [65] indicated a 0.2 g ammonia-nitrogen·L−1 value for ammonia-nitrogen in wastewater corresponding to tuna cooking. Also, for liquid effluents from tuna processing, wastewater showed values of 0.44 (g ammonia-nitrogen·L−1) [29].
A great attention has been accorded to the presence of peptide compounds in the CL resulting from marine species processing. Based on in vitro assays (i.e., Rancimat, DPPH, or ABTS), an antioxidant behaviour was detected in octopus [24,25] and tuna [30,48] cooking drips; this preservative effect was justified by the presence of several free amino acids and peptides. Recently, the use of CL from octopus processing demonstrated an inhibitory effect on lipid oxidation development when included in the coating medium of canned horse mackerel (Trachurus trachurus) [27] and Chub mackerel (Scomber colias) [26] as well as when present in the glazing medium employed for the frozen storage of horse mackerel (T. trachurus) [66].
3.3. Analysis of the FA Profile
The FA composition of filtered and non-filtered CLs is indicated in Table 3. According to the general composition of marine substrates [47,67], both liquors under study were composed of a great diversity of individual FAs. As major FAs (over 13 g·100 g−1 total FAs each), C16:0, C18:0, and C22:6ω3 (docosahexaenoic acid, DHA) can be mentioned in non-filtered CL. Additionally, a lower presence (4.0–5.2 g·100 g−1 total FA range) was observed for C22:4ω6, C14:0, C22:5ω3 (eicosapentaenoic acid, EPA), and C20:4ω6. As a result of the filtration process, modification of the relative content of some FAs could be concluded. Thus, an increased (p < 0.05) presence of C14:0, C18:1ω9, C18:2ω6, and C24:1ω9 was observed. Contrarily, a content decrease in C22:5ω3 (docosapentaenoic acid, DPA) was detected. Additionally, average values of C22:6ω3 and C20:4ω6 showed a decrease after the filtration process.
Table 3.
Fatty acid (FA) composition (g·100 g−1 total FAs) in filtered and non-filtered cooking liquor *.
Changes produced as a result of the filtration process can be explained based on adsorption to the filter surface. However, a definite effect of filtration on the unsaturation degree could not be concluded in the present study. In order to better analyse the effect of filtration on the FA profile, knowledge of the FA composition of the different lipid classes would be necessary.
Regarding the FA groups, the STFA one showed to be the most abundant both in filtered and non-filtered CLs (Figure 1). Additionally, a higher (p < 0.05) presence of PUFAs than MUFAs was observed. As a consequence of the filtration process, a relative increase (p < 0.05) of the MUFA value was detected (Figure 1). On the contrary, such a process led to decreased average values for STFA and PUFA values in the filtered CL.
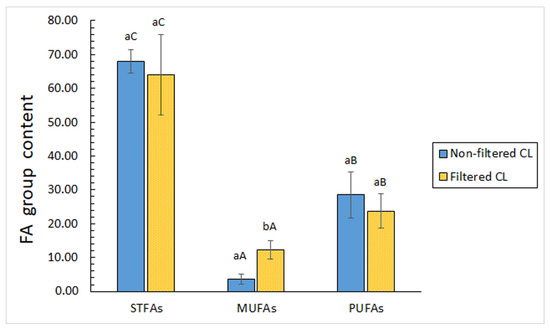
Figure 1.
Assessment of the fatty acid (FA) group content (g·100 g−1 total FAs) in filtered and non-filtered cooking liquor. Abbreviations: STFAs (saturated FAs), MUFAs (monounsaturated FAs), and PUFAs (polyunsaturated FAs). Mean values of three replicates (n = 3); standard deviations are expressed by bars. Different lowercase letters indicate significant differences (p < 0.05) as a result of filtration; different capital letters indicate significant differences (p < 0.05) among FA groups.
Recently, a great interest has been accorded to some FA ratios. Regarding the lipid oxidation assessment, the PUFA/STFA ratio has provided complementary information on the development of this deteriorative mechanism [68,69]. Notably, this ratio can provide knowledge on the possible variation in the PUFA content (notably both ω3 FA and ω6 FA series) resulting from marine species processing, in general, and has been reported to be directly related to the nutritional value. In the current work, Figure 2 shows values obtained for the PUFA/STFA ratio. Thus, a 0.42 score was detected in non-filtered CL, which did not undergo differences (p > 0.05) after the filtration process (ca. 0.40 score). This rancidity stability can be considered a positive behaviour in order to subsequent industrial implementation.
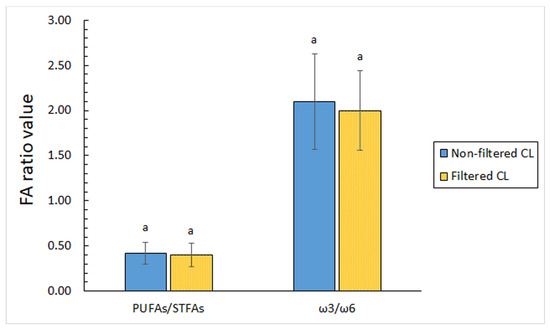
Figure 2.
Determination of fatty acid (FA) ratios in filtered and non-filtered cooking liquor. Abbreviations: STFAs (saturated FAs) and PUFAs (polyunsaturated FAs). Mean values of three replicates (n = 3); standard deviations are expressed by bars. Different lowercase letters indicate significant differences (p < 0.05) as a result of filtration.
Concerning PUFA series (i.e., ω3 FAs and ω6 FAs), great attention has recently been accorded to the ω3/ω6 ratio. In order to prevent different kinds of disorders (i.e., inflammatory, cardiovascular, and neurological), the World Health Organisation currently recommends that this ratio should be higher than 0.1 in the human diet [70]; furthermore, the European Nutritional Society indicated that a human diet with an ω3/ω6 ratio of 5 or higher would have positive effects on health [71].
In the current study, a small decrease in the average ω3/ω6 ratio value was observed after the filtration process (from ca. 2.1 to 2.0); nevertheless, differences were not significant (p > 0.05). It is worth pointing out that values included in the 2.0–2.1 range can be considered highly valuable for the human diet. Consequently, and in agreement with recommended values, the lipid composition of both kinds of CLs can be considered as highly valuable from a healthy point of view. Therefore, a sustainable recovery of ω3 FAs (namely, DHA, EPA, and DPA) and PUFAs, in general, from the current by-product is found convenient.
No previous studies have been reported regarding the FA composition of liquor resulting from octopus cooking or any other processing. Present results can be considered highly valuable regarding different nutraceutical applications, such as fortification of livestock, feed and infant formula [31,32,33]. Previous research has been mostly focused on the FA profile of octopus edible tissues, and scarce information has been provided regarding other kinds of octopus by-products. Thus, Sieiro et al. [72] proved that PUFAs were the most abundant FA group in ovary (49–56 g·100 g−1 total FA range) and hepatopancreas (45–52 g·100 g−1 total FA range) during a seasonal study; remarkably, ω3/ω6 ratio values of 4.2–9.1 and 5.0–9.1 ranges were detected, respectively, for both tissues. Recently, whole by-products obtained from octopus processing showed values of 3.26 and 1.66 for ω3/ω6 and PUFA/STFA ratios, respectively [50]; additionally, a high presence of DHA and EPA (ca. 22 and 14 g·100 g−1 total FAs, respectively) was reported in such study.
3.4. Determination of Macro- and Microelement Content
Values detected for the presence of macroelements are indicated in Table 4. For non-filtered CL, Na was found to be the most abundant, followed by S and K. Contrary, Ca revealed the lowest value. As a consequence of the filtration process, a general content decrease (p < 0.05) was observed in macroelements. In all cases, a ca. 50 ± 4% decrease could be observed.
Table 4.
Concentration of macroelements (g·L−1 cooking liquor) filtered and non-filtered cooking liquor *.
Regarding the macroelement presence, previous research has described the ion quotient ratio as a highly valuable dietary and healthy index [73]. This value can be calculated as the following concentration (moles) ratio: ([Ca+2] + [Na+])/([Mg+2] + [K+]). Values obtained for filtered and non-filtered CLs were 2.88 and 2.72, respectively. Therefore, values can be considered as valuable and not negative for maintaining the recommended quotient ratio (namely, 2.5–4.0) and maintaining a good health state regarding the development of hypertension, preeclampsia, and heart diseases [74,75].
For the current microelement composition (Table 5), As, followed by Zn, was found to be the most abundant one in the non-filtered CL. Contrary to Co, Pb, and Ba, which provided the lowest values. As a consequence of the filtration process, a general decrease in the average value was observed. Except for Cu, such a decrease was significant (p < 0.05) in all microelements.
Table 5.
Concentrations of microelements (mg·L−1 cooking liquor) in filtered and non-filtered cooking liquor *.
The mineral presence in cooking drips from octopus processing was previously studied by Oh et al. [24]. As a result, lower values (ppm) than in the present case were obtained for Ca (18.5), P (99.8), Mg (48.3), K (220.7), Fe (0.6), and Zn (0.9); notably, Pb and Cd were not detected in this study. Cooking drips obtained from skipjack tuna and oyster depicted values (ppm) of 31.4 and 47.9 (Ca), 296.9 and 226.3 (P), 55.4 and 53.3 (Mg), and 546.4 and 393.3 (K), respectively [24]; for microelements, concentrations (ppm) of 1.0 and 2.7 (Fe), and 2.6 and 1.5 (Zn) were detected, respectively, for CLs corresponding to both marine species. In the case of cooking wastewater from industrial manufacturing of shrimp (Penaeus vannamei), Rodríguez Amado et al. [51] found values of 0.05, 74.5, 375.1, 36.98, and 1.30 mg·L−1 for Ba, Ca, K, Mg, and Na, respectively. Bechtel [52] analysed the element composition of wastewater resulting from pollock/cod and salmon heat processing; as a result, freeze-dried wastewater revealed values (% dry basis) of 0.62–0.82 and 1.17 (P), 1.74–2.79 and 2.16 (K), 0.03–0.04 and 0.09 (Ca), and 0.10–0.11 and 0.14 (Mg), respectively.
Present results on essential macro- and microelement contents can be considered highly valuable regarding different functional and nutraceutical uses, such as incorporation into diet supplements focused on reinforcing different kinds of human feeds [31,32,33]. In order to identify the sustainability potential of mineral recovery, previous studies focused on assessing the kind of molecular elements that would be necessary, so that a subsequent use of advanced and traditional extraction technologies can be applied [76,77,78].
No previous data are available with respect to the effect of a filtration process on the mineral composition of octopus liquor resulting from cooking or any other technological process. However, information regarding other marine invertebrate species is available. Kim et al. [62] compared the composition of wastewater resulting from oyster processing (harvesting, cleaning, and boiling) to that of a hot-water oyster extract. Thus, wastewater resulting from oyster processing showed higher values of macroelements (K, Ca, and Mg) and microelements (Cu and Zn), while no effect could be observed for Cd, Pb, Cr, Hg, and Fe values. Shrimp wastewater ultrafiltration led to the following general increase in element values (mg·kg−1) [54]: Na (from 111 to 177), K (from 155 to 274), Mg (from 8 to 20), Ca (from 23 to 55), P (from 47 to 105), Mn (from 0.04 to 0.06), Fe (from 0.05 to 0.23), Zn (from 0.1 to 0.5), Cu (from 0.6 to 1.5), and Se (from 0.05 to 0.16).
The presence of minerals in cephalopod tissues and marine species, in general, can be influenced by a wide number of factors such as biological and seasonal differences, environmental conditions, and nourishment source [3,4,79]. Most of such elements are considered necessary for biological processes; among trace elements analysed in the current study, Cu, Mn, and Zn are reported to be present in enzymes which protect cells against oxidant stress and consequently may be taken into account as biological antioxidants [80,81]. In the present study, both for filtered and non-filtered CLs, valuable levels have been detected according to other kinds of marine substrates [2,47,81]. Consequently, a sustainable recovery of essential macro- and microelements from present CLs, notably for the non-filtered substrate, is recommended.
The presence of toxic elements has been reported to lead to certain health risks in commercial seafood [80,81]. Thus, the European Commission regulation EU 2023/915 of Commission 25 April 2023 established maximum levels for some contaminants in foodstuffs, which for Pb were 0.3 (eviscerated cephalopod) and 0.50 (crustaceans) mg·kg−1 and for Cd were 1.0 mg·kg−1 (eviscerated cephalopod), 0.50 (crustaceans), and 0.10 (muscle meat fish) [82]. Additionally, the EFSA established the tolerable weekly intake for Cd of 2.5 mg/week/kg of body weight [83]. Concerning the As value, a differentiation was not made between toxic (inorganic) and less-toxic (organic) As in the present study, as both were determined altogether. Notably, the WHO has established a limit for the safe As (as inorganic form) intake in 15 μg·kg−1 body weight [84], so that no limit recommendation is available actually for total As in seafood [85].
As a benthic species that lives in direct contact with the sea bottom, the common octopus is potentially exposed to a remarkable degree of contamination [86,87]. Therefore, before carrying out any attempt for the commercialisation of the current CL as a food additive, subsequent toxicological studies ought to be carried out in order to meet the regulatory limitations [15,16]; these studies ought to imply the knowledge of the kind of molecules toxic elements are included in.
4. Conclusions
The chemical composition of CL resulting from common octopus processing was analysed. Furthermore, the effect of an industrial filtration procedure for partial elimination of chemical compounds from the CL was studied. As a result, valuable levels of proteins, ω3 FAs, PUFAs in general, and essential macro- and microelements were detected in the non-filtered CL. Remarkably, the filtration process led to a general content decrease in chemical constituents in the resulting CL, notably for macro- and microelements. It is concluded that both kinds of liquors, especially the non-filtered one, resulting from octopus cooking, can be considered a convenient source of bioactive compounds, so that a sustainable use of this by-product is recommended.
The present work is a preliminary study that includes a first comprehensive characterisation of octopus CL, an abundant, valueless substrate. It constitutes a new approach that meets the present global needs for natural sources of bioactive molecules to be used for human nutrition, as well as for different kinds of industries like pharmaceutical, nutraceutical, and cosmeceutical. Besides the added value that the current by-product may represent, this study addresses the ecological upside of reducing seafood industry waste. In this sense, repurposing this kind of bioresource will contribute to a more sustainable use of seafood. Future work should focus on bioactivity validation, toxicological assessments, and techno-economic feasibility of large-scale valorisation. Ongoing research should also take into account the microbial characterisation of the CL before and after the filtration process. Additionally, the stability of CLs during commercial storage ought to be addressed.
Author Contributions
Conceptualisation, R.P., A.C.-G. and S.P.A.; methodology, A.C.-G., M.T. and S.C.; data curation, R.P., M.T. and S.C.; writing—original draft preparation, S.P.A.; writing—review and editing, R.P. and S.P.A. All authors have read and agreed to the published version of the manuscript.
Funding
This research was funded by the Spanish Ministry of Research and Innovation, grant number PID2023-146042OB-C21 (2024–2027).
Institutional Review Board Statement
Not applicable.
Informed Consent Statement
Not applicable.
Data Availability Statement
The original contributions presented in the study are included in the article; further inquiries can be directed to the corresponding authors.
Acknowledgments
The authors wish to acknowledge Frigoríficos Rosa de los Vientos S. L. (Marín, Pontevedra, Spain) for kindly providing the octopus samples.
Conflicts of Interest
The authors declare no conflicts of interest.
References
- Venugopal, V. Marine product for health care. In Marine Product for Health Care; Venugopal, V., Ed.; CRC Press: Boca Raton, FL, USA, 2009; pp. 185–214. [Google Scholar]
- Tilami, S.K.; Sampels, S. Nutritional value of fish: Lipids, proteins, vitamins, and minerals. Rev. Fish. Sci. 2018, 26, 242–253. [Google Scholar]
- Martínez-Valverde, I.; Periago, M.J.; Santaella, M.; Ros, G. The content and nutritional significance of minerals on fish flesh in the presence and absence of bone. Food Chem. 2000, 71, 503–509. [Google Scholar] [CrossRef]
- Durazzo, A.; Di Lena, G.; Gabrielli, P.; Santini, A.; Lombardi-Boccia, G.; Lucarini, M. Nutrients and bioactive compounds in seafood: Quantitative literature research analysis. Fishes 2022, 7, 132. [Google Scholar] [CrossRef]
- Ghaly, A.E.; Ramakrishnan, V.V.; Brooks, M.S.; Budge, S.M.; Dave, D. Fish processing wastes as a potential source of proteins, amino acids and oils: A critical review. J. Microb. Biochem. Technol. 2013, 5, 107–129. [Google Scholar]
- Olsen, R.L.; Toppe, J.; Karunasagar, I. Challenges and realistic opportunities in the use of by-products from processing of fish and shellfish. Trends Food Sci. Technol. 2014, 36, 144–152. [Google Scholar] [CrossRef]
- Zhang, J.; Akyol, Ç.; Meers, E. Nutrient recovery and recycling from fishery waste and by-products. J. Environ. Manag. 2023, 348, 119266. [Google Scholar] [CrossRef]
- Cooney, R.; De Sousa, D.B.; Fernández-Ríos, A.; Mellett, S.; Rowan, N.; Morse, A.P.; Clifford, E. A circular economy framework for seafood waste valorisation to meet challenges and opportunities for intensive production and sustainability. J. Clean. Prod. 2023, 392, 136283. [Google Scholar] [CrossRef]
- Cristóvão, R.O.; Botelho, C.M.; Martins, R.J.E.; Loureiro, J.M.; Boaventura, R.A.R. Primary treatment optimization of a fish canning wastewater from a Portuguese plant. Water Res. Ind. 2014, 6, 51–63. [Google Scholar] [CrossRef]
- Katsara, A.; Coughlan, N.E.; Jansen, M.A.K. Characterization of seafood processing wastewater: Processing procedures and physicochemical variability. Environ. Pollut. 2025, 383, 126761. [Google Scholar] [CrossRef]
- Al-Dawery, S.K.; Al-Yaqoubi, G.E.; Al-Musharrafi, A.A.; Harharah, H.N.; Amari, A.; Harharah, R.H. Treatment of fish-processing wastewater using polyelectrolyte and palm anguish. Processes 2023, 11, 2124. [Google Scholar] [CrossRef]
- Ltaief, S.; Mateos, A.; Forestier, A.; Walha, K.; Firdaous, L. Sustainable protein recovery and wastewater valorization in shrimp processing by ultrafiltration. Foods 2025, 14, 2044. [Google Scholar] [CrossRef]
- Dewi, R.N.; Nur, M.M.A.; Astuti, R.P.; Andriyanto, W.; Panjaitan, F.C.A.; Febrianti, D.; Budiadnyani, I.G.A.; Utari, S.P.S.D.; Samanta, P.N.; Perceka, M.L. Bioremediation of seafood processing wastewater by microalgae: Nutrient removal, and biomass, lipid and protein enhancement. Environ. Eng. Res. 2024, 29, 230673. [Google Scholar] [CrossRef]
- Azin, E.; Moghimi, H.; Dastgheib, S.M.M.; Darvishi, F. Biovalorization of wastewater of fish canning process by Yarrowia lipolytica for biodiesel and animal feed supplement production. Biomass Conv. Biorefin. 2024, 14, 7981–7994. [Google Scholar] [CrossRef]
- Lourenço, H.M.; Anacleto, P.; Afonso, C.; Ferraria, V.; Martins, M.F.; Carvalho, M.L.; Lino, A.R.; Nunes, M.L. Elemental composition of cephalopods from Portuguese continental waters. Food Chem. 2009, 113, 1146–1153. [Google Scholar] [CrossRef]
- Oliveira, H.; Muniz, J.A.; Bandarra, N.M.; Castanheira, I.; Ribeiro Coelho, I.; Delgado, I.; Gonçalves, S.; Lourenço, H.M.; Motta, C.; Duarte, M.P.; et al. Effects of industrial boiling on the nutritional profile of common octopus (Octopus vulgaris). Foods 2019, 8, 411. [Google Scholar] [CrossRef] [PubMed]
- Arechavala-López, P.; Capó, X.; Oliver-Codorniú, M.; Sillero-Ríos, J.; Busquéts-Cortés, C.; Sánchez-Jerez, P.; Sureda, A. Fatty acids and elemental composition as biomarkers of Octopus vulgaris populations: Does origin matter? Mar. Pollut. Bull. 2019, 139, 299–310. [Google Scholar] [CrossRef] [PubMed]
- Kang, S.I.; Kim, J.S.; Park, S.Y.; Lee, S.M.; Jang, M.S.; Oh, J.Y.; Choi, J.S. Development and quality characteristics of elderly-friendly Pulpo a la Gallega prepared using texture-modified octopus (Octopus vulgaris) arms. Foods 2023, 12, 3343. [Google Scholar] [CrossRef] [PubMed]
- Zamuz, S.; Bohrer, B.M.; Shariati, M.A.; Rebezov, M.; Kumar, M.; Pateiro, M.; Lorenzo, J.M. Assessing the quality of octopus: From sea to table. Food Front. 2023, 4, 733–749. [Google Scholar] [CrossRef]
- Venugopal, V.; Gopakumar, K. Shellfish: Nutritive value, health benefits, and consumer safety. Comp. Rev. Food Sci. Food Saf. 2017, 16, 1219–1242. [Google Scholar] [CrossRef]
- Ngandjui, Y.A.T.; Kereeditse, T.T.; Kamika, I.; Madikizela, L.M.; Msagati, T.A.M. Review: Nutraceutical and medicinal importance of marine molluscs. Mar. Drugs 2024, 22, 201. [Google Scholar] [CrossRef]
- Kim, Y.J.; Kim, H.J.; Choi, J.I.; Kim, J.H.; Chun, B.S.; Ahn, D.H.; Kwon, J.H.; Kim, Y.J.; Byun, M.W.; Lee, J.W. Effect of electron beam irradiation on the physiological activities of cooking drips from Enteroctopus dofleini. J. Korean Soc. Food Sci. Nutr. 2008, 37, 1190–1195. [Google Scholar] [CrossRef]
- Vázquez, J.A.; Murado, M.A. Enzymatic hydrolysates from food wastewater as a source of peptones for lactic acid bacteria productions. Enzym. Microb. Technol. 2008, 43, 66–72. [Google Scholar] [CrossRef]
- Oh, H.S.; Kang, K.T.; Kim, H.S.; Lee, J.H.; Jee, S.J.; Ha, J.H.; Kim, J.J.; Heu, M.S. Food Component characteristics of seafood cooking drips. J. Korean Soc. Food Sci. Nutr. 2007, 36, 595–602. [Google Scholar] [CrossRef]
- Choi, J.I.; Kim, Y.J.; Sung, N.Y.; Kim, J.H.; Ahn, D.H.; Chun, B.S.; Cho, K.Y.; Byun, M.W.; Lee, J.W. Investigation on the increase of antioxidant activity of cooking drip from Enteroctopus dofleini by irradiation. J. Korean Soc. Food Sci. Nutr. 2009, 38, 121–124. [Google Scholar] [CrossRef]
- Malga, J.M.; Trigo, M.; Martínez, B.; Aubourg, S.P. Preservative effect on canned mackerel (Scomber colias) lipids by addition of octopus (Octopus vulgaris) cooking liquor in the packaging medium. Molecules 2022, 27, 739. [Google Scholar] [CrossRef]
- Méndez, L.; Trigo, M.; Zhang, B.; Aubourg, S.P. Antioxidant effect of octopus by-products in canned horse mackerel (Trachurus trachurus) previously subjected to different frozen storage times. Antioxidants 2022, 11, 2091. [Google Scholar] [CrossRef]
- Ahn, C.B.; Kim, H.R. Processing of the extract powder using skipjack cooking juice and its taste compounds. Korean J. Food Sci. Technol. 1996, 28, 696–701. [Google Scholar]
- Achour, M.; Khelifi, O.; Bouazizi, I.; Hamdi, M. Design of an integrated bioprocess for the treatment of tuna processing liquid effluents. Process Biochem. 2000, 35, 1013–1017. [Google Scholar] [CrossRef]
- Jao, C.L.; Ko, W.C. 1,1-Diphenyl-2-picrylhydrazyl (DPPH) radical scavenging by protein hydrolyzates from tuna cooking juice. Fish. Sci. 2002, 68, 430–435. [Google Scholar] [CrossRef]
- Suleria, H.A.R.; Osborne, S.; Masci, P.; Gobe, G. Marine-based nutraceuticals: An innovative trend in the food and supplement industries. Mar. Drugs 2015, 13, 6336–6351. [Google Scholar] [CrossRef]
- Šimat, V.; Elabed, N.; Kulawik, P.; Ceylan, Z.; Jamroz, E.; Yazgan, H.; Cagalj, M.; Regenstein, J.M.; Özogul, F. Recent advances in marine-based nutraceuticals and their health benefits. Mar. Drugs 2020, 18, 627. [Google Scholar] [CrossRef]
- Senadheera, R.L.; Hossain, A.; Shahidi, F. Marine bioactives and their application in the food industry: A Review. Appl. Sci. 2023, 13, 12088. [Google Scholar] [CrossRef]
- Anh, H.T.H.; Shahsavari, E.; Bott, N.J.; Ball, A.S. Options for improved treatment of saline wastewater from fish and shellfish processing. Front. Environ. Sci. 2021, 9, 689580. [Google Scholar] [CrossRef]
- Mosquera-Corral, A.; Val del Río, A.; Campos Gómez, J.L. Case study: Treatment of fish-canning effluents. In Treatment and Valorisation of Saline Wastewater: Principles and Practice; IWA Publishing: London, UK, 2021; pp. 123–149. [Google Scholar]
- Virpiranta, V.H.; Abayie, S.O.; Mäkikangas, J.; Puirava, M.; Koivula, K.; Leivisk, T. Treatment of fish processing plant wastewater using dissolved air flotation and pilot-scale biochar column filtration. J. Environ. Chem. Eng. 2023, 11, 110853. [Google Scholar] [CrossRef]
- FAO. El Estado Mundial de la Pesca y la Acuicultura: Hacia la Transformación Azul; Organización de las Naciones Unidas para la Alimentación y la Agricultura: Rome, Italy, 2022; pp. 117–160. [Google Scholar]
- Regulation (EU) 2024/1781, Also Known as the Ecodesign for Sustainable Products Regulation (ESPR), Establishes EU-Wide Ecodesign Requirements to Make Products Placed on the EU Market More Sustainable, Durable, Repairable, and Resource-Efficient, Aiming for a Circular and Climate-Neutral Economy. Available online: http://data.europa.eu/eli/reg/2024/1781/oj (accessed on 1 July 2025).
- AOAC. Official Methods for Analysis of the Association of Analytical Chemistry, 15th ed.; Association of Official Chemists, Inc.: Arlington, VA, USA, 1990; pp. 931–937. [Google Scholar]
- Bligh, E.; Dyer, W. A rapid method of total extraction and purification. Can. J. Biochem. Physiol. 1959, 37, 911–917. [Google Scholar] [CrossRef]
- Herbes, S.E.; Allen, C.P. Lipid quantification of freshwater invertebrates: Method modification for microquantitation. Can. J. Fish. Aquat. Sci. 1983, 40, 1315–1317. [Google Scholar] [CrossRef]
- Raheja, R.; Kaur, C.; Singh, A.; Bhatia, A. New colorimetric method for the quantitative determination of phospholipids without acid digestion. J. Lipid Res. 1973, 14, 695–697. [Google Scholar] [CrossRef]
- Aubourg, S.P.; Quitral, V.; Larraín, M.A.; Rodríguez, A.; Gómez, J.; Maier, L.; Vinagre, J. Autolytic degradation and microbiological activity in farmed Coho salmon (Oncorhynchus kisutch) during chilled storage. Food Chem. 2007, 104, 369–375. [Google Scholar] [CrossRef]
- Aubourg, S.P.; Medina, I.; Pérez-Martín, R. Polyunsaturated fatty acids in tuna phospholipids: Distribution in the sn-2 location and changes during cooking. J. Agric. Food Chem. 1996, 44, 585–589. [Google Scholar] [CrossRef]
- US-EPA. Acid Digestion of Sediments, Sludges, and Soils, SW-846 Test Method 3050B; Revision 2 (12 Pages); United States Environmental Protection Agency: Washington, DC, USA, 1996. [Google Scholar]
- Prego, R.; Cobelo-García, A.; Calvo, S.; Aubourg, S.P. Comparative nutritional and healthy values of macro- and microelements in edible and non-edible tissues of raw and processed common octopus (Octopus vulgaris). Foods 2025, 14, 2210. [Google Scholar] [CrossRef]
- Piclet, G. Le poisson aliment. Composition-Intérêt nutritionnel. Cah. Nutr. Diét. 1987, XXII, 317–335. [Google Scholar]
- Cheong, H.S. Antioxidant effect of histidine containing low molecular weight peptide isolated from skipjack boiled extract. Korean J. Food Cook. Sci. 2007, 23, 221–226. [Google Scholar]
- Soto, M.; Méndez, R.; Lema, J.M. Biodegradability and toxicity in the anaerobic treatment of fish canning wastewaters. Environ. Technol. 1991, 12, 669–677. [Google Scholar] [CrossRef]
- Méndez, L.; Rodríguez, A.; Aubourg, S.P.; Medina, I. Low-toxicity solvents for the extraction of valuable lipid compounds from octopus (Octopus vulgaris) waste. Foods 2023, 12, 3631. [Google Scholar] [CrossRef]
- Rodríguez Amado, I.; González, M.P.; Murado, M.A.; Vázquez, J.A. Shrimp wastewater as a source of astaxanthin and bioactive peptides. J. Chem. Technol. Biotechnol. 2016, 91, 793–805. [Google Scholar] [CrossRef]
- Bechtel, P.J. Properties of Stickwater from Fish Processing Byproducts. J. Aquat. Food Prod. Technol. 2005, 14, 25–38. [Google Scholar] [CrossRef]
- Martínez-Montaño, E.; Osuna-Ruiz, I.; Benítez-García, I.; Osuna, C.O.; Pacheco-Aguilar, R.; Navarro-Peraza, R.S.; Lugo Sánchez, M.E.; Hernández, C.; Spanopoulos-Hernández, M.; Salazar-Leyva, J.A. Biochemical and antioxidant properties of recovered solids with pH shift from fishery effluents (sardine stickwater and tuna cooking water). Waste Biomass Valoriz. 2021, 12, 1901–1913. [Google Scholar] [CrossRef]
- Tonon, R.V.; dos Santos, B.A.; Couto, C.C.; Mellinger-Silva, C.; Brígida, A.I.S.; Cabral, L.M.C. Coupling of ultrafiltration and enzymatic hydrolysis aiming at valorizing shrimp wastewater. Food Chem. 2016, 198, 20–27. [Google Scholar] [CrossRef]
- Köhler, A.; Sarkinnen, E.; Tapola, N.; Niskanen, T.; Bruheim, I. Bioavailability of fatty acids from krill oil, krill meal and fish oil in healthy subjects–a randomized, single-dose, cross-over trial. Lipids Health Dis. 2015, 14, 19. [Google Scholar] [CrossRef]
- Li, J.; Wang, X.; Zhang, T.; Huang, Z.; Luo, X.; Deng, Y. A review on phospholipids and their main applications in drug delivery systems. Asian J. Pharm. Sci. 2015, 10, 81–98. [Google Scholar] [CrossRef]
- Aubourg, S.P.; Medina, I.; Pérez-Martín, R. A comparison between conventional and fluorescence detection methods of cooking-induced damage to tuna fish lipids. Z. Lebensm. Unters. Forsch. 1995, 200, 252–255. [Google Scholar] [CrossRef]
- Özoğul, Y. Methods for freshness quality and deterioration. In Handbook of Seafood and Seafood Products Analysis; Nollet, L., Toldrá, F., Eds.; CRC Press, Taylor & Francis Group: Boca Raton, FL, USA, 2010; pp. 189–214. [Google Scholar]
- Ólafsdóttir, G.; Jónsdóttir, R. Volatile aroma compounds in fish. In Handbook of Seafood and Seafood Products Analysis; Nollet, L., Toldrá, F., Eds.; CRC Press, Taylor & Francis Group: Boca Raton, FL, USA, 2010; pp. 97–117. [Google Scholar]
- Directive 95/149/EC: Commission Decision of 8 March 1995 fixing the total volatile basic nitrogen (TVB-N) limit values for certain categories of fishery products and specifying the analysis methods to be used. Off. J. Eur. Com. 1995, L 097, 29/04/1995. 0084–0087.
- Picos-Benítez, A.R.; Peralta-Hernández, J.M.; López-Hincapié, J.D.; Rodríguez-García, A. Biogas production from saline wastewater of the evisceration process of the fish processing industry. J. Water Process. Eng. 2019, 32, 100933. [Google Scholar] [CrossRef]
- Kim, J.S.; Heu, M.S.; Yeum, D.M. Component characteristics of canned oyster processing waste water as a food resource. J. Korean Soc. Food Sci. Nutr. 2001, 30, 299–306. [Google Scholar]
- Thomas, S.; Harindranathan Nair, M.V.; Bright Singh, I.S. Physicochemical Analysis of Seafood Processing Effluents in Aroor Gramapanchayath, Kerala. IOSR J. Environm. Sci. Toxicol. Food Technol. 2015, 9, 38–44. [Google Scholar]
- Prasertsan, P.; Jung, S.; Buckle, K.A. Anaerobic filter treatment of fishery wastewater. World J. Microbiol. Biotechnol. 1994, 10, 11–13. [Google Scholar] [CrossRef]
- Veiga, M.C.; Méndez, R.; Lema, J.M. Anaerobic filter and DSFF reactors in anaerobic treatment of tuna processing wastewater. Water Sci. Technol. 1994, 30, 425–432. [Google Scholar] [CrossRef]
- Méndez, L.; Zhang, B.; Aubourg, S.P. Enhancement of lipid stability of frozen fish by octopus-waste glazing. Foods 2023, 12, 2298. [Google Scholar] [CrossRef]
- Aubourg, S.P. Lipid compounds. In Handbook of Seafood and Seafood Products Analysis; Nollet, L., Toldrá, F., Eds.; CRC Press, Taylor & Francis Group: Boca Raton, FL, USA, 2010; pp. 69–86. [Google Scholar]
- Rustad, T. Lipid oxidation. In Handbook of Seafood and Seafood Products Analysis; Nollet, L., Toldrá, F., Eds.; CRC Press, Taylor & Francis Group: Boca Raton, FL, USA, 2010; pp. 87–95. [Google Scholar]
- Rodríguez, A.; Trigo, M.; Aubourg, S.P.; Medina, I. Optimisation of healthy-lipid content and oxidative stability during oil extraction from squid (Illex argentinus) viscera by green processing. Mar. Drugs 2021, 19, 616. [Google Scholar] [CrossRef]
- Kumari, P.; Kumar, M.; Reddy, C.R.; Jha, B. Algal lipids, fatty acids and sterols. In Functional Ingredients from Algae for Foods and Nutraceuticals; Domínguez, H., Ed.; Woodhead Publishing: Cambridge, UK, 2013; pp. 87–134. [Google Scholar]
- Simopoulos, A.P. The importance of the ratio of omega-6/omega-3 essential fatty acids. Biomed. Pharmacother. 2002, 56, 365–379. [Google Scholar] [CrossRef]
- Sieiro, M.P.; Aubourg, S.P.; Rocha, F. Seasonal study of the lipid composition in different tissues of the common octopus (Octopus vulgaris). Eur. J. Lipid Sci. Technol. 2006, 108, 479–487. [Google Scholar] [CrossRef]
- Kiss, S.A.; Forster, T.; Dongo, A. Absorption and effect of the magnesium content of a mineral water in the human body. J. Am. Coll. Nutr. 2004, 23, 758S–762S. [Google Scholar] [CrossRef] [PubMed]
- El-Said, G.F.; El-Sikaily, A. Chemical composition of some seaweed from Mediterranean Sea coast, Egypt. Environ. Monit. Assessm. 2013, 185, 6089–6099. [Google Scholar] [CrossRef] [PubMed]
- Ismail, G.A. Biochemical composition of some Egyptian seaweeds with potent nutritive and antioxidant properties. Food Sci. Technol. Campinas 2017, 37, 294–302. [Google Scholar] [CrossRef]
- Shahidi, F.; Varatharajan, V.; Peng, H.; Senadheera, R. Utilization of marine by-products for the recovery of value-added products. J. Food Bioact. 2019, 6, 10–61. [Google Scholar] [CrossRef]
- Bruno, S.F.; Ekorong, F.J.A.A.; Karkala, S.S.; Cathrine, M.S.B.; Kudre, T.G. Green and innovative techniques for recovery of valuable compounds from seafood by-products and discards: A review. Trends Food Sci. Technol. 2019, 85, 10–22. [Google Scholar] [CrossRef]
- Venugopal, V. Valorization of seafood processing discards: Bioconversion and bio-refinery approaches. Front. Sustain. Food Syst. 2021, 5, 611835. [Google Scholar] [CrossRef]
- Rodrigues, M.J.; Franco, F.; Martinho, F.; Carvalho, L.; Pereira, M.E.; Coelho, J.P.; Pardal, M.A. Essential mineral content variations in commercial marine species induced by ecological and taxonomical attributes. J. Food Compos. Anal. 2021, 103, 104118. [Google Scholar] [CrossRef]
- Fraga, C.G. Relevance, essentiality and toxicity of trace elements in human health. Mol. Asp. Med. 2005, 26, 235–244. [Google Scholar] [CrossRef]
- Oehlenschläger, J. Minerals and trace elements. In Handbook of Seafood and Seafood Products Analysis; Nollet, L., Toldrá, F., Eds.; CRC Press: Boca Raton, FL, USA, 2010; Chapter 20; pp. 351–375. [Google Scholar]
- Commission Regulation (EU) 2023/915 of 25 April 2023 on Maximum Levels for Certain Contaminants in Food and Repealing Regulation (EC) No. 1881/2006. Diario Oficial de la Unión Europea L119/103, 5 May 2023.
- European Food Safety Authority (EFSA). Panel on contaminants in the food chain (CONTAM); scientific opinion on tolerable weekly intake for cadmium. EFSA J. 2011, 9, 1975. [Google Scholar]
- Lavilla, I.; Vilas, P.; Bendicho, C. Fast determination of arsenic, selenium, nickel and vanadium in fish and shellfish by electrothermal atomic absorption spectrometry following ultrasound-assisted extraction. Food Chem. 2008, 106, 403–409. [Google Scholar] [CrossRef]
- CXS 193-1995; General Standard for Contaminants and Toxins in Food and Feed. FAO/WHO: Rome, Italy, 1995.
- Anacleto, P.; Lourenço, H.M.; Ferraria, V.; Afonso, C.; Carvalho, M.L.; Martins, M.F.; Nunes, M.L. Total arsenic content in seafood consumed in Portugal. J. Aquat. Food Prod. Technol. 2009, 18, 32–45. [Google Scholar] [CrossRef]
- Alves, R.N.; Maulvault, A.L.; Barbosa, V.L.; Fernandez-Tejedor, M.; Tediosi, A.; Kotterman, M.; van den Heuvel, F.H.M.; Robbens, J.; Fernandes, J.O.; Rasmussen, R.R.; et al. Oral bioaccessibility of toxic and essential elements in raw and cooked commercial seafood species available in European markets. Food Chem. 2018, 267, 15–27. [Google Scholar] [CrossRef]
Disclaimer/Publisher’s Note: The statements, opinions and data contained in all publications are solely those of the individual author(s) and contributor(s) and not of MDPI and/or the editor(s). MDPI and/or the editor(s) disclaim responsibility for any injury to people or property resulting from any ideas, methods, instructions or products referred to in the content. |
© 2025 by the authors. Licensee MDPI, Basel, Switzerland. This article is an open access article distributed under the terms and conditions of the Creative Commons Attribution (CC BY) license (https://creativecommons.org/licenses/by/4.0/).