Article

Driving Sustainable Adaptation Through Community Engagement: A Social Adaptive Capacity Tool for Climate Policy

by
Monika Piotrkowska
1,*,
Katarzyna Rędzińska
1,
Monika Zgutka
2 and
Małgorzata Płaszczyca
2
1
Department of Spatial Planning and Environmental Sciences, Faculty of Geodesy and Cartography, Warsaw University of Technology, Politechniki 1 Sq., 00-661 Warsaw, Poland
2
Strategic Analysis Department, Warsaw University of Technology, Rektorska 4 St., 00-614 Warsaw, Poland
*
Author to whom correspondence should be addressed.
Sustainability 2025, 17(21), 9361; https://doi.org/10.3390/su17219361
Submission received: 6 August 2025 / Revised: 1 October 2025 / Accepted: 9 October 2025 / Published: 22 October 2025

Abstract

Existing studies on adaptive capacity often focus on isolated theoretical aspects of the concept, without offering practical tools for climate policy. Moreover, gaps remain in integrating public participation into adaptation strategies and in extending research beyond specific climate-related threats, such as flooding. Current climate adaptation plans usually rely on public statistics, which are not accurate enough to reflect adaptive capacity at the local level. Improving such plans requires incorporating local knowledge and adequately addressing the needs of vulnerable groups. This article proposes a survey-based tool for measuring social adaptive capacity, providing policymakers with detailed insights into a community’s ability to cope with climate change. The tool was tested while developing a climate adaptation plan for a medium-sized city in Poland. A total of 238 responses were analysed, applying basic and non-parametric statistical methods across four key variables: risk perception of climate change, perceived adaptive capacity, adaptation motivation, and adaptation behaviour. Findings revealed that residents were aware of climate change and believed in the necessity of adaptation. To translate this awareness into sustainable action, local authorities should raise individual responsibility, offer technical and financial guidance, provide various forms of financial assistance, and strengthen social capital, which could increase participation in grassroots initiatives.

1. Introduction

While climate change is a global phenomenon, its effects are observed locally and must be addressed in that context. Progress to date in climate change adaptation planning has been slow and lags behind mitigation [1,2,3,4,5]. Local strategies and plans have been created mainly for big cities [5,6]. In addition, evaluations show a need to improve first-generation plans [7,8]. Among the reasons cited are insufficient public participation, failure to use local knowledge when making adaptation decisions, and inadequate consideration of the needs of vulnerable groups [7,9]. As adaptation strategies will remain key instruments for implementing climate policy in the upcoming years, it is advocated that authorities at the local, regional and national levels should continue to develop them [10].
For adaptation plans, adaptive capacity is determined [11], understood as the ability of a system to adjust to climate change (including climate variability and extremes) to moderate potential damages, to take advantage of opportunities or to cope with the consequences [12]. Depending on the approach, the subject of interest may be the adaptive capacity of society and the city’s natural and physical components treated as a coupled socio-ecological system [11,13].
The study of adaptive capacity is inherently multidisciplinary, spanning social and natural sciences, environmental studies, and geography [13,14,15]. Much of the earlier work focused on single sectors at risk, most often agriculture and water resources [13]. Parallel to the sectoral emphasis, agro-pastoralist communities have been examined more frequently than urban systems. Research has also tended to analyse adaptive capacity at the community level, typically measured as the aggregated capacity of households, followed by studies at the district and city level [13], or regional scales [15]. In terms of geographical scope, most studies have concentrated on Asia and North America, while Europe has received comparatively less attention [13,15], with existing work focused primarily on Western and Northern countries [13,14].
Research on adaptive capacity has developed along three main trajectories. Early studies were based on the Sustainable Livelihoods Framework (SLF), which viewed human, physical, natural, financial, and social assets as the key determinants of adaptive capacity. Later research expanded the SLF by adding dimensions such as innovation, technology, information, and governance [15]. A third line of work moved beyond the SLF, focusing instead on psycho-social factors that shape how assets are mobilised for adaptation [16]. For example, Cinner et al. [17] identified flexibility, collective action, learning, and agency as central domains of adaptive capacity. Moreover, in recent years emerged the concept of adaptive social protection that combines social safety nets with climate change adaptation and disaster risk reduction to achieve resilience [18,19,20]. Researchers and practitioners emphasise that such an integrated approach aims to help households mitigate the effects of climate shocks and invest in long-term adaptive capacity, but also to encourage positive environmental behaviour and strengthen governance by empowering vulnerable groups [20,21].
Examining residents’ attitudes allows local authorities to understand how communities adapt to climate threats and what motivates or limits their actions [22]. Acquiring detailed, everyday, tacit knowledge [23,24,25] can help identify the needs of vulnerable groups [26], and when combined with expert knowledge, will allow better planning of adaptation options, contributing to the quality of plans [27,28,29,30]. Additionally, exploring people’s attitudes towards climate change helps policymakers understand to whom they assign responsibility for adaptation actions [31]. It is important, given the limited mandate and capacity of local governments, to deal with increasing climate risks and the resulting growing need for greater citizen engagement in collective efforts [32]. In fact, society’s ability to cope with climate crises depends not only on cooperation between institutions, but also between institutions and citizens [33].
However, direct measurement of adaptive capacity is impossible, making its assessment challenging [34]. It is therefore evaluated based on the measurable factors that determine it [14,26] using qualitative, quantitative and participatory approaches, depending on the scale and context [11].
Commonly used indicator methods, which rely on aggregate proxy data, often obtained from public statistics, do not consider many processes and contextual factors (e.g., local knowledge or power relations) and thus are not considered accurate enough to reflect adaptive capacity at the local level [11,26]. A deeper and more holistic understanding of adaptation strategies at the household and community levels can be achieved through quantitative and qualitative methods utilising interviews and surveys [11]. Additionally, due to the paucity of data in public statistics (especially in terms of social capital) that enable the assessment of residents’ agency and collective action skills in preparing for the consequences of climate change, the primary data collection is most often applied [13]. In Poland, for example, the guidelines for developing climate adaptation plans [35] suggest including a set of eleven questions directed at municipal officials to assess a city’s adaptive capacity. These questions focus on social capital, which is understood as the functioning of social organisations, the level of social awareness among local groups, and their willingness to engage in activities for the city.
A related stream of research involves examining the decision-making process of citizens taking adaptation action, where adaptation behaviour is the dependent variable explained by a set of factors hypothesised to influence it [36]. The studies exemplifying this approach, as summarised in Table 1, are typically survey-based, theoretically driven, and focused on specific hazard contexts like floods or heatwaves. Among the determinants of adaptation motivation and adaptive behaviour to climate threats are access to financial, technical, informational, and institutional resources [37], social networks, socio-cultural factors (social norms, values, traditions), cognitive factors (perceptions, knowledge, past experiences), psychological factors (emotions, worries, goals, aspirations), among others [38,39,40,41]. In addition, theoretical models have been developed to illustrate the links between the various determinants, including the Model of Private Proactive Adaptation to Climate Change (MPPACC) [42] or the Climate Change Risk Perception Model (CCRPM) [40], which have been applied in various studies [43,44,45,46,47].
Existing studies on the adaptive capacity of communities have predominantly focused on exploring selected aspects of the concept and constructing theoretical models, without offering comprehensive tools to facilitate its practical application in climate adaptation planning. Moreover, beyond a narrow research focus on specific hazards like flooding, the mechanisms for effectively integrating public participation into adaptation policy remain poorly understood [49]. Consequently, this study aims to bridge this gap by developing and testing a comprehensive tool for measuring social adaptive capacity (SoAC Tool). Through a survey-based method, this tool is designed to serve as a direct mechanism for increasing public involvement in the climate adaptation planning process, providing local authorities with insights into the community’s abilities to cope with climate change, risk attitudes, and adaptation behaviours. This raises the research question: building on prior efforts in adaptive capacity research, is it possible to develop a tool applicable to participatory adaptation planning that can effectively support the selection of tailored adaptation measures?
This study makes several notable contributions. First and foremost, by capturing residents’ climate awareness and adaptation behaviours, the SoAC tool demonstrates how public participation can be structurally embedded in the diagnostic phase of policy development and extended to a broader range of climate risks. The tool’s practical utility was validated through its application during the development of the Climate Adaptation Plan for the city of Starachowice in Poland [50]. Finally, this article provides an overview of this process from a Central European context, supplementing the literature with a new perspective, as results have often concentrated on Western or Northern European countries.
More broadly, this research operationalises the social dimension of sustainability. By systematically including residents’ opinions, our approach helps craft policies that enhance community safety and social inclusion, particularly for vulnerable groups. Because these policies are rooted in community needs, they have a higher likelihood of successful implementation, directly supporting the creation of resilient cities as envisioned in SDGs 11 and 13. Furthermore, because the tool can be used repeatedly over time, it provides a crucial mechanism for sustainability monitoring, allowing authorities to track public perceptions and evaluate the long-term effectiveness of adaptation measures.
The article is structured as follows. Section 2 outlines the research methodology, including the development and testing of the SoAC tool, as well as its application in a case study. Section 3 presents the survey results across the tool’s four variables and their contributing factors. Section 4 discusses these findings in the context of existing literature, their implications for adaptation policy, and considerations for refining the tool. Section 5 provides a summary and conclusions.

2. Materials and Methods

This section presents the step-by-step development and testing of the Social Adaptive Capacity Tool. It also describes the context of the case study in which the tool was applied, as well as the method of analysing the quantitative data collected in this process.

2.1. Development of the Social Adaptive Capacity Tool

The SoAC Tool was developed in a multi-stage process, which is illustrated in Figure 1.
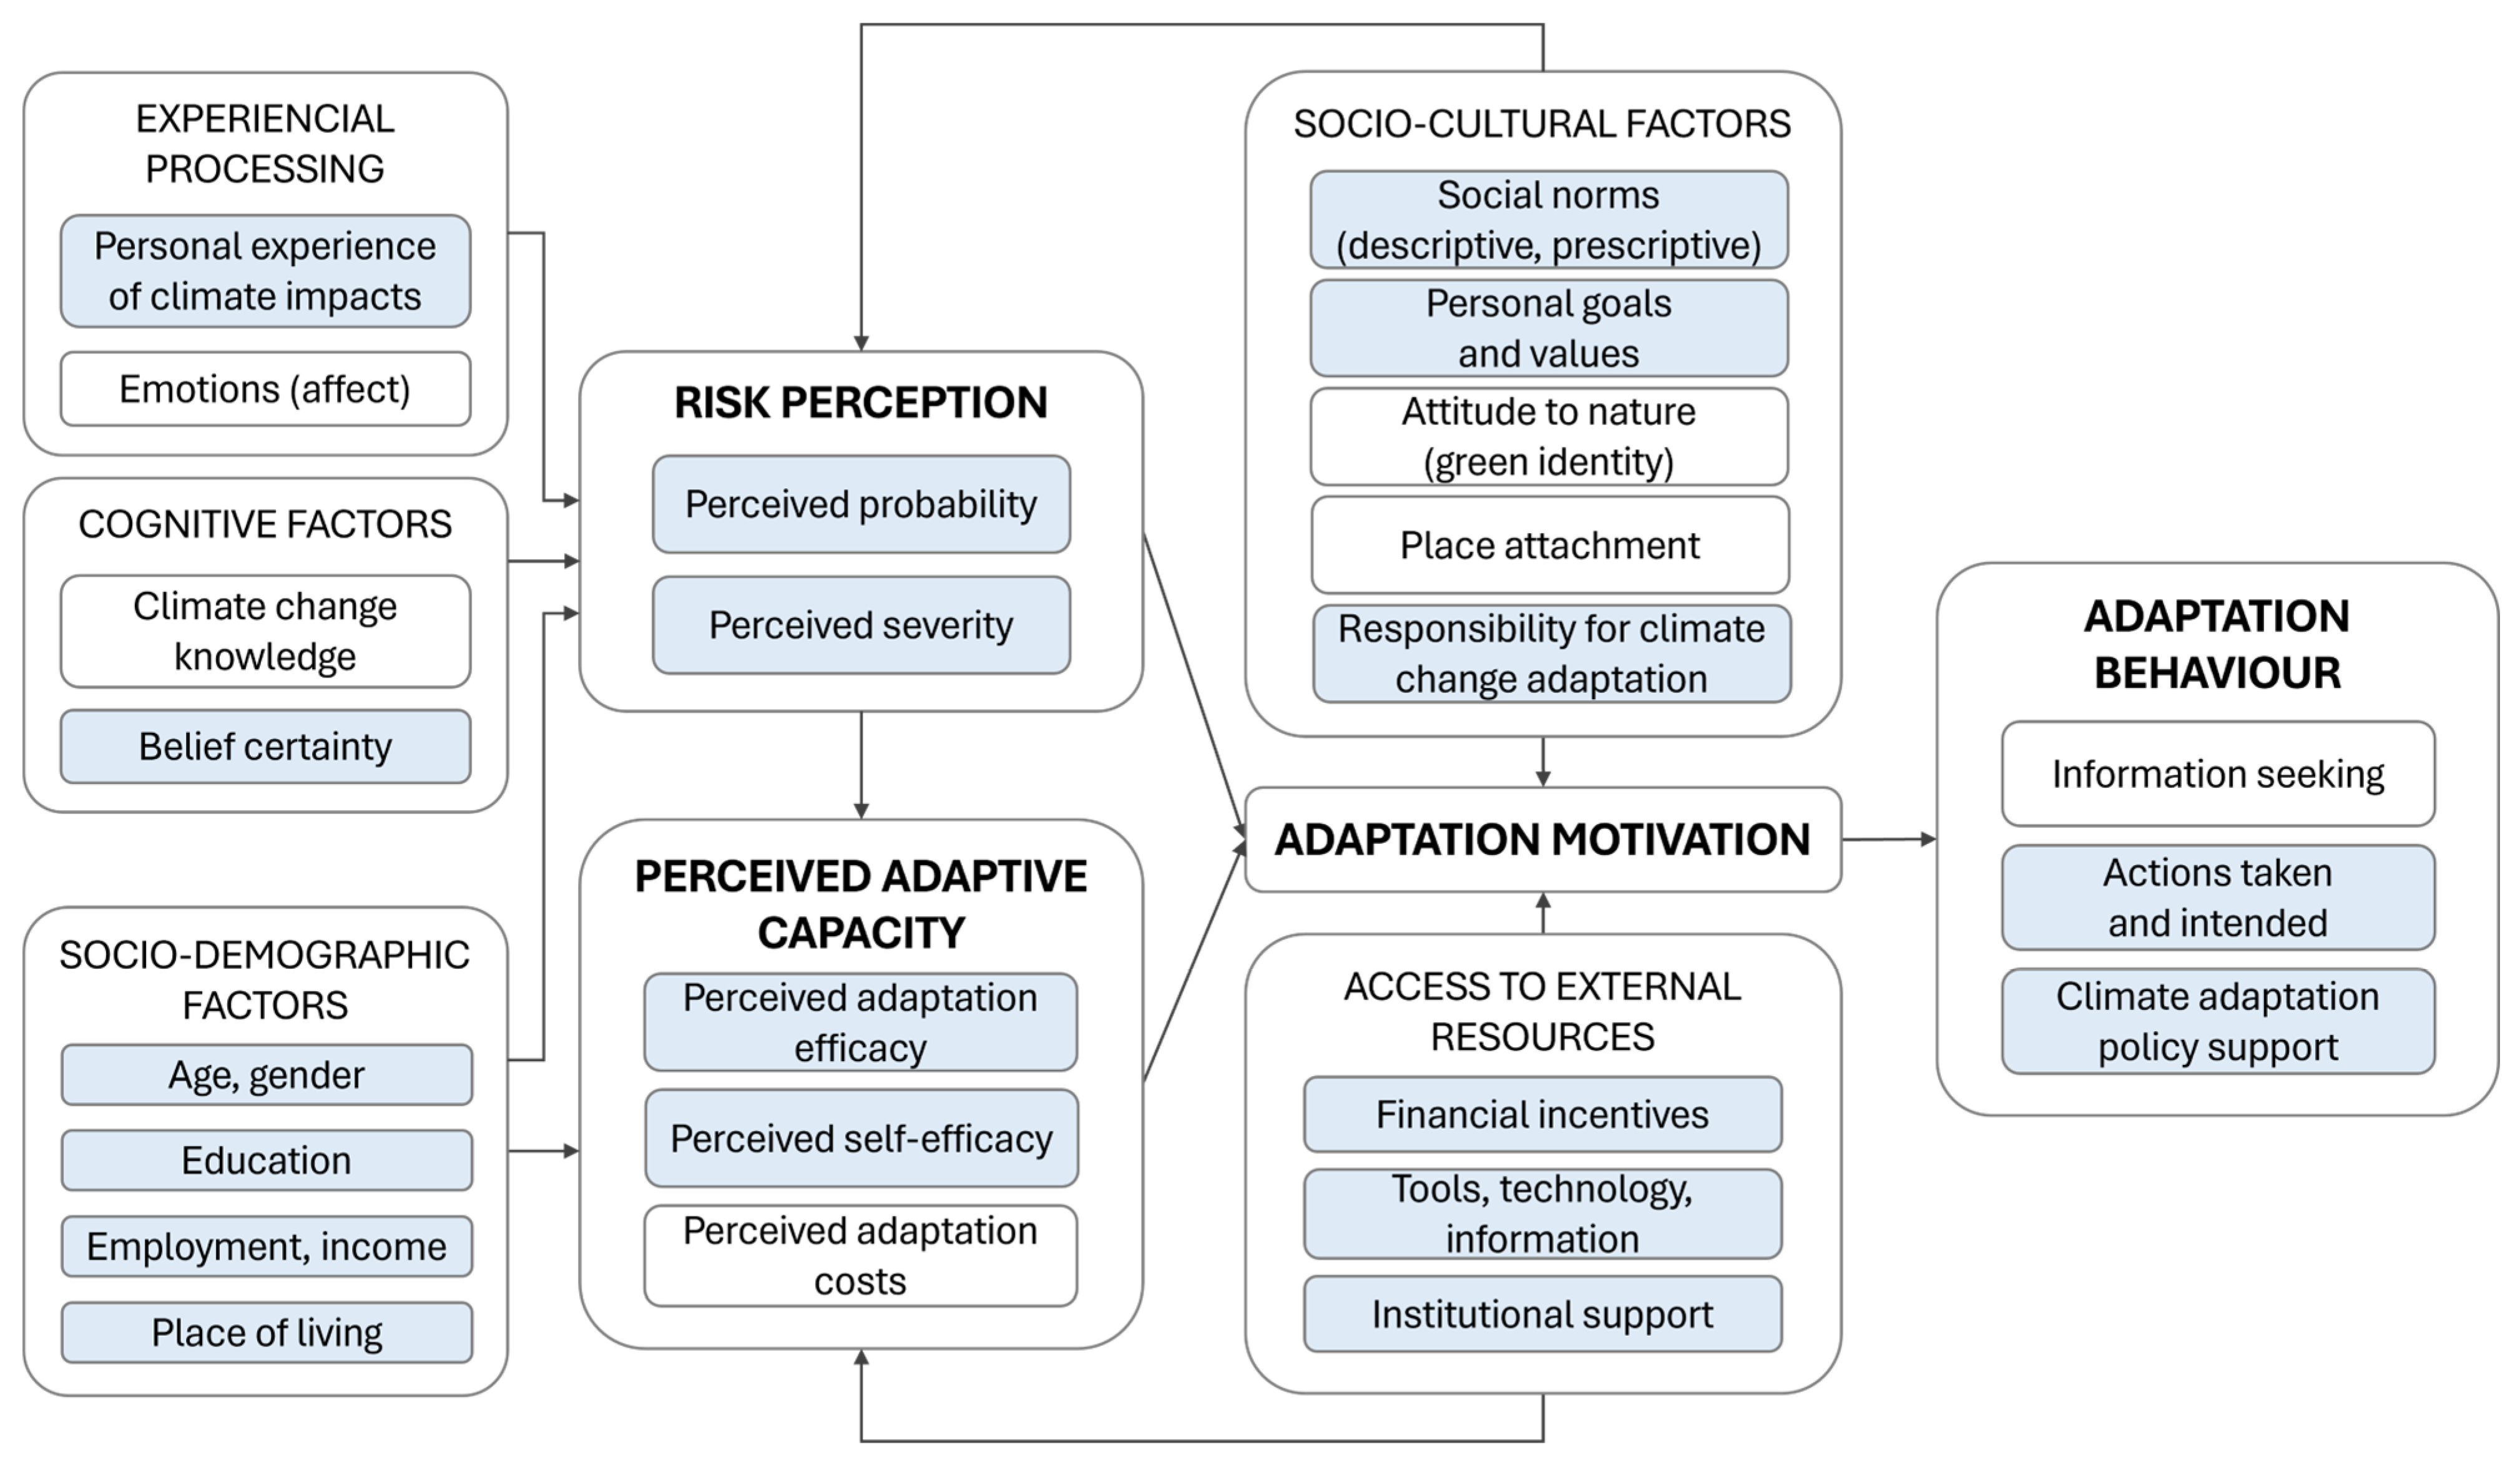
Firstly, a synthesis of key variables and influencing factors relevant to social adaptive capacity was conducted based on a literature review. This conceptual framework was informed by the MPPACC model [42], which links risk perception and perceived adaptive capacity to adaptive behaviour, the CCRPM [40], which identifies determinants of risk perception, and factors associated with adaptation motivation [41] (Figure 2).
A prototype survey questionnaire was then constructed using 19 items inspired by multiple literature sources and adapted to the local context. Although rooted in prior studies, the phrasing, order, and assignment of items to four theoretically grounded variables (risk perception of climate change, perceived adaptive capacity, adaptation motivation, adaptation behaviour), each encompassing two to four factors (Table 2), represent an original conceptual contribution. The questionnaire consists of closed-ended single- and multiple-choice questions, including matrix questions, with response options structured on a five-point Likert scale; as well as metrics with socioeconomic data (gender, age, education level, place of residence, income, economic activity).
The tool underwent pre-testing with a small group to evaluate clarity and identify potential ambiguities, followed by refinements. Afterwards, it was pilot tested in a real-life context as part of the climate adaptation planning process in the city of Starachowice (see Section 2.3), which enabled final adjustments to the questionnaire’s structure and wording (see Supplementary Material).

2.2. Climate Adaptation Planning Context in Poland

In Poland, local climate adaptation plans are developed based on recommendations from the national adaptation strategy [52] which constitutes a direct implementation of the EU climate policy [53]. To date, most plans are the results of projects co-financed by external funds and have primarily focused on large cities [54,55].
In contrast, climate change adaptation has not been a priority in small and medium-sized cities [56]. However, this trend has begun to shift in the past two years, with a growing number of adaptation plans being developed. It is estimated that out of 1000 small and medium-sized cities, 106 have prepared such plans, obtaining funding individually [57].
Further progress in this area will be driven by new national legislation requiring all cities with populations over 20,000 to develop climate adaptation plans by 2028 [58]. It also stipulates that these documents must be updated every six years.

2.3. Study Area and Data Acquisition

Pilot testing of the SoAC Tool was conducted on a sample of inhabitants from Starachowice, a post-industrial, medium-sized, shrinking city (population: 44,906) located in central Poland (Figure 3). It was identified as one of 255 cities with the most challenging socio-economic conditions in the country [59] and, as such, became eligible to apply for funding under the Norwegian Financial Mechanism for development plans, projects, and investments that stimulate development, including the elaboration of a climate change adaptation plan.
The main projected impacts of climate change in Central and Eastern Europe include more frequent temperature extremes, more intense precipitation that can trigger floods at any time of year, increased frequency and intensity of hurricanes, and more frequent droughts. In Poland, exposure to these climate hazards varies regionally [60]. Analysis of historical data and climate projections has shown that Starachowice faces threats from increased heatwaves that exacerbate the urban heat island effect. Additionally, more frequent heavy rainfall leading to flash floods and prolonged droughts pose risks, while river valley areas are vulnerable to flooding and waterlogging [50].
Based on public statistics, the level of social capital in Starachowice is lower compared to similar cities due to lower civic engagement (as measured by participation in cultural events and the number of newly registered associations) and higher social stratification (the number of individuals receiving social assistance and housing allowances). The aforementioned socio-economic and environmental problems make it a representative example of a declining European city [61,62] in the process of climate change adaptation.
The answers were collected from June to September 2022, employing both PAPI and CAWI methods. Only adults living or working in the city were allowed to participate. Face-to-face interviews using a paper questionnaire were conducted in the city’s public spaces and at public events. The online survey was conducted using the LimeSurvey tool. Respondents were informed about the purpose of the study, the voluntary nature of their participation, and their right to withdraw at any time without consequence. The study ensured confidentiality and anonymity, with results analysed and presented in an aggregated form, preventing the identification of individual respondents. A total of 238 complete responses were received. For a detailed summary, see Table 3.

2.4. Results Analysis

Statistical analysis was conducted using STATISTICA (version 13) by Tibco Software Inc., San Ramon, CA, USA and encompassed both basic and non-parametric statistics. Firstly, the response frequencies were analysed. Afterwards, the Mann–Whitney U test was employed to check for statistically significant differences between groups of participants based on their metrics (gender, place of residence, economic activity). Additionally, Spearman’s correlation (R) was examined among items operationalising the main variables (see A, B, C, and D in Table 1), and between items and ordinal data from metrics (age, education, income). The answers “No opinion/Difficult to say” were excluded. Only for the result presentation, the 5-point Likert scale was reduced to a 3-point scale (e.g., whenever in the text it is stated that a given percentage of respondents agreed with a statement, it means both answers “strongly agree” and “agree” have been summed).

3. Results

Section 3.1, Section 3.2, Section 3.3 and Section 3.4 present the results by variables (risk perception of climate change, perceived adaptive capacity, adaptation motivation, adaptation behaviour) and their contributing factors, while Section 3.5 summarises key correlations between the variables.

3.1. Risk Perception of Climate Change (Variable A)

3.1.1. Perceived Probability

Most participants reported an increase in heat waves, droughts (over 80%), strong winds, and heavy rainfall (over 50%) in Starachowice during their lifetime, while cold waves decreased (over 55% of answers). The number of floods and storms remained unchanged (over 52%).

3.1.2. Belief Certainty

Eighty-one per cent of the surveyed individuals claimed that climate change affects them personally. No statistically significant differences were noted due to characteristics from the metrics.

3.1.3. Perceived Severity of Impact

Respondents rated the impact of all extreme weather events on their lives negatively. Two-thirds noted that heat waves, droughts, heavy rainfall, and strong winds had particularly negative effects. Responses were almost equally split between those indicating a negative impact and those indicating no impact for floods.
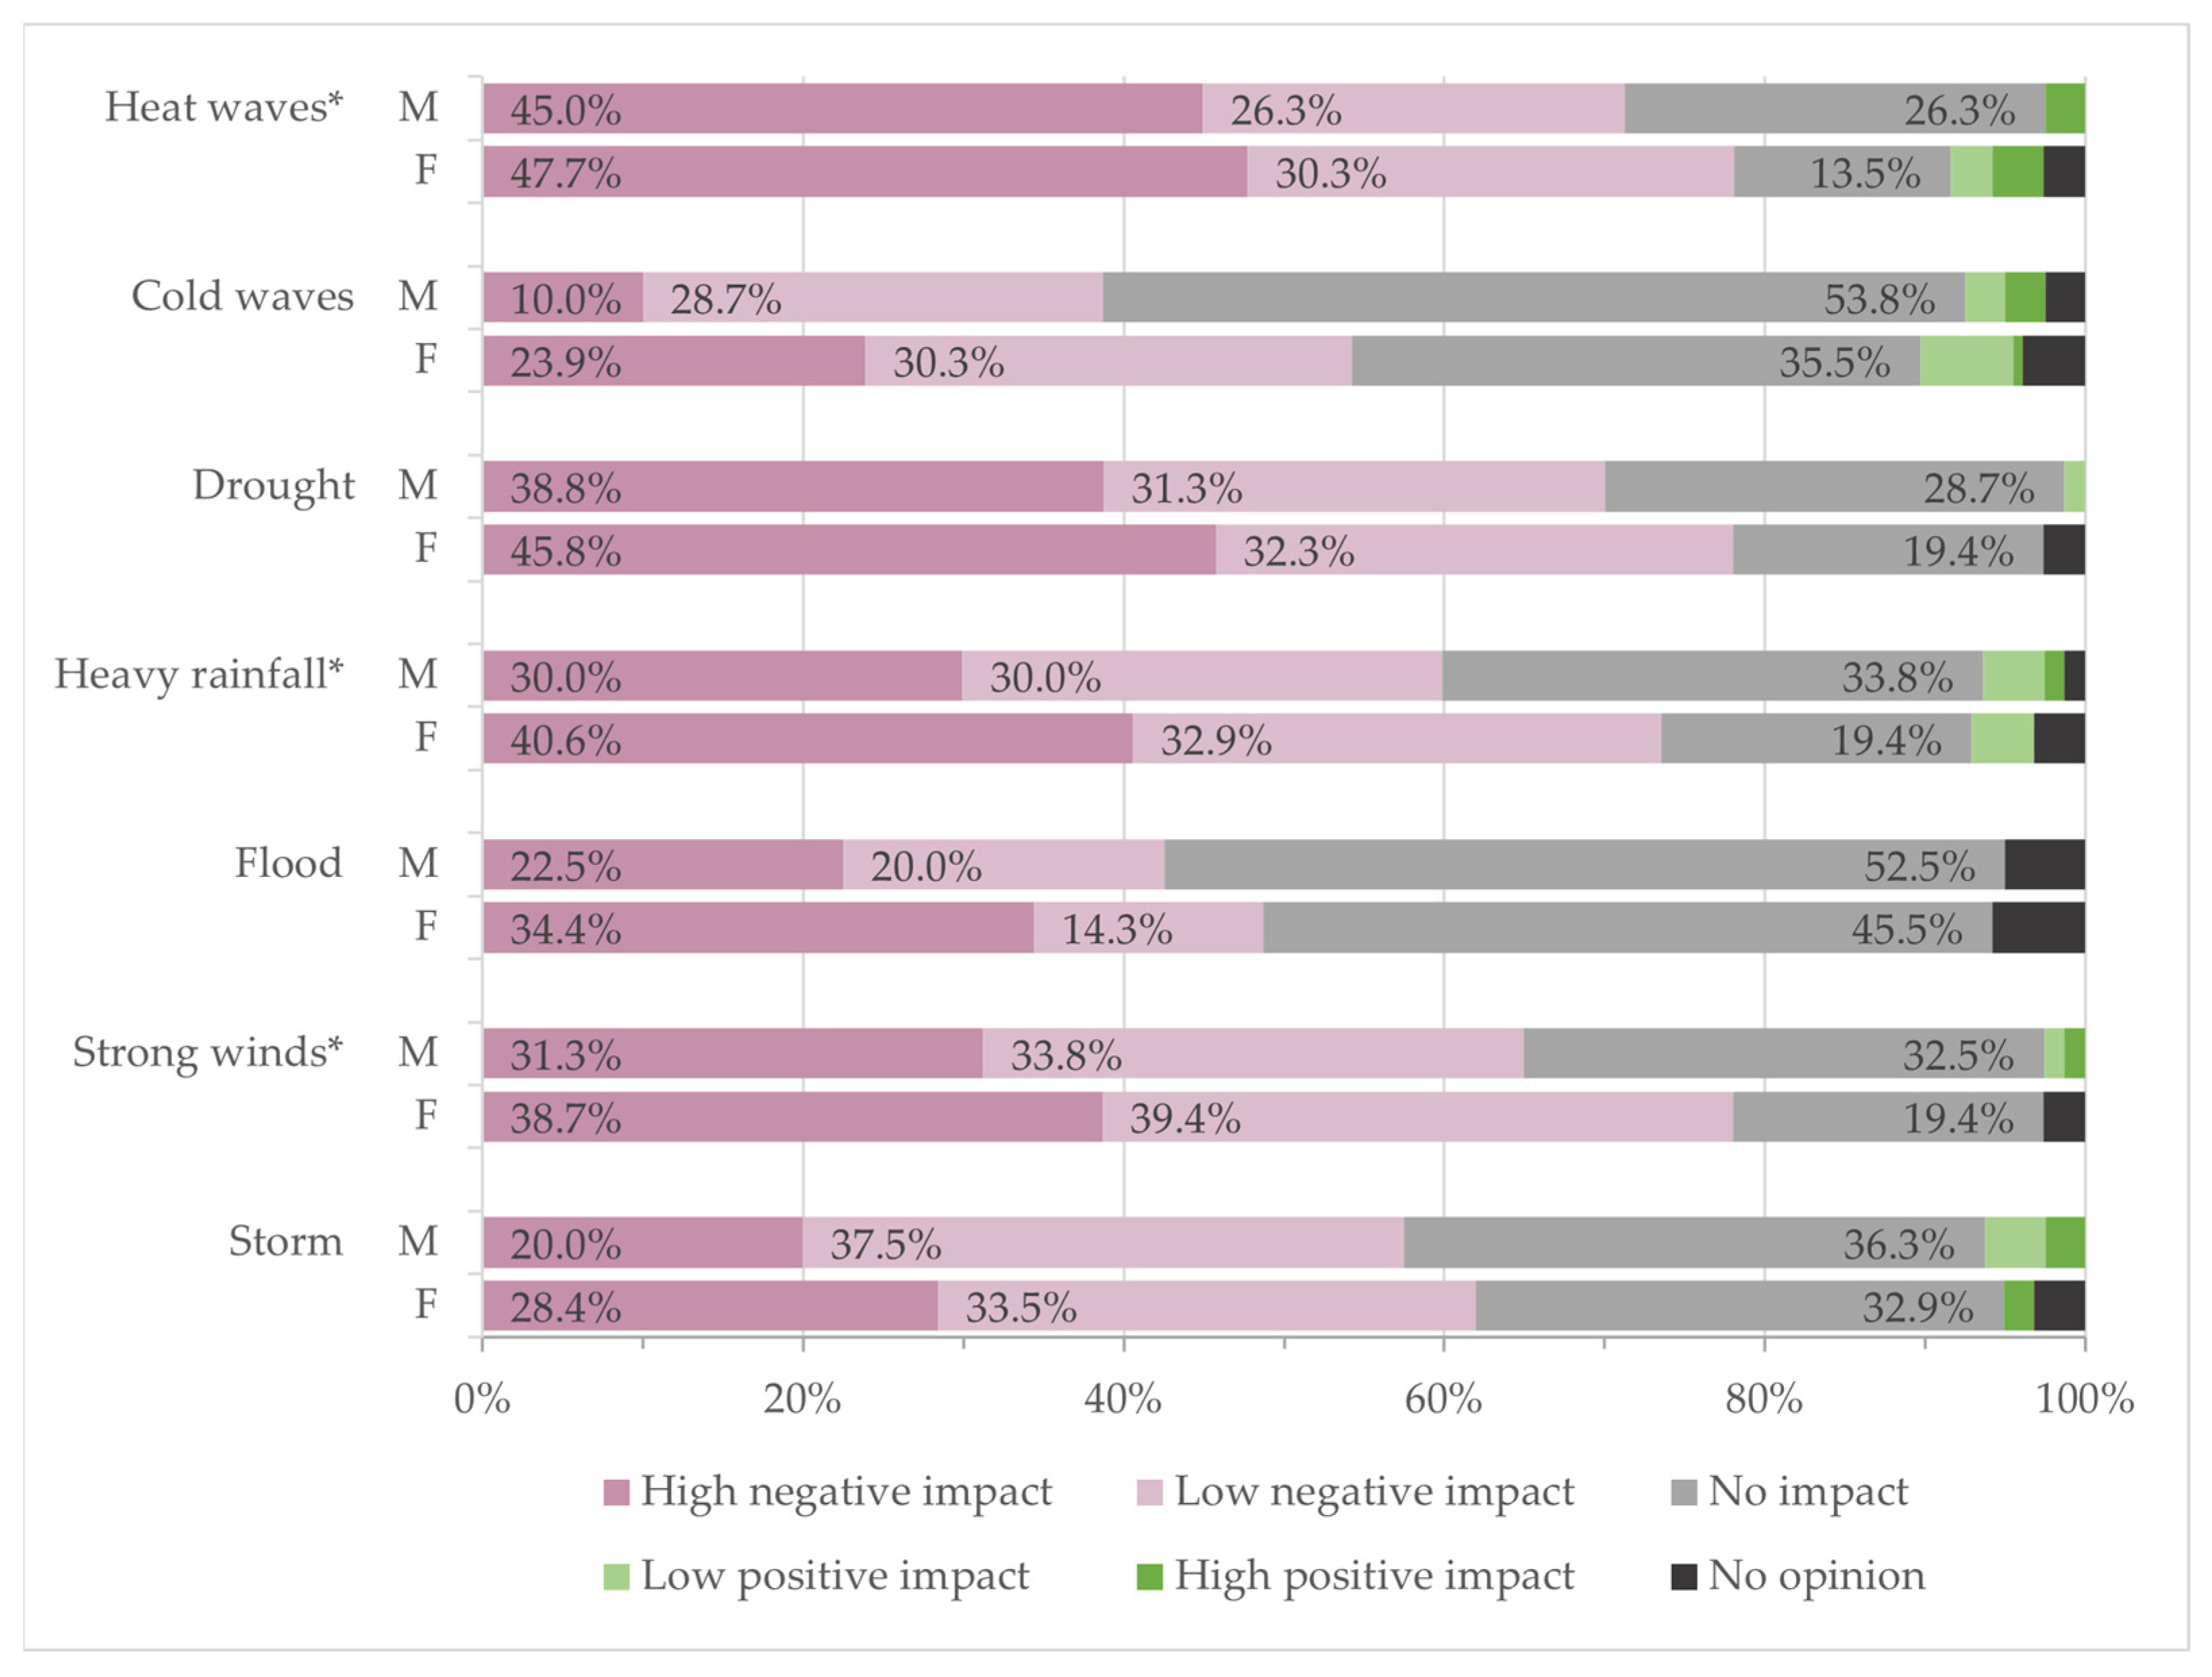
Men were more likely to declare no impact from heat waves (U = 4704.0; p < 0.05), heavy rainfall (U = 4896.0; p < 0.05), and strong winds (U = 5048.5; p < 0.05), while women rated these as unfavourable (Figure 4). Residents of single-family homes more often than residents of multi-family homes indicated that droughts (U = 5419.0; p < 0.01), floods (U = 5227.0; p < 0.05), and strong winds (U = 5728.5; p < 0.05) have a negative impact on their lives. Economically active people were more likely than economically inactive to claim that cold waves had a significant negative effect (U = 3823.0; p < 0.05).
The responses about the impact of extreme weather events on the city’s functioning exhibit a similar pattern. Over half of the surveyed assessed these events as having a negative impact. More than three-quarters believed heavy rainfall, droughts, and strong winds particularly exert a negative influence.
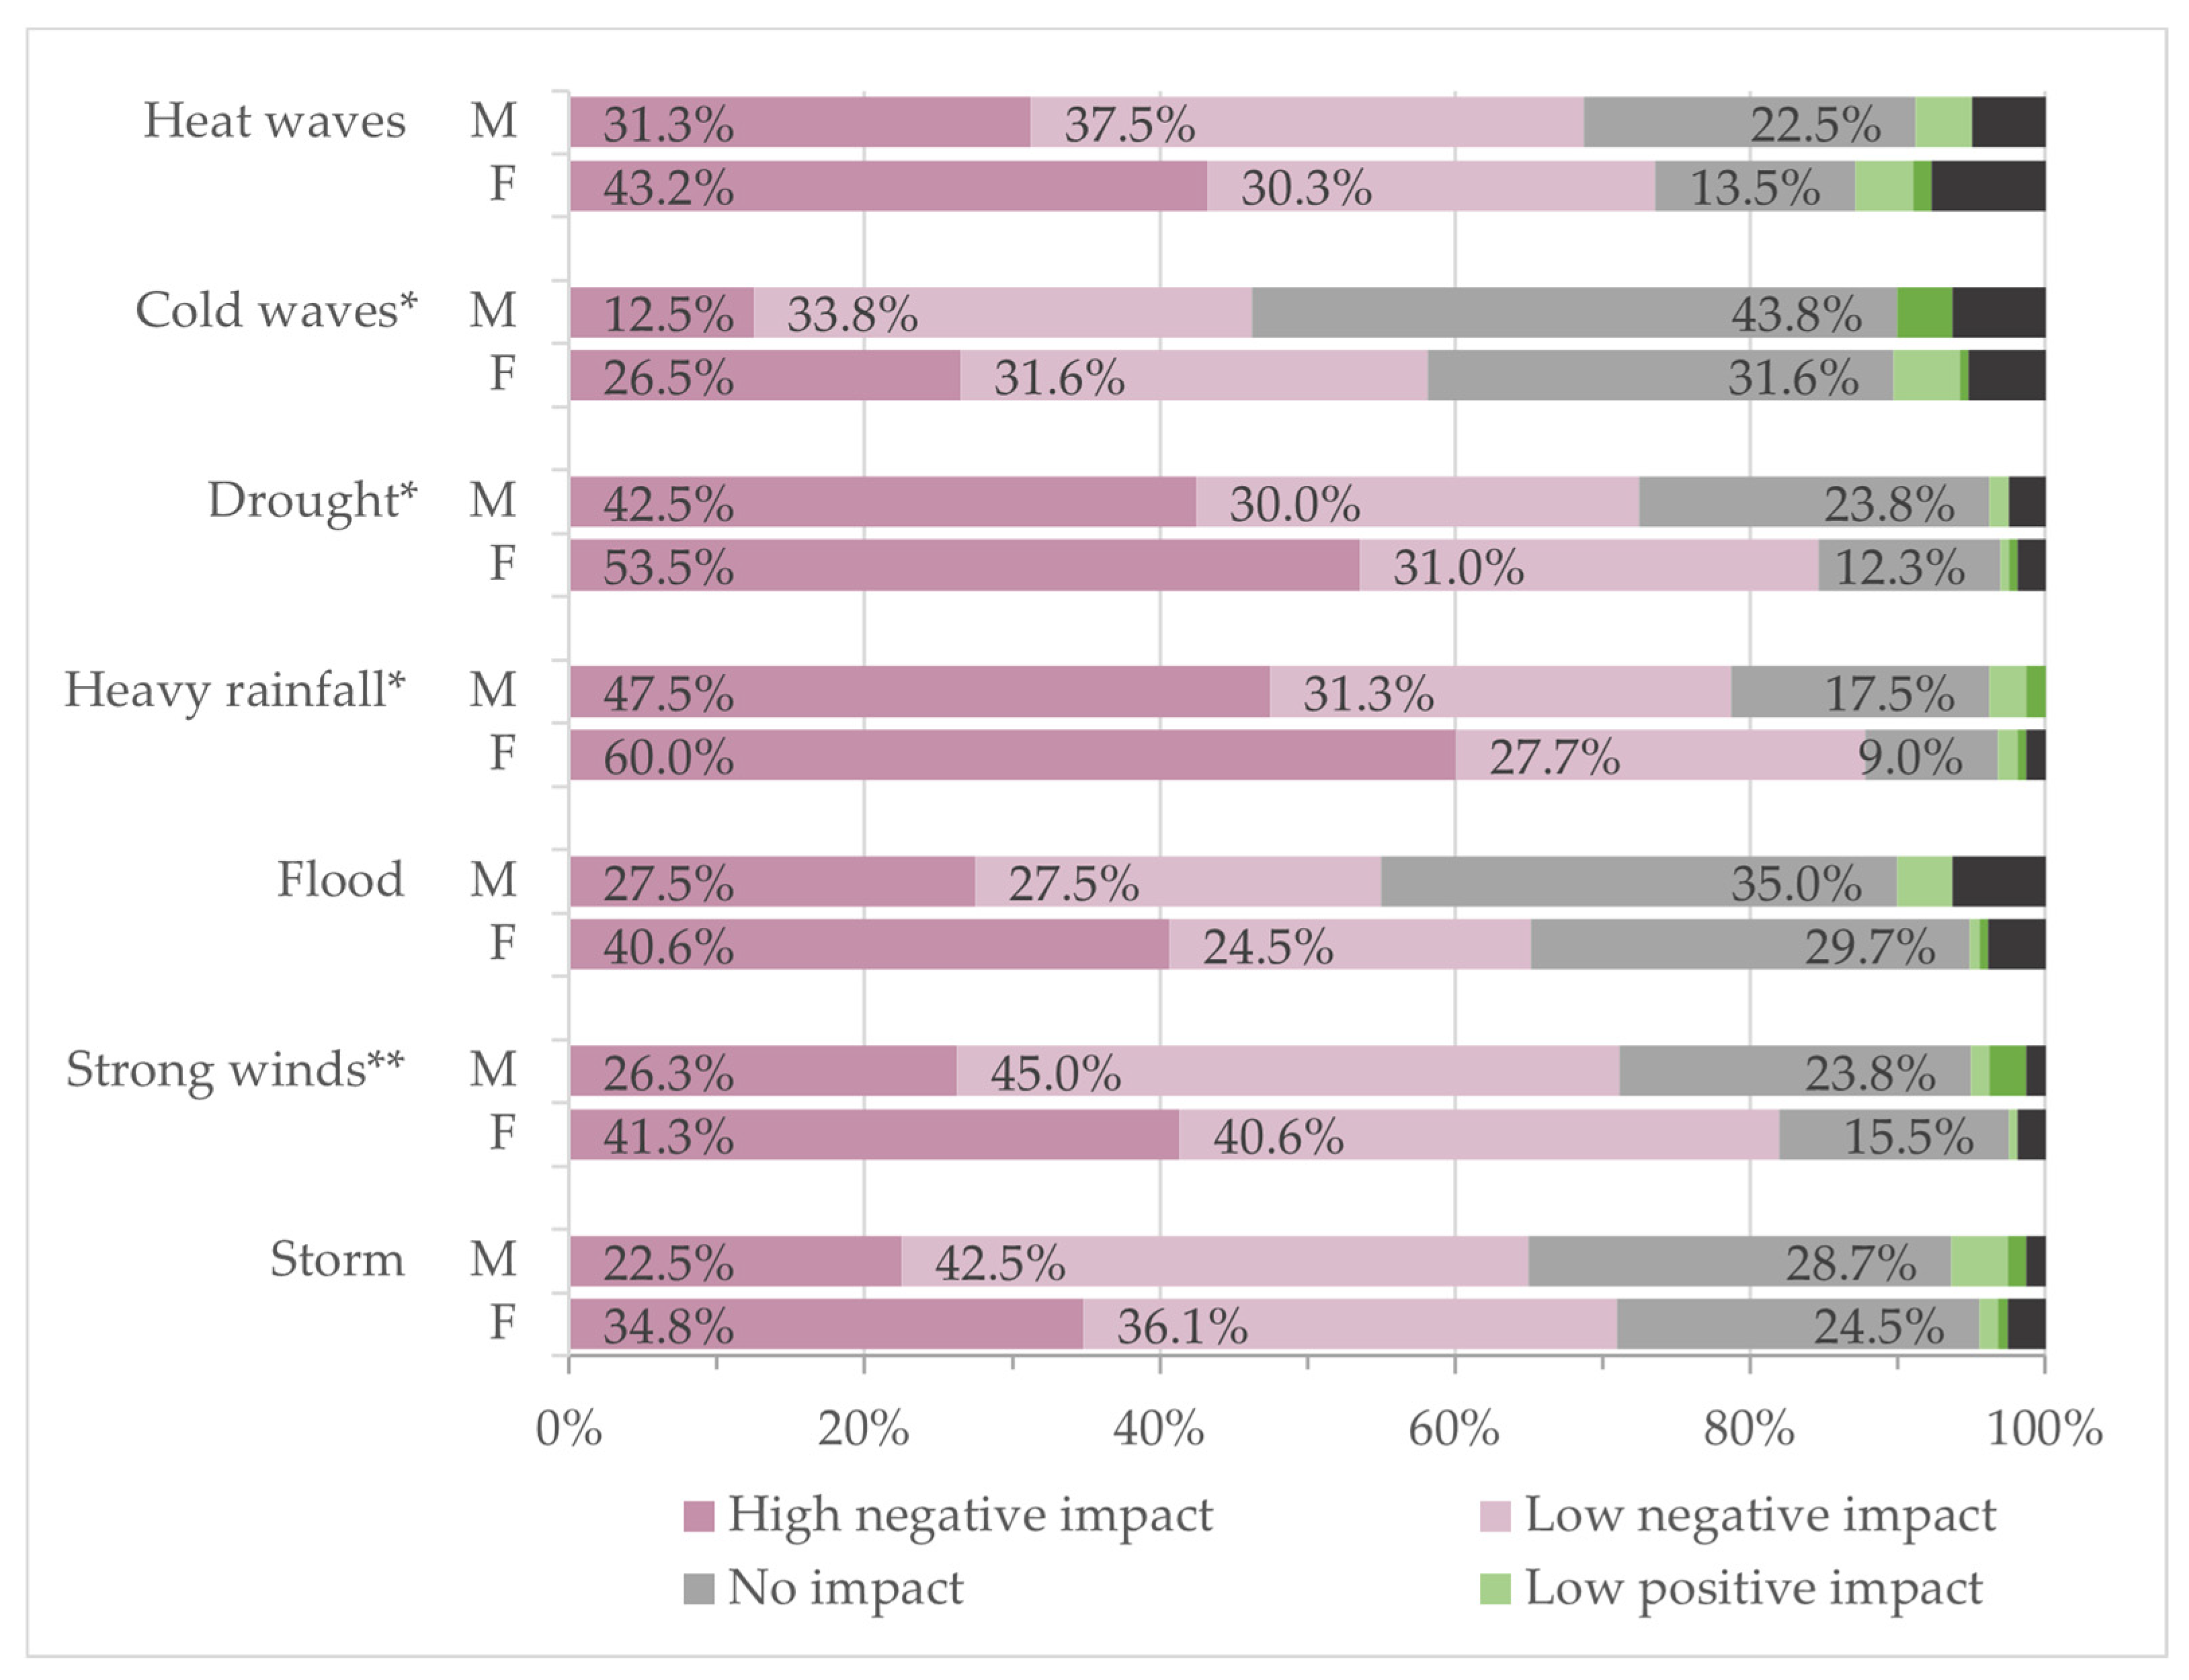
Statistically significant gender differences were noted for cold waves (U = 4604.5, p < 0.05), droughts (U = 5057.0, p < 0.05), heavy rainfall (U = 5154.0, p < 0.05), and strong winds (U = 4801.5, p < 0.01), with men more often selecting “no impact” and women “significantly negative impact” (Figure 5). Residents of single-family homes were more likely than those in multi-family homes to indicate the negative impact of heavy rainfall (U = 5512.5; p < 0.01), floods (U = 4653.0; p < 0.01), and strong winds (U = 5660.5; p < 0.05). There was no correlation between age and the perceived impact of extreme weather events on one’s own life and the city’s functioning, except for floods (R = −0.13, p < 0.05 and R = −0.14, p < 0.05), which was rated less negatively with age (“no impact” was selected more often).

3.1.4. Personal Experience

More than half of the participants reported experiencing power outages, destruction of garden plants, and flooding of buildings due to extreme weather events. Residents of single-family homes were more likely to report these effects (U = 5253.0; p < 0.01). Additionally, over 40% observed damage to the city’s infrastructure (roads, bridges, power lines) or adverse changes in the city landscape and natural environment. Only about 13% had not personally encountered any of these effects. As the number of experienced damages increased, so did the belief that climate change personally affects the respondent (R = 0.27; p < 0.05).

3.2. Perceived Adaptive Capacity (Variable B)

3.2.1. Adaptation Efficacy

Most participants agreed that undertaking adaptation actions to climate change (either individually or through city authorities) will enable them to better cope with the impacts of extreme weather. There was a significant gender difference in responses (U = 5156.5; p < 0.05), with 92% of women believing climate change adaptation is justified compared to 74% of men.

3.2.2. Adaptation Knowledge

In total, 68% of the surveyed individuals agreed that they feel well-informed about methods of coping with climate change, while 27% disagreed.

3.2.3. Self-Efficacy

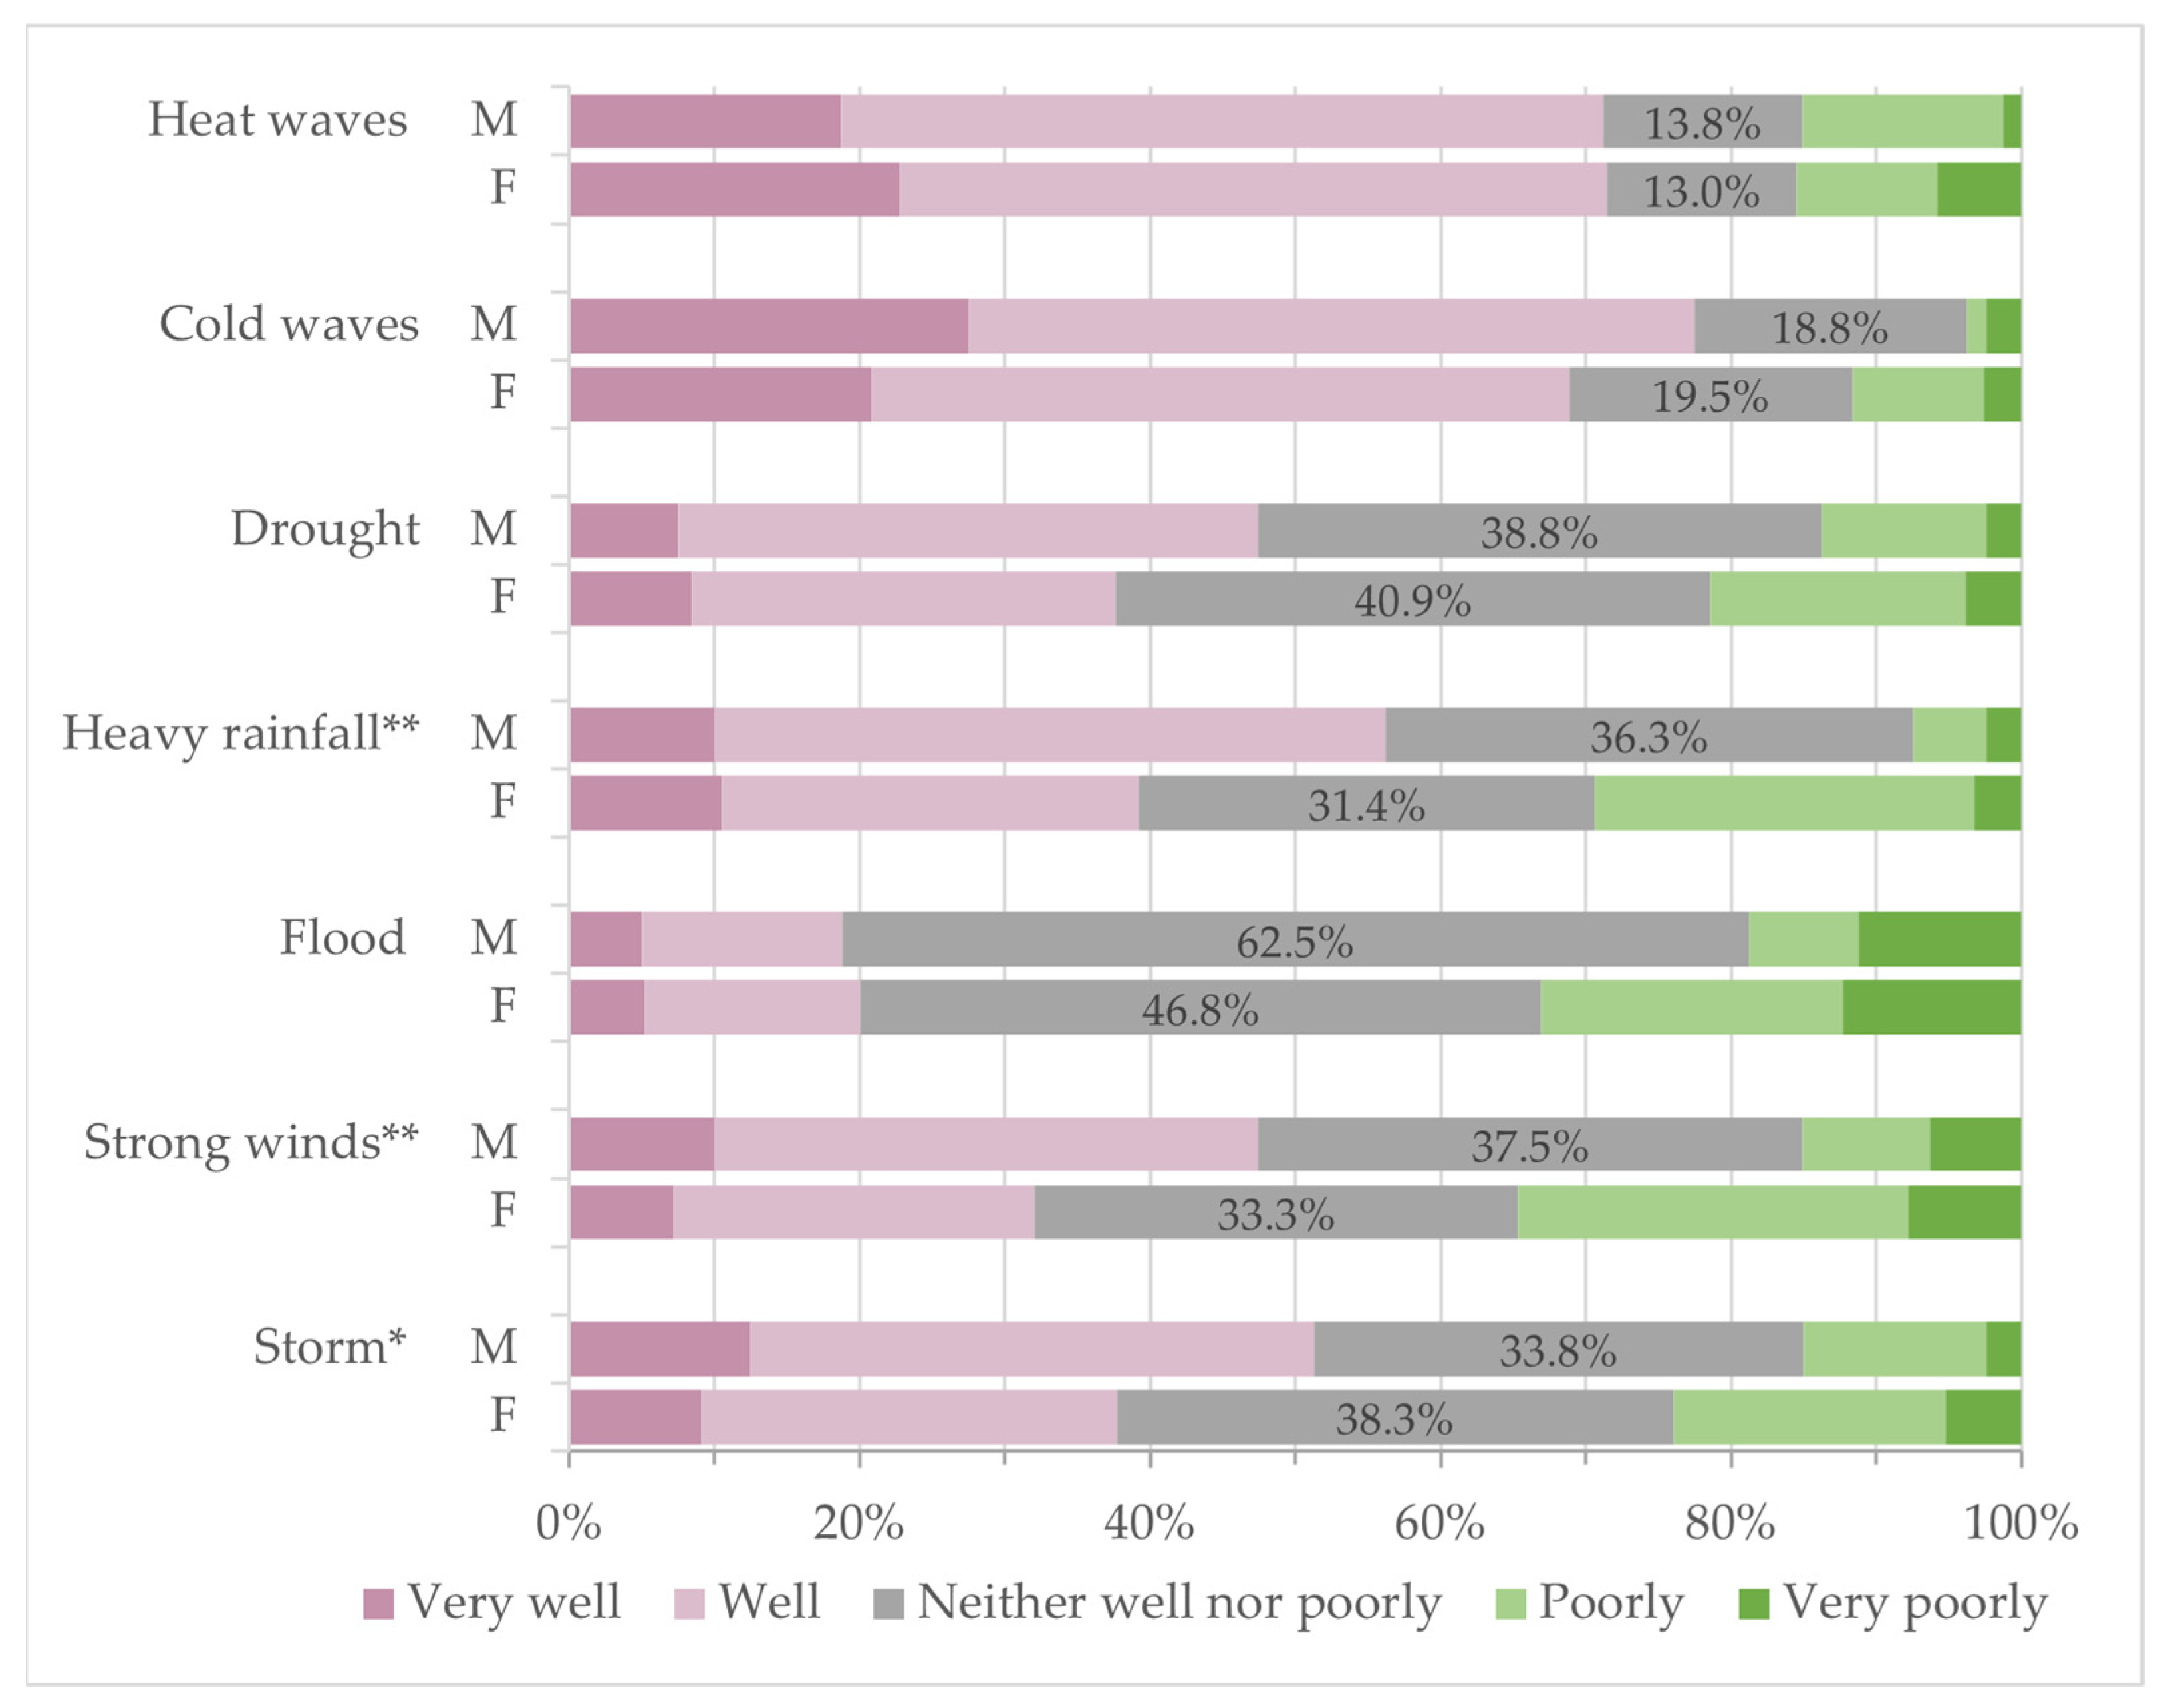
Participants rated their ability to cope with extreme weather; over 70% felt capable of handling heat and cold waves, while more than 40% felt capable of handling drought, heavy rainfall, and storms. Floods and strong winds received the most negative responses, with almost one in three indicating poor coping. There was a significant gender difference; men reported better coping with strong winds (U = 4757.5; p < 0.01), heavy rainfall (U = 4719.0; p < 0.01), and storms (U = 5163.5; p < 0.05) (Figure 6).
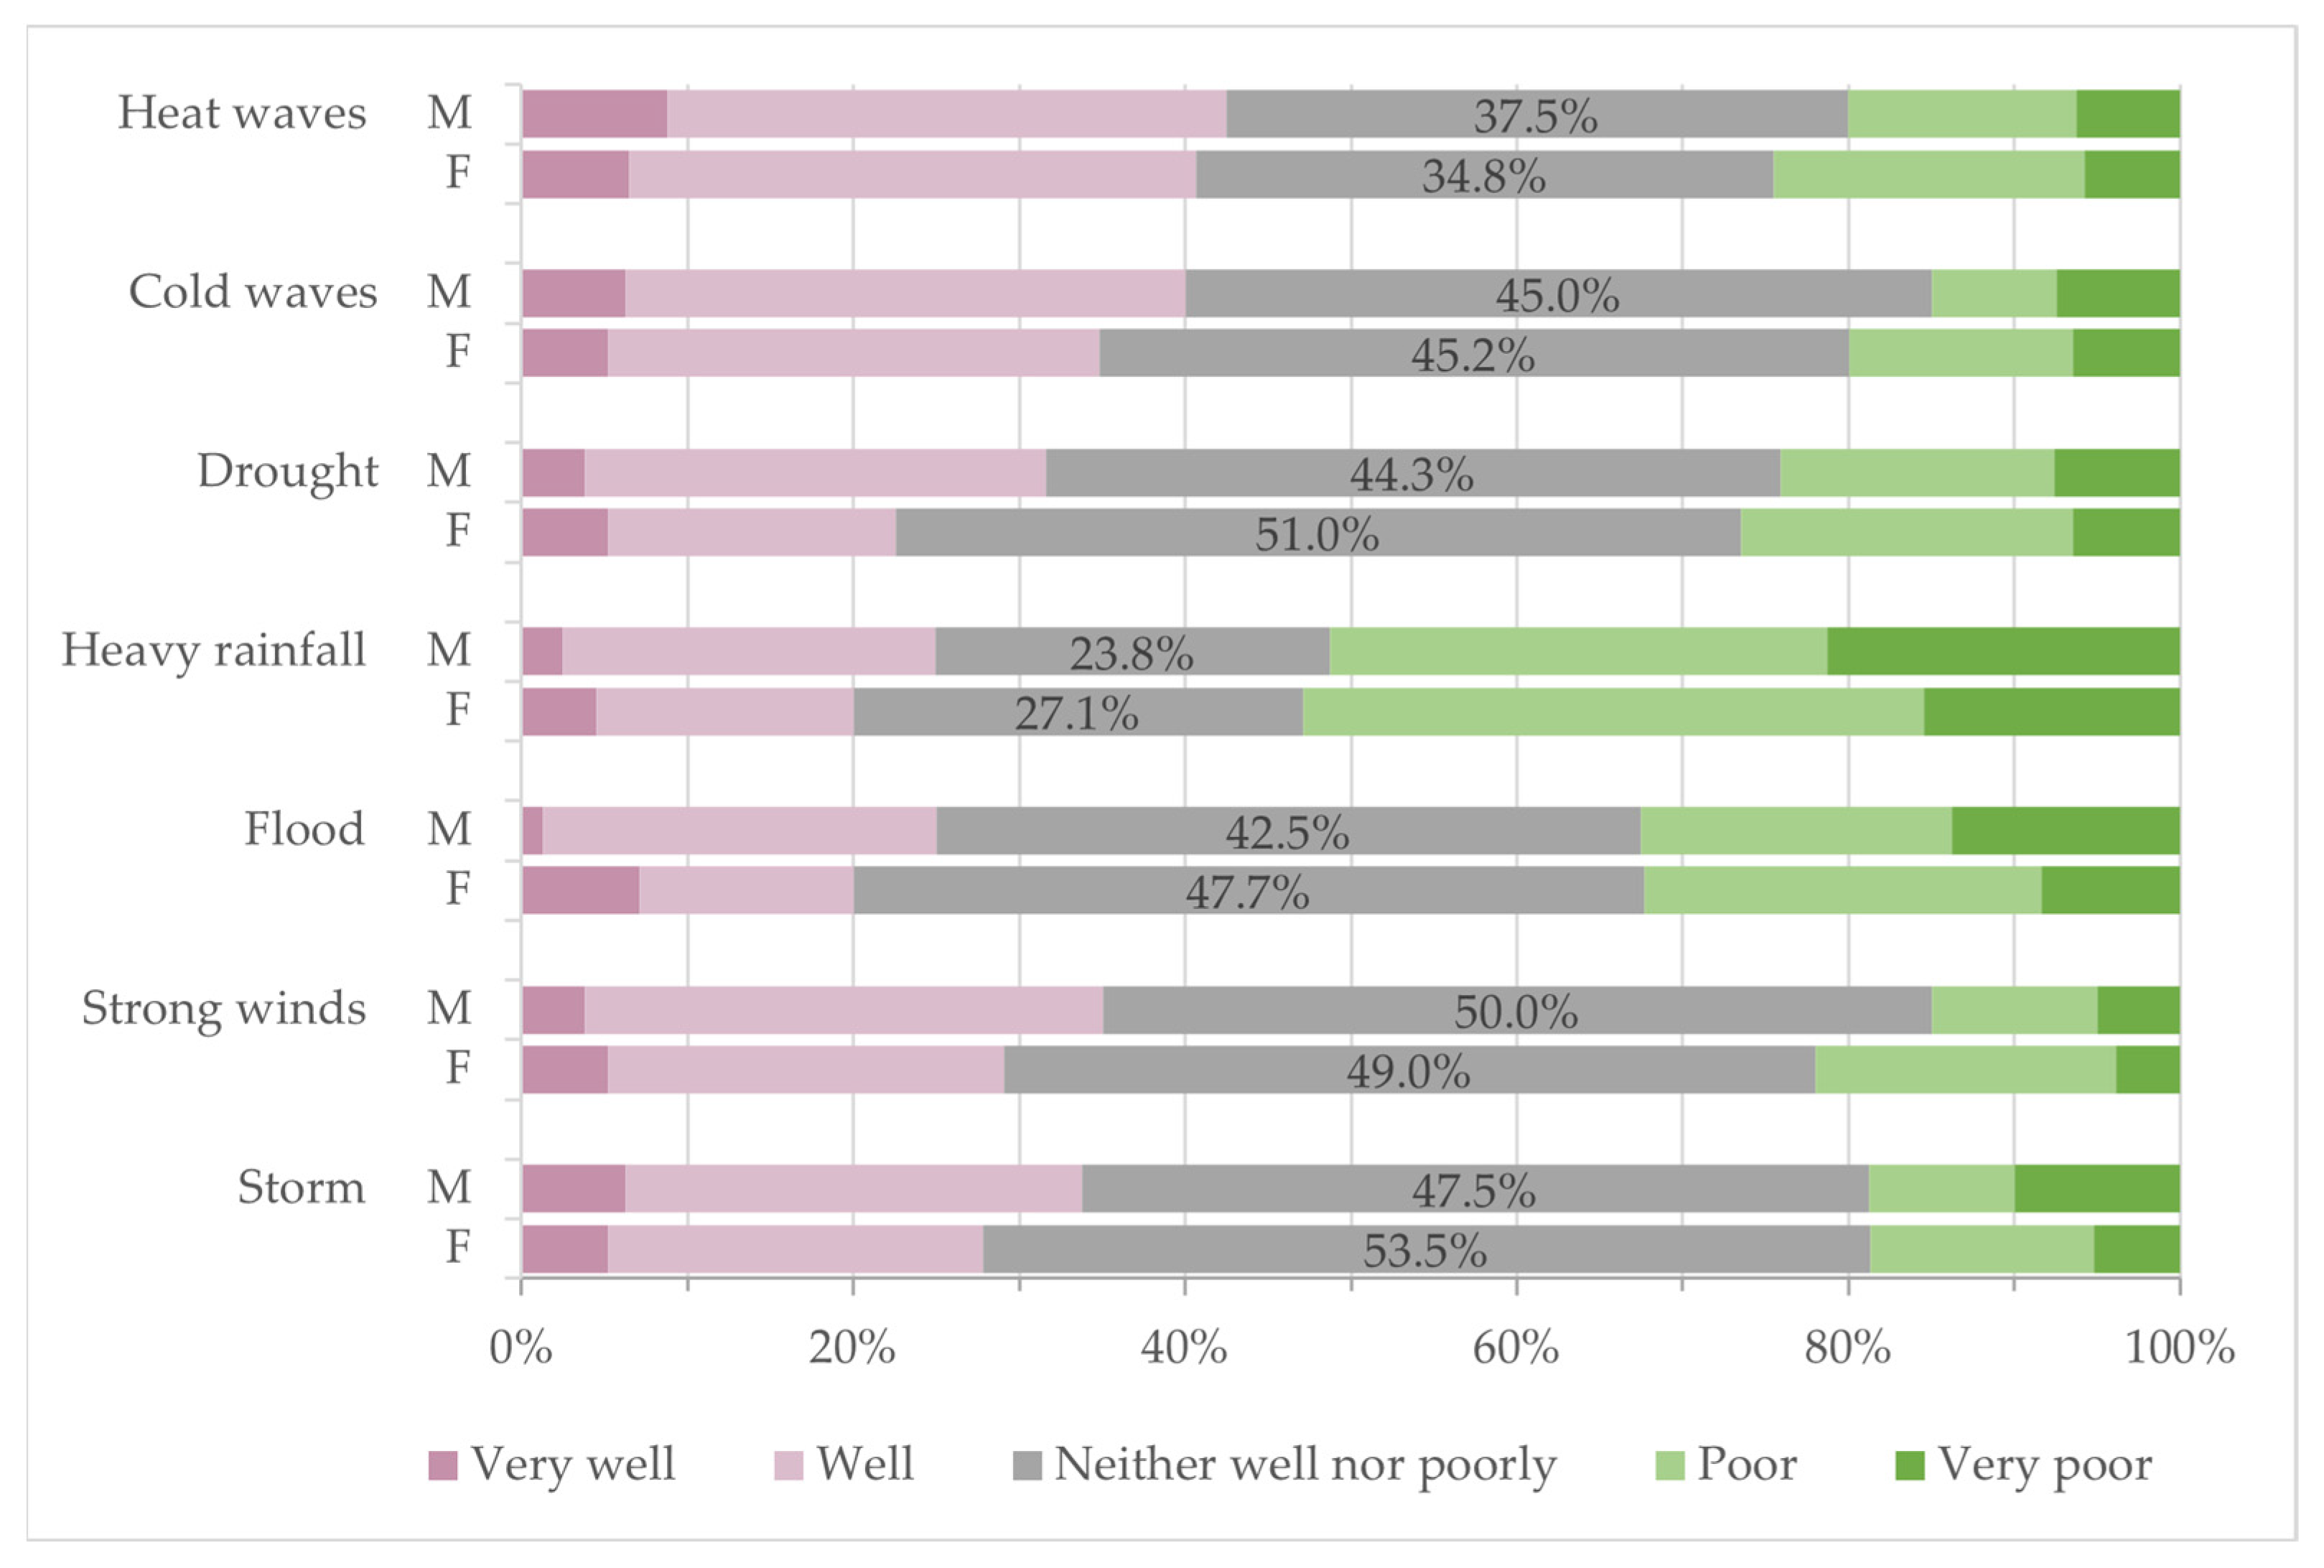
Similarly, respondents rated local authorities’ ability to deal with extreme weather, often selecting the answer “neither well nor poorly” for cold waves, floods, droughts, strong winds, and storms. According to 53% of surveyed residents, heavy rainfall is poorly managed, whereas 41% believe that the authorities handle heat waves well. There was no significant gender difference in responses (Figure 7).
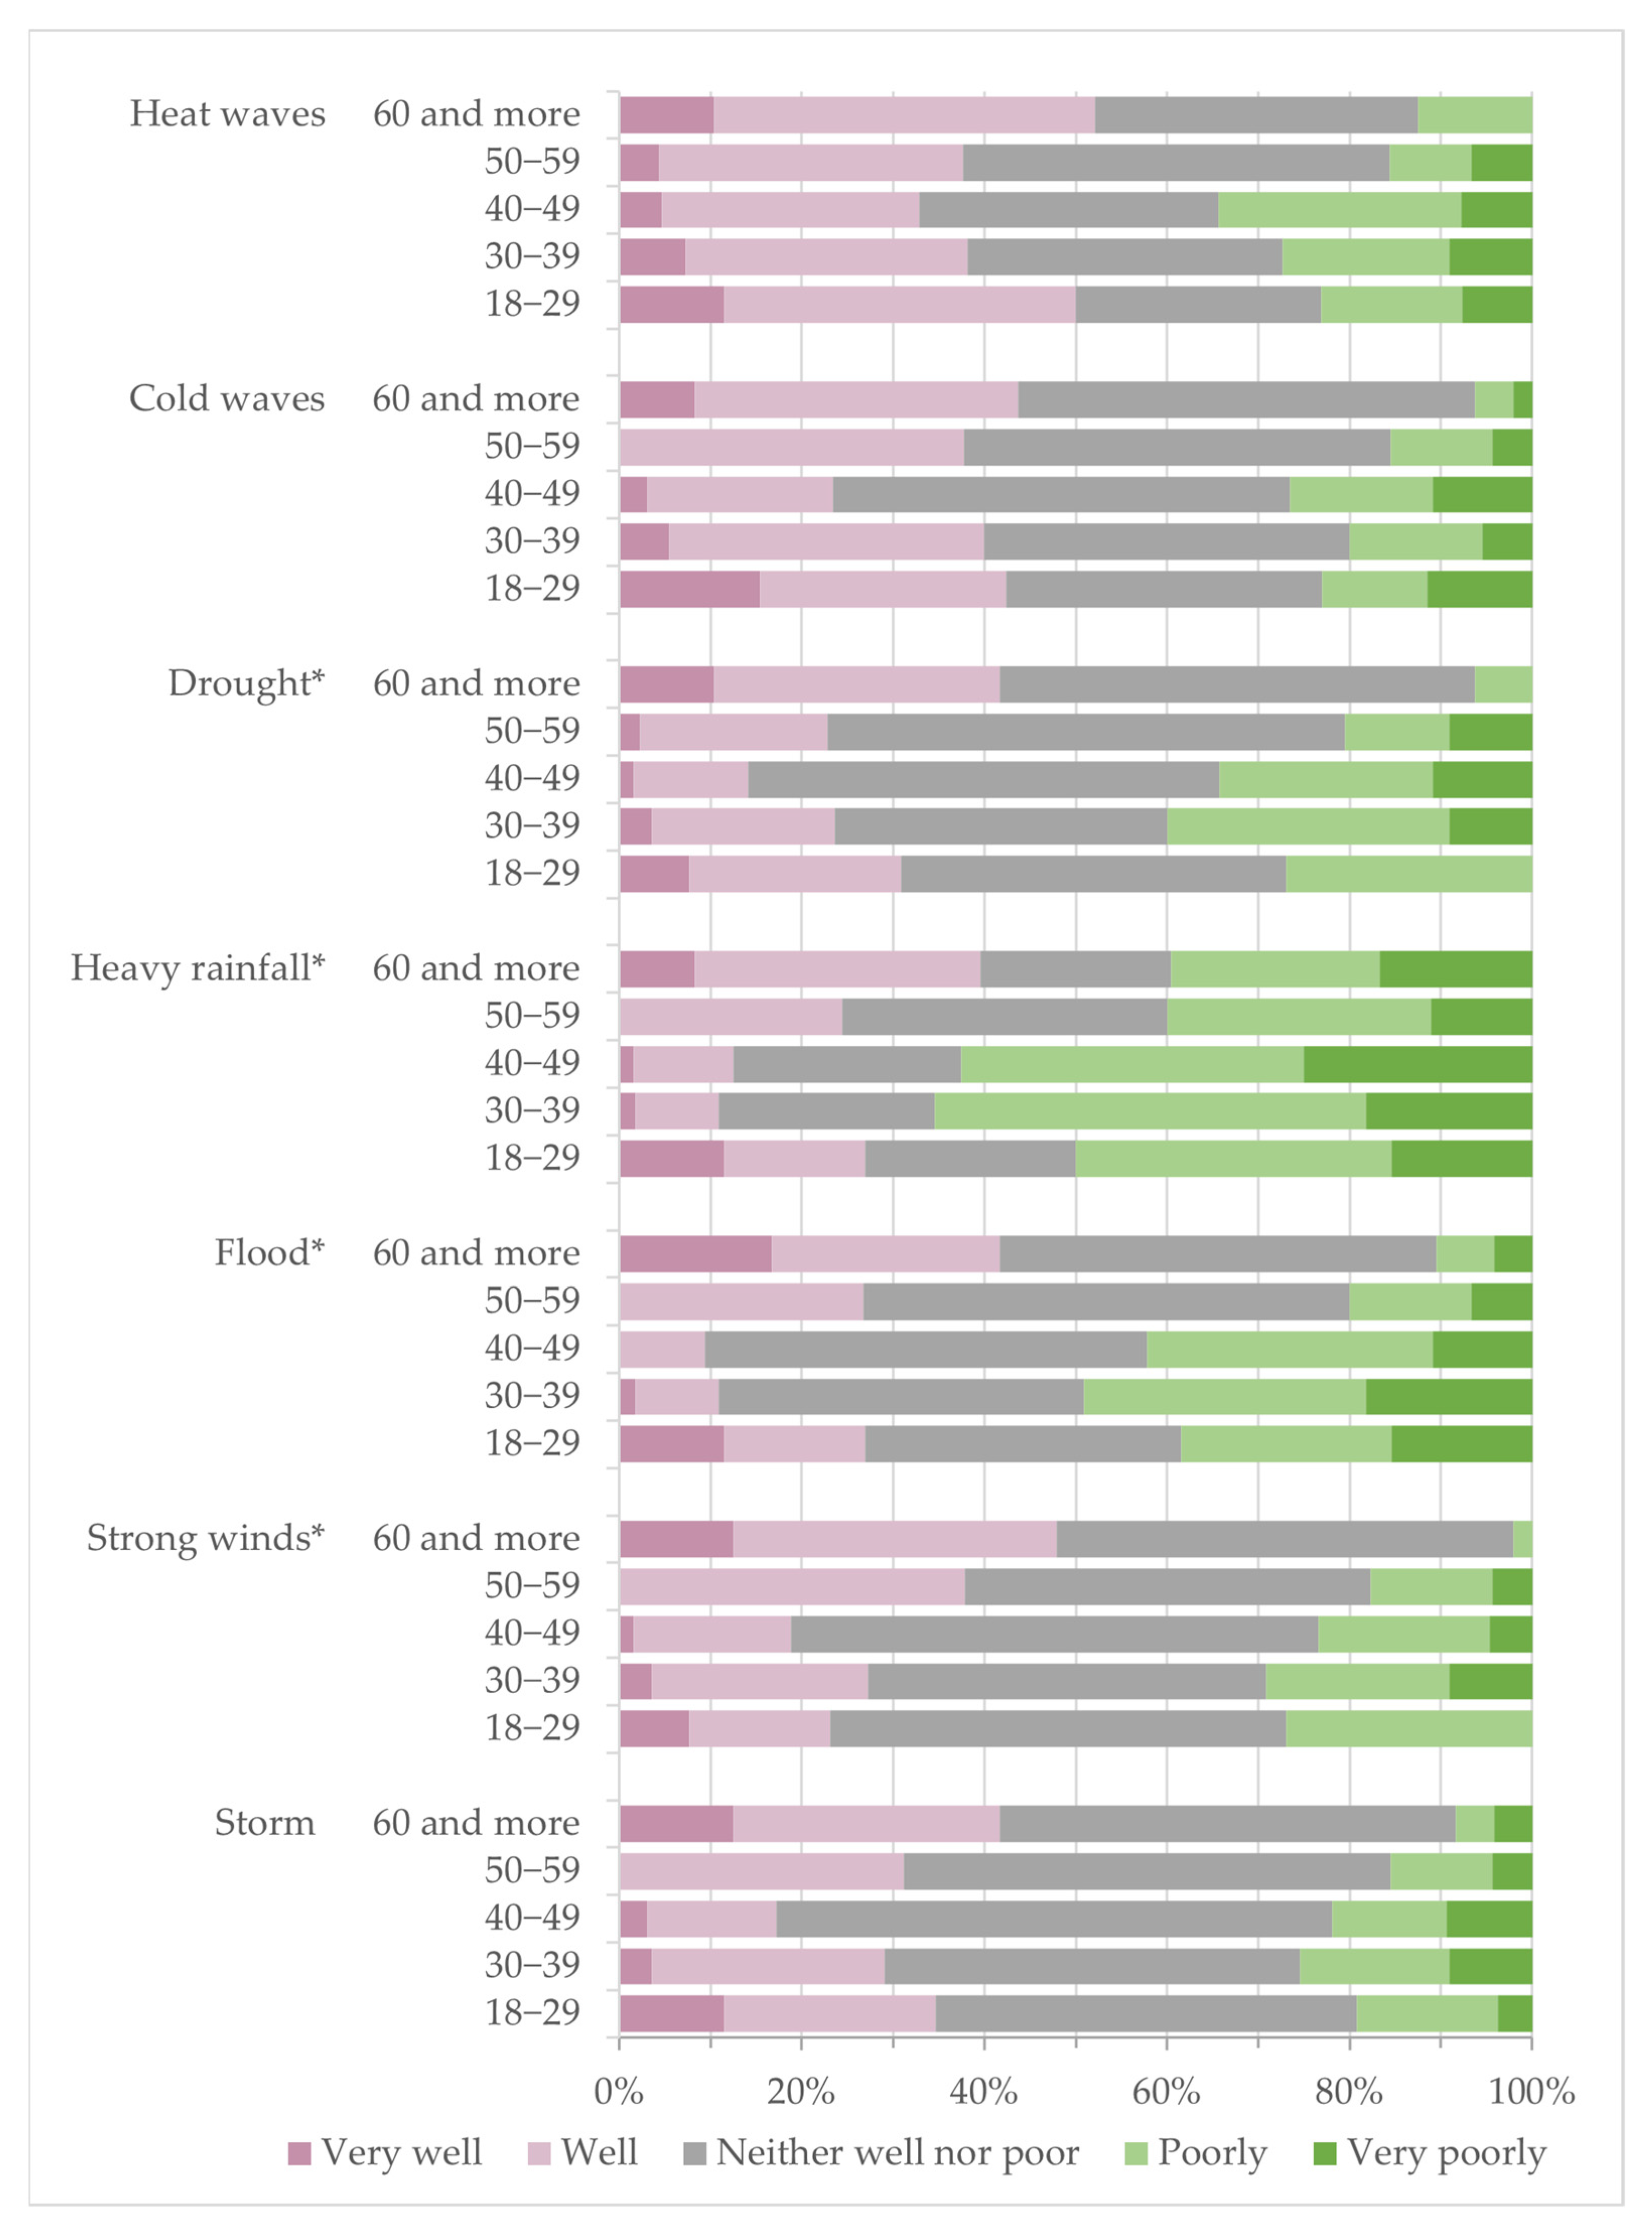
In general, non-workers rated the city government’s ability to cope with extreme weather (except for heat waves) better than workers (p < 0.05). Age correlated positively with ratings for floods (R = 0.30; p < 0.05), strong winds (R = 0.24; p < 0.05), drought (R = 0.18; p < 0.05), and heavy rainfall (R = 0.15; p < 0.05) indicating that older residents assessed city’s capacity to manage weather extremes more favourably (Figure 8).
On the other hand, the level of education negatively correlated with ratings for heat waves (R = −0.13; p < 0.05), drought (R = −0.19; p < 0.05), storms (R = −0.20; p < 0.05), floods (R = −0.24; p < 0.05), and strong winds (R = −0.24; p < 0.05). Assessment of one’s own coping abilities was positively correlated with assessment of the city’s abilities (R = 0.32; p < 0.05).

3.3. Adaptation Motivation (Variable C)

3.3.1. Adaptation Responsibility

More than half of the participants (58.4%) agreed that every citizen is responsible for preventing damage caused by extreme weather events in their household, while one-third (32.3%) held the opposite view. At the same time, more than three-quarters (77.7%) were convinced that local authorities are responsible for protecting residents and their property from extreme phenomena. In both questions, there were no statistically significant differences in responses due to the characteristics measured by the metrics.

3.3.2. Social Norms and Access to Resources

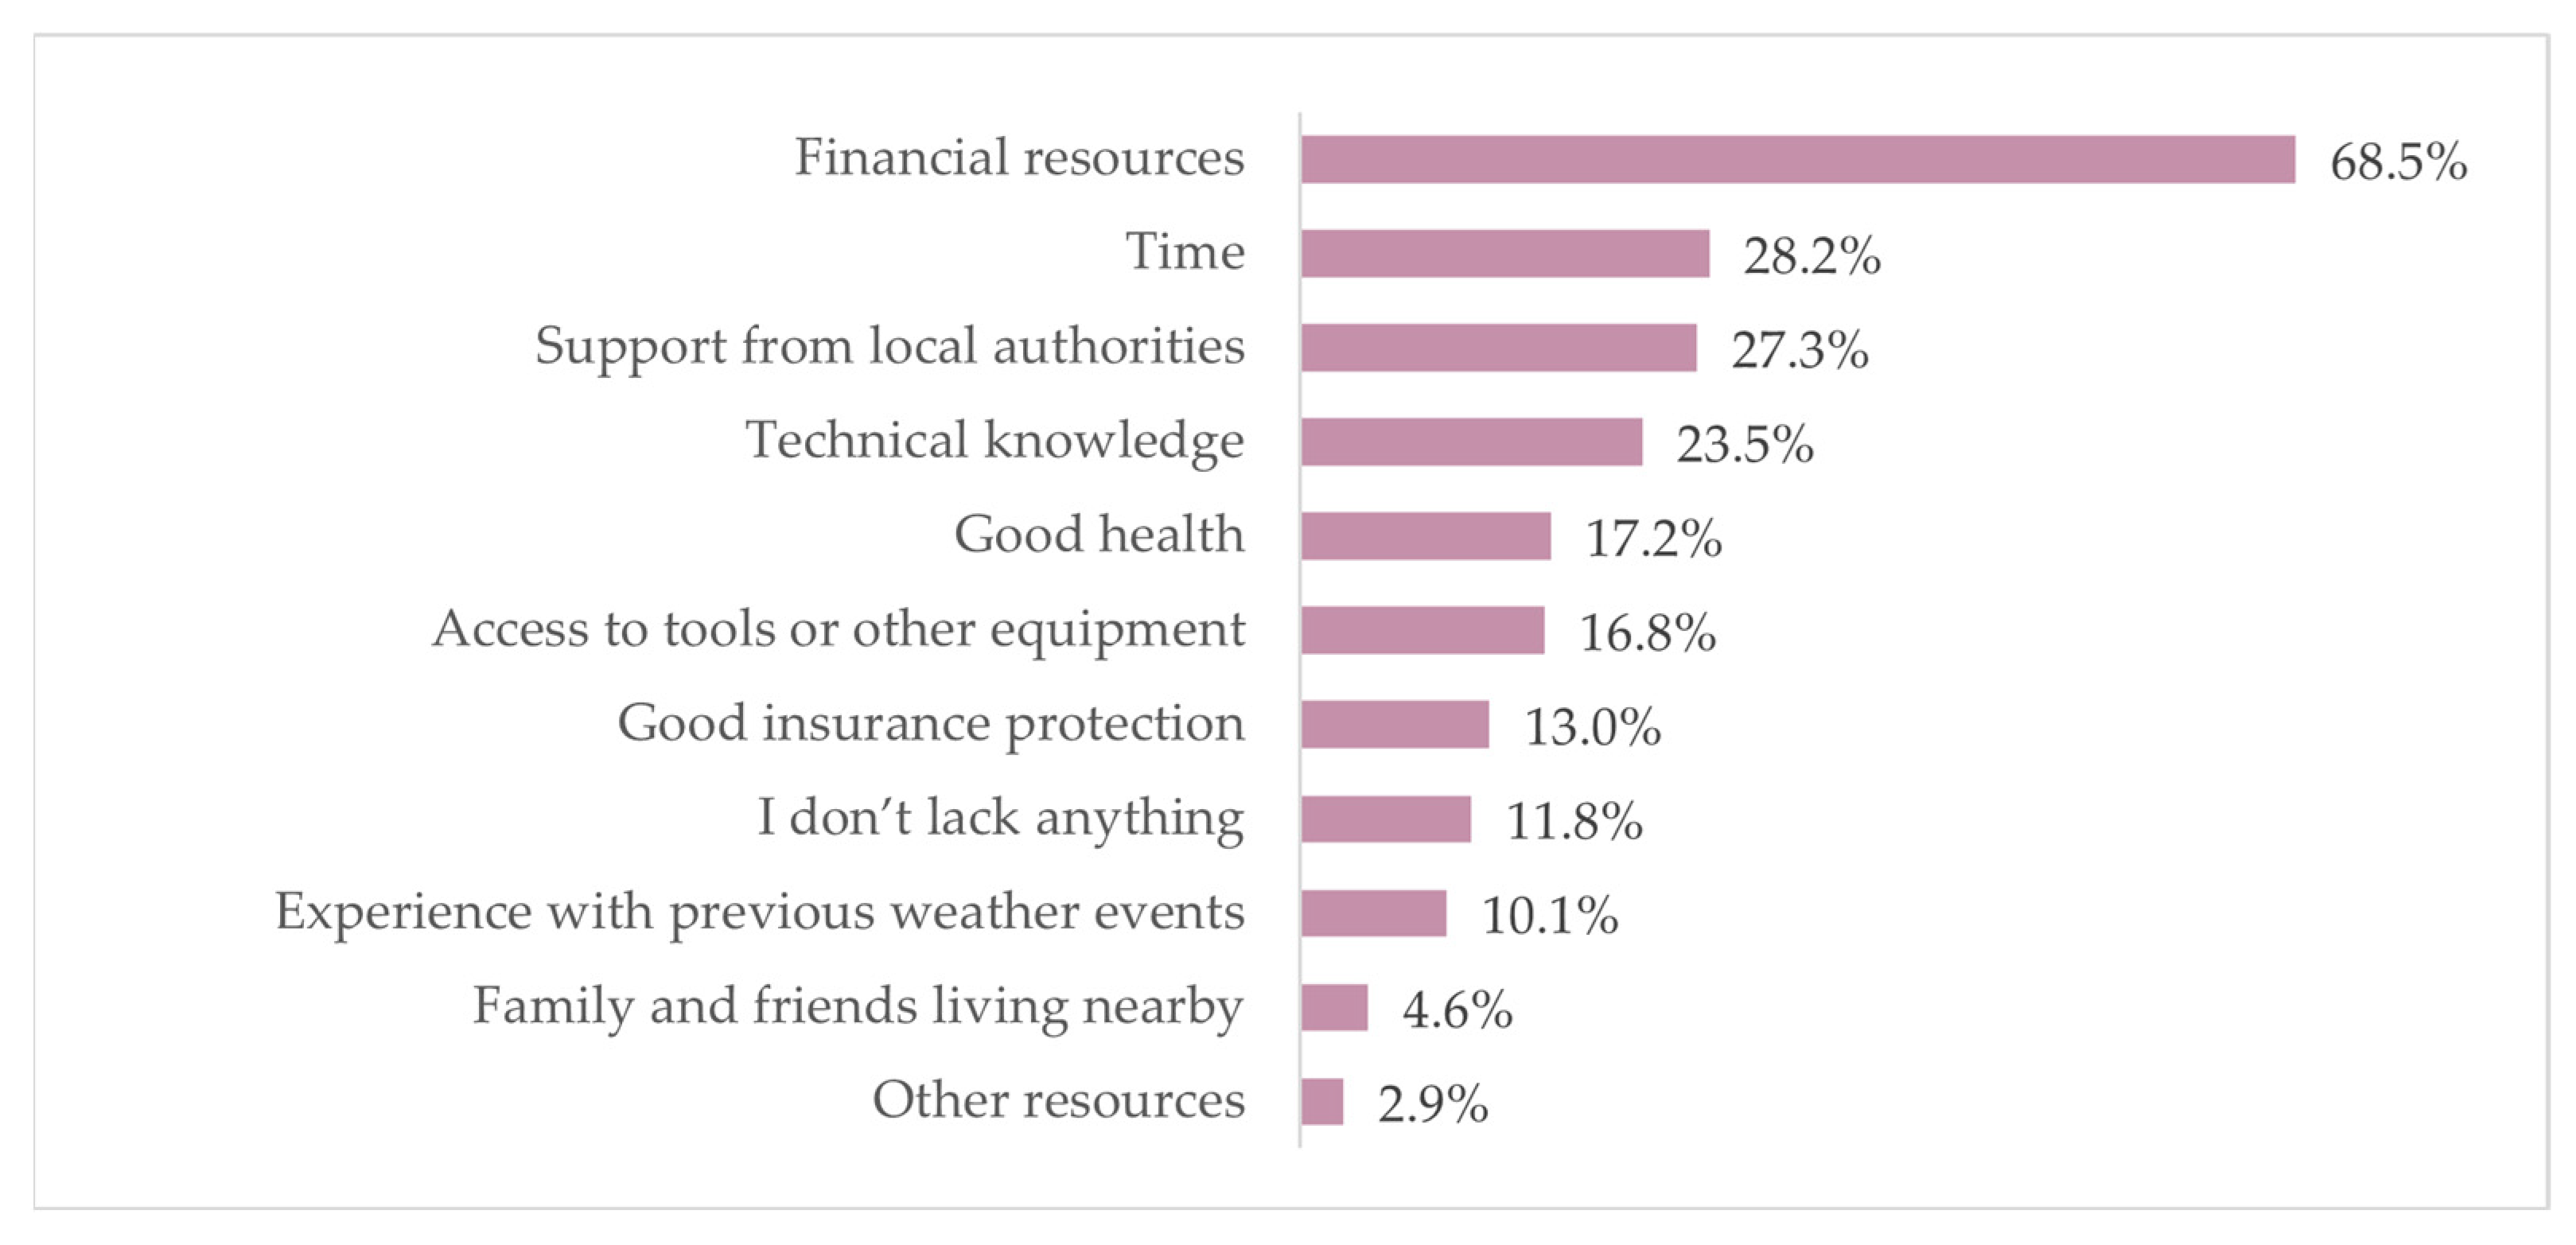
Respondents were asked to choose up to three resources they lack that would help them better cope with extreme weather. Financial resources were the most frequently selected option, followed by time, support from the local authorities, and technical expertise (Figure 9).
Significant differences in responses were observed according to respondents’ characteristics. Women indicated a lack of technical knowledge more often than men (U = 5252.5; p < 0.01). Residents of single-family homes were more likely to mention financial resources (U = 5512.0; p < 0.01), while those from multi-family homes reported a lack of good health (U = 6311.0; p < 0.05). Economically active people more often selected a lack of time (U = 4348.0; p < 0.05) and a lack of technical knowledge (U = 4191.0; p < 0.01), whereas those who were inactive chose good health (U = 4029.0; p < 0.01). Moreover, there is a correlation between age and the resources such as family and friends nearby and good health, which were more frequently expressed by elderly people (R = 0.13; p < 0.05 and R = 0.17; p < 0.05, respectively), while support from local authorities was more frequently expressed by younger participants (R = −0.16; p < 0.05).
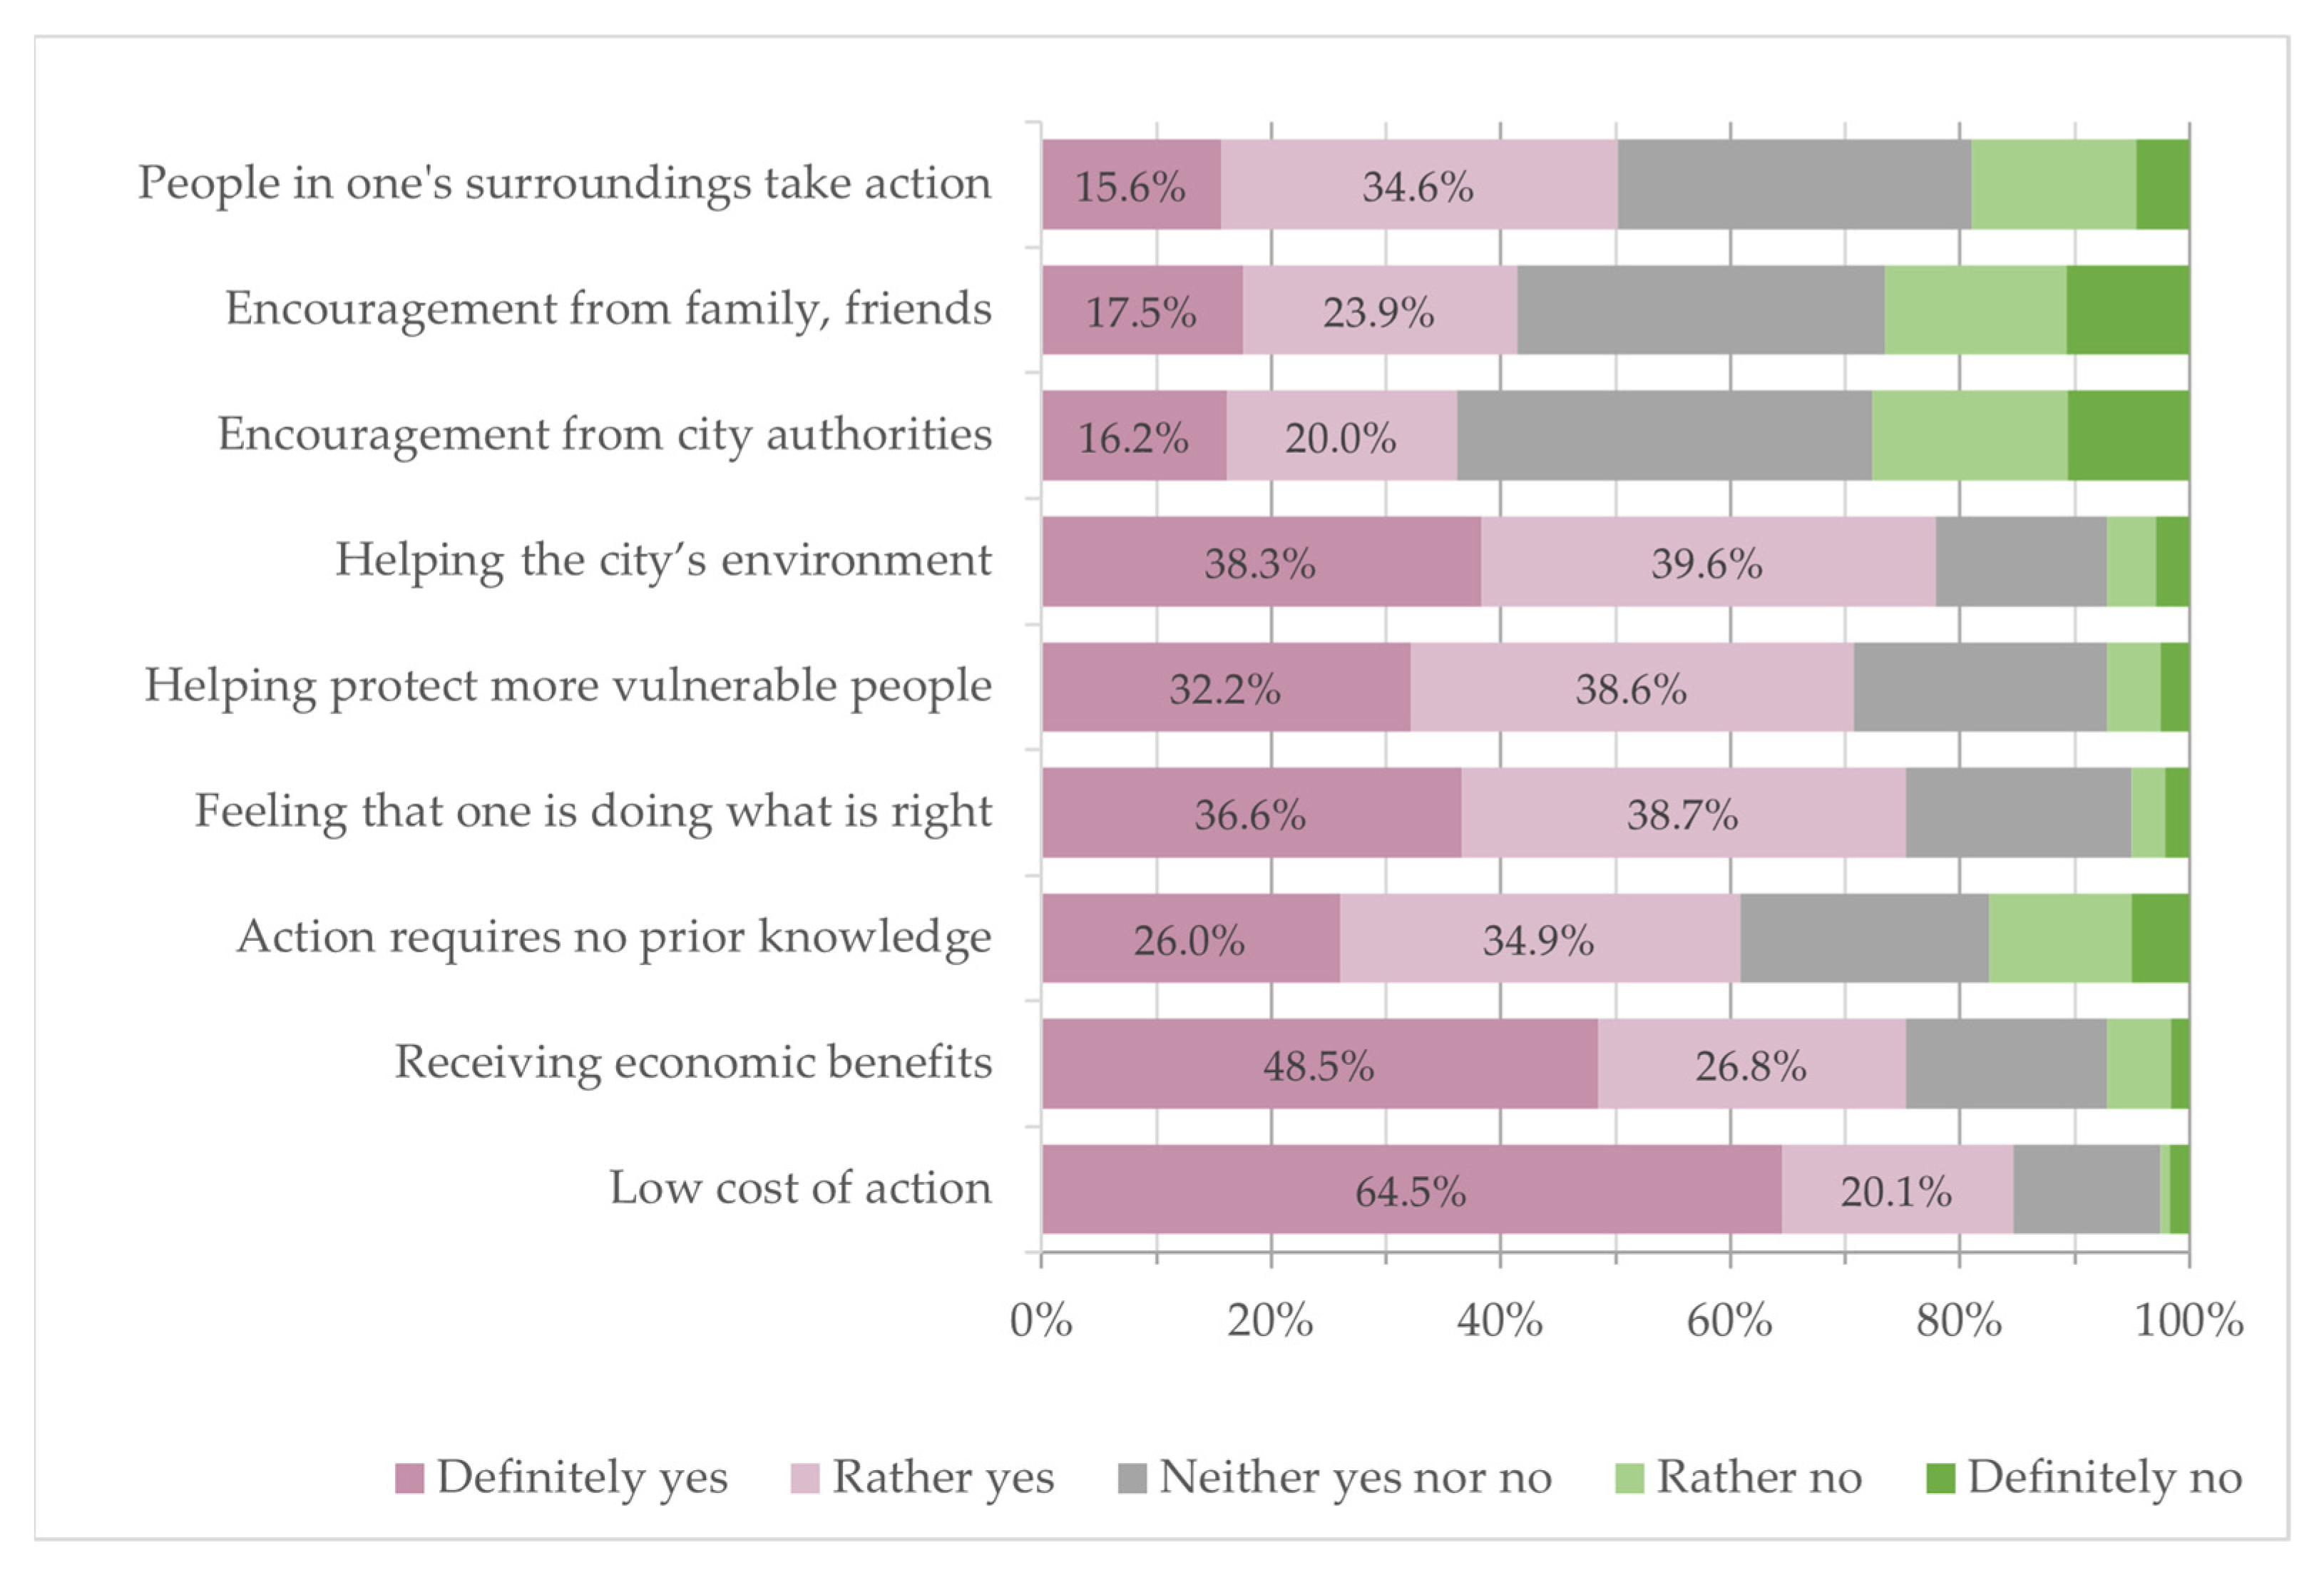
Regarding motivation to reduce the risk of damage from extreme weather, over three-quarters of participants cited economic factors such as the low cost of action or the chance of receiving financial benefits. In addition, participants mentioned ecological motivations, including contributing to the city’s environmental quality, and ethical considerations, such as acting in accordance with one’s conscience. Encouragement from local authorities or family and friends was rated as the least motivating (Figure 10).
Statistically significant differences were observed in answers regarding gender, place of residence, age, and net income per household member. Women were more likely to be motivated by protecting more vulnerable people in the community (U = 5021.0; p < 0.05) and contributing to the city’s environmental quality (U = 5050.5; p < 0.05). Residents of single-family homes were more motivated to act if it was associated with low cost (5213.0; p < 0.01) or the chance of economic benefit (U = 5145.5; p < 0.01). Furthermore, a negative correlation was found between the respondent’s age and being encouraged by family or friends (R = −0.20; p < 0.05) and receiving economic benefits (R = −0.17; p < 0.05), as well as household income level and the factors “I help protect people more vulnerable than me” (R = −0.18; p < 0.05) and “I have a clear conscience that I am doing what is ‘right’” (R = −0.15; p < 0.05).

3.4. Adaptation Behaviour (Variable D)

3.4.1. Adaptive Actions Taken and Intended

Of the measures that can mitigate the impacts of heatwaves, more than half of the respondents reported they had already purchased a house fan (50.8%), insulated the house (57.6%), covered windows with blinds, shades, etc. (62.6%), and installed LED lights (74.8%). Planting trees near the house also ranked high (according to declarations of 46.2% of participants) (see Table A1 in Appendix A). The most popular actions planned in the next five years included installing an air conditioner and indoor or outdoor blinds or shades.
Over half of the interviewees have replaced household appliances with more water-efficient models, and about a third have reduced concrete surfaces in favour of vegetation and installed rain barrels to mitigate the impact of flash floods and the urban heat island effect. These actions, along with influencing housing associations to take adaptation measures, are among the most planned for the next five years. For 10 of the 12 measures, over a third of participants reported not applying it to their home.
More than half of the participants indicated that they were prepared for power outages from heavy rainfall, floods, strong winds, and storms, and about 45% planned to care for and warn elderly relatives or neighbours before upcoming weather events. Women were significantly more likely than men to undertake or plan this caregiving (U = 4970.0; p < 0.05).
When analysing the responses on adaptation actions collectively, on average, more measures were taken by residents of single-family houses than multi-family houses (U = 4533.4; p < 0.01, m = 7.69 and m = 5.36, respectively). An analogous situation applied to planned activities (U = 5190.0; p < 0.01), i.e., residents of single-family houses planned on average 5.44 actions, while those from multi-family houses planned 3.94. This difference was due, among other reasons, to the fact that the latter indicated the answer “Not applicable to my house” more often. Furthermore, the number of planned activities was found to decrease with the respondent’s age (R = −0.23; p < 0.05) and to increase with their level of education (R = 0.17; p < 0.05). No statistically significant differences were observed in terms of gender and economic activity. The number of already undertaken adaptive measures was negatively correlated with the number of measures planned (R = −0.33; p < 0.05).

3.4.2. Grassroot Initiatives

Over 90% of the surveyed declared that they were not members of organisations influencing local climate adaptation policy or actively participated in associations, civic groups, or residents’ groups aiming to improve the city’s climate and environment.

3.4.3. Adaptation Policy Support

Respondents showed high support for city authorities implementing adaptation measures to reduce the adverse effects of climate change in Starachowice. The vast majority assessed positively the intention to invest in planting trees in public spaces (97.9%), establishing new green areas (94.5%), modernising sewer infrastructure (94.1%), and constructing flood defences (90.8%).

3.5. Key Correlations Between the Variables

The main correlations between the items representing four variables (A, B, C, D) of social adaptive capacity in the case study are summarised in Table 4 and interpreted below.

3.5.1. Risk Perception (A) and Perceived Adaptive Capacity (B)

Respondents who reported a greater variety of damages due to extreme weather events (Q5) were more likely to believe that taking adaptation measures would help them better cope with such impacts (Q8). They also rated both their own ability to cope with extreme weather (Q15) and the city’s ability (Q16) more poorly. In addition, a positive correlation was observed between the belief in the usefulness of adaptive actions (Q8) and the belief that climate change personally affects the respondent (Q2) (Table 4).

3.5.2. Risk Perception (A) and Adaptation Motivation (C)

No correlation was found between the variety of damages experienced (Q5) and beliefs about responsibility for climate change adaptation (Q6, Q7). Those who reported being affected by more types of damage (Q5) were more likely to indicate a lack of resources (Q13), such as financial resources, local authorities’ support, technical knowledge, and time, which would help them better cope with extreme weather (Table 4). At the same time, they identified factors such as the improvement of the city’s environment, encouragement from family or emulation of others’ actions, and concern for more vulnerable community members as motivations for taking adaptive actions (Q14) (Table 5).

3.5.3. Risk Perception (A) and Adaptation Behaviour (D)

A statistically significant positive correlation was observed between the number of damages experienced (Q5) and the number of adaptation actions planned (Q9–11.2) and already performed (Q9–11.1). Respondents who believed that climate change affects them personally (Q2) were more likely to plan adaptation actions (Q9–11.2) (Table 4).

3.5.4. Perceived Adaptive Capacity (B) and Adaptation Motivation (C)

Analyses showed a positive correlation between the belief that adaptation actions help to better cope with the effects of extreme weather (Q8) and both the belief in individual responsibility for household protection (Q6) and in local authorities’ responsibility to protect residents and their property from extreme phenomena (Q7). At the same time, a higher mean score for the city’s ability to cope with extreme events (Q16) corresponded with a stronger belief in citizens’ responsibility to prevent damage (Q6), while belief in the local authority’s responsibility for protecting residents and their property (Q7) correlated with a lower mean score of the city’s ability to cope with extreme events (Q16). Moreover, those who attributed responsibility to local authorities (Q7) were also more likely to report a lack of support from the municipality (Q13). Respondents who rated their coping ability less favourably (Q15) identified experience, technical knowledge, family and friends nearby as lacking resources that would help them cope better (Q13) (Table 4).

3.5.5. Perceived Adaptive Capacity (B) and Adaptation Behaviour (D)

Correlations were found between the mean score of one’s coping abilities (Q15) and the number of adaptation actions planned (Q9–11.2) and performed (Q9–11.1). In other words, the individual who rated their coping skills as poorer declared that they had performed fewer actions but had more planned. Moreover, the belief that taking adaptation actions would allow better coping with extreme weather (Q8) positively correlated with the number of actions performed (Q9–11.1) (Table 4).

3.5.6. Adaptation Motivation (C) and Adaptation Behaviour (D)

No correlation was found between beliefs about responsibility for adaptation (Q6, Q7) and the number of implemented adaptive measures (Q9–11.1). Participants planning to introduce more actions (Q9–11.2) were more likely to identify financial resources and access to tools and equipment among the lacking resources, which would foster their ability to deal with extreme weather events (Q13) (Table 4). Moreover, they were more motivated by encouragement from family and friends (R = 0.20; p < 0.05) and by the fact that people in their surroundings took adaptive actions (R = 0.18; p < 0.05).

4. Discussion

This discussion is structured around four main themes. It examines the design of the SoAC tool and its grounding in existing literature, followed by a summary of key findings from its application in a case study. These findings are then situated within the broader literature, organised according to the variables employed in the tool. Their implications for adaptation policy are also considered. Finally, the discussion reflects on the tool’s refinement and outlines the study’s limitations.

4.1. Translating Theoretical Models into a Practical Tool

One reason for advocating changes in the development of climate adaptation plans is the insufficient engagement of residents [7,9]. However, such engagement is highly needed, as local authorities have a limited mandate and capacity to address increasing climate risks, thereby necessitating the adoption of collaborative approaches [32]. Adaptation strategies created so far are mainly for large cities [5,6] will remain instruments of climate policy [10]. In Poland, as of 2025, all cities with more than 20,000 inhabitants are required to prepare a climate adaptation plan [57]. Therefore, efforts should aim to develop tools for assessing the adaptive capacity of urban communities that can be practically applied in the formulation of such plans.
In this study, we introduce the SoAC Tool, designed to measure the social adaptive capacity and provide direct input for policymakers involved in the development of climate adaptation plans. It was tested in the Polish context as part of the adaptation planning process for the city of Starachowice. It is intended for use at the community level, gathering data from individual residents to inform targeted interventions. Unlike previous approaches, the SoAC Tool comprehensively integrates variables from several established theoretical frameworks that, to date, have not been combined or operationalised together for this purpose.
Specifically, it draws on the MPPACC model [42], which explains why individuals differ in adaptive behaviour, and the CCRPM [40], which identifies key psychological determinants of climate risk perception. These were supplemented with motivational factors influencing adaptive behaviour [41]. This integrated conceptual foundation informed the selection of survey variables, for which items were proposed based on a literature review [31,32,43,47,48,51].
In contrast to prior studies, which have focused on isolated psychological or behavioural dimensions of adaptive capacity, such as risk perception [47], climate change beliefs [48], motivational factors [32], or psychological predictors of pro-environmental behaviour [43], our approach offers a unified and practice-oriented framework for assessing social adaptive capacity in a way that supports policy-relevant outcomes. Moreover, our study demonstrates the application of the MPPACC model in the context of individuals’ responses to a broad spectrum of extreme weather events, rather than selected hazards as in previous studies [43,44,46].

4.2. Framing Local Findings

Respondents have observed changes in extreme weather in Starachowice, which most perceive as negatively affecting their lives and the city. Many have experienced direct damage, and those who faced more impacts feel more personally affected by climate change.
While many felt capable of handling heat and cold waves, fewer felt prepared for floods, strong winds, or heavy rainfall. Assessments of the city’s ability to manage extreme weather were mixed, with older and non-working participants generally more positive, and higher education levels associated with more critical views.
Participants recognised both personal and institutional responsibilities in addressing extreme weather. Over half of the respondents considered households responsible for preventing damage, while most expected local authorities to protect residents and their property. Many reported lacking resources such as finances, time, or technical knowledge to prepare effectively, with specific needs differing by gender, housing type, employment status, and age.
Adaptation actions were common at the household level, including insulation, shading, LED lighting, and tree planting, with plans focused on air conditioning and water-saving measures. Single-family homeowners reported more activity than residents of multi-family housing, with age and education also shaping responses. Civic engagement in climate adaptation remained very limited, but there was strong support for municipal measures such as tree planting, expanding green areas, sewer modernisation, and flood defences.
Although a direct comparison of the results obtained with other studies is partly limited due to differences in research objectives, research tool design and geographical contexts, the similarities and differences observed are presented below.

4.2.1. Risk Perception of Climate Change (Variable A)

The survey revealed that residents in Starachowice have noticed climate change occurring, with observations of increased heatwaves, droughts, heavy rainfall, and fewer cold waves aligning with historical meteorological data. However, discrepancies exist regarding the occurrence of strong winds and storms. It aligns with Werg [47], who found that meteorological data only partially confirms people’s perception of weather trends.
Steg [39] states that “people are more likely to take adaptive actions and support climate change adaptation policies when they more strongly perceive climate change as real, human-caused, and threatening”. Results from Starachowice confirm these findings, as individuals who believed that climate change negatively impacts the city’s functioning and their lives planned more adaptive actions. Furthermore, similarly to the study by Brink and Wamsler [32], respondents who experienced more damage from extreme weather events were more inclined to act.

4.2.2. Perceived Adaptive Capacity (Variable B)

The application of the SoAC Tool has revealed that participants who experienced more damage tended to assess their coping abilities more negatively while simultaneously considering adaptation justified. Moreover, the belief that taking adaptive actions would help better cope with climate change positively correlated with the number of actions taken by respondents in Starachowice, similar to the findings in the study by Bradley et al. [43].

4.2.3. Adaptation Motivation (Variable C)

Understanding residents’ beliefs regarding who bears responsibility for adaptation is crucial for developing collaborative approaches [32]. It can aid decision-makers in better planning interventions, such as targeted education [31]. In Starachowice, respondents who considered adaptive actions justified attributed responsibility for protection against extreme weather events to both citizens and local authorities. However, contrary to previous findings [31], there was no correlation found between the extent of damage experienced and beliefs about responsibility; nevertheless, individuals who suffered greater damage reported a lack of support from local authorities. Moreover, those who rated the local authorities’ ability to deal with extreme weather as poor were more likely to view adaptation as the government’s responsibility. It underscores the need to enhance awareness of adaptive responsibilities.
Understanding the level of residents’ motivation for action is necessary during the creation of climate adaptation policy, because decision-makers uncertain about societal support may adopt conservative decision-making approaches [39]. In Starachowice, respondents who experienced damage due to extreme weather were motivated to act by ecological, socio-ethical, and economic factors, even though, in the face of these threats, costs could be more important than abstract values such as the environment or justice [32]. Additionally, for this group, as observed by Werg et al. [47], the desire to emulate others encouraged them to plan their own adaptation actions. Factors such as protecting more vulnerable individuals and environmental quality were of considerable importance for women, similar to findings of Brink and Wamsler [32]. No statistically significant gender difference was found in terms of motivation by economic factors. Moreover, unlike the results from Sweden [32], wealthier households were less motivated by socio-ethical considerations.

4.2.4. Adaptation Behaviour (Variable D)

The application of the SoAC Tool provided information that, similarly to the study by Liu and Zhang [45], Starachowice residents have so far undertaken low-cost activities that are quick to implement and do not require external support. Concerning planned activities, it was observed that their number decreased with the respondents’ age, analogous to Brink and Wamsler [32], and increased with education level, as in Werg [47].
Some adaptation methods also entail greater financial investment, e.g., the development of blue-green infrastructure or the modernisation of grey infrastructure. However, it should be noted that the extent to which such solutions can be implemented varies not only by housing type (in single-family homes, there are more possibilities thanks to the private green space) but also by ownership structure.
In the study by Grothmann and Patt [42], ownership appeared to be an essential factor in explaining residents’ adaptive responses, as homeowners have more freedom to take independent action (e.g., no need for housing cooperative or property owner approval) while having more to lose in the event of a natural disaster. The resulting differences in duties and responsibilities are reflected in the survey answers from Starachowice, which show that, on average, residents of single-family homes took and planned more measures than those in multi-family homes.
In-depth knowledge about individuals’ engagement in adaptation actions and their beliefs regarding responsibility for adaptation, provided through the SoAC Tool, can help local authorities improve communication with residents by taking into account different patterns of social behaviour (e.g., individualistic or fatalist), thereby enhancing the potential to activate mutual support between institutions and the community [33].

4.3. Policy Implications

The characterisation of the urban community achieved through the application of the SoAC Tool provides a valuable complement to data gathered from public statistics or interviews with local authorities. It is important to recognise that information on social capital can be subjective when derived from officials based on the predefined catalogue of questions outlined in the Polish guidelines for climate adaptation plans [35]. On the other hand, this characterisation can be overly general if it relies solely on public statistics where data are not specifically tailored to the environmental context, as seen in Poland’s case [63,64]. The survey confirmed that social capital in Starachowice is low (less than 9% of respondents actively participated in associations or civic groups aiming to improve the city’s climate and environment). Still, the situation appears less pessimistic when considering other aspects contributing to the adaptive capacities of individual residents, such as risk perception, adaptation beliefs, motivations and adaptive behaviours [40,41,42].
These findings have several implications for the city’s climate policy. They underscore the need to enhance communication, education, and advisory services, strengthen responsibility and engagement, and design financial support schemes tailored to diverse needs. Since perceptions of risk and adaptive capacity vary by gender, housing type, and age, the city should implement targeted educational campaigns for groups with lower awareness, emphasising concrete adaptive practices and the specific climate-related risks they face.
The survey also revealed low levels of civic participation, highlighting the importance of supporting grassroots climate initiatives and participatory planning. The relatively higher awareness of risks and willingness to protect vulnerable groups observed among women suggests that their active involvement could play a key role in fostering bottom-up engagement. To harness this potential, developing intergenerational community centres offers a powerful solution. They would serve as the platforms for local leaders to transform awareness into action, mobilising networks to launch climate initiatives and strengthen community resilience.
Moreover, improving communication about local authorities’ actions and enhancing urban infrastructure are crucial for building public trust in the city’s capacity to manage extreme weather events, particularly those previously perceived as poorly handled, such as heavy rainfall and floods. Information and education initiatives should reinforce the notion that adaptation is a shared responsibility, with municipal measures complemented by household-level actions to achieve resilience. One of the recommendations is to establish the role of a climate advisor focused on local businesses and housing associations.
Finally, economic considerations emerged as decisive in shaping adaptive behaviour, emphasising the need for financial instruments and technical support to facilitate measures that are otherwise costly or complex. Dedicated programmes for multi-family housing are particularly important to prevent inequalities in living conditions, for example, by improving shared green spaces, stormwater management, and internal building systems.
Obtained results can also inform social protection programmes, aligning with recent studies that advocate integrating climate and social protection agendas to achieve transformational adaptation [20,21].

4.4. Lessons Learned—Fine-Tuning of the Tool

The number of responses obtained enabled the testing of the tool, followed by the proposal of its improved version (see the questionnaire in Supplementary Materials). Analysis of items with increased drop-out rates in the online survey, along with observations from face-to-face interviews, allowed for several adjustments, such as shortening the questionnaire to make it more respondent-friendly.
For instance, we noticed that questions concerning the impact of extreme weather on the respondent’s life (Q3) and the city’s functioning (Q4) were perceived as too similar, thus quickly becoming tedious. Therefore, we decided to retain only the latter question, where respondents refer to the broader context of the urban environment and draw upon observations that do not solely pertain to their private sphere, about which they may not always wish to be truthful.
Furthermore, we discarded the question about observed climate change in the city over the respondent’s lifetime (Q1) due to its susceptibility to bias, as perception varies with age (older individuals have more comparative experience than younger ones) and can be influenced by media coverage of extreme weather in the country.
We also eliminated the item regarding being informed about coping methods for climate change (Q12) because of its susceptibility to diverse interpretations, which precludes reliable analysis. Direct interviews revealed that respondents perceived being informed as receiving weather alerts on their mobile phones before extreme events. Others understood adaptation methods as adjusting clothing to current weather conditions or basic safety measures during heat waves and storms, rather than technical and spatial solutions discussed in questions Q9–Q11.
Finally, we modified the order of questions to improve survey completion dynamics while maintaining a logical sequence of content. Consequently, we decided to begin with simpler items (e.g., those referring to direct experiences of the respondent) and those most engaging (matrix questions on adaptation actions), interspersed with shorter questions (such as agree/disagree statements).

4.5. Limitations of the Study

Bearing in mind that adaptive behaviour is influenced by the multitude of socio-economic, cultural, psychological and cognitive factors, the measurement of social adaptive capacity can only capture a single point in time. For example, a recent extreme weather event, such as a flood, could affect respondents’ perceptions of climate threats and their motivation to implement protective measures. As a result, the findings may reflect short-term experiences rather than long-term adaptive capacity.
When interpreting the results, two aspects must be considered: first, that awareness of climate risk does not always translate into adaptive action [31,51], and second, that declared actions may not reflect actual behaviour [32]. Therefore, we examine both aspects to assess the extent to which awareness is translated into reported action.
During pilot testing, we did not obtain a sample representative in terms of the demographic structure of the Starachowice community, which limits the generalizability of the results for that population. Nevertheless, the number of responses collected was sufficient to test the tool in a real-life context. Other studies in this area have used a similar sample size [32,42,47].

5. Conclusions

Examining the adaptive capacity of communities provides policymakers with valuable knowledge in formulating strategic documents, such as climate adaptation plans. Recognising residents’ attitudes towards climate risks raises the local authorities’ awareness about the ability of communities to cope with and moderate potential damages. Integrating this information with expert knowledge enhances the quality of adaptation strategies.
However, previous studies have not comprehensively addressed the issue of measuring social adaptive capacity in the context of its practical application to climate adaptation planning, and tend to narrow their focus on specific hazards. This study directly addresses this gap by demonstrating that existing theoretical models provide a sufficient basis for designing a practical tool that supports participatory adaptation planning processes and refers to a broader range of climate risks.
By enabling primary data collection, the SoAC tool facilitates in-depth recognition of residents’ capacity to deal with the effects of extreme weather. It provides insights into their perceptions of climate change occurring in the city and the impact on its functioning, their adaptation actions, and underlying motivations, while also exploring disparities in attitudes among different demographic groups. Thus, the main contribution of the tool is that it provides a structured, replicable mechanism for embedding public participation in the diagnostic phase of policy development, moving beyond the theoretical models that have dominated the literature.
The application of the tool for a medium-sized city in Poland revealed that residents are aware of climate change, experience its consequences, and negatively assess its impact on urban life. They believe in the necessity for adaptation and protection against climate threats despite the associated costs, as well as the need for access to various resources and state support. Their responses indicate a sense of responsibility for preparing their households for extreme weather conditions, and they currently engage in or plan actions that contribute positively to climate adaptation. Simultaneously, they expect city authorities to be involved in safeguarding their safety from the effects of climate change and strongly endorse the implementation of top-down measures. This application serves as an important secondary contribution, validating the tool’s utility and supplementing the existing literature with a new perspective from a Central European context.
Ultimately, this tool aims to assist in selecting adaptation measures tailored to local needs and the precise allocation of funds. Based on the results collected, local authorities should raise public awareness of residents’ responsibility for adaptation (e.g., public campaigns), offer technical and financial advice, and provide various forms of financial support. It would also be recommended that social capital be strengthened, which could increase the participation of residents in bottom-up initiatives. The abovementioned solutions are prescribed in the strategy developed for Starachowice.
The presented tool can be applied worldwide once adjusted to the national or regional contexts in terms of extreme weather events and suitable adaptation measures. Furthermore, when conducting a survey for the climate strategy, it is important to employ different response collection methods to reach various groups, including marginalised individuals. Obtaining a representative sample with a particular focus on vulnerable groups would provide a comprehensive picture of social adaptive capacity. Above all, triangulation of data sources—combining primary data acquired from citizens and local authorities and secondary data from public statistics—is advisable.
While public participation in developing adaptation strategies is generally acknowledged, there are no requirements for conducting representative social surveys to assess the adaptive capacity of communities, for example, in terms of people’s attitudes toward risk and their adaptive behaviour. The SoAC tool presented in this study fills this procedural gap by offering a validated method for conducting such an assessment. We argue that its application is a clear advantage for urban adaptation, even if it increases the cost of elaborating the document. To support practitioners in participatory adaptation planning, it is recommended that national and international knowledge bases be expanded to provide guidance on survey execution, as well as to offer adequate questionnaire templates. The SoAC tool could serve this purpose. Moreover, consideration should be given to conducting a pan-European or national survey of representative samples of urban respondents. This would provide a detailed characterisation of societal capacities to cope with climate change impacts and enable monitoring, facilitating comparisons between cities.

Supplementary Materials

The following supporting information can be downloaded at: https://www.mdpi.com/article/10.3390/su17219361/s1. Social Adaptive Capacity Tool—Survey Questionnaire.

Author Contributions

Conceptualization, M.P. (Monika Piotrkowska) and K.R.; methodology, M.P. (Monika Piotrkowska); validation, M.Z. and M.P. (Małgorzata Płaszczyca); formal analysis, M.P. (Monika Piotrkowska) and M.Z.; investigation, M.P. (Monika Piotrkowska) and K.R.; resources, M.Z. and M.P. (Małgorzata Płaszczyca); data curation, M.Z.; writing—original draft preparation, M.P. (Monika Piotrkowska); writing—review and editing, M.P. (Monika Piotrkowska) and K.R.; visualisation, M.P. (Monika Piotrkowska); supervision, K.R.; project administration, K.R.; funding acquisition, K.R. All authors have read and agreed to the published version of the manuscript.

Funding

This research was co-financed by the Norwegian Financial Mechanism 2014–2021 and the Polish state budget (grant no. 21/2021/RL) as part of the “Direction for the Future—Starachowice Local Development Program” project. The APC was co-financed under the research grant of the Warsaw University of Technology, supporting the scientific activity in the discipline of Civil Engineering, Geodesy and Transport.

Institutional Review Board Statement

The study was approved by the Ethics Committee of Warsaw University of Technology (opinion 2/12/2024).

Informed Consent Statement

Verbal informed consent was obtained from participants who took part in the in-person survey. For those who participated online, consent was implied by their voluntary decision to proceed with the anonymous questionnaire after being informed about the study’s purpose, the voluntary nature of participation, and their right to withdraw at any time. In both cases, no personal or sensitive data were collected, and the study posed minimal risk to participants. All responses were aggregated for analysis, and it is not possible to identify individual participants.

Data Availability Statement

The data presented in this study are available on request from the corresponding author. The data are not publicly available due to ethical restrictions.

Conflicts of Interest

The authors declare no conflicts of interest. The funders had no role in the design of the study; in the collection, analyses, or interpretation of data; in the writing of the manuscript; or in the decision to publish the results.

Abbreviations

The following abbreviations are used in this manuscript:
MPPACCModel of Private Proactive Adaptation to Climate Change
CCRPMClimate Change Risk Perception Model
SoAC ToolSocial Adaptive Capacity Tool
SDGsSmart Development Goals
EUEuropean Union
PAPIPaper-and-pencil Personal Interview
CAWIComputer-assisted Web Interview

Appendix A

Table A1. Adaptation measures undertaken and planned to be taken in the next five years by respondents.
Type of Adaptation MeasurePlanning
to Do This
Not Planning to Do ThisHave
Already Done This
Not
Applicable
to My Home
Aim: Reducing the Negative Impacts of Heatwaves
Installing LED lights, which give off less heat18.1%6.7%74.8%0.4%
Covering windows with indoor blinds, shades, and thermal curtains23.9%11.3%62.6%2.1%
Insulating the home to keep
warm air outside
14.7%8.0%57.6%19.7%
Purchasing a home fan15.1%32.4%50.8%1.7%
Planting trees and leafy plants near the home to provide shade and absorb heat17.6%13.0%46.2%23.1%
Painting external roofs and walls in lighter colours that
reflect sunlight
8.4%29.1%33.8%28.7%
Installing awnings or outdoor sun blinds24.1%48.5%15.6%11.8%
Installing an air conditioner26.2%59.5%9.3%5.1%
Applying sun-blocking film to windows12.6%75.2%2.9%9.2%
Aim: reducing local climate change risks, including flash floods and urban heat island
Replacing household
appliances with more
water-efficient ones
19.9%25.4%51.7%3.0%
Reducing concrete areas
on the property by replacing it with vegetation
12.2%19.3%32.8%35.7%
Installing a rain barrel20.2%11.3%32.4%36.1%
Installing a green wall9.2%43.7%13.9%33.2%
Using water from dishwashing or bathing to flush toilets
(manually)
16.8%63.0%13.4%6.7%
Installing a rain garden8.0%45.8%9.2%37.0%
Converting the home plumbing system to use rainwater10.1%47.1%5.5%37.4%
Building flood protection
on the property
8.0%34.5%3.4%54.2%
Trying to influence the
property owner/housing
association to undertake
adaptation actions
27.0%33.8%2.5%36.7%
Installing a pond9.2%49.6%2.5%38.7%
Converting home plumbing system to reuse greywater (from shower, bathtub, washing machine)8.8%52.5%2.5%36.1%
Installing a green roof1.7%58.4%0.4%39.5%
Aim: personal protection from heavy rainfall, floods, strong winds and storms
Be prepared for power outages (candles, torches, power banks)30.7%16.0%51.7%1.7%
Revise home insurance regarding extreme weather events31.5%25.2%30.3%13.0%
Look after elderly relatives/neighbours44.1%21.8%24.8%9.2%
Warn neighbours when a storm or other weather event is on its way45.8%26.5%21.4%6.3%
Obtain pumps and/or sandbags to use in case of flood8.4%36.3%6.3%48.9%

References

  1. Campos, I.; Guerra, J.; Gomes, J.F.; Schmidt, L.; Alves, F.; Vizinho, A.; Lopes, G.P. Understanding Climate Change Policy and Action in Portuguese Municipalities: A Survey. Land Use Policy 2017, 62, 68–78. [Google Scholar] [CrossRef]
  2. European Environment Agency. Urban Adaptation in Europe: How Cities and Towns Respond to Climate Change; Publications Office of the European Union: Luxembourg, 2020. [Google Scholar]
  3. Heidrich, O.; Reckien, D.; Olazabal, M.; Foley, A.; Salvia, M.; de Gregorio Hurtado, S.; Orru, H.; Flacke, J.; Geneletti, D.; Pietrapertosa, F.; et al. National Climate Policies across Europe and Their Impacts on Cities Strategies. J. Environ. Manag. 2016, 168, 36–45. [Google Scholar] [CrossRef] [PubMed]
  4. Lee, T.; Yang, H.; Blok, A. Does Mitigation Shape Adaptation? The Urban Climate Mitigation-Adaptation Nexus. Clim. Policy 2020, 20, 341–353. [Google Scholar] [CrossRef]
  5. Reckien, D.; Salvia, M.; Heidrich, O.; Church, J.M.; Pietrapertosa, F.; De Gregorio-Hurtado, S.; D’Alonzo, V.; Foley, A.; Simoes, S.G.; Krkoška Lorencová, E.; et al. How Are Cities Planning to Respond to Climate Change? Assessment of Local Climate Plans from 885 Cities in the EU-28. J. Clean. Prod. 2018, 191, 207–219. [Google Scholar] [CrossRef]
  6. Reckien, D.; Flacke, J.; Olazabal, M.; Heidrich, O. The Influence of Drivers and Barriers on Urban Adaptation and Mitigation Plans—An Empirical Analysis of European Cities. PLoS ONE 2015, 10, e0135597. [Google Scholar] [CrossRef] [PubMed]
  7. Olazabal, M.; Ruiz De Gopegui, M. Adaptation Planning in Large Cities Is Unlikely to Be Effective. Landsc. Urban Plan. 2021, 206, 103974. [Google Scholar] [CrossRef]
  8. Preston, B.L.; Westaway, R.M.; Yuen, E.J. Climate Adaptation Planning in Practice: An Evaluation of Adaptation Plans from Three Developed Nations. Mitig. Adapt. Strateg. Glob. Change 2011, 16, 407–438. [Google Scholar] [CrossRef]
  9. Kalbarczyk, E.; Kalbarczyk, R. Credibility Assessment of Municipal Climate Change Adaptation Plans Using the Ex-Ante Method: A Case Study of Poland. Sustain. Cities Soc. 2022, 87, 104242. [Google Scholar] [CrossRef]
  10. European Commission. Communication from the Commission to the European Parliament, the Council, the European Economic And Social Committee and the Committee of the Regions Empty Forging a Climate-Resilient Europe—The New EU Strategy on Adaptation to Climate Change COM (2021) 82 Final 2021. Available online: https://eur-lex.europa.eu/legal-content/EN/TXT/PDF/?uri=CELEX:52021DC0082&from=EN (accessed on 8 October 2025).
  11. Whitney, C.K.; Bennett, N.J.; Ban, N.C.; Allison, E.H.; Armitage, D.; Blythe, J.L.; Burt, J.M.; Cheung, W.; Finkbeiner, E.M.; Kaplan-Hallam, M.; et al. Adaptive Capacity: From Assessment to Action in Coastal Social-Ecological Systems. Ecol. Soc. 2017, 22, 22. [Google Scholar] [CrossRef]
  12. IPCC. Annex II: Glossary. In Climate Change 2014: Synthesis Report. Contribution of Working Groups I, II and III to the Fifth Assessment Report of the Intergovernmental Panel on Climate Change; Pachauri, R.K., Meyer, L.A., Eds.; IPCC: Geneva, Switzerland, 2014; pp. 117–130. [Google Scholar]
  13. Vallury, S.; Smith, A.P.; Chaffin, B.C.; Nesbitt, H.K.; Lohani, S.; Gulab, S.; Banerjee, S.; Floyd, T.M.; Metcalf, A.L.; Metcalf, E.C.; et al. Adaptive Capacity beyond the Household: A Systematic Review of Empirical Social-Ecological Research. Environ. Res. Lett. 2022, 17, 063001. [Google Scholar] [CrossRef]
  14. Siders, A.R. Adaptive Capacity to Climate Change: A Synthesis of Concepts, Methods, and Findings in a Fragmented Field. WIREs Clim. Change 2019, 10, e573. [Google Scholar] [CrossRef]
  15. Chapagain, P.S.; Banskota, T.R.; Shrestha, S.; Khanal, N.R.; Yili, Z.; Yan, J.; Linshan, L.; Paudel, B.; Rai, S.C.; Islam, M.N.; et al. Studies on Adaptive Capacity to Climate Change: A Synthesis of Changing Concepts, Dimensions, and Indicators. Humanit. Soc. Sci. Commun. 2025, 12, 331. [Google Scholar] [CrossRef]
  16. Mortreux, C.; Barnett, J. Adaptive Capacity: Exploring the Research Frontier. WIREs Clim. Change 2017, 8, e467. [Google Scholar] [CrossRef]
  17. Cinner, J.E.; Adger, W.N.; Allison, E.H.; Barnes, M.L.; Brown, K.; Cohen, P.J.; Gelcich, S.; Hicks, C.C.; Hughes, T.P.; Lau, J.; et al. Building Adaptive Capacity to Climate Change in Tropical Coastal Communities. Nat. Clim. Change 2018, 8, 117–123. [Google Scholar] [CrossRef]
  18. Rana, I.A.; Khaled, S.; Jamshed, A.; Nawaz, A. Social Protection in Disaster Risk Reduction and Climate Change Adaptation: A Bibliometric and Thematic Review. J. Integr. Environ. Sci. 2022, 19, 65–83. [Google Scholar] [CrossRef]
  19. Prihantika, I.; Rahmadhani, T.P.; Mulyana, N. Adaptive Social Protection: A Systematic Literature Review and Research Agenda. Policy Gov. Rev. 2024, 8, 231–248. [Google Scholar] [CrossRef]
  20. Tenzing, J.D. Integrating Social Protection and Climate Change Adaptation: A Review. WIREs Clim. Change 2020, 11, e626. [Google Scholar] [CrossRef]
  21. Costella, C.; McCord, A.; van Aalst, M.; Ammoun, J. Social Protection and Climate Change: Scaling up Ambition; Social Protection Approaches to COVID-19 Expert Advice Service (SPACE); DAI Global UK Ltd.: Hemel Hempstead, UK, 2021; p. 39. [Google Scholar]
  22. Fischer, A.P.; Shah, M.A.R.; Segnon, A.C.; Matavel, C.; Antwi-Agyei, P.; Shang, Y.; Muir, M.; Kaufmann, R. Human Adaptation to Climate Change in the Context of Forests: A Systematic Review. Clim. Risk Manag. 2024, 43, 100573. [Google Scholar] [CrossRef]
  23. Birkmann, J.; Garschagen, M.; Kraas, F.; Quang, N. Adaptive Urban Governance: New Challenges for the Second Generation of Urban Adaptation Strategies to Climate Change. Sustain. Sci. 2010, 5, 185–206. [Google Scholar] [CrossRef]
  24. Khatibi, F.S.; Dedekorkut-Howes, A.; Howes, M.; Torabi, E. Can Public Awareness, Knowledge and Engagement Improve Climate Change Adaptation Policies? Discov. Sustain. 2021, 2, 18. [Google Scholar] [CrossRef]
  25. Uittenbroek, C.J.; Mees, H.L.P.; Hegger, D.L.T.; Driessen, P.P.J. The Design of Public Participation: Who Participates, When and How? Insights in Climate Adaptation Planning from the Netherlands. J. Environ. Plan. Manag. 2019, 62, 2529–2547. [Google Scholar] [CrossRef]
  26. Jones, L.; Ludi, E.; Levine, S.; Towards a Characterisation of Adaptive Capacity: A Framework for Analysing Adaptive Capacity at the Local Level. Overseas Development Institute. 2010. Available online: https://media.odi.org/documents/6353.pdf (accessed on 8 October 2025).
  27. Brody, S.D.; Bernhardt, S.P.; Zahran, S.; Kang, J.E. Evaluating Local Flood Mitigation Strategies in Texas and Florida. Built Environ. 2009, 35, 492–515. [Google Scholar] [CrossRef]
  28. Clemmensen, A.H.; Haugvaldstad, A.; Vizinho, A.; Penha-Lopes, G.P. D 5.3 Participation in Climate Change Adaptation. Base Rep. 2015. [Google Scholar] [CrossRef]
  29. Glucker, A.N.; Driessen, P.P.J.; Kolhoff, A.; Runhaar, H.A.C. Public Participation in Environmental Impact Assessment: Why, Who and How? Environ. Impact Assess. Rev. 2013, 43, 104–111. [Google Scholar] [CrossRef]
  30. Prutsch, A.; Steurer, R.; Stickler, T. Is the Participatory Formulation of Policy Strategies Worth the Effort? The Case of Climate Change Adaptation in Austria. Reg. Environ. Change 2018, 18, 271–285. [Google Scholar] [CrossRef]
  31. Bichard, E.; Kazmierczak, A. Are Homeowners Willing to Adapt to and Mitigate the Effects of Climate Change? Clim. Change 2012, 112, 633–654. [Google Scholar] [CrossRef]
  32. Brink, E.; Wamsler, C. Citizen Engagement in Climate Adaptation Surveyed: The Role of Values, Worldviews, Gender and Place. J. Clean. Prod. 2019, 209, 1342–1353. [Google Scholar] [CrossRef]
  33. Wamsler, C.; Brink, E. Interfacing Citizens’ and Institutions’ Practice and Responsibilities for Climate Change Adaptation. Urban Clim. 2014, 7, 64–91. [Google Scholar] [CrossRef]
  34. Pelling, M.; High, C. Understanding Adaptation: What Can Social Capital Offer Assessments of Adaptive Capacity? Glob. Environ. Change 2005, 15, 308–319. [Google Scholar] [CrossRef]
  35. Hajto, M.; Bidłasik, M.; Kuśmierz, A.; Marcinkowski, M.; Potapowicz, I.; Rajkowska, B.; Romańczak, A.; Siwiec, E. Podręcznik adaptacji dla miast; IOŚ-PIB: Warszawa, Poland, 2023. [Google Scholar]
  36. Smith, A.; Vallury, S.; Metcalf, E. Social Dimensions of Adaptation to Climate Change in Rangelands: A Systematic Literature Review. Clim. Change 2023, 176, 180. [Google Scholar] [CrossRef]
  37. Smit, B.; Pilifosova, O. Chapter 18: Adaptation to Climate Change in the Context of Sustainable Development and Equity. In Impacts, Adaptation, and Vulnerability; The Contribution of Working Group II to the Third Scientific Assessment of the Intergovernmental Panel on Climate Change; IPCC, Ed.; Cambridge University Press: Cambridge, UK, 2001. [Google Scholar]
  38. Grothmann, T.; Grecksch, K.; Winges, M.; Siebenhuener, B. Assessing Institutional Capacities to Adapt to Climate Change—Integrating Psychological Dimensions in the Adaptive Capacity Wheel. Nat. Hazards Earth Syst. Sci. 2013, 13, 3369–3384. [Google Scholar] [CrossRef]
  39. Steg, L. Psychology of Climate Change. Annu. Rev. Psychol. 2023, 74, 391–421. [Google Scholar] [CrossRef]
  40. van der Linden, S. The Social-Psychological Determinants of Climate Change Risk Perceptions: Towards a Comprehensive Model. J. Environ. Psychol. 2015, 41, 112–124. [Google Scholar] [CrossRef]
  41. van Valkengoed, A.M.; Steg, L. Meta-Analyses of Factors Motivating Climate Change Adaptation Behaviour. Nat. Clim. Change 2019, 9, 158–163. [Google Scholar] [CrossRef]
  42. Grothmann, T.; Patt, A. Adaptive Capacity and Human Cognition: The Process of Individual Adaptation to Climate Change. Glob. Environ. Change 2005, 15, 199–213. [Google Scholar] [CrossRef]
  43. Bradley, G.L.; Babutsidze, Z.; Chai, A.; Reser, J.P. The Role of Climate Change Risk Perception, Response Efficacy, and Psychological Adaptation in pro-Environmental Behavior: A Two Nation Study. J. Environ. Psychol. 2020, 68, 101410. [Google Scholar] [CrossRef]
  44. Chen, D.; Kong, L.; Zhang, J.; Fan, C.; Zhang, Y.; Li, B. A Study on Risk Perception and Adaptive Behavior of the Chinese Public toward Urban Heat Based on the MPPACC Model. Urban Clim. 2024, 58, 102224. [Google Scholar] [CrossRef]
  45. Liu, Y.; Zhang, M. Urban Residents’ Behavioral Response to Climate Change and Its Influencing Factors: A Case Study of Tianjin, China. Chin. J. Popul. Resour. Environ. 2020, 18, 188–195. [Google Scholar] [CrossRef]
  46. Ma, A.T.H.; Wong, G.K.L.; Cheung, L.T.O.; Lo, A.Y.; Jim, C.Y. Climate Change Perception and Adaptation of Residents in Hong Kong. J. Clean. Prod. 2021, 288, 125123. [Google Scholar] [CrossRef]
  47. Werg, J.; Grothmann, T.; Spies, M.; Mieg, H.A. Factors for Self-Protective Behavior against Extreme Weather Events in the Philippines. Sustainability 2020, 12, 6010. [Google Scholar] [CrossRef]
  48. van Valkengoed, A.M.; Perlaviciute, G.; Steg, L. Relationships between Climate Change Perceptions and Climate Adaptation Actions: Policy Support, Information Seeking, and Behaviour. Clim. Change 2022, 171, 14. [Google Scholar] [CrossRef]
  49. Hügel, S.; Davies, A.R. Public Participation, Engagement, and Climate Change Adaptation: A Review of the Research Literature. WIREs Clim. Change 2020, 11, e645. [Google Scholar] [CrossRef]
  50. Starachowice City Council The Climate Adaptation Plan for the City of Starachowice with a Perspective Until 2030. 2023. Available online: https://bip.um.starachowice.pl/bip/54_umstarachowice/fckeditor/file/Sesje%20RM/IX-2023%20-%2029%20wrzesien%202023%20rok//Uchwa%C5%82a%20Nr%20IX_8_2023.pdf (accessed on 8 October 2025).
  51. Whitmarsh, L.; O’Neill, S. Green Identity, Green Living? The Role of pro-Environmental Self-Identity in Determining Consistency across Diverse pro-Environmental Behaviours. J. Environ. Psychol. 2010, 30, 305–314. [Google Scholar] [CrossRef]
  52. Ministerstwo Środowiska Strategiczny plan adaptacji dla sektorów i obszarów wrażliwych na zmiany klimatu do roku 2020. 2013. Available online: https://bip.mos.gov.pl/fileadmin/user_upload/bip/strategie_plany_programy/Strategiczny_plan_adaptacji_2020.pdf (accessed on 8 October 2025).
  53. European Commission. Communication from the Commission to the European Parliament, the Council, the European Economic and Social Committee and the Committee of the Regions an EU Strategy on Adaptation to Climate Change; COM (2013) 216 final; European Commission: Brussels, Belgium, 2013. [Google Scholar]
  54. ADAPTCITY Project Has Finished. Available online: http://adaptcity.pl/adaptcity-project-has-finished/ (accessed on 16 December 2024).
  55. Ministerstwo Klimatu i Środowiska MPA 44. Available online: https://www.gov.pl/web/klimat/mpa-44 (accessed on 8 October 2025).
  56. Karaczun, Z.M.; Bojanowski, J.; Zawieska, J.; Swoczyna, B. Adaptacja Do Zmiany Klimatu w Programach Ochrony Środowiska Małych i Średnich Polskich Miast. Stud. BAS 2022, 71, 59–80. [Google Scholar] [CrossRef]
  57. Minister Klimatu i Środowiska Uzasadnienie do rządowego projekt Ustawy o Zmianie Ustawy—Prawo Ochrony Środowiska Oraz Niektórych Innych Ustaw 2024. Available online: https://orka.sejm.gov.pl/Druki10ka.nsf/0/B11CFC2359EBA212C1258BD600432EF3/%24File/813-uzasadnienie.docx (accessed on 8 October 2025).
  58. Environmental Protection Law of 27 April 2001. 2001. Available online: https://isap.sejm.gov.pl/isap.nsf/download.xsp/WDU20010620627/U/D20010627Lj.pdf (accessed on 8 October 2025).
  59. Śleszyński, P. Determination and typology of medium-size cities losing their socio-economic functions. Przegląd Geogr. 2017, 89, 565–593. [Google Scholar] [CrossRef]
  60. Ministerstwo Środowiska Polityka Ekologiczna Państwa 2030. 2019. Available online: https://bip.mos.gov.pl/fileadmin/user_upload/bip/strategie_plany_programy/Polityka_Ekologiczna_Panstwa/Polityka_Ekologiczna_Panstwa_2030.pdf (accessed on 8 October 2025).
  61. Stryjakiewicz, T.; Jaroszewska, E. The Process of Shrinkage as a Challenge to Urban Governance. Quaest. Geogr. 2016, 35, 27–37. [Google Scholar] [CrossRef]
  62. Wolff, M.; Wiechmann, T. Urban Growth and Decline: Europe’s Shrinking Cities in a Comparative Perspective 1990–2010. Eur. Urban Reg. Stud. 2018, 25, 122–139. [Google Scholar] [CrossRef]
  63. Monitor Rozwoju Lokalnego. Available online: https://monitorrozwoju.pl/ (accessed on 7 July 2024).
  64. Statistics Poland Local Data Bank. Available online: https://bdl.stat.gov.pl/ (accessed on 7 July 2024).
Figure 1. Flow chart of the research method.
Sustainability 17 09361 g001
Figure 2. Conceptual framework that informed the development of the SoAC Tool. It synthesises key variables and factors identified in the literature as relevant to social adaptive capacity. Elements highlighted in blue indicate the subset that was operationalised through the survey items and included in the empirical analysis. (Source: Own elaboration based on [40,41,42]).
Sustainability 17 09361 g002
Figure 3. Case study location (Source: Own elaboration, © EuroGeographics for the administrative boundaries).
Sustainability 17 09361 g003
Figure 4. Impact of extreme weather events on residents’ lives in Starachowice. Responses are shown by gender (M—male, F—female). Asterisks denote responses with statistically significant differences, as determined by the Mann–Whitney U test (p < 0.05).
Sustainability 17 09361 g004
Figure 5. Impact of extreme weather events on the functioning of Starachowice. Responses are shown by gender (M—male; F—female). Asterisks denote responses with statistically significant differences according to the Mann–Whitney U test (* p < 0.05, ** p < 0.01).
Sustainability 17 09361 g005
Figure 6. Self-assessment of residents’ capacity to cope with extreme weather events, presented by gender (M—male; F—female). Asterisks denote responses with statistically significant differences according to the Mann–Whitney U test (* p < 0.05, ** p < 0.01).
Sustainability 17 09361 g006
Figure 7. Residents’ assessment of the city’s capacity to cope with extreme weather events, presented by gender (M—male; F—female). No statistically significant differences were found.
Sustainability 17 09361 g007
Figure 8. Residents’ assessment of the city’s capacity to cope with extreme weather events, presented by age groups. Asterisks denote responses with statistically significant differences according to Spearman’s correlation (p < 0.05).
Sustainability 17 09361 g008
Figure 9. Resources which respondents lack that would help them better cope with extreme weather.
Sustainability 17 09361 g009
Figure 10. Factors motivating respondents to take action to reduce the risk of damage from extreme weather events.
Sustainability 17 09361 g010
Table 1. Overview of selected survey-based studies concerning adaptation behaviours.
ReferenceAims and ScopeMethodologyStudy Area/Hazard Analysed
[31]Investigate homeowners’ preparedness for climate change impacts (interest in purchasing mitigation and adaptation improvements), their concern about cli-mate change, awareness of flood risk, and views on responsibility for action. Explain reasons for the low uptake of measures and recommend how to accelerate property-level investmentSurvey (telephone)
Sample: n = 961
England and Wales, the UK
Hazard: flood
[32]Provide empirical evidence on what inspires adaptation engagement in different citizen groups, including material and subjective aspects (emotions, values, beliefs)Survey (written)
Sample: n = 217 (non-representative)
Lomma, Sweden
Hazards: pluvial and coastal flooding, storms
[43]Develop and test a model of antecedents of pro-environmental behaviours (PEB) and their psychological precursors (risk perception, response efficacy, psychological adaptation), validate the model in two national samples, and recommend strategies for promoting behaviour changeSurvey (online)
Sample:
Study 1: n = 3096, Study 2: n = 3480 (nationally representative panels)
Study 1: Australia,
Study 2: France
Hazards: Storms, Bushfires, Droughts, Floods, and other natural disasters
[45]Deepen the understanding of urban residents’ behavioural response to climate change and its influencing factorsSurvey (online) and face-to-face interviews
Sample: n = 386
Tianjin, China
Hazard: flood, heat wave, cold spell
[47]Understand the level of, and explanatory factors for, self-protective behaviour of private households against the impacts of extreme weather eventsFace-to-face interviews
Sample: n = 210 (non-representative)
Three cities in the Philippines
Hazards: heat waves, drought, heavy precipitation
[48]Explore whether people’s perceptions of climate change (its reality, causes, and consequences) determine their adaptation actions, i.e., support for policies, information-seeking, and practical preparedness in response to different hazards and contextsSurvey (online)
Sample:
Study 1: n = 3546 Study 2: n = 803
Study 1: A medium-sized city in the Netherlands
Hazard: pluvial flooding and urban heat island
Study 2: The UK
Hazard: heatwaves
Table 2. Main variables and assigned items as part of the Social Adaptive Capacity Tool. (Source: Own elaboration based on multiple sources).
VariableFactorItemReferences
A.
Risk perception of climate change
Perceived
probability
Q1. Perceived past weather trends in the city
(changes in extreme weather occurrence)
[47] *
Belief certaintyQ2. Belief that climate change affects
the residents personally
[51]
Perceived severity
of impacts
Q3. Extreme weather impact on citizens’ lives[47] *
Q4. Extreme weather’s impact on the city’s functioning[47] *
Personal experienceQ5. Experienced damage due to extreme weather[32] *
B.
Perceived
adaptive
capacity
Adaptation efficacyQ8. Belief that adaptation to climate change can help better cope with extreme weather impacts[43] *
Adaptation knowledgeQ12. Belief in being well-informed about methods of coping with climate change[47] *
Self-efficacyQ15. Self-assessment of abilities to cope with extreme weather[32]
Institutional efficacyQ16. Assessment of the city authorities’ abilities to cope with extreme weatherOwn
elaboration
C.
Adaptation
motivation
Social norms and
access to resources
Q13. Resources needed to better cope with extreme weather[32] *
Q14. Factors motivating adaptation behaviours of individuals[32] *
Adaptation
responsibility
Q6. Belief in self-responsibility for property protection against extreme weather[47] *
Q7. Belief in the city authorities’ responsibility for residents and property protection against extreme weather[31] *
D.
Adaptation
behaviour
Adaptive actions
taken and intended
Q9. Adaptation measures to reduce the negative effects of heat waves[48] *
Q10. Adaptation measures to reduce flash floods, urban heat island[32,48] *
Q11. Adaptation measures to protect from heavy rainfall, floods, strong winds and storms[32]
Grassroot
initiatives
Q17. Membership in an NGO or a local association which tries to influence local climate change adaptation policy[32] *
Q18. Active participation in an association or a residents’ group that seeks to improve the climate and natural environment in the city[32] *
Adaptation policy
support
Q19. Support for implementing adaptation measures by local authorities to reduce the negative effects of climate change[48] *
* Modified from original wording, items numbered according to their position in the questionnaire.
Table 3. Research sample characteristics in Starachowice (n = 238).
VariableValueSampleVariableValueSample
GenderFemale15565.1%Place
of living
Multi-family housing11447.7%
Male8033.6%Single-family housing12451.9%
Other31.3%Net
income per person in the household
≤1000 PLN41.7%
Age18 to 292610.9%1001–2000 PLN4820.2%
30 to 395523.1%2001–3000 PLN7431.1%
40 to 496426.9%3001–4000 PLN4418.5%
50 to 594518.9%4001–5000 PLN177.1%
>604820.2%>5000 PLN166.7%
Education levelBasic or basic
vocational
education
93.8%Non-response3514.7%
High School
Diploma
6828.2%Economic activityEconomically
active
18075.3%
University
degree
16168.0%Economically
inactive or
unemployed
5824.3%
Table 4. Correlations between selected items representing four variables (A–D) of social adaptive capacity in the case study.
VariableA.B.C.D.
ItemQ2.Q5.Q8.Q15.Q16.Q6.Q7.Q13.1Q13.2Q13.3Q13.4Q13.5Q13.6Q13.7Q13.8Q13.9Q13.10Q9–11
(1)
Q9–11
(2)
AQ2.10.27 *0.36 *−0.25 *−0.090.040.22 *0.10.01−0.020.1100.02−0.050.15 *0.04−0.120.080.20 *
Q5.0.27 *10.25 *−0.19 *−0.13 *0.060.110.19 *−0.060.01−0.01−0.060.15 *−0.15 *0.17 *0.18 *−0.19 *0.17 *0.16 *
BQ8.0.36 *0.25 *1−0.040.050.16 *0.34 *0.0700.16 *0.110.02−0.07−0.050.090−0.15 *0.19 *0.06
Q15.−0.25 *−0.19 *−0.0410.32 *0.11−0.08−0.06−0.010.02−0.15 *−0.07−0.08−0.18 *−0.16 *−0.080.13 *0.15 *−0.21 *
Q16.−0.09−0.13 *0.050.32 *10.19 *−0.21 *−0.17 *−0.020.0200.09−0.040−0.18 *−0.34 *0.16 *−0.05−0.02
CQ6.0.040.060.16 *0.110.19 *1−0.030−0.040.10−0.080.01−0.120.09−0.14 *−0.010.080.02
Q7.0.22 *0.110.34 *−0.08−0.21 *−0.0310.110−0.080.020−0.09−0.1−0.010.15 *−0.080.020.13
Q13.10.10.19 *0.07−0.06−0.17 *00.1110.11−0.06−0.02−0.050.06−0.070.10.09−0.53 *0.070.24 *
Q13.20.01−0.060−0.01−0.02−0.0400.111−0.07−0.05−0.15 *−0.080.040.120−0.16 *0.010.17 *
Q13.3−0.020.010.16 *0.020.020.1−0.08−0.06−0.0710.03−0.01−0.05−0.05−0.040.04−0.14 *−0.050.05
Q13.40.11−0.010.11−0.15 *000.02−0.02−0.050.0310.11−0.14 *−0.01−0.070.04−0.08−0.120.05
Q13.50−0.060.02−0.070.09−0.080−0.05−0.15 *−0.010.111−0.010.11−0.1−0.13 *−0.16 *−0.09−0.02
Q13.60.020.15 *−0.07−0.08−0.040.01−0.090.06−0.08−0.05−0.14 *−0.011−0.05−0.02−0.03−0.22 *0.080.09
Q13.7−0.05−0.15 *−0.05−0.18 *0−0.12−0.1−0.070.04−0.05−0.010.11−0.0510.04−0.02−0.12−0.050.07
Q13.80.15 *0.17 *0.09−0.16 *−0.18 *0.09−0.010.10.12−0.04−0.07−0.1−0.020.0410.02−0.20 *0.060.07
Q13.90.040.18 *0−0.08−0.34 *−0.14 *0.15 *0.0900.040.04−0.13 *−0.03−0.020.021−0.22 *0.070.12
Q13.10−0.12−0.19 *−0.15 *0.13 *0.16 *−0.01−0.08−0.53 *−0.16 *−0.14 *−0.08−0.16 *−0.22 *−0.12−0.20 *−0.22 *1−0.08−0.20 *
DQ9–11 (1)0.080.17 *0.19 *0.15 *−0.050.080.020.070.01−0.05−0.12−0.090.08−0.050.060.07−0.081−0.33 *
Q9–11 (2)0.20 *0.16 *0.06−0.21 *−0.020.020.130.24 *0.17 *0.050.05−0.020.090.070.070.12−0.20 *−0.33 *1
* Statistically significant correlations are denoted by asterisks (p < 0.05). Items Q9–11 (1) represent actions implemented, while Q9–11 (2) represent actions planned to reduce the impacts of extreme weather. Item Q13 represents resources to better cope with extreme weather: (1) Financial; (2) Access to tools or other equipment; (3) Insurance protection; (4) Family and friends nearby; (5) Good health; (6) Time; (7) Experience with previous events; (8) Technical knowledge; (9) Support from local authorities; (10) No resources.
Table 5. Spearman’s correlation between the number of experienced damage types and the factors motivating respondents’ adaptation behaviour.
Q5. Experienced Damage
due to Extreme Weather
Q14. Factors Motivating Adaptation Behaviours of IndividualsR
1. Low cost of action0.17 *
2. Receiving economic benefits (e.g., tax reduction)0.19 *
3. Encouragement from family, friends or neighbours0.25 *
4. Helping protect more vulnerable people0.24 *
5. Clear conscience that one does what is “right”0.22 *
6. People in the surroundings take action0.25 *
7. Contributing to the quality of the city’s environment0.36 *
8. Action requires low or no prior knowledge0.12
9. Encouragement from city authorities0.05
* Statistically significant correlations are denoted by asterisks (p < 0.05).
Disclaimer/Publisher’s Note: The statements, opinions and data contained in all publications are solely those of the individual author(s) and contributor(s) and not of MDPI and/or the editor(s). MDPI and/or the editor(s) disclaim responsibility for any injury to people or property resulting from any ideas, methods, instructions or products referred to in the content.