Abstract
Landslides pose significant threats to sustainable development by causing infrastructure damage and ecosystem degradation, particularly in densely vegetated mountainous regions. To support sustainable land-use planning and disaster-resilient development, this study integrates three advanced vegetation metrics—Vegetation Formation Group (VFG), aboveground biomass (AGB), and forest canopy height (FCH)—into landslide susceptibility modeling. Using Yuanling County, a subtropical vegetated region in China, as a case study, we developed a novel ensemble model, AdaBoost-CB (AdaBoost-CatBoost), and compared its performance with mainstream machine learning models including RF, XGBoost, and LGB. The results show that AdaBoost-CB achieved the highest Area Under the Curve (AUC) value of 0.915. Furthermore, it yielded the highest landslide frequency ratio of 6.51 in the very-high-susceptibility zones. The dominant landslide-controlling factors—NDVI, elevation, slope gradient, slope aspect, and rainfall—were consistently identified across six models. These findings provide a scientific basis for sustainable land-use planning and disaster risk reduction strategies, contributing directly to the goals of sustainable development in vulnerable mountainous regions.
1. Introduction
Landslides rank among the most destructive geological hazards worldwide, inflicting considerable casualties and infrastructure damage, especially in densely vegetated mountainous regions under monsoon climates [1]. In 2016 alone, landslides accounted for about 70 % of the 9710 geological disasters recorded nationwide in China, causing an estimated direct economic loss of ≈22 billion CNY [2]. Consequently, accurate landslide-susceptibility mapping (LSM) is essential for disaster risk reduction and land-use planning.
In recent years, machine learning (ML) techniques have been increasingly applied to LSM because of their capacity to model complex non-linear relationships between landslide occurrence and environmental predisposing factors [3,4]. Commonly used algorithms—including Random Forest (RF), Extreme Gradient Boosting (XGBoost) and Light Gradient Boosting Machine (LightGBM)—have demonstrated superior predictive performance relative to traditional statistical methods [5,6]. Nevertheless, single models frequently suffer from over-fitting or under-fitting when handling high-dimensional, imbalanced landslide inventories [7].
To overcome these limitations, ensemble learning frameworks have been introduced to enhance model robustness and generalisability. For example, Pham et al. [4] proposed a hybrid ensemble that couples bagging and boosting strategies, achieving higher accuracy in the Himalayan region. Despite these advances, the selection of predictor variables—particularly vegetation-related metrics—remains a critical bottleneck for further improving model performance in densely vegetated terrain.
Vegetation exerts a dual influence on slope stability. Root networks mechanically reinforce soils and enhance shear strength, whereas canopy loading and transpiration may desiccate soils and promote cracking, potentially destabilising slopes [8]. Although the Normalised Difference Vegetation Index (NDVI) is widely adopted as a proxy for vegetation cover, it fails to capture structural and functional attributes that are more directly linked to mechanical reinforcement and hydrological regulation [9]. Recent studies therefore advocate incorporating multi-dimensional vegetation metrics—such as above-ground biomass (AGB), forest-canopy height (FCH) and vegetation functional group (VFG)—to better represent ecological controls on landslides [8,10].
However, systematic evaluations of the incremental value of these advanced vegetation metrics in landslide-susceptibility modelling remain scarce. This study addresses this knowledge gap by integrating three novel vegetation variables—VFG, AGB and FCH—into a high-resolution LSM framework. Furthermore, we propose a new ensemble algorithm, AdaBoost-CatBoost (AdaBoost-CB), which embeds the CatBoost classifier—known for its superior handling of categorical features and resistance to over-fitting [11]—within an adaptive-boosting architecture.
The objectives of this research are three-fold:
- (1)
- To quantify the individual and combined contributions of multi-dimensional vegetation metrics to landslide-susceptibility modelling;
- (2)
- To compare the predictive performance of the proposed AdaBoost-CB ensemble with five widely used ML algorithms;
- (3)
- To produce a scientifically robust landslide-susceptibility map for Yuanling County, Hunan Province—a representative vegetated mountainous region in subtropical China.
By demonstrating that ecologically meaningful vegetation variables can significantly enhance both model accuracy and physical interpretability, this work contributes to the growing field of geo-ecological hazard modelling and is expected to inform landslide-risk management and ecological planning in forested mountainous regions.
2. Study Area and Data
2.1. Study Area
Yuanling County is situated in the northwestern part of Hunan Province, administratively under the jurisdiction of Huaihua City, at the northern end of Huaihua City and in the middle reaches of the Yuan River. It is located at the convergence of the southeastern foothills of the Wuling Mountains and the northeastern end of the Xuefeng Mountains (Figure 1). The geographical coordinates of the county are between 110°05′31″ E to 111°06′27″ E and 28°04′48″ N to 29°02′26″ N. The county spans 106.6 km from north to south and 90.5 km from east to west, with a total area of 5832 square kilometers. The topography of Yuanling County is characterized by significant diversity, with overlapping mountains and a network of rivers, resulting in a complex terrain. Influenced by the Wuling and Xuefeng tectonic movements in ancient geological history, the county retains extensive areas of metamorphic slate strata from the Proterozoic Era and earlier. The highest elevation in the county is 1355.3 m, the lowest is 45 m, and the average elevation is 260 m. Yuanling County has a subtropical monsoon humid climate, with the highest average temperature of 27.8 °C in July and the lowest average temperature of 4.7 °C in January. The mean annual temperature is 16.6 °C, and the average annual precipitation is 1440.9 mm, ranging from 958.8 to 2047.8 mm. The county is rich in forest resources and has diverse vegetation types, with forest land covering 6.85 million mu (approximately 456,667 hectares), accounting for 79.2% of the county’s total land area. The total volume of standing timber is 18.86 million cubic meters, and the forest coverage rate is 76.19%.
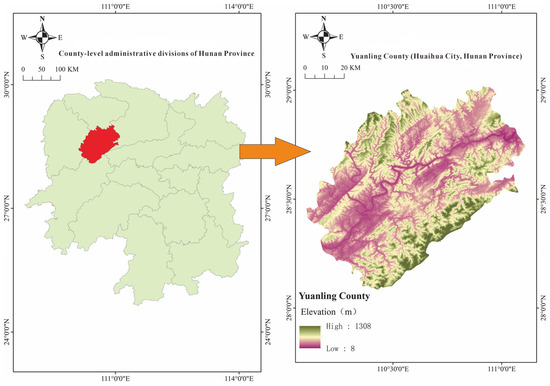
Figure 1.
Overview map of the study area.
2.2. Data
2.2.1. Landslide and Non-Landslide Data Preparation
The landslide inventory covering 2000–2022 was compiled by integrating high-resolution Google Earth imagery with historical archives. A total of 279 landslides were manually delineated on the basis of diagnostic geomorphological signatures; they are concentrated in the central and western parts of the study area. To construct a balanced training set, we adopted a buffer-based sampling strategy. Positive samples were enriched by generating two random points within a 30 m radius of each landslide polygon, resulting in 837 landslide points. Negative samples were optimised by randomly allocating 837 points beyond a 1 km buffer of any landslide, ensuring that these points fell on stable slopes with similar environmental settings. Consequently, the final dataset comprises 837 positive and 837 negative samples.
2.2.2. Environmental Factor Preparation
Thirteen predisposing factors were compiled at 12.5 m spatial resolution (Table 1). Vegetation metrics—NDVI, Vegetation Functional Group (VFG), above-ground biomass (AGB) and forest-canopy height (FCH)—constitute the core ecological variables. NDVI (30 m native, 2019) was acquired from the Chinese Ecosystem Research Network (CERN (Core Institution): Beijing, China). VFG (30 m, 2020) was sourced from CASEarth (Beijing, China) [12]. AGB (30 m, 2019) and FCH (30 m, 2019) were obtained from the Digital Ecosystem Group, Institute of Botany, CAS (http://www.ib.cas.cn/, accessed on 14 October 2025) [13,14]. Topographic variables (elevation, slope angle and aspect) were derived from NASA’s 12.5 m DEM product provided by Japan’s ALOS satellite, specifically collected between 2006 and 2011. Mean annual rainfall (1 km, 2018–2022) was interpolated from gauge records provided by the Qinghai–Tibet Plateau Data Centre (Beijing, China) [15]. River and road vectors were obtained from OpenStreetMap (updated 2024, https://www.openstreetmap.org/, accessed on 14 October 2025), while faults and lithology were digitised from 1:200 k geological maps (2022); land-use type came from 30 m Wuhan University (Wuhan, China) data (30 m, 2021) [16]. All feature layers were converted to Euclidean-distance rasters, bilinearly resampled to 12.5 m, and clipped to 37,052,210 pixels for modelling.

Table 1.
Description of evaluation-factor datasets.
Vegetation Factors
Vegetation exerts a significant influence on landslide occurrence in densely vegetated areas through root reinforcement, water-cycle regulation and improvement of soil physicochemical properties. In this study, four vegetation characteristic variables were used: Normalized Difference Vegetation Index (NDVI), Vegetation Formation Group (VFG), above-ground biomass (AGB) and forest canopy height (FCH) (Figure 2a–d). NDVI (30 m, 2019) was obtained from the Chinese Ecosystem Research Network Data Center [12]; VFG (30 m, 2020) was sourced from CASEarth [13]; FCH and AGB (30 m, 2019) were provided by the Digital Ecosystem Group [14,15]. High-value NDVI zones are concentrated along the northern and western ridges, whereas the You-Shui valley and the southern foothills of the Xuefeng Mountains appear as a continuous low-value belt (Figure 2a). VFG shows that evergreen broad-leaved forest dominates the northern mountains; the You-Shui mainstream and its first-order tributaries are lined with lighter-coloured patches corresponding to orchards and shrublands, which exhibit the highest spatial overlap with landslide points (Figure 2b). AGB exhibits a clear northwest–southeast gradient: biomass peaks in the northwestern ridges (deep-green tones), declines toward the northeast, and falls to its minimum in the southwest, where intense red tones indicate the sparsest vegetation cover (Figure 2c). The tonal gradient of FCH mirrors NDVI: canopy heights > 20 m occur on the northern and western ridges, whereas gorge areas generally exhibit values < 10 m, yielding a clear valley--ridge contrast (Figure 2d).
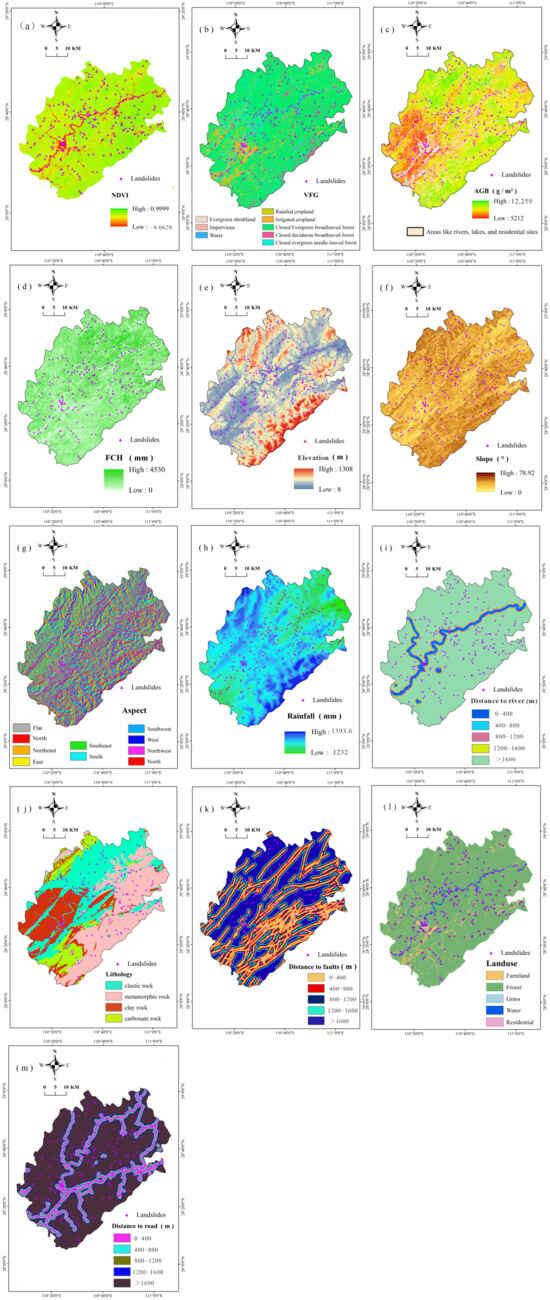
Figure 2.
Grading chart of evaluation factors. (a) NDVI; (b) VFG; (c) AGB; (d) FCH; (e) Elevation; (f) Slope; (g) Aspect; (h) Rainfall; (i) Distance to rivers; (j) Lithology; (k) Distance to faults; (l) Land type; (m) Distance to roads.
Topographic Factors
Topographic factors directly impact slope and terrain stability and thus play a crucial role in landslide events. In this study, elevation, slope gradient and slope aspect were used (Figure 2e–g). These data were derived from NASA’s 12.5 m resolution DEM product provided by Japan’s ALOS satellite, collected between 2006 and 2011. Fault data were obtained from the 1:200,000 geological map data of the Geoscientific Data & Discovery Publishing System. The colour ramp of elevation reveals a “two-ridges sandwich one valley” pattern: dark-green ridges (>800 m) in the north (Wuling) and south (Xuefeng) enclose a light-green to yellow Youshui gorge (200–500 m) (Figure 2e). Valley walls along the You-Shui and its first-order tributaries are rendered in dark brown-red (>30°), whereas the summit surfaces of Shengren-shan and Jiulong-shan switch to orange-yellow (<20°) (Figure 2f). The slope aspect map (Figure 2g) illustrates the orientation of slopes across the study area, with different colors representing various directions: red for north, green for east, yellow for south, and blue for west. This map helps identify areas that may be more susceptible to landslides due to their exposure to precipitation and sunlight, which can affect slope stability.
Climatic and Hydrological Factors
Climatic and hydrological factors are important in landslide formation. Rainfall increases soil moisture content and pore-water pressure, thereby reducing soil shear strength and increasing slope instability. Areas near rivers may be more prone to landslides due to water erosion; the erosive and scouring effects of water systems can weaken slope stability and increase landslide risks. In this study, rainfall and distance to rivers were used (Figure 2h–i). Rainfall data were sourced from the Qinghai–Tibet Plateau Data Center [15], with preprocessing involving interpolation to convert 1 km resolution annual rainfall data from 2018 to 2022 into 30 m grid size. Hydrological river data were obtained from OpenStreetMap and updated to 2024. Climatic factors, particularly rainfall, significantly influence landslide susceptibility. The rainfall map (Figure 2h) shows a gradient from southwest to northeast, with the highest rainfall levels in the southwest and lower levels in the northeast. This pattern is consistent with the spatial distribution of landslides, which are more frequent in areas with higher rainfall. The distance to river map (Figure 2i) indicates that landslides are more likely to occur closer to rivers, as shown by the concentration of landslide points within the blue buffer areas, which represent shorter distances to the river.
Geological Factors
Geological conditions such as lithology and the presence of faults significantly influence landslide susceptibility; specific rock types, geological structures and land types may make slopes more prone to landslides. In this study, lithology, distance to faults and land type were used (Figure 2j–l). Lithology and distance to faults data were obtained from the 1:200,000 geological map data of the Geoscientific Data & Discovery Publishing System, while 30 m resolution land-type data were provided by Wuhan University [16]. Lithology, distance to faults, and land-use type were key factors considered to evaluate the geological and human-induced influences on landslide susceptibility. Figure 2j illustrates distinct lithological zones: elastic rock (cyan) is predominant in the northwest, while metamorphic rock (pink) and clay rock (red) are more common in the central and southern regions, respectively. Carbonate rock (yellow) is also present but less widespread. The distribution of these lithologies correlates with the locations of landslides, suggesting certain rock types may be more susceptible to failure. Figure 2k demonstrates that landslides are more frequent in areas closer to faults, as indicated by the concentration of landslide points within the yellow buffer zones, which represent shorter distances to faults. This suggests that faults may significantly contribute to landslide initiation by compromising slope stability. Figure 2l indicates that landslides are more likely to occur in areas designated as farmland (yellow), highlighting the impact of human land use on slope failure. In contrast, forested areas (green) appear more stable, emphasizing the protective role of natural vegetation in reducing landslide risk.
Human Activity Factors
Human activities such as road construction can alter surface-water flow paths and increase landslide likelihood; excavation and filling during road construction and maintenance can directly destabilize slopes. In the study, the influence of human activities on landslide susceptibility was examined using the distance to roads as a proxy, as shown in Figure 2m. The map illustrates that landslides are more frequent in areas closer to roads, indicated by the concentration of landslide points within the pink buffer areas. This suggests that road construction and maintenance can contribute to landslide occurrences by altering slope stability.
3. Methodology
The study follows a five-step methodology: (i) collect historical landslide data, digital elevation model data, meteorological and hydrological data, road network and geological map data, and land use data for the study area; (ii) interpret landslides using high-resolution satellite imagery from Google Earth, establish a landslide inventory, extract evaluation factors, preprocess the data into a 12.5 m raster grid, and create a dataset of evaluation factors; (iii) use Information Gain (IG), entropy weight, Random Forest, LGB, XGBoost, and AdaBoost-CatBoost (AdaBoost-CB) to identify key landslide factors; (iv) predict landslide probabilities using different machine learning models and generate corresponding landslide susceptibility maps; and (v) analyze the extremely susceptible areas of the Landslide Susceptibility Prediction (LSP) results from different models to determine the optimal model and evaluate model performance. See Figure 3 for a simplified flowchart.

Figure 3.
Process Flowchart.
3.1. Machine Learning Algorithms
3.1.1. CatBoost Algorithm
CatBoost is a powerful machine learning algorithm specifically designed to handle datasets containing categorical features. It is based on symmetric decision trees and excels in classification tasks. Its unique mechanisms for correcting gradient bias and prediction shift effectively reduce overfitting, enhancing both accuracy and generalization capability [11].
3.1.2. AdaBoost Algorithm
AdaBoost (Adaptive Boosting) is an ensemble learning algorithm that trains weak classifiers by iteratively adjusting sample weights. The weights of misclassified samples are increased, while those of correctly classified samples are decreased, enabling subsequent classifiers to focus on difficult-to-classify instances and progressively improve the overall accuracy of the model [17,18].
3.1.3. AdaBoost-CB Algorithm
The AdaBoost-CB is a novel ensemble model first applied in landslide susceptibility prediction experiments, with its architecture shown in Figure 4. This model integrates the CatBoostClassifier as the base learner within the AdaBoostClassifier framework. Here, the AdaBoostClassifier combines predictions from multiple CatBoost classifiers, enhancing the model’s ability to handle nonlinearity and high-dimensional features in complex problems. The framework and computational process of AdaBoost-CB are as follows:
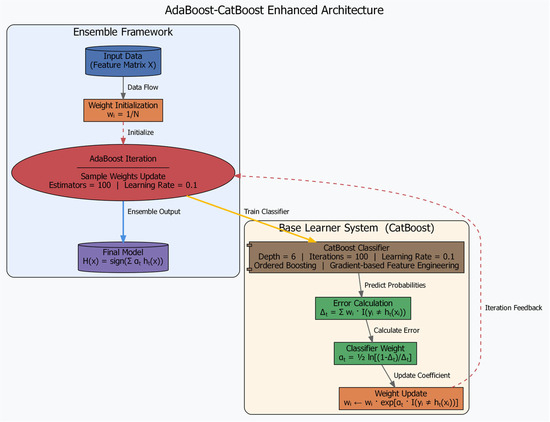
Figure 4.
daBoost-CatBoost Model Framework Diagram.
Outer framework
AdaBoost drives the system for T = 100 rounds: each round trains a CatBoost weak learner with current sample weights, computes classifier weight αₜ = 1/2 ln[(1 − Δₜ)/Δₜ], and increases weights of mis-classified samples, forming a “hard-sample & causality focus” loop.
Inner CatBoost (parameters locked by interaction matrix M)
depth = 6 (C = +17, main cause, enlarge first)
iterations = 100 (balanced, second priority)
learning_rate = 0.1 (C = –7, effect receiver, fine-tune last)
ordered boosting + rsm = 1.0 handle categorical features and prevent target leakage
Training pipeline (mapped to M)
- ①
- jInit: Wi = 1/N
- ②
- kFor t = 1…100
Train CatBoost(ht) with current weights
Compute Δt and αt (αt directly from the “classifier weight” row of M)
Boost mis-classified weights by αt → next round
- ③
- lOutput: H(x) = sign (Σ αt ht(x)).
3.1.4. XGBoost Algorithm
XGBoost (Extreme Gradient Boosting) is an efficient gradient boosting framework introduced by Chen and Guestrin . The algorithm optimizes the ensemble of decision trees using gradient descent and incorporates regularization terms to control model complexity. XGBoost demonstrates exceptional computational efficiency and scalability when handling large-scale datasets, and it performs particularly well in machine learning competitions that require rapid processing and efficient training [19,20].
3.1.5. Random Forest Algorithm
The Random Forest (RF) algorithm, proposed by Breiman, is an ensemble learning method that constructs multiple decision trees and combines them through a voting mechanism to improve the accuracy of classification and regression tasks. During the training of each decision tree, the algorithm randomly selects feature subsets, which helps reduce overfitting. Random Forest is highly effective in processing high-dimensional data, especially in feature selection, as it can accurately identify the most important features for classification tasks [21,22].
3.1.6. LightGBM Algorithm
LightGBM is an efficient ensemble learning technique based on gradient boosting decision trees. It employs a leaf-wise tree growth strategy and a histogram-based algorithm to optimize speed and memory usage, enabling fast training while maintaining high accuracy. LightGBM has demonstrated strong performance across various data types and has achieved excellent results in numerous practical applications [23].
3.2. Entropy Model
Entropy is a measure of the uncertainty in a system. In information theory, higher entropy indicates greater system uncertainty, while lower entropy corresponds to higher information content [24]. This concept provides a foundation for calculating weights in multi-criteria comprehensive evaluations. In landslide susceptibility prediction, the entropy weight method is used to assess the relative importance of influencing factors, thereby providing more precise data inputs for model construction [25].
3.3. Information Gain Model
Information Gain (IG) is a method used in decision tree algorithms to select the optimal splitting point. It quantifies the reduction in uncertainty achieved by partitioning the dataset and determines the importance of a feature. A higher information gain value indicates a stronger influence of the feature on the classification outcome. IG is widely applied in machine learning for feature selection, particularly in decision tree algorithms such as ID3 and C4.5 [26].
4. Results
4.1. Multicollinearity Check and Feature Selection of Environmental Factors
In this study, the Pearson correlation coefficient was employed to measure the correlation among all factors. As depicted in Figure 5, no strong correlation (>0.8) was found between any pair of factors, indicating that all factors exhibited strong independence. Consequently, all 13 evaluation factors were retained for subsequent contribution rate analysis.
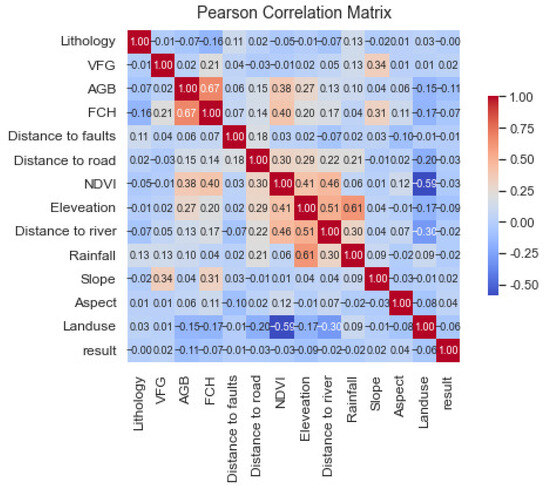
Figure 5.
Pearson covariance index plot.
4.2. Factor Contribution Rate Analysis Using Six Models
The differing principles and logics of machine learning models lead to varying emphases on input features, influencing their applicability in different regions [27]. To systematically analyze the dominant factors affecting landslide susceptibility in Yuanling County, we employed six models—Information Gain (IG), Entropy Weight, Random Forest (RF), LGB, XGBoost, and AdaBoost-CB—for factor contribution rate analysis, as shown in Figure 6.
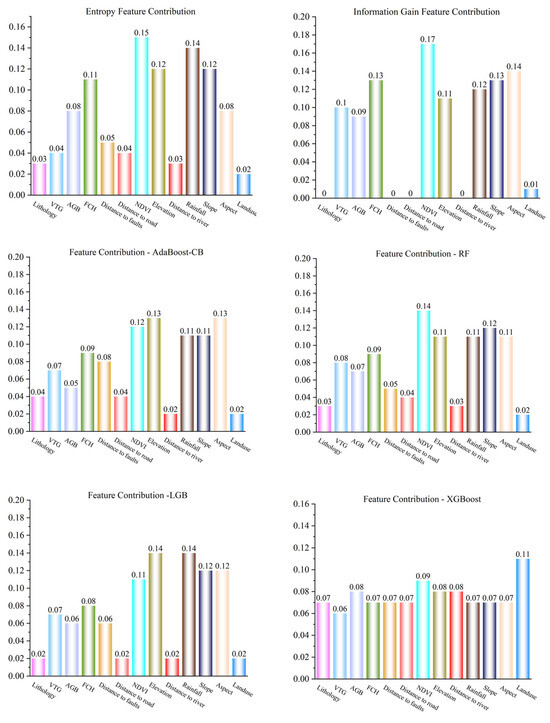
Figure 6.
Contribution rate of evaluation factors of different models.
The Entropy Weight model revealed high contribution rates for NDVI (0.15), Rainfall (0.14), Elevation (0.12), and Slope (0.12). The IG model indicated significant contributions from NDVI (0.17), Aspect (0.14), Forest Canopy Height (FCH) (0.13), and Slope (0.13). For the AdaBoost-CB model, Aspect (0.13), Elevation (0.13), NDVI (0.12), and Slope (0.11) were the top contributors. The RF model highlighted NDVI (0.14), Slope (0.12), Elevation (0.11), and Rainfall (0.11). The LGB model showed substantial contributions from Rainfall (0.14), Elevation (0.14), Aspect (0.12), and Slope (0.12). Meanwhile, the XGBoost model identified Land Use Type (0.11), NDVI (0.09), Aboveground Biomass (AGB) (0.08), and Elevation (0.08) as key factors.
Most models underscored NDVI’s significant role in landslide occurrence. The evaluation factors across models showed minimal disparity, with no single factor overwhelmingly dominating. The three newly introduced vegetation factors (VFG, AGB, and FCH) exhibited notable contribution rates in all models, indicating their relevance to landslide susceptibility. This can be attributed to Yuanling County’s extensive forest coverage and diverse vegetation types. NDVI, a measure of vegetation density and health, directly relates to soil stability through root systems, thereby influencing landslide occurrence. Topographic factors and rainfall also played significant roles, as terrain determines potential sliding surfaces and directions, while rainfall increases surface runoff, eroding slope soil and weakening its structure. Vegetation directly impacts soil stability, highlighting the strong correlation between landslides in Yuanling County and vegetation density and health.
4.3. Accuracy Analysis Using ROC Curves
The ROC curve is a standard graphical tool for evaluating binary classifiers, illustrating the trade-off between true positive rate (TPR) and false positive rate (FPR) [28,29]. To assess model stability and generalization, ten-fold cross-validation was adopted: the dataset was randomly split into ten mutually exclusive folds, nine for training and one for validation in each round, repeated ten times to obtain mean and standard deviation of performance metrics (Figure 7).
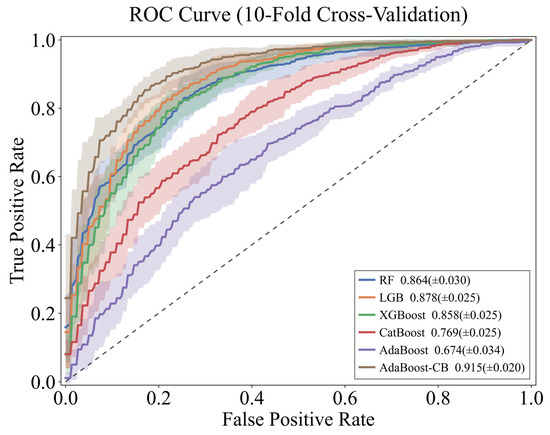
Figure 7.
ROC graphs for the 6 models (shade = ±1 s.d. from 10-fold CV, dash = random classifier).
Using AUC as the primary metric, AdaBoost-CB achieved 0.915 ± 0.020, significantly outperforming the original CatBoost (0.769 ± 0.025) and standard AdaBoost (0.674 ± 0.034), while exhibiting the smallest standard deviation, demonstrating the highest robustness to data partitioning. Compared with other mainstream models, AdaBoost-CB also surpassed RF (0.864 ± 0.030), LGB (0.878 ± 0.025) and XGBoost (0.858 ± 0.025). In subsequent landslide susceptibility mapping, the landslide frequency ratio in extremely susceptible areas will be used to further verify the model’s accuracy in predicting historical landslide locations.
4.4. Comparison of Recall, F1, ACC, and Precision Metrics for Six Models
The analysis based on the ROC curve shows that the AUC value of the Adaboost-CatBoost model reaches 0.915, which is significantly better than other models. However, relying solely on the AUC metric can lead to a one-sided understanding of model performance. In highly imbalanced data scenarios, while the AUC can reflect the overall performance of a classifier [28], it may overestimate the model’s actual ability to distinguish minority classes [29]. This is especially true when there are hidden errors such as missed detections in high-risk areas or misjudgments in safe areas. These limitations have been confirmed by several empirical studies in machine learning: the AUC value is sensitive to class distribution and can easily mask the model’s recognition defects in critical samples in extremely imbalanced data [28,29]. To address these issues, this study introduces a multi-dimensional metric evaluation system, including Recall, F1, ACC, and Precision, to comprehensively analyze model performance, as shown in Figure 8.
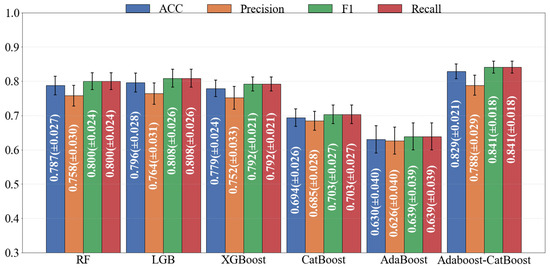
Figure 8.
Comparison of Recall, F1, ACC, and Precision Metrics for Six Models.
Accuracy (ACC) serves as a critical metric for evaluating the overall predictive accuracy of a model in distinguishing between landslide-prone and non-prone areas. In scenarios characterized by data imbalance, where landslide-prone regions constitute a minor proportion (e.g., 10%), an over-reliance on ACC may lead to a bias toward the majority class (non-prone areas), potentially resulting in an inflated accuracy metric [30]. The experimental outcomes demonstrate that AdaBoost-CatBoost achieved the highest ACC value of 0.829 ± 0.021, signifying improvements of 4.1% and 5.3% over LGB (0.796 ± 0.028) and RF (0.787 ± 0.027), respectively. XGBoost (0.779 ± 0.024) exhibited performance close to the baseline, whereas CatBoost (0.694 ± 0.026) and AdaBoost (0.630 ± 0.040) displayed significantly lower ACC values, indicating deficiencies in their overall predictive capabilities.
Recall reflects the model’s capacity to correctly identify true landslide-prone regions, directly impacting the risk of missed detections [1]. AdaBoost-CatBoost attained the highest recall rate of 0.841 ± 0.018, marking enhancements of 4.1% and 5.1% over LGB (0.808 ± 0.026) and RF (0.800 ± 0.024), respectively, showcasing its superior capability in capturing high-risk areas. XGBoost (0.792 ± 0.021) performed near the second tier, while the lower values of CatBoost (0.703 ± 0.027) and AdaBoost (0.639 ± 0.039) revealed an inadequate adaptability of their base learners to complex topographical features, such as missed detections in steep slopes or fault zones.
Precision indicates the reliability of the model’s predictions for landslide-prone areas. AdaBoost-CatBoost achieved the highest precision of 0.788 ± 0.029, representing improvements of 3.1% and 4.0% over LGB (0.764 ± 0.031) and RF (0.758 ± 0.030), respectively, indicating the lowest risk of false alarms. XGBoost (0.752 ± 0.033) showed a 2.5% decrease in precision due to insufficient regularization constraints. The lower values of CatBoost (0.685 ± 0.028) and AdaBoost (0.626 ± 0.040) further confirmed the sensitivity of single ensemble methods to noisy features [7], such as misjudgments in flat areas due to low-resolution topographic data.
The F1 Score, which balances precision and recall through a harmonic mean, is a pivotal indicator of a model’s overall performance [31]. AdaBoost-CatBoost achieved the highest F1 score of 0.841 ± 0.018, representing improvements of 4.1% and 5.1% over LGB (0.808 ± 0.026) and RF (0.800 ± 0.024), respectively, reflecting its balanced ability to minimize both missed detections and false alarms. Although XGBoost (0.792 ± 0.021) demonstrated excellent computational efficiency, its F1 score was 6.2% lower than that of AdaBoost-CatBoost. The lower F1 scores of CatBoost (0.703 ± 0.027) and AdaBoost (0.639 ± 0.039) highlighted the insufficient adaptability of traditional methods to complex topographical data, particularly in transitional areas (e.g., slopes of 15–25°).
AdaBoost-CatBoost led in all four metrics: ACC (0.829), Recall (0.841), Precision (0.788), and F1 (0.841), achieving improvements of 4.1%, 4.1%, 3.1%, and 4.1% over the second-best models, respectively. LGB (ACC = 0.796, Recall = 0.808) and RF (Recall = 0.800, Precision = 0.758) exhibited moderate performance but failed to break through performance bottlenecks. XGBoost (ACC = 0.779, F1 = 0.792) was limited by insufficient feature interaction depth, while CatBoost (ACC = 0.694, Recall = 0.703) and AdaBoost (ACC = 0.630, Recall = 0.639) lagged significantly in imbalanced data scenarios due to inherent algorithmic limitations. These results confirm that the hybrid boosting strategy, through dynamic weight adjustment and gradient boosting optimization, effectively enhances model geaneralization in complex topographical data.
4.5. Landslide Susceptibility Mapping Using Different Models
All raster points in Yuanling County (totaling 646,778,450) were input into six trained models to obtain landslide occurrence probabilities for each raster point. These probabilities were then classified into five susceptibility levels—very low, low, moderate, high, and very high—using the natural breaks classification method in ArcGIS 10.7 software. The susceptibility evaluation maps generated by the six models are shown in Figure 9.
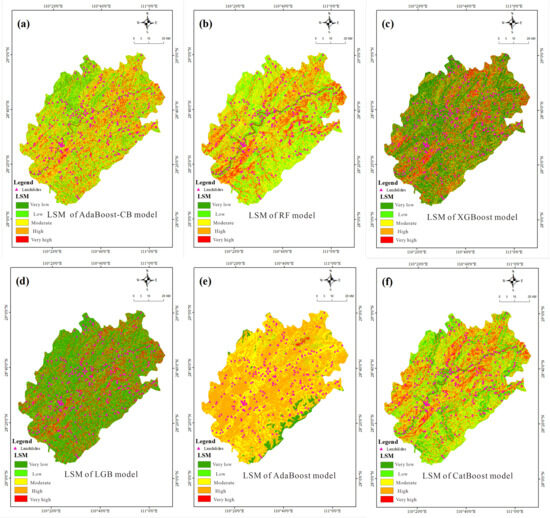
Figure 9.
Susceptibility map of susceptibility for the 6 models. (a) AdaBoost-CB. ; (b) RF; (c) XGBoost; (d) LGB; (e) AdaBoost; (f) CatBoost.
From a spatial-pattern perspective, the susceptibility outputs exhibit pronounced model-dependent heterogeneity along the Yuanling reach of the Yuan River corridor (Figure 9).
- (a)
- AdaBoost-CB delineates a continuous belt of moderate susceptibility that faithfully tracks the central valley axis, coincident with the main Yuan River channel; high-susceptibility pixels appear only as isolated spots on the flanks, indicating the algorithm’s acute sensitivity to riparian terraces and low-relief hills.
- (b)
- RF blankets the valley floor with extensive very-low susceptibility and allocates scarce high-risk pixels, reflecting an inherently conservative classification.
- (c)
- XGBoost assigns high susceptibility to narrow, river-parallel strips along both banks, achieving the closest correspondence with the deeply incised channel morphology.
- (d)
- LGB infills the valley–mountain transition zone with a broad swath of moderate susceptibility, whereas
- (e)
- AdaBoost clusters high-susceptibility patches along the northeastern and southwestern mountainous margins, leaving the valley interior in distinctly lower classes.
- (f)
- CatBoost stretches moderate- to high-susceptibility zones in a dendritic pattern that mirrors the trunk stream and its tributaries.
Collectively, the six maps portray the Yuan River valley as a northeast-trending corridor of diminished susceptibility flanked by elevated risk on the adjacent slopes, underscoring fluvial incision and terrace geomorphology as the primary macro-controls on spatial susceptibility differentiation.
A conspicuous divergence emerges between Figure 9d (LGB) and Figure 9e (AdaBoost): the former renders the bulk of the scene in green (very-low to low susceptibility) with only a thin yellow–orange fringe along the valley rim, whereas the latter saturates the same landscape in yellow (moderate susceptibility) punctuated by red (high susceptibility) agglomerates.
Figure 10 illustrates the landslide-frequency ratio (FR) predicted by each model for the five susceptibility classes in Yuanling County. Within the very-high class, the AdaBoost-CB ensemble attains the highest FR (6.51), demonstrating a pronounced advantage in delineating the most hazardous locations. Random Forest follows with an FR of 5.46, while LightGBM registers 4.28; both algorithms also exhibit strong discriminative power. CatBoost and XGBoost yield FR values of 3.99 and 3.84, respectively—effective but inferior to the top three performers. In contrast, the standalone AdaBoost records the lowest FR (0.85), indicating limited sensitivity to extreme-risk pixels.
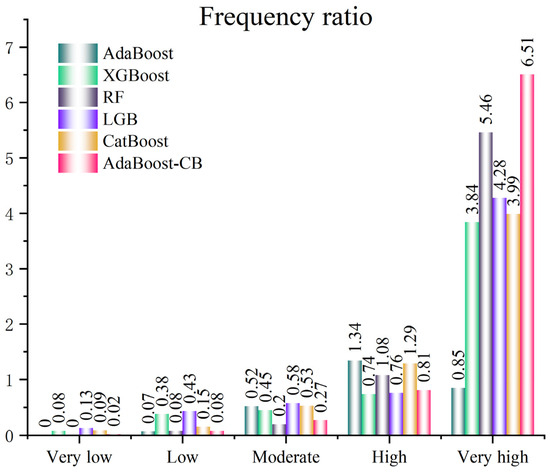
Figure 10.
Frequency Ratios of Landslides for Different Models.
These discrepancies underscore the divergent capacities of the investigated algorithms in identifying landslide-prone hotspots and highlight the superior performance of AdaBoost-CB for this specific task. The observed variations presumably stem from fundamental differences in feature-processing strategies and risk-assessment logics embedded in each model. Consequently, integrating multi-model outputs is recommended to enhance the reliability of susceptibility mapping and to achieve a more comprehensive identification of high-risk zones in practical applications.
5. Discussion
This study presents a novel landslide susceptibility mapping framework integrating multidimensional vegetation metrics and an ensemble learning model (AdaBoost-CB), demonstrating superior performance in a densely vegetated mountainous region. However, several mechanistic, methodological, and policy-related issues remain underexplored.
5.1. From Correlation to Causation: Unpacking the Role of Vegetation
While NDVI, VFG, FCH and AGB all exhibited high variable importance, their underlying mechanisms influencing slope stability differ substantially. NDVI, as a proxy for vegetation cover, enhances soil shear strength primarily through root reinforcement, particularly effective on transitional slopes (15–25°) [9]. In contrast, FCH and AGB reflect above-ground biomass and canopy architecture, which may exert dual effects: deep-rooted species can stabilise shallow soils, whereas increased canopy load and transpiration may induce desiccation cracks in clay-rich metamorphic slate, potentially destabilising slopes [8].
Notably, VFG (vegetation functional group) was introduced to capture ecological functional differences in vegetation. However, the current VFG dataset, derived from reclassified ESA land-cover products, does not distinguish root types or erosion-resistance capacity, limiting its mechanistic interpretability. Future efforts should integrate root mechanical-trait databases and soil–root interaction models to develop physiologically meaningful vegetation–soil coupling indicators.
To conceptually illustrate the mechanistic pathways through which vegetation influences slope stability, we propose a simplified framework (Figure 11). This schematic distinguishes between mechanical effects (root reinforcement via NDVI, FCH, AGB, and VFG) and hydrological effects (transpiration-induced changes in matrix suction and pore-pressure response to rainfall). While this diagram does not replace field-based validation, it provides a visual hypothesis for how vegetation metrics may modulate soil cohesion and suction, ultimately influencing landslide initiation. Empirical quantification of these pathways remains a priority for future work.
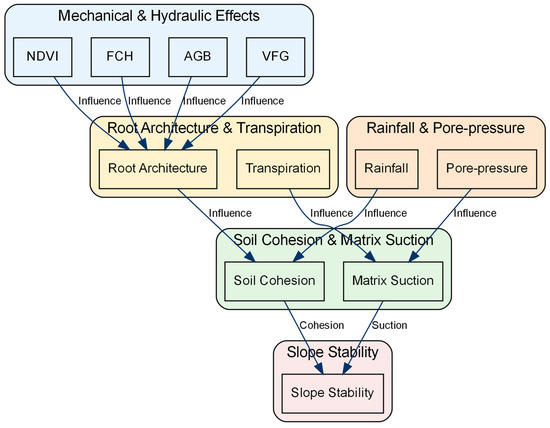
Figure 11.
Conceptual mechanisms of vegetation–slope stability interactions.
To unpack the mechanistic pathways behind the dominant factors, we constructed an asymmetric interaction matrix (Figure 12) from the trained CatBoost model. The matrix quantifies how much parameter A enhances or suppresses parameter B during classification; interaction intensity is encoded 0–1, where 1.0 denotes the strongest directional enhancement and values < 0.3 are considered weak. Notably, Elevation → AGB exhibits the strongest coupling (1.00), indicating that the combined effect of terrain height and above-ground biomass markedly amplifies landslide likelihood. Rainfall → Aspect (0.86) and NDVI → Elevation (0.93) also demonstrate strong directional interactions, implying that vegetation influence is intensified on steep reliefs while rainfall impact is strongly modulated by slope orientation. In contrast, most lithology-related pairs remain below 0.30, underscoring that eco-hydrological–topographic coupling, rather than lithological heterogeneity, governs failure initiation in the Yuanling slate terrain.
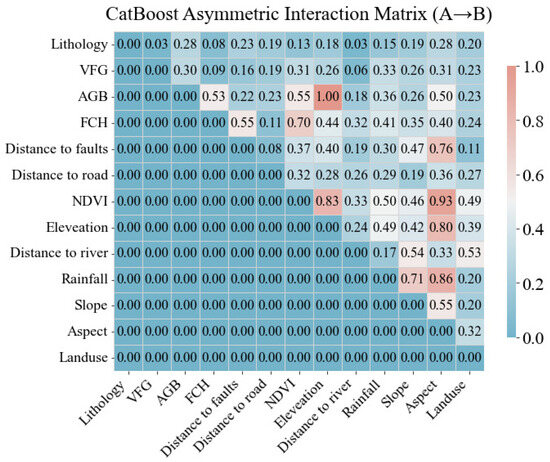
Figure 12.
CatBoost Asymmetric Interaction Matrix.
5.2. Spatial Divergence Among Models: A Geomorphic Perspective
Marked spatial discrepancies were observed among model outputs, particularly between LGB (Figure 9d) and AdaBoost (Figure 9e). LGB tends to under-predict susceptibility in low-gradient valley floors (<10°), possibly overlooking fluvial under-cutting and terrace-deformation-induced instability. Conversely, the standalone AdaBoost model exhibits over-sensitivity to elevation and slope gradients, misclassifying mountainous margins as high-susceptibility zones without fully accounting for lithological resistance (e.g., slate vs. sandstone).
AdaBoost-CB mitigates these biases by leveraging CatBoost’s strength in handling categorical variables (e.g., lithology, VFG), yielding the highest landslide frequency ratio (FR = 6.51) in very-high susceptibility zones and demonstrating superior spatial fidelity to historical landslide density patterns.
5.3. Data-Resolution Constraints and Policy Transferability: From Laboratory to County-Level Implementation
Although all covariate layers were resampled to 12.5 m to match the DEM, the native resolution of the three vegetation metrics (VFG, AGB and FCH) remains 30 m. In heterogeneous landscapes this scale mismatch inevitably introduces mixed-pixel effects. Along the Yuan River terraces, for example, a single 30 m cell frequently contains both orchard plots and remnant broad-leaved forest. Because the root architecture and soil-reinforcement capacity of fruit trees differ from those of old-growth stands, the model may over-estimate the stability of such grid cells. Similar uncertainty arises on road cut-slopes where paved surfaces and sparse herbs coexist within one pixel, potentially depressing the AGB signal and, in turn, under-representing anthropogenic disturbance.
Beyond thematic accuracy, computational burden determines whether a method can be transferred from an academic environment to routine county-level workflows. AdaBoost-CB requires roughly three times the training time of Random Forest and twice that of LightGBM when the same hyper-parameter grid is searched on a standard desktop workstation. Memory demand increases proportionally because the ensemble must store one CatBoost sub-model per boosting round.
5.4. Susceptibility vs. Hazard: Toward a Probabilistic Framework
The present map quantifies spatial likelihood of slope failure under static environmental conditions; it does not incorporate temporal frequency or run-out intensity. Consequently, the output represents relative susceptibility rather than absolute hazard. High-resolution rainfall archives and volume-frequency relationships necessary for quantitative hazard estimation (H = P(S) × P(T) × P(V)) are not yet available for the study area and will be compiled in a subsequent phase.
More fundamentally, VFG, FCH and AGB remain statistical proxies within the ensemble framework. Their physical effects on root cohesion (kPa) and storm-time matric suction have not been measured. Coupling field-derived root-tensile strength and root-area-ratio with shear-box tests will convert the current gain-based importance into additional cohesion and modified hydraulic parameters, shifting the model from a data-driven to a mechanistic platform.
5.5. Limitations and Future Directions
Key limitations include:
- (I)
- Lack of mechanical vegetation parameters: FCH and AGB are not yet linked to root tensile strength or soil cohesion.
- (II)
- Neglect of groundwater dynamics: pore-water pressure and groundwater-table fluctuations are not incorporated.
- (III)
- Absence of cross-regional validation: the model has only been validated in Yuanling County, with no transferability tests in similar eco-geomorphic settings (e.g., Wuling Mountains, Jiangxi hilly region).
Future directions:
- (I)
- Construct a “vegetation–root–soil” coupled database, integrating root area density (RAD) and root–soil interface friction angle.
- (II)
- Develop a CNN-Boost hybrid framework, using CNN to extract topographic texture features, followed by AdaBoost-CB for classification.
- (III)
- Conduct cross-regional transfer-learning experiments to validate model generalisability across different climatic and tectonic settings, facilitating upscaling to provincial-level disaster platforms.
6. Conclusions
This study advances landslide susceptibility assessment in densely vegetated subtropical mountains by integrating multidimensional vegetation metrics with a novel AdaBoost-CB ensemble. The main findings are summarised below.
- Methodological innovation
To the best of our knowledge, this study is the first to simultaneously incorporate vegetation formation group (VFG), forest canopy height (FCH) and above-ground biomass (AGB) into landslide-susceptibility modelling. Ten-fold cross-validation showed that the proposed AdaBoost-CB ensemble achieved an AUC of 0.915, outperforming RF, LGB and XGBoost. Moreover, a frequency ratio of 6.51 in the very-high susceptibility class demonstrates improved identification of historical landslides within densely vegetated mountains.
- 2.
- Dominant controlling factors
Six independent algorithms consistently ranked NDVI, elevation, slope angle, slope aspect and rainfall as the primary regional controls; the newly added three-dimensional vegetation metrics all placed among the top ten contributors. The asymmetric interaction matrix (Figure 12) further reveals that Elevation → AGB (1.00), NDVI → Elevation (0.93) and Rainfall → Aspect (0.86) are the strongest directional couplings, underscoring that eco-hydrological–topographic interactions, rather than lithological heterogeneity, govern failure initiation in the Yuanling slate terrain.
- 3.
- County-scale application value
The 12.5 m resolution susceptibility map clearly differentiates a low-probability corridor along the Yuan River valley from a high-probability metamorphic-slate mountain rim, enabling county authorities to prioritise patrol routes, select sites for terrace-strengthening subsidies and target ecological-restoration zones, thus supporting refined geohazard management at county level.
- 4.
- Policy relevance and computational efficiency
Model size and runtime lie within the range of conventional boosting frameworks, making annual offline updates on a single desktop feasible and offering a readily transferable solution to neighbouring counties in the hilly subtropical region.
- 5.
- Limitations
- (1)
- FCH and AGB are not yet linked to root mechanical parameters, as friction angle, cohesion and root tensile strength were not measured in the field;
- (2)
- Transient pore-water pressure is not considered, and rainfall is used only as a static proxy;
- (3)
- The model has only been validated in Yuanling County, and its generalisability to other regions remains to be tested.
- 6.
- Future directions
We will construct a vegetation–root–soil mechanical attribute database, couple transient hydrological modules, and conduct cross-regional transfer-learning experiments to progress from static susceptibility to dynamic hazard assessment, thereby offering methodological support for provincial land-use planning and disaster risk management.
Author Contributions
Conceptualization, K.Z.; Methodology, S.H.; Software, Y.K. and T.S.; Validation, S.H. and J.Z. (Jianwei Zhou); Formal analysis, K.Z.; Investigation, Y.K., J.T., Y.P. and Z.J.; Data curation, J.Z. (Junmeng Zhao); Writing—original draft, K.Z.; Writing—review & editing, J.Z. (Jianwei Zhou) and W.L.; Supervision, J.L.; Project administration, J.Z. (Junmeng Zhao); Funding acquisition, J.Z. (Junmeng Zhao). All authors have read and agreed to the published version of the manuscript.
Funding
This research was made possible through the generous support of several funding sources. The projects that provided financial backing include: 1. National Natural Science Foundation of China Key Project “Formation Mechanism and Subsequent Earthquake Early Warning of the Jash Strong Earthquake Group” (42230307), spanning from 1 January 2023–31 December 2027. 2. Tibet University Talent Introduction & Cultivation Project [00061166] “Deep Crustal Structure and Seismic Activity in Western China”, 1 January 2023–31 December 2027.
Institutional Review Board Statement
Not applicable.
Informed Consent Statement
Not applicable.
Data Availability Statement
Data is contained within the article.
Conflicts of Interest
The authors declare no conflict of interest.
References
- Reichenbach, P.; Rossi, M.; Malamud, B.D.; Mihir, M.; Guzzetti, F. A review of statistically-based landslide susceptibility models. Earth-Sci. Rev. 2018, 180, 60–91. [Google Scholar] [CrossRef]
- Ministry of Natural Resources of the People’s Republic of China. China Geological Environment Bulletin 2016 [R/OL], Beijing, 2017, 6. Available online: https://www.gov.cn/xinwen/2017-05/04/5190904/files/c1e7f8c031f940afa330756645d6b638.pdf (accessed on 14 October 2025).
- Hossen, S.; Uddin, M.S.; Ali, Y.; Rana, P. Integrated analysis of land use and land cover changes and landslide susceptibility: A machine learning approach in Rangamati Sadar, Bangladesh. Nat. Hazards 2025, 121, 19387–19408. [Google Scholar] [CrossRef]
- Pham, B.T.; Prakash, I.; Singh, S.K.; Shirzadi, A.; Shahabi, H.; Bui, D.T. Hybrid ensemble learning models for landslide susceptibility mapping. Geomorphology 2019, 327, 150–165. [Google Scholar] [CrossRef]
- Indah, Y.M.; Aristawidya, R.; Fitrianto, A.; Erfiani, E.; Jumansyah, L. M.R. Comparison of Random Forest, XGBoost and LightGBM methods on the Human Development Index classification. Jambura J. Math. 2025, 7, 14–18. [Google Scholar] [CrossRef]
- Yang, Z.; Zhang, Y.; Lu, G.; Li, D. Comparative study of ensemble learning models for landslide susceptibility prediction: A case study in the Loess Plateau, China. Geomorphology 2023, 425, 108630. [Google Scholar] [CrossRef]
- Merghadi, A.; Yunus, A.P.; Dou, J.; Whiteley, J.; ThaiPham, B.; Bui, D.T.; Avtar, R.; Abderrahmane, B. Machine learning methods for landslide susceptibility studies: A comparative overview of algorithm performance. Earth-Sci. Rev. 2020, 207, 103225. [Google Scholar] [CrossRef]
- Li, Y.; Duan, W. Decoding vegetation’s role in landslide susceptibility mapping: An integrated review of techniques and future directions. Biogeotechnics 2024, 2, 100056. [Google Scholar] [CrossRef]
- Schwarz, M.; Preti, F.; Giadrossich, F.; Lehmann, P.; Or, D. Quantifying the role of vegetation in slope stability: A review. Earth-Sci. Rev. 2011, 110, 65–83. [Google Scholar] [CrossRef]
- Liu, X.; Su, Y.; Hu, T.; Yang, Q.; Liu, B.; Deng, Y.; Tang, H.; Tang, Z.; Fang, J.; Guo, Q. Neural network guided interpolation for mapping canopy height of China’s forests by integrating GEDI and ICESat-2 data. Remote Sens. Environ. 2022, 269, 112844. [Google Scholar] [CrossRef]
- Prokhorenkova, L.; Gusev, G.; Vorobev, A.; Dorogush, A.V.; Gulin, A. CatBoost: Unbiased boosting with categorical features. In Proceedings of the 32nd Conference on Neural Information Processing Systems (NeurIPS 2018), Montréal, QC, Canada, 3–8 December 2018; pp. 6639–6649. [Google Scholar]
- Yang, J.; Dong, J.; Xiao, X.; Dai, J.; Wu, C.; Xia, J.; Zhao, G.; Zhao, M.; Li, Z.; Zhang, Y.; et al. Divergent shifts in peak photosynthesis timing of temperate and alpine grasslands in China. Remote Sens. Environ. 2019, 233, 111395. [Google Scholar] [CrossRef]
- Zhang, X.; Liu, L.; Chen, X.; Gao, Y.; Xie, S.; Mi, J. GLC_FCS30: Global land-cover product with fine classification system at 30 m using time-series Landsat imagery. Earth Syst. Sci. Data 2021, 13, 2753–2776. [Google Scholar] [CrossRef]
- Su, Y.; Guo, Q.; Hu, T.; Guan, H.; Jin, S.; An, S.; Chen, X.; Guo, K.; Hao, Z.; Hu, Y.; et al. An updated vegetation map of China (1:1,000,000). Sci. Bull. 2020, 65, 1125–1136. [Google Scholar] [CrossRef]
- Peng, S. 1-km Monthly Precipitation Dataset for China (1901–2022); National Tibetan Plateau/Third Pole Environment Data Center: Beijing, China, 2020. [Google Scholar]
- Yang, J.; Huang, X. The 30 m annual land cover dataset and its dynamics in China from 1990 to 2019. Earth Syst. Sci. Data 2021, 13, 3907–3925. [Google Scholar] [CrossRef]
- Freund, Y.; Schapire, R.E. A decision-theoretic generalization of on-line learning and an application to boosting. J. Comput. Syst. Sci. 1997, 55, 119–139. [Google Scholar] [CrossRef]
- Schapire, R.E.; Singer, Y. Improved boosting algorithms using confidence-rated predictions. Mach. Learn. 1999, 37, 297–336. [Google Scholar] [CrossRef]
- Chen, T.; Guestrin, C. XGBoost: A scalable tree boosting system. In Proceedings of the 22nd ACM SIGKDD International Conference on Knowledge Discovery and Data Mining, San Francisco, CA, USA, 13–17 August 2016; pp. 785–794. [Google Scholar] [CrossRef]
- Shahreza, S.K.; Ahmadi, K. Data-driven prediction of masonry flexural bond strength: Interpretability and implications. Case Stud. Constr. Mater. 2025, 23, e05412. [Google Scholar] [CrossRef]
- Breiman, L. Random forests. Mach. Learn. 2001, 45, 5–32. [Google Scholar] [CrossRef]
- Cutler, D.R.; Edwards, T.C.; Beard, K.H.; Cutler, A.; Hess, K.T.; Gibson, J.; Lawler, J.J. Random forests for classification in ecology. Ecology 2007, 88, 2783–2792. [Google Scholar] [CrossRef] [PubMed]
- Ke, G.; Meng, Q.; Finley, T.; Wang, T.; Chen, W.; Ma, W.; Ye, Q.; Liu, T.-Y. LightGBM: A highly efficient gradient boosting decision tree. Adv. Neural Inf. Process. Syst. 2017, 30, 3146–3154. [Google Scholar]
- Shannon, C.E. A mathematical theory of communication. Bell Syst. Tech. J. 1948, 27, 379–423. [Google Scholar] [CrossRef]
- Liu, G.; Li, Z.; Zhang, X.; Jia, H.; Zhang, R. Application of the entropy weight method in landslide susceptibility assessment: A case study of the Wudongde Reservoir area, China. Landslides 2020, 17, 727–742. [Google Scholar] [CrossRef]
- Quinlan, J.R. Induction of decision trees. Mach. Learn. 1986, 1, 81–106. [Google Scholar] [CrossRef]
- Mandal, K.; Saha, S.; Mandal, S. Applying deep learning and benchmark machine learning algorithms for landslide susceptibility modelling in Rorachu river basin of Sikkim Himalaya, India. Geosci. Front. 2021, 12, 101203. [Google Scholar] [CrossRef]
- Fawcett, T. An introduction to ROC analysis. Pattern Recognit. Lett. 2006, 27, 861–874. [Google Scholar] [CrossRef]
- Saito, T.; Rehmsmeier, M. The precision-recall plot is more informative than the ROC plot when evaluating binary classifiers on imbalanced datasets. PLoS ONE 2015, 10, e0118432. [Google Scholar] [CrossRef]
- Hong, H.; Tsangaratos, P.; Ilia, I.; Liu, J.; Zhu, A.-X.; Chen, W. Landslide susceptibility mapping using J48 decision tree with AdaBoost, Bagging and Rotation Forest ensembles in the Three Gorges Reservoir Area, China. Remote Sens. 2018, 10, 1250. [Google Scholar] [CrossRef]
- Pham, B.T.; Prakash, I.; Singh, S.K.; Shirzadi, A.; Shahabi, H.; Bui, D.T. Landslide susceptibility modeling using machine learning algorithms and remote sensing data: A comparative study in Vietnam. Catena 2021, 203, 105348. [Google Scholar] [CrossRef]


Disclaimer/Publisher’s Note: The statements, opinions and data contained in all publications are solely those of the individual author(s) and contributor(s) and not of MDPI and/or the editor(s). MDPI and/or the editor(s) disclaim responsibility for any injury to people or property resulting from any ideas, methods, instructions or products referred to in the content. |
© 2025 by the authors. Licensee MDPI, Basel, Switzerland. This article is an open access article distributed under the terms and conditions of the Creative Commons Attribution (CC BY) license (https://creativecommons.org/licenses/by/4.0/).