Abstract
This paper examines how marketization influences the spatial effects of household consumption upgrading in China, by analyzing provincial panel data from China between 2010 and 2022. The study employs a two-way fixed-effects Spatial Durbin Model to capture both the direct effects of marketization within a region and the spillover effects transmitted to neighboring regions. This model incorporates spatial dependence in both dependent and independent variables, providing a comprehensive assessment of spatial interactions. The results reveal that marketization and consumption upgrading both have the spatial pattern characteristics of significant spatial difference and agglomeration features. Marketization considerably encourages the upgrading of local people’s consumption and has positive spillover effects on the consumption upgrading levels of nearby regions. Mechanism analysis shows that market competition and enterprise innovation play key roles in this process. Heterogeneity analysis shows in eastern regions, areas with high industrial upgrading levels, high financial agglomeration levels, and high house prices, and the promotion effect of marketization on household consumption upgrading is more pronounced. These findings suggest that promoting differentiated regional marketization reforms, amplifying the spillover effects of marketization, reinforcing the dual engine of competition and innovation, and strengthening industrial upgrading and financial agglomeration are key to promote Chinese household consumption upgrading.
1. Introduction
In the face of global economic uncertainty and anti-globalization tendencies, China has entered a pivotal stage of economic restructuring since the 18th National Congress of the Communist Party of China. Domestic consumption has become the primary driver of economic growth. For example, in 2023, the contribution rate of final consumption expenditure to economic growth reached 82.5% [1]. However, structural challenges remain. Despite the large consumption scale, consumer confidence is still low—the average confidence index in 2024 was 87.6, below the critical threshold of 100 [2]. Moreover, service consumption accounted for only 46.1% of total household expenditure, considerably lower than the over 60% observed in developed countries [3]. Hence, promoting sustained consumption upgrading has become a vital pathway to expanding domestic demand and achieving high-quality economic development.
Household consumption upgrading encompasses both quantitative expansion and qualitative improvement, reflecting a shift from basic material consumption toward developmental and service-oriented patterns [4,5]. Although prior studies have examined economic, technological, and behavioral drivers of consumption upgrading, they have rarely considered the institutional dimension—especially the role of marketization. Based on transition economics theory, marketization refers to the extent to which market mechanisms, rather than administrative orders, determine the allocation of resources, goods, and services within an economy [6]. It embodies the transition from a state-controlled system to a market-driven one, characterized by competition, price flexibility, and institutional efficiency [7]. In China’s context, marketization is a gradual, path-dependent reform process that began with the 1978 “Reform and Opening-up.” It emphasizes the coexistence of government guidance and market forces, forming a “dual-track” transition system [8]. Unlike foreign transition studies that mainly emphasize economic liberalization, China’s marketization focuses more on building and improving its market system. Therefore, market-oriented reform involves a series of changes in economic, social, and legal systems, covering all aspects of the system [9]. Empirical studies suggest that higher levels of marketization promote human capital accumulation, enterprise innovation, and regional prosperity [10,11], though marketization may also widen regional disparities [12]. These mixed outcomes imply that the relationship between marketization and consumption upgrading is complex and regionally differentiated. Although from a theoretical perspective, marketization is crucial for the upgrading of residents’ consumption, there is little focus in the literature on effect of marketization on consumption upgrading, its spatial effect, and its mechanisms.
This study aims to fill this research gap by addressing the following questions: (1) Does marketization significantly promote household consumption upgrading in China? (2) Does marketization generate spatial spillover effects across regions? (3) Through what mechanisms—such as market competition and enterprise innovation—does marketization affect consumption upgrading? (4) Are there regional heterogeneities in this relationship?
Based on the aforementioned study, we utilize data from China’s provinces between 2010 and 2022, employ a Spatial Durbin Model (SDM) to evaluate the impact of marketization on residents’ consumption upgrades, and particularly focus on the mechanisms of market competition and enterprise innovation. Additionally, the study explored endogeneity, robustness, and heterogeneity analysis to ensure empirical reliability. This paper proceeds as follows: Section 2 presents the literature review. Section 3 proposes the research hypotheses via theoretical analysis. Section 4 describes the research model and data. Section 5 analyzes the spatial patterns. Section 6 reports the empirical results and analyses. Section 7 discusses the research results. Section 8 elaborates on the research conclusions, policy recommendations, and future prospects.
2. Literature Review
2.1. Influencing Factors of Consumption Upgrading
Empirical research on the driving factors of consumption upgrade is becoming increasingly extensive and profound. The focus of the study lies in systematically validating the impact of various key indicators, such as supply-side indicators [13] (technological innovation and cost optimization), demand-side indicators [14] (income and saving preferences), market environment indicators [15] (factor market allocation, infrastructure construction), and cultural psychological indicators [16] (consumption awareness, brand awareness). These diverse influencing factors often shape and drive (or inhibit) residents’ consumption upgrade through channels such as enterprise innovation and market competition, income growth and brand economy, human capital and digital economy, identity recognition, and consumption habits. Collectively, these studies have established a multidimensional framework for understanding consumption upgrading. However, most driving factors of consumption upgrade focus primarily on income, technology, and consumer behavior, while institutional drivers, such as marketization and the evolution of market mechanisms, have received comparatively limited attention.
2.2. The Economic Impact of Marketization
Market-oriented reform in China involves a series of changes in economic, social, and legal systems, covering all aspects of the system [9]. Fan Gang and his team’s China’s Provincial Marketization Index provides a comprehensive evaluation framework based on five institutional dimensions: government–market relations, development of the non-state economy, product marketization, factor market development, and intermediary organizations and legal environment [17]. It is frequently used in studies on regional differences, institutional changes, and economic growth, etc. A growing body of literature confirms that a higher level of marketization significantly enhances economic prosperity, innovation capacity, and market competitiveness. At the regional level, it promotes human capital accumulation and facilitates labor mobility, which are critical for regional economic prosperity [10]. At the enterprise level, marketization encourages digital transformation, technological innovation, and productivity growth, thus improving firm value [11]. Marketization leads to increased enterprise entry and competition, and reduces transaction costs [18]. Therefore, there is a close connection between marketization and the driving factors of consumption upgrading (such as market competition and corporate innovation), which thereby shapes the dynamic mechanism of residents’ consumer upgrade.
2.3. The Impact of Marketization on Consumption Upgrading
The existing literature indicates that marketization has two opposite forces. The first is a “promotive effect”. Market-oriented reforms may increase residents’ income, reduce transaction costs, enhance product diversity, and improve the consumption environment [19]. Some scholars have proposed that marketization plays a positive mediating role in the impact of financial market participation on residents’ well-being [20]. The existing literature has pointed out that a better market environment can promote the accumulation of human capital, drive regional economic prosperity, and improve consumption levels [10]. Empirical research has further confirmed that specific dimensions of marketization—such as land, housing, financial, and product markets—affect consumption upgrading in heterogeneous ways. For example, land marketization can generate social welfare benefits, whereas excessive government land planning may constrain consumption and welfare through distorted prices and resource misallocation [21]. The marketization of housing promotes wealth accumulation and investment capacity among urban households, indirectly stimulating consumption upgrading [22]. Similarly, financial marketization can stabilize consumption by regulating asymmetric housing price effects [23], while mortgage market imperfections reduce households’ future income expectations and suppress consumption expenditure [24]. The second is an “inhibitory effect”. The marketization process has significantly intensified the uneven development of regional economies [25]. Gao et al. [12] points out that marketization has almost no effective role to play in narrowing the gap between wealthy counties and poor counties. Moreover, Deng & He [26] found that the market-oriented process has both diffusion and convergence effects on the urban–rural income gap. Market integration exhibits a nonlinear (U-shaped) effect on consumption, suggesting that moderate market reforms initially suppress consumption but later enhance it as market efficiency improves [27]. Therefore, the existing findings indicate that the impact of marketization on consumption upgrading may be nonlinear and spatially heterogeneous.
In summary, although extensive research has examined the determinants of household consumption upgrading, most studies have primarily focused on income, technology, and consumer behavior, while institutional drivers—particularly marketization—remain underexplored. The existing literature on marketization and consumption has largely concentrated on single-dimensional aspects, such as land, housing, or financial marketization, and thus has overlooked the integrated effects of institutional improvement across multiple dimensions of the market system. Moreover, most studies have focused on direct economic outcomes, neglecting how marketization interacts with mechanisms such as market competition and enterprise innovation to influence consumption upgrading. In addition, there is a lack of research incorporating spatial perspectives to capture regional heterogeneity and spillover effects in the marketization–consumption nexus. Given the pronounced east–west disparities in both marketization and consumption upgrading in China, this omission limits the understanding of the broader institutional dynamics underlying spatially uneven development.
Based on the aforementioned study, we utilize data from China’s provinces between 2010 and 2022, and employ a two-way fixed-effects Spatial Durbin Model (SDM) to evaluate the direct effect and spatial spillover effect of marketization on residents’ consumption upgrades. It is crucial for this study to adopt the Spatial Durbin Model (SDM) because new economic geography points out that consumption upgrading and marketization are essentially spatial processes [28]. Market-oriented reforms in one province can influence neighboring regions through labor mobility, information spillovers, and demonstration effects. The Spatial Durbin Model is capable of capturing the spatial dependence of consumption upgrading and the spillover effects of marketization, thereby enabling the estimation of direct effects, indirect effects, and total effects between regions. We particularly focus on the mechanisms of market competition and enterprise innovation. Additionally, this study explored endogeneity, robustness, and heterogeneity analysis. The objective is to give policymakers who want to deepen market-oriented reforms to improve the quality of household consumption both a theoretical understanding and real-world applications.
By doing so, this study contributes to the literature in three ways. First, it provides an integrated institutional perspective on consumption upgrading, highlighting marketization as a key determinant of both consumption scale and structure. Second, in combination with the theories of institutional economics, consumer economics, and new economic geography, it constructs an integrated analytical framework linking marketization, market competition, enterprise innovation, and consumption upgrading, offering empirical evidence on the mediating mechanisms. Third, it enriches the spatial economics literature by visualizing the spatial distribution and clustering patterns and first examining the spatial effects and regional and economic elements’ heterogeneity of marketization on household consumption upgrading with the Spatial Durbin Model (SDM).
3. Theoretical Mechanisms and Research Hypotheses
3.1. Direct Effect of Marketization on Household Consumption Upgrading
From the perspective of direct effects, marketization promotes consumption upgrading primarily through two effects: income-enhancing and efficiency-enhancing effects [29,30]. These two effects are jointly transmitted through the five institutional dimensions of the marketization process: government–market relations, non-state economy, product and factor market development, intermediary organizations, and legal environment.
(1) Income-Enhancing Effects
Marketization simultaneously raises income levels, expands employment, and improves income distribution, thereby enhancing residents’ consumption capacity and scale. First, from the perspective of the government–market relationship, market-oriented reforms improve total factor productivity and economic growth, increasing household income and relaxing budget constraints. Higher income expands residents’ consumption capacity and strengthens the foundation for sustainable growth in domestic demand [31]. Second, from the perspective of the non-state-owned economy, in regions with higher marketization, private enterprises (POEs) outperform state-owned enterprises (SOEs) in efficiency and profitability, creating more employment opportunities and higher disposable income [30]. The expansion of the private sector drives industrial restructuring toward light industry and services, providing more high-value-added goods and improving overall consumption quality [32]. Last, from the perspective of factor market development, market-based allocation of labor factors increases wage flexibility and promotes human-capital-driven income growth. Labor migration enhances household welfare and narrows regional income gaps through remittance effects [33]. This not only raises aggregate consumption levels but also supports balanced regional development [34]. Through economic growth, job creation, and more equitable income distribution, marketization enhances household purchasing power, expands the scale of consumption, and strengthens the income foundation for further consumption upgrading.
(2) Efficiency-Enhancing Effects
Marketization improves total factor productivity and resource allocation efficiency, thereby optimizing the consumption environment and structure. First, under the government–market relationship dimension, market-oriented reforms streamline administrative functions, reduce price distortions, and enhance the responsiveness of local governments [31]. As more resources are allocated through market mechanisms, transaction costs fall and allocative efficiency improves. These institutional improvements enhance service consumption and promote the structural upgrading of household consumption [18]. Second, in product market development, a more open and competitive product market stimulates supply-side innovation. The rise of the digital and platform economy diversifies product supply and transaction modes, increases market transparency, and enhances consumer welfare [15]. By improving market efficiency and product quality, product marketization accelerates the shift from material-based to service- and experience-oriented consumption [35]. Third, within factor market development, reforms that liberalize capital and labor markets improve the allocation efficiency of production factors [36]. Capital mobility reduces credit constraints and enhances intertemporal consumption smoothing [37,38,39]. At the same time, skill-based migrants tend to have a higher proportion of service consumption, education, and leisure spending, promoting a shift in consumption structure towards an “enjoyment-oriented” model [34]. Finally, in intermediary and legal systems, a mature market intermediary system and sound legal protection reduce transaction risks, improve information transparency, and enhance consumer confidence [40]. Lower precautionary savings motives and stronger consumer trust stimulate long-term, service-oriented, and experiential consumption [41]. Through these four institutional dimensions, marketization enhances overall allocative efficiency, reduces institutional frictions, and fosters a more transparent and competitive market environment that supports structural upgrading of household consumption.
Based on these insights, this study proposes the following hypothesis:
Hypothesis 1.
Marketization enhances the efficiency of resource allocation and income levels, exerting a positive direct impact on household consumption upgrading.
3.2. Spatial Spillover Effect of Marketization on Household Consumption Upgrading
(1) Spatial Spillover Effect
It is worth emphasizing that the impact of marketization in promoting consumption upgrades is not isolated but comes with strong spillover effects [15]. The degree of marketization reshapes the economic ownership structure and improves resource allocation efficiency. A higher level of marketization reduces regional asset specificity, strengthens interregional trust, and facilitates the diffusion and spillover of knowledge and technology [42], and also enhances the spillover effect of the domestic value chain division network [43]. Marketization can promote orderly, standardized, and stable competition in the market, generating a demonstration effect, thereby encouraging more regions to participate in domestic value chain competition, which is conducive to breaking regional market segmentation, promoting the construction of a unified national market [44]. Last, it generates spillover effects through a complete cyclical process that enhances coordination between supply and demand, thereby promoting consumption upgrading in surrounding areas [45]. Therefore, the deepening of marketization in a certain region will drive up the marketization level and consumption upgrade process of surrounding areas or related industries through knowledge and technology diffusion, demonstration effects, industrial chain integration, and the construction of a unified large market, thus forming a virtuous cycle of coordinated development between regions and industries [46].
(2) Measurement Basis and Model Justification
In the early stage, most studies used only one or two indicators to measure the process of marketization [47]. To address this limitation, Fan et al. [17] developed a comprehensive evaluation system for marketization, compiling the China Provincial Marketization Index, which covers five institutional dimensions: government–market relations, development of the non-state economy, product markets, factor markets, and intermediary organizations and legal environment. This index has been widely adopted in numerous studies on China’s institutionalization and its spatial effect. For example, Li et al. [48] employed the China Provincial Marketization Index as an institutional environment variable to provides a historical perspective toward the understanding of the association between marketization and urban development in China. Ruan et al. [49] used Fan Gang and Wang Xiaolu’s provincial marketization index to classify China’s 31 provinces (autonomous regions and municipalities) by the degree of marketization and examined how regional institutional differences influence the relationship between outward foreign direct investment (OFDI) and employment effects. Pan et al. [50] referenced Fan Gang’s marketization “Financial Sector Marketization Index” as a proxy for financial marketization. Using the Spatial Durbin Model (SDM), the study found that the financial marketization of one province has a negative spatial spillover effect on the energy intensity of other provinces.
Regarding the measurement of consumption upgrading, previous studies have mostly relied on a single dimension, focusing either on consumption scale or structure. The scale dimension commonly includes indicators such as per capita consumption expenditure [51], per capita total retail sales of consumer goods [52], and consumption ratio [53]. The structure dimension often involves high-level consumption expenditure based on expenditure elasticity [54], share of high-end consumption expenditure [5], and the Engel coefficient [55]. To overcome the limitations of single-dimensional measurement, Chen et al. constructed a composite consumption upgrading index based on both scale and structure using the entropy-weight method, and applied the Spatial Durbin Model (SDM) to analyze the spatiotemporal pattern of the digital economy’s impact on household consumption upgrading in China [56]. Building upon Chen’s index framework, Luo et al. [57] examined the spatial effects of financial agglomeration on residents’ consumption upgrading by using the Spatial Durbin Model (SDM), verifying the index’s validity in capturing both the quantitative and qualitative aspects of consumption. Zhang & Hu [58] further incorporated consumption quality indicators (e.g., the share of service consumption and durable goods expenditure) into Chen’s framework and found that digital inclusive finance not only promotes consumption scale expansion but also significantly improves the quality of consumption structure, with pronounced spatial spillover effects, by using the Spatial Durbin Model (SDM).
These findings collectively confirm the scientific validity of the marketization index and entropy-based consumption upgrading index [56], as well as the applicability of the Spatial Durbin Model (SDM) in revealing spatial heterogeneity and interregional dependence in marketization and household consumption upgrading. Accordingly, this study adopts the provincial marketization index by Fan et al. [31] to measure marketization and the entropy-weighted composite index by Chen et al. [56] to assess consumption upgrading, and employs the Spatial Durbin Model SDM model to explore the spatial spillover effects of marketization on consumption upgrading across Chinese provinces. Direct effects will be tested via Spatial Durbin Model (SDM) baseline regression. Indirect effects will be tested through spatial decomposition of direct and indirect effects.
Based on these insights, this study proposes the following hypothesis:
Hypothesis 2.
Marketization has a positive spillover effect on household consumption upgrading.
3.3. Mechanism Effect of Market Competition
Market-oriented reforms promote consumer upgrading through market competition mechanisms. One of the core principles of market-oriented reform is to break monopolies and lower entry barriers, attracting diverse market players to participate in competition. As the degree of marketization deepens, the number of companies within an industry increases, and competitive dynamics become more intense [59].
Under competitive pressure, companies must continuously optimize their business strategies to win market share and consumer favor, such as through price competition and quality competition. In terms of price competition, competition forces businesses to strive to reduce costs, improve operational efficiency, and attract price-sensitive consumers with more competitive pricing strategies, effectively expanding consumption scale in the mid-to-low-end market, allowing more consumers to access basic goods and services [60,61]. In terms of quality competition, fierce market competition drives companies to shift from simple price competition to competition based on quality, service, brand, and differentiation [62]. Companies have a stronger motivation to segment the market, deeply explore the specific needs of different consumer groups, and continuously launch higher-quality products and services with better functions, more innovative designs, and better experiences to meet consumers’ increasingly diversified and high-end demands [63]. This supply-side optimization driven by competition directly enriches market choices, improves consumption quality, and significantly promotes the upgrading of consumption structure towards higher levels and more diversification [64].
From the perspective of corporate pricing ability and differentiation strategy, market competition is usually measured by the Lerner Index [65,66]. Given this, this article chooses the Lerner Index to measure market competition. An elevated Lerner Index reflects enhanced price-setting ability, increased monopolistic influence, and a diminished level of competitive intensity in the market. Existing studies often use the method of mediating effect testing [67] to verify the mechanism of the spatial effect of consumption upgrading [56,57]. Therefore, mechanism variables in this article will be tested via the mediation effect test method.
Based on these insights, this study proposes the following hypothesis:
Hypothesis 3.
Marketization promotes household consumption upgrading by reducing costs and improving product quality through market competition.
3.4. Mechanism Effect of Enterprise Innovation
Market-oriented reform promotes consumption upgrading through enterprise innovation mechanisms. By optimizing the external institutional environment for enterprises, the allocation of enterprise innovation resources, and reducing financing constraints, it further enhances enterprise innovation behavior.
First, improvement of the institutional environment under marketization encourages enterprises to increase investment in innovation activities [68]. Enhancing marketization can improve enterprises’ awareness of intellectual property protection, promote the transparency of the institutional environment, and reduce issues such as corruption. Ultimately, this has a direct positive impact on contract signing and market transaction costs, thereby enhancing enterprise innovation [69]. Market intermediary organizations can undertake some service functions. For example, industry associations can help enterprises smooth financing channels, expand the scope of market activities, and enhance protection of intellectual property rights. The intellectual property protection system not only protects enterprises’ R&D achievements but also stimulates enterprises to engage in continuous innovation, which helps build a good knowledge exchange mechanism [70]. Second, marketization can improve the distortions in the capital factor market, the insufficient supply and structural imbalance in the human factor market, as well as the unreasonable allocation of scientific and technological resources in the technology factor market among the key elements of enterprise innovation [71]. It further optimizes the allocation of enterprise innovation resources, improves internal management coordination capabilities, and provides strong support and assurance for improving the quality of enterprise innovation [72,73]. Third, marketization effectively alleviates corporate financing constraints, providing adequate financial support for enterprise innovation activities [74,75]. Non-state-owned economies find it difficult to obtain innovation and R&D funds under the direct intervention of local governments in bank credit resource allocation [76]. Marketization can reduce improper administrative interventions by the government, especially in enterprises and financial institutions, and enhance competition among financial institutions, particularly in the banking sector. This, in turn, increases the opportunities and amount of credit funding available to innovative small and medium-sized enterprises, alleviates financing constraints for non-state-owned economies, lowers borrowing costs, and effectively incentivizes corporate innovation [77].
Enterprise innovation promotes consumption upgrading through two main mechanisms [78]. On one hand, enterprise innovation increases the overall consumption scale though an “employment-creating effect” [46]. To adapt to the development of emerging technologies, enterprises carry out product R&D innovation. The demand for new products creates more employment opportunities, thereby increasing consumption income [74,79]. According to the life cycle hypothesis [80], high-income families tend to increase their consumption expenditure. On the other hand, enterprise innovation improves household consumption structure through “structural passive transition” [81]. It refers to the adjustments in consumption behavior made in response to prevailing modes of production and living in the economy determined by technological development [82]. As new technologies are increasingly integrated into production and new product development, high-quality and high–value-added goods emerge, gradually replacing inferior products in the market [83]. This leads to a shift toward branded and specialized consumption and provides consumers with more favorable and diversified choices [84]. As technology evolves, new consumer needs emerge [85]. For instance, smartphones like the iPhone have enabled mobile payments and the rise of livestream e-commerce; furthermore, recommendation algorithms have reshaped decision-making pathways, leading consumers to passively receive personalized and branded product suggestions, thereby driving passive upgrading in consumption patterns [86].
The existing literature often measures enterprise innovation by patent applications, patent approvals [87], number of times a patent is cited, total number of innovative and breakthrough patents, and originality and generality of patents [88]. Given the availability of data, the model selects the number of provincial patent applications as a proxy indicator for innovation performance [89]. Mechanism variables will be tested via mediating mechanism models. Based on these insights, this study proposes the following hypothesis:
Hypothesis 4.
Marketization promotes household consumption upgrading by fostering employment and consumption structural passive transition through enterprise innovation.
In summary, the impact and mechanism of marketization on household consumption upgrading can be deduced (see Figure 1).
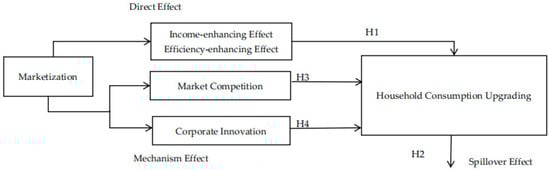
Figure 1.
Diagram of the impact and mechanism of marketization on household consumption upgrading.
4. Methodology and Data
4.1. Model Design
In order to investigate how marketization affects household consumption upgrading, this study selects a spatial econometric model that takes regional links and geographic reliance into account [90,91]. These models come in the following specific forms:
In the above equations denotes the dependent variable (household consumption upgrading); represents the core explanatory variable (marketization); represents a set of control variables; W signifies the spatial weight matrix. This study follows the approach of Wang et al. [92] and uses the economic geography nested spatial weight matrix to reflect the spatial characteristics of neighboring provinces as well as the degree of economic interdependence between provinces; i stands for provinces; t signifies years; C represents the constant term; captures individual (province-specific) effects; captures time-specific effects; denotes the stochastic disturbance term, while a, b, and c represent the coefficients to be estimated within the model framework.
4.2. Variable Selection
4.2.1. Explained Variable
Household Consumption Upgrading (Consup). This variable is measured using a composite index, drawing on the framework established by Chen et al. [56], which assesses consumption upgrading from both the scale and structure dimensions. Specifically, the framework has six indicators: per capita consumption expenditure [51], per capita total retail sales of consumer goods [52], consumption ratio [53], high-level consumption expenditure (identified based on expenditure elasticity) [54], share of high-end consumption expenditure [5], and the Engel coefficient [55]. Among them, the first three indicators are consumption scale indicators, and the last three indicators are consumption structure indicators. These variables are synthesized into a single index using the entropy-weighting method to reflect the overall level of household consumption upgrading.
4.2.2. Explanatory Variable
This article primarily selected the index provided in the “China’s Provincial Marketization Index Report (2021)” compiled by Wang et al. [9]. The index includes sub-indicators such as “development level of product markets”, “development level of factor markets”, “relationship between government and market”, “development of non-state-owned economy”, “development of market intermediary organizations and legal system environment”, among others, which encompass 23 basic indicators. Due to its broad coverage and long-term comparability, the index accurately assesses the long-term evolution of China’s marketization process across various provinces.
4.2.3. Control Variables
There are numerous factors influencing the level of resident consumption upgrading. If not properly controlled, these may lead to omitted variable bias. For this investigation, the following control variables were chosen: Research and development Intensity (R&D): Enterprise R&D activities improve production methods and product quality, serving as an important driver of consumption upgrading [93]. This is measured by the ratio of industrial businesses’ R&D spending to GDP. Financial Development (Fin): Access to credit expands residents’ investment channels and income sources, thereby promoting consumption upgrading [94]. This variable is expressed as the proportion of total deposits and loans to GDP. Level of Economic Development (lnPGDP): Greater economic development levels can promote consumption upgrading [56]. This is measured using the logarithm of per capita GDP. Urbanization (Urban): Urbanization enhances residents’ consumption capacity, changes consumption habits, and expands the scope of consumption, thereby facilitating consumption upgrading [95]. It is measured by the ratio of urban population to total population. Industrial upgrading (Industry): Changes in the industrial structure influence consumer utility and affect shifts in the consumption structure [64]. This statistic is represented as the proportion of tertiary industry output to secondary industry output. Social Security Level (Security): refers to the extent of social security benefits, which help residents shift their consumption structure from food expenditure to development-oriented or enjoyment-oriented consumption upgrades [96], measured by the proportion of social security and employment expenditures in the general budget. Fiscal Support Intensity (Fis): refers to the effective promotion of low-income individuals’ consumption structure upgrades through fiscal support [97], measured by the ratio of general budget expenditures to regional total value. The level of Informatization (Inf): Improving the level of informatization enhances regional economic efficiency and subsequently promotes consumer upgrades [98], measured by the ratio of postal and telecommunications business volume to gross regional product. The Level of Transportation Infrastructure (Transport): The construction of transportation infrastructure can effectively enhance the consumption appeal of various regions to residents from other areas [99], measured by the logarithm of the total freight volume (in ten thousand tons). Human Capital (Hu-capital): Improvements in human capital contribute to income growth and stimulate higher-level consumption such as cultural and knowledge-based consumption. This in turn shifts the consumption structure toward more elastic goods and services [100]. The ratio of college students to 10,000 persons is used to measure this. Financial Agglomeration (Agglo): The concentration of financial resources improves consumption structure by optimizing financing services and reducing transaction costs, especially in education, culture, and health [57]. It is measured by dividing the ratio of regional financial industry added value to regional GDP by the ratio of national financial industry added value to national GDP. House Price (House): The appreciation of housing assets significantly expands consumption scale through the “wealth effect” and structurally drives an increase in higher-level consumption needs [101]. This is measured by the logarithm of the average sales price of commercial properties.
4.2.4. Mechanism Variables
Following the approach of Peress [102], market competition is measured by the Lerner Index’s negative in this study. Specifically, the Lerner Index is calculated as:
Referring to the methodology of Xu & Yuan [89], enterprise innovation is measured by the total number of patent applications at the provincial level. Generally, variables should be log-transformed before regression analysis [103]. However, for count variables, taking logarithms may introduce estimation bias [87]. Therefore, in this study, the enterprise innovation variable is not log-transformed in the regression analysis.
Descriptive statistics for the relevant variables are presented in Table 1. It can be seen that there are significant differences in the level of consumption upgrade among residents in various regions of our country, with the highest value being 0.829 and the lowest value being 0.108. The highest value of the marketization index is 1.286, while the lowest value is 0.336. There are also significant differences in the control variables across different regions. Variance Inflation Factor (VIF) test was conducted on each variable. The test results showed that the VIF values of all variables were less than 10, indicating that there is no multicollinearity problem.

Table 1.
Descriptive statistics of variables.
4.3. Sample Construction and Data Sources
We compile a balanced provincial panel covering 30 mainland provinces over 2010–2022, resulting in 390 province–year observations, because 2010 marks the formal inclusion of “promoting consumption upgrading” in the national strategy, while 2022 represents the latest year with complete data. Tibet, Hong Kong, Macao, and Taiwan are excluded because continuous series for the core variables are unavailable or statistically incomparable over the study window. We harmonize provincial identifiers across sources, ensure consistent statistical calibers, and retain only provinces with full-period coverage to avoid interpolation. All nominal monetary variables are deflated to constant prices using the provincial CPI. The final balanced panel (N = 390) guarantees that identification in the Spatial Durbin Model is not confounded by missingness patterns. Marketization-related data are sourced from “China’s Provincial Marketization Index Report (2021)”. Other relevant data mainly come from “China Statistical Yearbook”, “China Population and Employment Statistical Yearbook”, “provincial statistical yearbooks”, “China Social and Economic Big Data Research Platform”, and “China Research Data Service Platform”.
5. The Spatial Patterns of Household Consumption Upgrading and Marketization
To visualize the spatial pattern characteristics of consumption upgrade levels among Chinese residents, this paper uses ArcGIS 10.8 software and applies the Natural Breaks classification method to draw the spatial distribution of consumption upgrade levels for the years 2010, 2017, and 2022 (Figure 2). In addition to selecting the first and last years, this paper also selects 2017 as a sample for spatial pattern analysis. The reason is that 2017 was a structural inflection point for consumption upgrading. In 2017, the National Development and Reform Commission first organized the compilation of the “Report on China’s Resident Consumption Development”, which pointed out that in 2017, China’s residents’ Engel coefficient was 29.3%, entering for the first time the affluent range of 20–30% as defined by the United Nations [104]. China had entered an important stage where consumer demand continued to grow, the consumption structure upgraded rapidly, and the role of consumption in driving economic growth became significantly stronger. By comparing the spatial distribution and evolution from 2010 to 2017 and 2022, it can be observed that there is a clear regional differentiation and hierarchical distribution characteristic in the consumption upgrade levels of Chinese residents.
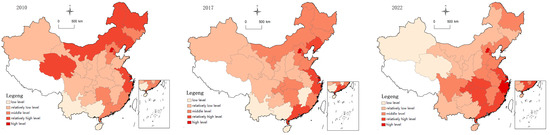
Figure 2.
Spatial difference characteristics and pattern of household consumption upgrading. Note: This figure is made based on the standard map of the Standard Map Service System of the Ministry of Natural Resources of the People’s Republic of China (Map Review number: GS (2020) 4630).
Overall, there are significant regional differences in the consumption upgrade levels, with the eastern region having an absolute advantage, while the central and western regions remain at relatively lower levels. High-value areas of consumption upgrade levels are mainly concentrated in developed eastern regions such as such as Shanghai, Beijing, Zhejiang, Jiangsu, etc., whereas low-value areas are primarily found in less-developed central and western regions including Gansu, Guizhou, Shaanxi, Yunnan, Guangxi, Shanxi, Ningxia, Qinghai, and Xinjiang. The possible reasons for this phenomenon are that the economic development level in the eastern region is higher, resulting in relatively higher actual incomes for residents, while the economic development in the central and western regions is relatively lagging, leading to lower actual incomes for residents. This results in a significant difference in the consumption upgrade levels between eastern provinces and central and western provinces, indicating that high-value and low-value areas exhibit a clear agglomeration distribution pattern, further verifying the existence of spatial spillover effects in consumption upgrades.
To explore the spatial correlation between marketization and residents’ consumption upgrade levels in our country, this paper calculates the global Moran’s Index of marketization and residents’ consumption upgrade levels from 2010 to 2022, as shown in Table 2. It can be seen that the Moran’s Index is significantly positive, indicating that marketization and residents’ consumption upgrade levels generally exhibit a geographical agglomeration spatial pattern, and there is a positive spatial spillover effect between them.
Table 2.
Moran’s I for household consumption upgrading and marketization.
By comparing the spatial distribution and evolution of marketization levels in 2010, 2017, and 2022 (Figure 3), it can be observed that high-value areas of marketization mainly concentrate in eastern regions such as Beijing, Tianjin, Guangdong, Zhejiang, and Jiangsu, while lower marketization levels are primarily found in central and western regions including Xinjiang, Qinghai, Shanxi, Gansu, Ningxia, Guizhou, and Shaanxi, showing significant spatial differences and clustering characteristics.
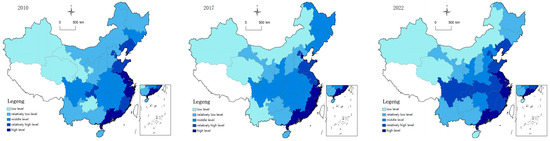
Figure 3.
Spatial difference characteristics and pattern of marketization. Note: This figure is made based on the standard map of the Standard Map Service System of the Ministry of Natural Resources of the People’s Republic of China (Map Review number: GS (2020) 4630).
6. Results
6.1. Baseline Regression Results of the Spatial Econometric Model
6.1.1. Selection Test Results of Spatial Econometric Model
Based on the results of Moran’s I test and spatial distribution maps, there is a significant spatial correlation between marketization and the level of residents’ consumption upgrade. Ignoring spatial correlation factors, traditional econometric models may have specification errors. Therefore, it is necessary to set up spatial econometric models.
According to Elhorst [91], the LM and robust LM tests are the first diagnostic tools to detect spatial dependence in econometric models. As shown in Table 3, both the LM–spatial lag (96.108, p = 0.000) and LM–spatial error (38.314, p = 0.000) tests are significant, indicating that spatial correlation exists in both the dependent and error terms. Moreover, the robust LM–spatial lag test remains significant (p < 0.001), while the robust LM–spatial error test becomes insignificant (p = 0.703), suggesting that the spatial lag model (SAR) is more appropriate than the spatial error model (SEM).
Table 3.
Selection test results of spatial econometric model.
However, further Wald and Likelihood Ratio (LR) tests are conducted to determine whether the Spatial Durbin Model (SDM) can be simplified to SAR or SEM. The Wald–lag (82.960, p = 0.000) and Wald–error (103.41, p = 0.000) statistics, together with the LR–lag (78.670, p = 0.000) and LR–error (98.950, p = 0.000) results, all reject the null hypothesis that the SDM can be reduced to either the SAR or SEM specification. This indicates that both the spatial lag of the dependent variable and the spatial lag of the explanatory variables jointly affect the dependent variable, supporting the use of the SDM.
Finally, the Hausman test (χ2 = 63.570, p = 0.000) rejects the random-effects model, suggesting that a two-way fixed-effects SDM should be adopted as the benchmark model. This specification accounts for both spatial dependence and unobserved heterogeneity across provinces and over time, ensuring consistent and unbiased estimation results [105,106].
Therefore, based on these diagnostic tests, this study employs the Spatial Durbin Model with two-way fixed effects as the baseline model to examine the spatial impact of marketization on residents’ consumption upgrading.
6.1.2. Baseline Regression Results of SDM
Table 4 shows the regression results of marketization’s impact on the upgrading level of residents’ consumption. The results indicate that the regression coefficient for marketization is 0.053, which has passed the 5% significance test, indicating that improved market mechanisms effectively enhance local residents’ consumption upgrading by stimulating income growth, optimizing resource allocation, and expanding access to diverse goods and services, thus validating Hypothesis 1. Additionally, the spatial lag term coefficient for marketization is 0.213, which has passed the 10% significance test, suggesting a positive spatial spillover effect: higher marketization in one province also promotes consumption upgrading in neighboring regions through cross-regional competition, innovation diffusion, and labor mobility.
Table 4.
Baseline regression results of SDM.
6.1.3. Decomposition Results of Spatial Effects
Due to feedback effects, the coefficients estimated by the SDM model cannot directly represent the marginal influence of explanatory variables on dependent variables. Following LeSage and Pace [105], this study decomposes the effects of marketization into direct, indirect, and total effects. As shown in Table 5, all three effects are significantly positive, suggesting that marketization not only enhances local residents’ consumption upgrading but also generates positive spillovers to surrounding regions. Economically, this implies that improvements in market mechanisms stimulate household consumption through income growth and efficiency improvement, while interregional linkages amplify these benefits beyond administrative boundaries, thus validating Hypothesis 2.
Table 5.
Decomposition results of spatial effects.
Among the control variables, R&D intensity, social security, fiscal support, and transportation infrastructure show significantly positive direct and indirect effects, indicating that innovation investment, social welfare expansion, government support, and improved connectivity not only stimulate local consumption upgrading but also generate positive spillovers to neighboring provinces. Industrial upgrading exerts a significant local effect but no cross-regional influence, implying that structural transformation mainly enhances within-province consumption through higher productivity and product diversity. In contrast, urbanization shows weak local but negative spatial effects, suggesting that excessive population concentration in core cities may crowd out surrounding regions’ consumption capacity by raising living costs and resource competition.
6.2. Endogeneity Test and 2SLS Estimations
While marketization influences residents’ consumption upgrading, it may also be affected in return by rising consumption levels. This suggests the potential for a reverse causal relationship between the two—that is, an endogeneity problem may exist.
To address this issue, and following the approach proposed by Frésard [107], this study uses the one-period lag of marketization as an instrumental variable. To further validate the robustness of the instrumental variable strategy, this study examines both its relevance and exogeneity following established econometric criteria [108,109]. The lagged one-period marketization index is expected to be highly correlated with the current level of marketization, as institutional reforms and market-oriented policies generally evolve gradually over time, ensuring strong relevance. Meanwhile, it is unlikely to be directly correlated with the contemporaneous error term of the consumption upgrading equation, since present consumption behavior cannot affect past institutional conditions, thus satisfying the exogeneity requirement [110].
As a result, a two-stage least squares (2SLS) regression is carried out, and Table 6’s column (1) shows the results of the first-stage regression of 2SLS indicate that the instrumental variable is significantly correlated with marketization, which shows that the instrumental variable meets the relevance requirement. In addition, standard diagnostic tests confirm the validity of the instrumental variable. The first-stage F-statistic is 338.04, far exceeding the conventional threshold of 10 [111], which rules out weak instrument bias. The Kleibergen–Paap LM statistic and Cragg–Donald Wald F-statistic both indicate the rejection of the null hypothesis of instrument under-identification at the 1% level. The results passed the under-identification test and the weak instrument variable test, proving the validity of the instrumental variable selection [112].
Table 6.
Results of endogeneity test.
Table 6’s column (2) displays the regression results of the instrumental variable in the second stage. The coefficient of marketization remains significantly positive (0.071) after controlling for endogeneity, indicating that the key conclusion—that marketization promotes household consumption upgrading—remains robust and reliable.
Finally, this paper tests the exclusivity of the instrumental variables. If the instrumental variables selected in the paper meet the exclusivity requirement, it indicates that the instrumental variables affect consumer upgrading only through their impact on marketization, rather than through their influence on factors such as industry competition, industrial agglomeration, employee wage levels, and market segmentation. Following the approach of Jiang et al. [5], this paper tests whether the instrumental variables have a significant impact on industry competition, industrial agglomeration, employee wage levels, and market segmentation based on provincial-level data. The estimation results in Supplementary Materials show that the instrumental variables have no significant impact on the above variables. Therefore, the instrumental variables satisfy the exclusivity feature.
6.3. Robustness Test
The preliminary results from the aforementioned benchmark regression have given us positive feedback. We then conducted a series of tests to provide more reliable and robust results.
6.3.1. Replace the Explanatory Variable
To avoid measurement errors or inaccuracies in the definition of existing indicators when measuring consumption upgrade, the measurement indicators for the dependent variable will be redefined. Further referencing the research by Shi et al. [4], the original sub-indicator of the share of high-end consumption, which is measured by the proportion of consumption expenditure after excluding food, clothing, and housing categories [113], has been replaced by the proportion of household spending on development and enjoyment-type consumption including equipment services, healthcare, transportation and communication, and education and entertainment [114]. The data still come from the National Bureau of Statistics database, and the new consumption upgrade index is generated using the entropy-weight method. If the core results remain largely unchanged, it indicates that the conclusions are not very sensitive to measurement errors in the original variables, making the results more credible. As shown in column (1) of Table 7, the coefficient representing the impact of marketization on residents’ consumption upgrade is consistent with the benchmark regression results in terms of sign, direction, and statistical significance, although its magnitude varies. These results support the robustness of the conclusion.
Table 7.
Results of robustness test.
6.3.2. Replace Geography Spatial Weight Matrix
The spatial weight matrix is a core element of spatial econometric models, and different spatial weight matrices may produce different estimation results [115]. Therefore, we use a geography distance-based spatial weight matrix to replace the economic geography nested spatial weight matrix to verify the robustness of the model. If the core results remain largely unchanged, it indicates that the core conclusions are universal across different spatial scales or dimensions of association, making the results more credible. The robustness test results shown in column (2) of Table 7 reveal that the direction of marketization, estimated coefficients, and significance are similar to those of the original SDM model. Consequently, after replacing the spatial weight matrix, there is no significant change in the estimation results of the main variables, suggesting that these estimates are reliable.
6.3.3. Replace Spatial Weight Matrix and Explanatory Variable
In the robustness test of the spatial weight matrix in the previous section, we found that the main conclusions did not change substantially. To further enhance the reliability of the research results, this paper simultaneously replaces both the spatial weight matrix and the explained variable on this basis to comprehensively test the robustness of the model estimation results. Specifically, we use a geographic distance spatial weight matrix to replace the original economic geography nested spatial weight matrix, and change the explained variable to an alternative indicator. The regression results in column (3) of Table 7 show that the estimated coefficient direction, value size, and significance level of the core variables remain highly consistent with the benchmark SDM model. Compared with the robustness test results of only replacing the spatial weight matrix, this further robustness test indicates that even under double adjustment conditions, the core conclusions of this paper still hold firmly. This not only verifies the stability of the research conclusions but also further demonstrates their strong applicability under different spatial association dimensions and indicator choices, thereby significantly enhancing the credibility of the empirical results.
6.3.4. Replace the Database
To avoid systematic bias in measurements dependent on specific databases, the database source for the dependent variable will be redefined. Further referencing the study by Yin & Guo [54], the data sources for the dependent variable will be replaced with the China Household Finance Survey (CHFS) database. The resident consumption upgrade index of the CHFS database uses the logarithm of high-quality expenditure as a measure. If the core results remain largely unchanged, it indicates that the conclusions are insensitive to the measurement methods of variables and data quality, making the results more credible. As shown in column (4) of Table 7, the coefficient representing the impact of marketization on residents’ consumer upgrading shows consistency in sign, direction, and statistical significance with the benchmark regression results, although its magnitude varies. These results support the robustness of the conclusion.
6.3.5. Replace Economic Spatial Weight Matrix
The economic weight matrix captures interregional linkages based on similarities in per capita GDP and industrial structure, emphasizing economic correlation rather than geographic proximity [105]. To verify robustness, we replace the geographic nested spatial weight matrix with an economic weight matrix reflecting regional economic relevance. The results in column (5) of Table 7 show that both the direct and indirect (spillover) effects of marketization remain significantly positive, suggesting that market-oriented reforms not only stimulate local consumption upgrading but also promote spillovers through economic linkages such as factor flows and industrial connections. Hence, the core findings are consistent with the benchmark results, indicating that the effect of marketization on household consumption upgrading is robust across different spatial dependence structures.
6.3.6. Remove Outliers
To minimize the potential bias caused by extreme observations, this chapter excludes sample provinces whose consumption upgrading levels fall above the 99th percentile or below the 1st percentile. The corresponding results are reported in column (6) of Table 7. The estimation results remain highly consistent with the baseline regression: both the direct effect and the spatial spillover effect coefficients of marketization are significantly positive. This indicates that the positive influence of marketization on household consumption upgrading is not driven by statistical outliers or data extremes, thereby reinforcing the robustness and reliability of the main conclusions.
6.4. Heterogeneity Analysis
Consumption expenditures of different groups exhibit distinct behavioral characteristics. We further examined whether the benchmark regression results vary due to factors such as region, industrial upgrading, financial agglomeration, and housing price. This paper categorizes the sample into two sub-samples based on the classification standards of China’s National Bureau of Statistics: eastern regions including Beijing, Tianjin, Hebei, Shanghai, Jiangsu, Zhejiang, Fujian, Shandong, Guangdong, and Hainan; and central and western regions including Shanxi, Anhui, Jiangxi, Henan, Hubei, Hunan, Inner Mongolia, Guangxi, Chongqing, Sichuan, Guizhou, Yunnan, Shaanxi, Gansu, Qinghai, Ningxia, Xinjiang, Liaoning, Jilin, and Heilongjiang. Additionally, the sample is divided into high and low sub-samples based on the median levels of industrial upgrading, financial agglomeration, and housing price. Using the Spatial Durbin Model (SDM) we conducted heterogeneity tests on the impact of marketization on household consumption upgrading within these four types of sub-samples.
Table 8’s columns (1) and (2) show the regression results for different regions. Clearly, marketization has a significantly positive effect on both local and neighboring residents’ consumption upgrading in the eastern region, reflecting the region’s stronger institutional environment, openness, and innovation capacity that facilitate income growth and cross-regional spillovers. In contrast, the effect in central and western regions is insignificant locally but positive for neighboring provinces, implying that market-oriented reforms in developed provinces may radiate benefits through demonstration and trade linkages rather than internal consumption capacity.
Table 8.
Heterogeneity analysis (SDM model).
Table 8’s columns (3) and (4) show the regression results of different levels of industrial upgrading. Marketization significantly promotes consumption upgrading in provinces with advanced industrial transformation, both locally and spatially, as industrial upgrading enhances productivity, product sophistication, and consumer diversity. However, the effect is insignificant in regions with lagging industrial structures, suggesting weaker innovation diffusion and limited market responsiveness.
Table 8’s columns (5) and (6) show the regression results of different levels of financial agglomeration. Both local and spillover effects are significant in areas with dense financial resources, indicating that developed financial systems expand credit access and reduce liquidity constraints, fostering higher-value and service-oriented consumption. In less agglomerated areas, these effects vanish due to financial segmentation and weak transmission channels.
Table 8’s columns (7) and (8) show the regression results of different levels of housing price. Clearly, marketization significantly promotes local consumption upgrading but exerts limited spillovers, reflecting a moderate wealth effect that boosts consumption within provinces but not across them. Conversely, in low-price regions, positive spillovers dominate, possibly because housing affordability and resource mobility enable broader spatial diffusion of market-driven consumption.
6.5. Mechanism Analysis
Considering the theoretical analysis that came before, the influence of marketization on residents’ consumption upgrading may be realized through two primary mechanisms: enhancing market competition and promoting enterprise innovation. To test these mechanisms, this study conducts mechanism effect analyses using market competition and enterprise innovation as mechanism variables. Table 9 and Table 10 shows the findings.
Table 9.
Result of mechanism test by market competition.
Table 10.
Result of mechanism test by enterprise innovation.
Marketization greatly encourages residents’ upgrading of their consumption and market competition, as seen by Table 9’s columns (1) and (2). Both the market competition and marketization coefficients in column (3) are noticeably positive, and the coefficient of marketization is smaller than that in column (1), indicating the presence of a mechanism effect. This indicates that market-oriented reforms intensify market competition, which in turn stimulates consumption upgrading by improving product variety, service quality, and price efficiency.
Similarly, Table 10’s columns (1) and (2) demonstrate that marketization significantly promotes both residents’ consumption upgrading and enterprise innovation. The marketization and enterprise innovation coefficients are both statistically positive in column (3), and the enterprise innovation coefficient is smaller than the one in column (1), showing a mechanism effect once more. This suggests that marketization drives firms to optimize resource allocation, strengthen technological R&D, and introduce innovative products and services, which expand consumption choices and shift demand toward high-value and experience-based goods.
Therefore, the mechanism regression results validate both Hypothesis 3 and Hypothesis 4 proposed in this study.
7. Discussion
There are many indicators and measurement methods for consumption upgrading, but previous studies have mostly measured consumption upgrading using a single indicator, focusing only on the aspects of consumption structure or consumption scale. Meanwhile, Fan Gang’s marketization index [31] has been widely used by economists, but it has mostly focused on the spatial effect research of a single marketization factor [50]. Compared with previous studies, this study strengthens the applicability of Chen Jian’s consumption upgrading indicators [56] and Fan Gang’s marketization index [31] under the theory of new economic geography, providing empirical evidence for subsequent research on the application of indicators for the spatial effects of marketization and consumption upgrading.
In addition, the existing literature has mostly focused on the impact of marketization on economic growth or income distribution [10,11], with less direct exploration of its spatial effects on household consumption upgrading. This paper employs a Spatial Durbin Model (SDM) to not only capture the direct impact of marketization on consumption upgrading in the local area but also further uses the partial differential method proposed by LeSage and Pace [105] to decompose the influence of explanatory variables on the dependent variable into direct effects, indirect effects, and total effects. It is found that marketization significantly promotes household consumption upgrading and generates positive spillover effects, verifying Hypothesis 1 and 2 of this paper. This conclusion is consistent with the research findings of Yu et al. [29] and Chen et al. [30]. This conclusion confirms the necessity of implementing the strategy to expand domestic demand. However, more econometric models should be developed to test the dynamic spatial effects between variables.
Mechanism analysis verifies Hypotheses 3 and 4, which indicates that market competition and enterprise innovation are key transmission channels through which marketization promotes consumption upgrading. This conclusion aligns with the institutional economics literature, which suggests that competition helps improve resource allocation efficiency [60], while innovation can expand consumption diversity [72]. It can provide reference for the formulation of relevant policies.
This study investigates the heterogeneous effects of marketization on household consumption upgrading, considering regional, industrial, financial, and housing market differences. The results show that the positive effect of marketization is more pronounced in eastern provinces and in regions with advanced industrial upgrading, stronger financial agglomeration, and higher housing prices. This indicates that the impact of market-oriented reforms on consumption upgrading has obvious regional and economic elements differences. In eastern China, higher openness, infrastructure, and institutional quality allow marketization to stimulate consumption through higher income, competition, and innovation spillovers. Industrial upgrading enhances employment quality and income elasticity, boosting consumption capacity. Financial agglomeration improves access to credit and investment channels, promoting high-value and service-oriented spending. Rising housing prices also generate a moderate wealth effect that supports consumption upgrading, though excessive speculation may crowd out productive consumption. The heterogeneity analysis of this paper mainly focuses on regional, and economic elements, without considering emerging dimensions such as digitalization and green transformation. In the future, indicators such as digital infrastructure, green finance, and social equity can be incorporated into the framework.
8. Conclusions
8.1. Research Conclusions
This paper is based on panel data from 30 provinces in China from 2010 to 2022. It constructs an integrated analytical framework that links marketization, market competition, corporate innovation, and consumption upgrading, in combination with theories of institutional economics, consumer economics, and new economic geography. It uses spatial autocorrelation analysis, the Spatial Durbin Model, and the mechanism effect test to explore the direct, spatial impact and mechanism and heterogeneity analyses of marketization on household consumption upgrading, thereby expanding the research boundaries of institutional economics, consumer economics, and spatial economics. The main conclusions drawn are as follows:
First, the spatial pattern characteristics indicate that there is a significant spatial difference in the level of consumption upgrade and marketization, with higher levels in the east and lower levels in central and western regions. At the same time, both have clear agglomeration features in spatial distribution.
Second, the Spatial Dubin Model analysis shows marketization has a significantly positive direct impact on household consumption upgrading, indicating marketization that enhances the efficiency of resource allocation and income levels has significantly promoted the upgrading of consumption among local residents.
Third, the spatial decomposition of Spatial Dubin Model (SDM) analysis shows that marketization has a positive spillover effect on the consumption upgrade level of surrounding areas.
Fourth, the results of the mechanism effect test indicate that marketization mainly enhances residents’ consumption upgrade by promoting market competition and encouraging corporate innovation.
Last, heterogeneity analysis also indicates that the effect of marketization on consumption upgrading is more pronounced in eastern regions, areas with high levels of industrial upgrading, high levels of financial agglomeration, and high housing prices.
8.2. Policy Recommendations
Based on the above research findings, four policy recommendations are proposed:
Promote differentiated regional marketization reforms to narrow spatial disparities in consumption upgrading. The east–west gap in consumption upgrading highlights the need for region-specific reforms. Eastern regions should deepen institutional reform and foster innovation-driven consumer markets, while central and western regions should reduce institutional barriers and improve business environments to boost household consumption potential.
Enhance and capitalize on marketization spillovers to promote balanced regional consumption upgrading. Strengthen interregional linkages in infrastructure, industry, and finance to facilitate the diffusion of innovation and institutional efficiency. Improving fiscal coordination and financial integration can help channel the benefits of marketization spillovers to less-developed regions, fostering more balanced and inclusive consumption upgrading.
Foster competitive and innovative business environments to sustain high-quality consumption upgrading. Marketization promotes consumption upgrading mainly by enhancing competition and stimulating innovation. Policymakers should build a fair and transparent market environment by enforcing anti-monopoly rules and protecting intellectual property rights to strengthen firms’ innovation incentives and sustain diversified, high-quality consumption growth.
Strengthen industrial upgrading and financial agglomeration to reinforce the impact of marketization on consumption upgrading. Focus on aligning industrial upgrading with market-oriented reform and fostering the spatial concentration and coordination of financial institutions. By enhancing capital allocation efficiency, supporting regional financial centers, and improving the interaction between finance and industry, financial agglomeration can amplify the role of marketization in promoting high-quality consumption upgrading.
8.3. Future Prospects
Future research can introduce new variables such as digital transformation, first-mover economy, and green finance into this framework to more comprehensively reveal the dynamic evolution characteristics of marketization and consumption upgrading. Meanwhile, dynamic spatial econometric models [116,117] can be adopted to examine the time-series effects and feedback mechanisms between the two, thereby gaining a deeper understanding of their long-term interactive relationship. Additionally, by combining micro-level household or enterprise data, research can explore how market-oriented reforms influence consumption upgrading through behavioral mechanisms, providing stronger theoretical and empirical support for promoting digital, cultural, and sustainable consumption upgrading.
Supplementary Materials
The following supporting information can be downloaded at: https://www.mdpi.com/article/10.3390/su17219373/s1, Table S1: Exogeneity Test of Instrumental Variables.
Author Contributions
Conceptualization, M.Z. (Meiqi Zhao); Methodology, M.Z. (Mengxia Zhang); Writing—original draft, M.Z. (Meiqi Zhao); Writing—review and editing, M.Z. (Mengxia Zhang). All authors have read and agreed to the published version of the manuscript.
Funding
This research was funded by the National Social Science Foundation of China (Grant No. 23&ZD078).
Institutional Review Board Statement
Not applicable.
Informed Consent Statement
Not applicable.
Data Availability Statement
The original contributions presented in this study are included in the article/Supplementary Materials. Further inquiries can be directed to the corresponding author.
Acknowledgments
The authors are grateful to the editors and the anonymous referees for their constructive and thorough comments, which contributed to the improvement of this study.
Conflicts of Interest
The authors declare no conflicts of interest.
References
- National Bureau of Statistics of China. Last Year, Final Consumption Expenditure Contributed 82.5% to Economic Growth. Available online: https://www.gov.cn/lianbo/bumen/202401/content_6927456.htm (accessed on 11 October 2025).
- Trading Economics. Available online: https://zh.tradingeconomics.com/china/consumer-confidence (accessed on 11 October 2025).
- Minister Wang Wentao Publishes an Article in ‘Qiushi’: Take Multiple Measures to Expand Service Consumption. Available online: https://www.mofcom.gov.cn/syxwfb/art/2025/art_289bbccd6d40402a84fb0696174ce428.html (accessed on 11 October 2025).
- Shi, M.; Jiang, Z.; Zhou, X. Is It Consumption Upgrading or Consumption Downgrading? China Ind. Econ. 2019, 42–60. [Google Scholar] [CrossRef]
- Jiang, L.; Chen, H.; Lu, Y.; Zhang, G. Consumption Structure Upgrading and Export Product Quality Improving. J. Quant. Technol. Econ. 2024, 41, 5–26. [Google Scholar] [CrossRef]
- Hsieh, C.T.; Klenow, P.J. Misallocation and manufacturing TFP in China and India. Q. J. Econ. 2009, 124, 1403–1448. [Google Scholar] [CrossRef]
- North, D.C. Institutions, Institutional Change and Economic Performance; Cambridge University Press: Cambridge, UK, 1990. [Google Scholar]
- Wang, X. Sustainability of China’s Economic Growth and Institutional Change. Econ. Res. J. 2000, 7, 3–15+79. [Google Scholar]
- Wang, X.; Hu, L.; Fan, G. China’s Provincial Marketization Index Report; Social Science Literature: Beijing, China, 2021. [Google Scholar]
- Yu, M.; Deng, X. The Inheritance of Marketization Level and Regional Human Capital Accumulation: Evidence from China. Financ. Res. Lett. 2021, 43, 102268. [Google Scholar] [CrossRef]
- Zhang, Z.; Liu, C. Marketization level, digital transformation, and corporate value. Financ. Res. Lett. 2025, 84, 107779. [Google Scholar] [CrossRef]
- Gao, J.; Liu, Y.; Chen, J.; Cai, Y. Demystifying the geography of income inequality in rural China: A transitional framework. J. Rural Stud. 2022, 93, 398–407. [Google Scholar] [CrossRef]
- Sun, Z.; Xu, X. Industrial Innovation and Consumption Upgrade: An Empirical Study from the Perspective of Supply-Side Structural Reform. China Ind. Econ. 2018, 7, 98–116. [Google Scholar] [CrossRef]
- Zhang, D.Y.; Guo, R. The consumption response to household leverage in China: The role of investment at household level. Int. Rev. Financ. Anal. 2020, 71, 101580. [Google Scholar] [CrossRef]
- Zhou, Q. Does the digital economy promote the consumption structure upgrading of urban residents? Evidence from Chinese cities. Struct. Change Econ. Dyn. 2024, 69, 543–551. [Google Scholar] [CrossRef]
- Tong, M.Q. Customers’ craft beer repurchase intention: The mediating role of customer satisfaction. Int. J. FOOD Prop. 2022, 25, 845–856. [Google Scholar] [CrossRef]
- Fan, G.; Wang, X.; Ma, G. The contribution of China’s market-oriented reform process to economic growth. Econ. Res. J. 2011, 46, 4–16. [Google Scholar]
- Ngok, K.; Zhu, G. Marketization, globalization and administrative reform in China: A zigzag road to a promising future. Int. Rev. Adm. Sci. 2007, 73, 217–233. [Google Scholar] [CrossRef]
- Fu, C.; Luo, D.; Zhang, J.; Li, W. Tax incentives, marketization level, and corporate digital transformation. Int. Rev. Econ. Financ. 2025, 97, 103777. [Google Scholar] [CrossRef]
- Liu, D.; Zhao, L.; Yi, H. Financial market participation, household asset choices, and resident well-being: An empirical analysis of China family panel studies data. Financ. Res. Lett. 2024, 67, 105885. [Google Scholar] [CrossRef]
- He, Y.; Wu, M.; Jiang, H. Land supply marketization, economic fluctuations and welfare: A quantitative analysis for China. Int. J. Strateg. Prop. Manag. 2024, 28, 152–162. [Google Scholar] [CrossRef]
- Wang, Y.; Li, Y.; Huang, Y.; Yi, C.; Ren, J. Housing wealth inequality in China: An urban-rural comparison. Cities 2020, 96, 102428. [Google Scholar] [CrossRef]
- Hui, E.C.M.; Dong, Z.; Jia, S. Housing Price, Consumption, and Financial Market: Evidence from Urban Household Data in China. J. Urban Plan. Dev. 2018, 144, 06018001. [Google Scholar] [CrossRef]
- Gerardi, K.S.; Rosen, H.S.; Willen, P.S. The Impact of Deregulation and Financial Innovation on Consumers: The Case of the Mortgage Market. J. Financ. 2010, 65, 333–360. [Google Scholar] [CrossRef]
- Sun, X.; Li, M.; Wang, Y. Market-oriented Process and Regional Economic Development Gap. J. Quant. Technol. Econ. 2015, 32, 39–55. [Google Scholar] [CrossRef]
- Deng, Q.; He, A. Government-led Initiatives, Marketization Process, and Urban-Rural Income Gap. J. Agrotech. Econ. 2018, 44–56. [Google Scholar] [CrossRef]
- Qin, S.; Zhang, Y. Market integration and consumer spending. Appl. Econ. Lett. 2025, 32, 103–109. [Google Scholar] [CrossRef]
- Fujita, M.; Mori, T. Frontiers of the New Economic Geography*. Pap. Reg. Sci. 2005, 84, 377–405. [Google Scholar] [CrossRef]
- Yu, J.; Shi, X.; Cheong, T.S. Distribution dynamics of China’s household consumption upgrading. Struct. Change Econ. Dyn. 2021, 58, 193–203. [Google Scholar] [CrossRef]
- Chen, T.; Lu, H.; Chen, R.; Wu, L. The Impact of Marketization on Sustainable Economic Growth—Evidence from West China. Sustainability 2021, 13, 3745. [Google Scholar] [CrossRef]
- Fan, G.; Ma, G.; Wang, X. Institutional reform and economic growth of China: 40-year progress toward marketization. Acta Oeconomica 2019, 69, 7–20. [Google Scholar] [CrossRef]
- Heinrich, T.; Yang, J.; Dai, S. Levels of structural change. J. Evol. Econ. 2022, 32, 35–86. [Google Scholar] [CrossRef]
- Pan, X.; Sun, C. Internal migration, remittances and economic development. J. Int. Econ. 2024, 147, 103845. [Google Scholar] [CrossRef]
- Zhou, C.; Li, M.; Zhang, G.; Wang, Y.; Liu, S. Heterogeneity of Internal Migrant Household Consumption in Host Cities: A Comparison of Skilled Migrants and Labor Migrants in China. Sustainability 2020, 12, 7650. [Google Scholar] [CrossRef]
- Chen, X.J.; Li, L.; Ling, X.P. Research on Driving Factors of Digital Innovation in the Tourism Industry. Sage Open 2024, 14, 21582440241304537. [Google Scholar] [CrossRef]
- Brandt, L.; Tombe, T.; Zhu, X. Factor market distortions across time, space and sectors in China. Rev. Econ. Dyn. 2013, 16, 39–58. [Google Scholar] [CrossRef]
- Holm, M.B. Consumption with liquidity constraints: An analytical characterization. Econ. Lett. 2018, 167, 40–42. [Google Scholar] [CrossRef]
- Saxena, V.; Bindal, I.; LeMay-Boucher, P. Social groups and credit shocks: Evidence of inequalities in consumption smoothing. Econ. Anal. Policy 2020, 68, 311–326. [Google Scholar] [CrossRef]
- Wang, Z.; Zhang, D.; Wang, J. How does digital finance impact the leverage of Chinese households? Appl. Econ. Lett. 2022, 29, 555–558. [Google Scholar] [CrossRef]
- Bothello, J.; Mehrpouya, A. Between regulatory field structuring and organizational roles: Intermediation in the field of sustainable urban development. Regul. Gov. 2019, 13, 177–196. [Google Scholar] [CrossRef]
- Galego, D.; Esposito, G.; Crutzen, N. Sustainable urban development: A scoping review of barriers to the public policy and administration. Public Policy Adm. 2024, 09520767241266410. [Google Scholar] [CrossRef]
- Isaksson, O.H.D.; Simeth, M.; Seifert, R.W. Knowledge spillovers in the supply chain: Evidence from the high tech sectors. Res. Policy 2016, 45, 699–706. [Google Scholar] [CrossRef]
- Zhang, J.; Liu, Z. Institutional Constraints, Global Value Chain Embedding and Upgrading of Local Industrial Clusters in China. Contemp. Financ. Econ. 2008, 84–91. [Google Scholar]
- Su, D.; Sheng, B.; Shao, C. Spillover Effects of Domestic Value Chains, Marketization Degree and Economic Growth. J. World Econ. 2019, 42, 143–168. [Google Scholar] [CrossRef]
- Jinm, X.; Ru, Y.; Wu, H. Institutions, Enterprise Production Efficiency, and China’s Regional Export Differences. J. Manag. World 2008, 11, 65–77. [Google Scholar] [CrossRef]
- Guo, D.; Li, L.; Qiao, L.; Qi, F. Digital economy and consumption upgrading: Scale effect or structure effect? Econ. Change Restruct. 2023, 56, 4713–4744. [Google Scholar] [CrossRef]
- Fujita, M.; Hu, D. Regional disparity in China 1985–1994: The effects of globalization and economic liberalization. Ann. Reg. Sci. 2001, 35, 3–37. [Google Scholar] [CrossRef]
- Li, R.; Ma, Z.; Chen, X. Historical market genes, marketization and economic growth in China. Econ. Model. 2020, 86, 327–333. [Google Scholar] [CrossRef]
- Ruan, Z.; Liu, W.; Na, S.; Tan, X.; Xue, T. Regional Marketization, OFDI, and Sustainable Employment: Empirical Analysis in China. Sustainability 2019, 11, 4101. [Google Scholar] [CrossRef]
- Pan, J.; Lv, K.; Yu, S.; Fu, D. What Mechanisms Do Financial Marketization and China’s Fiscal Decentralization Have on Regional Energy Intensity? Evidence Based on Spatial Spillover and Panel Threshold Effects Perspectives. Int. J. Environ. Res. Public Health 2022, 19, 5759. [Google Scholar] [CrossRef]
- Sun, J.; Li, C. Research on the Upgrading Path of Consumption Combining Demand-Side and Supply-Side. J. Renmin Univ. China 2022, 36, 52–62. [Google Scholar]
- Huang, M.; Dou, X. How does the development of the digital economy release residents’ consumption potential? J. Shanghai Univ. Financ. Econ. 2024, 26, 79–93. [Google Scholar] [CrossRef]
- Qi, H.L.; Liu, Y. Population Age Structure Changes and Household Consumption Upgrade of Residents: An Empirical Study Based on CFPS Data. China Popul. Resour. Environ. 2020, 30, 174–184. [Google Scholar]
- Yin, Z.; Guo, P. Assessment of the effects of targeted poverty alleviation policies: An empirical study from the perspective of household consumption. J. Manag. World 2021, 37, 64–83. [Google Scholar] [CrossRef]
- Sun, H.; Gui, H.; He, W. Consumer Upgrade, Carbon Emissions, and the Achievement of China’s Carbon Peak Target. J. Financ. Econ. 2025, 51, 79–93. [Google Scholar] [CrossRef]
- Chen, J.; Zou, H.; Zhang, J. The Impact of the Digital Economy on the Spatiotemporal Pattern of Consumption Upgrade among Chinese Residents. Econ. Geogr. 2022, 42, 129–137. [Google Scholar] [CrossRef]
- Luo, Y.; Tang, Q.; Li, Q. The spatial effect of financial agglomeration on residents’ consumption upgrade. Econ. Geogr. 2023, 43, 31–38. [Google Scholar] [CrossRef]
- Zhang, Z.; Hu, W. The Impact of Digital Inclusive Finance on China’s Household Consumption Upgrade: Theoretical Mechanism and Empirical Facts. Econ. Probl. 2025, 38–47. [Google Scholar] [CrossRef]
- Hou, X.; Li, C.; Wang, Q. The role of financial institution marketization in China’s industrial contestability. Singap. Econ. Rev. 2016, 63, 1245–1261. [Google Scholar] [CrossRef]
- Qi, L.; Yang, L.; Ta, M. The impact of digital economy on regional resource allocation efficiency: An analysis based on resource flow speed and direction. Financ. Res. Lett. 2025, 82, 107644. [Google Scholar] [CrossRef]
- Taylor, C.; Wagman, L. Consumer privacy in oligopolistic markets: Winners, losers, and welfare. Int. J. Ind. Organ. 2014, 34, 80–84. [Google Scholar] [CrossRef]
- Amiti, M.; Khandelwal, A.K. Import Competition and Quality Upgrading. Rev. Econ. Stat. 2013, 95, 476–490. [Google Scholar] [CrossRef]
- Liu, W.; Atuahene-Gima, K. Enhancing product innovation performance in a dysfunctional competitive environment: The roles of competitive strategies and market-based assets. Ind. Mark. Manag. 2018, 73, 7–20. [Google Scholar] [CrossRef]
- Wang, Y.; Li, L. Digital economy, industrial structure upgrading, and residents’ consumption: Empirical evidence from prefecture-level cities in China. Int. Rev. Econ. Financ. 2024, 92, 1045–1058. [Google Scholar] [CrossRef]
- Shaffer, S.; Spierdijk, L. Measuring multi-product banks’ market power using the Lerner index. J. Bank. Financ. 2020, 117, 105859. [Google Scholar] [CrossRef]
- Zhang, Q.; Yang, H.J.; Wang, Q.; Zhang, A.M.; Zhang, Y.H. Impact of high-speed rail on market concentration and Lerner index in China’s airline market. J. AIR Transp. Manag. 2020, 83, 101755. [Google Scholar] [CrossRef]
- Wen, Z.; Zhang, L.; Hou, J. The Procedure and Application of Mediation Effect Testing. Acta Psychol. Sin. 2004, 614–620. [Google Scholar]
- He, J.; Wu, H. Marketization Process, Technological Diversification, and Corporate Innovation Performance. Econ. Surv. 2025, 42, 106–119. [Google Scholar] [CrossRef]
- Zeng, W.; Li, L.; Huang, Y. Industrial collaborative agglomeration, marketization, and green innovation: Evidence from China’s provincial panel data. J. Clean. Prod. 2021, 279, 123598. [Google Scholar] [CrossRef]
- Yang, J.; Zhang, P. Can Joining Industry Associations Promote Corporate Technological Innovation?—Micro Evidence from Chinese Private Enterprises. Bus. Manag. J. 2020, 42, 59–75. [Google Scholar] [CrossRef]
- Arora, A.; Cohen, W.M.; Walsh, J.P. The acquisition and commercialization of invention in American manufacturing: Incidence and impact. Res. Policy 2016, 45, 1113–1128. [Google Scholar] [CrossRef]
- Xu, N.; Xu, L.; Yan, X.-W. Data factor marketization empowering enterprise innovation quality: New evidence from Chinese patent citations. Int. Rev. Econ. Financ. 2025, 103, 104433. [Google Scholar] [CrossRef]
- He, B.; Chen, H.; Li, Z.; Zhou, X. Information and communication technology and innovation performance of firms: Evidence from Chinese listed state-owned enterprises. Int. Rev. Econ. Financ. 2023, 88, 47–59. [Google Scholar] [CrossRef]
- Li, C.M.; Wang, Y.L.; Zhou, Z.H.; Wang, Z.Y.; Mardani, A. Digital finance and enterprise financing constraints: Structural characteristics and mechanism identification. J. Bus. Res. 2023, 165, 114074. [Google Scholar] [CrossRef]
- Xu, G.Y.; Li, G.G.; Sun, P.B.; Peng, D. Inefficient investment and digital transformation: What is the role of financing constraints? Financ. Res. Lett. 2023, 51, 103429. [Google Scholar] [CrossRef]
- Wang, J.; Luo, L.; Guo, Q. Does local government intervention harm the efficiency of credit allocation? J. Financ. Res. 2015, 99–114. [Google Scholar]
- Chava, S.; Oettl, A.; Subramanian, A.; Subramanian, K.V. Banking deregulation and innovation. J. Financ. Econ. 2013, 109, 759–774. [Google Scholar] [CrossRef]
- Zhou, X.; Cai, Z.; Tan, K.H.; Zhang, L.; Du, J.; Song, M. Technological innovation and structural change for economic development in China as an emerging market. Technol. Forecast. Soc. Change 2021, 167, 120671. [Google Scholar] [CrossRef]
- Xu, Q.; Zhong, M. The impact of income inequity on energy consumption: The moderating role of digitalization. J. Environ. Manag. 2023, 325, 116464. [Google Scholar] [CrossRef] [PubMed]
- Ahn, S.C.; Kim, H.Y.; Kang, T.H. Life-cycle consumption, precautionary saving, and risk sharing: An integrated analysis using household panel data. BE J. Macroecon. 2017, 17, 20160082. [Google Scholar] [CrossRef]
- Babina, T.; Fedyk, A.; He, A.; Hodson, J. Artificial intelligence, firm growth, and product innovation. J. Financ. Econ. 2024, 151, 103745. [Google Scholar] [CrossRef]
- Schultz, C.D.; Kumar, H. ARvolution: Decoding consumer motivation and value dimensions in augmented reality. J. Retail. Consum. Serv. 2024, 78, 103701. [Google Scholar] [CrossRef]
- Laukkanen, T.; Xi, N.; Hallikainen, H.; Ruusunen, N.; Hamari, J. Virtual technologies in supporting sustainable consumption: From a single-sensory stimulus to a multi-sensory experience. Int. J. Inf. Manag. 2022, 63, 102455. [Google Scholar] [CrossRef]
- Ye, X.; Yue, P. What matters to reshaping consumption patterns in China? Digital inclusion and supply chain. Financ. Res. Lett. 2024, 59, 104804. [Google Scholar] [CrossRef]
- Zhang, Y.; Luo, X.; Shao, B.; Benitez, J. Technology-driven mandatory customer participation: A new recovery strategy to promote customers’ online post-recovery satisfaction. Eur. J. Inf. Syst. 2024, 33, 315–333. [Google Scholar] [CrossRef]
- Aw, E.C.-X.; Tan, G.W.-H.; Cham, T.-H.; Raman, R.; Ooi, K.-B. Alexa, what’s on my shopping list? Transforming customer experience with digital voice assistants. Technol. Forecast. Soc. Change 2022, 180, 121711. [Google Scholar] [CrossRef]
- Funk, R.J. Making the most of where you are: Geography, networks, and innovation in organizations. Acad. Manag. J. 2014, 57, 193–222. [Google Scholar] [CrossRef]
- Hsu, P.-H.; Tian, X.; Xu, Y. Financial development and innovation: Cross-country evidence. J. Financ. Econ. 2014, 112, 116–135. [Google Scholar] [CrossRef]
- Xu, X.; Yuan, K. Industrial Structure, Fnancial Development, and Provincial Innovation Performance. Res. Manag. 2016, 37, 53–60. [Google Scholar] [CrossRef]
- Anselin, L. Thirty years of spatial econometrics. Pap. Reg. Sci. 2010, 89, 3–26. [Google Scholar] [CrossRef]
- Elhorst, J.P. Specification and estimation of spatial panel data models. Int. Reg. Sci. Rev. 2003, 26, 244–268. [Google Scholar] [CrossRef]
- Wang, Z.; Ma, D.; Zhang, J.; Wang, Y.; Sun, D. Does urbanization have spatial spillover effect on poverty reduction: Empirical evidence from rural China. Econ. Res. -Ekon. Istraživanja 2023, 36, 2167730. [Google Scholar] [CrossRef]
- Boeing, P.; Eberle, J.; Howell, A. The impact of China’s R&D subsidies on R&D investment, technological upgrading and economic growth. Technol. Forecast. Soc. Change 2022, 174, 121212. [Google Scholar] [CrossRef]
- Hu, D.; Zhai, C.; Zhao, S. Does digital finance promote household consumption upgrading? An analysis based on data from the China family panel studies. Econ. Model. 2023, 125, 106377. [Google Scholar] [CrossRef]
- Le, X.; Shao, X.; Gao, K. The Relationship between Urbanization and Consumption Upgrading of Rural Residents under the Sustainable Development: An Empirical Study Based on Mediation Effect and Threshold Effect. Sustainability 2023, 15, 8426. [Google Scholar] [CrossRef]
- Wang, L.; Hu, Q. The effect of urban–rural health insurance integration on consumption of middle-aged and older adult households in rural areas: Evidence from China. Front. Public Health 2023, 11, 1260571. [Google Scholar] [CrossRef]
- Zhang, Y.; Ma, G.; Tian, Y.; Dong, Q. Nonlinear Effect of Digital Economy on Urban–Rural Consumption Gap: Evidence from a Dynamic Panel Threshold Analysis. Sustainability 2023, 15, 6880. [Google Scholar] [CrossRef]
- Huang, X.L.; Li, G.P.; Liu, J.G. The Impact of Spatial Structure on Economic Efficiency of Beijing-Tianjin-Hebei Megalopolis in China. Complexity 2020, 2020, 6038270. [Google Scholar] [CrossRef]
- Hao, F.; Yang, D.; Lou, Y. Rural roads and consumption: Empirical evidence from China. Appl. Econ. Lett. 2025, 32, 2055–2059. [Google Scholar] [CrossRef]
- Aina, C.; Sonedda, D. Sooner or later? The impact of child education on household consumption. Empir. Econ. 2022, 63, 2071–2099. [Google Scholar] [CrossRef]
- He, Z.; Ye, J.; Shi, X. Housing wealth and household consumption in urban China. Urban Stud. 2019, 57, 1714–1732. [Google Scholar] [CrossRef]
- Peress, J. Product market competition, insider trading, and stock market efficiency. J. Financ. 2010, 65, 1–43. [Google Scholar] [CrossRef]
- Chen, Q. Advanced Econometrics and Applications with Stata; Higher Education Press: Beijing, China, 2014. [Google Scholar]
- The National Development and Reform Commission Officially Released the “2017 China Residents’ Consumption Development Report”. Available online: https://www.ndrc.gov.cn/xwdt/xwfb/201803/t20180330_954229_ext.html (accessed on 11 October 2025).
- LeSage, J.; Pace, R.K. Introduction to Spatial Econometrics; Chapman and Hall/CRC: Boca Raton, FL, USA, 2009. [Google Scholar]
- Elhorst, J. Spatial Econometrics: From Cross-Sectional Data to Spatial Panels; Springer: Berlin/Heidelberg, Germany, 2014. [Google Scholar]
- Frésard, L. Financial strength and product market behavior: The real effects of corporate cash holdings. J. Financ. 2010, 65, 1097–1122. [Google Scholar] [CrossRef]
- Semykina, A.; Wooldridge, J.M. Estimating panel data models in the presence of endogeneity and selection. J. Econom. 2010, 157, 375–380. [Google Scholar] [CrossRef]
- Baum, C.F.; Schaffer, M.E.; Stillman, S. Enhanced routines for instrumental variables/generalized method of moments estimation and testing. Stata J. 2007, 7, 465–506. [Google Scholar] [CrossRef]
- Zhang, F.; Yin, X.; Ding, S. Market-oriented Reform and Enterprise Innovation: An Explanation Based on Institutional Transaction Costs. J. Shanxi Univ. Financ. Econ. 2021, 43, 32–46. [Google Scholar] [CrossRef]
- Stock, J.; Yogo, M. Asymptotic distributions of instrumental variables statistics with many instruments. Identif. Inference Econom. Models Essays Honor. Thomas Rothenberg 2005, 6, 109–120. [Google Scholar]
- Kleibergen, F.; Paap, R. Generalized reduced rank tests using the singular value decomposition. J. Econom. 2006, 133, 97–126. [Google Scholar] [CrossRef]
- Hong, J.; Liu, X. Has the promotion of domestic large-scale circulation advanced common prosperity?—Empirical evidence from the China Family Panel Studies. J. Financ. Econ. 2025, 51, 35–49. [Google Scholar] [CrossRef]
- Li, G.; Li, H.; Peng, D. The Impact of Mobile Internet Use on Rural Household Consumption: Micro Evidence from a Two-Dimensional Perspective of Structure and Diversity. Chin. J. Popul. Sci. 2023, 37, 114–128. [Google Scholar]
- Yang, S.; Chen, Z.; Umar, M.; Khursheed, A. Environmental regulation and high-quality sustainable development of China’s economy—An empirical study based on a spatial durbin model and threshold model. Econ. Res. Ekon. Istraživanja 2022, 35, 5699–5718. [Google Scholar] [CrossRef]
- Elhorst, J.P. Dynamic spatial panels: Models, methods, and inferences. J. Geogr. Syst. 2012, 14, 5–28. [Google Scholar] [CrossRef]
- Yu, J.; de Jong, R.; Lee, L.-F. Quasi-maximum likelihood estimators for spatial dynamic panel data with fixed effects when both n and T are large. J. Econom. 2008, 146, 118–134. [Google Scholar] [CrossRef]


Disclaimer/Publisher’s Note: The statements, opinions and data contained in all publications are solely those of the individual author(s) and contributor(s) and not of MDPI and/or the editor(s). MDPI and/or the editor(s) disclaim responsibility for any injury to people or property resulting from any ideas, methods, instructions or products referred to in the content. |
© 2025 by the authors. Licensee MDPI, Basel, Switzerland. This article is an open access article distributed under the terms and conditions of the Creative Commons Attribution (CC BY) license (https://creativecommons.org/licenses/by/4.0/).