Article

Characterizing the Evolution of Multi-Scale Communities in Urban Road Networks

School of Transportation Engineering, Chang’an University, Xi’an 710064, China
*
Author to whom correspondence should be addressed.
Sustainability 2025, 17(20), 9355; https://doi.org/10.3390/su17209355
Submission received: 19 September 2025 / Revised: 18 October 2025 / Accepted: 19 October 2025 / Published: 21 October 2025

Abstract

The growing abundance of traffic data offers new opportunities to uncover dynamic traffic patterns in urban road networks, providing valuable insights for promoting sustainable mobility. By leveraging these data, road segments can be grouped into communities to capture the spatiotemporal correlations driving the dynamic evolution of traffic states. However, existing distance-based methods lack the capacity to facilitate multi-scale analysis of urban traffic patterns and are limited in capturing the heterogeneity of road regions. To address this gap, in this study, we introduce a traffic-data-driven approach to detect road segment communities and extract multi-scale traffic patterns. Here, traffic data are mapped onto a dual graph of urban road networks, with node correlations weighted using Dynamic Time Warping (DTW). A hierarchical community detection algorithm is then applied to identify multi-scale communities, revealing the spatiotemporal structure of urban traffic dynamics. The robustness and effectiveness of the proposed method were tested on the road network of Chengdu. The results show that the method successfully integrates the topological structure with traffic data, capturing multi-scale spatial autocorrelation communities. By characterizing the evolution of traffic patterns, our method has potential applications in traffic prediction, traffic control, and urban planning applications, contributing to sustainable urban transportation through congestion mitigation and efficiency enhancement.

1. Introduction

The dynamic evolution of traffic patterns in urban road networks results in complex interactions between road segments [1,2]. Analyzing the spatiotemporal relationships between road segments by leveraging massive traffic data can provide valuable insights for traffic prediction, traffic control, and urban planning [3,4,5,6,7,8,9], thereby facilitating sustainable urban transportation development through congestion alleviation and efficiency improvements. However, given the large scale and structural complexity of urban road networks, a key challenge in understanding their dynamics lies in identifying appropriate groups of road segments that can effectively capture their underlying interaction characteristics [10].
Currently, studies on urban traffic patterns commonly group road segments based on spatial distance, feature clustering, or community detection. The dominant approach involves partitioning urban areas into grids according to geographical Euclidean distance, thereby assigning traffic data with geographic coordinates to distinct spatial units for pattern analysis [11]. Owais et al. conducted research on a public transportation system network using square and irregularly shaped traffic analysis zones (TAZs) and proposed a framework for the optimal design of metro lines [12,13]. To achieve more uniform adjacency relationships and isotropy, many studies have further adopted hexagonal partitions in place of quadrilateral grids [14,15]. In response to the uneven distribution of road networks, Min and Wynter [16] simulated traffic flow correlations based on topological distance, leading to improvements in traffic prediction. Similarly, Wang et al. [17] utilized topological distance to define neighboring roads, which enhanced the accuracy of travel time estimates. However, due to the inherent heterogeneity of urban traffic, geographically adjacent roads may exhibit different traffic behaviors, while spatially distant segments can show strong correlations. Consequently, methods that solely rely on distance metrics are insufficient to capture the full complexity of urban traffic patterns [18].
Building upon distance-based partitioning, feature clustering-based models can be used to further analyze correlations within traffic data to more effectively group road segments with similar traffic patterns [19]. Nagy and Horváth [20] partitioned their study area into a grid network and mapped traffic flow data to identify spatially contiguous regions of homogeneous traffic behavior using spectral clustering. Gao and Liao [21] first identified core urban areas using point of interest (POI) data and then clustered slow-moving regions based on congestion metrics. Yang et al. [22] applied the K-means algorithm to group highly correlated road segments. Leveraging the Macroscopic Fundamental Diagram (MFD), Chen et al. [23] employed an improved genetic algorithm to merge correlated partitions and refine cluster boundaries. A common characteristic of these feature clustering methods is their reliance on predefined distance-based spatial partitions for traffic data analysis. However, the connectivity between adjacent partitions often varies, and different partitioning strategies can substantially affect clustering quality, resulting in unstable and inconsistent outcomes.
Community detection is a well-established technique used to partition network nodes into distinct groups, where connections within communities are dense and connections between them are sparse [24,25]. Unlike clustering-based models, community detection algorithms can simultaneously capture both topological structure and traffic state features by incorporating traffic data as edge weights. The Louvain algorithm [26], an efficient bottom-up approach, has been widely used to identify large-scale communities of roads based on speed data or origin–destination (OD) data [27,28]. To reveal more granular community structures, Petri et al. [29] applied the Partition Decoupling Method (PDM) [30] to hierarchically partition communities across two levels and then optimized the results using modularity Q [31]. However, the Louvain algorithm exhibits stochasticity, which can lead to inconsistent community detection results across multiple runs, further limiting the reliability and interpretability of the detected communities. Moreover, although modularity Q is a widely used metric, it may be less discriminative than the map equation in directed networks [32]. Recently, deep learning-based approaches have been increasingly applied for graph clustering and community detection. The graph neural network (GNN), graph convolutional network (GCN), and graph attention network (GAT) have all demonstrated strong capabilities in learning node embeddings and achieved advanced results in tasks such as node classification and connection prediction [33,34,35]. Yang et al. [36] integrated a GCN with fuzzy clustering, enabling the authors to effectively capture the fuzzy membership of nodes to multiple communities. He et al. [37] integrated a GNN with gated recurrent units (GRUs) to identify geographical units suitable for urban functional zone analysis. However, research on detecting communities in urban road networks remains relatively limited.
Although existing studies have employed diverse methods to partition urban road networks, three major limitations persist in effectively characterizing traffic patterns. (a) Firstly, spatial divisions relying solely on distance often overlook the intrinsic characteristics of traffic data, potentially merging adjacent roads with heterogeneous features and thus reducing the accuracy of road segment clustering. (b) Secondly, while community detection algorithms can identify groups of highly correlated road segments, the inherent stochasticity of these algorithms continues to undermine the stability and reproducibility of the results. (c) Finally, current research focuses either on small-scale road networks or macroscopic large-scale features, yet it fails to provide a comprehensive multi-scale characterization of traffic patterns across urban road systems.
In this study, we propose the use of a data-driven community detection approach to address the aforementioned challenges by extracting multi-scale communities of road segments and revealing the evolution of traffic patterns in urban road networks. The proposed method begins by representing the urban road network as a dual graph, where nodes correspond to road segments and edges represent topological adjacency. Traffic data are then mapped to each node based on spatial overlap relationships. Using the average speed sequences of each road segment, a correlation weight matrix is computed using Dynamic Time Warping (DTW) [38]. This weighted dual graph serves as the input to the Infomap algorithm [39], which detects a hierarchical multi-scale community structure. By effectively integrating spatial topology with dynamic traffic information, our approach identifies spatiotemporally correlated groups of road segments while maintaining high robustness. In particular, this method employs a random walk-based community detection algorithm to hierarchically aggregate road segments, thereby capturing traffic flow characteristics more effectively. The robustness of the detected communities can then be evaluated using the Adjusted Rand Index (ARI) and Mutual Information (MI). Previous research has indicated significant differences in the daytime distribution of road traffic flow between public holidays and working days, with markedly lower traffic volumes observed on public holidays compared to those on working days [40]. Therefore, in this study, we conducted experiments using a real urban road network and a complete week of traffic data encompassing five working days and two holidays. The results demonstrate that the proposed method can successfully identify distinct traffic patterns on weekdays and holidays, achieving improvements in spatial auto-correlation compared with the results of distance-based methods.
The remainder of this study is organized as follows: Section 2 presents the traffic-data-driven modeling of the urban road network and describes the multi-scale community detection method. Section 3 presents the experimental results based on real traffic data to evaluate the robustness and effectiveness of the proposed approach, and also provides a discussion of our findings. Finally, Section 4 concludes this study and outlines potential directions for future research.

2. Data and Methodology

An overview of the proposed method is presented in Figure 1. Firstly, urban road network data are used to construct a graph representation consisting of nodes and edges. Subsequently, the traffic data are matched to the corresponding road segments, and DTW is applied to calculate the similarity of the data across each road segment within a specified time period, thereby generating a road segment correlation weight matrix. Finally, a hierarchical community detection algorithm is employed to identify multi-scale community structures in the weighted dual graph of the urban road network.

2.1. Study Area and Data

The traffic data for the main roads in Chengdu, including motorways, trunk roads, primary roads, secondary roads, and selected branch roads, were obtained via the web service API of AutoNavi Maps. Due to the limited availability of traffic data in the suburban areas of Chengdu, this study focuses on analyzing the central urban area within Chengdu’s Third Ring Road (Figure 2) to construct a sufficiently complete road network that effectively represents the main characteristics of urban traffic activities.
In this study, data were collected over a total of 168 time periods from 26 May 2025 to 1 June 2025, covering five working days and two weekend holidays. The collected dataset is indexed by unique road segment numbers, recording road name, polyline coordinates, congestion status, average speed, and time period information. The polyline coordinate field defines the spatial extent of the corresponding road segment using a set of coordinate points. Notably, due to variations in available data and traffic states, the sets of road segments recorded across different time periods are not fully aligned. The congestion status field contains four levels, ranging from 0 to 3, which represent insufficient data, free-flow traffic, slow-moving traffic, and congested traffic, respectively. The average speed field reflects the mean speed of vehicles traveling on the road segment during the specified time period.

2.2. Traffic-Data-Driven Urban Road Network Modeling

2.2.1. Dual-Graph Representation of Urban Road Networks

In related research on complex networks and transportation systems, road networks are commonly represented using graphs consisting of nodes and edges. By mapping intersections to nodes and road segments to edges, the road network depicted in Figure 3a can be represented as the primal graph shown in Figure 3b. The primal graph effectively captures the connectivity between intersections but retains limitations in terms of modeling interactions among multiple pairs of adjacent road segments. The dual graph maps road segments to nodes and intersections to multiple edges (Figure 3c), thereby providing a more accurate representation of the connectivity between road segments. Therefore, this study adopts a dual graph approach to model the urban road network, treating road segments divided by intersections or interchanges at both ends as nodes and establishing edges between each pair of topologically connected road segments. The weight of each edge is determined by the similarities in traffic data between the corresponding road segment pairs.

2.2.2. Data Matching of Road Segments

As the set of road segments in the dataset dynamically varies across different time periods, it is necessary to match the traffic data to the road segment nodes in the dual graph based on their spatial extent. The correspondence between the original road segments from the traffic data and the model road segments is illustrated in Figure 4, revealing four distinct spatial overlap patterns.
To quantify the strength of the correspondence between the original traffic data road segments and the model road segments for the purpose of matching traffic data, the overlap coefficient O i j is defined as follows:
O i j = i j i i j j = i j 2 i j
where i and j denote the lengths of road segments i and j , and i j denotes the length of the overlapping portion between road segments i and j . The value range of O i j is between 0 and 1. A value of 0 indicates that the two road segments have no overlapping relationship, whereas a value of 1 indicates that the two road segments are completely equivalent. Formally, O i j is equivalent to the square of the Ochiai coefficient.
Based on overlap coefficient O i j , the traffic data can be mapped to road segment nodes in the dual graph representation of the urban road network. The average speed data of road segment node i can be represented as the time series set V i :
V i = v i 1 , v i 2 , , v i t
v i t = j R t O i j v j t j R t O i j
where v i t denotes the average speed of road segment i in time period t . R t denotes the set of all road segments included in the original dataset in time period t , and v j t represents the speed data of road segment j at time t within R t .

2.2.3. Dynamic Time Warping Weighting

Dynamic Time Warping (DTW) is an algorithm designed to measure similarities between time series data. In contrast to the conventional Pearson correlation coefficient, DTW is robust against temporal shifts and capable of aligning sequences of different lengths, making it more effective at capturing nonlinear shape similarities in the data. Given that the collected dataset contains a small number of missing values and may exhibit phase difference characteristics, this study employs DTW to quantify the correlation between adjacent road segments.
For the average speed sequences V i and V j of adjacent road segment nodes i and j with lengths m and n , respectively, the accumulated cost matrix C = c m , n can be computed through iterative calculations. The recursive equation for each element is as follows:
c m , n = v i m v j n + min c m 1 , n , c m 1 , n 1 , c m , n 1
The DTW distance between V i and V j is defined as the value of the element located in the lower-right corner of the accumulated cost matrix C , as follows:
DTW V i , V j = c m , n
where the smaller the DTW distance, the greater the similarity between speed variations in the road segments. By normalizing the DTW distance to the range [0, 1], the edge weight w i j between nodes i and j can be derived as follows:
w i j = exp DTW V i , V j 1 2 V i + V j

2.3. Multi-Scale Community Detection

As previously discussed, most prior studies have divided urban roads into adjacent groups based on topological distance, neglecting the spatial heterogeneity of traffic states across road segments. To obtain a multi-scale road segment community, the hierarchical community structure is identified based on the traffic data-enhanced urban road network dual graph using the Infomap algorithm in this study.
The Infomap algorithm is a fast and accurate method for hierarchical community detection. This algorithm inherently captures the flow characteristics in graphs based on random walking, making it particularly suitable for analyzing networks with flows [40,41,42,43,44]. Compared with the widely used Louvain algorithm, the community detection results generated by the Infomap algorithm exhibit greater robustness and are less sensitive to random factors.
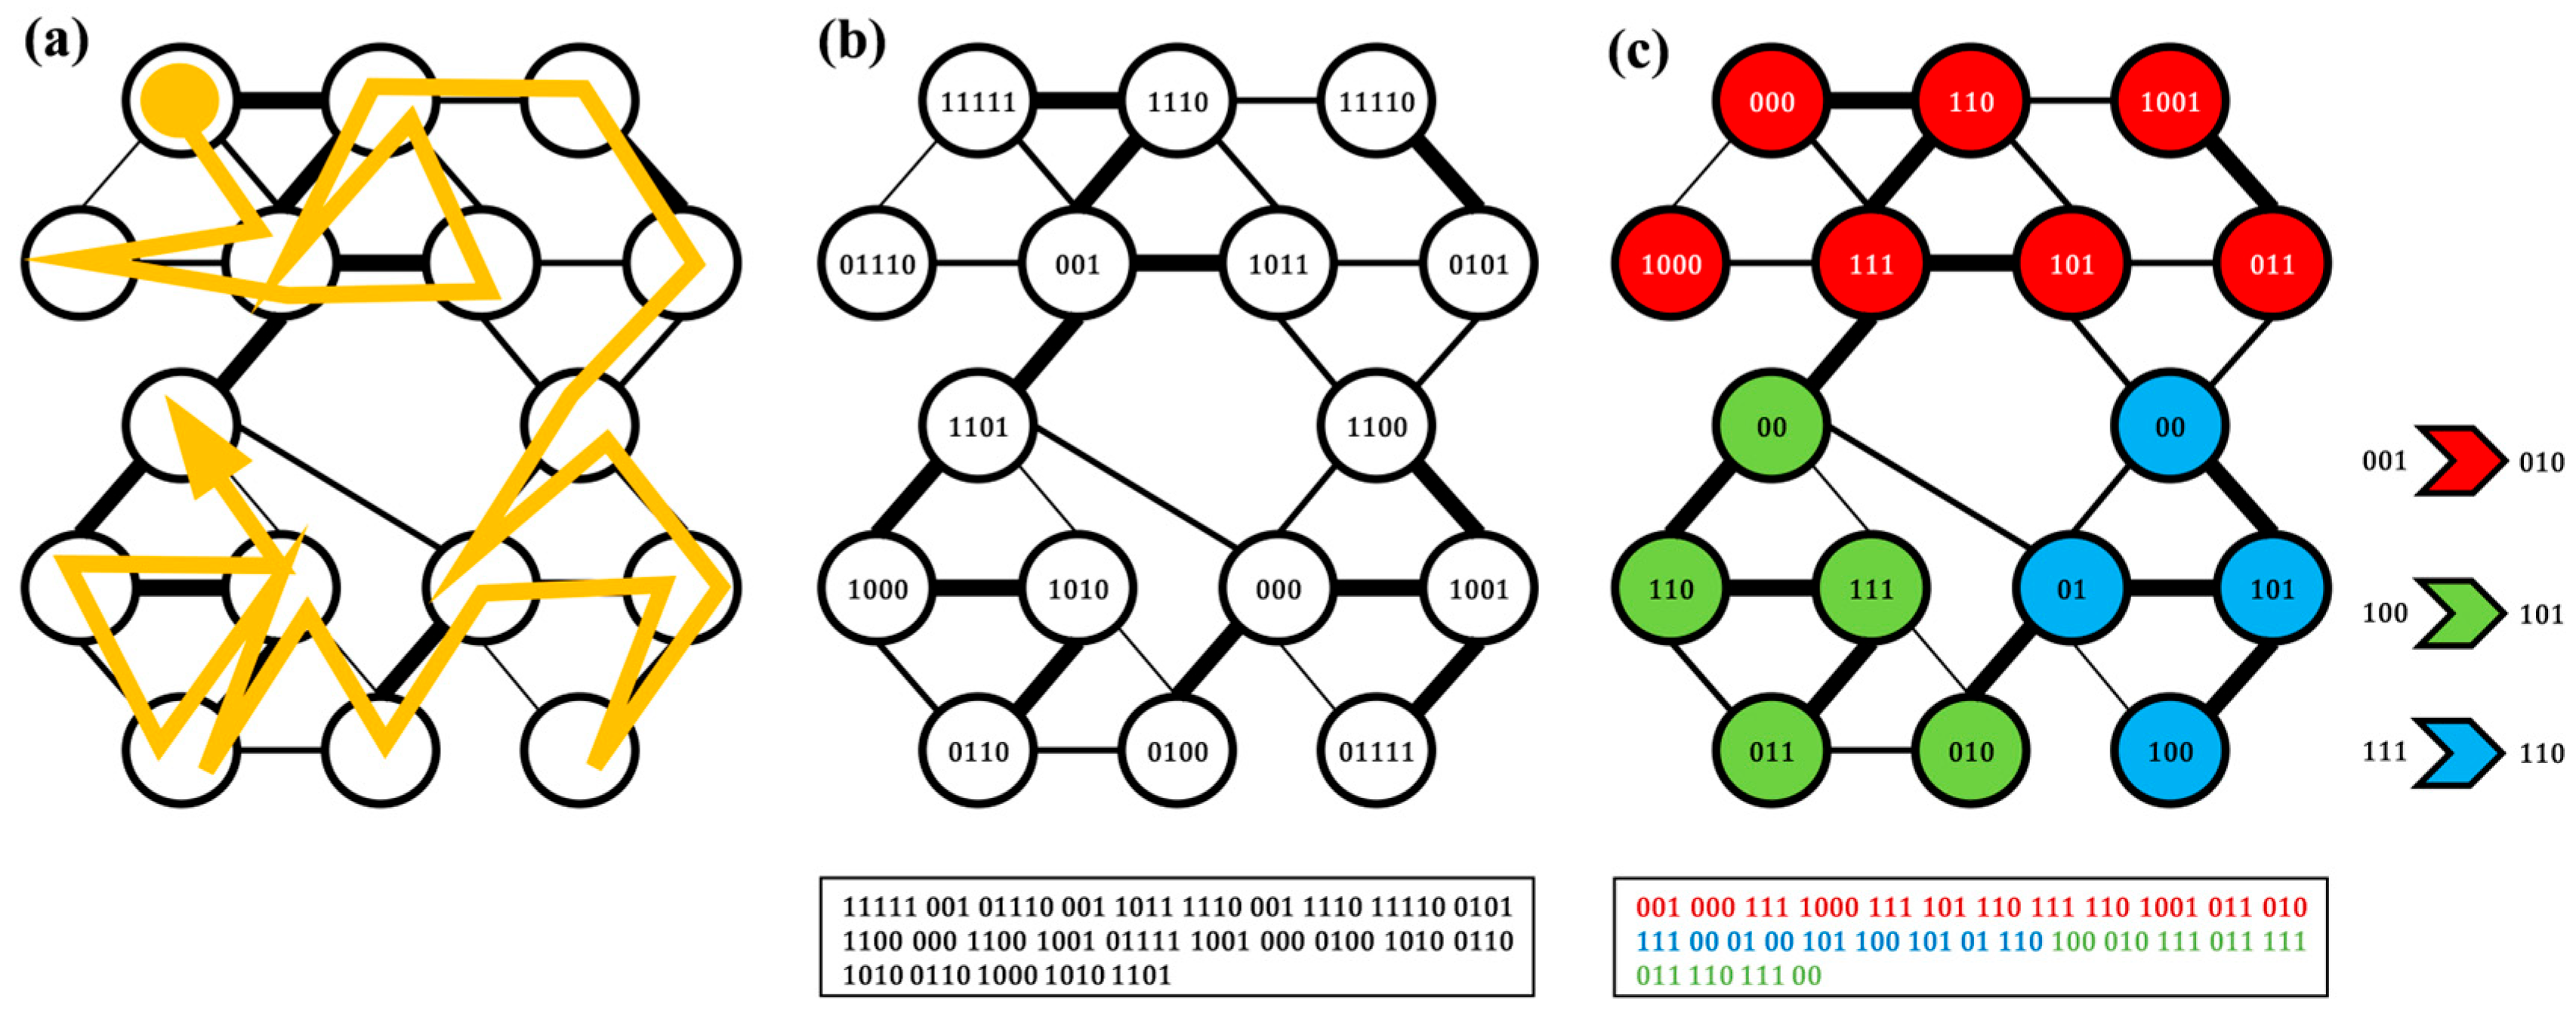
The Infomap algorithm is grounded in the observation that information flows predominantly within well-connected modules and minimally across sparsely connected ones. As illustrated in Figure 5, in the 16-node example graph, random walking is employed to simulate the flow process (Figure 5a), and the resulting path is encoded using Huffman coding [45]. Compared with establishing a single Huffman codebook (Figure 5b), constructing an index codebook and multiple module codebooks based on the network structure can reduce the description length of the random walk process (Figure 5c). This process establishes a connection between community detection and coding theory. Specifically, the objective of the Infomap algorithm is to identify an optimal community division that minimizes the expected coding length required to describe the random walk process.
According to Shannon’s source coding theorem [46], when using n codewords to describe the n states of a random variable X with probabilities p i , the average length of the codewords is no less than the entropy H X of the random variable X itself:
H X = i = 1 n p i log p i
For a network partitioned into m communities, the map equation L M characterizes the theoretical lower bound of the average coding length for a one-step random walk process in the network, as follows:
L M = q H Q + i = 1 m p i H P i
where H Q represents the theoretical lower bound of the frequency-weighted average codeword length in the index codebook, and H P i denotes the theoretical lower bound of the frequency-weighted average codeword length in the i -th module codebook. Both H Q and H P i are weighted by the corresponding codebook usage probabilities. The index codebook has a usage probability of q = i = 1 m q i , where q i denotes the probability of exiting module i . The index codebook has a usage probability of p i = α i p α + q i , where p α denotes the probability of accessing node α within module i .
For weighted networks, the Infomap algorithm computes the corresponding access probabilities based on edge weights. In this study, we defined the edge weights according to the DTW similarity of traffic speed sequences between road segment nodes. Therefore, the proposed method tends to group adjacent road segments with similar traffic patterns into the same community.
The Infomap algorithm is capable of identifying multi-scale community structures through hierarchical clustering. Specifically, the community division is optimized through an iterative greedy algorithm that minimizes the L M to achieve single-scale community detection. At a larger scale, communities identified at a finer scale are aggregated and treated as nodes to construct a new network, upon which the same optimization process is recursively applied. The detailed algorithm is outlined below.
(1)
In the initial stage of the first phase, each node is assigned to a separate module.
(2)
Then, in a random order, nodes are reassigned to the adjacent module that can reduce L M to the greatest extent.
(3)
Step 2 is repeated in a new random order each time until no further reduction in the value of L M is achievable through node movement, thereby obtaining one-level community detection results.
(4)
Based on the results of step 3, a new network is constructed. Each node in the new network represents a community from the original network. The weight of each new edge is calculated as the sum of the weights of the corresponding original edges. Steps 1 to 3 are then repeated on the new network to obtain more level community detection results.
(5)
Step 4 is repeated until the value of L M in the new network can no longer be reduced. Finally, the algorithm outputs the multi-scale hierarchical community detection results of the network, as illustrated in Figure 6.

3. Results and Discussion

3.1. Statistical Characteristics of Urban Road Traffic

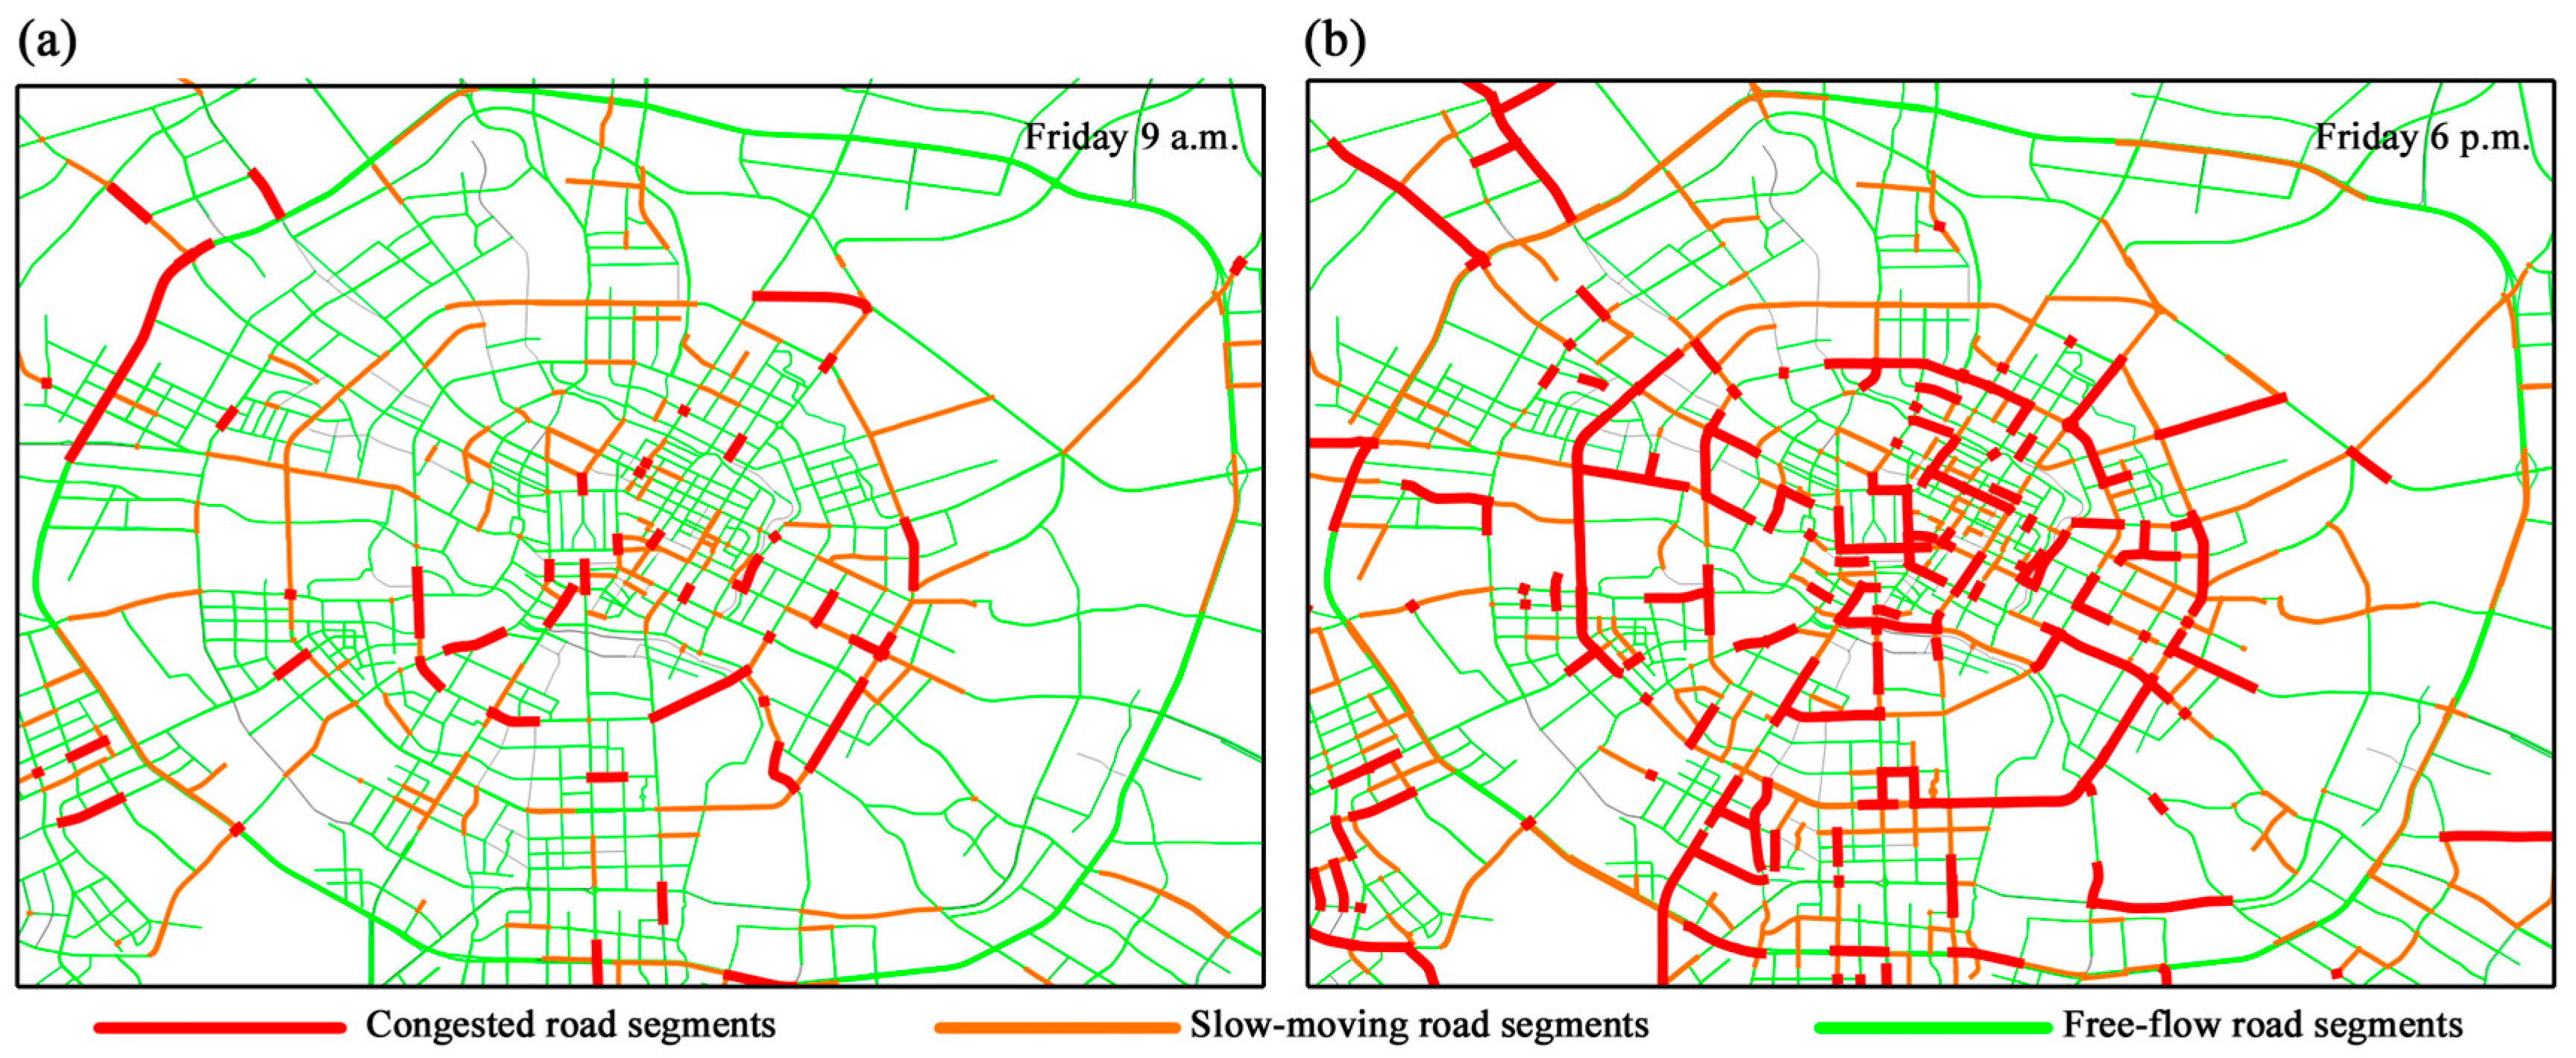
Figure 7 illustrates the statistical congestion and speed characteristics of the main roads within Chengdu City’s Third Ring Road over a seven-day period from 26 May 2025 to 1 June 2025. Figure 8 illustrates the spatial distribution of congested road segments during the morning and evening peak hours in Chengdu on Friday, 30 May 2025. Notably, this dataset clearly captures the congestion associated with both the morning and evening rush hours, as well as the weekend rush hour, in Chengdu.
During weekdays, i.e., from Monday to Friday, there are two distinct peaks in the number of slow-moving and congested road segments (Figure 7a). The first peak consistently occurs between 8 a.m. and 9 a.m., while the second peak typically appears between 6 p.m. and 7 p.m., reflecting the morning and evening rush hour traffic characteristics on weekdays. On Saturdays and Sundays, the pattern of the two congestion peaks weakens, with the first peak delayed until after 11 a.m., which aligns with the traffic behavior on rest days. Another phenomenon is the severe congestion observed on Friday evenings, with more than a quarter of roads experiencing slow-moving or congested traffic. This congestion can be attributed to the three-day holiday beginning on Saturday, 31 May, which coincides with the traditional Chinese Dragon Boat Festival, prompting many families to depart for their vacations after work on the preceding evening. Importantly, the festival factor does not undermine the general conclusions of this study. According to a three-year urban traffic congestion study [47], the evening rush hour on Fridays is particularly pronounced, whereas congestion levels on Saturdays, Sundays, and holidays are lower than those observed on weekdays, consistent with the data trends presented in Figure 7.
The average speed statistics of all studied road segments in Figure 7b exhibit a synchronous and inverse pattern when compared with the congestion statistics in Figure 7a. This result can be interpreted as evidence that congestion leads to a reduction in driving speed. When numerous road segments are congested, there is a significant decline in the average driving speed across the entire road network, which confirms the consistency between different statistical measures in the dataset. The real-world traffic data mentioned above reflect the road congestion status and its spatial distribution over time, which is helpful for depicting the spatiotemporal correlations among road segments and traffic patterns in urban road networks.

3.2. Multi-Scale Community Detection Results for the Chengdu Road Network

Taking the road network within the Third Ring Road of Chengdu as a case study, the proposed method was employed to identify multi-scale communities. Firstly, a dual graph of the urban road network in the experimental area was constructed using the collected dataset. The correlation between adjacent road segments was calculated based on the average speed sequence data from 168 time periods across seven consecutive days and subsequently normalized to serve as edge weights in the dual graph. The results of the multi-scale community detection for the Chengdu road network are presented in Figure 9.
By iteratively executing the Infomap algorithm, community structure detection results at different scales are progressively generated from the bottom up. The final result (community level 1) consists of fewer communities with larger scales, providing macroscopic and coarse-grained structural information. The second and third levels below exhibit smaller community scales and an increasing number of communities, offering more granular structural insights. This outcome demonstrates that the proposed method is capable of generating multi-scale community detection results for traffic analysis, thereby enhancing its practical applicability.
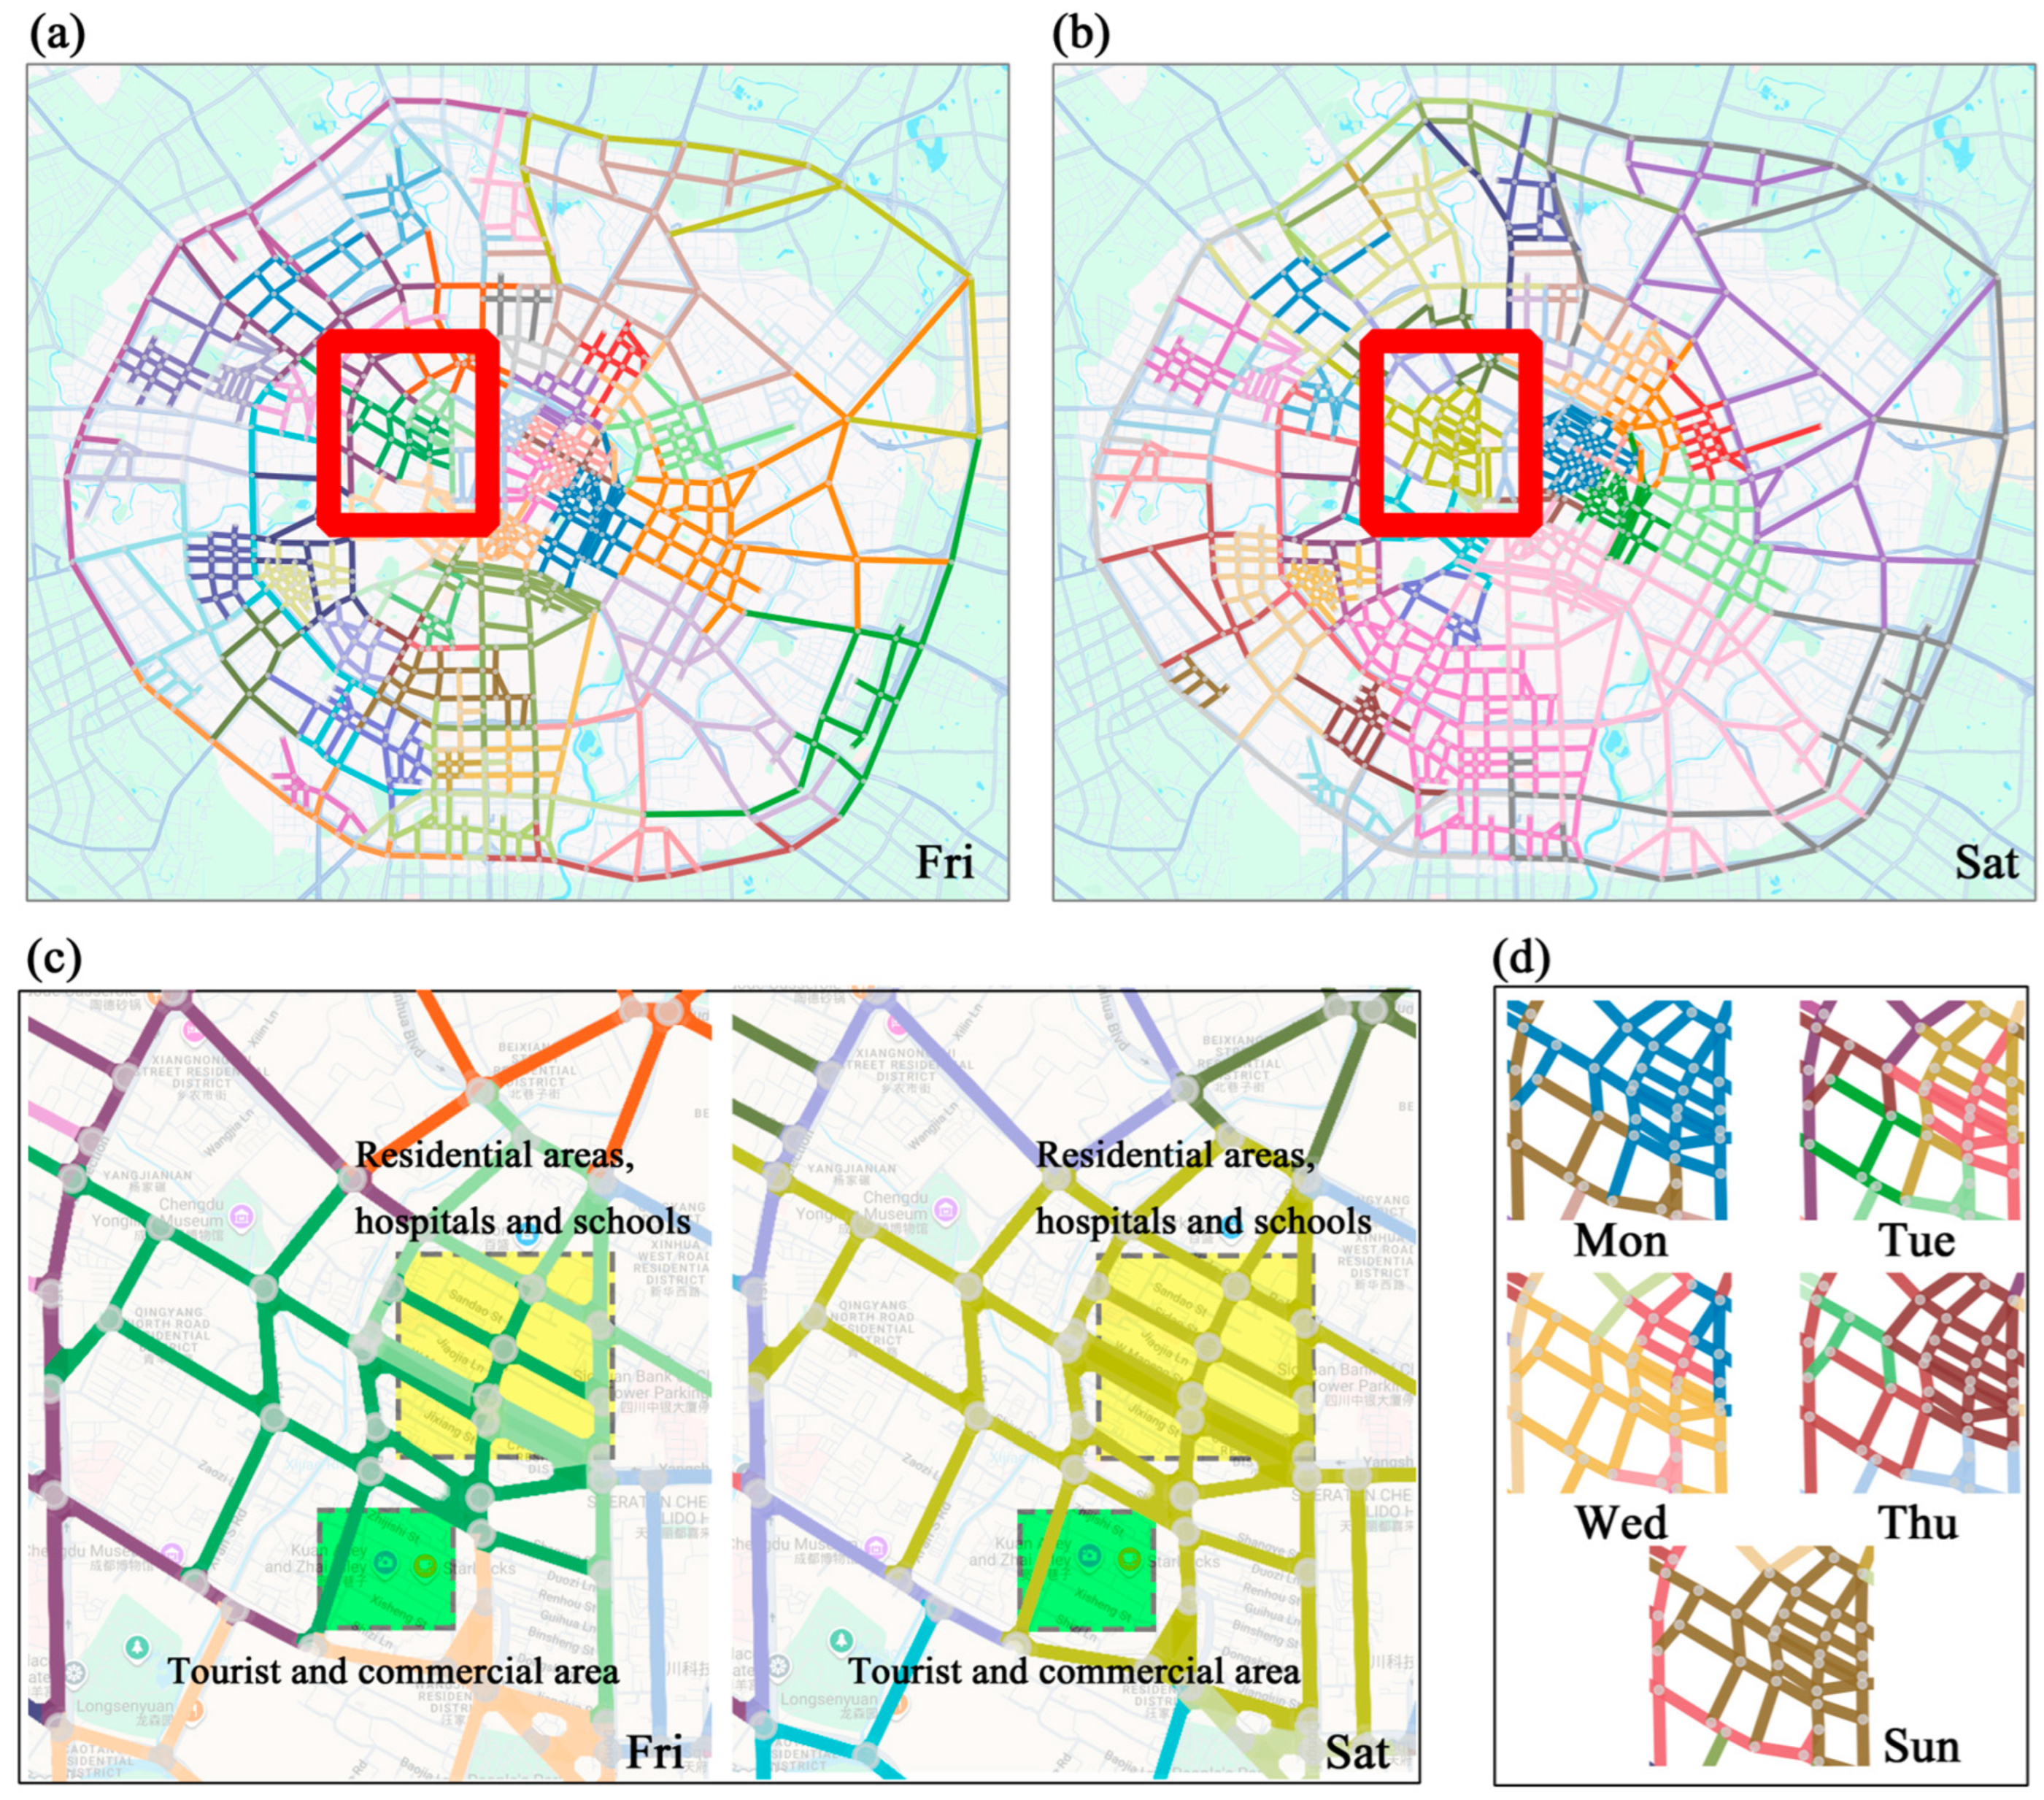
Secondly, as the statistical analysis in Section 3.1 indicates, weekdays and holidays present distinct traffic patterns. Therefore, it is essential to construct urban road network models based on the 24 h speed sequence data of each individual day. To provide sufficient detail, we chose to visualize the results at community level 2, as illustrated in Figure 10. Figure 10a,b present the community structures on Friday and Saturday. The community detection results for these two days exhibit both similarities and notable differences. These variations confirm that the proposed method is capable of capturing the changes in traffic patterns between weekdays and weekends.
Taking the well-known Kuanzhai Alley scenic area and its surrounding regions in Chengdu as an example (indicated by the red-box in Figure 10a,b), Figure 10c illustrates the detailed community structures of this area on Friday and Saturday. The green-marked areas are primarily used for tourism and commercial activities, whereas the yellow-marked areas are predominantly residential areas, hospitals, and schools. On weekdays such as Friday, residential and tourist areas exhibit distinct traffic patterns. As a result, the proposed method tends to divide this region into multiple distinct communities. When there is a holiday on a Saturday, the morning and evening rush hour travel patterns in residential areas diminish, and the traffic patterns become more similar to those observed in tourist areas. Consequently, the proposed method identifies this region as a single community. Beyond the comparison between Friday and Saturday as a single illustrative example, we systematically compared community structures detected across the other five days of the week, consistently observing similar patterns. The comparison of community detection results across different days in Figure 10d demonstrates that the proposed method accurately captured distinct traffic patterns in tourist and residential areas during weekdays and holidays.

3.3. Robustness of Community Detection Results

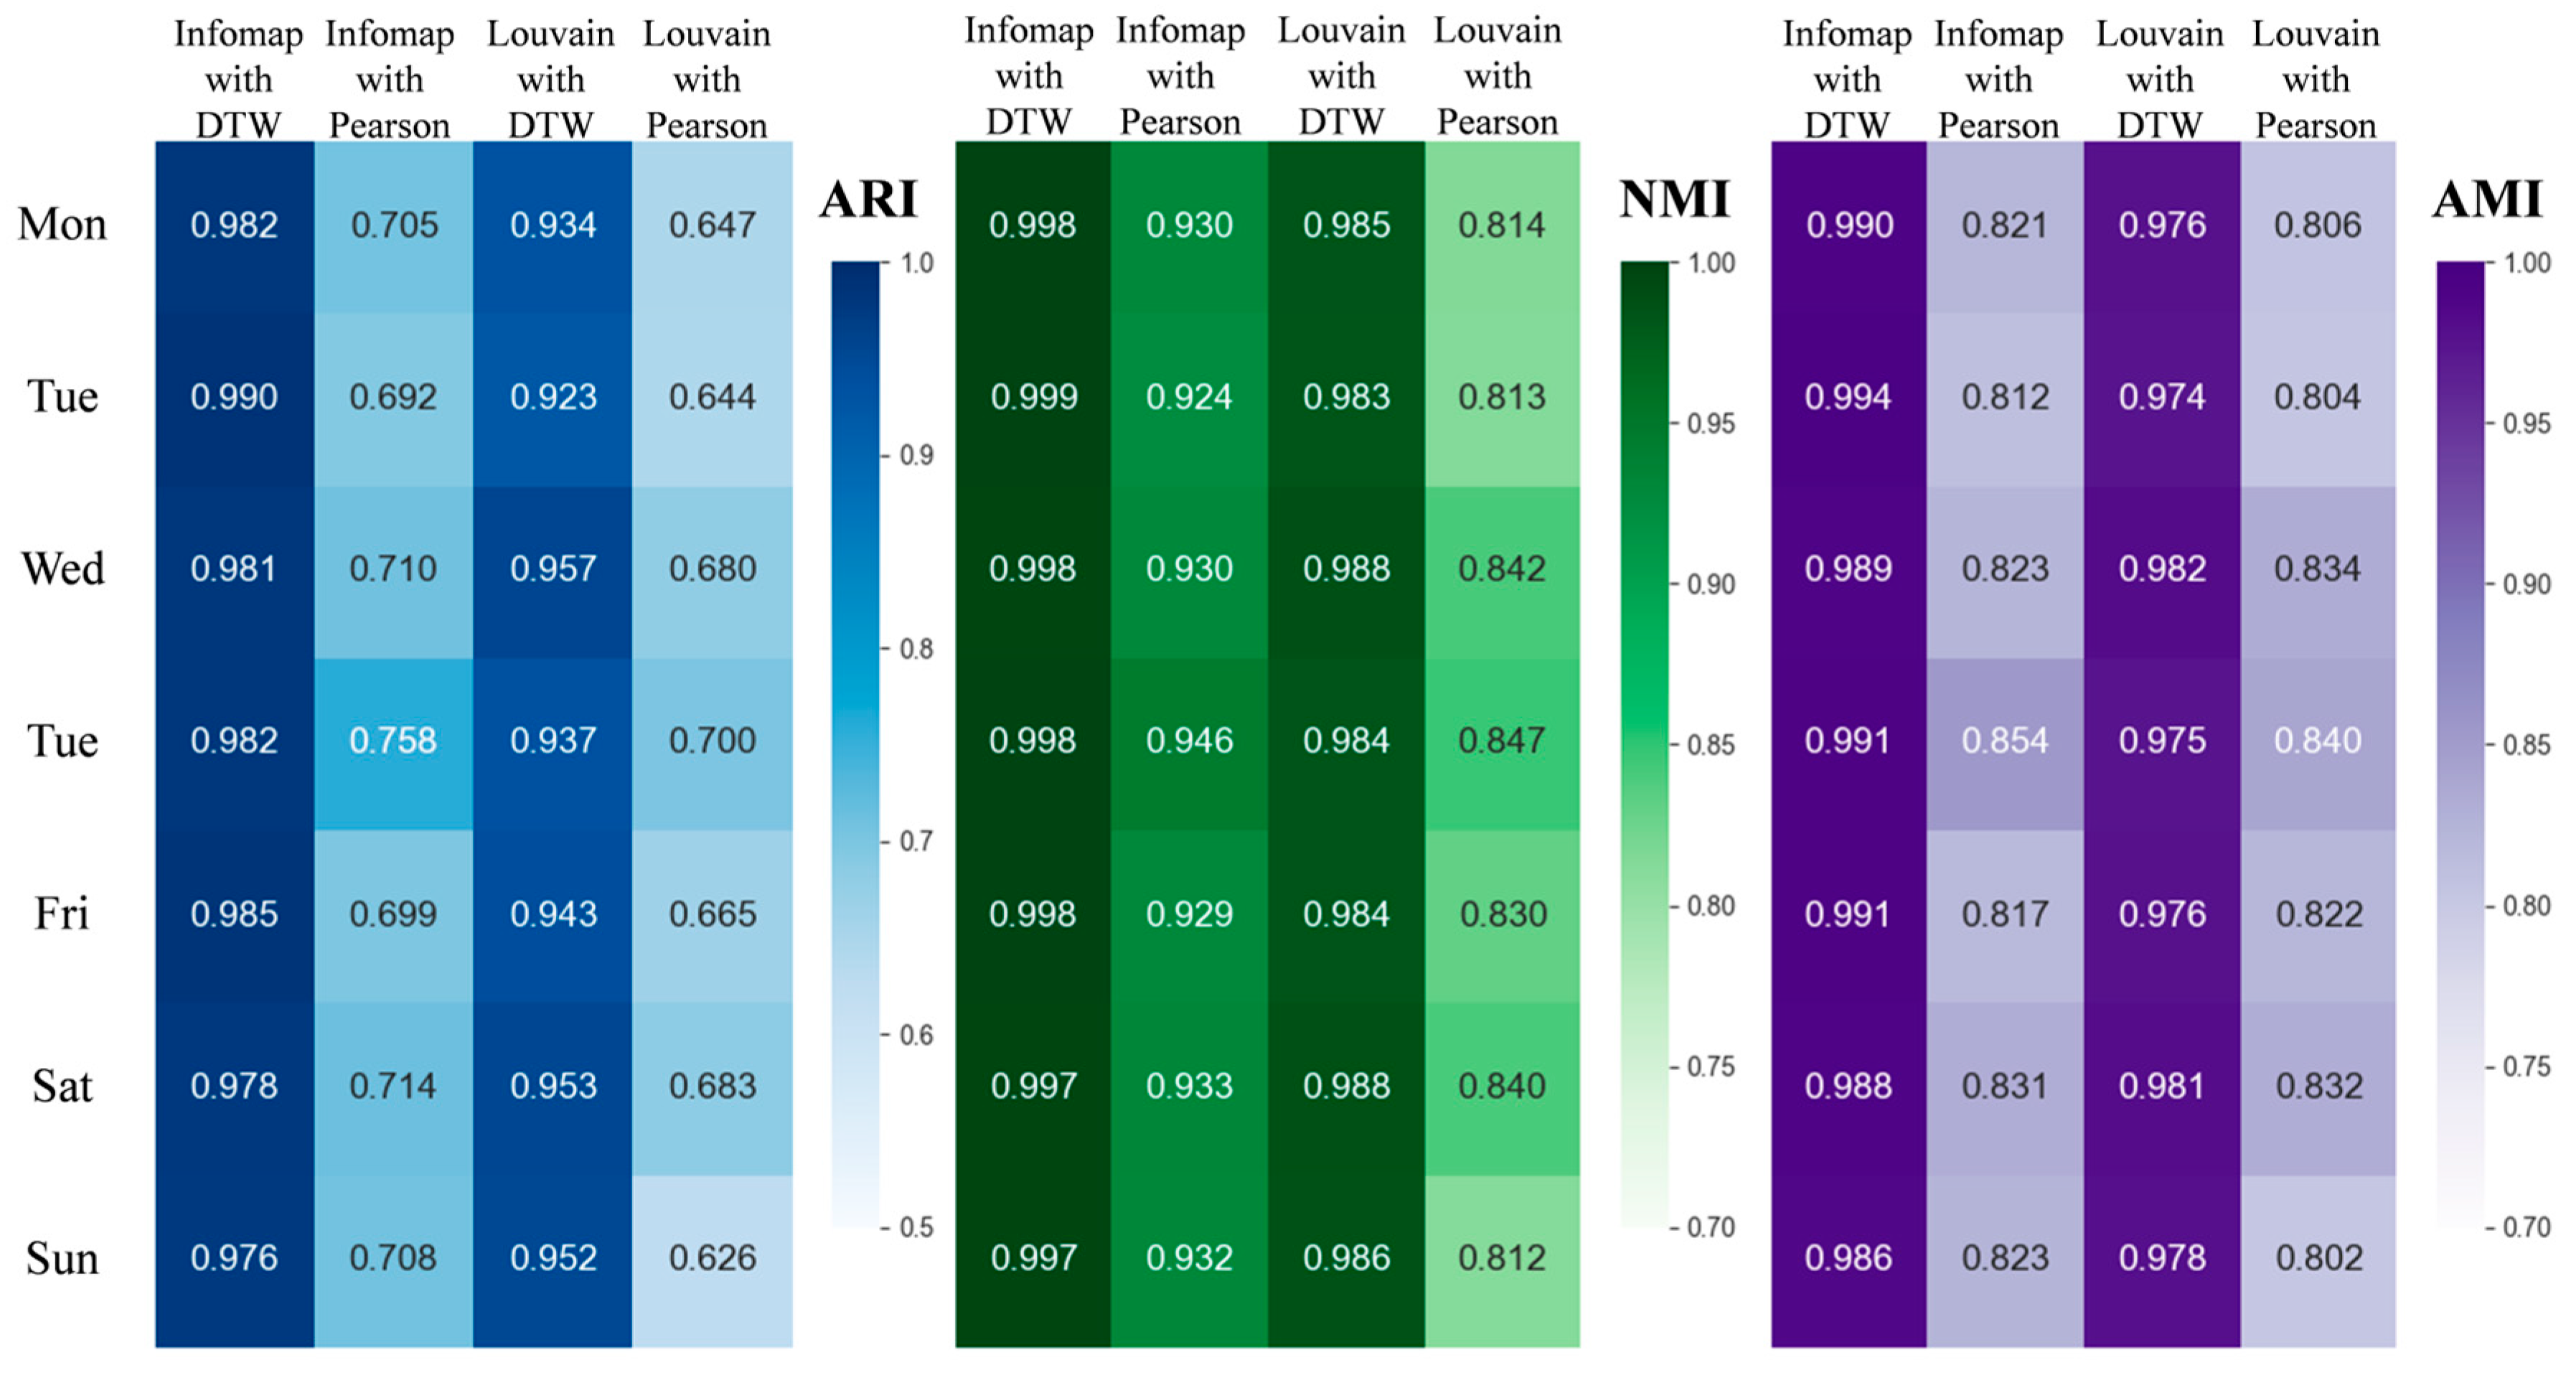
Due to the random execution order during the iteration process of the Infomap algorithm, different community detection results may be obtained across multiple runs if a fixed random seed is not specified. To evaluate the robustness of the proposed method in detecting urban road network communities, the similarities between daily traffic sequence data for each road segment in Chengdu’s road network were computed using both DTW and the Pearson correlation coefficient as edge weights. The Infomap and Louvain algorithms were independently executed 50 times each with different random seeds to identify community structures. Subsequently, the Adjusted Rand Index (ARI), Normalized Mutual Information (NMI), and Adjusted Mutual Information (AMI) were employed to evaluate the similarities between the community detection results across each scenario.
The ARI measures the degree of consistency between two community detection results, with values ranging from −1 to 1. An ARI of 1 indicates complete agreement between the two partitions, an ARI of 0 suggests a similarity equivalent to a random scenario, and a negative ARI implies that the consistency is lower than expected under a random scenario. In information theory, Mutual Information (MI) quantifies the interdependence between two random variables. In this study, MI reflects the amount of information that can be inferred from the results of one community division compared with those of another. The NMI normalizes the MI to mitigate sensitivity to the number of clusters, with values ranging from 0 to 1. An NMI of 1 indicates complete consistency between the two partitions, whereas an NMI of 0 signifies that the partitions are entirely independent and share no information. The AMI is adjusted for chance based on MI, with values ranging from −1 to 1. An AMI of 1 indicates complete consistency between the two partitions, an AMI of 0 suggests a degree of similarity equivalent to that of a random scenario, and a negative AMI implies that the consistency between the two partitions is lower than expected under a random scenario.
Figure 11 presents the ARI, NMI, and AMI of community detection results in the urban road network, derived from combinations of different similarity measures and community detection algorithms. Across all tasks based on single-day traffic data, the Infomap algorithm with DTW-based weights yields the highest robustness, outperforming the Louvain algorithm under the same weighting method. When the Pearson correlation coefficient is used as the weight, Infomap still achieves higher ARI and NMI values than those of Louvain. The Pearson correlation coefficient emphasizes trend similarities between data sequences but may overlook magnitude differences in similarly shaped segments and is highly sensitive to phase shifts common in traffic speed time series. As a weighting metric for community detection, the Pearson correlation is less effective than DTW. Therefore, integrating DTW into the Infomap algorithm for community detection in urban road networks offers robust and consistent results, outperforming alternative approaches.
To further assess the robustness of the community detection results produced by the proposed method, the algorithm was independently executed 50 times on the dual graphs of Chengdu’s road network under three scenarios: without traffic data weighting, with one-week traffic data weighting, and with daily traffic data weighting. Table 1, Table 2 and Table 3 present the robustness of the community detection results across different scales based on traffic data from different time periods.
Firstly, the lowest similarity between community detection results was obtained without traffic data weighting. When the results were weighted using the average speed data sequence, the similarity value improved significantly. Secondly, at all community levels, the similarities between the results based on shorter single-day weighted data sequences were consistently higher than those derived from longer one-week data sequences. This discrepancy exists because traffic pattern characteristics vary significantly across different days, and aggregating an entire week’s data may obscure the distinct features of individual days. Therefore, it is essential to construct a weighted road network model for analysis using daily traffic data separately. Thirdly, the similarity values across community levels 1 to 3 generally exhibit a gradual decline, indicating that community detection results at smaller scales are more vulnerable to disturbances from random factors, while communities identified at the macroscopic level tend to be more stable. Notably, the decline in NMI, which is insensitive to the number of clusters, is relatively minor. This result suggests that the primary cause for the decreases in ARI and AMI is the increase in community numbers at smaller scales. Therefore, the community detection results generated by the proposed method maintain robustness at smaller scales. Finally, at community levels 1 and 2, the similarity values on weekdays consistently exceed those on weekends. This observation agrees with expected traffic patterns, suggesting that the proposed method effectively captures the temporal heterogeneity of traffic’s influence on the urban road network.

3.4. Spatial Autocorrelation of the Multi-Scale Community

In this study, a method for partitioning road segments in urban road networks into communities is proposed. We anticipated that road segments within the same community would exhibit strong correlations in their traffic patterns. To evaluate the effectiveness of the proposed method, we employed Moran’s I to assess the spatial autocorrelation in urban road networks.
Spatial autocorrelation refers to the degree of correlation between the attribute value of a spatial unit and the attribute values of its neighboring spatial units. In the context of our urban road network model, a spatial unit is defined as a road segment, and the attribute value corresponds to the average speed of that road segment at time period t . The corresponding equation for Moran’s I is as follows:
I t = N i N j N s i j i N j N s i j v i t v t ¯ v j t v t ¯ i N v i t v t ¯ 2
where N denotes the set of road segment nodes in the dual graph of the urban road network and N represents the total number of road segment nodes. Further, v i t represents the speed of road segment i at time period t , and v t ¯ denotes the average speed of all road segments at time t . Additionally, let A denote the adjacency matrix of the dual graph, where element a i j = 1 if there is an edge between road segments i and j ; otherwise, a i j = 0 . To calculate the spatial autocorrelation within a specific spatial range and simultaneously account for the influence of community structure on spatial autocorrelation, element a i j is extended to define the spatial weight s i j .
In the dual graph of the urban road network we constructed, the topological distance d i j between road segment nodes i and j is defined as the number of edges traversed by the shortest path connecting the nodes. If d i j = m , then nodes i and j are referred to as m -order neighbors of each other. Then s i j is defined as follows:
s i j = 1   if   d i j m ,   C i = C j 0   o t h e r w i s e
where C i and C j denote the communities to which nodes i and j belong. In particular, for road networks lacking community structures, all road segment nodes are considered to belong to the same community.
Using the proposed method, the communities of the road network were identified based on daily traffic data, and Moran’s I was computed for 168 time periods within a week. The results were then compared with the values of Moran’s I derived from topological communities and spatial distance, as illustrated in Figure 12. The three subplot columns, from left to right, illustrate the influence of community structures at different scales on spatial autocorrelation. The four rows of subplots, from top to bottom, demonstrate the effect of the spatial neighborhood threshold m on spatial autocorrelation.
Firstly, Moran’s I for all time periods is greater than 0. Additionally, the p-value is less than 0.05, indicating that a strong spatial autocorrelation exists in urban road traffic. A commonly observed phenomenon is that Moran’s I exhibits a significant negative correlation with the congestion state of urban traffic. When the number of congested road segments increases, Moran’s I tends to decrease significantly. This phenomenon can be attributed to the reduced travel speed on congested segments, which increases the speed disparities with non-congested segments, thereby weakening spatial autocorrelation.
Second, the Moran’s I of topological communities showed no significant improvement compared with that based on spatial distance at community levels 1 and 2. However, at community levels 2 and 3, spatial autocorrelation was higher for Pearson weighted communities than for topologically communities, confirming that the traffic sequence similarity effectively captures road section correlation. In all cases, the Moran’s I of the proposed method is the highest, demonstrating its effectiveness in identifying spatially autocorrelated road segment clusters across multiple scales.
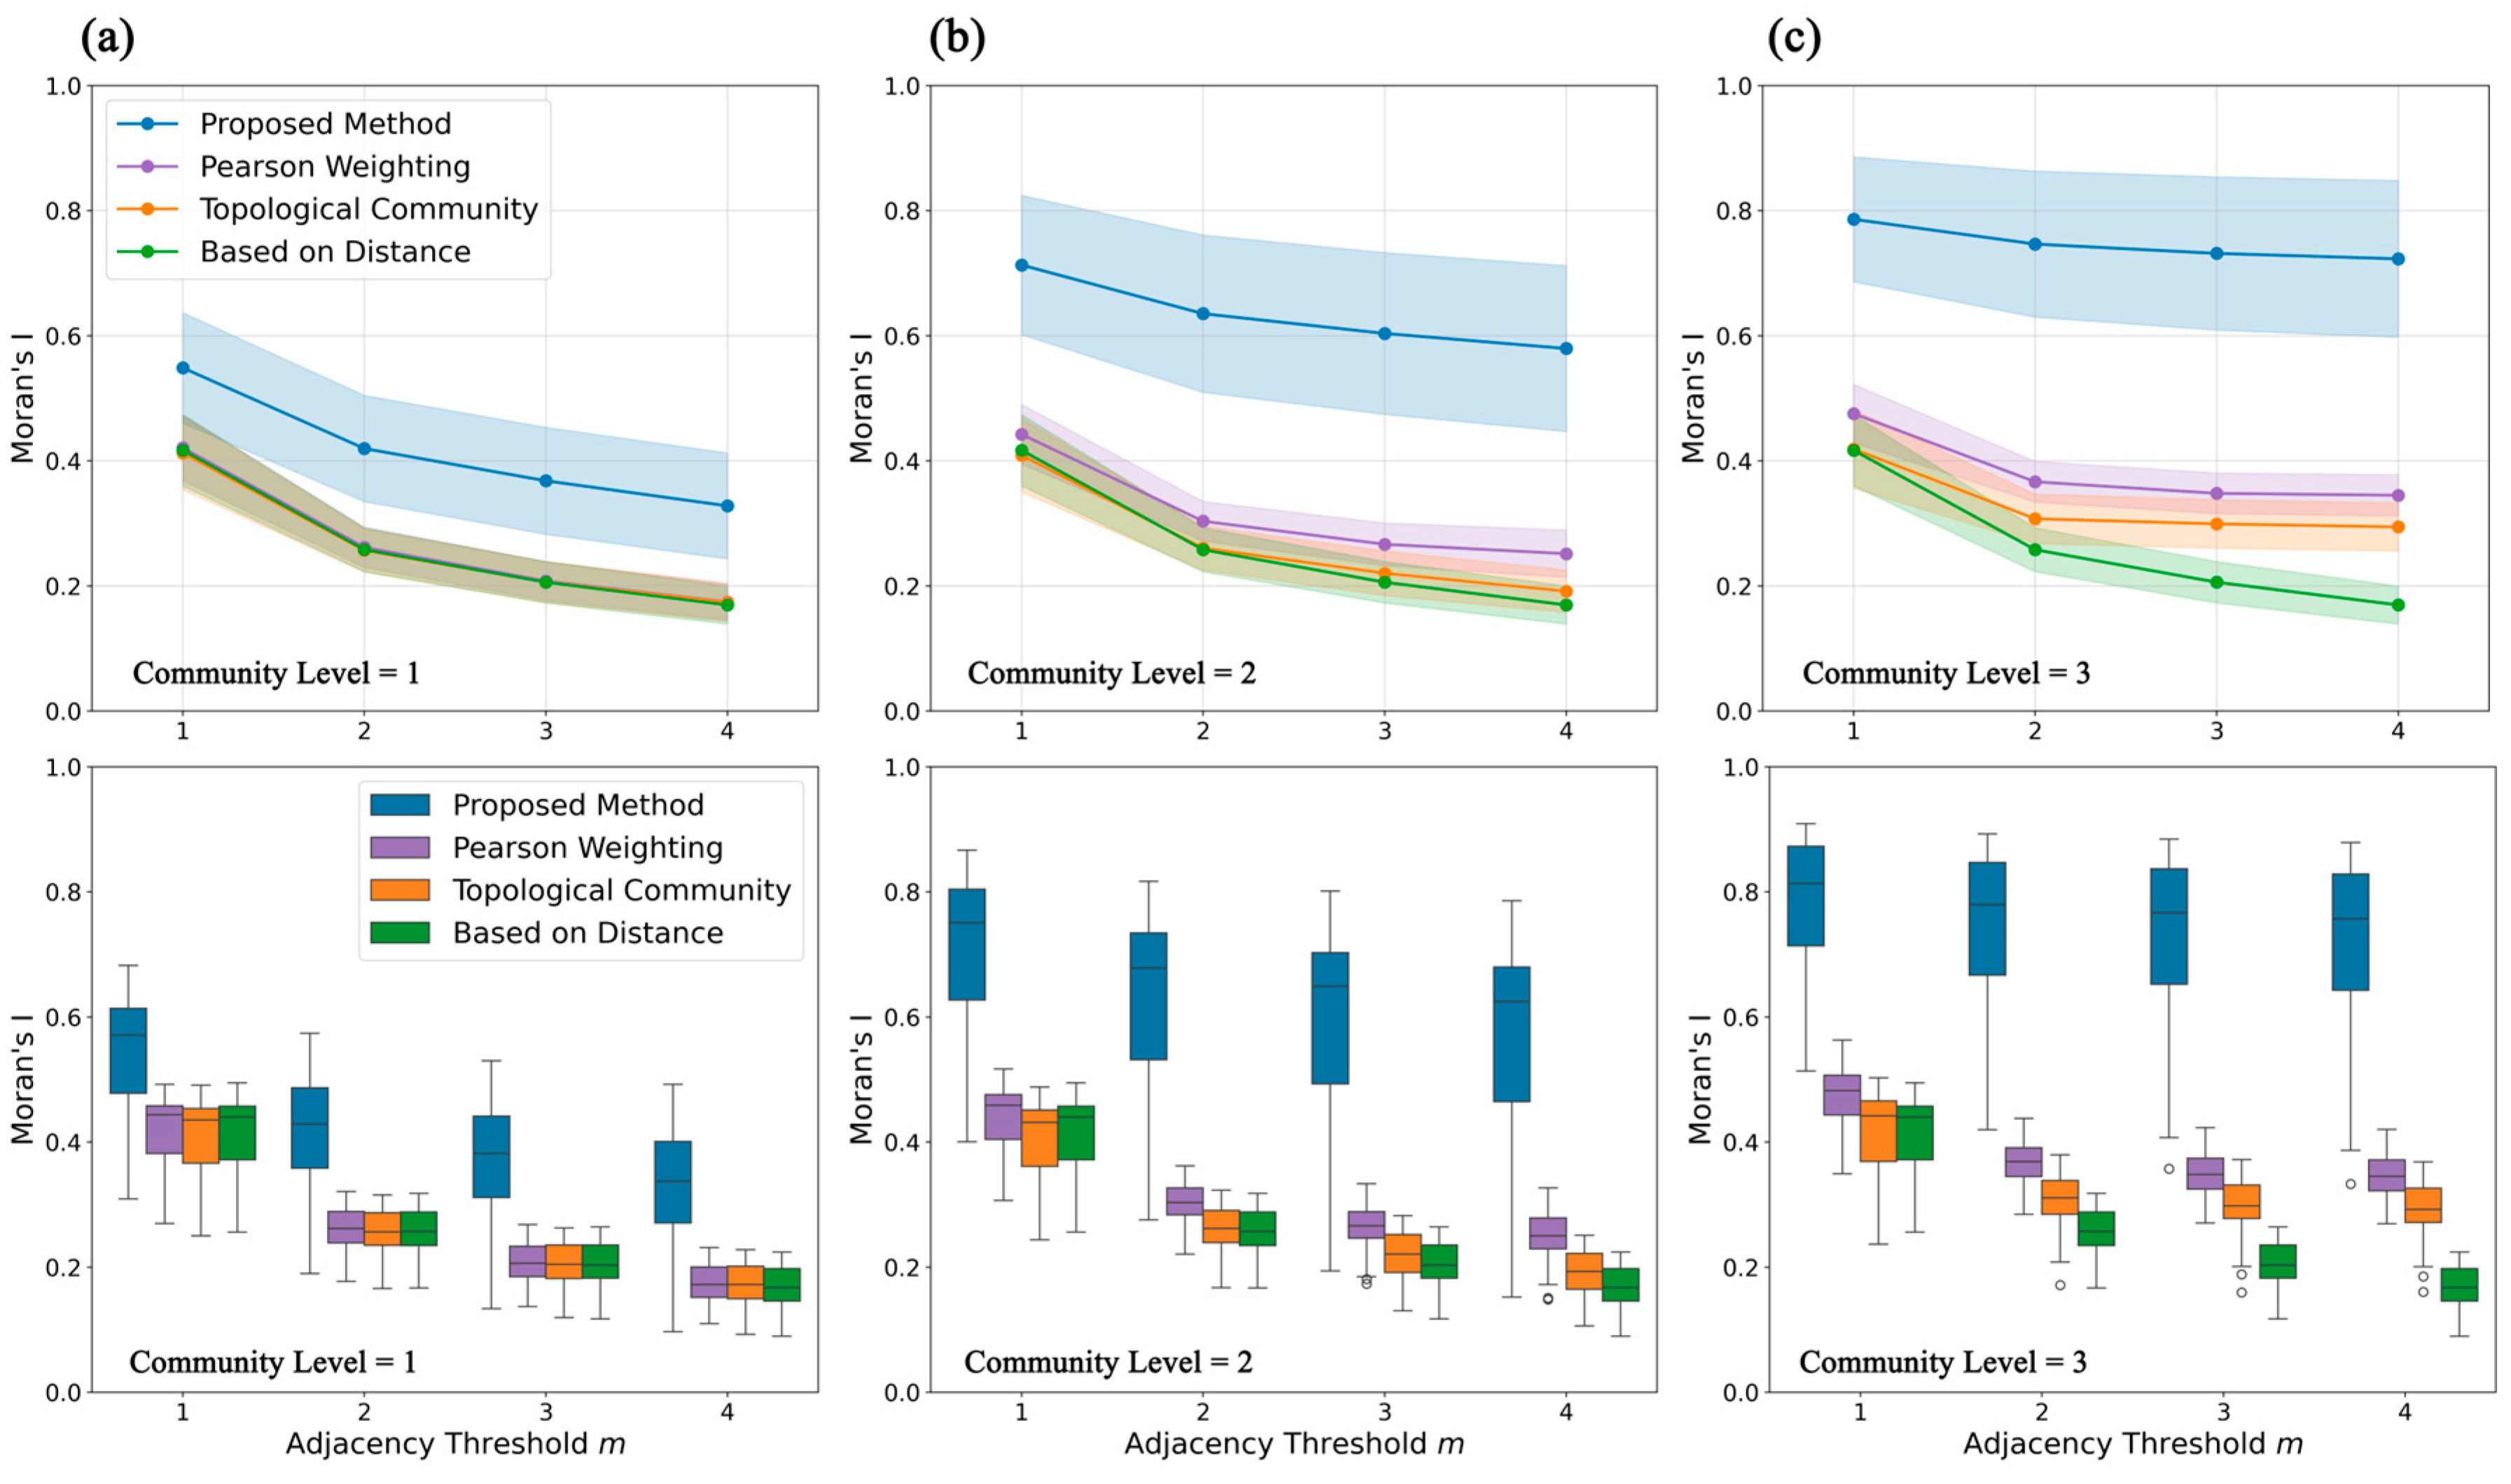
Figure 13 presents the Moran’s I values for the 168 time periods in a week as a line chart with corresponding box plots, more clearly demonstrating the changing trend of spatial autocorrelation with variation at a community scale with an adjacency threshold. Table 4 summarizes the advantages of the proposed method compared to those of the benchmark methods and reports the results of statistical significance tests conducted across the different methods.
From large to small scales, under the proposed method, Moran’s I demonstrates increased advantages over that based on spatial distance (Figure 13), indicating stronger correlations between road segments within small-scale community structures. In contrast, the large-scale community structure inevitably results in reduced correlation due to the aggregation of numerous road segments with heterogeneous traffic patterns. Specifically, when m = 1 , the Moran’s I value of the proposed method exceeds the value based on spatial distance by 31.61% at large scales and by 88.58% at small scales (Table 4). The communities identified using Pearson weighting and unweighted topological communities exhibit a similar trend, with higher Moran’s I values at smaller spatial scales.
As the spatial adjacency threshold m increases, all values of Moran’s I tend to decrease, indicating that road segments with greater topological distances exhibit weaker correlation. However, as the community scale decreases, the sensitivity of the proposed method to variations in m diminishes, enabling it to consistently maintain a relatively high Moran’s I value. In addition, as m increases, the topological community demonstrates a slight advantage over the distance-based Moran’s I, suggesting that the topological structure is helpful in identifying long-distance spatial autocorrelation. Compared with communities obtained based on topological structure and spatial partitions derived from distance metrics, the proposed method offers higher spatial autocorrelation across different scales and neighborhood ranges, making it more effective for road segment clustering.
In previous experiments, one-day traffic data with a sequence length of 24 and full-week traffic data with a sequence length of 168 were used, enabling DTW to compute the weights of all 3367 edges in Chengdu’s road network relatively quickly. However, DTW has a high time complexity of O ( M N ) , where M and N denote the lengths of the two sequences being compared. For traffic data sequences with longer time scales or finer time granularity, the computational feasibility of DTW must be considered, and its computational cost can be effectively reduced by applying time window constraints. The Sakoe–Chiba Band path constraint limits the search space of DTW to a band-shaped region around the main diagonal of the accumulated cost matrix C , thereby improving computational efficiency. A smaller time window radius parameter R imposes stricter constraints, which can substantially reduce computational costs but may overlook optimal alignment. For instance, when R = 0.1, the matching distance between data sequences must not exceed 10% of the total sequence length. Table 5 presents the computational costs of unconstrained DTW and constrained DTW with different R values across various sequence lengths, as well as the similarities of the resulting road network weight matrices. All experiments were performed using Python 3.9 on a Lenovo laptop equipped with an AMD Ryzen 7 4800H CPU and an NVIDIA RTX 2060 GPU.
For a one-day traffic data sequence with a length of 24, it takes only 1.48 s to compute the unconstrained DTW weights for all 3367 edges. However, for a full-week traffic data sequence with a length of 168, the computation requires 71.74 s, which aligns with the theoretical time complexity of DTW. Using the Sakoe–Chiba Band constraint in DTW improves computational efficiency, reducing computation time by 63% to 85% as R decreases from 0.2 to 0.05. The high Pearson correlation coefficient between the constrained and unconstrained results indicates that the time window constraint exerts only a minor influence on the outcome. Consequently, we conducted a further analysis of the coefficient’s impact on the spatial autocorrelation of the community detection results, as illustrated in Figure 14.
Although stricter time window constraints limit the range of feasible solutions, they help reduce spurious data matching over excessively long time spans. Consequently, in large-scale communities, a smaller R value not only reduces computational costs but also enhances the spatial autocorrelation of community detection results. In the present study, time window constraints did not reduce the spatial autocorrelation of community detection results for smaller-scale communities. Thus, applying the Sakoe–Chiba Band path constraint improved computational efficiency without compromising result validity, enabling the proposed method to be used with longer time series data and demonstrating the feasibility of applying this method to traffic pattern recognition at larger temporal scales.

4. Conclusions

Based on complex network theory and driven by traffic data, this study characterized the evolution of multi-scale communities in urban road networks to reveal dynamic traffic patterns. To capture the multi-scale spatiotemporal features of urban roads, the road network was first modeled as a dual graph, explicitly representing adjacency relationships between road segments. Subsequently, a correlation weight matrix between road segments was constructed using DTW to measure the similarities between their speed time series. Given the effectiveness of random walks in capturing network dynamics, the Infomap algorithm was employed to detect multi-scale hierarchical communities in the weighted dual graph. This hierarchical approach effectively identifies clusters of correlated road segments across scales, thereby elucidating the evolution of traffic patterns in urban road networks.
The proposed method was applied to the road network within Chengdu’s Third Ring Road. Analysis of the detected communities across different time periods revealed that the method accurately captures distinct traffic patterns in various urban areas during both weekdays and holidays. By integrating topological structures with traffic dynamics, the proposed method effectively reduced the inherent randomness in community detection algorithms and demonstrated enhanced robustness in identifying multi-scale communities compared to methods based on the Louvain algorithm and the Pearson correlation coefficient. Spatial autocorrelation analysis based on Moran’s I showed that these multi-scale communities exhibit the highest spatial autocorrelation across different scales and adjacency threshold ranges, effectively capturing clusters of road segments with similar spatiotemporal traffic characteristics. Finally, parameter sensitivity analysis confirmed that the adoption of Sakoe–Chiba Band path constraints simultaneously enhanced algorithmic efficiency and the spatial autocorrelation of community detection results, demonstrating the algorithm’s applicability to longer time series data.
From an application perspective, these spatial autocorrelation communities can serve as fundamental units for regional-level traffic state predictions, thereby mitigating the adverse effects of geometric regional partitioning on prediction accuracy. These communities also revealed strongly correlated road segments within the road network. By designating these communities as traffic control sub-areas and coordinating signals at internal intersections, overall regional traffic efficiency can be improved. Furthermore, by leveraging the sparse topological connections between communities, key corridor structures linking different urban districts can be identified, thereby providing a foundation for urban construction planning aimed at addressing road network bottlenecks. As a result, the proposed method offers theoretical insights and practical value for traffic predictions, traffic control, and urban planning applications.
Although the proposed method is effective and robust when characterizing the evolution of multi-scale communities in urban road networks, certain limitations remain in terms of both the algorithm design and mode, which must be improved. Firstly, while the proposed method produces multi-scale community structures, the sizes of the communities at each scale lack controllability. Secondly, as traffic patterns vary over time, the selection of an optimal time window for sequence data remains an open question that requires further investigation. Enhancing the controllability of the community detection algorithm and extending the feature extraction methods for traffic data would improve the generalizability and practicality of this approach. In addition, due to limitations in data availability, this study employed hourly traffic data collected over a seven-day period to identify and differentiate between traffic patterns across various dates. Acquiring time series data with a finer temporal resolution would enable a more detailed analysis of short-term traffic dynamics, whereas data spanning longer time periods would support the identification of seasonal variation patterns.

Author Contributions

Conceptualization, N.W. and Y.L.; methodology, Y.W. and Y.L.; software, Y.W.; validation, X.S. and S.W.; formal analysis, Y.W.; investigation, Y.W.; resources, N.W. and Y.L.; data curation, Y.W. and X.S.; writing—original draft preparation, Y.W.; writing—review and editing, Y.L. and Y.W.; visualization, Y.W.; supervision, N.W.; project administration, Y.L.; funding acquisition, Y.L. All authors have read and agreed to the published version of the manuscript.

Funding

This research was funded by the Humanities and Social Science Fund of Ministry of Education of China (24YJC630117) and the Natural Science Basic Research Program of Shaanxi Province (S2025-JC-QN-0569).

Institutional Review Board Statement

Not applicable.

Informed Consent Statement

Not applicable.

Data Availability Statement

The data presented in this study are available upon request from the corresponding author.

Conflicts of Interest

The authors declare no conflicts of interest.

References

  1. Zhao, Y.; Chen, B.Y.; Gao, F.; Zhu, X. Dynamic community detection considering daily rhythms of human mobility. Travel Behav. Behav. Behav. Soc. 2023, 31, 209–222. [Google Scholar] [CrossRef]
  2. Zhou, H.; Hirasawa, K. Spatiotemporal traffic network analysis: Technology and applications. Knowl. Inf. Syst. 2019, 60, 25–61. [Google Scholar] [CrossRef]
  3. Fang, Y.; Zhao, F.; Qin, Y.; Luo, H.; Wang, C. Learning all dynamics: Traffic forecasting via locality-aware spatio-temporal joint transformer. IEEE Trans. Intell. Transp. Syst. 2022, 23, 23433–23446. [Google Scholar] [CrossRef]
  4. Li, Y.; Li, W.; Yu, Q.; Yang, H. Taxi global positioning system data in urban road network: A methodology to identify key road clusters based on travel speed–traffic volume correlation. Transp. Res. Rec. 2022, 2676, 487–498. [Google Scholar] [CrossRef]
  5. Liang, J.; Xie, S.; Bao, J. Analysis of a Multiple Traffic Flow Network’s Spatial Organization Pattern Recognition Based on a Network Map. Sustainability 2024, 16, 1300. [Google Scholar] [CrossRef]
  6. Wang, L.; Yang, M.; Li, X.; Qian, Y. A Microcirculation Optimization Model for Public Transportation Networks in Low-Density Areas Considering Equity—A Case of Lanzhou. Sustainability 2025, 17, 5679. [Google Scholar] [CrossRef]
  7. Almaliki, M.; Bamaqa, A.; Badawy, M.; Farrag, T.A.; Balaha, H.M.; Elhosseini, M.A. Adaptive Traffic Light Management for Mobility and Accessibility in Smart Cities. Sustainability 2025, 17, 6462. [Google Scholar] [CrossRef]
  8. Si, R.; Lin, Y. Exploring the Spatiotemporal Associations Between Ride-Hailing Demand, Visual Walkability, and the Built Environment: Evidence from Chengdu, China. Sustainability 2025, 17, 5441. [Google Scholar] [CrossRef]
  9. Qiang, D.; Xiaoyi, Z.; Yi, L.; Xiqian, G.; Zhongnan, Y.; Shasha, L.; Libiao, B. Resilience optimization of bus-metro double-layer network against extreme weather events. Transp. Res. Part D Transp. Environ. 2024, 135, 104378. [Google Scholar]
  10. Feng, Z.T.; Zhang, L.; Wu, Y.H.; Hu, M.B. Dynamic partition of urban network considering congestion evolution based on random walk. Chin. Phys. B 2025, 34, 018902. [Google Scholar] [CrossRef]
  11. Gao, Y.; Meng, H.; Pei, T.; Liu, Y. Understanding Spatial Dependency Among Spatial Interactions. In International Conference on Spatial Data and Intelligence; Springer Nature: Singapore, 2024; pp. 28–43. [Google Scholar]
  12. Owais, M.; Ahmed, A.S.; Moussa, G.S.; Khalil, A.A. An Optimal Metro Design for Transit Networks in Existing Square Cities Based on Non-Demand Criterion. Sustainability 2020, 12, 9566. [Google Scholar] [CrossRef]
  13. Owais, M.; Ahmed, A.S.; Moussa, G.S.; Khalil, A.A. Integrating underground line design with existing public transportation systems to increase transit network connectivity: Case study in Greater Cairo. Expert Syst. Appl. 2021, 167, 114183. [Google Scholar] [CrossRef]
  14. Bramson, A.; Hori, M.; Zha, B.; Inamoto, H. Social and economic flows across multimodal transportation networks in the Greater Tokyo Area. Appl. Netw. Sci. 2020, 5, 7. [Google Scholar] [CrossRef]
  15. Wu, D.; Ma, L.; Yan, X. Applying and Evaluating Data-Driven Fine Grid Partitioning Methods for Traffic Analysis Zones. J. Urban Plan. Dev. 2024, 150, 04024004. [Google Scholar] [CrossRef]
  16. Min, W.; Wynter, L. Real-time road traffic prediction with spatio-temporal correlations. Transp. Res. Part C Emerg. Technol. 2011, 19, 606–616. [Google Scholar] [CrossRef]
  17. Wang, J.; Tsapakis, I.; Zhong, C. A space–time delay neural network model for travel time prediction. Eng. Appl. Artif. Intell. 2016, 52, 145–160. [Google Scholar] [CrossRef]
  18. Lu, F.; Liu, K.; Duan, Y.; Cheng, S.; Du, F. Modeling the heterogeneous traffic correlations in urban road systems using traffic-enhanced community detection approach. Phys. A Stat. Mech. Its Appl. 2018, 501, 227–237. [Google Scholar] [CrossRef]
  19. Chen, W.; Gu, Y.; Chen, X.; Cheng, L.; De Vos, J. Optimal location of free-floating bike-sharing dispatching hubs: A multi-scale perspective. J. Transp. Geogr. 2025, 127, 104264. [Google Scholar] [CrossRef]
  20. Nagy, V.; Horváth, B. Automatic Definition of Traffic Analysis Zones Based on Big Data. Appl. Sci. 2024, 14, 5964. [Google Scholar] [CrossRef]
  21. Gao, Y.; Liao, Y. Urban Tourism Traffic Analysis Zone Division Based on Floating Car Data. Promet-Traffic Transp. 2023, 35, 395–406. [Google Scholar] [CrossRef]
  22. Yang, Y.; Cao, J.; Qin, Y.; Jia, L.; Dong, H.; Zhang, A. Spatial correlation analysis of urban traffic state under a perspective of community detection. Int. J. Mod. Phys. B 2018, 32, 1850150. [Google Scholar] [CrossRef]
  23. Chen, S.; Wu, N.; Fu, H.; Wang, Y.; Qiao, Y. Urban road network partitioning based on bi-modal traffic flows with multiobjective optimization. IEEE Trans. Intell. Transp. Syst. 2022, 23, 20664–20680. [Google Scholar] [CrossRef]
  24. Javed, M.A.; Younis, M.S.; Latif, S.; Qadir, J.; Baig, A. Community detection in networks: A multidisciplinary review. J. Netw. Comput. Appl. 2018, 108, 87–111. [Google Scholar] [CrossRef]
  25. Chen, X.J.; Zhao, Y.; Kang, C.; Xing, X.; Dong, Q.; Liu, Y. Characterizing the temporally stable structure of community evolution in intra-urban origin-destination networks. Cities 2024, 150, 105033. [Google Scholar] [CrossRef]
  26. Blondel, V.D.; Guillaume, J.L.; Lambiotte, R.; Lefebvre, E. Fast unfolding of communities in large networks. J. Stat. Mech. Theory Exp. 2008, 2008, P10008. [Google Scholar] [CrossRef]
  27. Yu, Q.; Li, W.; Yang, D.; Zhang, H. Partitioning urban road network based on travel speed correlation. Int. J. Transp. Sci. Technol. 2021, 10, 97–109. [Google Scholar] [CrossRef]
  28. Dong, Q.F.; Chen, D.K.; Wang, T. Urban community structure detection based on the OD of traffic analysis zones. Mod. Phys. Lett. B 2019, 33, 1950164. [Google Scholar] [CrossRef]
  29. Petri, G.; Expert, P.; Jensen, H.J.; Polak, J.W. Entangled communities and spatial synchronization lead to criticality in urban traffic. Sci. Rep. 2013, 3, 1798. [Google Scholar] [CrossRef]
  30. Leibon, G.; Pauls, S.; Rockmore, D.; Savell, R. Topological structures in the equities market network. Proc. Natl. Acad. Sci. USA 2008, 105, 20589–20594. [Google Scholar] [CrossRef]
  31. Newman, M.E. Modularity and community structure in networks. Proc. Natl. Acad. Sci. USA 2006, 103, 8577–8582. [Google Scholar] [CrossRef]
  32. Rosvall, M.; Axelsson, D.; Bergstrom, C.T. The map equation. Eur. Phys. J. Spec. Top. 2009, 178, 13–23. [Google Scholar] [CrossRef]
  33. Konstantinos, S.; Petros, P.; Dora, S.; Aris, P. Overlapping community detection using graph attention networks. Future Gener. Comput. Syst. 2025, 163, 107529. [Google Scholar]
  34. Chen, J.; Gao, J.; Cui, B. ICS-GNN+: Lightweight interactive community search via graph neural network. VLDB J. 2023, 32, 447–467. [Google Scholar] [CrossRef]
  35. Hussein, N.A.; Mokhtar, H.M.O.; El-Sharkawi, M.E. Influential Attributed Communities via Graph Convolutional Network (InfACom-GCN). Information 2022, 13, 462. [Google Scholar] [CrossRef]
  36. Yue, Y.; Guodong, L.; Dongxu, L.; Jun, Z.; Pengwei, H.; Lun, H. Integrating Fuzzy Clustering and Graph Convolution Network to Accurately Identify Clusters from Attributed Graph. IEEE Trans. Netw. Sci. Eng. 2025, 12, 1112–1125. [Google Scholar]
  37. He, H.; Enjian, Y.; Yang, Y.; Shasha, L.; Long, P.; Yue, W. How to build vibrant communities by utilizing functional zones? A community-detection-based approach for revealing the association between land use and community vibrancy. Cities 2024, 155, 105431. [Google Scholar]
  38. Zhao, J.; Itti, L. shapeDTW: Shape dynamic time warping. Pattern Recognit. 2018, 74, 171–184. [Google Scholar] [CrossRef]
  39. Emmons, S.; Mucha, P.J. Map equation with metadata: Varying the role of attributes in community detection. Phys. Rev. E 2019, 100, 022301. [Google Scholar] [CrossRef]
  40. Macioszek, E.; Kurek, A. Road traffic distribution on public holidays and workdays on selected road transport network elements. Transp. Probl. 2021, 16, 127–138. [Google Scholar] [CrossRef]
  41. Zhao, L.; Wang, Z.; Ma, H.; Hu, G.; Guo, R. Identification of Urban Spatial Form Based on Multimode Transit Travel Features. J. Urban Plan. Dev. 2023, 149, 04023025. [Google Scholar] [CrossRef]
  42. Wang, N.; Yuen, K.F.; Gao, X.; Nie, Y. Resilience assessment of global container shipping network via port communities. Transp. Res. Part D Transp. Environ. 2025, 141, 104649. [Google Scholar] [CrossRef]
  43. Liu, M.; Liu, Y.; Wong, C.W.; Lai, K.H.; Tu, E. The impacts of geopolitics on global Liquefied Natural Gas (LNG) shipping network: Evidence from two geopolitical events. Ocean Coast. Manag. 2025, 267, 107706. [Google Scholar] [CrossRef]
  44. Chan, H.Y.; Ma, H.; Zhou, J. Resilience of socio-technical transportation systems: A demand-driven community detection in human mobility structures. Transp. Res. Part A Policy Pract. 2024, 190, 104244. [Google Scholar] [CrossRef]
  45. Huffman, D.A. A Method for the Construction of Minimum-Redundancy Codes. Proc. IRE 1952, 40, 1098–1101. [Google Scholar] [CrossRef]
  46. Shannon, C.E. A mathematical theory of communication. Bell Syst. Tech. J. 1948, 27, 379–423. [Google Scholar] [CrossRef]
  47. Zang, J.; Jiao, P.; Liu, S.; Zhang, X.; Song, G.; Yu, L. Identifying Traffic Congestion Patterns of Urban Road Network Based on Traffic Performance Index. Sustainability 2023, 15, 948. [Google Scholar] [CrossRef]
Figure 1. Framework of the methodology.
Sustainability 17 09355 g001
Figure 2. Study area.
Sustainability 17 09355 g002
Figure 3. Graph representation of the urban road network: (a) original road network; (b) primal graph representation of the road network; (c) dual graph representation of the road network. Different colors encode the correspondence between dual graph edges and primal graph nodes.
Sustainability 17 09355 g003
Figure 4. Spatial overlap patterns of the traffic data road segments and model road segments.
Sustainability 17 09355 g004
Figure 5. Huffman coding of the random walking process: (a) a random walking example; (b) recording based on a single Huffman codebook; (c) recording based on an index codebook and multiple module codebooks. Coding colors correspond to the communities along the random walk path.
Sustainability 17 09355 g005
Figure 6. Iterative generation of multi-scale hierarchical community visualization. Nodes in the same box belong to the same community, and the box color matches the communities in the right-side graph representation.
Sustainability 17 09355 g006
Figure 7. The time-varying statistical characteristics of urban road traffic: (a) proportion of slow-moving and congested road segments; (b) average speed of the road network.
Sustainability 17 09355 g007
Figure 8. Spatial distribution of congested roads in Chengdu on 30 May 2025: (a) the distribution of congested roads at 9 a.m.; (b) the distribution of congested roads at 6 p.m.
Sustainability 17 09355 g008
Figure 9. Multi-scale community detection results. Large-scale community structures emerge through hierarchical aggregation of small-scale communities.
Sustainability 17 09355 g009
Figure 10. The community detection results derived from single-day data: (a) Friday communities; (b) Saturday communities; (c) a detailed comparison of the local communities within the red-box area on Friday and Saturday; (d) local communities within the red-box area on other days.
Sustainability 17 09355 g010
Figure 11. Comparison of the similarities between community detection results across different methods.
Sustainability 17 09355 g011
Figure 12. Spatial autocorrelation assessment based on Moran’s I. The p-values of Moran’s I for all time periods are less than 0.05.
Sustainability 17 09355 g012
Figure 13. The trend in the average Moran’s I based on communities at different scales varying with the adjacency threshold: (a) the result for large-scale community level 1; (b) the result for medium-scale community level 2; (c) the result for small-scale community level 3.
Sustainability 17 09355 g013
Figure 14. The trend of the average Moran’s I value based on communities of different DTW weigh: (a) the result for large-scale community level 1; (b) the result for medium-scale community level 2; (c) the result for small-scale community level 3. The box plot displays the median, quartiles, and data range. Circles represent outliers, defined as data points located outside of 1.5 times the interquartile range (IQR) from the quartiles.
Sustainability 17 09355 g014
Table 1. The similarities between community detection results in community level 1.
Weighting TypeAverage ARIAverage NMIAverage AMI
No Weight0.6260.8970.766
One-Week data0.9730.9970.985
Monday data0.9820.9980.990
Tuesday data0.9900.9990.994
Wednesday data0.9810.9980.989
Thursday data0.9820.9980.991
Friday data0.9850.9980.991
Saturday data0.9780.9970.988
Sunday data0.9760.9970.986
Table 2. The similarities between community detection results in community level 2.
Weighting TypeAverage ARIAverage NMIAverage AMI
No Weight0.4440.8490.726
One-Week data0.8290.9830.937
Monday data0.9500.9950.977
Tuesday data0.9770.9970.988
Wednesday data0.9630.9960.982
Thursday data0.9810.9980.990
Friday data0.9600.9950.980
Saturday data0.9390.9940.974
Sunday data0.9410.9940.972
Table 3. The similarities between community detection results in community level 3.
Weighting TypeAverage ARIAverage NMIAverage AMI
No Weight0.5160.7370.713
One-Week data0.7060.9240.854
Monday data0.7310.9640.889
Tuesday data0.8580.9790.941
Wednesday data0.7580.9720.908
Thursday data0.9610.9960.982
Friday data0.8450.9780.935
Saturday data0.7900.9680.910
Sunday data0.7620.9610.900
Table 4. The average improvement rate of Moran’s I relative to the distance-based methods.
MethodsScalesm = 1m = 2m = 3m = 4p
Proposed MethodLevel = 131.61%62.74%78.78%93.51%all < 0.001
Level = 271.05%146.34%193.20%241.95%all < 0.001
Level = 388.58%189.49%255.37%326.55%all < 0.001
Pearson WeightingLevel = 10.94%1.47%0.92%2.89%all < 0.001
Level = 26.14%17.68%29.48%48.38%all < 0.001
Level = 314.08%42.11%69.01%103.48%all < 0.001
Topological CommunitiesLevel = 1−1.08%−0.47%0.15%2.42%all < 0.001
Level = 2−1.94%1.01%6.99%12.98%all < 0.001
Level = 30.48%19.19%45.31%73.63%all < 0.001
Table 5. The influence of time window radius parameter R on DTW.
Data LengthConstrainedCost Time (Seconds)Improvement RateSimilarity ResultsMAD Results
One-day traffic dataNone constrained1.48---
R = 0.200.5463.51%0.99549.34
R = 0.150.4470.27%0.994111.90
R = 0.100.3377.70%0.992215.66
R = 0.050.2285.14%0.989521.76
Full-week traffic dataNone constrained71.74---
R = 0.2026.1263.59%0.996027.61
R = 0.1520.4871.45%0.994440.32
R = 0.1013.7280.88%0.991560.44
R = 0.057.4689.60%0.9875108.48
Disclaimer/Publisher’s Note: The statements, opinions and data contained in all publications are solely those of the individual author(s) and contributor(s) and not of MDPI and/or the editor(s). MDPI and/or the editor(s) disclaim responsibility for any injury to people or property resulting from any ideas, methods, instructions or products referred to in the content.