Article

Shear Behavior of Curved Concrete Structures Repaired with Sustainability-Oriented Trenchless Polymer Grouting

1
School of Water Conservancy and Transportation, Zhengzhou University, Zhengzhou 450001, China
2
Yellow River Laboratory (Henan), Zhengzhou 450018, China
*
Author to whom correspondence should be addressed.
Sustainability 2025, 17(20), 9340; https://doi.org/10.3390/su17209340
Submission received: 23 September 2025 / Revised: 14 October 2025 / Accepted: 16 October 2025 / Published: 21 October 2025

Abstract

Urban underground infrastructure is increasingly challenged by material aging, environmental degradation, and structural deterioration. In response, trenchless polymer grouting technologies employing sustainability-oriented two-component foaming polymers have attracted growing attention. To investigate shear behavior at the polymer–concrete interface, this study conducted direct shear tests on two types of composite interface geometries—curved and planar—formed by bonding two-component foaming polymer to concrete substrates. Five polymer densities (0.33, 0.42, 0.51, 0.58, 0.66 g/cm3), three concrete strengths (C20, C30, C40), three normal stress levels (0.3, 1.0, 2.0 MPa), three shear rates (0.5, 2.0, 5.0 mm/min), and three interface sizes (100, 150, 200 mm) were examined. The results show that both interface types undergo five characteristic stages under shear. Across identical parameter levels, curved interfaces consistently exhibited higher peak shear strength and larger peak displacement than planar ones. When the polymer density is identical, the peak shear strength and displacement of curved specimens are about 1.38 and 1.43 times those of planar specimens, respectively. Similarly, for specimens with the same concrete strength, normal stress, and shear rate, the corresponding ratios of peak shear strength and displacement are about 1.14 and 1.55, 1.96 and 1.43, and 1.43 and 1.36, respectively. Within the tested ranges, the shear stress increases with polymer density, concrete strength, and normal stress, and generally decreases with shear rate. The shear displacement decreases with polymer density, concrete strength, and shear rate, and generally increases with normal stress. As the specimen size increases, the peak shear strength and peak shear displacement of the curved specimens first increase and then decrease, whereas for the planar specimens, the peak shear strength exhibits a nonlinear increasing trend. These findings provide valuable insights to promote sustainable underground infrastructure rehabilitation.

1. Introduction

With rapid urbanization, the development of robust and sustainable urban infrastructure is crucial for ensuring long-term functionality and resilience. Among the various civil engineering structures, concrete components play a vital role in supporting essential urban functions, such as water distribution, transportation, and municipal services. However, these underground structures are subject to degradation caused by factors like soil erosion, water infiltration, and the effects of environmental and mechanical loading [1,2]. Over time, these structures develop defects such as voids, settlements, and cracks, which can compromise their stability, functionality, and safety [3].
Traditional repair methods often require disruptive excavation, resulting in high environmental costs, extended repair timelines, and social inconveniences [4]. In contrast, trenchless rehabilitation technologies, which minimize surface disruption, are increasingly recognized as a sustainable alternative to conventional repair methods [5,6]. One such approach is the use of two-component foaming polymer, a versatile material known for its excellent waterproofing properties, rapid curing times, and environmental friendliness [7,8,9,10]. This polymer-based grout has emerged as an effective solution for rehabilitating underground concrete structures, offering the potential for long-term durability and minimal disruption during repair.
The shear behavior between polymer and concrete at the interface is a crucial factor influencing the overall durability and structural integrity of these rehabilitated structures. Shear failure at this interface can significantly impair the load-bearing synergy between polymer and concrete, thereby compromising the structural integrity and service life of the rehabilitated infrastructure [11]. Therefore, understanding the shear behavior at this interface and identifying the key influencing factors are essential for advancing the fundamental theory of polymer-based repair techniques. Previous studies have demonstrated that parameters such as normal stress, material density, concrete strength, and shear rate critically influence interfacial shear performance. Wang et al. [12] examined how normal stress and shear rate influence the shear response at the polymer–concrete interface. Their findings showed that increasing vertical stress progressively enhanced the average peak shear stress, whereas a higher shear rate slightly reduced it. Qin et al. [13] conducted shear experiments on polymer–concrete composites with different surface roughness levels and polymer densities. It was found that when the polymer density exceeded 0.15 g/cm3, the interfacial bond strength increased significantly with increasing polymer density. Zhang et al. [14] investigated specimens with and without rubber pads under varying normal loads, finding that while post-peak shear strength remained relatively constant in bare concrete specimens, the presence of rubber significantly reduced shear strength. Li et al. [15], using direct shear tests and finite element simulations, demonstrated that interfacial bonding strength increases linearly with polymer density and decreases in peak displacement, especially under low-density conditions and varying normal stresses. Fang et al. [16] studied how polymer density, concrete strength, and moisture content affect the interfacial microstructure and failure behavior. They observed that a larger injection volume promotes deeper polymer penetration into surface pores, while higher moisture content suppresses infiltration and weakens bonding efficiency. Chen et al. [17] examined the influence of surface roughness on the soil–concrete interface via direct shear tests, revealing that shear strength rises with increasing surface roughness. Zhang et al. [18] found that both polymer density and ambient temperature positively influence bond strength, while elevated moisture content reduces it; additionally, surface roughness plays a crucial role under equivalent conditions. Wang et al. [19] further reported that average peak shear stress, shear strength, and shear modulus increase linearly with normal stress, but decrease with increasing shear rate and loading cycles. Li et al. [20] investigated the effects of curing temperature, moisture saturation of concrete, and surface roughness on the shear and splitting tensile strengths at the interface between polymer mortar and concrete. The results indicated that the interfacial bond strength increased gradually with rising curing temperature. However, it decreased with increasing moisture saturation of the concrete.
In practical engineering applications, concrete structures repaired with two-component foaming polymers may exhibit various interfacial geometries, such as those found in pipelines, piles, and tunnel linings. However, existing studies have predominantly focused on the interfacial characteristics between polymers and planar concrete structures, while research on non-planar interfaces remains limited. Wang et al. [21] suggested that future evaluations of bonding performance should extend beyond planar interfaces to encompass more complex configurations commonly encountered in practice. Therefore, investigating the interfacial behavior between polymers and non-planar concrete structures holds significant importance for guiding the repair design and practical application of polymer-based rehabilitation technologies.
To address these limitations, this study investigated the shear behavior of both planar and curved concrete structures rehabilitated with two-component foamed polymer through direct shear testing. The influences of polymer density, concrete strength, normal stress level, shear rate, and specimen size on the interfacial shear response were systematically examined. Trenchless polymer grouting is applied across diverse concrete systems that experience highly heterogeneous service environments and loading histories. To avoid confounding the effects of environmental and construction variables, the present study deliberately refrains from defining a specific field scenario and instead establishes a scenario-agnostic baseline for the monotonic interfacial shear behavior of curved polyurethane–concrete composites.

2. Shear Tests on Composite Specimens

2.1. Polymer

The polyurethane grouting material used in this study is a two-component, non-water reactive foamed system supplied by Wanhua Chemical Group Co., Ltd. (Yantai, China). It consists of two prepolymer liquids: Component A (isocyanate and polyisocyanate) and Component B (polyol and additives). These are mixed at a 1:1 ratio to initiate a polymerization reaction, primarily involving the formation of a polymer through the reaction of isocyanate groups with hydroxyl groups in polyols. The reaction produces a segmented copolymer with recurring urethane bonds. When a physical blowing agent is introduced, the heat generated by the exothermic polymerization causes rapid vaporization of the agent, resulting in the formation of numerous closed-cell microbubbles dispersed within the slurry. This foaming process enhances slurry volume and flowability, ultimately yielding a solidified foam structure, as illustrated in Figure 1.
The compositional analysis of the leachate from the polymer grouting material after water immersion revealed that no polymer components were detected in the leachate. This demonstrates that the solidified polyurethane grouting material does not undergo degradation or decay even after prolonged exposure to water. Furthermore, a comparative analysis between the water quality test results of the polymer immersion solution and the standards for drinking water hygiene indicates that the polymer material does not cause water pollution. These findings suggest that the long-term subsurface application of polymer grouting materials poses no environmental risk [7]. In typical subgrade environments containing saline, acidic, or detergent-based aqueous solutions, polymer materials exhibit excellent stability. Although strong acids and alkalis can cause chemical degradation [22], the likelihood of encountering such agents in engineering applications is extremely low. Therefore, the stability of polymer materials is not compromised by the chemical corrosiveness normally present in subgrade conditions. Regarding aging resistance, although polyurethane specimens buried underground for one and three years showed slight discoloration, their structure remained unchanged, with no signs of mold or decay. Their mass and compressive strength also remained constant, demonstrating the material’s long-term stability and durability under adverse environmental conditions [7].

2.2. Concrete Specimens

Concrete specimens were fabricated following the Standard for Test Methods of Concrete Physical and Mechanical Properties (GB/T 50081-2019) [23]. The mixture consisted of P·O 42.5 Portland cement, Zone II medium sand (0–5 mm), water, a high-performance water-reducing agent, and coarse aggregates (5–20 mm). The cement was supplied by Fushun Aosaier Cement Co., Ltd.; the river sand was obtained from the Zhongyuan Road West Fourth Ring Sand Plant in Zhengzhou; the coarse aggregates were sourced from the Zhongyuan Road West Fourth Ring Gravel Plant in Zhengzhou; and the KTPCA polycarboxylate-based high-performance water reducer was provided by Shanxi Kanteer Fine Chemical Co., Ltd. (Yuncheng, China). Specimens were designed to achieve compressive strengths of C20, C30, and C40. The specific mix proportions are presented in Table 1.
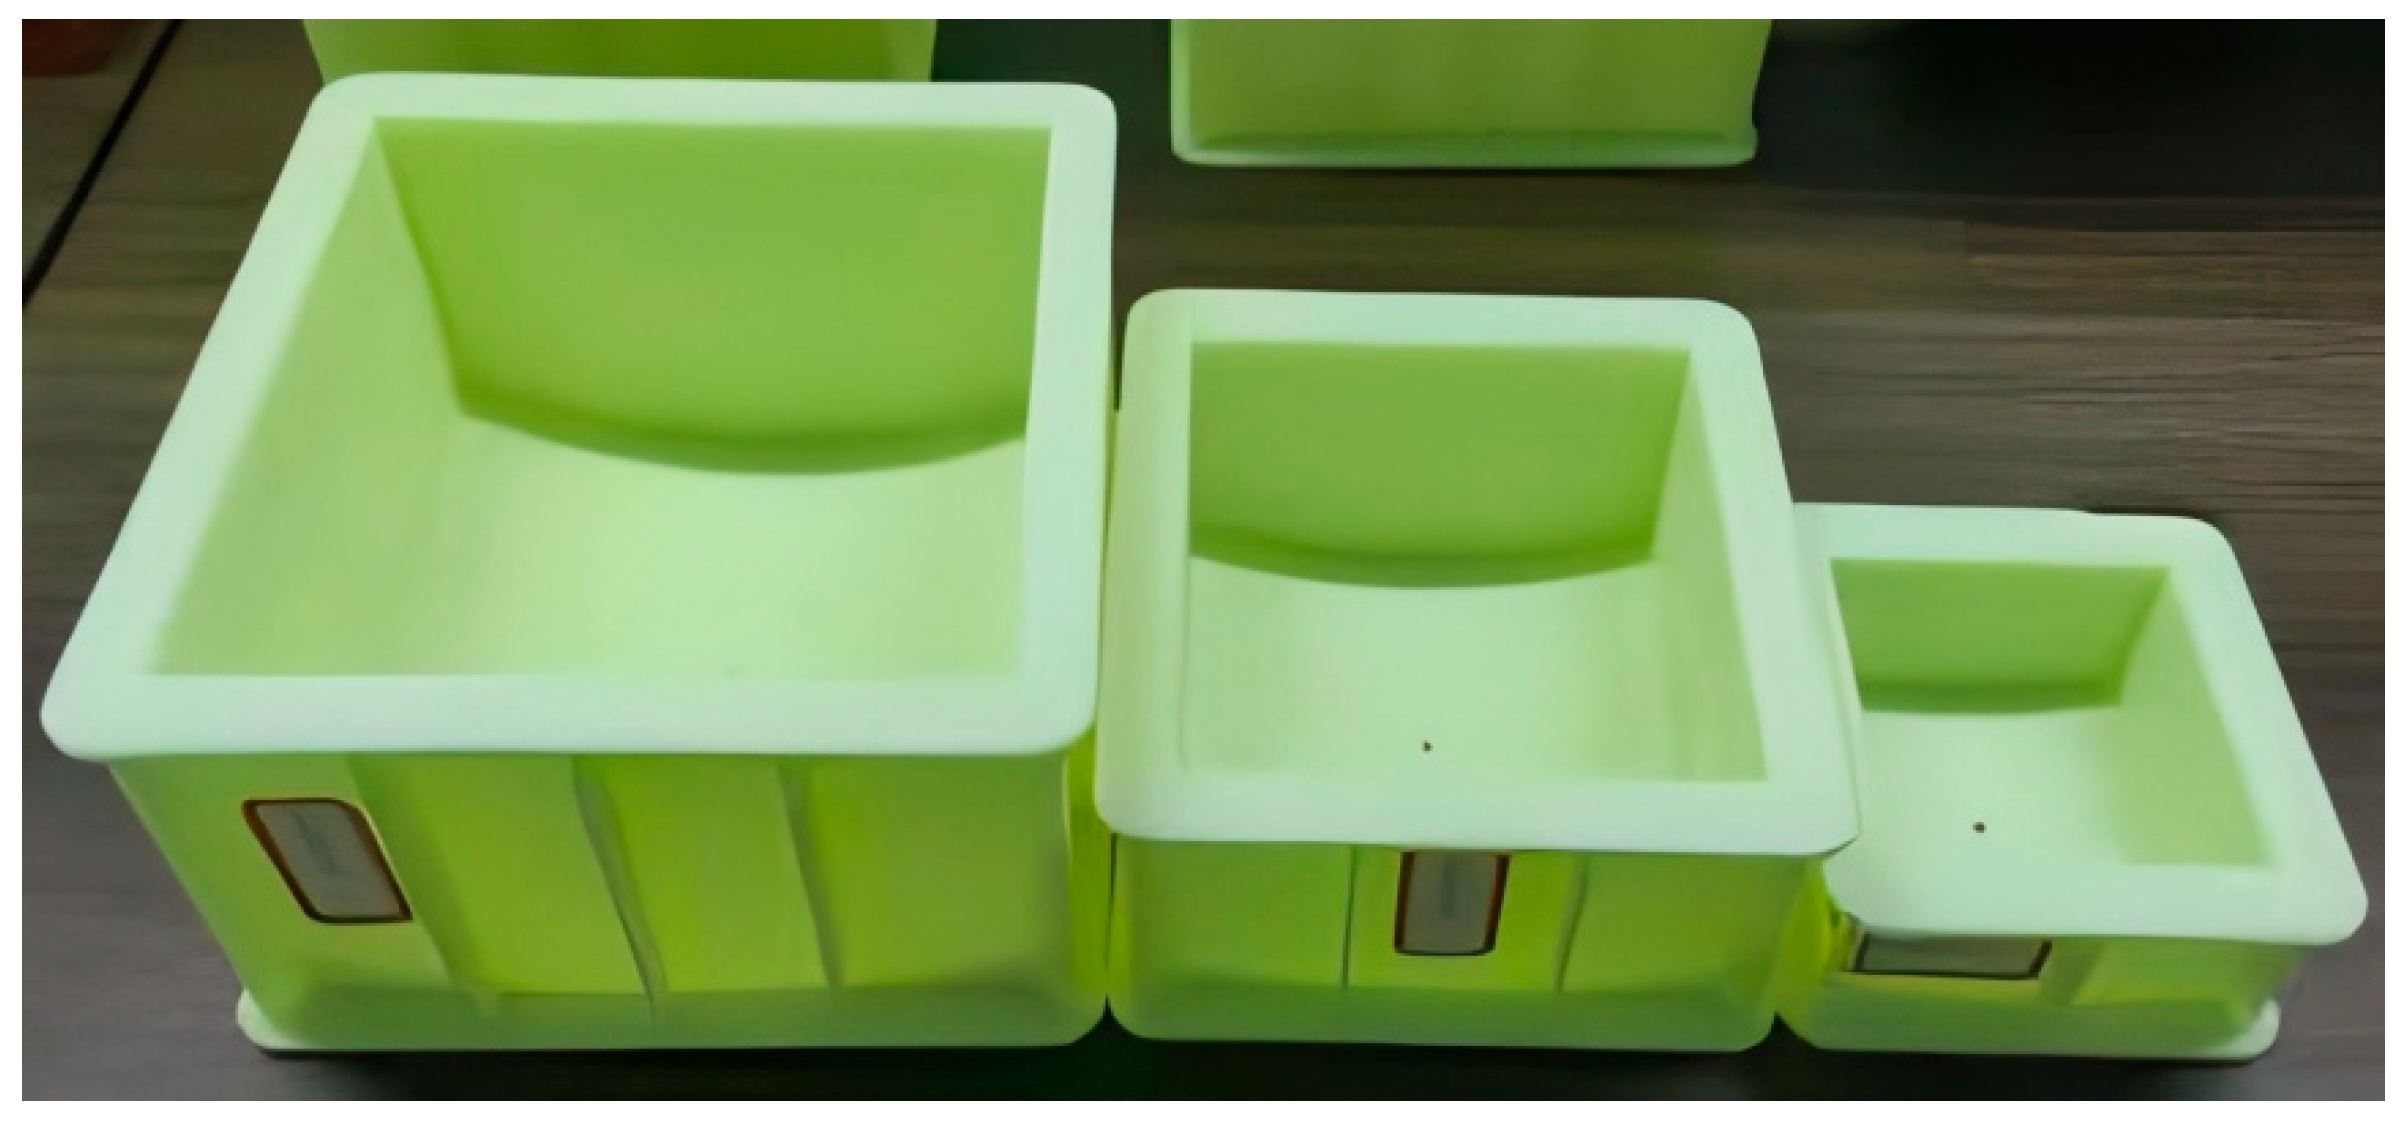
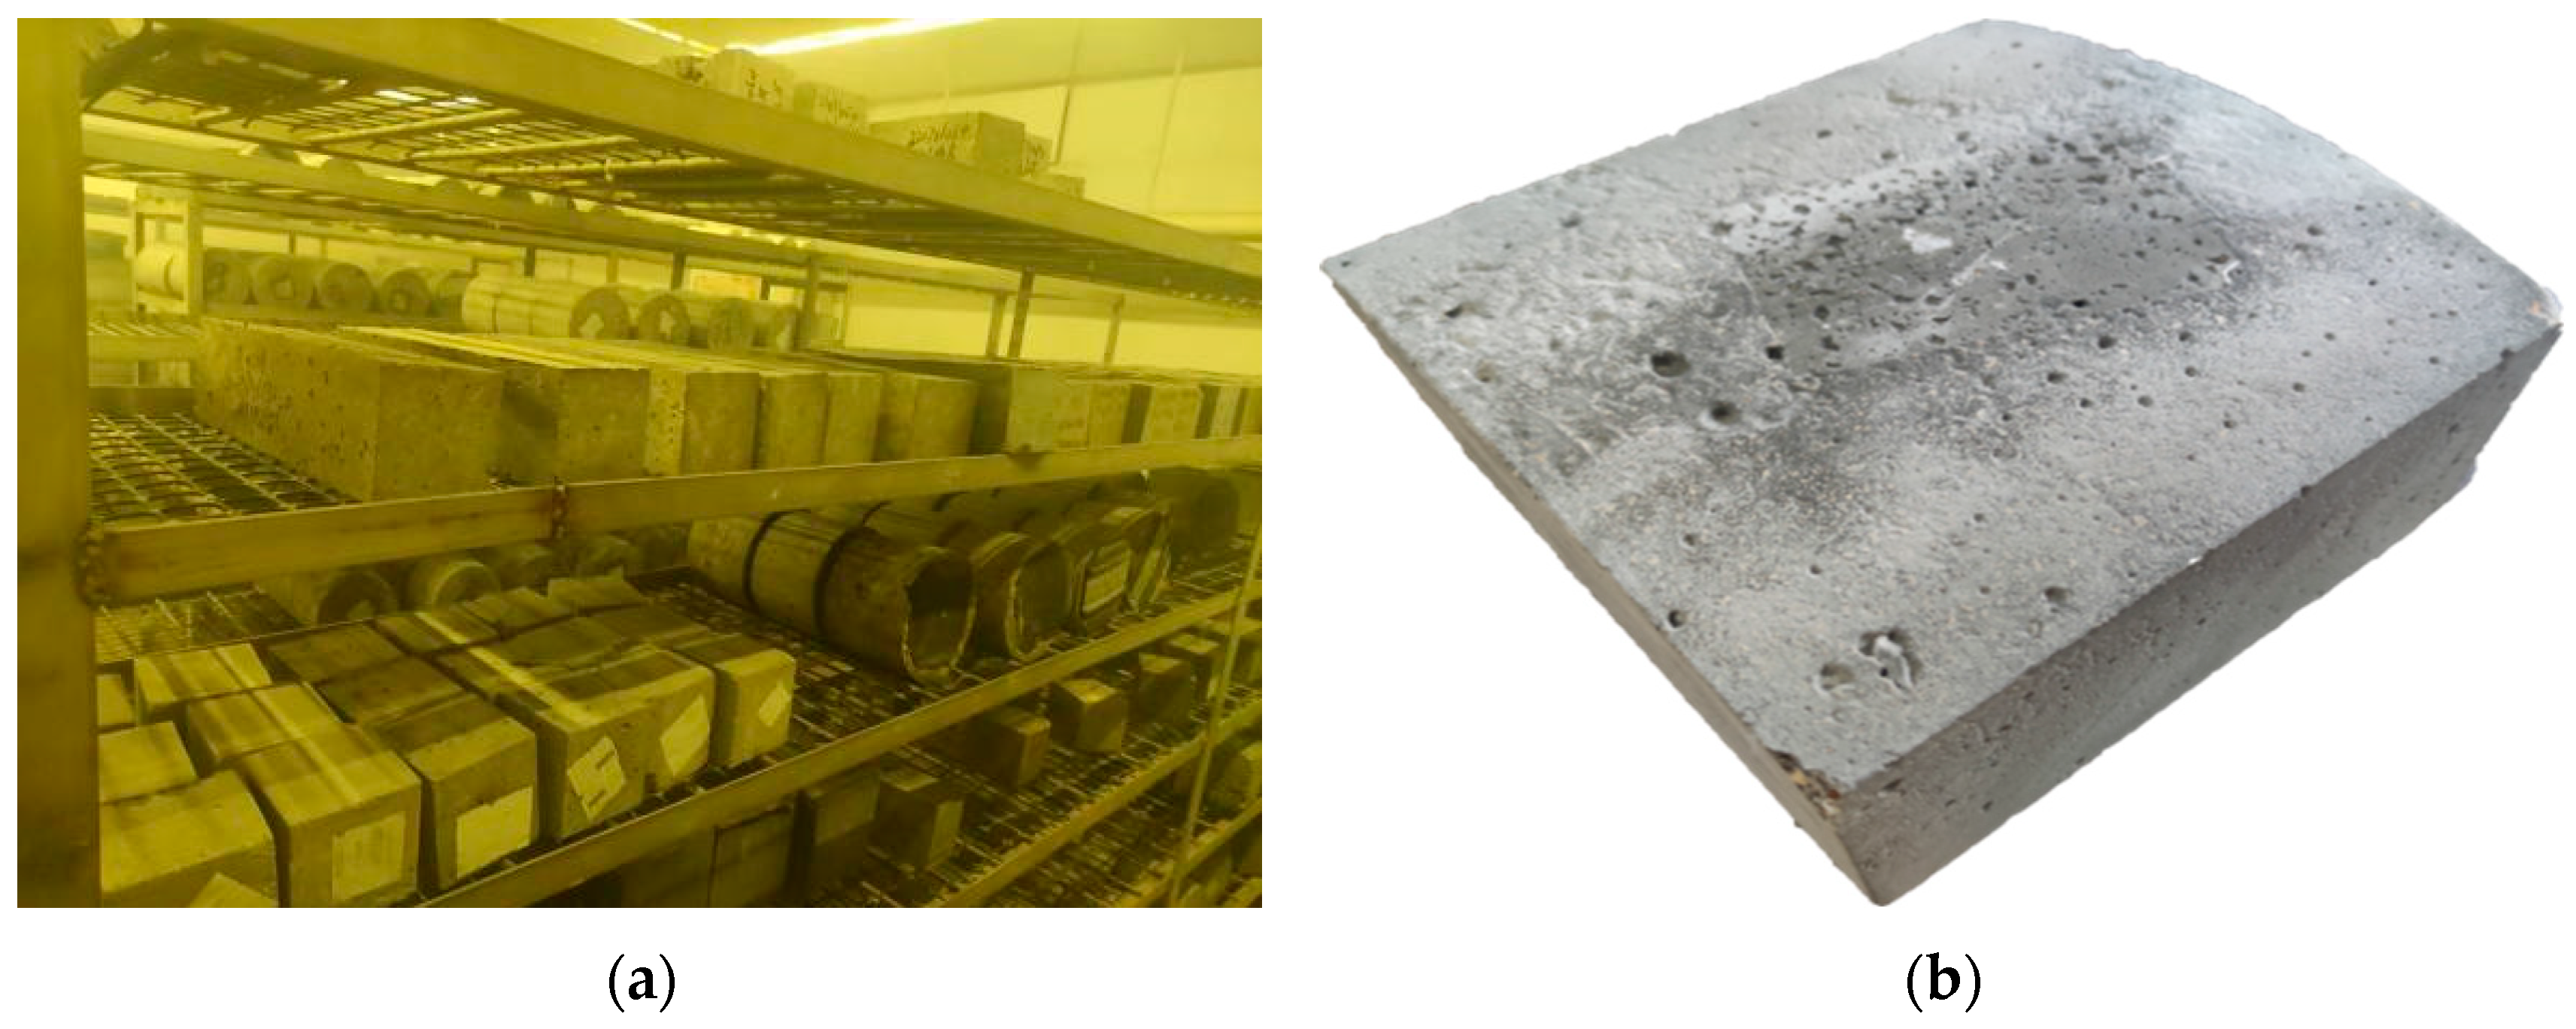
Following the standard Vibration Table for Concrete Test (JG/T 245-2009) [24], the vibration frequency of the vibration table during concrete casting was set to 50 Hz ± 2 Hz, and the vertical amplitude at the center of the table under no-load conditions was maintained at 0.5 mm ± 0.02 mm. Curved concrete molds were fabricated using 3D printing technology, with dimensional tolerances controlled within 0.3%, ensuring high geometric precision, as shown in Figure 2. Prior to casting, a uniform layer of mineral oil was applied to the inner walls of the mold to facilitate demolding. The freshly mixed concrete was poured into the mold in a single operation, and the periphery of the mold was compacted using a trowel to ensure proper filling, with the concrete slightly exceeding the top edge of the mold. After vibration compaction, the excess concrete was removed and the surface leveled with a trowel. A plastic film was then used to cover the top surface to maintain surface moisture [25]. After casting and demolding, all concrete specimens were kept under standard moist-curing conditions in a curing room at (20 ± 2) °C and relative humidity ≥ 95%. No environmental cycling was applied; curing conditions were maintained consistently across all groups to minimize confounding effects. The curing environment and final curved concrete specimens are illustrated in Figure 3.

2.3. Preparation of Composite Specimens

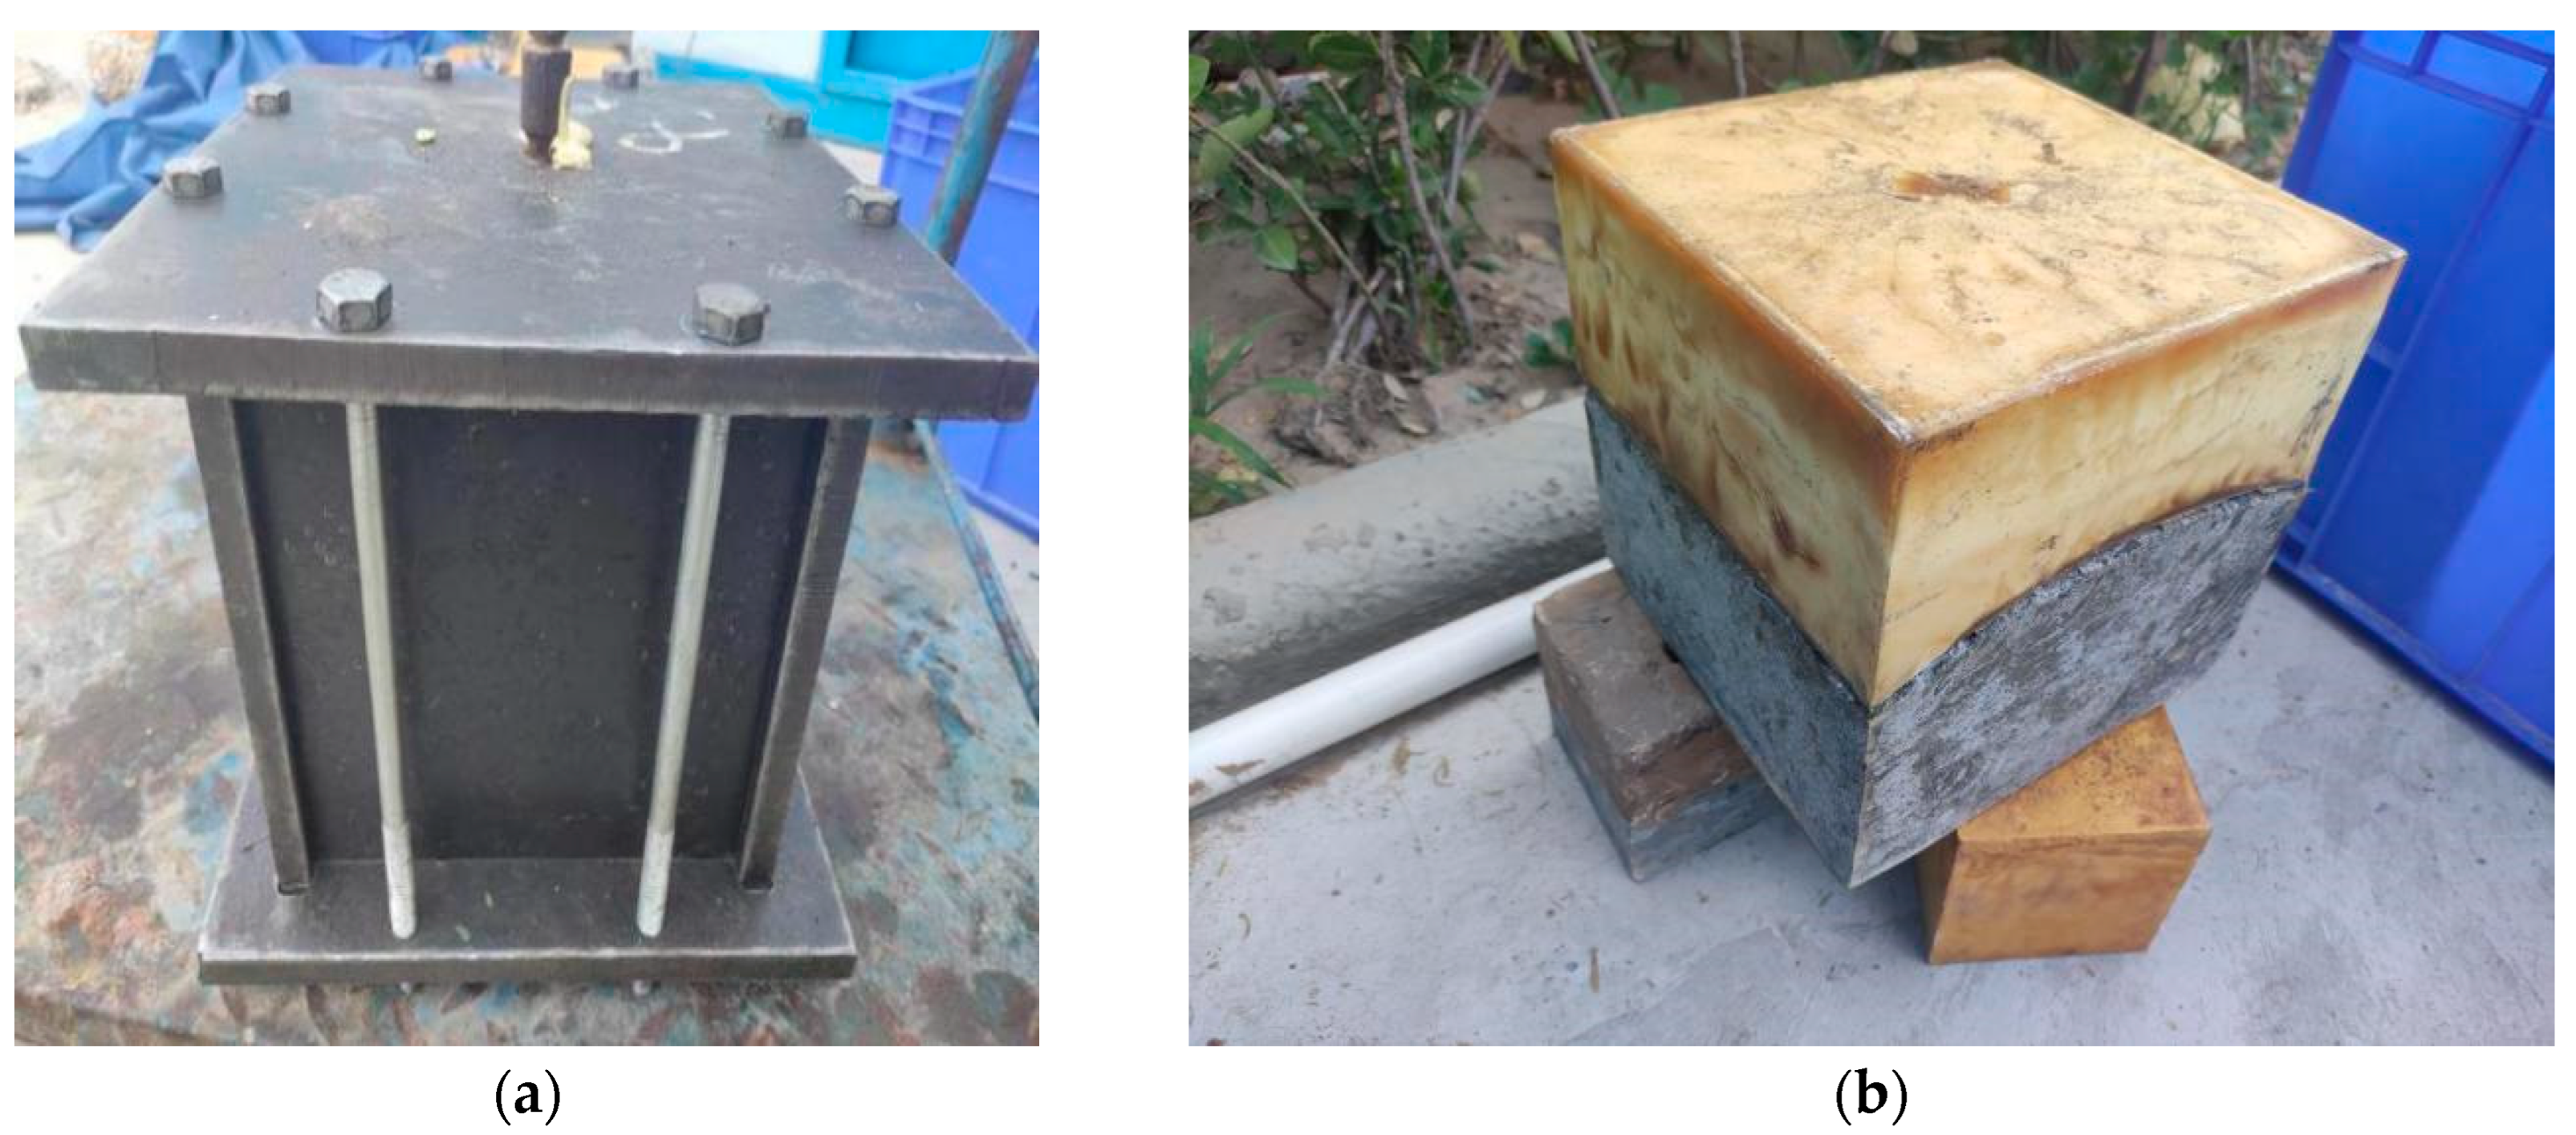
The concrete–polymer composite specimens were fabricated using steel molds assembled from six detachable plates, available in three nominal sizes: 100 mm, 150 mm, and 200 mm. The two-component polymer—preheated to 95 °C and mixed at a 1:1 volume ratio—was injected into the molds containing the concrete specimens using an air-compression grouting device under laboratory ambient conditions (approximately 20–25 °C, with uncontrolled humidity). The polymer material reached its final strength after curing for approximately 15 min. The top plate was equipped with a threaded injection port and a 2.0 mm diameter exhaust hole. During the injection process, the mixed prepolymers were introduced into the steel mold under pressure through the injection port, while the internal air was expelled through the exhaust hole as the reaction proceeded. The exothermic polymerization reaction quickly increased the temperature inside the mold, leading to volumetric expansion of the prepolymer and the displacement of residual air. The configuration of the mold and the resulting specimens are presented in Figure 4.

2.4. Experimental Setup

The direct shear tests were performed using a microcomputer-controlled triaxial servo testing machine for rock mechanics. The equipment features vertical and horizontal loading systems and is equipped with a German EDC full-digital servo controller and sensors, capable of automatically recording force, displacement, and deformation data during testing. The maximum axial load is 2000 kN, the maximum shear load is 100 kN, and the maximum displacement is 100 mm, with an overall testing precision within ±1%.
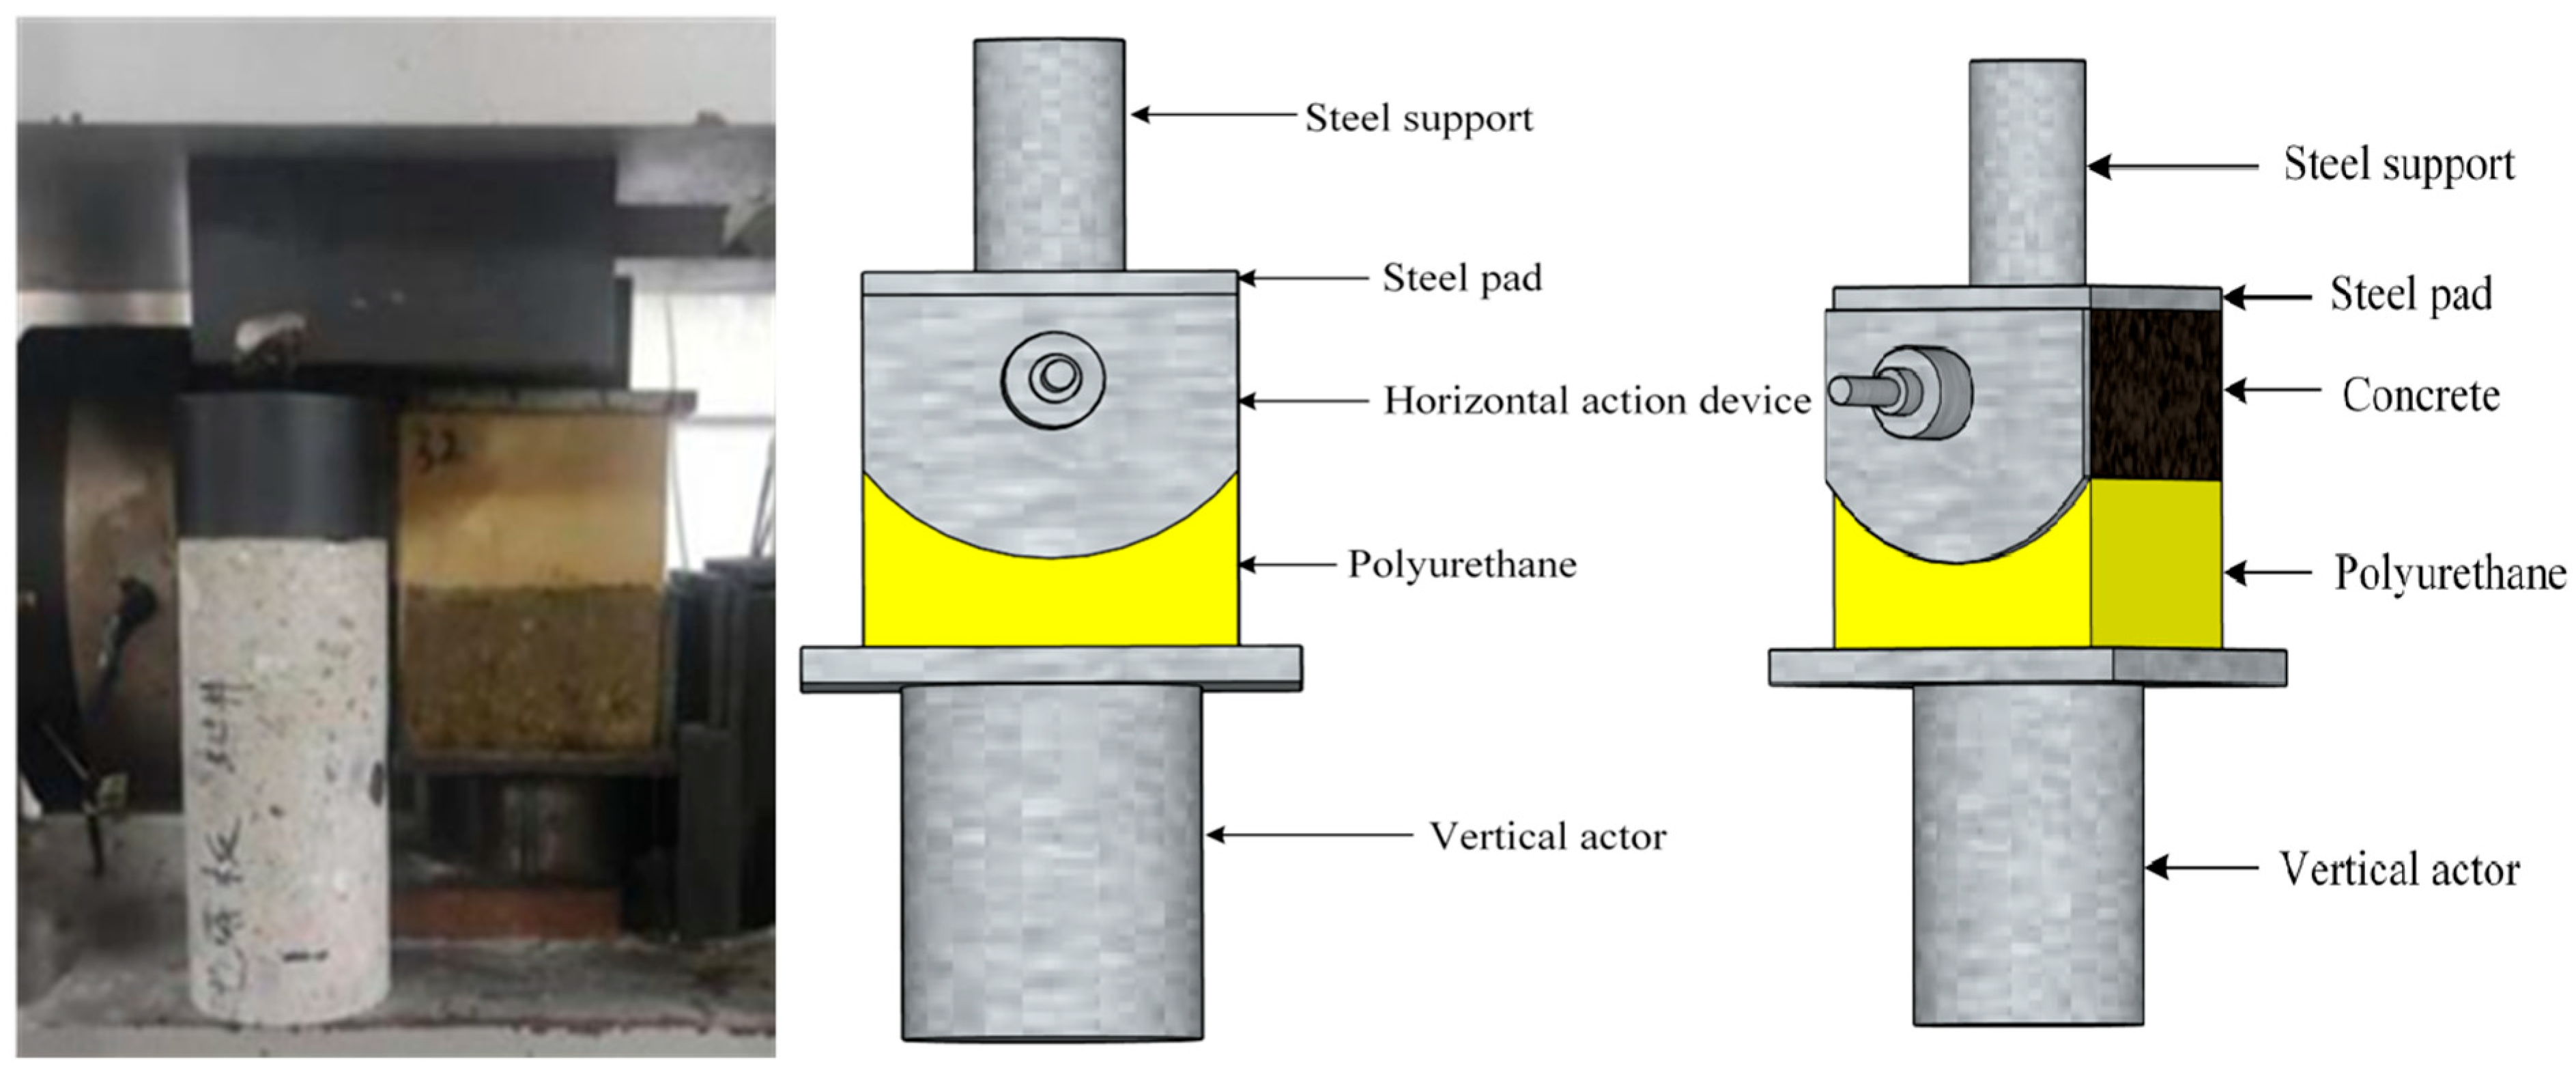
During testing, a normal load was first applied at a rate of 1.0 mm/min until the target normal stress level was reached. The horizontal loading head was then advanced to contact the specimen without applying load. At this point, all sensors were zeroed. Shear loading was subsequently applied at a constant rate of 2.0 mm/min until failure occurred [26,27,28]. It was observed that shear failure at the curved concrete–polymer interface mainly occurs within 15 mm of shear displacement. Therefore, a shear displacement of 15 mm was considered the failure criterion, and the maximum shear force and corresponding displacement were recorded. The shear testing setup is illustrated in Figure 5.

2.5. Experimental Condition Design

To compare the similarities and differences in the shear performance of curved and planar composite interfaces, polymer density, concrete strength, normal stress level, shear rate, and specimen size were selected for investigation. Based on the commonly adopted densities of polymer grouting materials in engineering applications, five polymer densities were selected: 0.33 g/cm3, 0.42 g/cm3, 0.51 g/cm3, 0.58 g/cm3, and 0.66 g/cm3 [6,29]. Concrete strengths of C20, C30, and C40 were chosen to represent a range of commonly used grades in practical engineering applications [15]. To account for the diversity of normal loading conditions in various structural contexts, three levels of normal stress were set: 0.3 MPa, 1.0 MPa, and 2.0 MPa [19,30]. Additionally, to simulate the variability in shear loading rates under different structural conditions, shear rates of 0.5 mm/min, 2.0 mm/min, and 5.0 mm/min were applied [15,19,31]. The standard test condition involved a curved interface with a diameter of 500 mm, specimen size of 150 mm, polymer density of 0.33 g/cm3, concrete strength grade of C30, normal stress of 1.0 MPa, and a shear rate of 2.0 mm/min. Each experimental condition was repeated three times to ensure data reliability and repeatability. The detailed test matrix is presented in Table 2. The test matrix was designed to provide trend-level insights that are common to multiple trenchless repair contexts, while deliberately excluding environmental conditioning and cyclic loading to prevent confounding.

3. Results and Discussion

3.1. Typical Shear Stress–Displacement Curves for Curved and Planar Composites

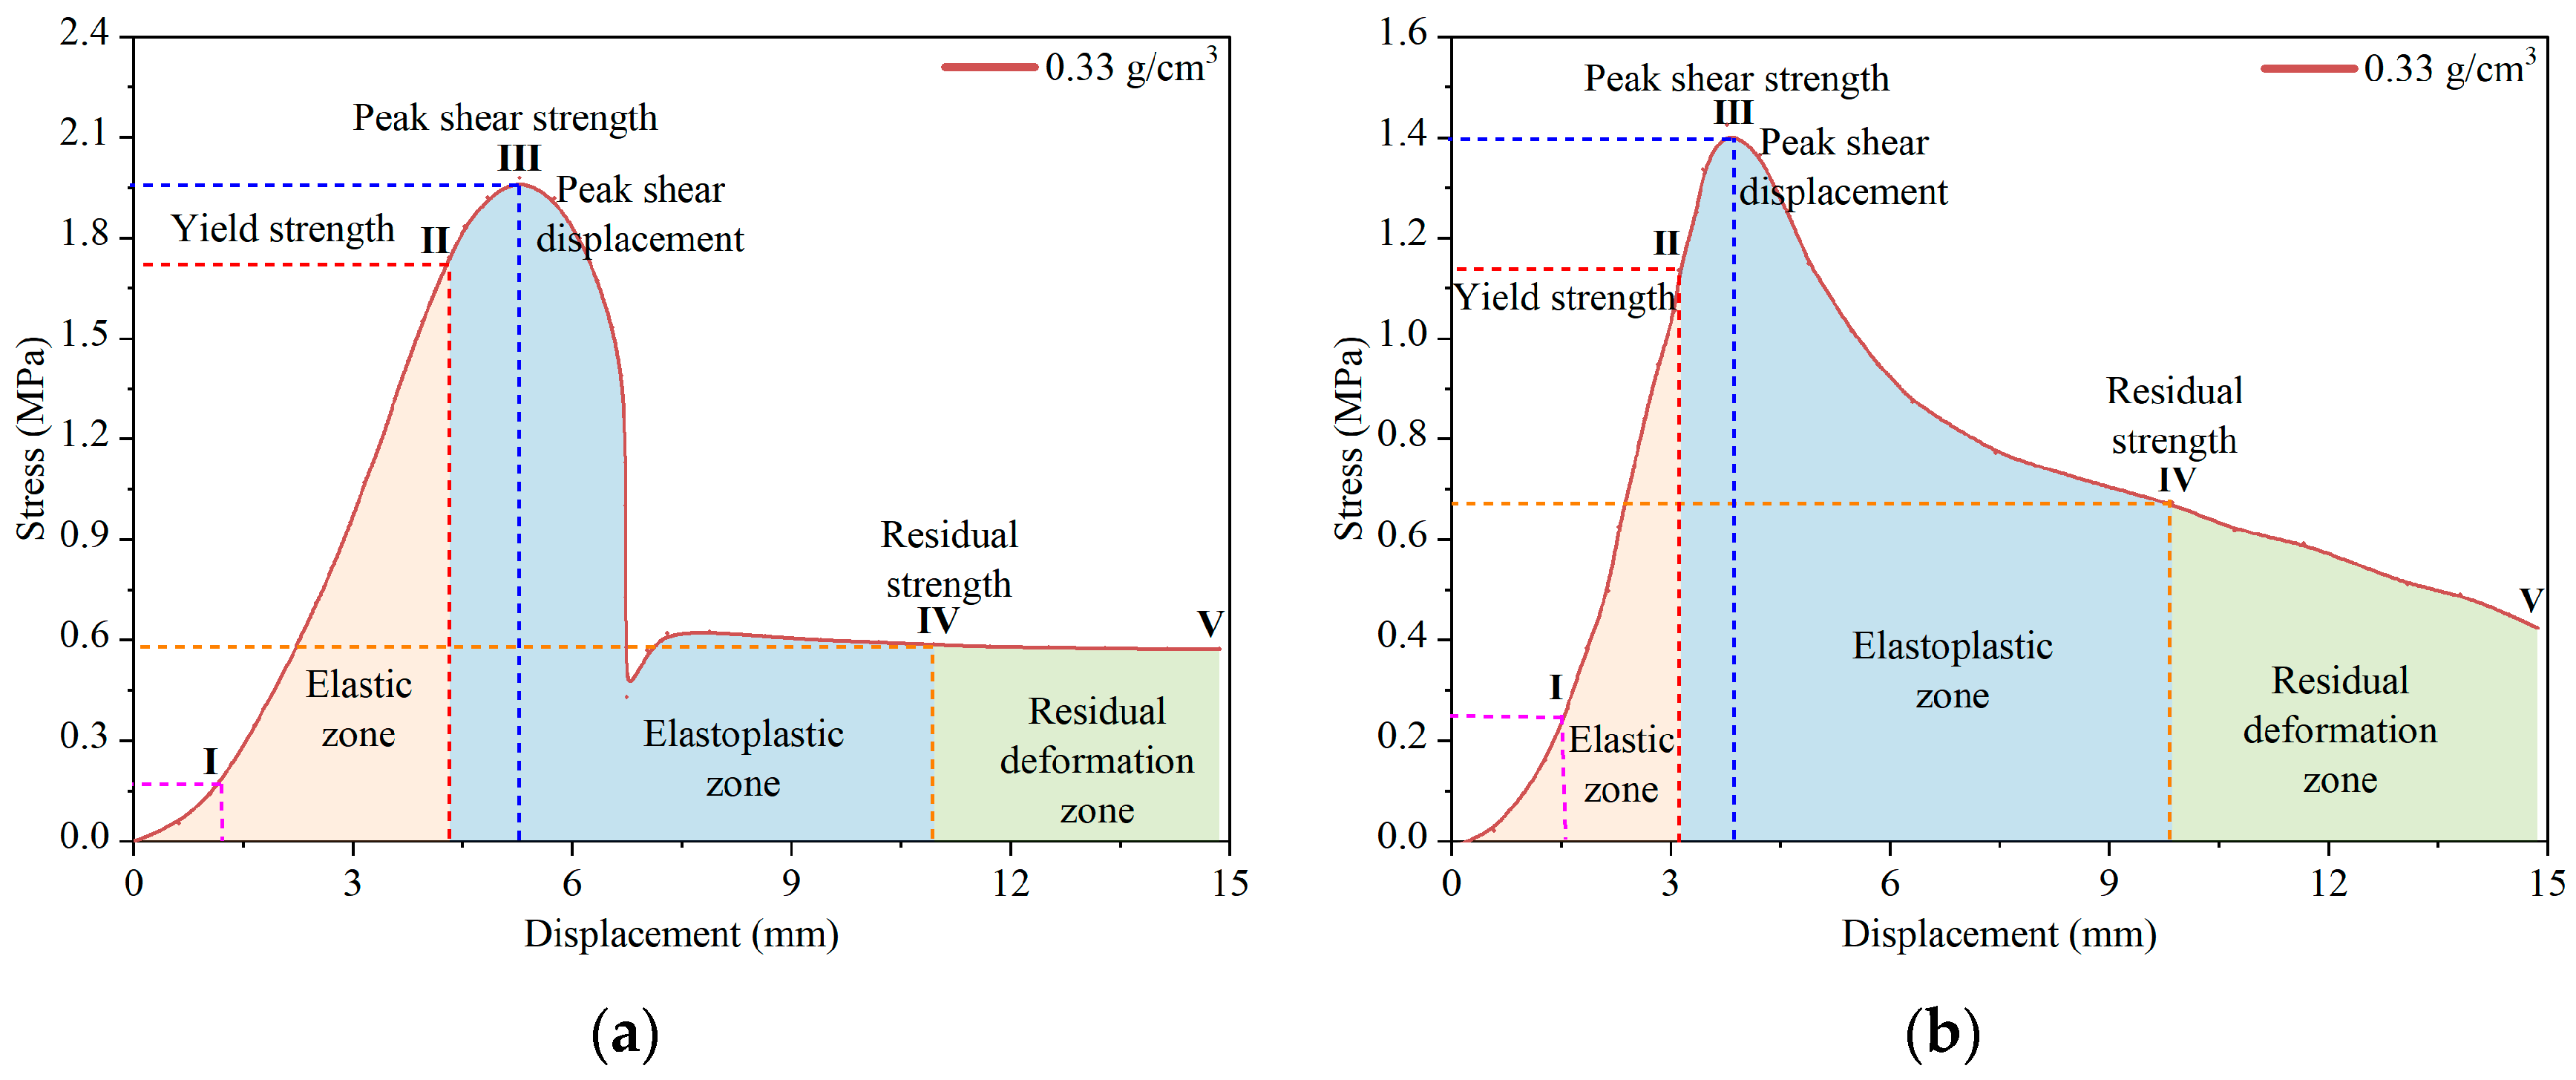
Figure 6 presents the typical shear stress–displacement curves for composite specimens with curved and planar interfaces, tested under standard conditions with a polymer density of 0.33 g/cm3. The results indicate that, regardless of interface geometry, the composite specimens underwent five distinct stages under shear loading: the initial slow growth stage (0–I), the linear elastic stage (I–II), the strain-hardening stage (II–III), the fracture stage (III–IV), and the residual deformation stage (IV–V). However, significant differences in mechanical response were observed across these stages due to variations in interface geometry.
For specimens with curved interfaces, the displacement range corresponding to the initial slow growth stage (0–I) was markedly smaller than that of the planar specimens, suggesting a more rapid transition into the linear elastic region. This behavior is primarily attributed to the densification of the polymer foam cell structure under shear loads, which enhances the overall stiffness. Additionally, the prestress distribution and curvature-induced bending effects in the curved geometry intensify local compaction, thereby triggering an earlier onset of linear growth behavior. Upon entering the linear elastic stage (I–II), both curved and planar specimens displayed a well-defined linear relationship between shear stress and displacement. Nevertheless, the displacement range of the linear response was broader for the curved specimens, reflecting their higher strain accommodation capacity in this stage. At the peak point (III), both types of specimens reached their maximum shear strength before transitioning into the failure stage (III–IV), which revealed the most pronounced differences between the two geometries. Specimens with curved interfaces exhibited a steep drop in shear stress following the peak, indicating a brittle failure mode characterized by sudden interface instability and rapid failure. In contrast, the planar specimens showed a more gradual decrease in shear stress with displacement, indicative of a more ductile softening behavior. This discrepancy primarily results from stress concentration and localized debonding that are more likely to occur along curved interfaces during loading, leading to abrupt degradation of interfacial mechanical performance. Conversely, stress distribution along planar interfaces tends to be more uniform, promoting a more stable crack propagation path and a slower debonding process. In the residual deformation stage (IV–V), the shear stress in both types of specimens stabilized, and the residual strength remained at a certain level. This suggests that despite interfacial failure, the polymer foam retained a degree of structural integrity, thereby continuing to provide basic shear load-bearing capacity.

3.2. Experimental Parameter Analysis

3.2.1. Effect of Polymer Density

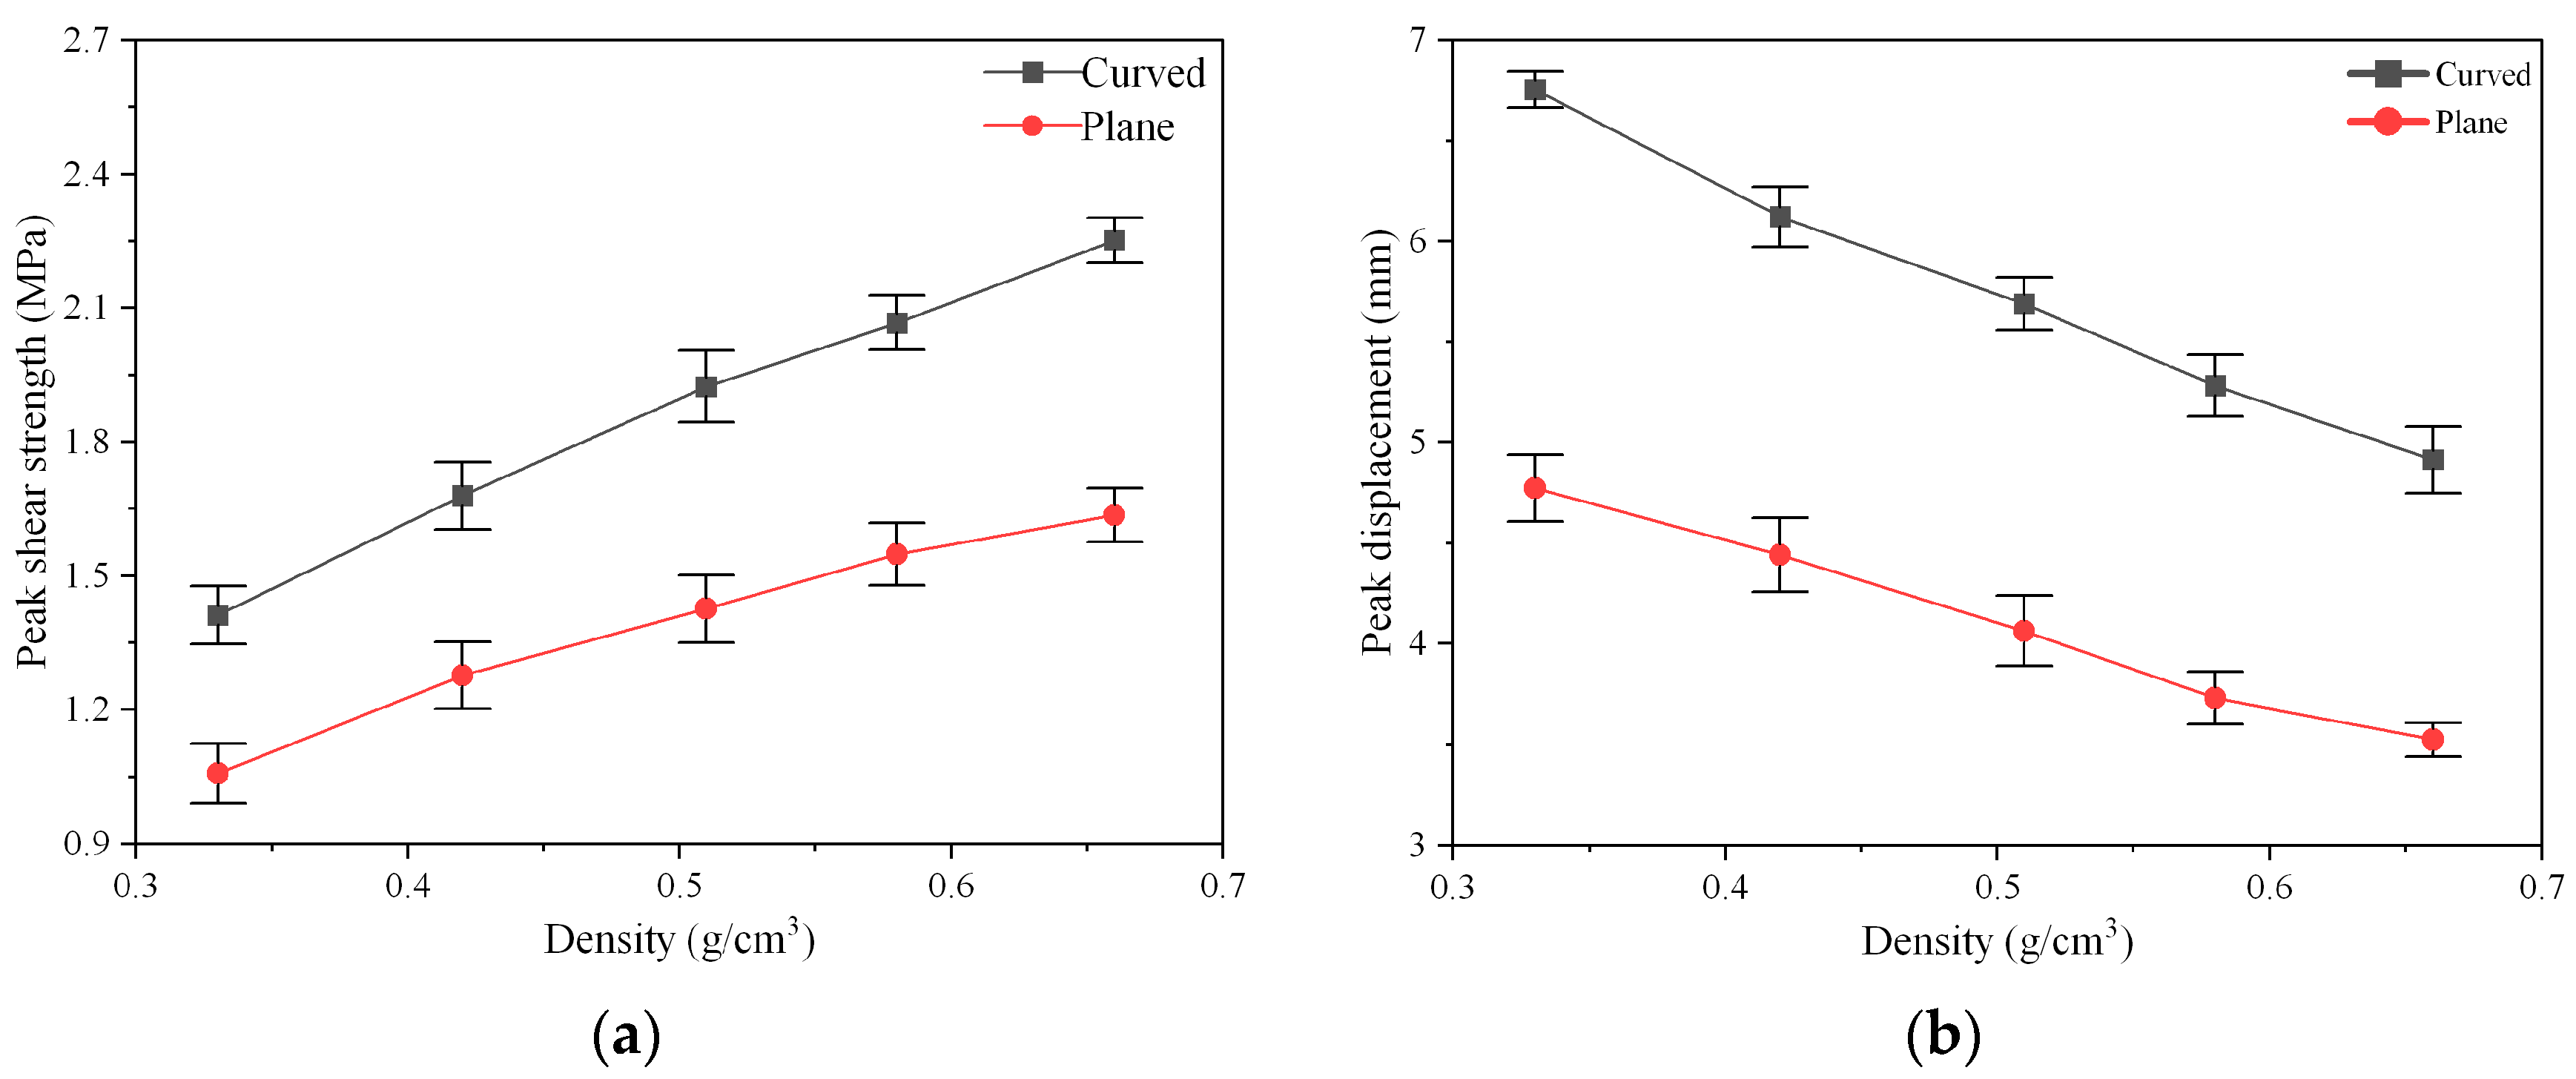
Figure 7 shows the mean shear stress–displacement curves of curved and planar composite specimens at various polymer densities. As density increases, both types of specimens exhibit higher interfacial shear strength and lower peak shear displacement. At the same density, curved specimens consistently show higher shear strength and greater peak displacement than planar ones. To further clarify this relationship, the peak shear strength and displacement values were plotted against density, as shown in Figure 8. Figure 8a reveals that both curved and planar composite specimens show a nonlinear increase in shear strength with rising density, but the growth rate decreases as density increases. The peak shear strength of curved specimens is consistently higher than that of planar ones, averaging about 1.38 times greater at the same density. Moreover, the difference in peak shear strength between the two specimen types gradually widens as the density increases. As illustrated in Figure 8b, the peak shear displacement of both curved and planar composite specimens decreases almost linearly as the polymer density increases. Curved specimens consistently exhibit larger peak displacements, averaging about 1.43 times that of planar specimens at the same density. This trend is similar to the findings of Li et al. [15], who reported that the bond strength at the polymer–concrete interface increases linearly with density, especially under low-density conditions and varying normal stresses.
The increased density enhances molecular chain compactness and crosslinking, improving interfacial stiffness and load-bearing capacity, while reducing deformability. This results in higher interface shear strength but lower peak shear displacement with increasing density. At the same density, curved composite specimens exhibit significantly greater shear strength and peak displacement than planar ones. This behavior is attributed to the normal stress component induced by the curved geometry, which partially counteracts the applied shear stress and facilitates mechanical interlocking—that is, the geometric interlock and wedging compression formed between the polymer’s cellular or rough surface and the irregular geometry of the concrete substrate. Under such a three-dimensional stress state, the curved geometry introduces normal confinement, causing the interface to sustain local normal compressive stress along with two orthogonal shear components, thereby delaying interfacial failure. In contrast, planar specimens exhibit unidirectional stress concentration, resulting in localized debonding. Moreover, the curved interface enlarges the effective contact area and extends the stress diffusion paths, further enhancing bonding performance. Overall, these results highlight the superior ability of curved composite structures to improve stress transfer efficiency and shear resistance within the composite system.

3.2.2. Effect of Concrete Strength

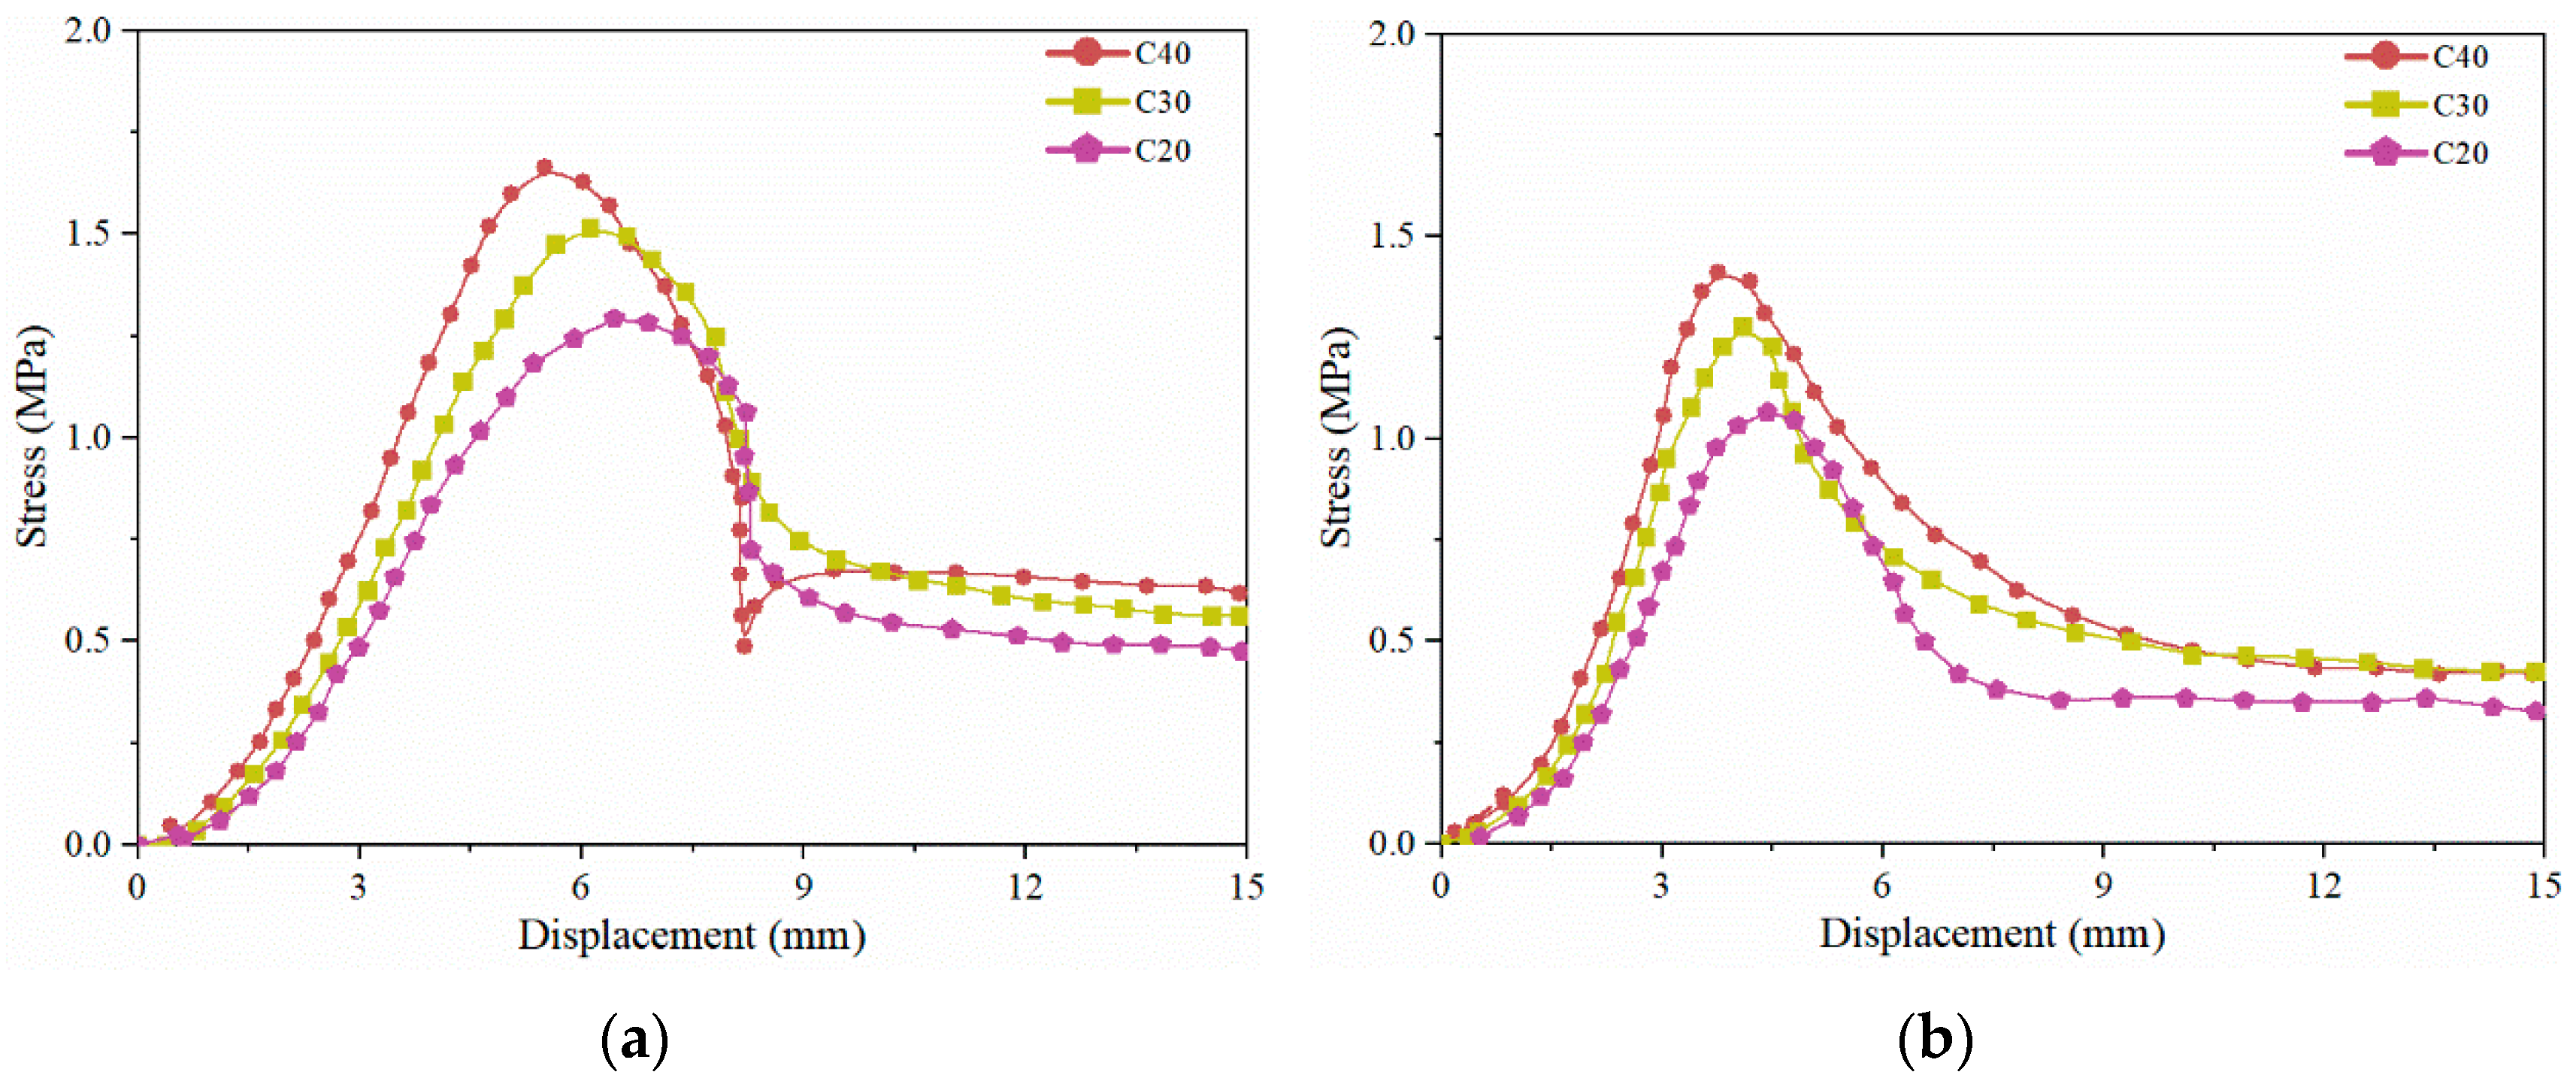
Figure 9 presents the mean shear stress–displacement curves of curved and planar composite specimens with different concrete strengths. It shows that the shear strength of both curved and planar composite specimens significantly increases with concrete strength, while the peak shear displacement decreases as the concrete strength increases, which is consistent with the phenomenon described by Fang et al. [16]. For curved composite specimens, the peak shear strength under the C30 and C40 conditions increases by approximately 12% and 20%, respectively, compared with that under the C20 condition. For planar composite specimens, the corresponding increases are about 18% and 31%. Furthermore, the results indicate that, under identical concrete strength grades, the peak shear strength of curved composite specimens is on average 1.14 times greater than that of planar specimens. Regarding deformation behavior, the peak shear displacement of curved specimens under the C30 and C40 conditions decreases by approximately 4% and 12%, respectively, relative to the C20 condition. For planar specimens, the corresponding reductions are about 7% and 12%. On average, at equivalent concrete strength levels, the peak shear displacement of curved specimens is approximately 1.55 times greater than that of their planar counterparts.
The observed behavior is attributed to the denser microstructure of high-strength concrete, which significantly enhances the interfacial bonding strength between the cement matrix and aggregates. This allows for more effective stress transfer at the composite interface under shear loading, thereby delaying the occurrence of peak shear displacement. In contrast, low-strength concrete exhibits relatively higher porosity and weaker interfacial bonding, reaching the critical stress concentration point at smaller displacements, resulting in reduced peak shear displacement. The increase in concrete strength enhances shear strength by reducing porosity and simultaneously limits material ductility due to the increased stiffness, thus decreasing the peak shear displacement.

3.2.3. Effect of Normal Stress Level

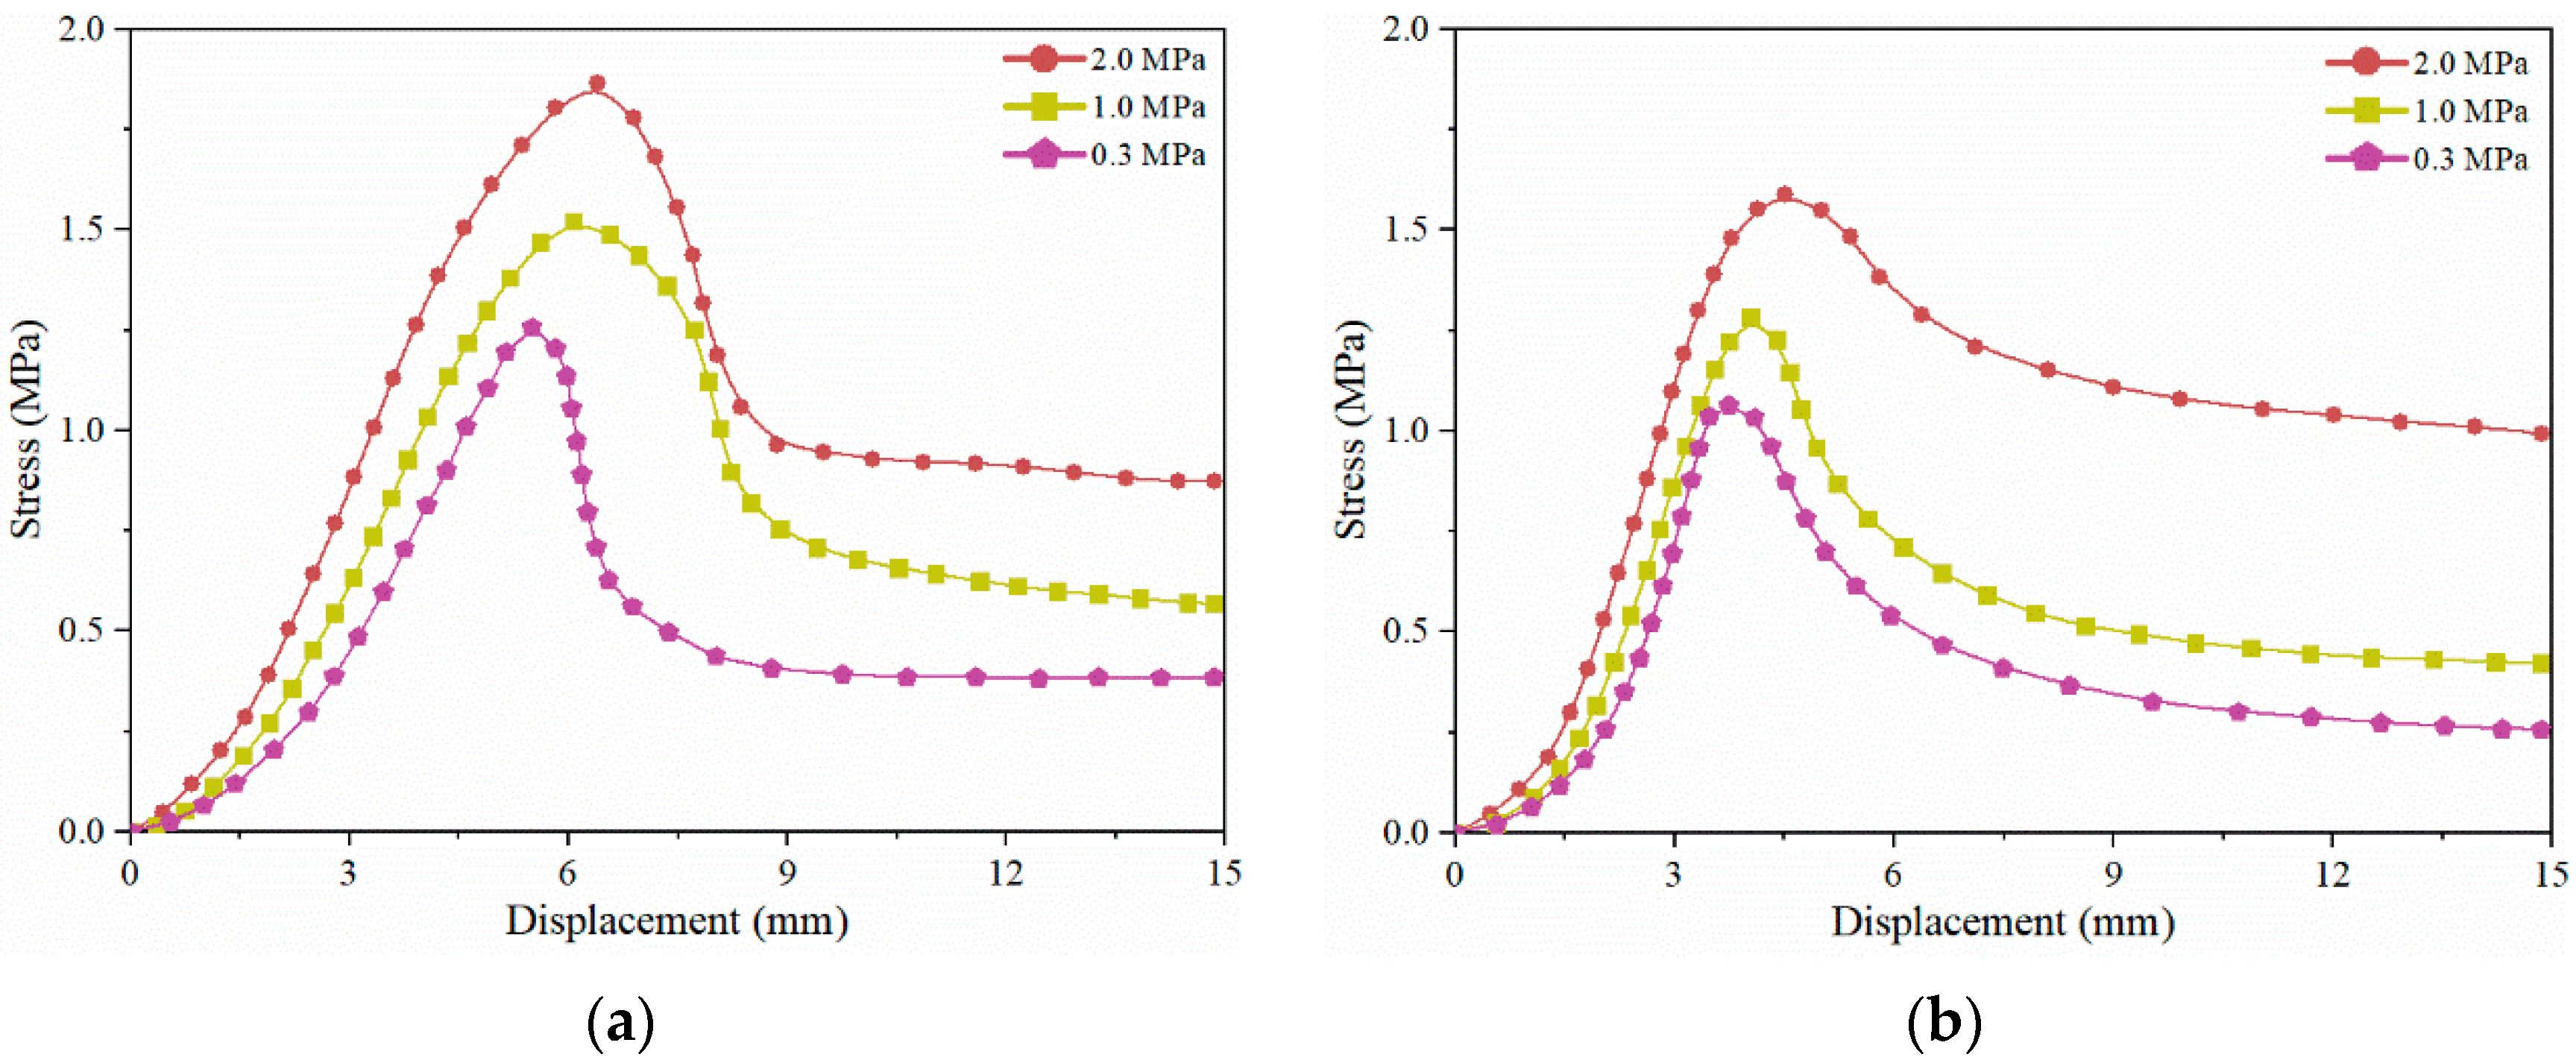
Figure 10 presents the mean shear stress–displacement curves of curved and planar composite specimens under varying normal stress levels. It can be observed that with increasing normal stress, both the peak shear strength and the peak shear displacement of the curved and planar specimens increase significantly. When normal stress increases from 0.3 MPa to 2.0 MPa, the peak shear strength increases by 40% and 66.7% for the curved and planar specimens, respectively. In addition, under identical normal stress conditions, the average peak shear strength of curved specimens is nearly 1.96 times that of planar specimens. When the normal stress rises from 0.3 MPa to 2.0 MPa, the peak shear displacement increases by 12.7% for curved specimens and 20.4% for planar ones. On average, the peak shear displacement of curved specimens remains about 1.33 times higher than that of planar specimens at equivalent normal stress levels.
This behavior can be attributed to the enhancement of interfacial friction under higher normal stress, following the Coulomb friction law. Furthermore, elevated normal pressure induces plastic deformation in the micro-asperities at the concrete–polymer interface, thereby increasing the effective contact area and mechanical interlocking. This effect is more pronounced in curved specimens, where the curvature-induced three-dimensional stress field facilitates distributed mechanical anchorage, suppressing interfacial slip. The nonlinear increase in shear strength may be associated with the viscoelastic response of the polymer under high stress and the closure of microcracks in the concrete. Such nonlinear behavior is less evident in planar specimens due to their lower structural stiffness. In terms of deformation characteristics, planar specimens are more susceptible to localized slip-induced failure under increasing normal stress owing to higher stress concentration at the interface, resulting in smaller peak shear displacements. In contrast, the curved geometry promotes stress diffusion, requiring a more extended process of energy dissipation and deformation accommodation, thereby leading to larger peak shear displacements. In summary, normal stress influences interfacial shear performance by modulating friction and mechanical interlocking at the interface, while the curved geometry further enhances the interfacial mechanical response through geometric advantages.

3.2.4. Effect of Shear Rate

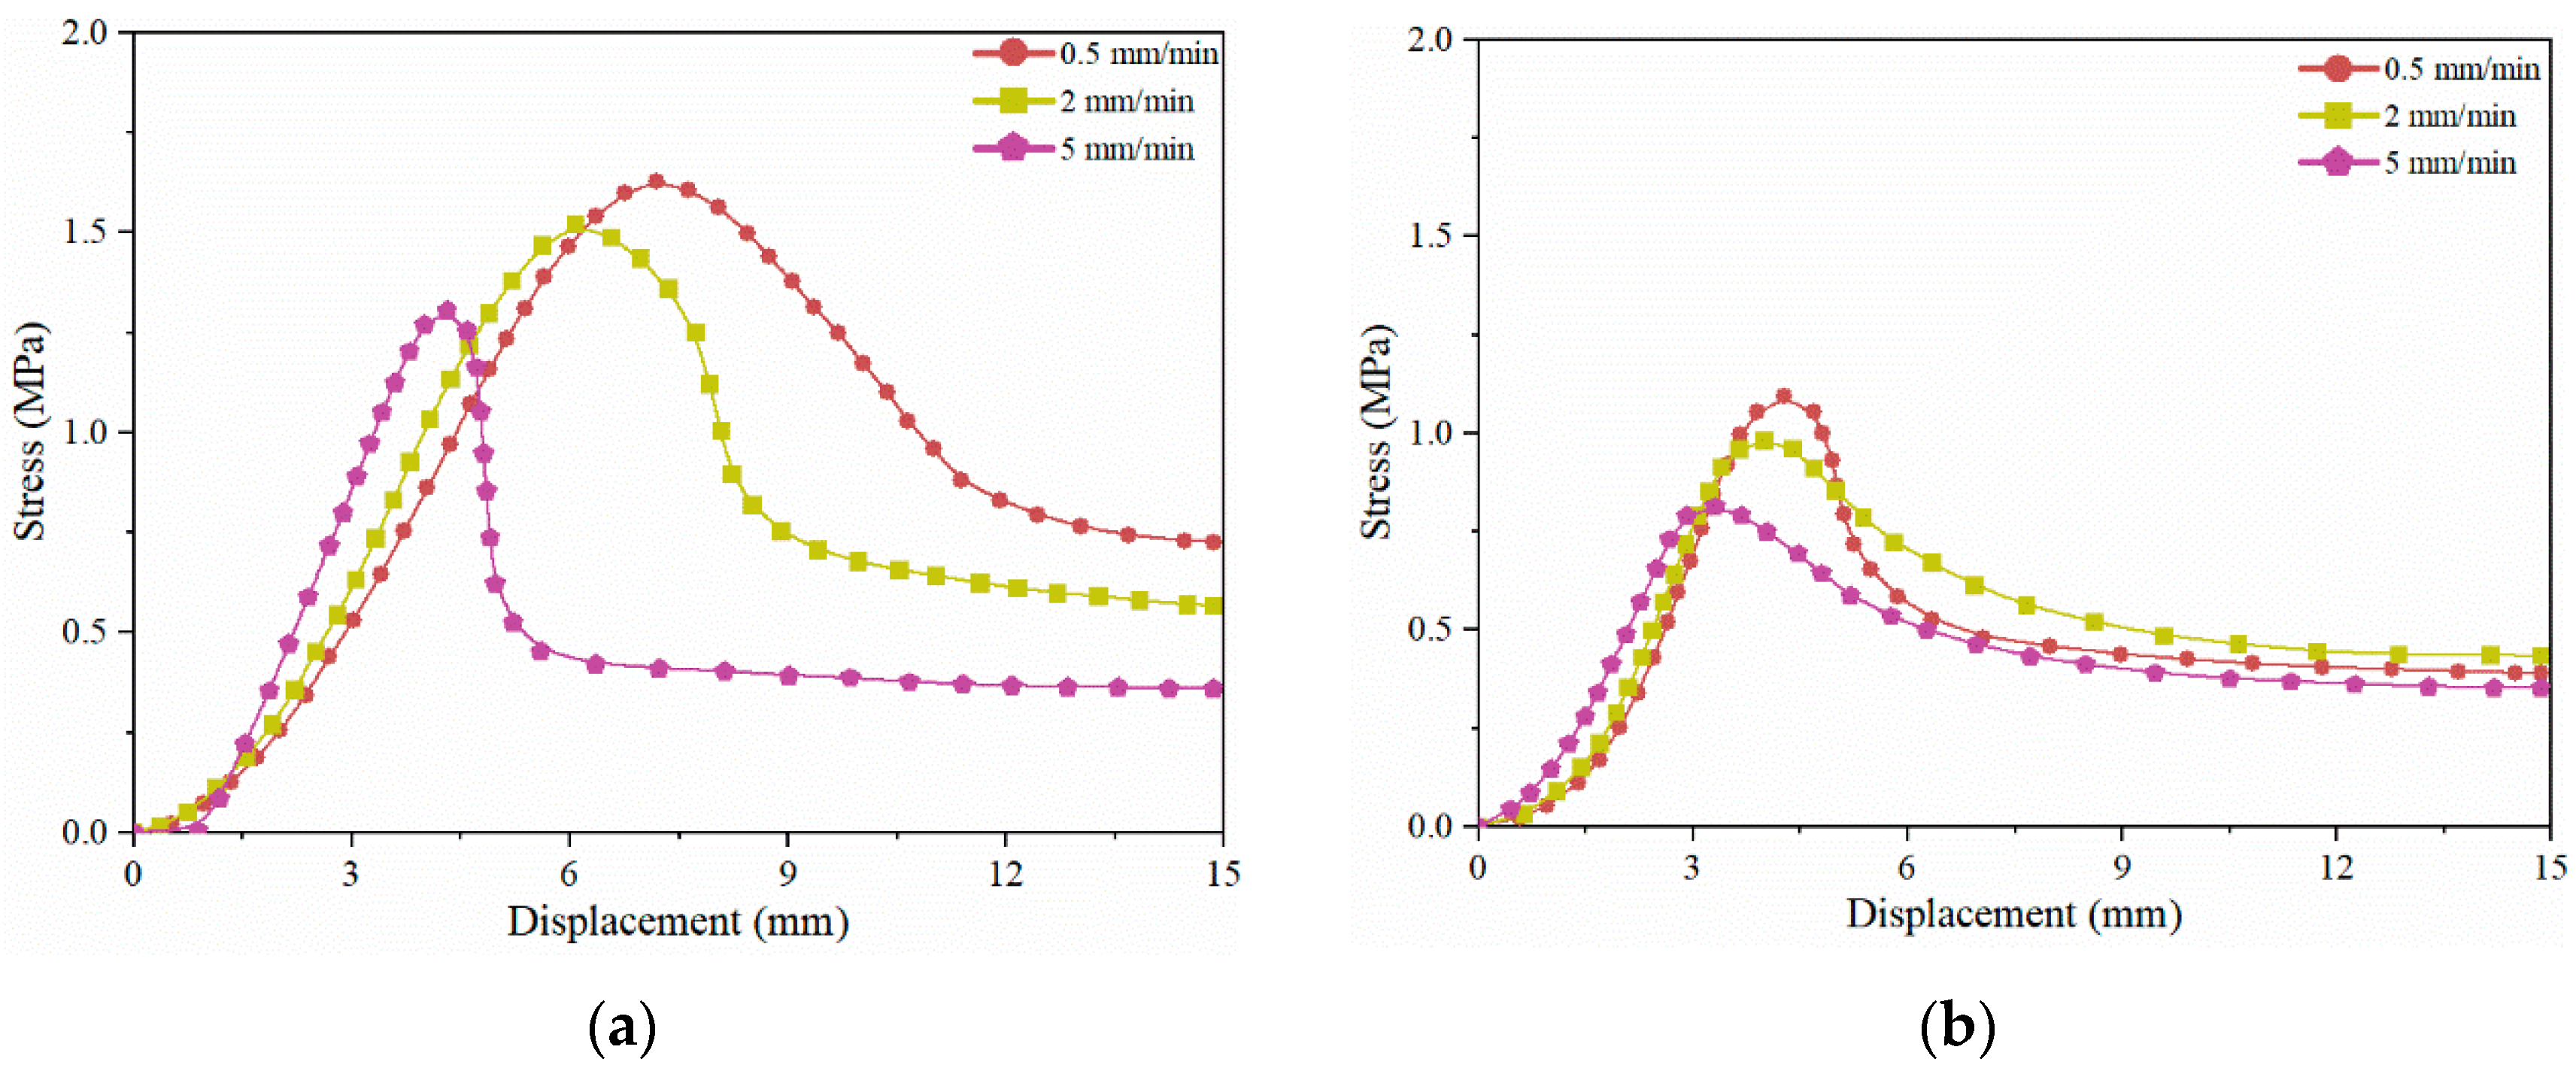
Figure 11 illustrates the mean shear stress–displacement curves of curved and planar composite specimens under varying shear rates. It can be observed that both the peak shear strength and displacement decrease as the shear rate increases for both specimen types. When the shear rate increases from 0.5 mm/min to 5.0 mm/min, the peak shear strength decreases by approximately 20% for curved specimens and 33% for planar specimens. On average, under identical shear rates, the peak shear strength of curved specimens is about 1.43 times greater than that of planar specimens. Similarly, as the shear rate rises from 0.5 mm/min to 5.0 mm/min, the peak shear displacement decreases by 12.0% and 12.2% for curved and planar specimens, respectively. At the same shear rate, the curved specimens exhibit a mean peak shear displacement approximately 1.36 times higher than that of the planar specimens. Wang et al. [12] also reported a gradual reduction in peak shear stress at the polymer–concrete interface with increasing shear rate, with a decrease of no more than 10% between 1 mm/min and 5 mm/min, which is consistent with the present findings.
This phenomenon may be explained by the fact that at lower shear rates, the interface materials have more time to undergo deformation and stress redistribution. The complex three-dimensional interlocking structure at the curved interface can progressively engage, promoting uniform stress distribution and thereby enhancing peak strength. At higher shear rates, the material may rapidly reach its failure threshold due to strain rate effects; however, the curved interface still retains a certain level of load-bearing capacity owing to its geometric advantages. The geometric characteristics of the curved interface enhance the mechanical interlock between polymer and concrete. At low shear rates, the combination of interfacial friction and mechanical interlocking allows for coordinated load transfer. In contrast, the planar interface, due to its geometric simplicity, is more susceptible to localized stress concentration, resulting in early localized failure and correspondingly lower peak strength and displacement. In terms of failure modes, curved interfaces tend to exhibit progressive failure under low shear rates and brittle fracture at high shear rates. Planar interfaces, however, tend to fail in a brittle manner regardless of shear rate, reflecting limitations in their stress transfer capacity. In conclusion, shear rate influences the interfacial stress response time, thereby affecting the mechanical behavior of different interfacial configurations. The curved specimens, owing to their structural interlocking advantages, consistently outperform planar specimens in both shear strength and displacement performance.

3.2.5. Effect of Size on Shear Behavior

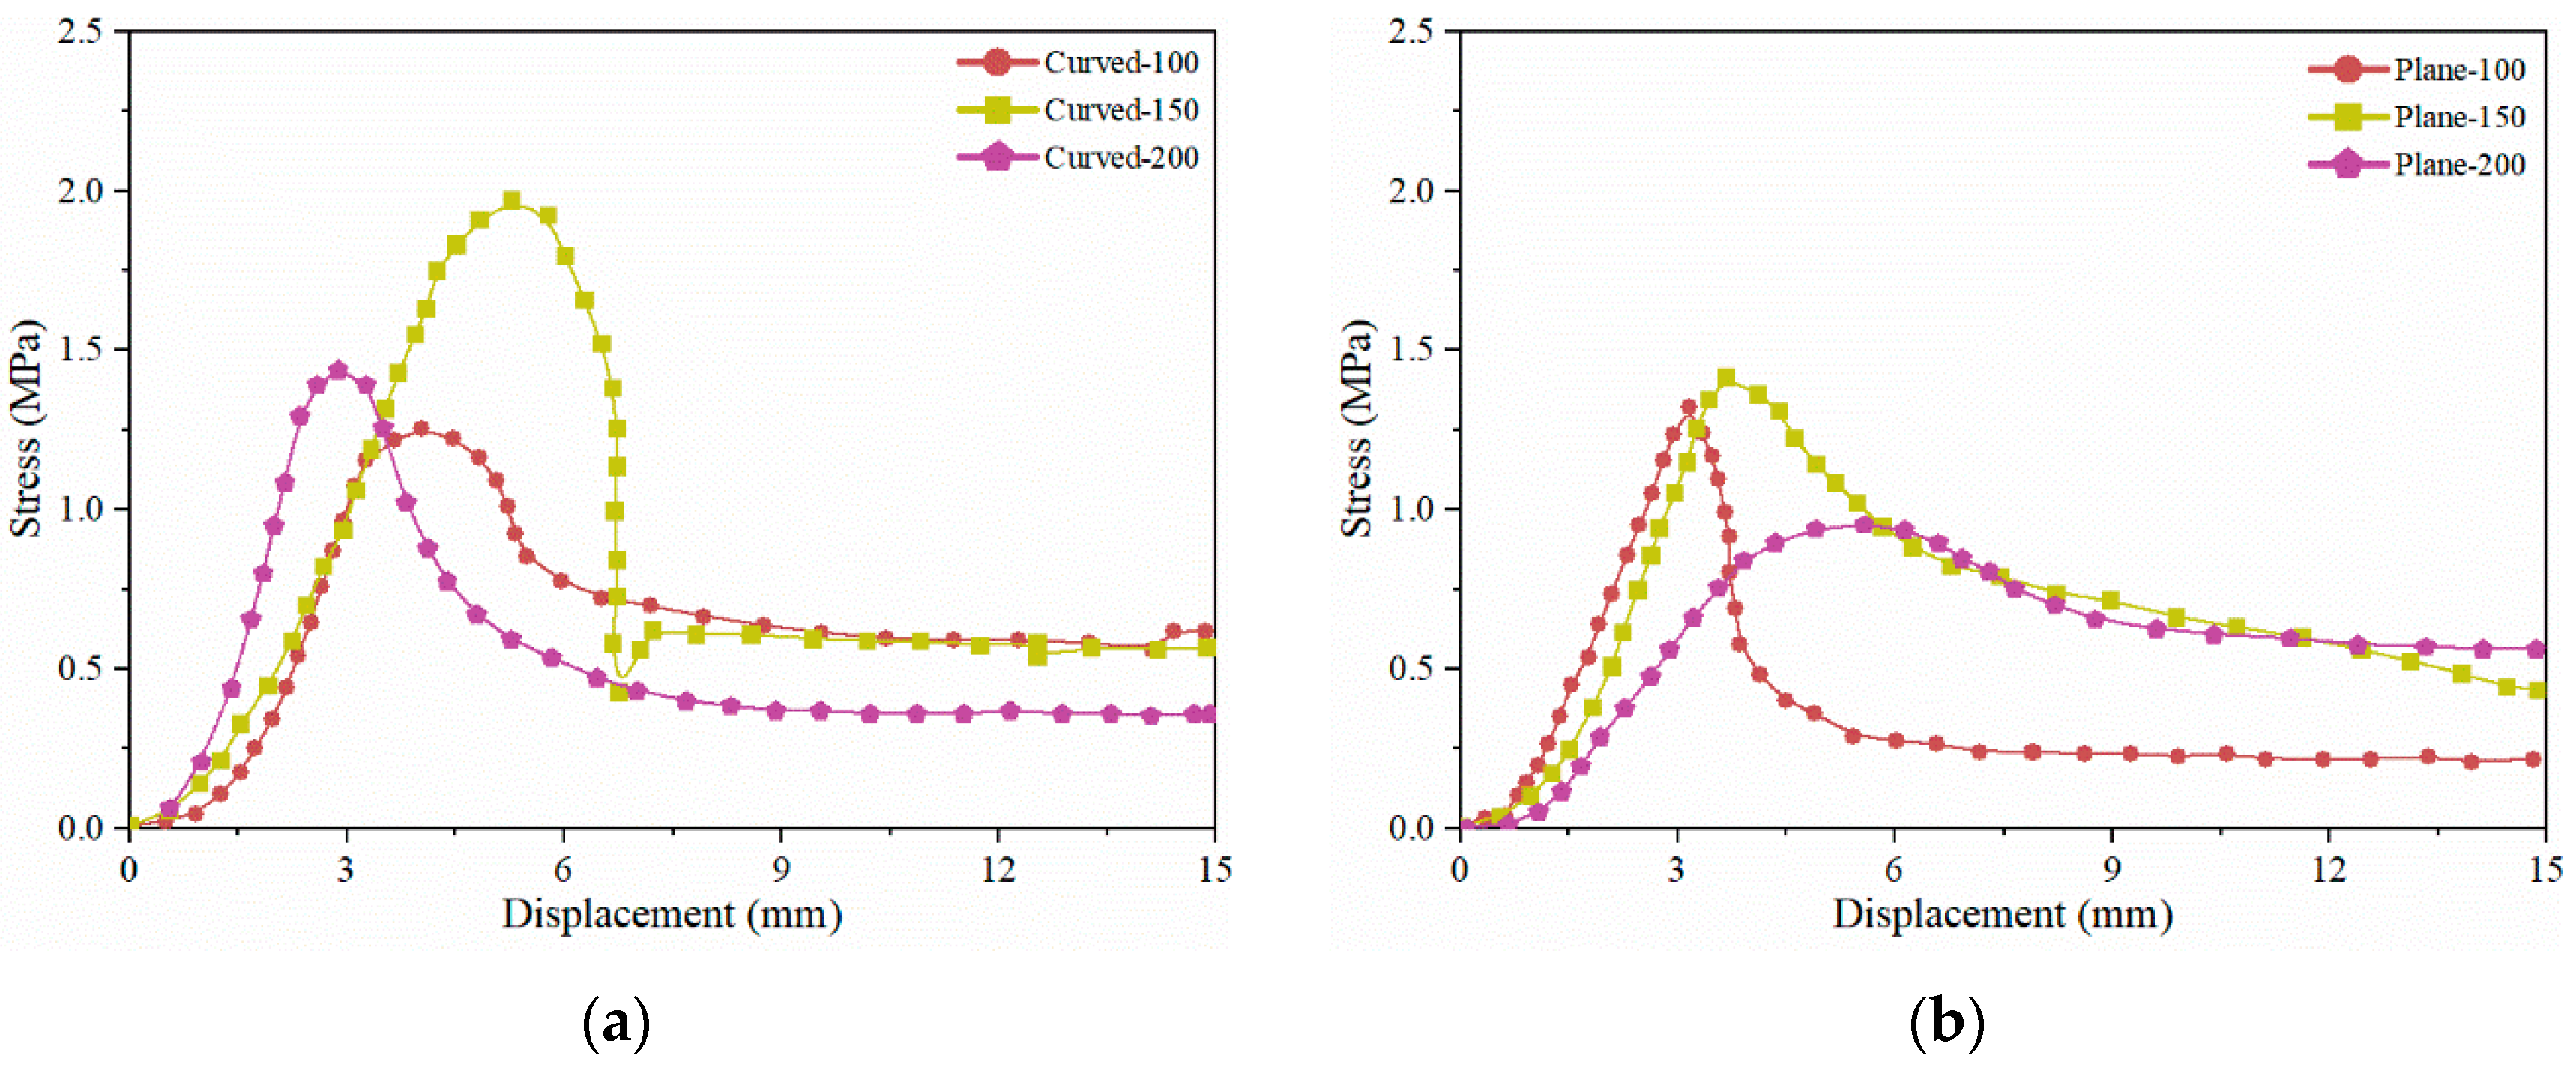
Figure 12 illustrates the mean shear stress–displacement curves of curved and planar composite specimens with different dimensions. As the specimen size increases from 100 mm to 150 mm, the peak shear strength of the curved and planar specimens increases by approximately 57% and 7%, respectively. However, further enlargement to 200 mm results in strength reductions of about 25% and 33%, respectively. For the curved specimens, increasing the size from 100 mm to 150 mm leads to a 31% increase in peak displacement, whereas a further increase to 200 mm causes a 45% decrease. In contrast, the peak displacement of planar specimens rises by approximately 77% as the specimen size increases from 100 mm to 200 mm. These findings indicate that specimen size exerts markedly different effects on the interfacial peak shear displacement between curved and planar geometries.
At the 100 mm size, the peak shear strength of the curved specimen is slightly lower than that of the planar specimen, which may be attributed to experimental variability. At 150 mm and 200 mm, the curved specimens exhibit peak shear strengths approximately 39% and 51% higher than the planar counterparts, respectively. In terms of peak shear displacement, curved specimens at 100 mm and 150 mm exhibit displacements approximately 28% and 44% greater than planar specimens, while at 200 mm, the displacement of curved specimens is approximately 48% lower.
These findings suggest that for curved specimens, the 150 mm dimension achieves an optimized curvature that facilitates more uniform interfacial stress distribution, reduces stress concentrations, and enhances mechanical interlocking between polymer and concrete, thereby significantly improving shear strength. However, further increases in size (200 mm) lead to a larger radius of curvature, which can amplify local stress gradients and increase the likelihood of internal material defects. For planar specimens, interfacial shear stress tends to concentrate near the edges. As specimen size increases, the edge-induced stress concentrations become more pronounced, resulting in limited strength gains followed by eventual strength reduction. Regarding deformation behavior, in the 100–150 mm range, the curvature of the curved specimens allows for controlled energy dissipation through micro-slips at the interface, leading to increased displacement. However, at 200 mm, increased structural rigidity reduces the adaptability of the curvature to deformation, resulting in significantly reduced displacement. In contrast, planar specimens exhibit more uniform sliding as size increases. The viscoelastic nature of the polymer contributes to a nonlinear increase in displacement with increasing size. Overall, at smaller sizes (100 mm), the curvature advantage of curved specimens is not fully realized. At larger sizes (200 mm), the geometric optimization and stress distribution characteristics of the curved interface yield significantly higher strength than planar specimens. However, due to increased stiffness and a shift towards brittle failure modes at the interface, their displacement capacity becomes lower than that of planar specimens.

4. Interfacial Failure Characteristics and Failure Mode Analysis

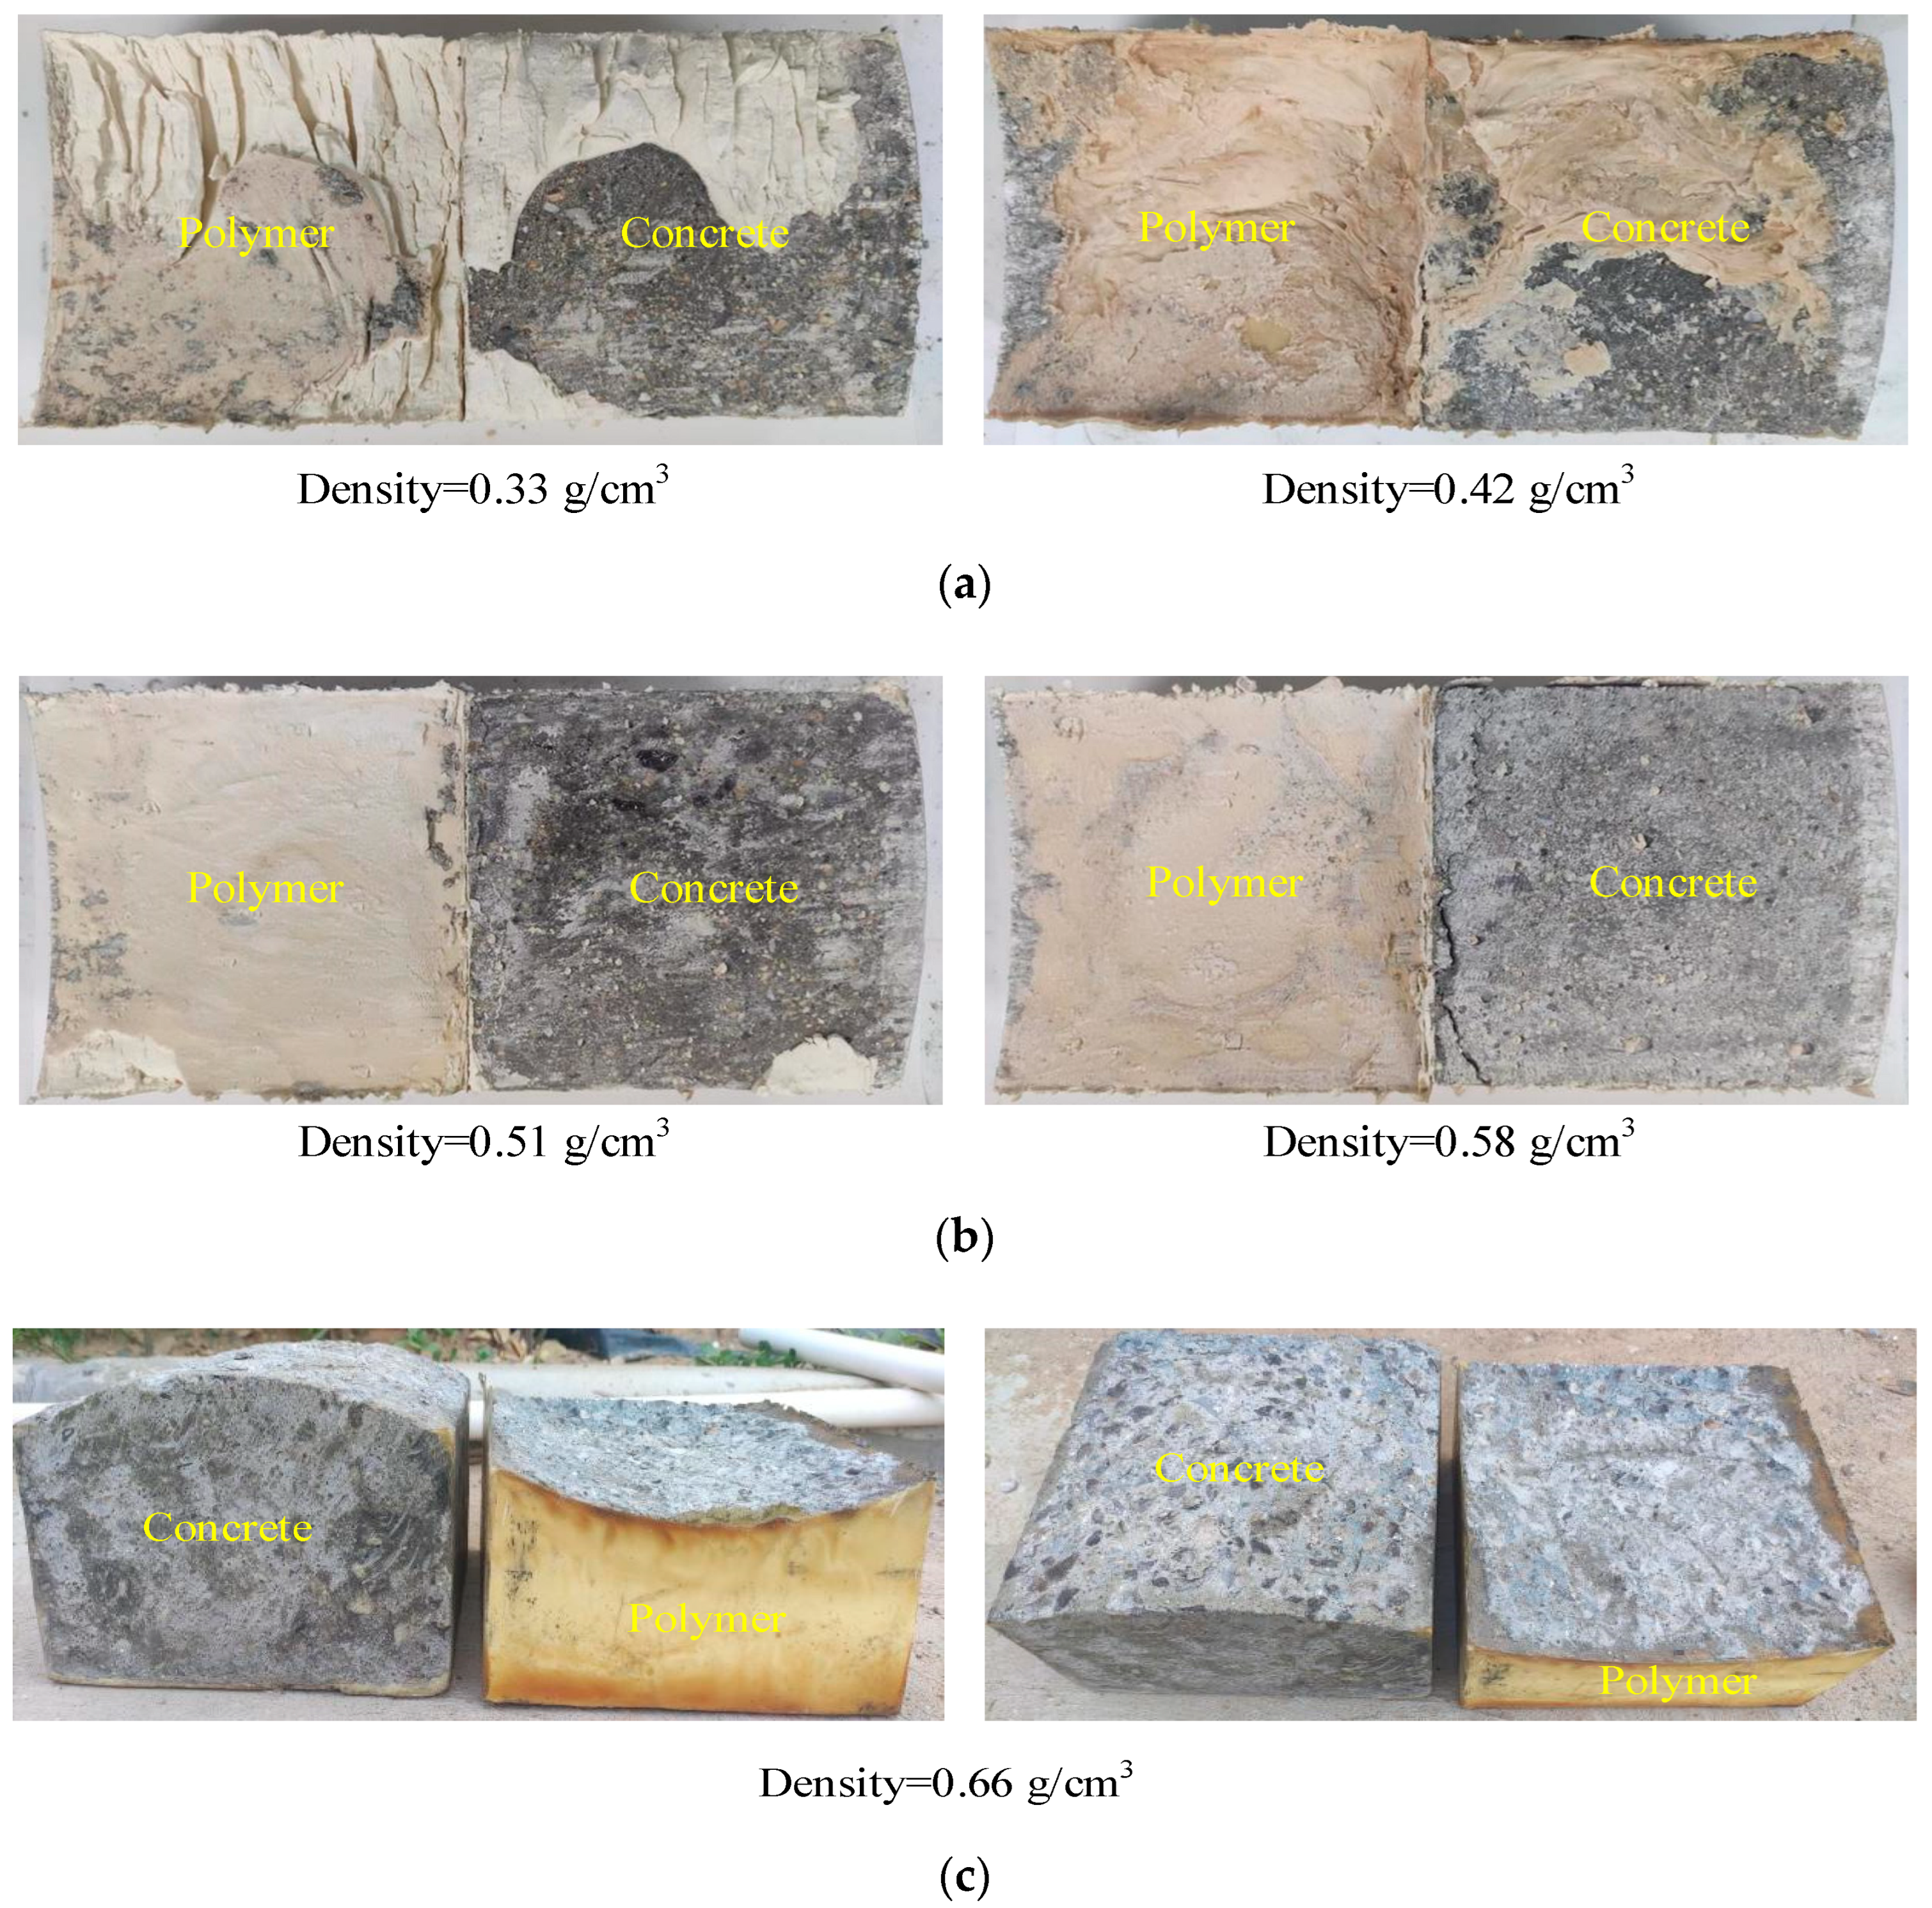
Qin et al. [13] identified three primary failure modes at the interface between planar concrete and polymer. The interfacial failure patterns observed between curved concrete and polymer were visually similar to those in the planar specimens.
Type A failure is characterized by a complete shear fracture of the polymer matrix, with residual polymer firmly bonded to the concrete. This failure mode was predominantly observed in low-density polymer specimens, where high normal stress induces plastic deformation in the interfacial region. Owing to the significantly lower shear strength of low-density polymer compared to concrete, a “weak matrix–strong interface” system is formed. This failure is essentially governed by the insufficient yield strength of the polymer matrix. The cross-sectional morphology of Type A failure is shown in Figure 13a.
Type B failure is characterized by clean interfacial separation, with no significant damage observed on either material surface. This failure mode typically occurs in composite specimens with higher-density polymer, as illustrated in Figure 13b. Such a failure pattern indicates that the interface serves as the weak plane during shear loading, where failure initiates and propagates along the contact surface, ultimately leading to the shear failure of the entire composite specimen. This phenomenon is attributed to the markedly improved shear properties of higher-density polymer, where both polymer and concrete possess shear strengths substantially higher than that of the interface. As a result, debonding occurs precisely along the interface, with negligible damage within either material body.
Type C failure primarily occurs in polymer–concrete composites incorporating high-density polymer. With increasing density, the shear strength of the polymer significantly improves, and the interfacial shear strength also increases accordingly. When the density reaches a certain threshold, the shear strengths of both the polymer and the interface may exceed that of the concrete itself, leading to a concrete-dominated shear failure mode, as depicted in Figure 13c. In this mode, the concrete near the interface exhibits evident damage, while the polymer remains largely intact, often retaining substantial amounts of adhered concrete aggregate on its surface.

5. Limitations and Future Work

This study was designed to isolate the macroscale interfacial shear response of curved and planar concrete–polymer composite specimens under controlled test conditions. The mechanistic interpretations are therefore presented as hypotheses consistent with the observed trends and previous studies, rather than as conclusive microstructural evidence. Future work will include SEM fractography of polymer–concrete fracture surfaces to visualize asperity interlocking and polymer infiltration, micro-CT imaging to quantify interpenetration depth and effective contact area, and acoustic emission monitoring to track damage initiation and evolution during shear loading. These characterizations will enable causal validation of the proposed mechanisms. Furthermore, future research should place greater emphasis on environmental factors, cyclic or fatigue loading, and field variability to support the sustainable application of polymer grouting in underground infrastructure rehabilitation.

6. Conclusions

This study investigated the shear behavior of curved and planar concrete–polymer composite interfaces fabricated using a two-component foaming polymer through direct shear testing. The key findings are as follows:
(1)
Both curved and planar interfaces experience five characteristic shear stages—slow initiation, linear elasticity, yield strengthening, fracture failure, and residual deformation. However, the curved interfaces consistently exhibit higher peak shear strength and larger peak displacement, indicating superior shear performance.
(2)
Both polyurethane density and concrete strength enhance peak shear strength but reduce peak displacement. At identical densities, the peak shear strength and displacement of curved specimens are about 1.38 and 1.43 times those of planar specimens. Similarly, under identical concrete strengths, the corresponding ratios are about 1.14 and 1.55, respectively.
(3)
Normal stress increases while shear rate reduces peak shear strength and displacement. Under identical normal stress levels, the peak shear strength and displacement of curved specimens are approximately 1.96 and 1.43 times greater than those of planar specimens. Similarly, under identical shear rates, the corresponding ratios are about 1.43 and 1.36, respectively.
(4)
Specimen size exerts distinct effects on curved and planar interfaces. For curved specimens, a 150 mm dimension yields optimal shear strength and displacement. In contrast, planar specimens exhibit limited strength improvement but increasing displacement with size.

Author Contributions

Conceptualization, D.Q.; methodology, Y.S.; writing—review and editing, B.L.; funding acquisition, B.L.; software, X.Y.; validation, M.L.; formal analysis, X.D.; investigation, X.Z. and K.Z.; writing—original draft preparation, D.Q. and Y.S. All authors have read and agreed to the published version of the manuscript.

Funding

This research was supported by the National Natural Science Foundation of China (52208375), for which the authors are grateful.

Institutional Review Board Statement

Not applicable.

Informed Consent Statement

Not applicable.

Data Availability Statement

The data presented in this study are available on request from the corresponding author.

Conflicts of Interest

The authors declare no conflicts of interest.

References

  1. Wang, J.; Liu, G.; Wang, J. Current status, existent problems, and coping strategy of urban drainage pipeline network in China. environ. Sci. Pollut. Res. 2021, 28, 43035–43049. [Google Scholar] [CrossRef]
  2. Xie, Z.; Jiang, F.; Xu, J.; He, J.; Zheng, D.; Lian, J.; Hou, Z.; Zhao, L.; Wang, Y.; Feng, Y. A narrative of urban underground pipeline system disasters in China in 2021: Spatial and temporal distribution, causal analysis, and response strategies. Sustainability 2023, 15, 10067. [Google Scholar] [CrossRef]
  3. Wang, S.; Li, X.; Ti, Y.; Zhang, X.; Yin, T.; Wang, R.; Jiang, X.; Su, Z.; Hao, J. Investigation on shakedown response-behavior of thawed subgrade soils under long-term traffic loading. Front. Earth Sci. 2024, 12, 1361283. [Google Scholar] [CrossRef]
  4. Chapman, D.N.; Ng, P.C.F.; Karri, R. Research needs for on-line pipeline replacement techniques. Tunn. Undergr. Space Technol. 2007, 22, 503–514. [Google Scholar] [CrossRef]
  5. Li, B.; Yu, W.; Xie, Y.N.; Fang, H.Y.; Du, X.M.; Wang, N.N.; Zhai, K.J.; Wang, D.C.; Chen, X.M.; Du, M.R. Trenchless rehabilitation of sewage pipelines from the perspective of the whole technology chain: A state-of-the-art review. Tunn. Undergr. Space Technol. 2023, 134, 105022. [Google Scholar] [CrossRef]
  6. Li, B.; Fang, H.Y.; Zhai, K.J.; Yang, K.J.; Zhang, X.J.; Wang, Y.K. Mechanical behavior of concrete pipes with erosion voids and the effectiveness evaluation of the polymer grouting. Tunn. Undergr. Space Technol. 2022, 129, 104672. [Google Scholar] [CrossRef]
  7. Wang, F.M.; Shi, M.S.; Li, H.J.; Zhong, Y.H.; Sang, X.M.; Wang, P.C.; Ai, L.; Li, Y.G.; Bu, J.L. Experimental study on the anti-permeability properties of polymer grouting materials. Adv. Mater. Res. 2011, 284, 1952–1955. [Google Scholar]
  8. Liu, K.; Liang, W.; Ren, F.; Ren, J.; Wang, F.; Ding, H. The study on compressive mechanical properties of rigid polymer grout materials with different densities. Constr. Build. Mater. 2019, 206, 270–278. [Google Scholar] [CrossRef]
  9. Saleh, S.; Yunus, N.Z.M.; Ahmad, K.; Ali, N. Improving the strength of weak soil using polymer grouts: A review. Constr. Build. Mater. 2019, 202, 738–752. [Google Scholar] [CrossRef]
  10. Vik, E.A.; Sverdrup, L.; Kelley, A.; Storhaug, R.; Beitnes, A.; Boge, K.; Grepstad, G.K.; Tveiten, V. Experiences from environmental risk management of chemical grouting agents used during construction of the Romeriksporten tunnel. Tunn. Undergr. Space Technol. 2000, 15, 369–378. [Google Scholar] [CrossRef]
  11. Wu, F.; Ma, Y.; Lei, S.; Liu, S.; He, L.; Liao, J.; Yang, F. Experimental study on the bond behavior of CFRP-grid-reinforced ECC and NC interface. Constr. Build. Mater. 2023, 392, 131947. [Google Scholar] [CrossRef]
  12. Wang, Y.K.; Wan, Y.S.; Guo, C.C.; Zeng, C.N.; Shao, J.G.; Wang, F.F. Experimental investigation on the monotonic, cyclic and post-cyclic interfacial behavior of non-water reacted polymer and concrete. Constr. Build. Mater. 2021, 292, 123323. [Google Scholar] [CrossRef]
  13. Qin, L.; Guo, C.C.; Sun, W.; Guan, H.; Yan, W.H.; Wang, F.M. Experimental investigation on the interfacial shear bond performance of non-water reacting polymer and concrete. Constr. Build. Mater. 2022, 331, 127351. [Google Scholar] [CrossRef]
  14. Zhang, Z.; Wang, S.; Feng, J. Frictional behaviour of the interface between concrete and rubber: Laboratory shear test and its elastoplastic model. Eng. Fract. Mech. 2018, 197, 192–205. [Google Scholar] [CrossRef]
  15. Li, X.X.; Wang, F.M.; Fang, H.Y.; Zheng, D.; Fu, Y.C. Bond behavior between concrete and self-expansion polymer material under normal pressures. Adv. Civ. Eng. 2021, 2021, 6675102. [Google Scholar] [CrossRef]
  16. Fang, H.; Su, Z.; Li, X.; Wang, F.; Fu, Y. Interfacial bond performance between self-expansion polymer and concrete. Constr. Build. Mater. 2021, 270, 121459. [Google Scholar] [CrossRef]
  17. Chen, X.B.; Zhang, J.S.; Xiao, Y.J.; Li, J. Effect of roughness on shear behavior of red clay–concrete interface in large-scale direct shear tests. Can. Geotech. J. 2015, 52, 1122–1135. [Google Scholar] [CrossRef]
  18. Zhang, X.J.; Wang, C.J.; Tian, H.; Shi, M.S. Interface bonding properties between nonwater reaction polyurethane polymer materials and concrete. Adv. Mater. Sci. Eng. 2021, 2021, 1041944. [Google Scholar] [CrossRef]
  19. Wang, Y.K.; Han, M.S.; Cao, T.C.; Yu, X.; Song, Y.B. Cyclic interface behavior of non-water reactive polymer and concrete during dam restoration. Structures 2021, 34, 748–757. [Google Scholar] [CrossRef]
  20. Li, Y.; Li, Y.L.; Wang, R.J.; Qin, Y.; Cao, Z.L. Experimental investigation of the interfacial bonding properties between polymer mortar and concrete under different influencing factors. Constr. Build. Mater. 2023, 408, 133800. [Google Scholar] [CrossRef]
  21. Wang, L.; Tian, Z.H.; Ma, G.W.; Zhang, M. Interlayer bonding improvement of 3D printed concrete with polymer modified mortar: Experiments and molecular dynamics studies. Cem. Concr. Compos. 2020, 110, 103571. [Google Scholar] [CrossRef]
  22. Wang, Z.Y.; Du, M.R.; Fang, H.Y.; Zhang, C.; Li, M.J.; Shi, M.S. Influence of different corrosion environments on mechanical properties of a roadbed rehabilitation polyurethane grouting material under uniaxial compression. Constr. Build. Mater. 2021, 301, 124092. [Google Scholar] [CrossRef]
  23. Ministry of Housing and Urban-Rural Development of the People’s Republic of China; State Administration for Market Regulation of the People’s Republic of China. GB/T 50081-2019; Standard for Test Methods of Concrete Physical and Mechanical Properties. China Architecture & Building Press: Beijing, China, 2019.
  24. Ministry of Housing and Urban-Rural Development of the People’s Republic of China. JG/T 245-2009; Vibrating Table for Concrete Test. Standards Press of China: Beijing, China, 2009.
  25. Choi, J.S.; Hong, S.H.; Yoo, S.J.; Yang, J.M.; Yoon, Y.S. Effect of internal curing on shrinkage and creep of self-compacting lightweight concrete under different curing conditions. Constr. Build. Mater. 2025, 470, 140612. [Google Scholar] [CrossRef]
  26. Tian, J.; Zhu, W.; Wu, X.; Sun, C.; Zheng, Y.; Tang, S.W.; Yuan, J.Y.; Zuo, Y.D. Deterioration test and damage model of FRP-ECC-concrete composite interface under sulfate-dry-wet cycles. Constr. Build. Mater. 2025, 471, 140723. [Google Scholar] [CrossRef]
  27. Wahab, S.; Salami, B.A.; Danish, H.; Nisar, S.; Alateah, A.H.; Alsubeai, A. A hybrid machine learning approach for predicting fiber-reinforced polymer-concrete interface bond strength. Eng. Appl. Artif. Intell. 2025, 148, 110458. [Google Scholar] [CrossRef]
  28. Xie, F.; Chang, T.; Kuang, G.; Sun, L.G.; Wu, L. Biaxial compression-shear behavior of SAP-PVA enhanced concrete: Experiments and analysis. J. Build. Eng. 2025, 108, 112833. [Google Scholar] [CrossRef]
  29. Li, B.; Wang, F.M.; Fang, H.Y.; Yang, K.J.; Zhang, X.J.; Ji, Y.T. Experimental and numerical study on polymer grouting pretreatment technology in void and corroded concrete pipes. Tunn. Undergr. Space Technol. 2021, 113, 103842. [Google Scholar] [CrossRef]
  30. Hao, S.; Liu, Y.; Zhang, Z.; Zhang, J. Experimental investigation of the shear behavior of soft-hard joints under constant normal stress. Bull. Eng. Geol. Environ. 2025, 84, 10. [Google Scholar] [CrossRef]
  31. Ferrier, E.; Michel, L.; Thiele, M.; Delmas, S. Strain-rate effect on the bond strength of external bonded reinforced carbon fiber-reinforced polymer for concrete structure. Constr. Build. Mater. 2025, 466, 140216. [Google Scholar] [CrossRef]
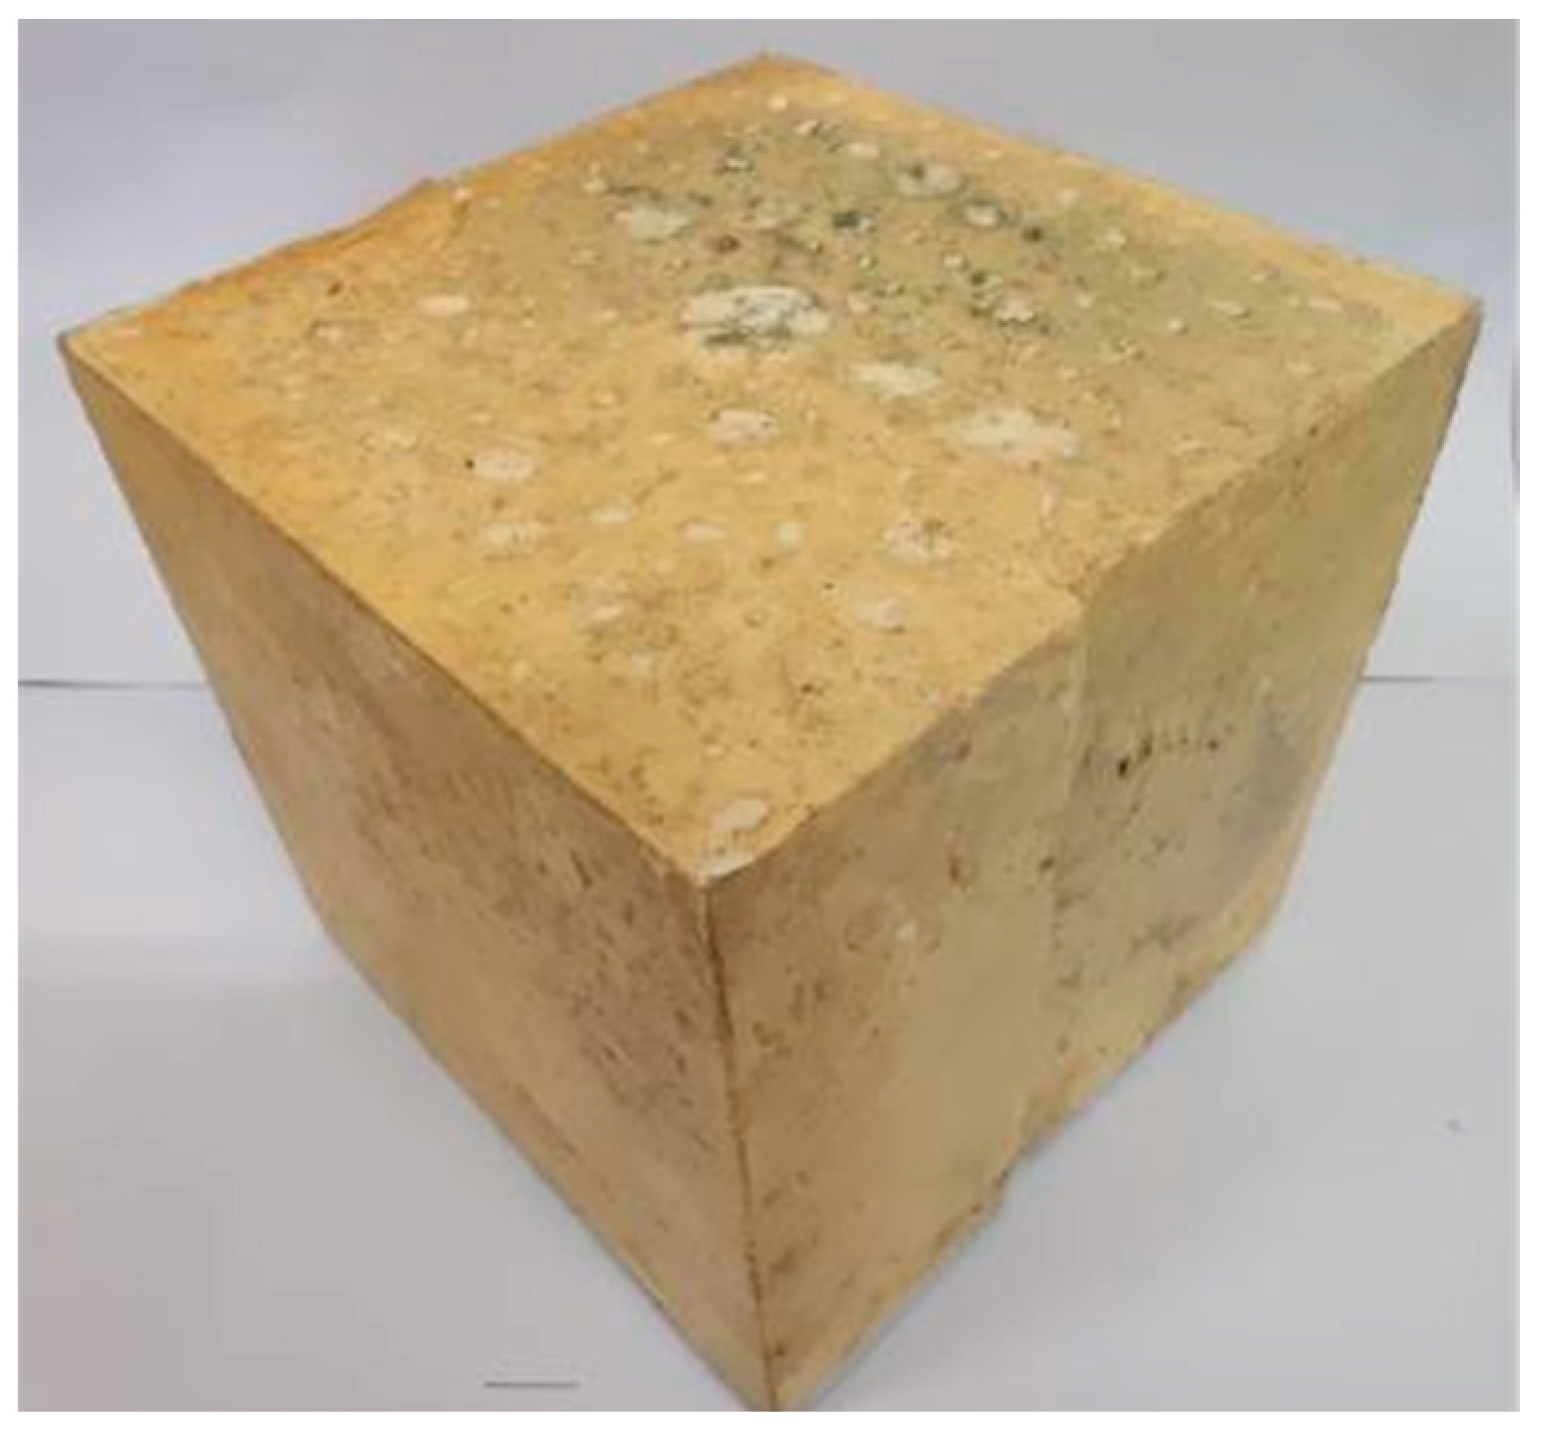
Figure 1. Solidified structure of two-component foamed polymer material.
Sustainability 17 09340 g001
Figure 2. The 3D-printed curved concrete mold.
Sustainability 17 09340 g002
Figure 3. Fabrication of concrete specimens: (a) curing environment and (b) molded concrete specimens.
Sustainability 17 09340 g003
Figure 4. Fabrication process and final product of concrete–polymer composite specimens: (a) grouting mold and (b) demolded composite specimen.
Sustainability 17 09340 g004
Figure 5. Direct shear test configuration for concrete–polymer composite specimens.
Sustainability 17 09340 g005
Figure 6. Typical shear stress–displacement curves of composite specimens: (a) curved specimen and (b) planar specimen.
Sustainability 17 09340 g006
Figure 7. Shear stress–displacement curves of curved and planar composite specimens with different polymer densities: (a) curved specimens and (b) planar specimens.
Sustainability 17 09340 g007
Figure 8. Influence of polymer density on (a) peak shear strength and (b) peak shear displacement.
Sustainability 17 09340 g008
Figure 9. Shear stress–displacement curves of curved and planar composite specimens with different concrete strengths: (a) curved specimens and (b) planar specimens.
Sustainability 17 09340 g009
Figure 10. Shear stress–displacement curves of curved and planar composite specimens with different normal stress levels: (a) curved specimens and (b) planar specimens.
Sustainability 17 09340 g010
Figure 11. Shear stress–displacement curves of curved and planar composite specimens with different shear rates: (a) curved specimens and (b) planar specimens.
Sustainability 17 09340 g011
Figure 12. Shear stress–displacement curves of curved and planar composite specimens with different specimen sizes: (a) curved specimens and (b) planar specimens.
Sustainability 17 09340 g012
Figure 13. Cross-sectional morphology of different failure modes in curved composite specimens: (a) type A, (b) type B, and (c) type C.
Sustainability 17 09340 g013
Table 1. Mix proportions of concrete materials.
StrengthWater–Cement RatioWater (kg/m3)Cement (kg/m3)Medium Sand
(kg/m3)
Coarse Aggregate
(kg/m3)
Water-Reducing Agent
(kg/m3)
C200.62517528068012500.01
C300.5017535065012000.01
C400.4016040060012500.01
Table 2. Experimental conditions and test matrix.
Size (mm)Concrete strengthNormal stress (MPa)Shear rate (mm/min)Density (g/cm3)
150C301.02.00.330.420.510.580.66
Size (mm)Density (g/cm3)Normal stress (MPa)Shear rate (mm/min)Concrete strength
1500.331.02.0C20C30C40
Size (mm)Density (g/cm3)Concrete strengthShear rate (mm/min)Normal stress (MPa)
1500.33C302.00.31.02.0
Size (mm)Density (g/cm3)Concrete strengthNormal stress (MPa)Shear rate (mm/min)
1500.33C301.00.52.05.0
Density (g/cm3)Concrete strengthNormal stress (MPa)Shear rate (mm/min)Size (mm)
0.33C301.02.0100150200
Disclaimer/Publisher’s Note: The statements, opinions and data contained in all publications are solely those of the individual author(s) and contributor(s) and not of MDPI and/or the editor(s). MDPI and/or the editor(s) disclaim responsibility for any injury to people or property resulting from any ideas, methods, instructions or products referred to in the content.