Article

Optimal Scheduling and Comprehensive Evaluation of Distributed Resource Aggregator Low-Carbon Economy Considering CET-RPS Coupling Mechanism

1
State Grid Hebei Economic Research Institute, Shijiazhuang 050000, China
2
School of Electrical Engineering and Automation, Wuhan University, Wuhan 430072, China
*
Authors to whom correspondence should be addressed.
Sustainability 2025, 17(20), 9311; https://doi.org/10.3390/su17209311
Submission received: 2 September 2025 / Revised: 10 October 2025 / Accepted: 17 October 2025 / Published: 20 October 2025

Abstract

As the scale of distributed resources continues to expand, decentralization and multi-agent characteristics bring significant challenges to low-carbon dispatching and market participation of power grids. To this end, this paper proposes a collaborative optimization scheduling framework with distributed resource aggregators (DRAs) as the main body, innovatively coupling carbon Emission trading (CET) with electric vehicle carbon quota participation, and the renewable energy quota (RPS) with tradable green certificate (TGC) transaction as the carrier, as well as constructing the connection path between the two to realize the integrated utilization of environmental rights and interests. Based on the ε-constraint method, a bi-objective optimization model of economic cost minimization and carbon emission minimization is established, and a multi-dimensional evaluation system, covering the internal and overall operation performance of the aggregator, is designed. The example shows that, under the proposed CET-RPS coupling mechanism, the total cost of DRA is about 23.4% lower than that of the existing mechanism. When the carbon emission constraint is relaxed from 2700 t to 3000 t, the total cost decreases from CNY 2537.32 to CNY 2487.74, indicating that the carbon constraint has a significant impact on the marginal cost. This study provides a feasible path for the large-scale participation of distributed resources in low-carbon power systems.

1. Introduction

With the continuous expansion of the scale of distributed resources, network information is huge, main interests are diversified and geographically dispersed, and the volatility of electricity consumption are significant. Efficient and reliable management of distributed resources has become a core challenge for power systems [1]. At the same time, with stable, efficient, and flexible grid-connected characteristics, distributed renewable energy power generation clusters are gradually becoming a new mode of power production and renewable energy consumption [2].
In order to fully exploit the potential flexibility of various distributed resources, reference [3] models them from the perspectives of economy, technology, and commercialization. In reference [4], an aggregation scheduling method based on polyhedra is proposed. By scaling and shifting the basic feasible region, the scheduling optimization of the maximum internal aggregation is realized. Reference [5] proposed a distributed energy aggregation algorithm, which can check the feasibility of aggregation and make control and market decisions at the aggregation level. However, the above research mostly stays at the level of resource characteristics or mathematical representation, ignoring the requirements of actual communication infrastructure and the complexity of compliance, measurement, and settlement when participating in the market.
In contrast, the method of aggregating distributed resources into aggregators, such as virtual power plant (VPP), has been widely recognized in energy trading and system support services due to its ability to process massive resources in a short time and perform complex optimal scheduling, as well as lower access and management thresholds, so it has high practical value [6,7,8,9,10]. The existing research on VPP pays more attention to internal resource management and market participation, but there are some shortcomings in the following aspects: first, the integration of energy management and carbon quota incentive mechanisms for mobile energy storage, such as electric vehicles, is insufficient; second, the integration scheme is not given at the levels of system design (such as the convergence rules of CET and RPS) and optimization implementation.
Driven by the low-carbon trend, the establishment of Carbon Emission Trading (CET) is regarded as an important means to promote the priority of renewable energy generation and realize the low-carbon operation of power systems [11]. Reference [12] points out that the step-by-step carbon trading mechanism has stronger binding force on emission reduction than the traditional pricing model, and can guide the subject to optimize emission behavior through graded fees. The scheduling optimization research for aggregators has initially introduced the stepped CET into the model to achieve low-carbon economic operation of multi-load entities. However, such research is mostly limited to traditional load scenarios and does not fully consider the carbon emission reduction potential of mobile energy storage, such as electric vehicles [13]. In fact, as large-scale access mobile energy storage units, EVs can not only improve the flexibility of the system through charging and discharging peak regulation, but also reduce the marginal carbon emissions of the system. Its carbon emission reduction contribution has considerable policy and market values. In order to fill this gap, References [14,15] proposed that mechanisms such as carbon quotas for electric vehicles provide a feasible path for EVs to participate in carbon trading, which not only brings direct emission reduction incentives to car owners and operators, but also helps to achieve synergistic improvement of economic and environmental benefits in multi-agent integrated energy systems.
As an important supplement to renewable energy policy, renewable portfolio standard (RPS) is considered to be the future development direction of China‘s renewable energy incentive policy by increasing the proportion of clean energy consumption through compulsory or incentive means [16,17]. The introduction of tradable green certificate (TGC) transaction under the framework of the RPS mechanism can reduce the rate of energy abandonment and connect with the CET market to build a multi-level incentive system [18].
At present, CET and RPS are two independent trading systems that lack unified accounting and mutual recognition rules, which can easily lead to repeated measurement of emission reduction benefits and unclear incentive transmission. Clarifying the relationship between the two environmental systems and realizing the linkage of environmental rights and interests is the focus of urgent research. Reference [19] qualitatively analyzed the interaction mechanism and connection among the electricity market, carbon market, and green certificate market, and proposed a mutual recognition system of environmental rights and interests through products based on carbon emission reduction performance. Reference [20] focuses on the carbon emission reduction mechanism of green certificates, and proposes interacting with each other at parity in CET and GCT, as well as dynamically adjusting the equivalence coefficient through market demand and transaction price to achieve green carbon convergence. Reference [21] offsets carbon emission rights with excess green certificates, releases more carbon quotas into transactions, and creates a linkage system between green certificates and carbon trading. The above research at the institutional level mostly stays in mechanism analysis and lacks the operational mathematical expression and transaction process design of using TGC to offset carbon quotas in the aggregator optimization model, which restricts the transformation of institutional schemes to specific regulatory strategies.
Under the background of multi-mechanism collaborative operation, it is of great significance to construct a scientific and reasonable evaluation system to measure the scheduling response ability and market adaptability of distributed resources. In view of the performance evaluation of internal distributed resources, Ref. [22] established a quantitative index system of flexible resource clusters from a technical point of view. Ref. [23] proposed a comprehensive benefit evaluation method from the aspects of operational economy, environment, and technology, but it is still difficult to uniformly measure flexibility and economy. In fact, the performance evaluation of distributed resources itself not only needs to pay attention to its economy and technology, but should also integrate the user’s electricity comfort index. Ref. [24] aims at maximizing user satisfaction, and comprehensively considers the comfort and economy of electricity consumption to construct a day-ahead optimal scheduling model. Ref. [25] proposed a charging and discharging strategy based on electric vehicle satisfaction for the relationship between electric vehicle travel convenience and state of charge. Ref. [26] divided users into economic preference and electricity preference by setting differentiated satisfaction weights, which improved the applicability and accuracy of the evaluation model. In the evaluation system, it is necessary to pay attention to both the user experience of internal resources and the overall effectiveness of aggregators. For the overall performance evaluation of the aggregator as the main body, it is necessary to take into account its economic, social, and environmental benefits [27]. Ref. [28] comprehensively evaluates the performance of the aggregator in the market environment through multi-dimensional indicators such as response ability and comprehensive benefits. In summary, the existing evaluation system often considers user satisfaction, economy, and low-carbon goals separately, and lacks a systematic construction of a two-level unified evaluation framework at the internal resource level of the aggregator and the overall level of the aggregator.
In summary, although the existing research has made progress in distributed resource modeling and scheduling optimization under a single market mechanism, it has not systematically embedded the carbon quota incentive and carbon–green certificate (CET-RPS) linkage mechanism into the aggregator (DRA) scheduling decision, and the evaluation system has insufficient consideration of user comfort. In order to fill this gap, the overall research goal of this paper is to design an operable CET-RPS convergence trading mechanism from the perspective of aggregators and to endogenize the carbon quotas of electric vehicles (EVs). A collaborative scheduling model, including EV-controlled charging and discharging constraints, is constructed, and the trade-off solution is solved under the dual-objective ε-constraint framework of economic cost and carbon emission. A multi-level evaluation system for optimal scheduling is proposed to simultaneously quantify user satisfaction, resource flexibility, and an aggregator’s overall cost and carbon emission reduction benefits.
To this end, this paper focuses on answering the following research questions:
  • How can the carbon quota mechanism of electric vehicles be designed and verified so that the space–time scheduling capability of EVs can be quantified as tradable emission reduction benefits and effectively encourage owners and operators to participate in the carbon market?
  • On the basis of considering EV carbon emission reduction, how can the renewable energy green certificates (TGCs) be linked with the carbon quotas (CET), and can a mutual recognition or deduction mechanism be established to avoid repeated measurement and amplify the benefit transmission?
  • Under the joint action of multiple types of distributed resources, how can aggregators build a feasible scheduling and market participation model under the dual objectives of economic cost and carbon emissions to achieve the coordination of low carbon and economic benefits?
  • How can the comprehensive performance of the proposed mechanism and model be evaluated in terms of cost saving, carbon emission reduction, and operation and maintenance feasibility?
In order to answer the above questions, this paper is organized in the following logical order: Firstly, a controlled charging and discharging model of electric vehicles is established to describe travel and SOC constraints. On this basis, the CET-RPS cohesion mechanism considering EV carbon emission reduction capacity is proposed. Then, the institutional constraints are embedded into the DRA dual-objective scheduling model and solved. In addition, a multi-level evaluation system for scheduling is constructed; finally, through the example analysis, the closed loop of system modeling–verification is formed.

2. Methodology

2.1. Controlled Charging and Discharging Model of Electric Vehicles

2.1.1. Daily Mileage of Electric Vehicles

The daily mileage of electric vehicles (EVs) can be used to calculate the amount of electricity consumed by electric vehicles during driving, which, in turn, affects the state of charge and charge time of electric vehicles. The probability density function expression of the daily mileage of electric vehicles can be expressed as follows:
f ( d x ) = 1 d x σ x 2 π exp [ ( ln d x μ x ) 2 2 σ x 2 ]
D = E e v L e v
In the formula, d x is the daily mileage (unit: km); μ x and σ x are the logarithmic mean and standard deviation of the daily mileage. Through the acceptance–rejection sampling method, the daily mileage sample d x x = 1 N of N electric vehicles can be obtained. D is the maximum mileage, E e v is the standard capacity of the battery, and L e v is the driving distance of the unit electric vehicle.

2.1.2. Charge and Discharge Power

Most current electric vehicles use lithium batteries, and the charging of lithium batteries can be analyzed by constant power charging. It is assumed that the charging and discharging power p e v of a single electric vehicle satisfies uniform distribution within 5~6 kW, that is, the probability density of p e v is as follows:
f ( p s i n g l e , e v ) = 1 , p e v [ 5 , 6 ] k W 0 , p e v [ 5 , 6 ] k W

2.1.3. Charge and Discharge Durations

The charging and discharging times of an electric vehicle are mainly determined by the state of charge of the lithium battery s o c e v ( t ) , the charging target s o c c h a , e v , the discharge target s o c d i s , e v , the charging and discharging efficiency μ e v , and the charging and discharging power at the current moment, which can be expressed as follows:
T c h a , e v = ( s o c c h a , e v s o c e v ( t ) ) E e v μ e v p e v T d i s , e v = ( s o c e v ( t ) s o c d i s , e v ) E e v μ e v p e v

2.1.4. Controlled Charging and Discharging Strategy

Morning peak discharge: Starting at 8 a.m., only for vehicles with SOC > 0.5, the use of electric vehicles with sufficient power to participate in the 7–9 point system peak clipping. Evening peak discharge: Discharge begins at 18:00, and vehicles with SOC still higher than 50% are preferentially dispatched; discharge is stopped when the SOC is lower than 10%. Night charging: Charging randomly starts from 23:00 to 24:00, making full use of the valley electricity price to complete the recharge.
In summary, the controlled charging and discharging model of electric vehicles, based on the Monte Carlo simulation, is constructed in this paper. By setting the SOC limit and charging and discharging rules for different periods, the roles of electric vehicles in peak load shifting and valley filling of power grid load are described, which provides a theoretical basis for the subsequent quantitative research on the coordinated operation of renewable energy and the scheduling of distributed resource aggregators.

2.2. The CET-RPS Convergence Trading Mechanism Considering the Carbon Quotas of Electric Vehicles

2.2.1. Carbon Emission Trading Mechanism Considering Carbon Quotas for Electric Vehicles

  • Carbon quotas for electric vehicles
Driven by the trend of low-carbonization, the establishment of Carbon Emission Trading (CET) is regarded as an important means to promote renewable energy priority power generation and realize low-carbon operation of power systems.
In order to fully stimulate the promotion and application of electric vehicles and give full play to their potential benefits in emission reduction, this paper introduces a carbon trading mechanism for electric vehicles based on carbon quotas. Specifically, referring to the differences in carbon emissions between electric vehicles and traditional fuel vehicles at the same driving distance, the carbon emissions saved by electric vehicles are quantified as tradable carbon quotas, giving electric vehicles a certain ‘emission reduction right’.
E C O 2 , e v = P c h a , e v L e v e c a r P c h a , e v P t h e r m a l P c l e a r + P t h e r m a l e t h e r m a l
In the formula, E C O 2 , e v is the carbon quota of an electric vehicle, P c h a , e v is the charging power of an electric vehicle, L e v is the driving distance of an electric vehicle per unit of electricity, e c a r is the carbon emission generated by traditional a fuel vehicle driving 1 km, P c l e a r is the active power of clean energy, P t h e r m a l is the active power of thermal power, and e t h e r m a l is the carbon quota factor of unit power generation.
P t h e r m a l = P m t + P b u y η f i r e
In the formula, η f i r e is the proportion coefficient of thermal power in the power purchase from the power grid by the load aggregator.
2.
Ladder Carbon Emission Trading Model
E C O 2 = χ m t P m t + χ b u y P b u y η f i r e + E C O 2 , e v
In the formula, E C O 2 is the carbon emission quota right of the load aggregator; χ m t and χ b u y are the carbon quota coefficients of the gas turbine and the power grid, respectively.
E C O 2 r e a l = e m t P m t + e g r i d P b u y η f i r e
In the formula, E C O 2 r e a l is the actual carbon emission generated by the load aggregator; e m t and e g r i d are the carbon emission coefficients of gas turbine and power grid, respectively. Then, the carbon emission trading volume E C O 2 d i f of the distributed resource aggregator can be calculated as follows:
E C O 2 d i f = E C O 2 r e a l E C O 2
C C O 2 = λ C O 2 E C O 2 d i f E C O 2 d i f l λ C O 2 1 + α E C O 2 d i f l + λ C O 2 l l E C O 2 d i f 2 l λ C O 2 1 + 2 α E C O 2 d i f 2 l + λ C O 2 2 + α l 2 l E C O 2 d i f 3 l λ C O 2 1 + 3 α E C O 2 d i f 3 l + λ C O 2 3 + 3 α l 3 l E C O 2 d i f 4 l λ 1 + 4 α E C O 2 d i f 4 l + λ 4 + 6 α l E C O 2 d i f 4 l
where λ C O 2 is the benchmark price of carbon trading, α is the price growth rate, and l is the interval length of carbon emissions.

2.2.2. Renewable Portfolio Standard Mechanism

Renewable portfolio standard (RPS) is a market-oriented support policy established by the government to promote the clean transformation of power systems and increase the proportion of renewable energy consumption. The core idea is to force or motivate power suppliers (such as power generation companies, power retailers, or distributed resource aggregators) to ensure that a certain proportion of their sales or consumption of electricity comes from renewable energy within the specified period, or through the purchase of the same amount in renewable energy certificates (RECs). RPS can not only force the optimization of energy structure, but also play the role of market price discovery and resource allocation adjustment through the trading mechanism. Quota requirements are as follows:
Q = ψ ( P c u t + P s h i f t + P t r a n s + P c h a , e v )
In the formula, Q is the green certificate quota obtained by the distributed resource aggregator, and ψ is the green certificate quota coefficient of the distributed resource aggregator, which reflects the minimum penetration level of renewable energy set by the policy.
Actual number of certificates: the total amount in green certificates obtained by distributed resource aggregators through their own renewable resources, as follows:
Q r e a l = = τ p v P p v + τ w i n d P w i n d
In the formula, Q r e a l is the number of green certificates held by distributed resource aggregators; τ p v and τ w i n d are the green certificate conversion coefficients of photovoltaic and wind power, respectively.
Transaction costs and incentives: if the actual number of certificates held by the compliance subject is lower than the quota requirement, it needs to be compensated according to the difference; if the subject exceeds performance, additional benefits can be obtained.
C G C T = λ G R E E N * ( Q Q r e a l )
In the formula, C G C T is the green certificate transaction cost, and λ G R E E N is the green certificate unit price.
Through the above mechanism, RPS and green certificate trading together constitute a closed-loop market operation mode of “quota–trading–performance“: the policy sets the proportion of the total amount, the trading market provides the balance adjustment, and the performance cost is fed back to the electricity price and investment income analysis of the whole platform, so as to realize the market-oriented promotion of the development and utilization of renewable energy.

2.2.3. Carbon Emission Trading–Renewable Portfolio Standard Convergence Trading Mechanism

According to the first edition of the integrated baseline methodology for renewable energy power generation grid-connected projects (CM-001-V01) issued by the National Development and Reform Commission of China [29], the emission reduction contribution of renewable energy power generation can be determined by the emission reduction project China regional grid baseline emission factor. For wind power and solar power projects, the weight of the marginal emission factor of electricity χ O M is 0.75, and the weight of the marginal emission factor of capacity χ B M is 0.25; the carbon quota coefficient χ G C T can be calculated as offset by green certificates:
χ G C T = 0.75 * χ O M + 0.25 * χ B M
After the distributed resource aggregator completes the renewable energy quota assessment and determines the number of excess green certificates, the corresponding carbon reduction E C O 2 G C T of green electricity can be calculated as follows:
E C O 2 G C T = χ G C T * ( Q r e a l Q )
After green certificates offset some carbon emissions, the carbon trading volume of distributed resource aggregators can be calculated as follows:
E C O 2 d i f = E C O 2 r e a l E C O 2 E C O 2 G C T
This mechanism allows the DRA to convert its excess green certificates into deductible carbon quotas in the carbon trading market after meeting the renewable portfolio standard (RPS) assessment, thereby reducing carbon transaction costs and achieving mutual recognition of environmental rights and interests between systems. This not only improves the utilization efficiency of environmental assets generated by RPS, but also provides economic incentives for low-carbon scheduling through institutional coupling.

2.3. Optimal Scheduling Model

2.3.1. Objective Function

  • Economic objectives
Distributed resource aggregators consider aggregators’ overall operating cost F minimization, as follows:
F = C G R I D + C O M + C L O A D + C M T + C E V + C C O 2 + C G C T
In the formula, C G R I D is the interaction cost between the distributed resource aggregator and the power grid, C O M is the operation and maintenance cost, C L O A D is the distributed flexible load response subsidy, C M T is the distributed microturbine cost, and C E V is the electric vehicle cost.
C G R I D = c b u y P b u y c s e l l P s e l l
In the formula, c b u y and c s e l l are the electricity purchase price and the electricity selling price of the distributed resource aggregator, while P b u y and P s e l l are the electricity purchase quantity and the electricity selling quantity, respectively.
C O M = c p v P p v + c w i n d P w i n d + c E S ( P c h a , E S + P d i s , E S )
In the formula, c p v , c w i n d , and c E S are the operation and maintenance costs of photovoltaic power, wind power, and energy storage, respectively; P c h a , E S and P d i s , E S are the charging and discharging amounts of energy storage.
C L O A D = c c u t Δ P c u t + c s h i f t Δ P s h i f t + c t r a n s Δ P t r a n s
In the formula, c c u t , c s h i f t , and c t r a n s , respectively, represent the compensation prices of load curtailment, transferable load, and shiftable load, while Δ P c u t , Δ P s h i f t , and Δ P t r a n s , respectively, represent the dispatching loads of load curtailment, transferable load, and shiftable load.
C M T = a m t × ( P M T ) 2 + b m t P M T + c m t
In the formula, P M T is the power generation of the distributed microturbine; a m t , b m t , and c m t are the cost coefficients of the microturbine.
C E V = c b u y , e v P c h a , e v + c s e l l , e v P d i s , e v + c l o s s , e v ( P c h a , e v + P d i s , e v ) + c c a r P d i s , e v
In the formula, P c h a , e v and P d i s , e v are the electric vehicle charging and discharging power, c b u y , e v and c s e l l , e v are the electricity purchase and sale prices of the electric vehicle to the distributed resource aggregator, c l o s s , e v is the cost of electric vehicle battery loss, and c c a r is the electric vehicle discharge subsidy. The cost of an electric vehicle is considered to be composed of three parts, the first of which is the charging and discharging cost of electric vehicles; the second is the battery loss cost of the electric vehicle; and the third is the discharge subsidy of the electric vehicle.
2.
Carbon emission targets
The carbon emissions of distributed resource aggregators are mainly considered to be composed of two parts, one of which is the carbon emission generated by the micro gas turbine inside the aggregator, while the other is the carbon emission generated by the power grid purchase. Carbon emissions E C O 2 r e a l can be calculated as follows:
E C O 2 r e a l = e m t P m t + e g r i d P b u y η f i r e

2.3.2. Constraint Conditions

1.
Constraints of microturbines
0 P M T P M A X , M T
In the formula, P M T is the power of the microturbine, and P M A X , M T is the upper limit of the microturbine output.
P M T ( t ) P M T ( t 1 ) P u p , M T P d o w n , M T P M T ( t 1 ) P M T ( t )
In the formula, P u p , M T and P d o w n , M T are the upper and lower limits of climbing power of a microturbine.
2.
Constraints of electric vehicles
Constraints of charge and discharge power:
0 P c h a , e v ( t ) Y c h a , e v P M A X , e v 0 P d i s , e v ( t ) Y d i s , e v P M A X , e v 0 Y c h a , e v + Y d i s , e v 1
In the formula, Y c h a , e v and Y d i s , e v represent the charging and discharging states of an electric vehicle, respectively, and P M A X , e v represents the upper limits of charging and discharging power of an electric vehicle.
Constraints of state of charge:
S O C min , e v S O C e v ( t ) S O C max , e v S O C e v ( t ) = S O C e v ( t 1 ) + μ c h a , e v P c h a , e v ( t ) + P d i s , e v ( t ) / μ d i s , e v
In the formula, S O C min , e v and S O C max , e v are the minimum and maximum states of charge of the electric vehicle, respectively; μ c h a , e v and μ d i s , e v are the charge and discharge efficiency values of the electric vehicle, respectively.
Constraints of total load of electric vehicle group:
In order to avoid the impact of a large number of electric vehicles charging and discharging on the power grid, it is necessary to set the upper and lower bounds on the cumulative energy of electric vehicle charging and discharging, as follows:
E _ c h a , e v N t = 1 T P c h a , e v ( t ) Δ t E ¯ c h a , e v E _ d i s , e v N t = 1 T P d i s , e v ( t ) Δ t E ¯ d i s , e v
In the formula, E ¯ c h a , e v and E _ c h a , e v are the upper and lower bounds of the cumulative charging energy of the electric vehicle group. The total charging and discharging loads P L O A D , e v of N electric vehicle groups can be calculated as follows:
P L O A D , e v = N ( Y c h a , e v P c h a , e v + Y d i s , e v P d i s , e v )
3.
Constraints of distributed flexible load
  • Reducible loads:
0 Δ P c u t Y c u t β c u t P c u t Δ P c u t = P c u t P c u t
In the formula, Δ P c u t is the amount of load reduced, P c u t and P c u t are the load values before and after the load reduction, and β c u t is the proportion of load reduction.
The load that can be reduced is only accepted within the specified period of time [ t c u t , t c u t + ] , and the load is not reduced during other periods, Y c u t is the 0–1 variable that characterizes the load reduction state, and n c u t is the total number of periods allowed to be reduced.
  • Transferable load:
0 P s h i f t b e Y s h i f t β s h i f t P s h i f t t = t s h t = t s h + ( P s h i f t b e P s h i f t a f ) = 0
In the formula, P s h i f t b e and P s h i f t a f are the load values before and after the transfer of transferable load, and β s h i f t is the proportion of transferable load.
[ t s h , t s h + ] is the period when the transferable load accepts the load transfer, and Y s h i f t uses a 0–1 variable to represent the state of load transfer.
  • Shiftable loads:
0 P t r a n s b e Y t r a n s β t r a n s P t r a n s
In the formula, P t r a n s b e and P t r a n s a f are the load values before and after translation, respectively, and β t r a n s is the proportion of translation load.
The total electricity consumption before and after load translation remains unchanged, [ t t r , t t r + ] is the period of time when the load can be translated to accept the load translation, and the 0–1 variable Y t r a n s is used to represent the state of the transfer within the τ of a certain period of time. The electricity consumption before and after the load translation remains unchanged, as follows:
t = t t r t = t t r + ( P t r a n s b e P t r a n s a f ) = 0
The load is shifted to the interval with τ as the starting time, that is, τ [ t t r , t t r + L t r a n s + 1 ] needs to meet the running time continuity constraint, as follows:
t = τ τ + L 1 Y t r a n s ( t ) L t r a n s ( Y t r a n s ( τ ) Y t r a n s ( τ 1 ) )
τ is any time within the acceptable shift period, and L t r a n s is the duration of the shiftable load.
4.
Constraints of energy storage
0 P c h a , E S ( t ) Y c h a , E S P M A X , E S 0 P d i s , E S ( t ) Y d i s , E S P M A X , E S 0 Y c h a , E S + Y d i s , E S 1
In the formula, Y c h a , E S and Y d i s , E S represent the charging and discharging operation states of energy storage, and P M A X , E S is the upper limit of energy storage power.
S O C M I N , E S S O C E S ( t ) S O C M A X , E S S O C E S ( 0 ) = S O C E S ( T ) S O C E S ( t ) = S O C E S ( t 1 ) + μ c h a , E S P c h a , E S ( t ) + P d i s , E S ( t ) / μ d i s , E S
In the formula, S O C M I N , E S and S O C M A X , E S are the minimum and maximum states of charge of energy storage; μ c h a , E S and μ d i s , E S are the charge and discharge efficiency values of energy storage.
5.
Constraints on grid transactions
0 P b u y Y b u y P M A X , g r i d 0 P s e l l Y s e l l P M A X , g r i d 0 Y b u y + Y s e l l 1
In the formula, Y b u y and Y s e l l are the purchase and sale states of the power grid, and P M A X , g r i d is the upper limit of the interactive power of the power grid.
6.
Constraints of aggregator power balance
The distributed resource aggregator requires power balance in each period, and the specific constraints are as follows:
P p v + P w i n d + P b u y + P d i s , E S + P M T = P c u t + P s h i f t + P t r a n s + P s e l l + P c h a , E S + P L O A D , E V

2.3.3. Solution Methods

1.
Big-M method
The Big-M method is a linearization modeling method, commonly used to deal with logical constraints, which is suitable for mixed-integer linear programming models. This method transforms the original nonlinear logical relationship into linear inequality constraints by introducing a sufficiently large positive number M and a 0–1 decision variable Y, so as to facilitate the solution.
For a constraint, if the constraint takes effect only when the binary variable Y = 1,
Y = 1 g x 0
it can be transformed into the following linear inequality:
( 1 Y ) M g x ( 1 Y ) M
In the formula, M is a sufficiently large positive number to ensure that the relaxation constraint is valid.
2.
Constraint method
The ε-constraint method is a classical method widely used in multi-objective optimization problems. It is suitable for solving problems with two or more conflicting objective functions. By retaining one of the objective functions as the main objective function, the remaining objective functions are transformed into constraints, so as to optimize the solution.
If the original multi-objective optimization problem is as follows,
min x X   F x = f 1 x , f 2 x , , f K x , s . t . g i x 0 , i = 1 , 2 , , m h j x = 0 , j = 1 , 2 , , p
X R n is the decision space. When the ε-constraint method is applied, the arbitrary target f p x is selected as the main target, and the remaining target f k x k p becomes a constraint, as follows:
min x X   f p x , s . t . f k x ε k , k 1 , , K , k p , g i x 0 , i = 1 , , m , h j x = 0 , j = 1 , , p .  

2.4. The Overall Evaluation System of DRA Internal Resources and Aggregators for Optimal Scheduling

In order to verify the comprehensive effect of the optimal scheduling scheme, this section proposes a two-layer evaluation framework covering the resource side and the system side. On the one hand, it quantifies the scheduling response and synergy of various distributed resources within the system. On the other hand, it evaluates the overall performance of aggregators in terms of load stabilization, self-sufficiency rate, carbon emission reduction, and economic benefits. The system realizes a comprehensive evaluation from micro-resource scheduling to macro-system performance and provides scientific and quantifiable support for subsequent strategy optimization and operational decision making.

2.4.1. Distributed Resource Evaluation System Within Aggregators

1.
Evaluation index of internal distributed resources
The evaluation system for the distributed resources within the aggregator is shown in Table 1. Through a unified and quantifiable indicator framework, the scheduling response characteristics and economic performance of various distributed resources in actual operation can be revealed. This evaluation not only helps operators understand the flexibility and synergy of various resources in different scheduling scenarios, but also provides decision-making bases for optimizing resource combination, improving system reliability, and economic benefits.
2.
Satisfaction model
Distributed resource aggregators need to flexibly control user load and electric vehicle charging and discharging behaviors to ensure grid security and economy. However, when the scheduling scheme significantly changes the user load or the charging and discharging states of the EV, the user experience (comfort or satisfaction) may be significantly reduced, which, in turn, affects the enthusiasm of the demand response. In this paper, three types of flexible loads and charging and discharging behaviors of electric vehicles are incorporated into the same satisfaction system. The specific modeling is as follows:
(1)
Electricity satisfaction
Distributed flexible load power satisfaction:
  • Reducible loads:
For the reducible load, the user’s demand for electricity at each time period is directly reduced, and the experience loss has obvious ‘time period independence’. A reduction will significantly reduce the comfort of the period. Therefore, this paper uses hourly deviation to measure comfort U c u t , c o m and reflect the experience change at each moment:
U c u t , c o m = 1 1 T t T P c u t P c u t P c u t
  • Transferable and shiftable loads:
Both transferable load and shiftable load require the conservation of total energy throughout the day. Users pay more attention to whether the ‘total energy throughout the day’ is up to standard, but they will feel inconvenience due to changes in power consumption time distribution. Since this is not cumulative and holistic, this paper uses the all-day deviation to measure the user’s electricity satisfaction, as follows:
U s h i f t , c o m = 1 t = 1 T ( P s h i f t P s h i f t ) t = 1 T P s h i f t U t r a n s , c o m = 1 t = 1 T ( P t r a n s P t r a n s ) t = 1 T P t r a n s
In the formula, U s h i f t , c o m and U t r a n s , c o m are the electricity satisfaction values of transferable load and shiftable load, respectively.
  • Electric vehicles:
The electricity satisfaction of electric vehicles is different from that of flexible loads. The electricity satisfaction of electric vehicles is mainly determined by their state of charge S O C E V . After charging, the increase in S O C E V will increase satisfaction, and vice versa, the satisfaction will decrease. The calculation formula can be expressed as follows:
U E V , c o m = 1 S O C E V S O C E V S O C E V
In the formula, U E V , c o m is the electricity satisfaction of an electric vehicle, and S O C E V is the state of charge of the electric vehicle before scheduling.
(2)
Financial satisfaction
  • Economic satisfaction of distributed flexible load:
U L O A D , e c o = 1 C L O A D C L O A D C L O A D
In the formula, U L O A D , e c o is the economic satisfaction degree of distributed flexible load, and C L O A D is the economic cost before load dispatch.
  • Economic satisfaction of electric vehicles:
U E V , e c o = 1 C E V C E V C E V
In the formula, U E V , e c o is the economic satisfaction of electric vehicles, and C E V is the economic cost before dispatching electric vehicles.
(3)
Comprehensive satisfaction degree
According to the differences in electricity preference and economic preference between distributed flexible load users and electric vehicle users, the above users can be divided into categories based on electricity preference, no preference, and economic preference, and the following user comprehensive satisfaction expression is established:
U a l l = ω c o m U c o m + ω e c o U e c o ω c o m + ω e c o = 1
In the formula, ω c o m and ω e c o are the weights of electricity satisfaction and economic satisfaction, respectively.

2.4.2. Aggregator Overall Evaluation System

As shown in Table 2, the overall evaluation system for aggregators is based on the system level, and measures the load stabilization effect, energy self-sufficiency, clean energy utilization, carbon emission intensity, and cost–benefit status from a comprehensive perspective, taking into account the added values of policy incentives. This evaluation fully reflects the overall performance of aggregators in achieving load balance, promoting green and low-carbon transformation, and responding to policy orientation, and provides an important reference for continuously optimizing operation strategies and promoting market-oriented development.
Through a systematic evaluation framework, we can quantitatively analyze the operational characteristics and economic benefits of aggregators and their internal distributed resources, which not only provides a scientific basis for optimizing scheduling strategies and improving system flexibility and reliability, but also enables key elements such as carbon emissions, costs, and policy synergies to be fully measured. Such evaluation can help operators accurately identify bottlenecks and potential, provide decision support for resource allocation and market-oriented operation, promote the coordinated development of distributed energy and electric vehicles, and help achieve green and low-carbon transformation and sustainable power system construction.

3. Analysis

3.1. Parameter Settings

The charging and discharging parameters of the electric vehicle were as follows: μ x took 3.2, σ x took 0.88, the battery capacity was 30 kW · h, and the value of distance L e v for which the electric vehicle consumed 1 kW · h was 5 km. The quota of microturbine χ m t was 0.156, and the carbon quota coefficient of power grid χ m t was 0.789. The carbon emission factor of microturbine e m t was 0.4. The carbon emission factor of thermal power in the power grid e g r i d was 0.92, and the proportion of thermal power in the purchase of power in the power grid η f i r e was 85%. In this paper, the electricity purchase price and the feed-in tariff referenced [30], while the remaining parameters were set as shown in Table 3.

3.2. Verification of CET-RPS Cohesion Mechanism

3.2.1. Comparison of Different Scenarios

In order to verify the correctness and effectiveness of the CET-RPS connection model established in this paper, as shown in Table 4, four different operating scenarios were compared and analyzed.
As shown in Figure 1, since the distributed new energy generation and load in each scenario used the predicted values, the RPS costs of all scenarios except Scene 1 were CNY −738.16, and the data in Table 5 were found. The total cost of introducing CET and RPS was significantly lower. Compared with Scenes 1 and 2, the total cost of DRA was reduced by CNY 382.6 after the introduction of CET and RPS. The cost reduction was mainly due to the stable economic incentives brought by RPS. At the same time, the carbon price signal of CET also guided DRA to prioritize the scheduling of low-carbon resources, achieving the dual optimization of economy and low-carbon emissions.
When the carbon quotas of electric vehicles were included in the scheduling framework (Scene 3), the carbon saved by the same mileage emission difference between electric vehicles and fuel vehicles was converted into tradable quotas, so that the net carbon quota demand plummeted to 228.47 t, and the carbon transaction cost was only CNY 88.71; thus, the total cost of the system was further reduced to CNY 3246.75. The results verify that electric vehicles, as a ‘mobile emission reduction source’, can achieve carbon emission reduction in the transportation sector while marketizing their saved emissions, significantly supplementing the carbon supply gap of traditional power sources and reducing overall operating costs.
In Scene 4, the deep integration of the two systems was realized by constructing the CET-RPS cohesion mechanism. The use of DRA led to a surplus in green certificates. It was converted into a deductible carbon emission reduction to obtain a carbon trading income of CNY 670.21, and the total cost was reduced to CNY 2486.90, which is 23.4% lower than that of Scene 3. The results show that the convergence mechanism not only optimized the use efficiency of DRA’s carbon assets, but also further enhanced its comprehensive competitiveness in the low-carbon market.

3.2.2. Scene 4 Result Analysis

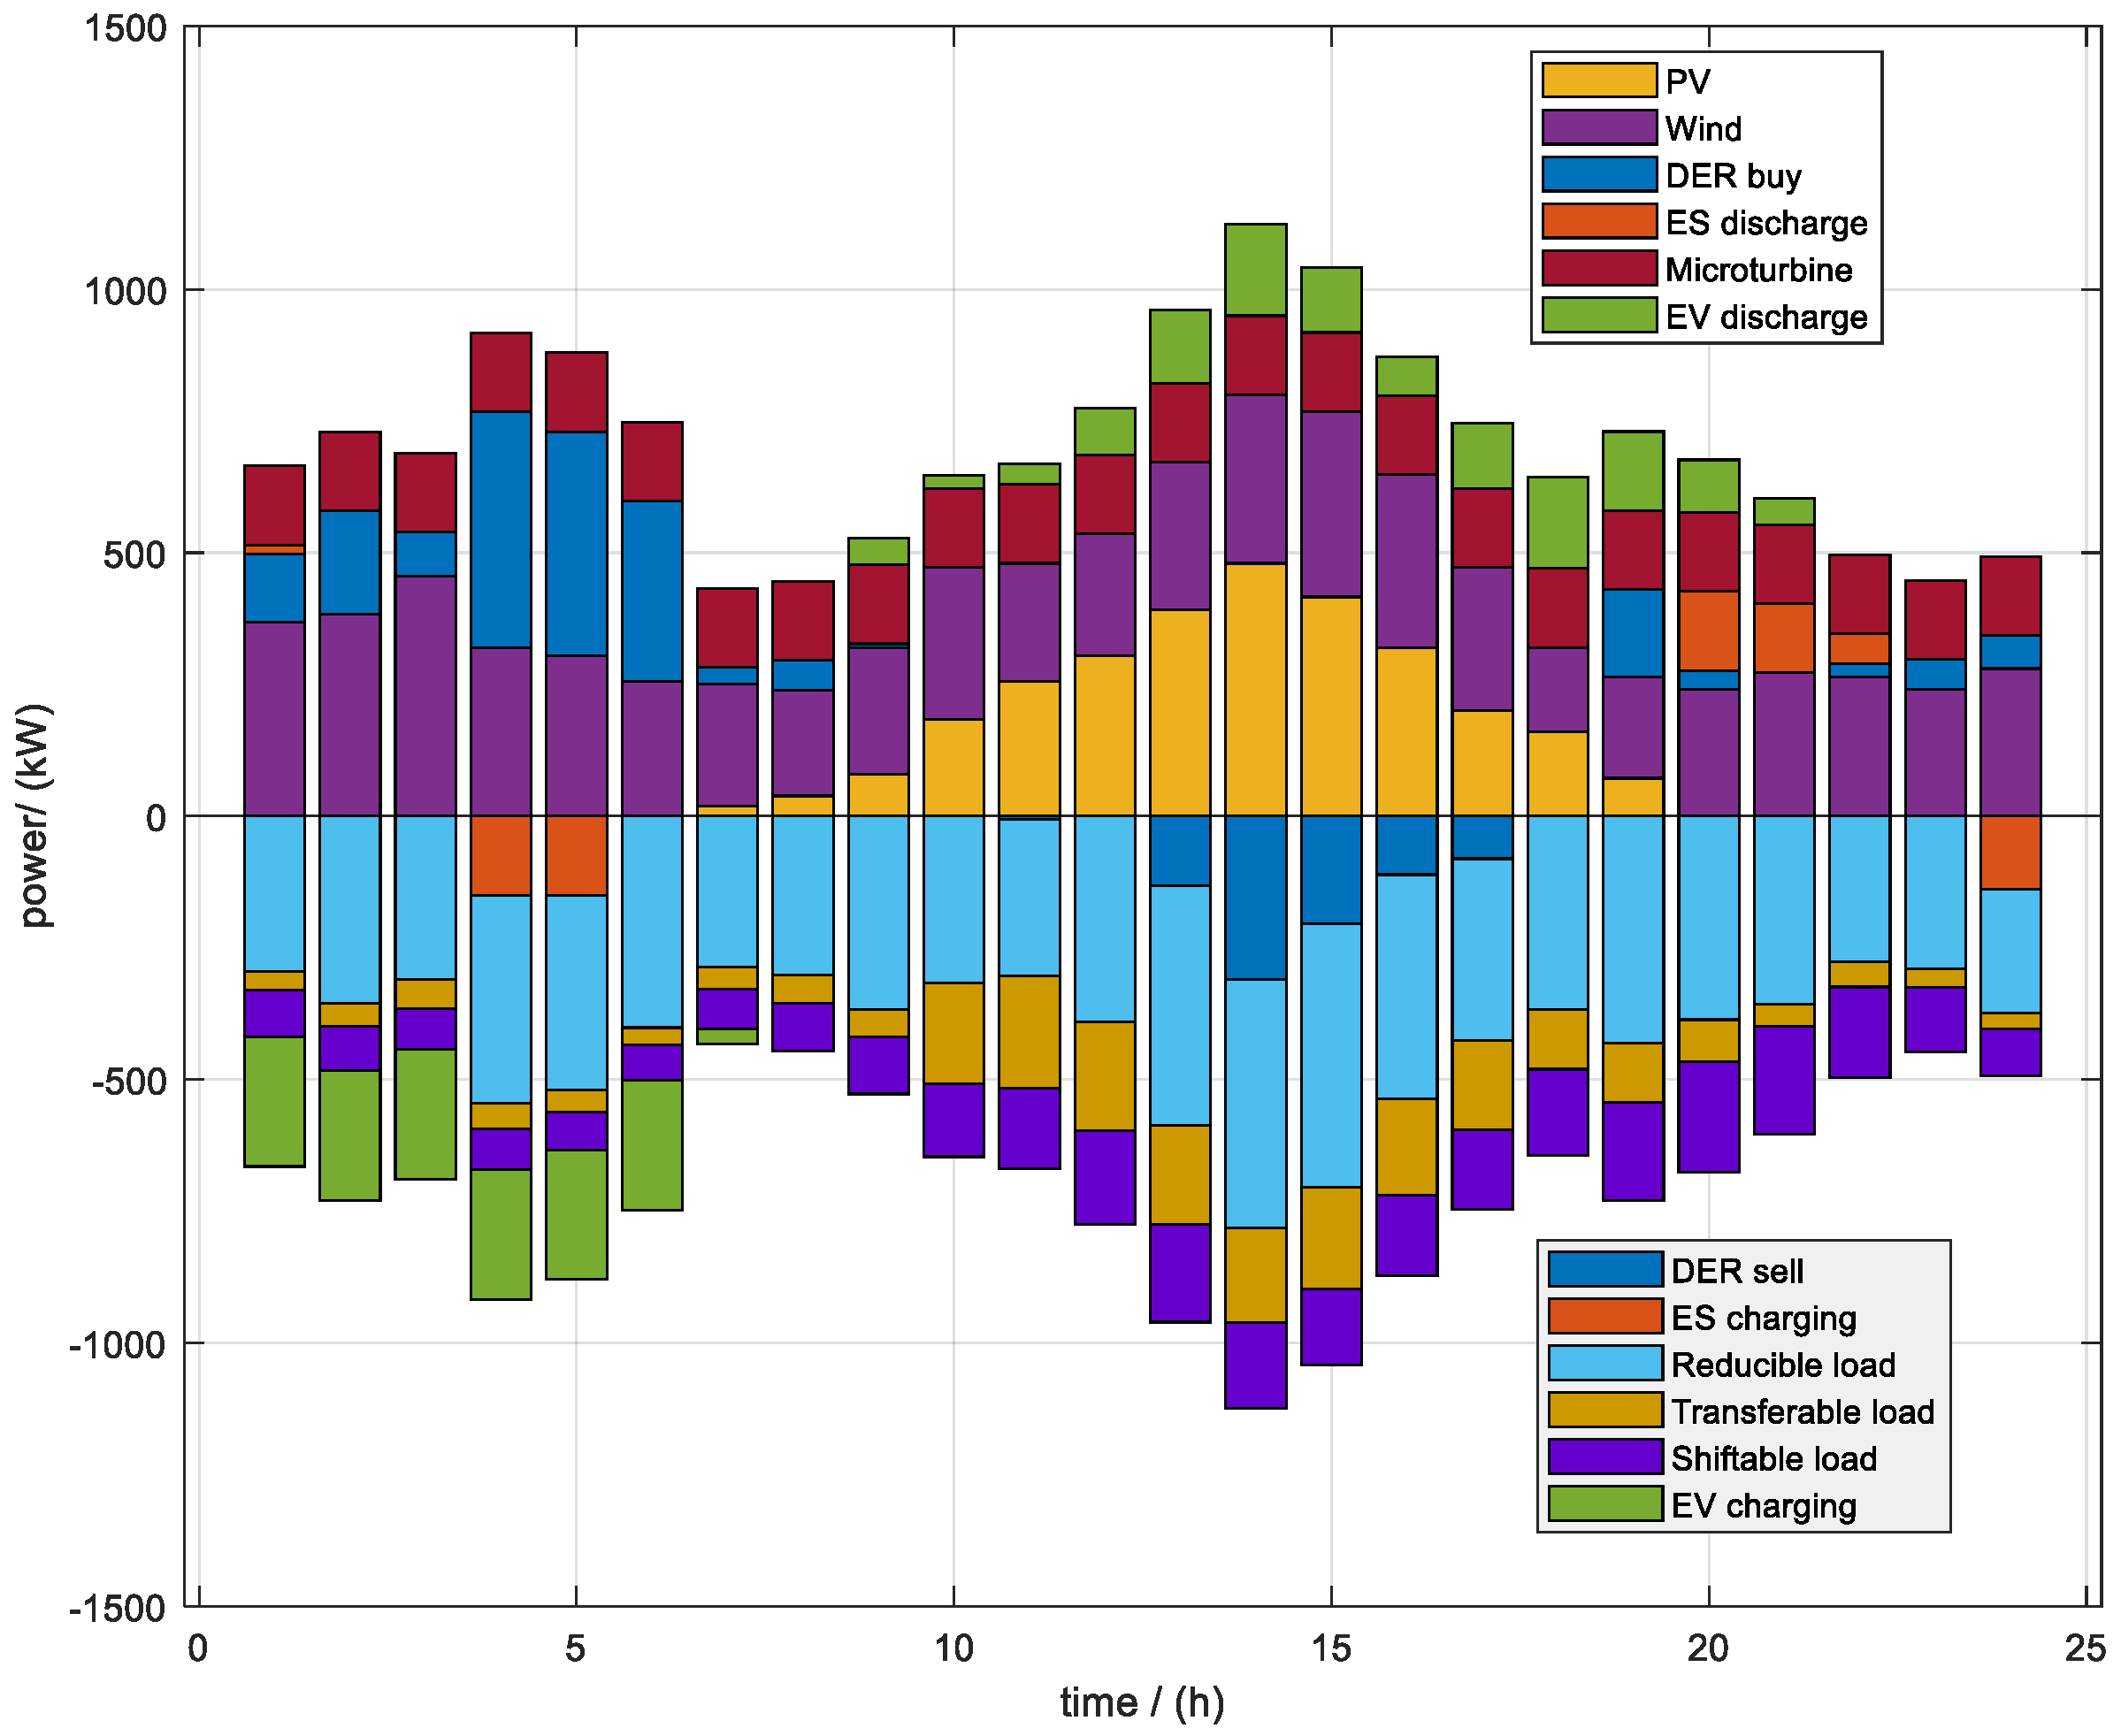
The specific optimization results of Scene 4 are shown in Figure 2, and distributed photovoltaic and wind power were complementary in typical time periods: photovoltaic power generation reached its peak at 10:00–14:00, and wind power output was relatively concentrated in the early morning and evening. They contribute most of the clean power and effectively support the green scheduling goal of DRA. The micro gas turbine maintained a constant base load output, providing the minimum operating guarantee for the system without participating in frequent regulation. DRA purchased electricity from the power grid from the low-price period at 5:00, started to sell electricity during the high-price period at 15:00, and flexibly allocated limited energy storage devices to stabilize the intermittent fluctuations of renewable energy and compress the peak–valley difference in the system. Compared with the method of relying solely on energy storage, the multi-resource linkage scheduling of DRA can maximize the economic benefits while ensuring system security. The introduction of carbon trading (CET) and green certificate (RPS) mechanisms can further promote the priority scheduling of clean power and internalize environmental costs into economic objectives.
On the load side, the DRA coordinated three types of flexible loads, reduced, transferred, or translated, and dynamically adjusted according to the price signal and system pressure to alleviate the power shock during the peak period. As mobile energy storage, the electric vehicle group not only provided a peak-shaving capability similar to energy storage, but also formed a space–time complementarity with fixed energy storage through low-price valley charging and high-price period V2G reverse discharge. DRA coordinated the coordinated operation of flexible load and EV charging and discharging, which made up for the limitation of energy storage operation and realized more fine-grained load management. At the same time, the charging and discharging behaviors of EV were included in the CET carbon transaction cost, which optimized the user’s electricity cost and system carbon footprint in both directions, effectively helping to meet the RPS renewable energy quota requirements and constructing an efficient and low-carbon operation framework of power generation–storage–utilization integration.
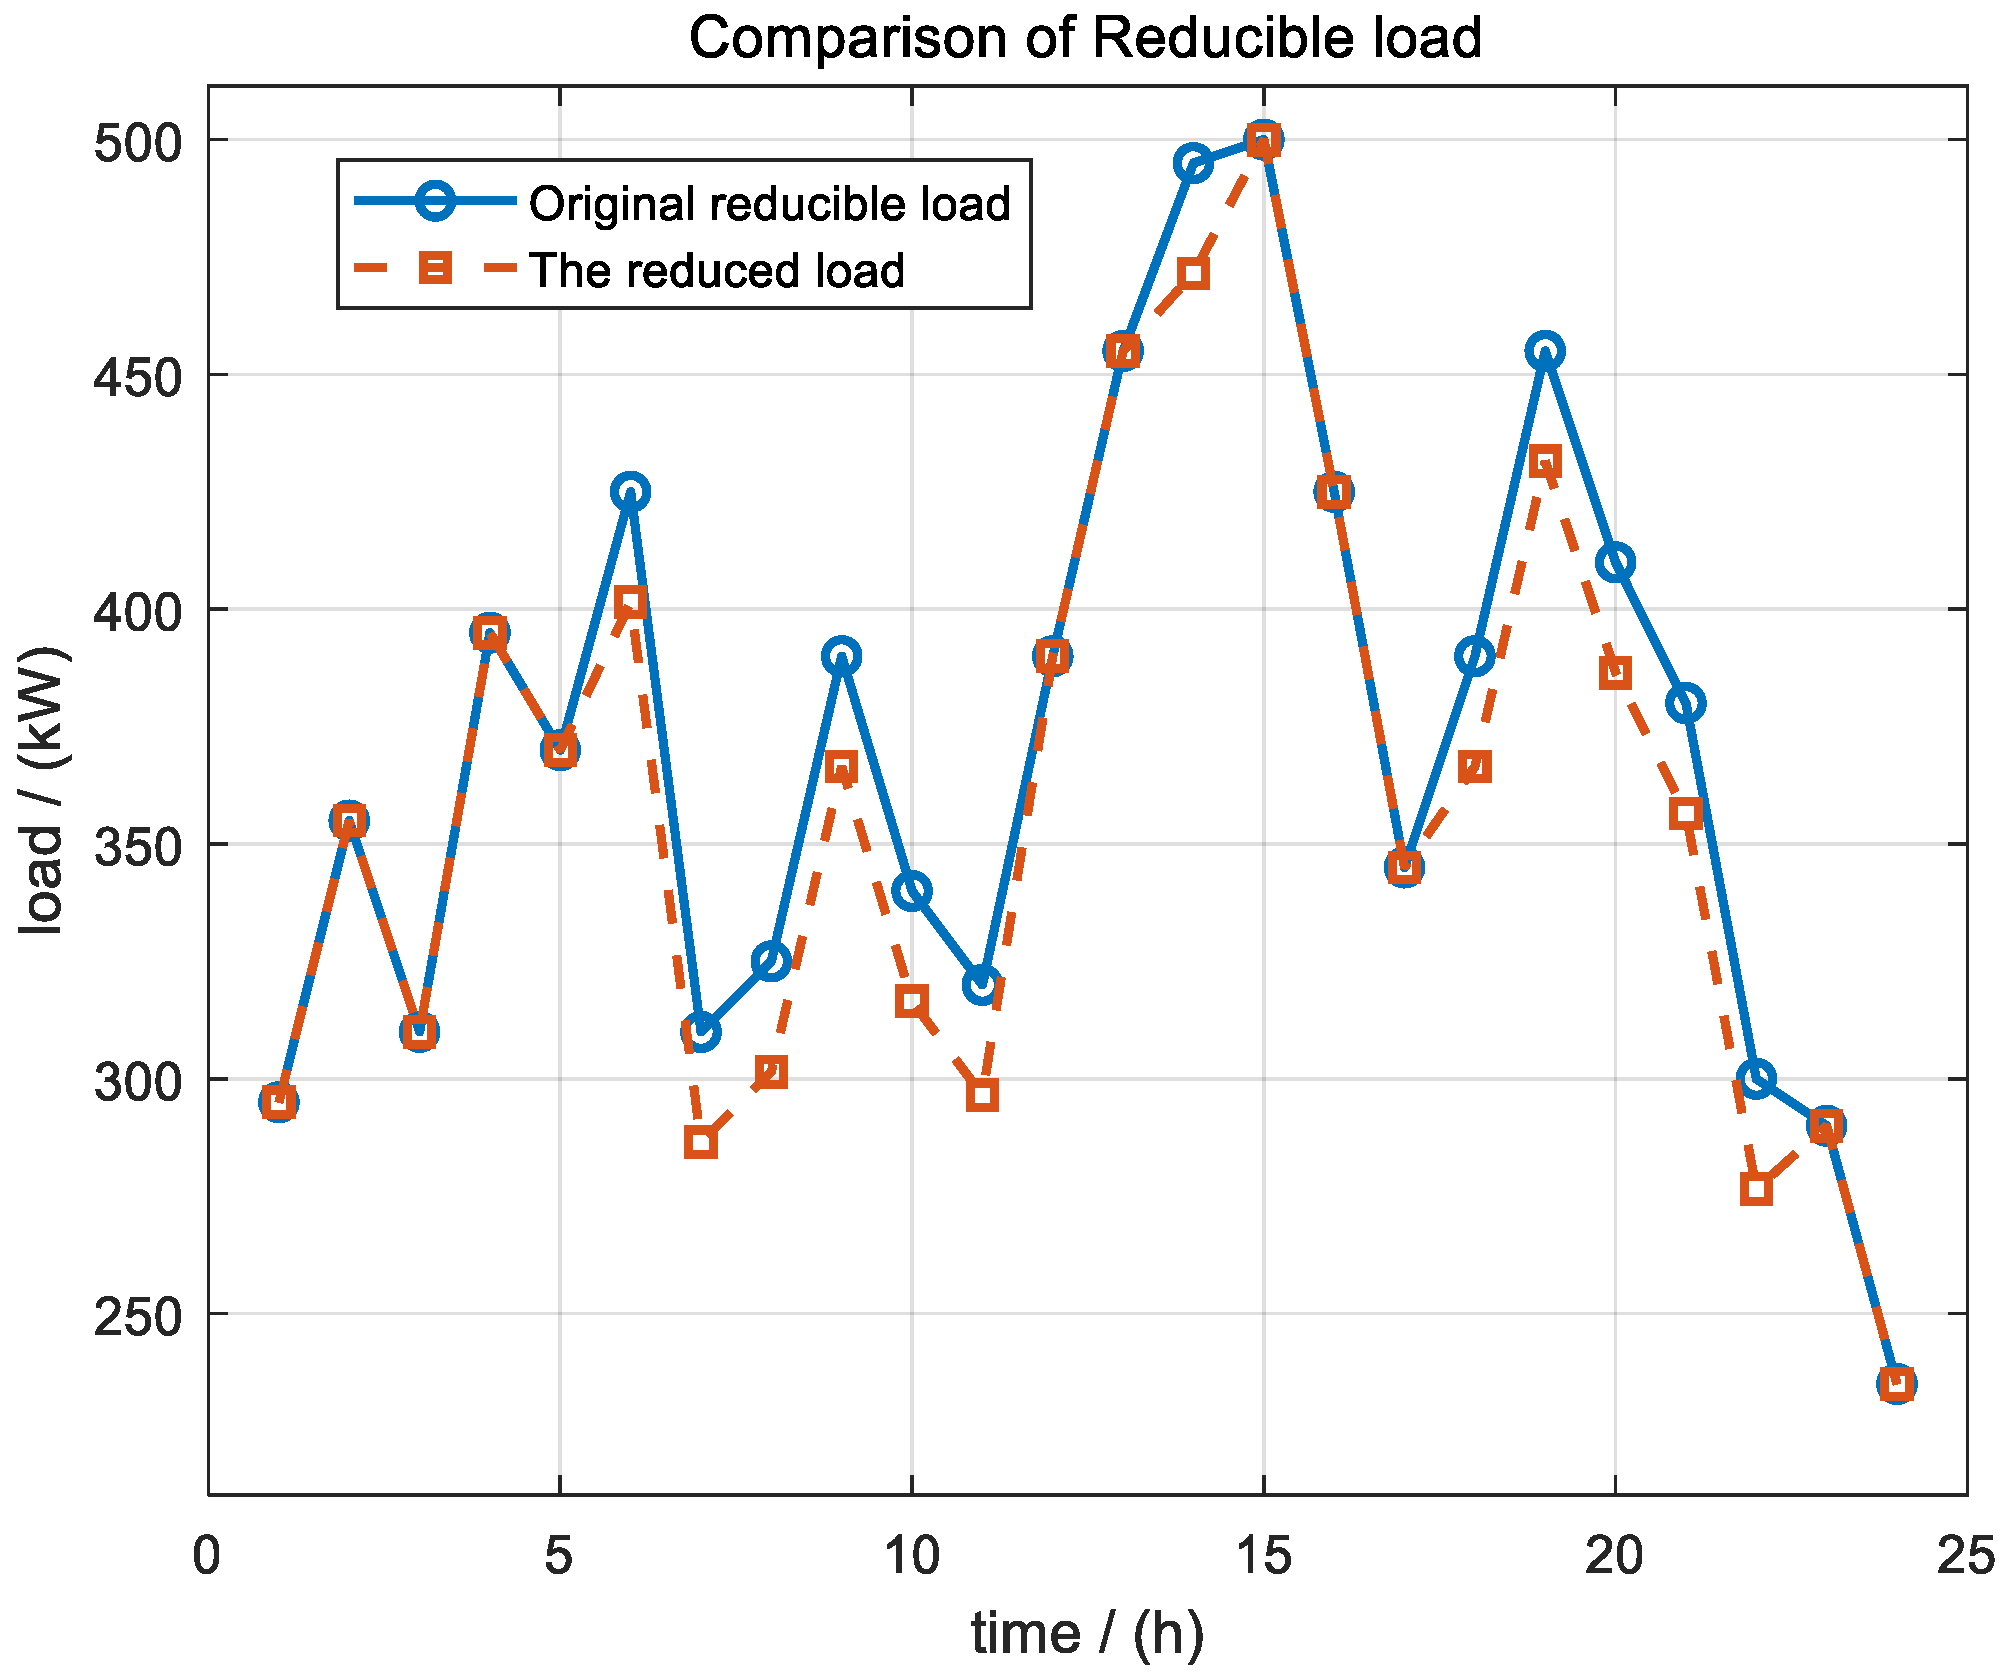
As shown in Figure 3, the overall load reduction showed a certain degree of decline, especially in the peak load period (such as 6 to 10 h), such as 6 h from 425 to 401.5 and 7 h from 310 to 286.5, reflecting that this kind of load was preferentially used for peak suppression and carbon emission pressure drop in system regulation. Due to its ability to withstand interruption or power reduction, the system can effectively reduce the operating cost and peak load without affecting the core load demand by flexible reduction.
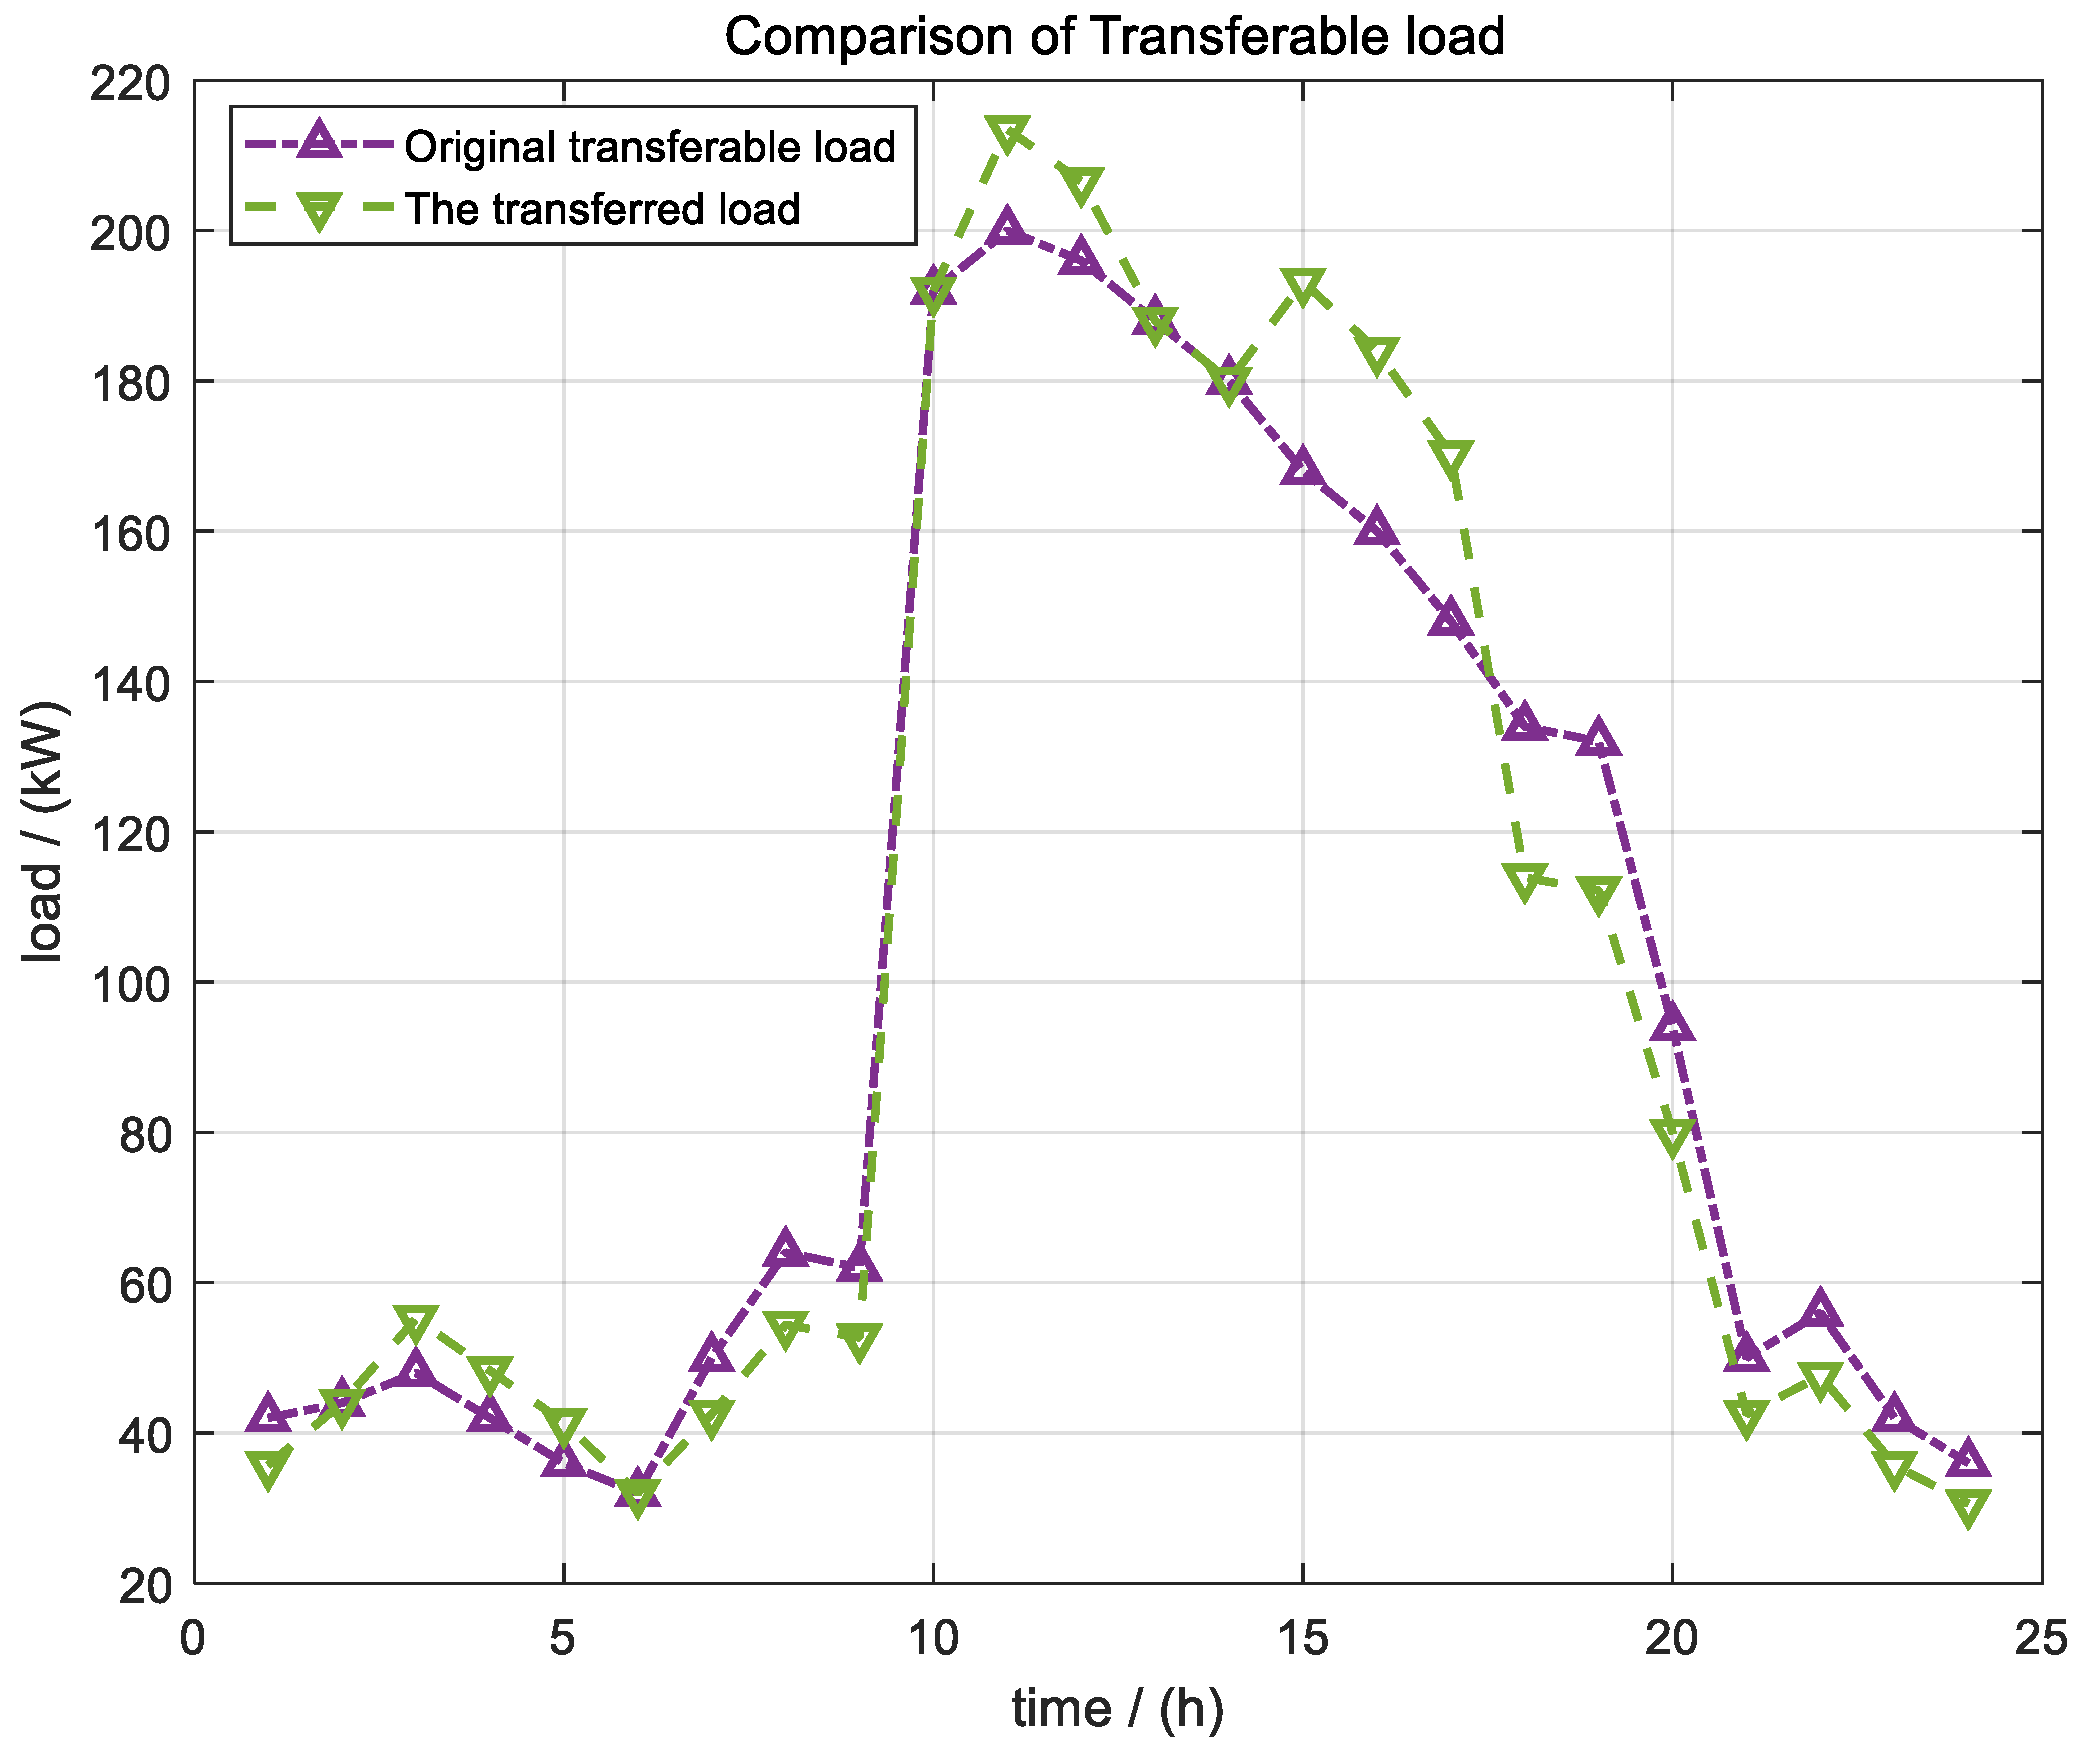
As shown in Figure 4, moderate reductions were made during periods of insufficient photovoltaic output in the morning and evening, and relatively high grid electricity and carbon trading prices (e.g., from 42 kW to 35.7 kW in period 1, and to 42.5 kW, 54.4 kW, and 52.7 kW in periods 7–9, respectively), and the equivalent load was shifted to the midday and afternoon photovoltaic peak periods. In this process, the total shift energy remained unchanged, which not only made full use of the low electricity price during the high-incidence period of renewable energy, but also effectively smoothed the net load curve and reduced the power purchase demand of the power grid and the loss of renewable wind and light abandonment.
As shown in Figure 5, the shiftable load was shifted from the 6–9 period, with relatively scarce wind and solar resources, to the 18–21 period, with abundant renewable power generation, which not only smoothed the net load curve of DRA, but also improved the consumption rate of renewable energy. Through this cross-period equivalent translation, the system could effectively reduce the power purchase expenditure in the high-cost period and obtain sufficient power supply in the surplus period of renewable power generation. The overall load curve is smoother, the peak–valley difference is reduced, and the system operation cost and carbon emission intensity are significantly reduced.
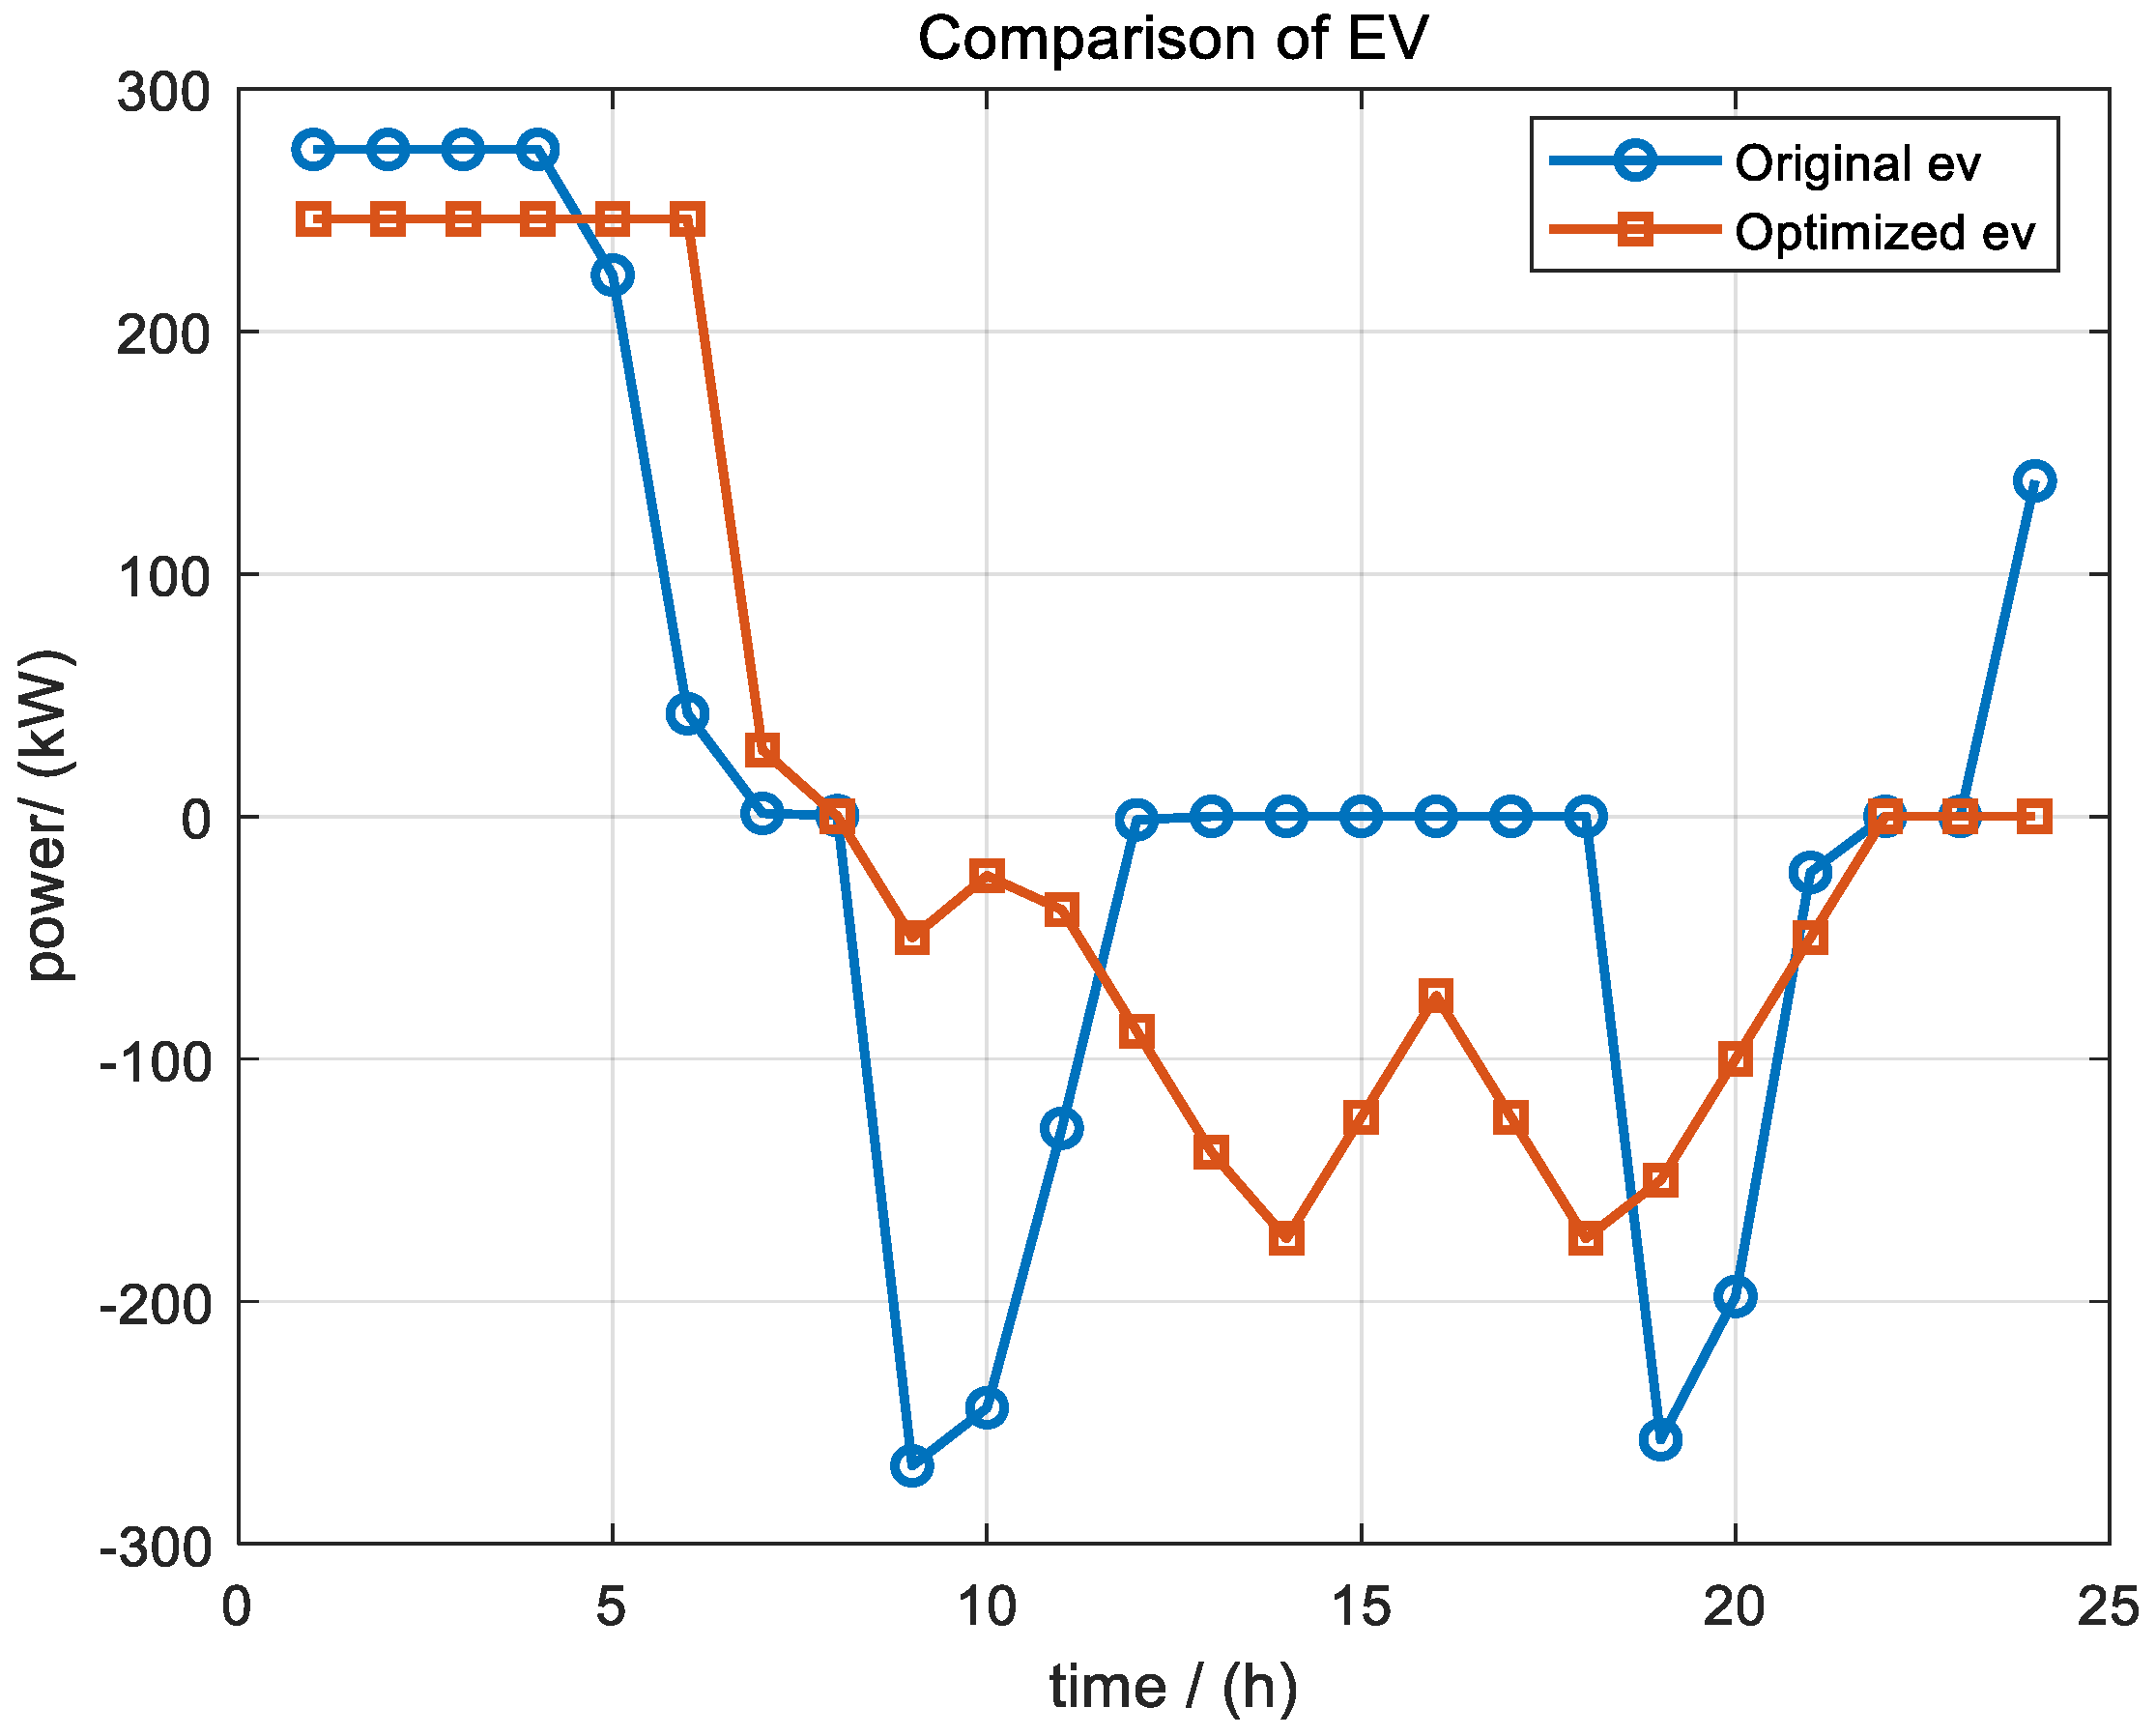
As shown in Figure 6, the charging and discharging modes of the electric vehicle group changed from the sharp peak–valley fluctuation of the original ‘charging–discharging–charging’ to a more balanced ‘high-level flat charging–steady discharge’ strategy that takes into account cost and carbon emissions. Specifically, under the original scheduling, the high-rate charging of 274.91 kW was mainly used in the 1–4 periods under the original scheduling, and the charging of the 6th period was rapidly reduced to 42.27 kW, and then the concentrated discharge of up to −267.75 kW appeared in the 7–12 periods, and the discharge was again deep in the 19–20 periods to −256.99 kW and −197.95 kW; after optimization, the 1–6 period was uniformly maintained at a stable charging level of 246.25 kW, and only 27.36 kW and 0 kW were fine-tuned in the 7–8 period. The discharge peak in the 9–11 period was compressed to −50 kW and −38.53 kW, and, in the 12–18 period, the continuous and decentralized discharge from −88.53 kW to −174 kW supported the high electricity price period, while the other periods tried to avoid deep discharge. This charge–discharge reconstruction not only eliminated the original deep peak–valley impact, but also concentrated large-scale charging on the low price or renewable power surplus period, significantly smoothing the net load curve, reducing the cost of electricity purchase, and improving the benefits of carbon emission reduction.

3.3. Results of DRA Low-Carbon Economy Optimal Scheduling Based on ε-Constraint Method

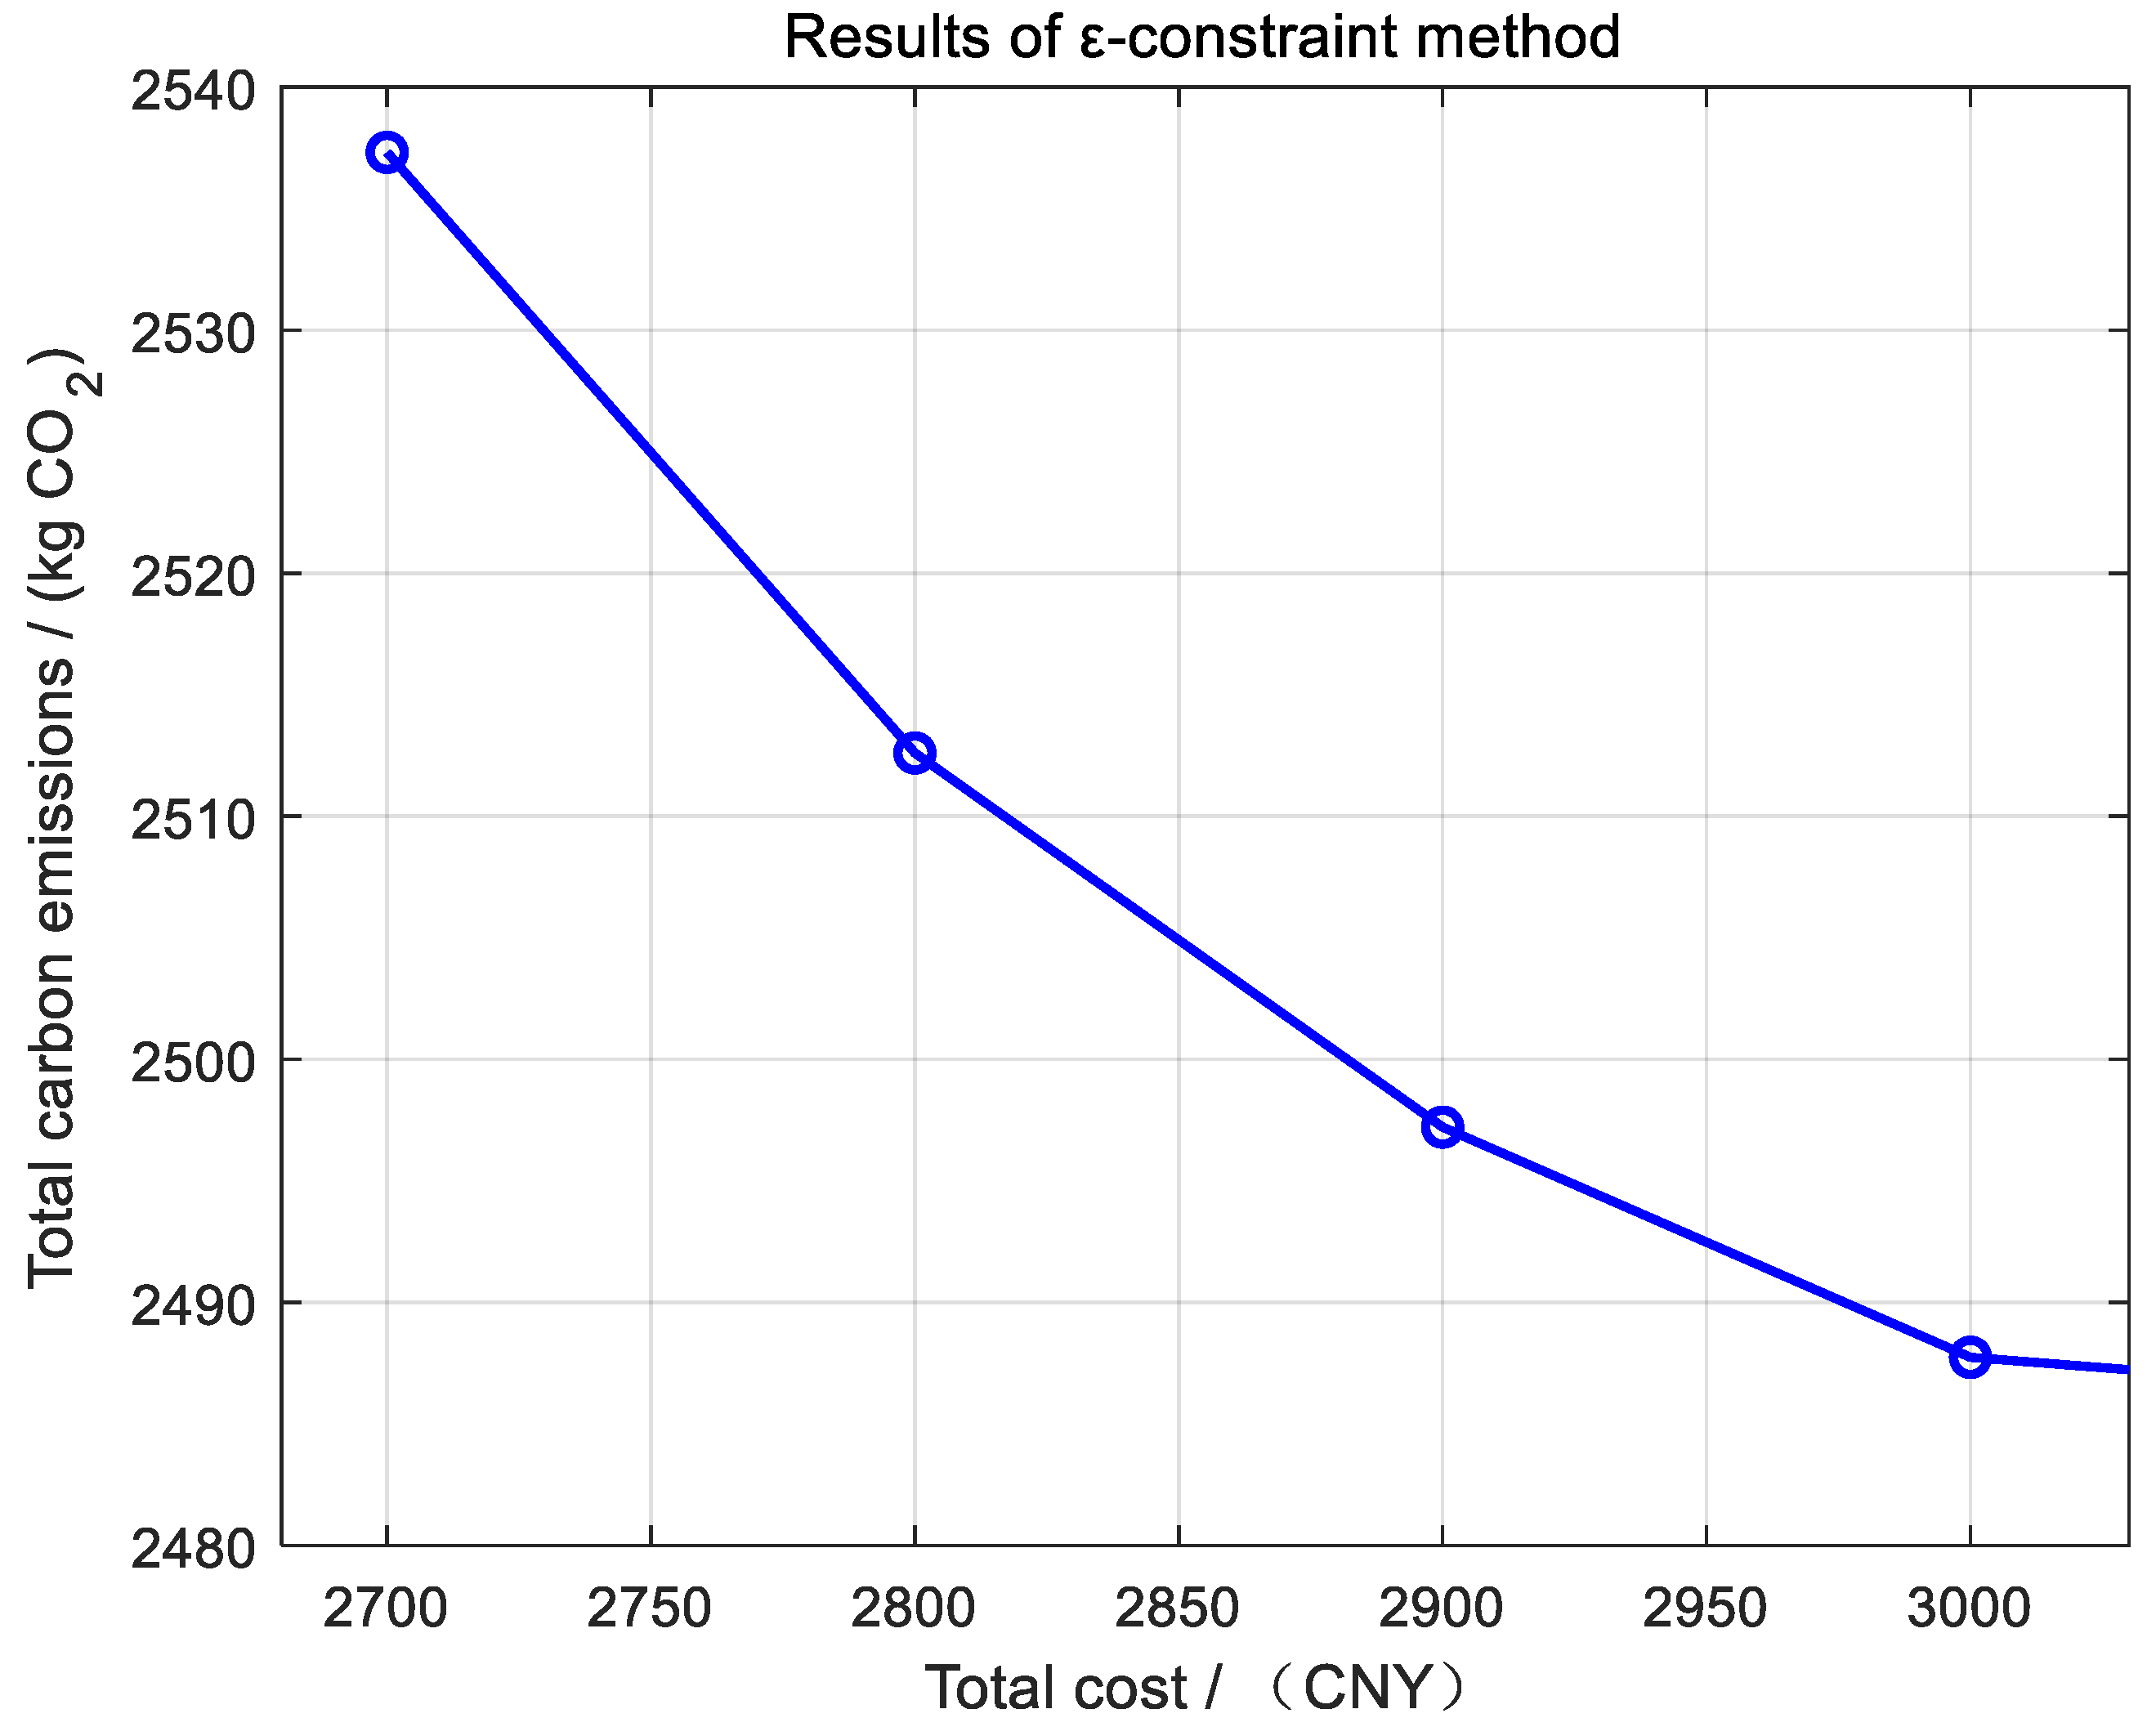
It can be seen from Figure 7 that, as the carbon emission constraint ε is gradually relaxed from 2700 to 3000, the total cost of the system decreases significantly, and the overall trend is decreasing. The carbon emission value is strictly consistent with ε, indicating that the optimal scheduling process makes full use of the allowable carbon budget. As shown in Table 6, for every 100-unit increase in ε, the total cost decreases by 24.72, 15.39, and 9.47, respectively, and the marginal cost-saving effect gradually weakens, reflecting that, under the lower carbon emission limit, the system needs to pay higher economic costs to meet the emission reduction requirements, while the relaxation of constraints releases greater scheduling flexibility, so that DRA can choose more operation strategies with lower cost, but slightly higher carbon emissions.
When ε is further relaxed to 3100, the total cost only decreases slightly, to 2486.77, and the carbon emission also approaches the upper limit (3008.10). The system scheduling space is basically saturated, and the relaxation of carbon emission constraints is difficult to bring substantial cost optimization. It can be seen that, when ε is close to 3000, a balance inflection point between carbon constraints and economy is formed. For DRA, this threshold can be used as the optimal scheduling boundary for both carbon emission reduction and cost control.

3.4. Optimization Scheduling Evaluation Results

3.4.1. Internal Resource Evaluation

Different types of distributed resources show different preference characteristics in optimal scheduling. Due to its strong interruption tolerance ability, the load can be reduced, and more attention paid to economy. Its economic satisfaction weight was set to 0.65, and the power consumption satisfaction weight was 0.35, reflecting its adjustment advantage in ensuring the economic operation of the system. In contrast, the shiftable load has a higher requirement for the continuity of the power consumption period, so it pays more attention to the user experience. The power consumption satisfaction weight was 0.65, and the economic satisfaction weight was 0.35; the transferable load seeks a balance between comfort and economy, and the weight of the two types of satisfaction was 0.5; as a typical controllable mobile load, electric vehicles need to meet the charging demand before travel on the one hand, and, on the other hand, they should also take into account the economy of participating in scheduling. The weights of electricity satisfaction and economic satisfaction were 0.55 and 0.45, respectively. By assigning differentiated satisfaction weights to different resources, the scheduling model could improve the acceptance of user response while ensuring the controllable operation cost of the system, so as to realize the collaborative optimization and complementary advantages of multiple resources. The evaluation results of distributed resources within DRA are shown in Table 7.
In terms of satisfaction, the reduced load and the shiftable load show higher electricity satisfaction (both more than 96%), reflecting the higher acceptance of these two types of load adjustment by users. The transferable load is slightly lower (90.46%), but it is still at a better level. The electric vehicle group has the lowest electricity satisfaction (81.30%), indicating that frequent charge and discharge scheduling has a certain impact on the convenience of users. However, the economic satisfaction of electric vehicles is as high as 116.39%. Driven by high returns, its comprehensive satisfaction reaches 97.09%, which is still maintained within a reasonable range, reflecting the sensitivity of users to economic compensation.
In terms of flexibility, electric vehicles show the strongest adjustment ability, with an adjustment range of 32.74% and a sustainable adjustment time of 21 h, which is much higher than other resources. The transferable load regulation range is 12.76% and the duration is 8 h, ranking first in flexible load, reflecting its flexible response ability in time migration. Although the adjustable load can be adjusted by 10.00%, the scheduling duration is only 4 h, due to the need to meet the continuous power consumption constraints, and the flexibility is slightly limited. Due to the direct power reduction, the adjustment range of the load can be reduced by only 6.36%, but it has strong fast-response characteristics because there is no need to redistribute the power consumption time.
In terms of economy, different resources show different benefit–cost efficiency due to differences in subsidy mechanisms and response methods. The profit–cost ratio of load curtailment is only 2.44 due to the small adjustment range and high adjustment cost (CNY 98.70), although the subsidy per kilowatt-hour is high (CNY 0.35). Although the compensation of electric vehicles is high, the adjustment cost is also high, and the profit–cost ratio is 3.08. In contrast, the transferable and shiftable load subsidies are relatively low, but, due to the optimization of response mechanism and good cost control, high revenue–cost ratios of 9.21 and 7.99, respectively, are achieved, reflecting strong economic dispatch value.
On the whole, the four types of resources have different emphases on satisfaction, flexibility, and economy. They can reduce load fast response, with high compensation, but limited adjustment potential; the transferable load takes into account both flexibility and economy, and is balanced in multi-dimensional indicators. The shiftable load has certain adjustment ability under the premise of ensuring the user experience; as the most promising flexible resources, electric vehicles show strong adjustment ability under income incentives. The complementary advantages of various resources support the fine management of aggregators in comprehensive optimal scheduling.

3.4.2. Overall Evaluation of Load Quotient

By analyzing the results of Table 8, it can be seen that, in the dimension of power consumption characteristics, aggregators can give full play to the synergistic effects of various flexible distributed resources by coordinating and optimizing various distributed resources, so that the total power consumption can be increased by 5.87%. Thanks to the CET-RPS coupling mechanism, the total cost is greatly reduced when the power consumption is increased, and the effect of ‘more consumption and less cost’ is achieved.
In the dimension of energy structure, the proportion of clean energy power generation after optimization decreased slightly, from 60.1% to 56.8%, due to the rise of the overall electricity base of DRA. At the same time, the energy self-supply rate climbed from 67.1% to 87.8%, indicating that the coordination of internal distributed resources is harmful to enhancing the self-sufficiency of DRA, further reducing its dependence on external power grids and improving system flexibility.
For environmental benefits, both total carbon emissions and carbon emission intensity per unit of electricity decreased significantly, achieving reductions of about 25.9% and 30.0%, respectively. At the same time, more than 50% of the operating cost was saved. This shows that, by introducing the CET-RPS coupling mechanism, the aggregator achieved significant environmental benefits and considerable economic returns.
In general, DRA optimal scheduling based on CET-RPS coupling achieves coordinated gains in the three dimensions of power consumption characteristics, energy structure, and environmental economic benefits: it not only taps the potential of flexible load and energy storage, improving system autonomy and flexibility, but also achieves a sustainable, low-cost, and low-carbon operation pattern under complex market and policy constraints.

4. Results

Aiming at the distributed resource aggregation scheduling scenario, this paper constructed an optimal scheduling method system that integrated multi-class heterogeneous resources; fully considered the collaborative characteristics and response differences in distributed clean energy, electric vehicles, photovoltaic power, wind power, energy storage, and other resources; and introduced the system-coupling mechanism of carbon quotas and green certificates, which enhanced the adaptability of the model to complex market and policy constraints. At the same time, combined with the dual-objective optimization method and the multi-level evaluation system, the whole process of quantitative evaluation from the scheduling strategy to the operation result was realized. The conclusions are as follows:
  • An optimal scheduling model with a distributed resource aggregator (DRA) as the main body, covering photovoltaic power, wind power, energy storage, electric vehicles, and other resources was constructed to realize the collaborative scheduling of internal resources and power grid interaction. It provided a method basis and practical path for realizing the integrated management of source–load–storage, enhancing the system autonomic ability and supporting the low-carbon transformation of a new power system.
  • Compared with the control scenario (Scene 3) without the implementation of the convergence mechanism, the model (Scene 4) proposed in this paper generated CNY 670.21 carbon trading revenue by converting surplus green certificates into deductible carbon emission reduction and realizing carbon trading, so that the total cost of DRA was reduced from CNY 3246.75 to CNY 2486.90, a decrease of 23.4%, indicating that the convergence of CET-RPS significantly improves the utilization efficiency of carbon assets and economic competitiveness.
  • Aiming at the diversity of DRA scheduling objectives, the ε-constraint method was used to achieve dual-objective optimization, and the analysis was carried out from the two dimensions of economic cost minimization and carbon emission minimization. The results of the example show that, as the ε was relaxed from 2700 t to 3000 t, the total cost was reduced from CNY 2537.32 to CNY 2487.74, which reveals the impact of carbon emission constraint lending on marginal cost.
  • This paper constructed a systematic evaluation system of scheduling effect; accurately identified the scheduling effect from the two levels of internal distributed resources and the overall system of aggregators; revealed the differences and complementary relationships of various resources in satisfaction, flexibility, and economy; and quantified the comprehensive benefits of optimization strategies in system autonomy, carbon emission reduction, and cost control, so as to provide reliable support for aggregators to achieve fine management and synergy.

5. Discussion

The CET-RPS collaborative convergence mechanism and dual-objective scheduling model based on DRA proposed in this paper have strong operability and promotion values at the practical level, as follows:
Firstly, it can provide quantitative decision-making tools for energy enterprises and power grid operators, and transform the space–time scheduling ability of electric vehicles into tradable carbon emission reduction benefits, so as to improve the flexibility of the power grid and the level of clean energy consumption while reducing operating costs.
Second, the model has potential for application in different countries and market environments. For regions that have an established carbon market or RPS system, the proposed mutual recognition/deduction mechanism can be directly applied; for areas where the carbon and green certificate mechanisms are not yet perfect, their economic–carbon coordination logic can also provide references for system design and policy evaluation.
However, there are still some limitations in this study, as follows:
(1)
Idealized assumptions regarding electric vehicle travel rules and charging and discharging behaviors are made in the modeling, which does not fully reflect individual differences;
(2)
The data of the example is typical, but the sample size is limited, so it needs to be verified by larger-scale measurement.
(3)
The model relies on a clear CET and RPS system design, and policy differences in different regions may affect applicability;
(4)
The dynamic factors, such as battery degradation, long-term price fluctuation, and user behavior evolution, are not fully considered, and the long-term economy still needs further analysis.

6. Conclusions Implications and Future Works

This paper constructs a low-carbon economic dispatch model for distributed resource aggregators that integrates carbon trading (CET) and a renewable energy quota system (RPS), and verifies its significant advantages in reducing operating costs and improving the utilization efficiency of carbon assets. The research results show that the CET-RPS coupling mechanism can effectively open up the value chain of carbon and green certificates, as well as provide a feasible path for the market-oriented low-carbon scheduling of distributed resources.
The main impacts of this study are that it provides a new institutional convergence idea for the low-carbon transformation of power systems, strengthens the synergy between distributed resources in carbon trading and renewable energy quota policies, and provides decision-making bases for aggregators to participate in multi-market transactions and comprehensive income optimization.
Future research can further expand the following directions:
(1)
The model could be docked with the actual market settlement mechanism to study the compliance trading path of carbon and green certificates;
(2)
Extending to cross-regional and cross-market scenarios, the impacts of transmission constraints and price differences on the effectiveness of the mechanism could be analyzed.
(3)
Behavior and risk modeling could be introduced to evaluate the heterogeneity and long-term stability of different market players.
(4)
Verification research could be conducted based on measured or pilot data to enhance the universality and policy guidance value of the model.

Author Contributions

Formal analysis, S.H., P.X. and X.C.; investigation, H.L. and P.X.; methodology, S.H. and P.T.; project administration, S.H. and X.C.; resources, H.L., P.X. and P.T.; software, P.T. and C.H.; supervision, S.H., H.L. and X.C.; validation, P.T., X.X. and C.H.; visualization, P.T.; writing—original draft, P.T. and X.X.; writing—review and editing, C.H., G.L. and X.X. All authors have read and agreed to the published version of the manuscript.

Funding

This research was funded by the Hebei Electric Power Technical Service Project: Research on aggregation control technology and market mechanism design for distributed resource participation market (SGHEJY00NYJS2400121).

Institutional Review Board Statement

Not applicable.

Informed Consent Statement

Not applicable.

Data Availability Statement

The original contributions presented in this study are included in the article. Further inquiries can be directed to the corresponding authors.

Conflicts of Interest

Authors Shiyao Hu, Hangtian Li, Chong Hong, Xiaobin Xu, and Peng Xi were employed by the State Grid Hebei Economic Research Institute. The remaining authors declare that the research was conducted in the absence of any commercial or financial relationships that could be construed as potential conflicts of interest.

References

  1. Wu, W.; Zhang, B.; Sun, H.; Wang, B.; Yang, Y.; Liu, H.; Lin, C.; Wang, S. Energy management and distributed energy resources cluster control for active distribution networks. Autom. Electr. Power Syst. 2020, 44, 111–118. [Google Scholar]
  2. Sheng, W.; Wu, M.; Ji, Y.; Kou, L.; Pan, J.; Shi, H.; Niu, G.; Wang, Z.G. Key techniques and engineering practice of distributed renewable generation clusters integration. Proc. CSEE 2019, 39, 2175–2186. [Google Scholar]
  3. Riaz, S.; Mancarella, P. Modelling and characterisation of flexibility from distributed energy resources. IEEE Trans. Power Syst. 2021, 37, 38–50. [Google Scholar] [CrossRef]
  4. Yi, Z.; Xu, Y.; Gu, W.; Yang, L.; Sun, H. Aggregate operation model for numerous small-capacity distributed energy resources considering uncertainty. IEEE Trans. Smart Grid 2021, 12, 4208–4224. [Google Scholar] [CrossRef]
  5. Muller, F.L.; Szabo, J.; Sundstrom, O.; Lygeros, J. Aggregation and disaggregation of energetic flexibility from distributed energy resource. IEEE Trans. Smart Grid 2017, 10, 1205–1214. [Google Scholar] [CrossRef]
  6. Peik-Herfeh, M.; Seifi, H.; Sheikh-El-Eslami, M.K. Decision making of a virtual power plant under uncertainties for bidding in a day-ahead market using point estimate method. Int. J. Electr. Power Energy Syst. 2013, 44, 88–98. [Google Scholar] [CrossRef]
  7. Silva, M.; Sousa, T.; Ramos, S.; Vale, Z.; Morais, H. Distributed energy resources scheduling considering real-time resources forecast. In Proceedings of the 2014 IEEE PES General Meeting|Conference & Exposition, IEEE, National Harbor, MD, USA, 27–31 July 2014; pp. 1–5. [Google Scholar]
  8. Yang, Q.; Wang, H.; Wang, T.; Zhang, S.; Wu, X.; Wang, H. Blockchain-based decentralized energy management platform for residential distributed energy resources in a virtual power plant. Appl. Energy 2021, 294, 117026. [Google Scholar] [CrossRef]
  9. Muhtadi, A.; Pandit, D.; Nguyen, N.; Mitra, J. Distributed energy resources based microgrid: Review of architecture, control, and reliability. IEEE Trans. Ind. Appl. 2021, 57, 2223–2235. [Google Scholar] [CrossRef]
  10. Gough, M.; Santos, S.F.; Lotfi, M.; Javadi, M.S.; Osorio, G.J.; Ashraf, P.; Castro, R.; Catalao, J.P.S. Operation of a technical virtual power plant considering diverse distributed energy resources. IEEE Trans. Ind. Appl. 2022, 58, 2547–2558. [Google Scholar] [CrossRef]
  11. Kang, C.; Du, E.; Li, Y.; Zhang, N.; Chen, Q.; Guo, H.; Wang, P. Key scientific problems and research framework for carbon perspective research of new power systems. Power Syst. Technol. 2022, 46, 821–833. [Google Scholar]
  12. Chen, J.; Hu, Z.; Chen, Y.; Chen, J.; Chen, W.; Gao, M.; Lin, M.; Du, Y. Thermoelectric optimization of integrated energy system considering ladder-type carbon trading mechanism and electric hydrogen production. Electr. Power Autom. Equip. 2021, 41, 48–55. [Google Scholar]
  13. Ren, H.; Wang, N.; Wu, Q. Collaborative optimal scheduling and cost allocation of multiload aggregator considering ladder-type carbon trading. Electr. Power Constr. 2024, 45, 171–182. [Google Scholar]
  14. Chen, Z.; Lu, Y.; Xing, Q.; Chen, X.; Leng, Z. Dispatch analysis of power system considering carbon quota for electric vehicle. Autom. Electr. Power Syst. 2019, 43, 44–51. [Google Scholar]
  15. Zhang, M.; Liu, S.; Pan, Z.; Zhang, W. Optimal Dispatching of Park-level Integrated Energy System Considering Carbon Quotas for Electric Vehicles. Electr. Power Sci. Eng. 2025, 41, 29–39. [Google Scholar]
  16. Jiang, Y.; Cao, H.; Yang, L.; Fei, F.; Li, J.; Lin, Z. Mechanism design and impact analysis of renewable portfolio standard. Autom. Electr. Power Syst. 2020, 44, 187–199. [Google Scholar]
  17. Zhang, X.; Chen, Z.; Ma, Z.; Xia, Q.; Dai, X. Study on electricity market trading system adapting to renewable portfolio standard. Power Syst. Technol. 2019, 43, 2682–2690. [Google Scholar]
  18. Liang, J.; Zuo, Y.; Zhang, Y.; Zhao, X. Energy-saving and economic dispatch of power system containing wind power integration under renewable portfolio standard. Power Syst. Technol. 2019, 43, 2528–2534. [Google Scholar]
  19. Shang, N.; Chen, Z.; Lu, Z.; Leng, Y. Interaction principle and cohesive mechanism between electricity market, carbon market and green power certificate market. Power Syst. Technol. 2023, 47, 142–154. [Google Scholar]
  20. Cui, Y.; Shen, Z.; Wang, Z.; Wang, M.; Zhao, Y. Green dispatch of regional integrated energy system considering green certificate-carbon emission equivalent interaction mechanism. Proc. CSEE 2023, 43, 4508–4517. [Google Scholar]
  21. Wu, W.; Yu, Y.; Zhang, Y.; Shi, J. Low-Carbon Economic Dispatch of the Integrated Energy Service Station Considering Life Cycle Carbon Emission and Green Certificate-Carbon Joint Trading. Power Syst. Clean Energy 2025, 41, 58–67. [Google Scholar]
  22. Wang, S.; Wu, W. Aggregation reference model and quantitative metric system of flexible energy resources. Autom. Electr. Power Syst. 2024, 48, 1–9. [Google Scholar]
  23. Liu, J.; Feng, H.; Ding, N.; Ye, J.; Zhang, C.; Xu, Y. Comprehensive benefit evaluation method for park with distributed resource clusters by electrical and carbon synergy. J. Electr. Power Sci. Technol. 2024, 39, 181–191. [Google Scholar]
  24. Tang, W.; Gao, F. Optimal operation of household microgrid day-ahead energy considering user satisfaction. High Volt. Eng. 2017, 43, 140–148. [Google Scholar]
  25. Liu, J.; Li, P.; Zhong, W.; Wang, L.; An, Y.; Li, H. Optimal charging/discharging strategy of electric vehicles in residential area considering user comprehensive satisfaction. E3S Web Conf. EDP Sci. 2018, 53, 02012. [Google Scholar] [CrossRef]
  26. Yan, X.W.; Wang, Q.; Lu, J.; Bu, J.; Shen, Z. Microgrid energy scheduling with electric vehicles and flexible loads. Power Syst. Prot. Control 2023, 51, 69–79. [Google Scholar]
  27. Mao, T.; Huang, N.; Cheng, R.; Zhou, B.; Xie, P. Construction for the benefit evaluation index system of virtual power plant and its example analysis. South. Power Syst. Technol. 2021, 16, 124–131. [Google Scholar]
  28. Jiang, Z.; Zhang, F.; Hu, F.; Sun, Y.; Jiang, W.; Deng, Y. Evaluation method of aggregated responsiveness of distributed resources in virtual power plant. Electr. Power Eng. Technol. 2022, 41, 39–49. [Google Scholar]
  29. China Climate Change Info-Net. CM-001-V01 Integrated baseline methodology for grid-connected renewable energy generation projects (Version 1) [EB/OL]. 2020, 03-11. Available online: https://www.ccchina.org.cn/archiver/cdmcn/UpFile/Files/Default/20130311164212571089.pdf (accessed on 1 August 2025).
  30. Liu, J.; Nie, J.; Cui, X.; Liu, P.; Tong, P.; Liu, X. Optimal Energy Configuration of Integrated Energy Community Considering Carbon Emission. Sustainability 2024, 16, 728. [Google Scholar] [CrossRef]
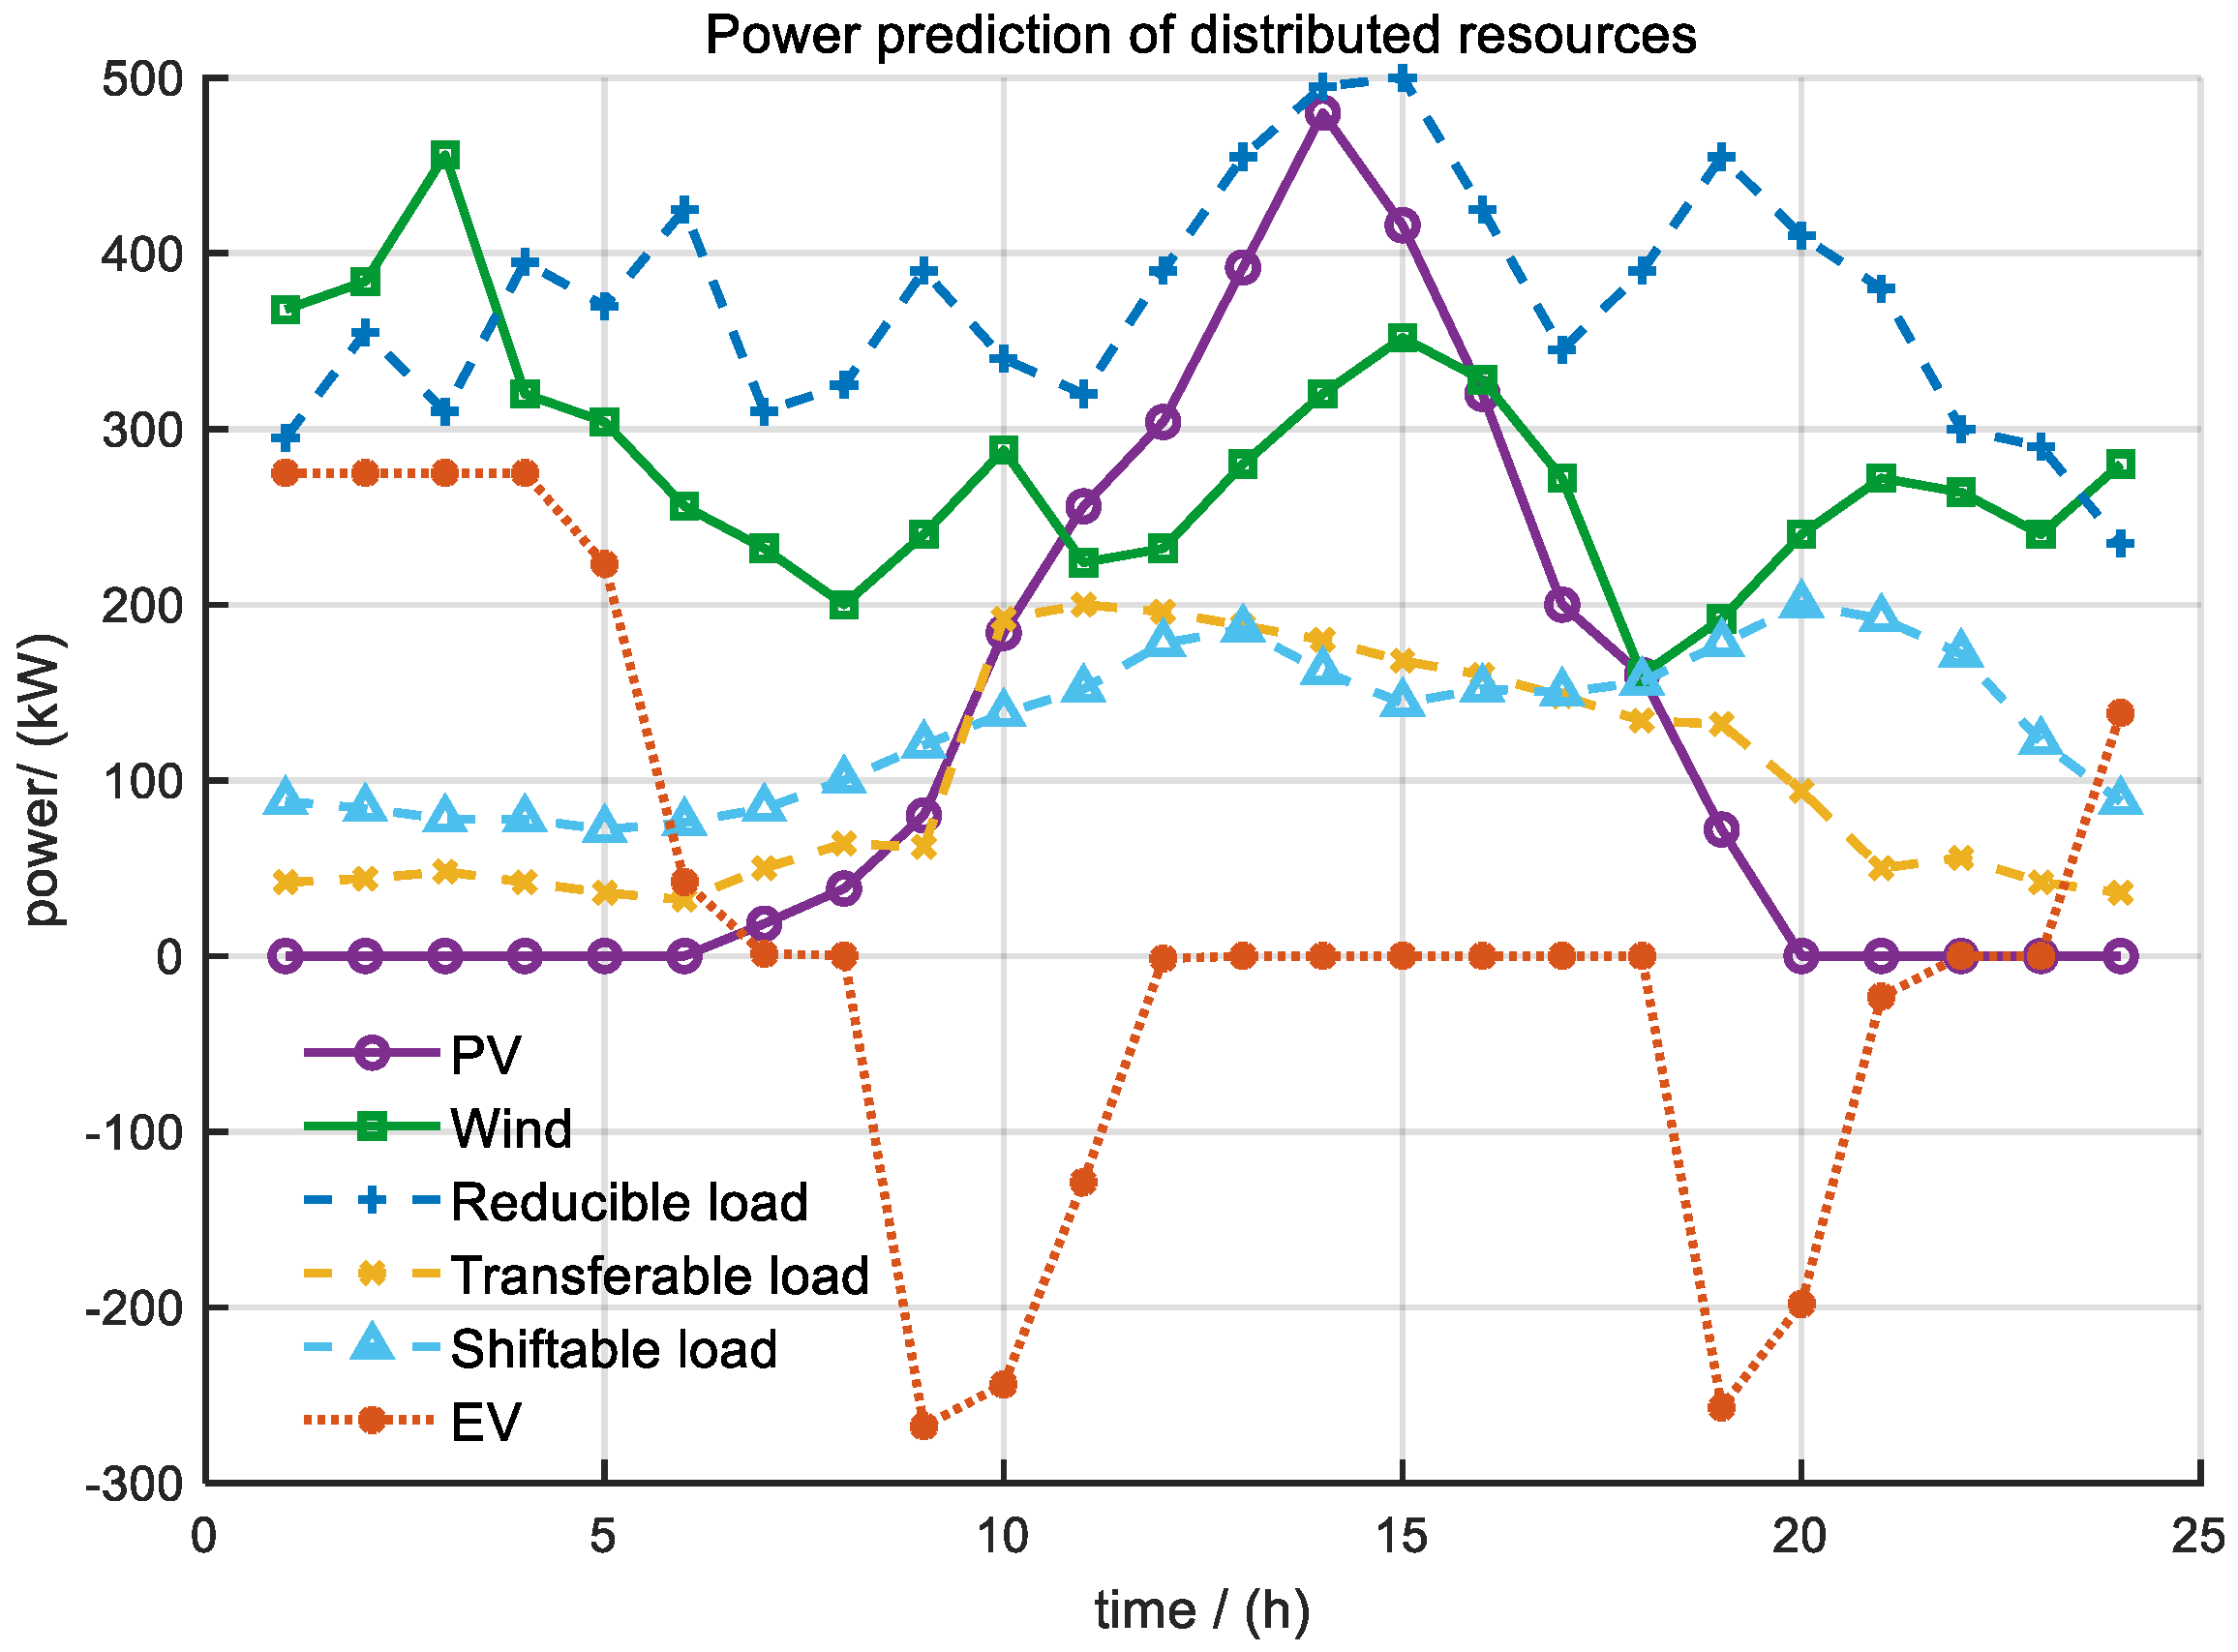
Figure 1. Distributed generation and load forecasting.
Sustainability 17 09311 g001
Figure 2. Optimal scheduling results of DRA under Scene 4.
Sustainability 17 09311 g002
Figure 3. Optimization results of reducible load under Scene 4.
Sustainability 17 09311 g003
Figure 4. Optimization results of transferable load under Scene 4.
Sustainability 17 09311 g004
Figure 5. Optimization results of shiftable load under Scene 4.
Sustainability 17 09311 g005
Figure 6. The optimization results of EVs under scenario 4.
Sustainability 17 09311 g006
Figure 7. Optimization results under different ε values.
Sustainability 17 09311 g007
Table 1. DRA internal distributed resource evaluation system.
First-Level IndicatorsSecond-Level
Indicators
Explanation
SatisfactionElectricity
satisfaction
The satisfaction degree of resources to the implementation of electricity plan
Economic
satisfaction
The economic benefit satisfaction of resources obtained by participating in scheduling
Comprehensive satisfactionThe overall satisfaction of resources to electricity and economy
FlexibilityRegulating
amplitude
Percentage of adjustable power during the scheduling period
DurationThe longest time for sustainable adjustment of resources
EconomyAdjusting costsThe cost of DRA regulating resources
Profit–cost ratioThe ratio of adjustment income to adjustment cost
Table 2. DRA overall system evaluation.
First-Level IndicatorsSecond-Level IndicatorsExplanation
Electrical characteristicsPeak–valley differenceThe difference between peak load and valley load
Total electricity consumptionAggregator’s total electricity
Adjustable load participation rateThe ratio of adjustable load
Energy
structure
The proportion of clean energy power generationThe proportion of renewable energy power generation to total power generation
Energy self-supply rateThe proportion of aggregator’s own energy in total energy demand
Environmental benefitsTotal carbon emissionsThe total carbon emissions of the aggregator as a whole
Carbon intensity per unit of electricityCarbon emissions generated by electricity consumption per unit of aggregator
Economic
benefits
Total costAggregator’s total operating cost
Policy synergy benefitsThe additional benefits generated by the linkage between CET and RPS policies
Table 3. Remaining parameter settings.
ParameterValueParameterValue
Microturbine a m t 0.00027Green certificate quota coefficient0.0004
Microturbine b m t 0.026Green certificate priceCNY 220
Microturbine c m t 48Carbon trading benchmark price0.268
Photovoltaic power c p v 0.12Price growth rate0.1
Wind power c w i n d 0.15Carbon emission interval length10
Energy storage c E S 0.08Electricity marginal emission factor0.9419
Battery loss of electric vehicle c l o s s , e v 0.0843Capacity marginal emission factor0.4819
Electric vehicle discharge subsidy c c a r 2Reducible load compensation price0.35 CNY/kW·h
Translatable load compensation price c s h i f t 0.08 CNY/kW·hTransferable load compensation price0.1 CNY/kW·h
Table 4. Scene settings.
CET and RPSEV Carbon QuotasConvergence Mechanism
Scene 1×××
Scene 2××
Scene 3×
Scene 4
Table 5. Comparison of results.
Carbon Trading CostTotal CostCarbon Trading Volume
Scene 1\3892.69\
Scene 2354.623510.091105.618
Scene 388.713246.75228.4723
Scene 4−670.212486.90−2542.99
Table 6. Optimization results under different ε values.
εTotal CostCarbon Emission
2600\\
27002537.32 2700.00
28002512.60 2800.00
29002497.21 2900.00
30002487.74 3000.00
31002486.77 3008.10
Table 7. Evaluation results of internal distributed resources in DRA.
First-Level IndicatorsSecond-Level
Indicators
Reducible LoadTransferable LoadShiftable LoadEV
Electricity
satisfaction
96.82%90.46%97.59%81.30%
SatisfactionEconomic
satisfaction
102.13%100.80%99.19%116.39%
Comprehensive satisfaction100.27%95.63%98.15%97.09%
Regulating
amplitude
6.36%12.76%10.00%32.74%
FlexibilityDuration12 h8 h4 h21 h
Adjusting costs98.7011.433.0428.74
EconomyProfit–cost ratio2.449.217.993.08
Table 8. DRA overall system evaluation results.
First-Level IndicatorsSecond-Level
Indicators
Before OptimizationAfter Optimization
Peak–valley difference678692
Electrical characteristicsTotal electricity consumption16,017.4316,957.92
Adjustable load participation rate0.00%8.59%
The proportion of clean energy power generation60.09%56.76%
Energy
structure
Energy self-supply rate67.08%87.81%
Total carbon emissions4123.413056.82
Environmental benefitsCarbon intensity per unit of electricity0.25740.1803
Total cost5020.532486.90
Economic
benefits
Policy synergy benefits0.00−1408.36
Disclaimer/Publisher’s Note: The statements, opinions and data contained in all publications are solely those of the individual author(s) and contributor(s) and not of MDPI and/or the editor(s). MDPI and/or the editor(s) disclaim responsibility for any injury to people or property resulting from any ideas, methods, instructions or products referred to in the content.