Article

Integrating Hard and Green Infrastructure for Sustainable Tourism: A Spatial Analysis of Saudi Regions

by
Muhannad Mohammed Alfehaid
Department of Geography and GIS, College of Social Sciences, Imam Mohammad Ibn Saud Islamic University (IMSIU), Riyadh 13318, Saudi Arabia
Sustainability 2025, 17(20), 9295; https://doi.org/10.3390/su17209295
Submission received: 10 September 2025 / Revised: 11 October 2025 / Accepted: 14 October 2025 / Published: 20 October 2025
(This article belongs to the Special Issue BRICS+: Sustainable Development of Air Transport and Tourism)

Abstract

Tourism performance often depends on the joint provision of built (“hard”) and environmental (“green”) infrastructure, yet their combined effects are not well established. Using official data for Saudi Arabia’s 13 regions (2023–2024), this study constructs composite hard and green indices, estimates ordinary least squares models with heteroskedasticity-consistent inference, and probes spatial heterogeneity using geographically weighted regression (exploratory) alongside k-means/hierarchical clustering. Hard infrastructure is the strongest and most consistent correlate of overnight visitors and spending, whereas green infrastructure exhibits non-positive marginal effects over the observed range of hard capacity; a negative, statistically significant Hard × Green interaction indicates diminishing returns to greening as built capacity increases. Clustering differentiates metropolitan hubs from nature-oriented regions, underscoring place-specific policy needs. Practically, results support sequencing prioritizing foundational access and basic accommodation in under-served regions, quality upgrades and public-realm enhancement in mature centers, and targeted green interventions where marginal gains are greatest. Key limitations (cross-sectional design; coarse green metrics) motivate richer environmental indicators and longitudinal data to clarify dynamics and thresholds over time.

1. Introduction

Tourism accounts for roughly 10% of global GDP and remains a rapidly expanding sector. Adequate infrastructure is essential for sustaining tourism: visitors require transportation networks, accommodation, utilities, waste management, and leisure facilities. The literature distinguishes tourism (main) infrastructure—such as hotels, restaurants, and recreational facilities—from supporting infrastructure including roads, railways, airports, electricity, water, and communications [1]. Beyond built systems, green infrastructure (GI) has gained prominence as a strategy for delivering ecosystem services and enhancing recreational experiences; it comprises interconnected parks, gardens, woodlands, natural areas, and green corridors. Empirical work documents that elements such as hiking trails, public parks, riverbanks, and greenways can catalyze sustainable tourism by raising aesthetic, ecological, and recreational value [2]. In urban contexts, the co-location of attractions with GI has been linked to improved well-being and destination image. Together, these insights suggest that integrating hard and green infrastructure may benefit tourism, albeit in ways that are likely context-dependent.
Within Saudi Arabia, pronounced regional disparities exist. Makkah annually receives more than 17 million visitors due to religious pilgrimage, whereas smaller regions such as Al-Baha host far fewer tourists (2023 statistics). Entertainment events, transport connectivity, and green-space provision also vary markedly across provinces. Yet, many prior analyses rely on national aggregates and standard, single-equation models that obscure spatial heterogeneity and potential interactions between built and green systems.
Beyond access and experience design, integrated provision has clear energy–environment linkages: compact access networks and high-quality public realm can reduce travel frictions, moderate energy use in hospitality and urban mobility, and enhance the environmental performance of destinations [3]. From a broader sustainability perspective, cross-domain advances in energy transformation and environmental risk (e.g., reservoir energy systems and geomechanical stability) offer relevant framings for destination development and governance. In this spirit, we cite recent work on energy transformation platforms and environmental protection, as well as geomechanical sensitivity analyses related to subsurface gas production, to motivate the need for integrated, resource-efficient tourism strategies [4,5].
This study addresses that gap by jointly examining built (“hard”) and environmental (“green”) infrastructure across the Kingdom’s 13 regions, with a focus on whether their combined provision is additive or exhibits diminishing returns as built capacity increases. The research questions are: (i) How strongly do built and green infrastructure relate to regional tourism outcomes (overnight visitors and spending)? (ii) Does the marginal association of green infrastructure vary with built capacity (tested via a Hard × Green interaction)? (iii) Do these relationships vary spatially in ways that support actionable regional typologies.
This study aims to quantify the separate and joint associations of built and green infrastructure with regional tourism performance across Saudi Arabia’s 13 regions, and to test whether their joint effect exhibits diminishing returns as built capacity increases. To this end, composite indices were constructed from official 2023–2024 data; OLS models with a Hard × Green interaction were estimated as the confirmatory backbone; geographically weighted regression was used to explore spatial heterogeneity; policy-relevant typologies were derived via clustering; and PCA was employed as a robustness check on index weighting. In doing so, the paper contributes to the growing literature on sustainability, competitiveness, and integrated tourism planning [6,7,8,9,10].
Literature Review
Tourism infrastructure and destination competitiveness
Infrastructure availability is widely acknowledged as a primary driver of tourism demand and destination competitiveness. Early empirical work in Turkey and Thailand demonstrated that reliable roads, water supplies, electricity and safety services strongly influence tourist arrivals. Cross-country analyses consistently show that destinations with well-developed transport systems and abundant accommodation attract more visitors and generate greater tourism receipts. Scholars have repeatedly identified accommodation and transport capacity as key predictors of tourism growth [11,12], while cross-sectional regressions confirm that investment in infrastructure positively influences arrivals [13,14]. Beyond these tangible elements, contemporary research emphasizes that infrastructure encompasses not only material assets but also intangible and digital resources. Smart tourism studies highlight how high-speed internet, mobile connectivity, big data and artificial intelligence enhance visitor experiences, improve resource efficiency and contribute to sustainability. Smart destinations leverage technologies to balance resource use and provide real-time information, enabling tourists and residents to enjoy more comfortable and resource-efficient experiences [8,15]. The sustainable tourism infrastructure planning (STIP) framework advocates integrated planning across attractions, services and transport facilities, embedding environmental criteria and visitor preferences [16] and recognizing that digital infrastructure underpins modern tourism services. Notably, recent research has proposed composite indices that integrate environmental and social criteria into destination competitiveness evaluation, reflecting a shift towards a more holistic and sustainable assessment of tourism performance [17].
Green infrastructure and sustainable tourism
Green infrastructure (GI) is conceived as an interconnected network of natural and semi-natural areas—parks, gardens, woodlands, natural areas, green streets and boulevards—that deliver ecosystem services and recreational opportunities [2]. Research on the parallel development of green infrastructure and tourism reveals that public parks, hiking trails, riverbanks and green corridors enhance destination appeal and create opportunities for ecotourism and active tourism. GI not only increases the attractiveness of tourist destinations but also contributes to climate regulation, biodiversity conservation and social well-being [2,18]. In urban contexts, studies show that synergy between tourist attractions and urban green infrastructure can enhance residents’ well-being and improve destination image [19,20]. However, empirical evidence on such synergy remains limited, as most research focuses on individual GI elements rather than holistic networks [2]. These insights imply that integrating green and built infrastructure within tourism planning can yield substantial benefits while promoting environmental sustainability [21]. Moreover, emerging destinations in the MENA region face sustainability trade-offs; recent evidence from North Africa shows that tourism expansion can drive up energy consumption and carbon emissions if not accompanied by environmental safeguards [3,22,23], underscoring the importance of sustainable infrastructure investment.
The concept of synergy captures how built (hard) and green (natural) infrastructure may jointly enhance tourism outcomes beyond the sum of their separate effects. Some scholars argue that complementary investment in high-quality accommodation, transport and entertainment facilities alongside parks, trails and other green spaces creates appealing environments that attract visitors and encourage longer stays. Empirical evidence is mixed. Studies from Hungary show that linear green infrastructure elements—public parks and alleys—complement tourism attractions and increase their value [2]. A recent study across Japanese cities suggests that the synergy between urban green infrastructure and tourist attractions varies with city size and economic structure, yielding overall benefits but limited evidence of multiplicative effects [11,20]. These findings indicate that synergy effects are context-dependent and that additive contributions of hard and green infrastructure are more common than multiplicative ones. Understanding the mechanisms of synergy and identifying where integrated investment yields the largest returns remain important research frontiers.
Synergy between built and natural infrastructure
Recent scholarship has broadened the geographic scope of synergy research to include the Arab region and other emerging economies. For example, Idris et al. (2025) analyze how tourists, infrastructure and institutions jointly shape sustainable tourism outcomes in Gulf Cooperation Council (GCC) countries, demonstrating that governance and ecological amenities significantly influence tourism performance [9,24]. Similarly, Yang and Homma (2025) examine the synergistic relationships between urban attractions and green infrastructure across Japanese cities using a green tourism framework, finding that synergy effects vary with city size and development patterns [20]. These contemporary studies extend earlier work by contextualizing synergy in diverse cultural and economic settings and underscore the need to integrate built and natural assets within broader sustainability frameworks [25,26].
Analytical approaches in tourism research
Researchers employ diverse analytical techniques to explore tourism determinants and infrastructure effects. Descriptive statistics and Pearson’s correlation coefficients measure the strength and direction of associations between variables. Multiple linear regression models estimate the net effect of infrastructure while controlling for socio-economic factors, assuming linearity, independence of errors and normality of residuals [27]. Unsupervised clustering algorithms such as k-means partition destinations into homogeneous groups based on infrastructure and tourism characteristics, revealing typologies. Geographically weighted regression (GWR) addresses spatial non-stationarity by calibrating local regressions with kernel weights, allowing coefficients to vary across space [28,29]. Principal component analysis (PCA) summarizes correlated variables into orthogonal components, mitigating multicollinearity and enabling robustness checks [30]. Beyond these techniques, advanced methods such as structural equation modeling (SEM) allow researchers to evaluate complex causal pathways among latent and observed variables. For example, a study of Nigerian eco-destinations used SEM to analyze relationships among ecotourism practices, tourism development agendas and socio-economic factors, finding significant positive links between ecotourism practices and tourist satisfaction. Smart tourism research also highlights the use of big data analytics, machine learning and remote sensing to monitor visitor flows, optimize resource allocation and enhance destination competitiveness. These methodological advances underscore the need for multi-method approaches that capture both global patterns and local variations in tourism systems.

2. Materials and Methods

2.1. Design, Data, and Variables

A cross-sectional analysis was conducted for Saudi Arabia’s 13 administrative regions (2023–2024 alignment). The primary outcome is annual overnight visitors; tourist spending (SAR) is used in robustness checks. Predictors are grouped into built (“Hard”) and environmental (“Green”) infrastructure. Built indicators include accommodation facilities, entertainment events, intercity vehicle movements, intercity road length, and domestic/international flight frequencies. Green infrastructure is proxied by regional green-space area and the number of public parks. Given the regional aggregation (N = 13), conservative specifications were adopted and heteroskedasticity-consistent (HC1) standard errors were used to obtain robust uncertainty estimates [31].

Data Sources and Operational Definitions

All raw indicators were obtained from three official Saudi sources (via their open-data portals) and aggregated to the 13 administrative regions (reference year 2023; 2024 updates harmonized where available):
  • Ministry of Tourism (Kingdom of Saudi Arabia): tourism outcomes and facilities, including annual overnight visitors, total tourist spending (SAR), number of accommodation establishments, and counts of officially programmed entertainment events.
  • Ministry of Municipal, Rural Affairs and Housing (MOMRAH): environmental amenities, namely the number of public parks and total urban green-space area as reported in municipal/open-data releases.
  • General Authority for Statistics (GASTAT): supporting infrastructure and denominators, including intercity road-network length, intercity vehicle movements/traffic, domestic and international flight frequencies, and population used for rate normalizations.
Temporal alignment and quality control were ensured as follows: units were harmonized across sources (e.g., kilometers for road length; annual counts for events, flights, and intercity vehicle movements), and regional boundaries were checked for geographic consistency. Internal consistency checks were conducted; isolated missing values, when present, were conservatively imputed using within-domain medians (<5% per indicator).

2.2. Composite Indices and Rationale

All indicators are min–max normalized to [0, 1]. The Hard Infrastructure Index is the arithmetic mean of normalized built indicators, and the Green Infrastructure Index is the mean of normalized green indicators. Equal weighting is framed as an exploratory choice under a small-N setting; to assess index-construction sensitivity, data-driven alternatives using principal component analysis (PCA) for weight derivation were pre-specified [29] and conduct comparative checks against established destination competitiveness/composite-indicator literature [32,33]. For PCA, loadings and explained variance are reported, and the implications of alternative weights for downstream results are evaluated.
Given the small regional sample (N = 13), a deliberately parsimonious Green Index was adopted (public parks and urban green-space area) to limit dimensionality and overfitting in confirmatory models. This choice is framed as conservative—not exhaustive. Future extensions will enrich the construct with quality-sensitive indicators (e.g., canopy cover/NDVI, habitat connectivity, landscape diversity), enabling finer ecological nuance once longer panels and sub-regional units are assembled.

2.3. Statistical Framework and Justifications

Descriptive statistics and Pearson correlations were reported. To test whether built and green infrastructure act jointly rather than additively, we estimate an OLS model with heteroskedasticity-consistent (HC1) standard errors [14]:
Y_i = β_0 + β_1 Hard_i + β_2 Green_i + β_3 (Hard_i × Green_i) + γ′ C_i + ε_i.
Moderation is interpreted via simple slopes of Green at the 25th/50th/75th percentiles of Hard, with Johnson–Neyman regions reported when informative. Predictors are mean-centered. Diagnostics include residual/leverage checks and variance inflation factors (VIF). As a construct-validity and multicollinearity check, we re-estimate models using PCA-based substitutes for the Hard index [29]. Diagnostics further include the condition index and a residualization check in which Green is regressed on Hard (yielding Green_resid) prior to re-estimating the interaction model.

2.4. Spatial Diagnostics (GWR)

Because global coefficients can mask spatial heterogeneity, we estimate geographically weighted regression (GWR) using an adaptive kernel [28]. Given N = 13, GWR is treated as exploratory; bandwidth choice and effective local N are reported. Multiscale extensions (MGWR) are noted for completeness [28], while global OLS remains the confirmatory backbone [31].

2.5. Descriptive Typologies of Joint Provision

Regions are grouped into High/Medium/Low synergy by joint quantiles of Hard and Green and compared on observed outcomes. This step is descriptive; inferential claims are derived from the interaction model in Section 2.3.

2.6. Clustering and Reproducibility

We complement regression with unsupervised clustering to identify regional typologies for policy design. We implement k-means (k = 3) with multiple random starts for stability [27], alongside hierarchical agglomerative clustering with Ward’s criterion on standardized [Hard, Green, Y]. Analyses were executed in Python 3.11.8 and R 4.4.1 using statsmodels 0.14.2, scikit-learn 1.5.2, and MGWR 2.2.1; HC1 covariance estimators were used for regression, random seeds were fixed for clustering, and the workflow was fully reproducible from data ingestion to final tables and figures.

3. Results

3.1. Preliminary Examination and Descriptive Statistics

Descriptive statistics for tourism performance and infrastructure indices reveal substantial inter-regional disparities. For example, annual overnight visitors range from only 14,850 (Najran) up to 17,014,574 (Makkah), and the composite Hard infrastructure index spans from 0.004 (Al-Baha) to 0.803 (Makkah). The Green infrastructure index similarly varies from 0.000 (Najran) to 1.000 (Riyadh), indicating a very uneven distribution of resources. Table 1 summarizes key descriptive measures.

3.2. Correlation Matrix

The Pearson correlation matrix (Table 2) shows that the Hard index is very strongly associated with tourism success (r = 0.814, p < 0.001), whereas the Green index has a more modest positive correlation (r = 0.541, p ≈ 0.06). Notably, the Hard and Green indices are highly inter-correlated (r = 0.899), suggesting multicollinearity concerns. This motivated using an interaction term in the regression analysis rather than combining these into a single multiplicative synergy measure.
The comparatively weaker associations for socio-economic covariates likely reflect heterogeneity in regional demand composition (e.g., pilgrimage/event-led flows vs. leisure).

3.3. OLS Regression with Interaction (HC1)

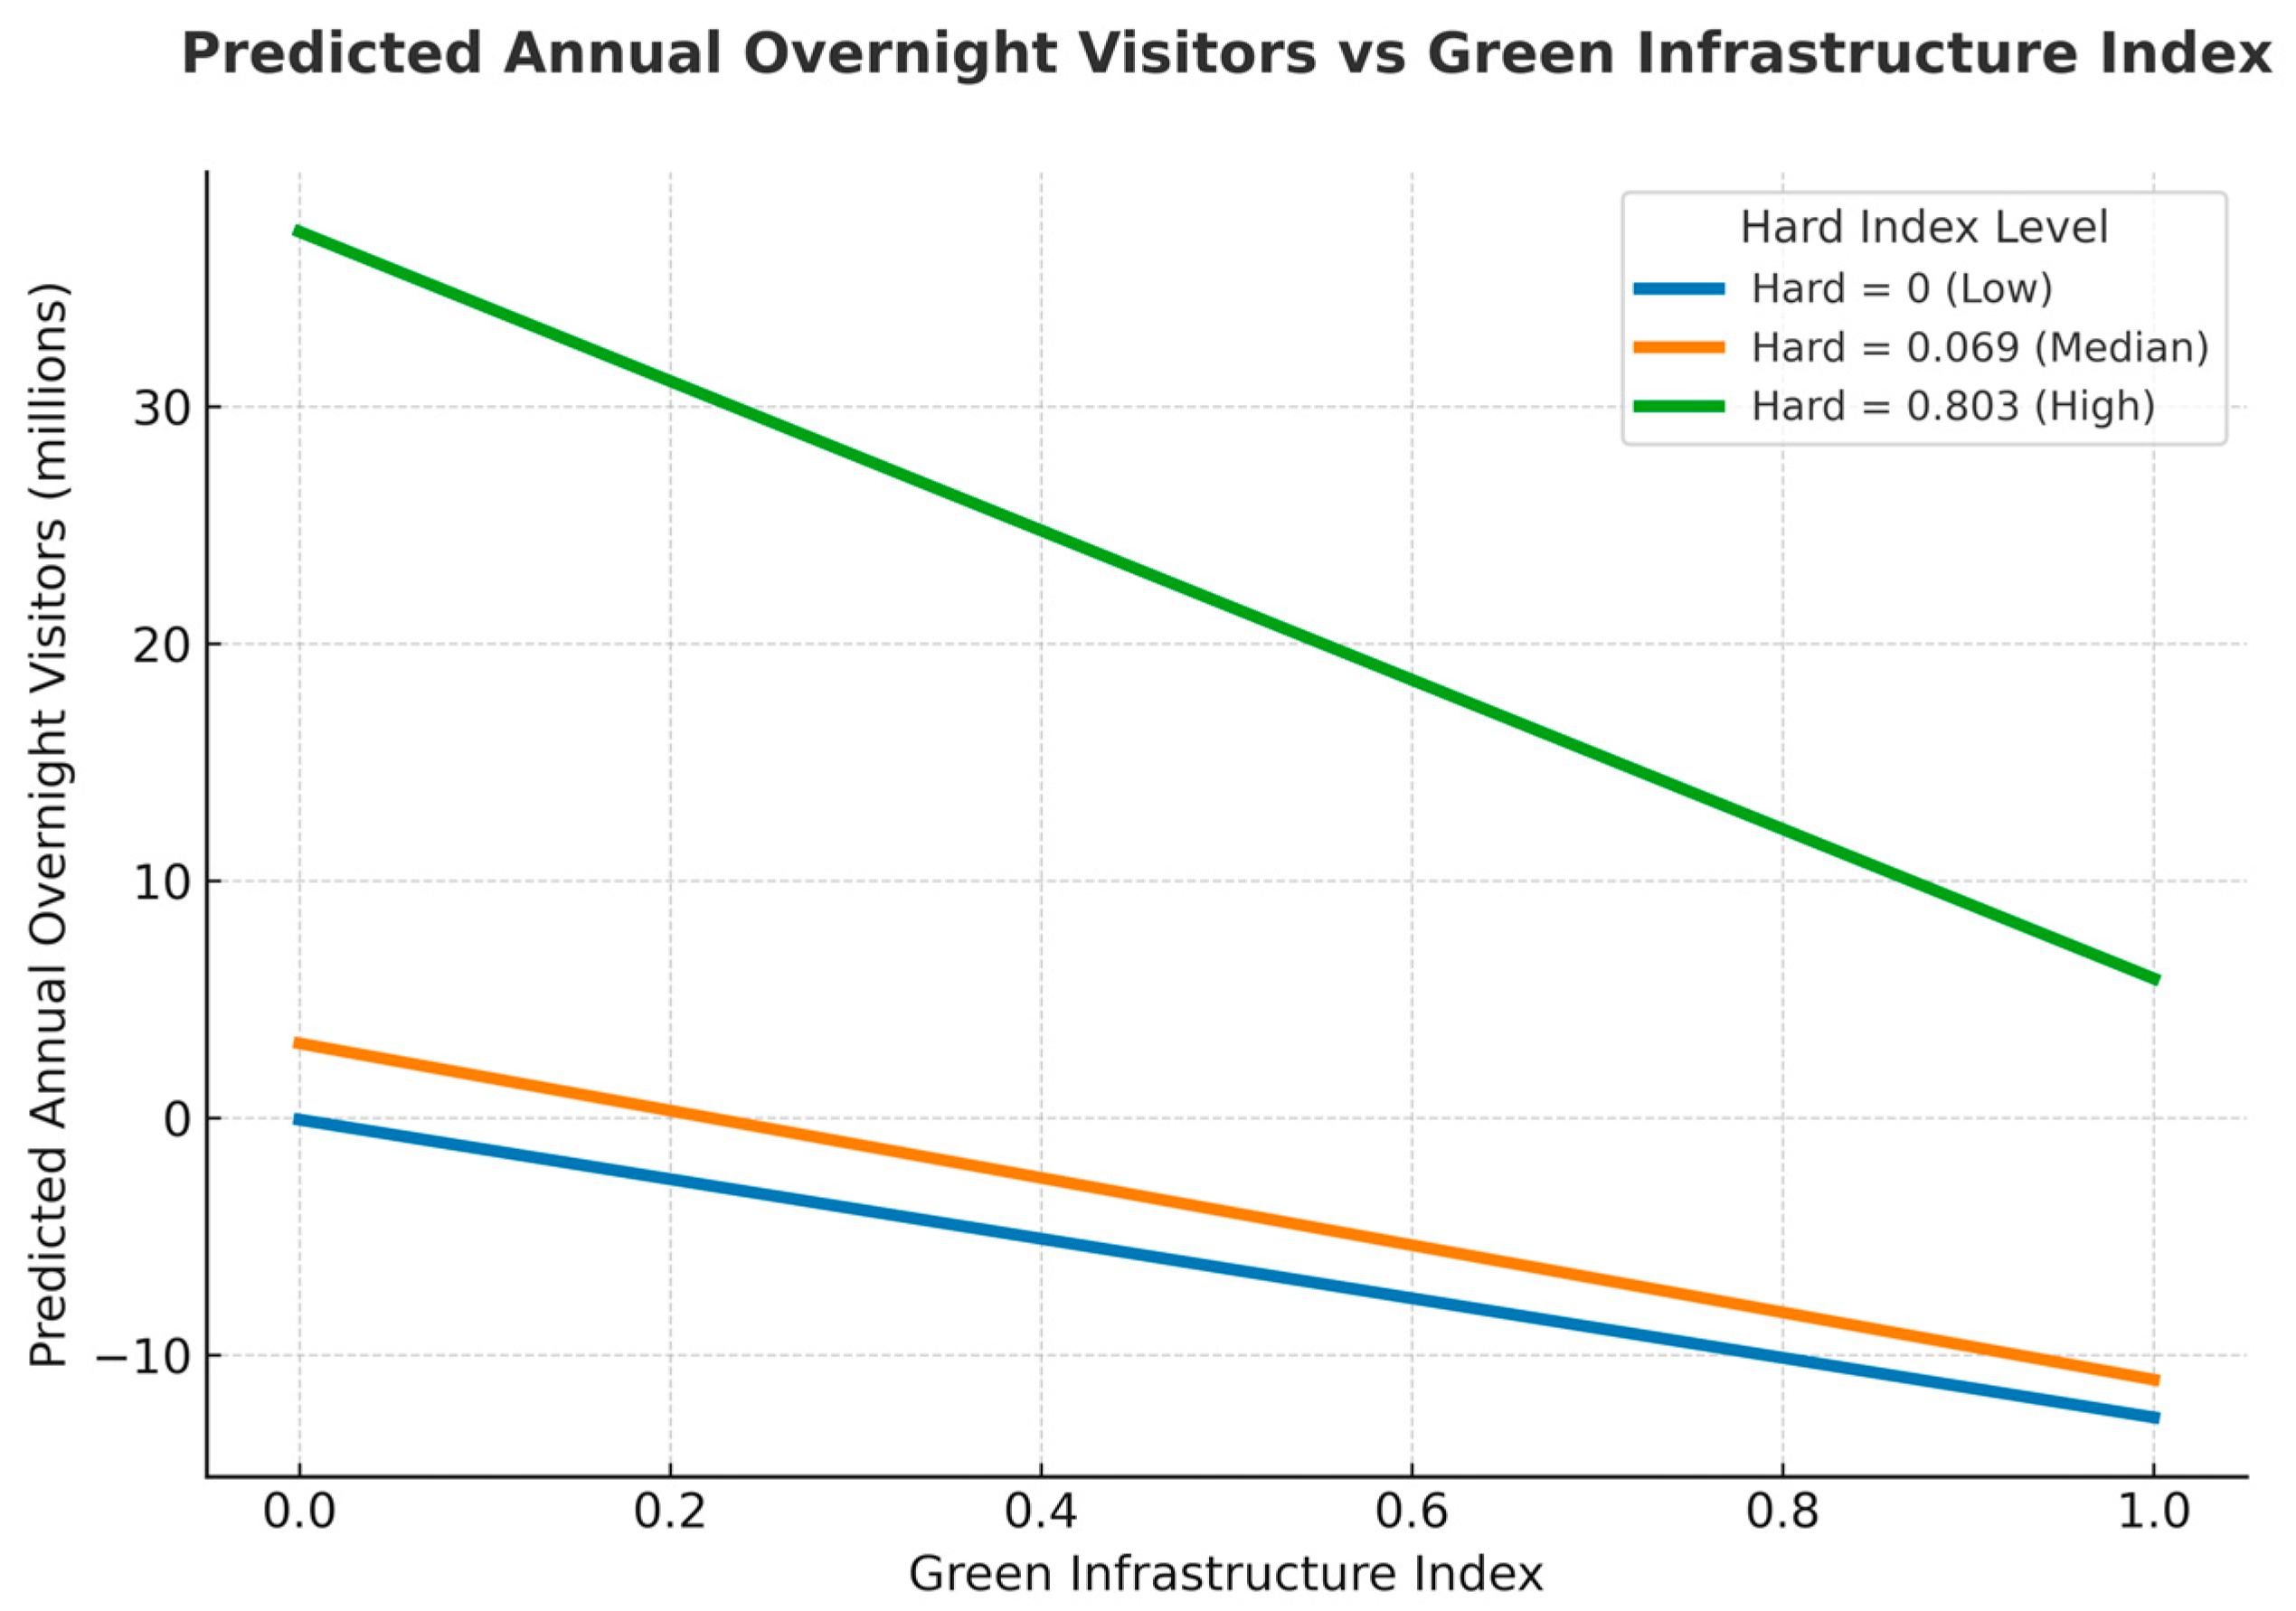
In the OLS models with HC1 inference (Table 3), the Hard × Green term is negative and statistically significant (β3 = −2.36 × 10⁷; p = 0.0016), while the main effect of Hard is strongly positive (p < 0.001). At mean Hard levels, the Green coefficient is negative, indicating that green amenities alone do not raise visitation absent sufficient built capacity. Simple-slope probes (Figure 1) show that the green–tourism association is strongest at low-to-moderate Hard and attenuates at high Hard, consistent with diminishing returns as built systems approach saturation (adjusted R2 ≈ 0.913).

Residualization Sensitivity

To probe collinearity, we residualized Green on Hard and re-estimated the interaction model. The Hard × Green term remained negative and statistically significant, and Green_resid was negative and significant; model fit and diagnostics were essentially unchanged. This pattern supports a diminishing-returns interpretation—greening yields larger marginal gains at low-to-moderate built capacity and wanes as built systems approach saturation (Table 4).

3.4. Simple Slopes and Visual Interpretation

To interpret the interaction, the marginal effect of Green infrastructure can be viewed at different Hard levels. Figure 1 depicts the predicted visitors versus the Green index at low (Hard = 0), median (Hard = 0.069), and high (Hard = 0.803) Hard index values. The negative slope for Green becomes steeper (more negative) at higher Hard levels, reflecting diminishing marginal returns to green infrastructure when built infrastructure is already strong. In other words, adding parks or green spaces has little positive impact—and can even coincide with lower visitor numbers—once a region’s hard infrastructure is highly developed.

3.5. Descriptive Synergy Categories

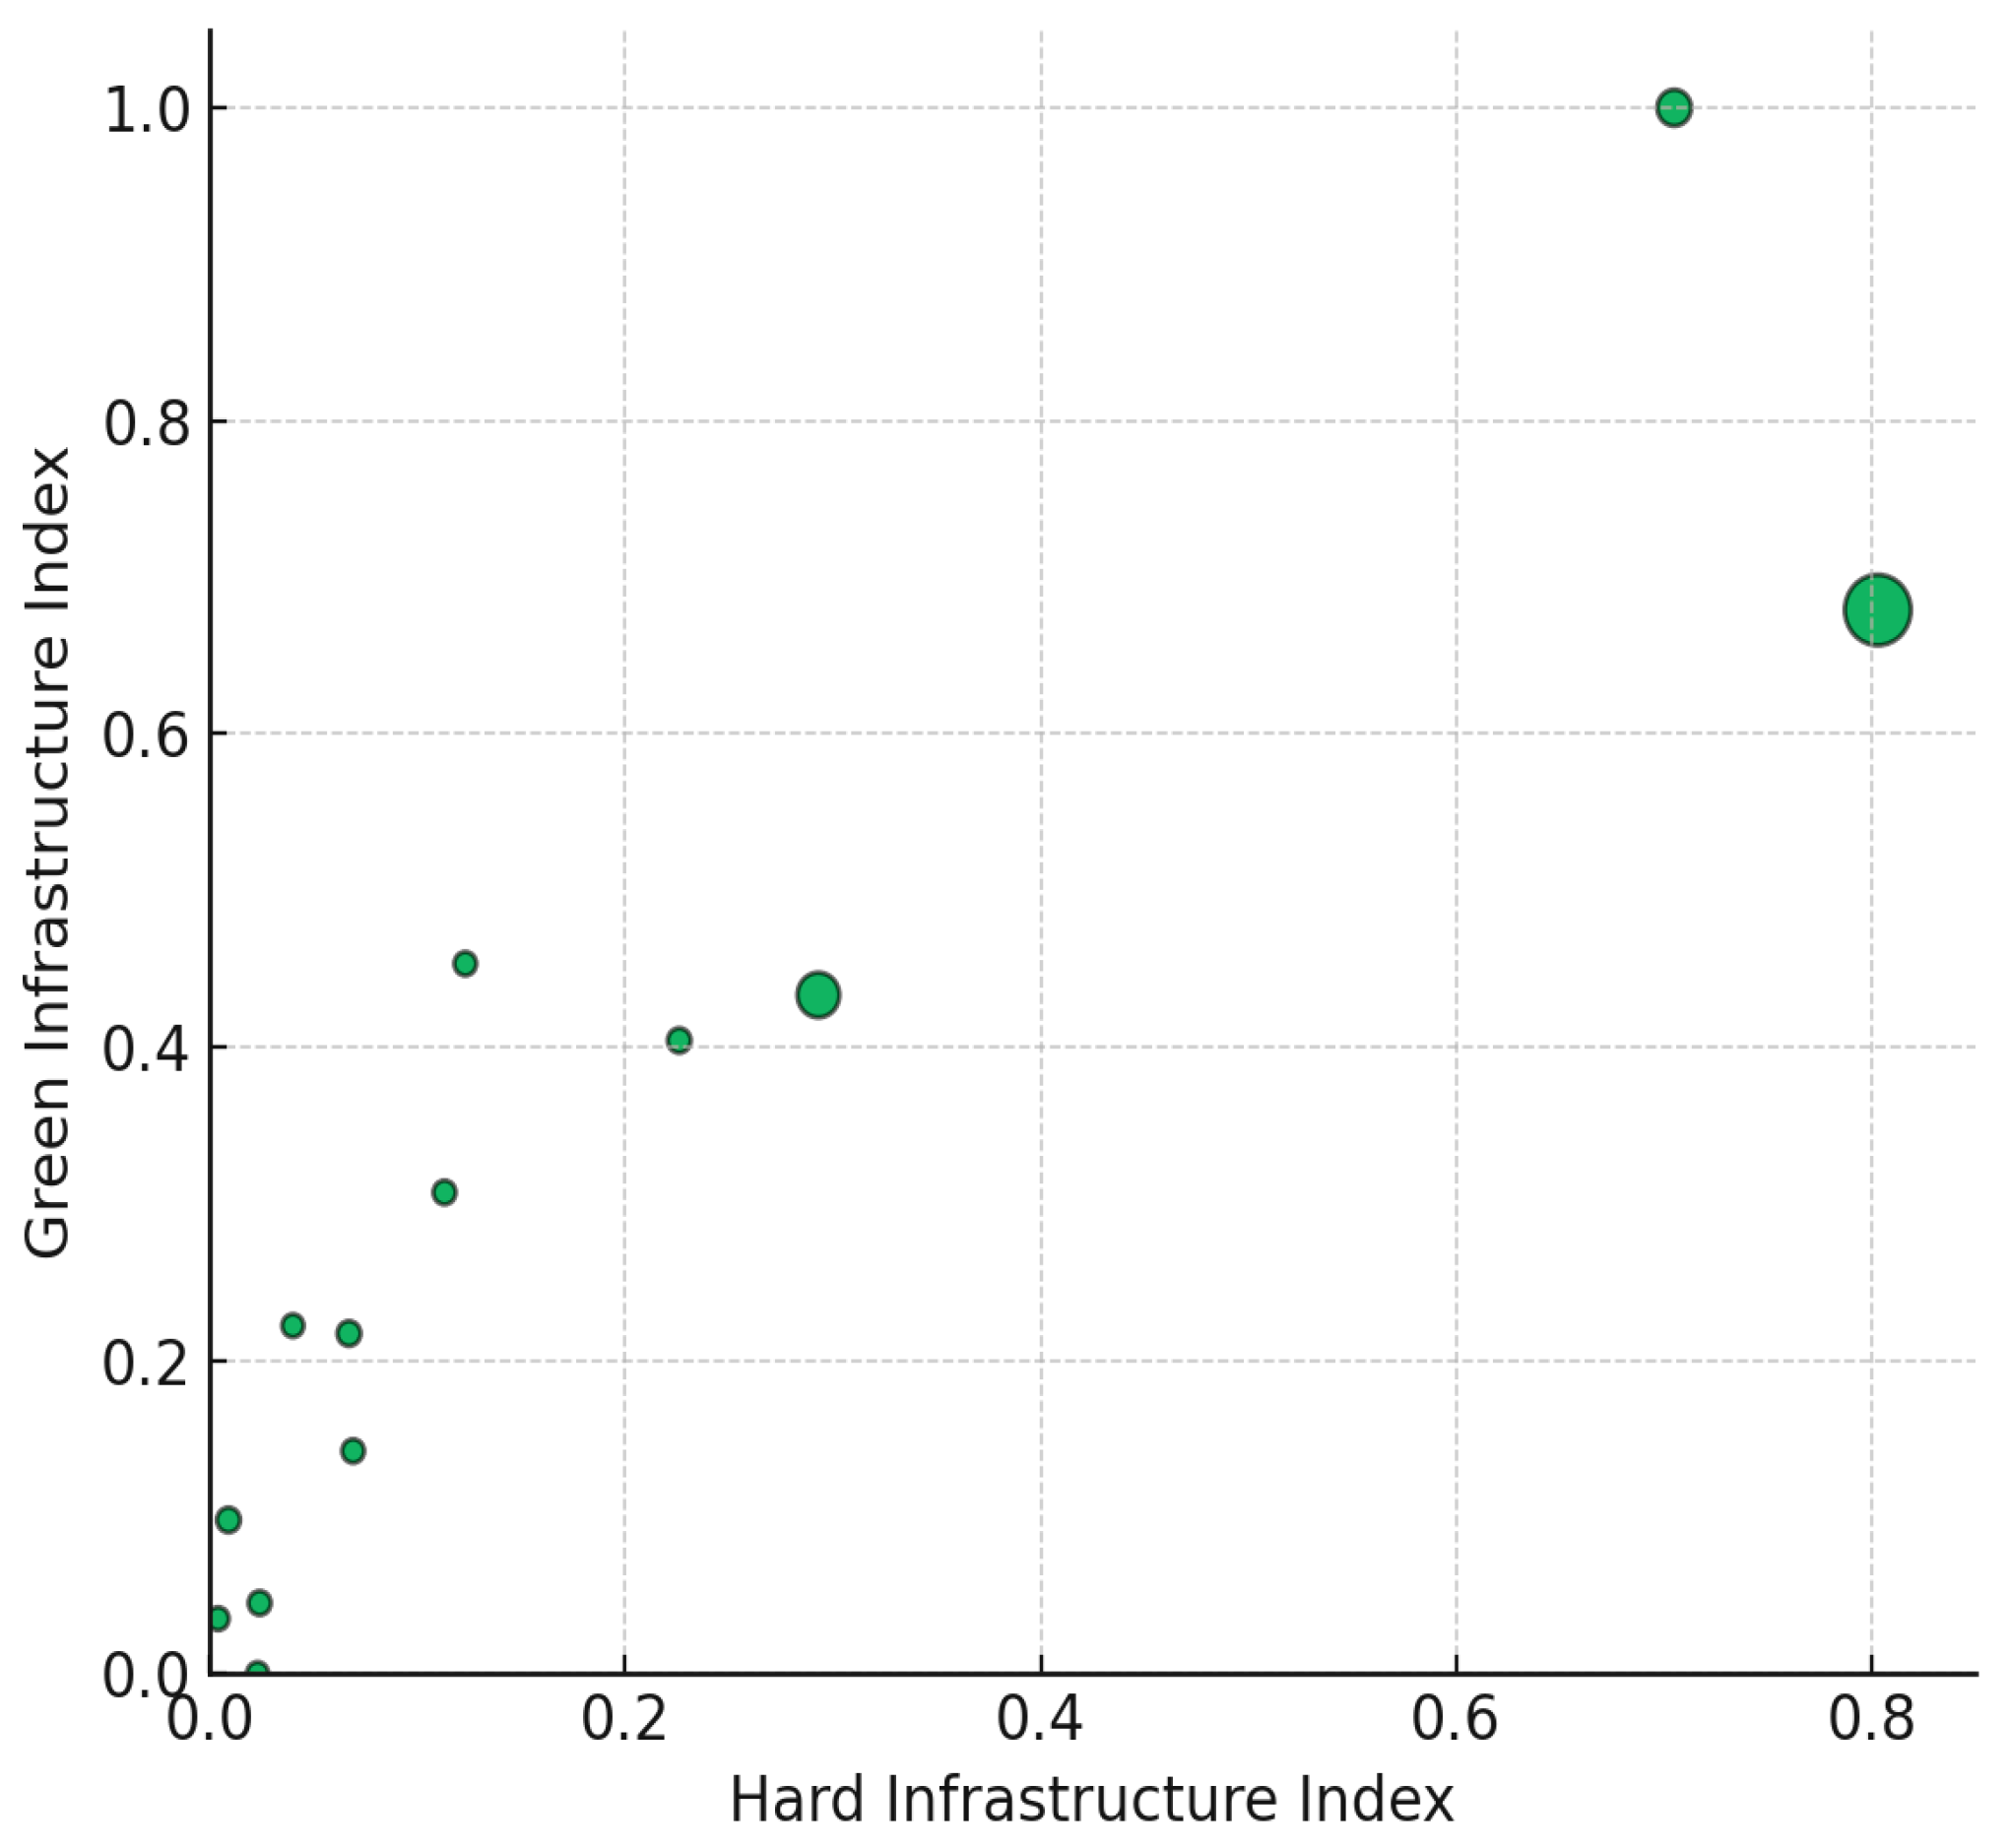
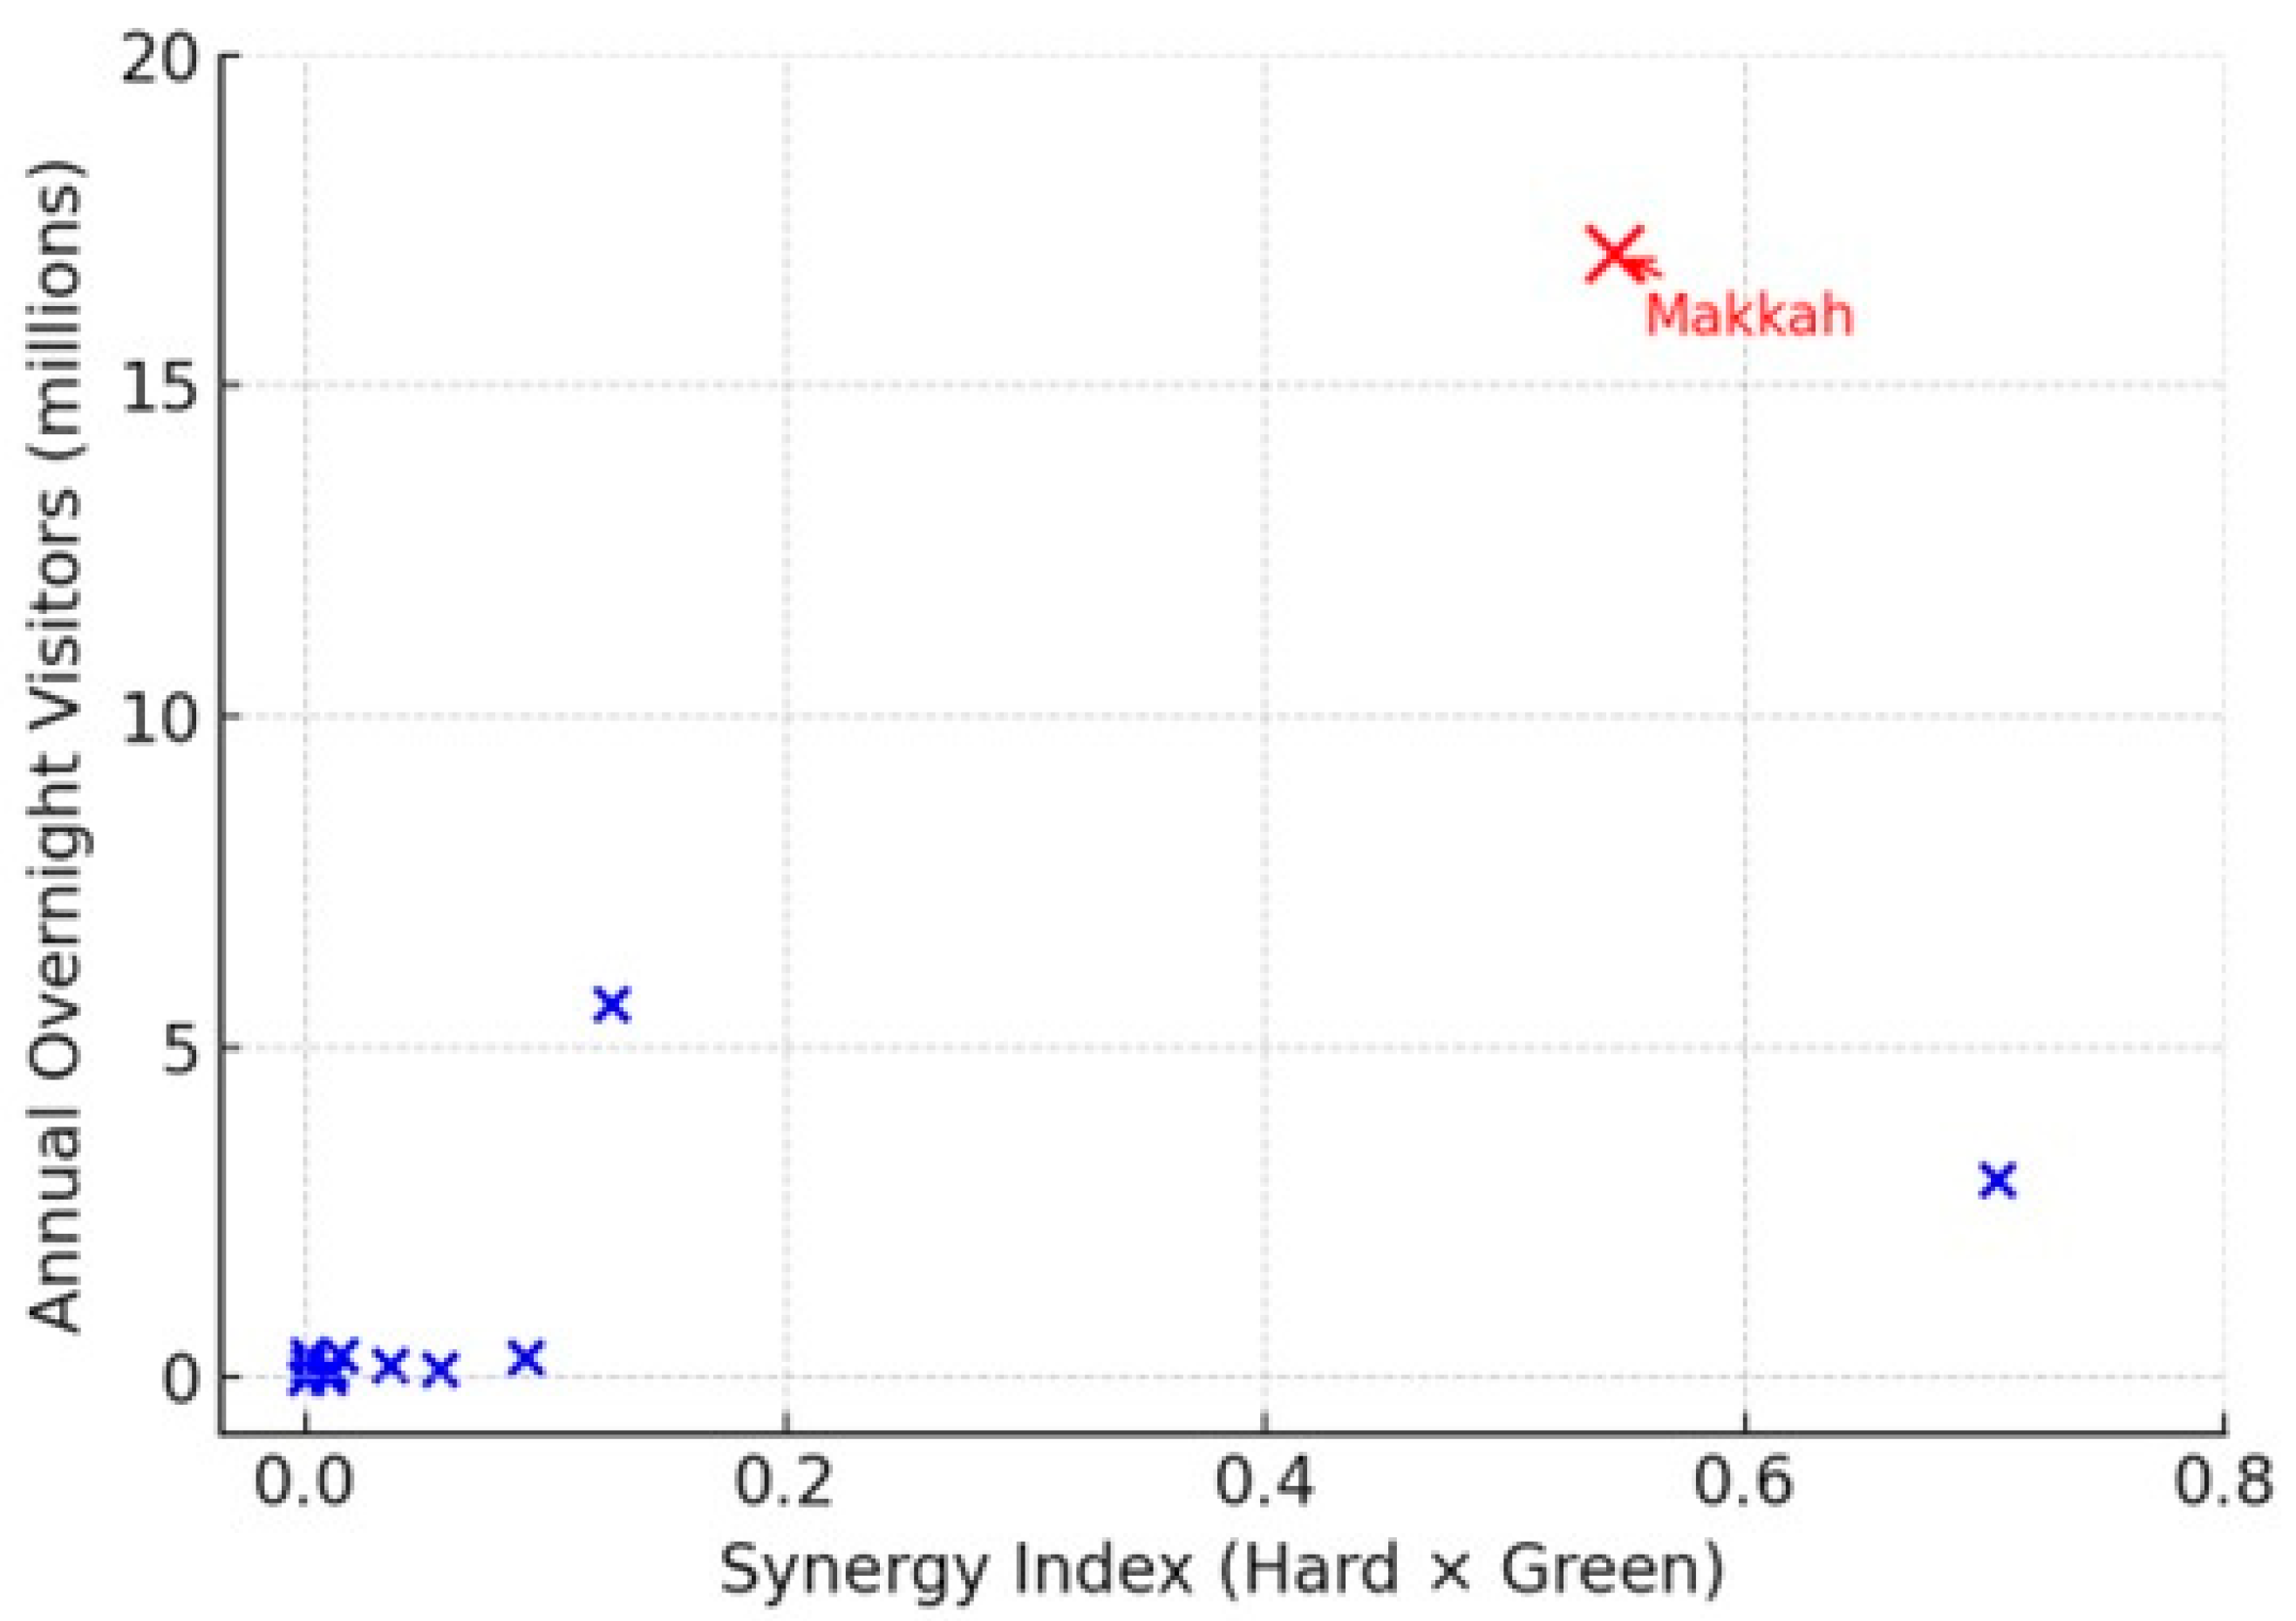
For a broader comparison, regions were categorized into synergy groups based on their joint infrastructure levels. Using a median split on the Hard and Green indices, each region was classified as High, Medium, or Low synergy. Table 5 lists each region’s index values and category. The six high-synergy regions (both Hard and Green above median) include the major tourism centers such as Riyadh, Makkah, and the Eastern Province, which indeed have the highest visitor counts. Two regions (Tabuk and Jazan) fall into a medium-synergy category (one index high, one low), and the remaining five regions (e.g., Hail, Najran, Al-Baha) are low-synergy with low values on both indices and minimal tourism activity. This clear trend suggests that substantial development in both built and green infrastructure is associated with significantly greater tourism. Figure 2 further illustrates the positive relationship between a combined Synergy Index (Hard × Green) and visitor numbers across regions, while Figure 3 shows a bubble chart of each region’s Hard and Green indices (x–y axes) with bubble size proportional to its visitors. Regions in the upper-right (high Hard and Green) have visibly larger bubbles, confirming that strong performance in both infrastructure dimensions coincides with higher tourism volumes.

3.6. Hierarchical Clustering (Ward)—Cluster Membership

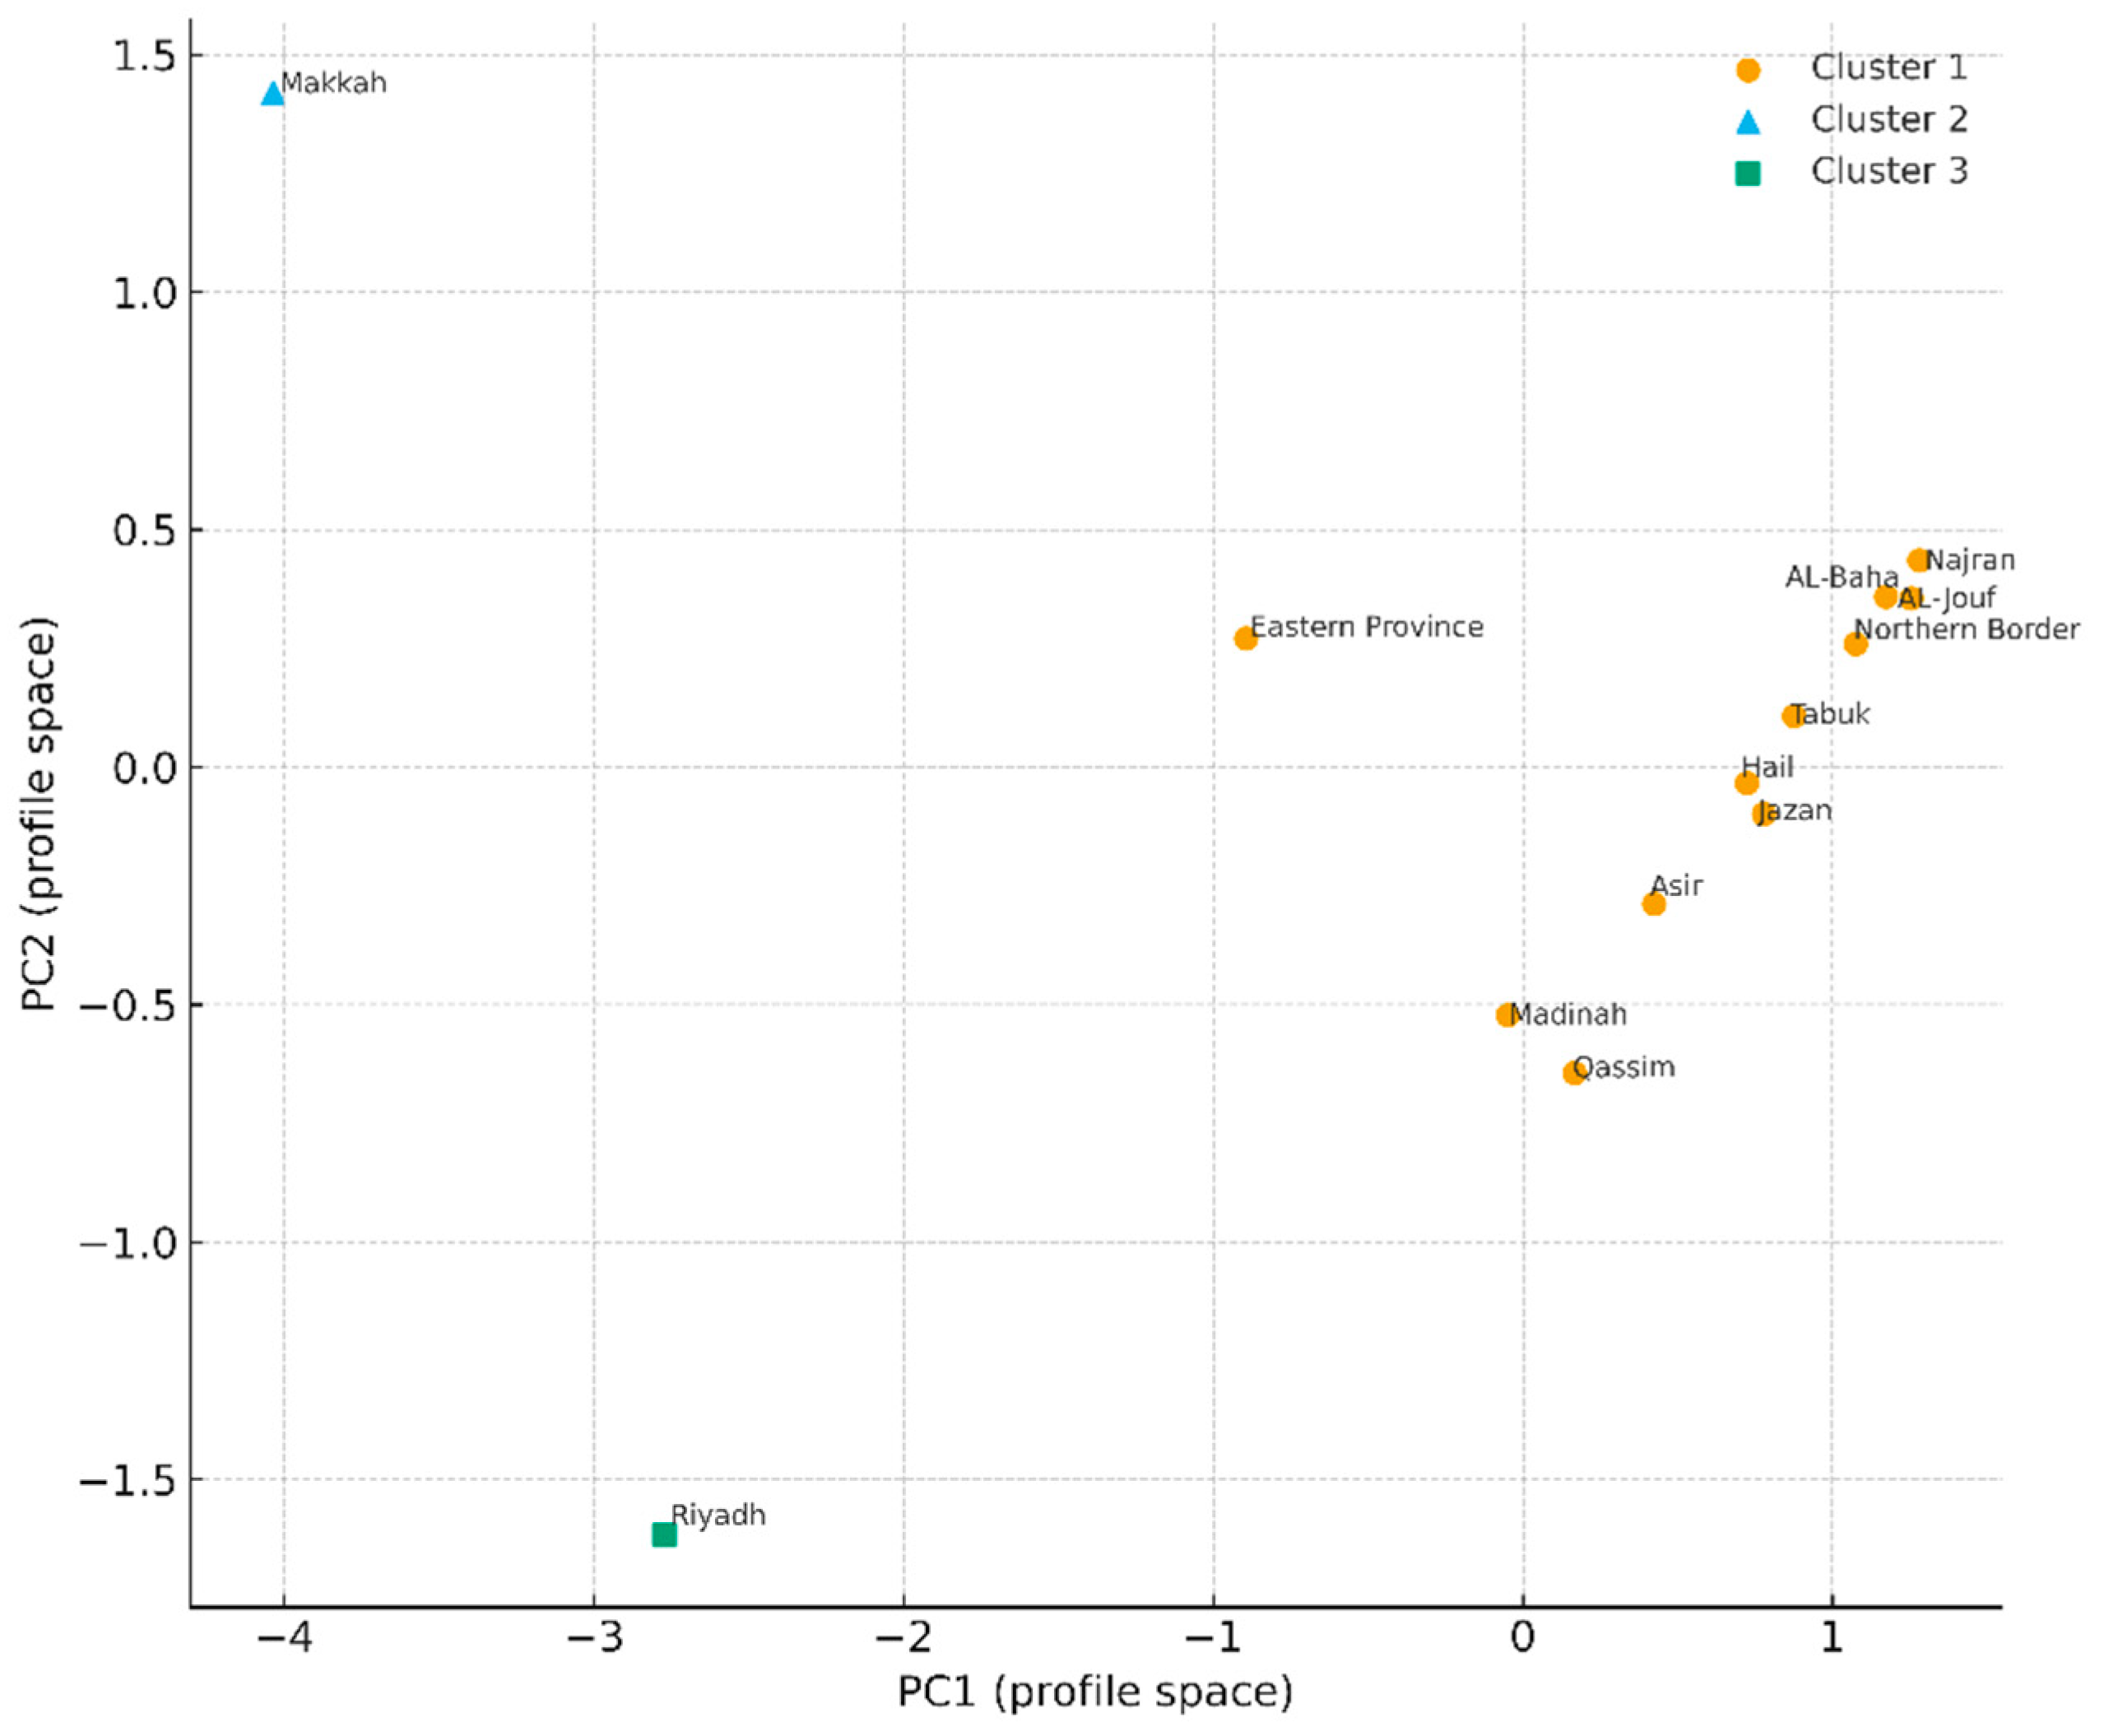
A hierarchical cluster analysis was conducted to validate the regional typologies. Using Ward’s method with Euclidean distance in the standardized Hard–Green–Visitors space, a three-cluster solution was retained. In this solution (Table 6), one cluster consists of a single “mega-hub” region (Makkah) with the highest infrastructure indices and visitor volume; another cluster isolates Riyadh (high built capacity and green provision with moderate visitor count) as a “strong urban” hub; and all remaining regions form a third cluster representing “emerging/peripheral” contexts with comparatively lower infrastructure and tourism. This structure broadly aligns with the synergy categorization by separating top-performing outliers from the rest.
Figure 4 presents a PCA profile map (PC1 × PC2) of the same standardized indicators, with points coded by k = 3 cluster membership. The map clarifies profile-level proximity (e.g., Riyadh and the Eastern Province plot near each other in multivariate space) while simultaneously showing why the k = 3 cut separates Riyadh as a singleton cluster due to its distinct overall profile. Taken together, Figure 4 (profile-level proximity) and Table 6 (cluster membership at k = 3) provide complementary perspectives on the regional typologies.

3.7. Region-Specific Marginal Effects of Green

To further elucidate the heterogeneous role of green infrastructure, we derived the marginal effect of Green from the interaction model for each region, i.e., ∂Y/∂Greeni = β(Green) + β(H × G)·Hardi. Consistent with the negative Hard × Green coefficient, the implied marginal effect becomes more negative as the Hard index increases, indicating smaller (and potentially adverse) returns to greening in high-capacity contexts. For transparency, region-specific marginal effects with robust standard errors and 95% confidence intervals are provided in Table 7, showing qualitatively similar patterns across regions.

3.8. PCA Robustness—Built Infrastructure Structure

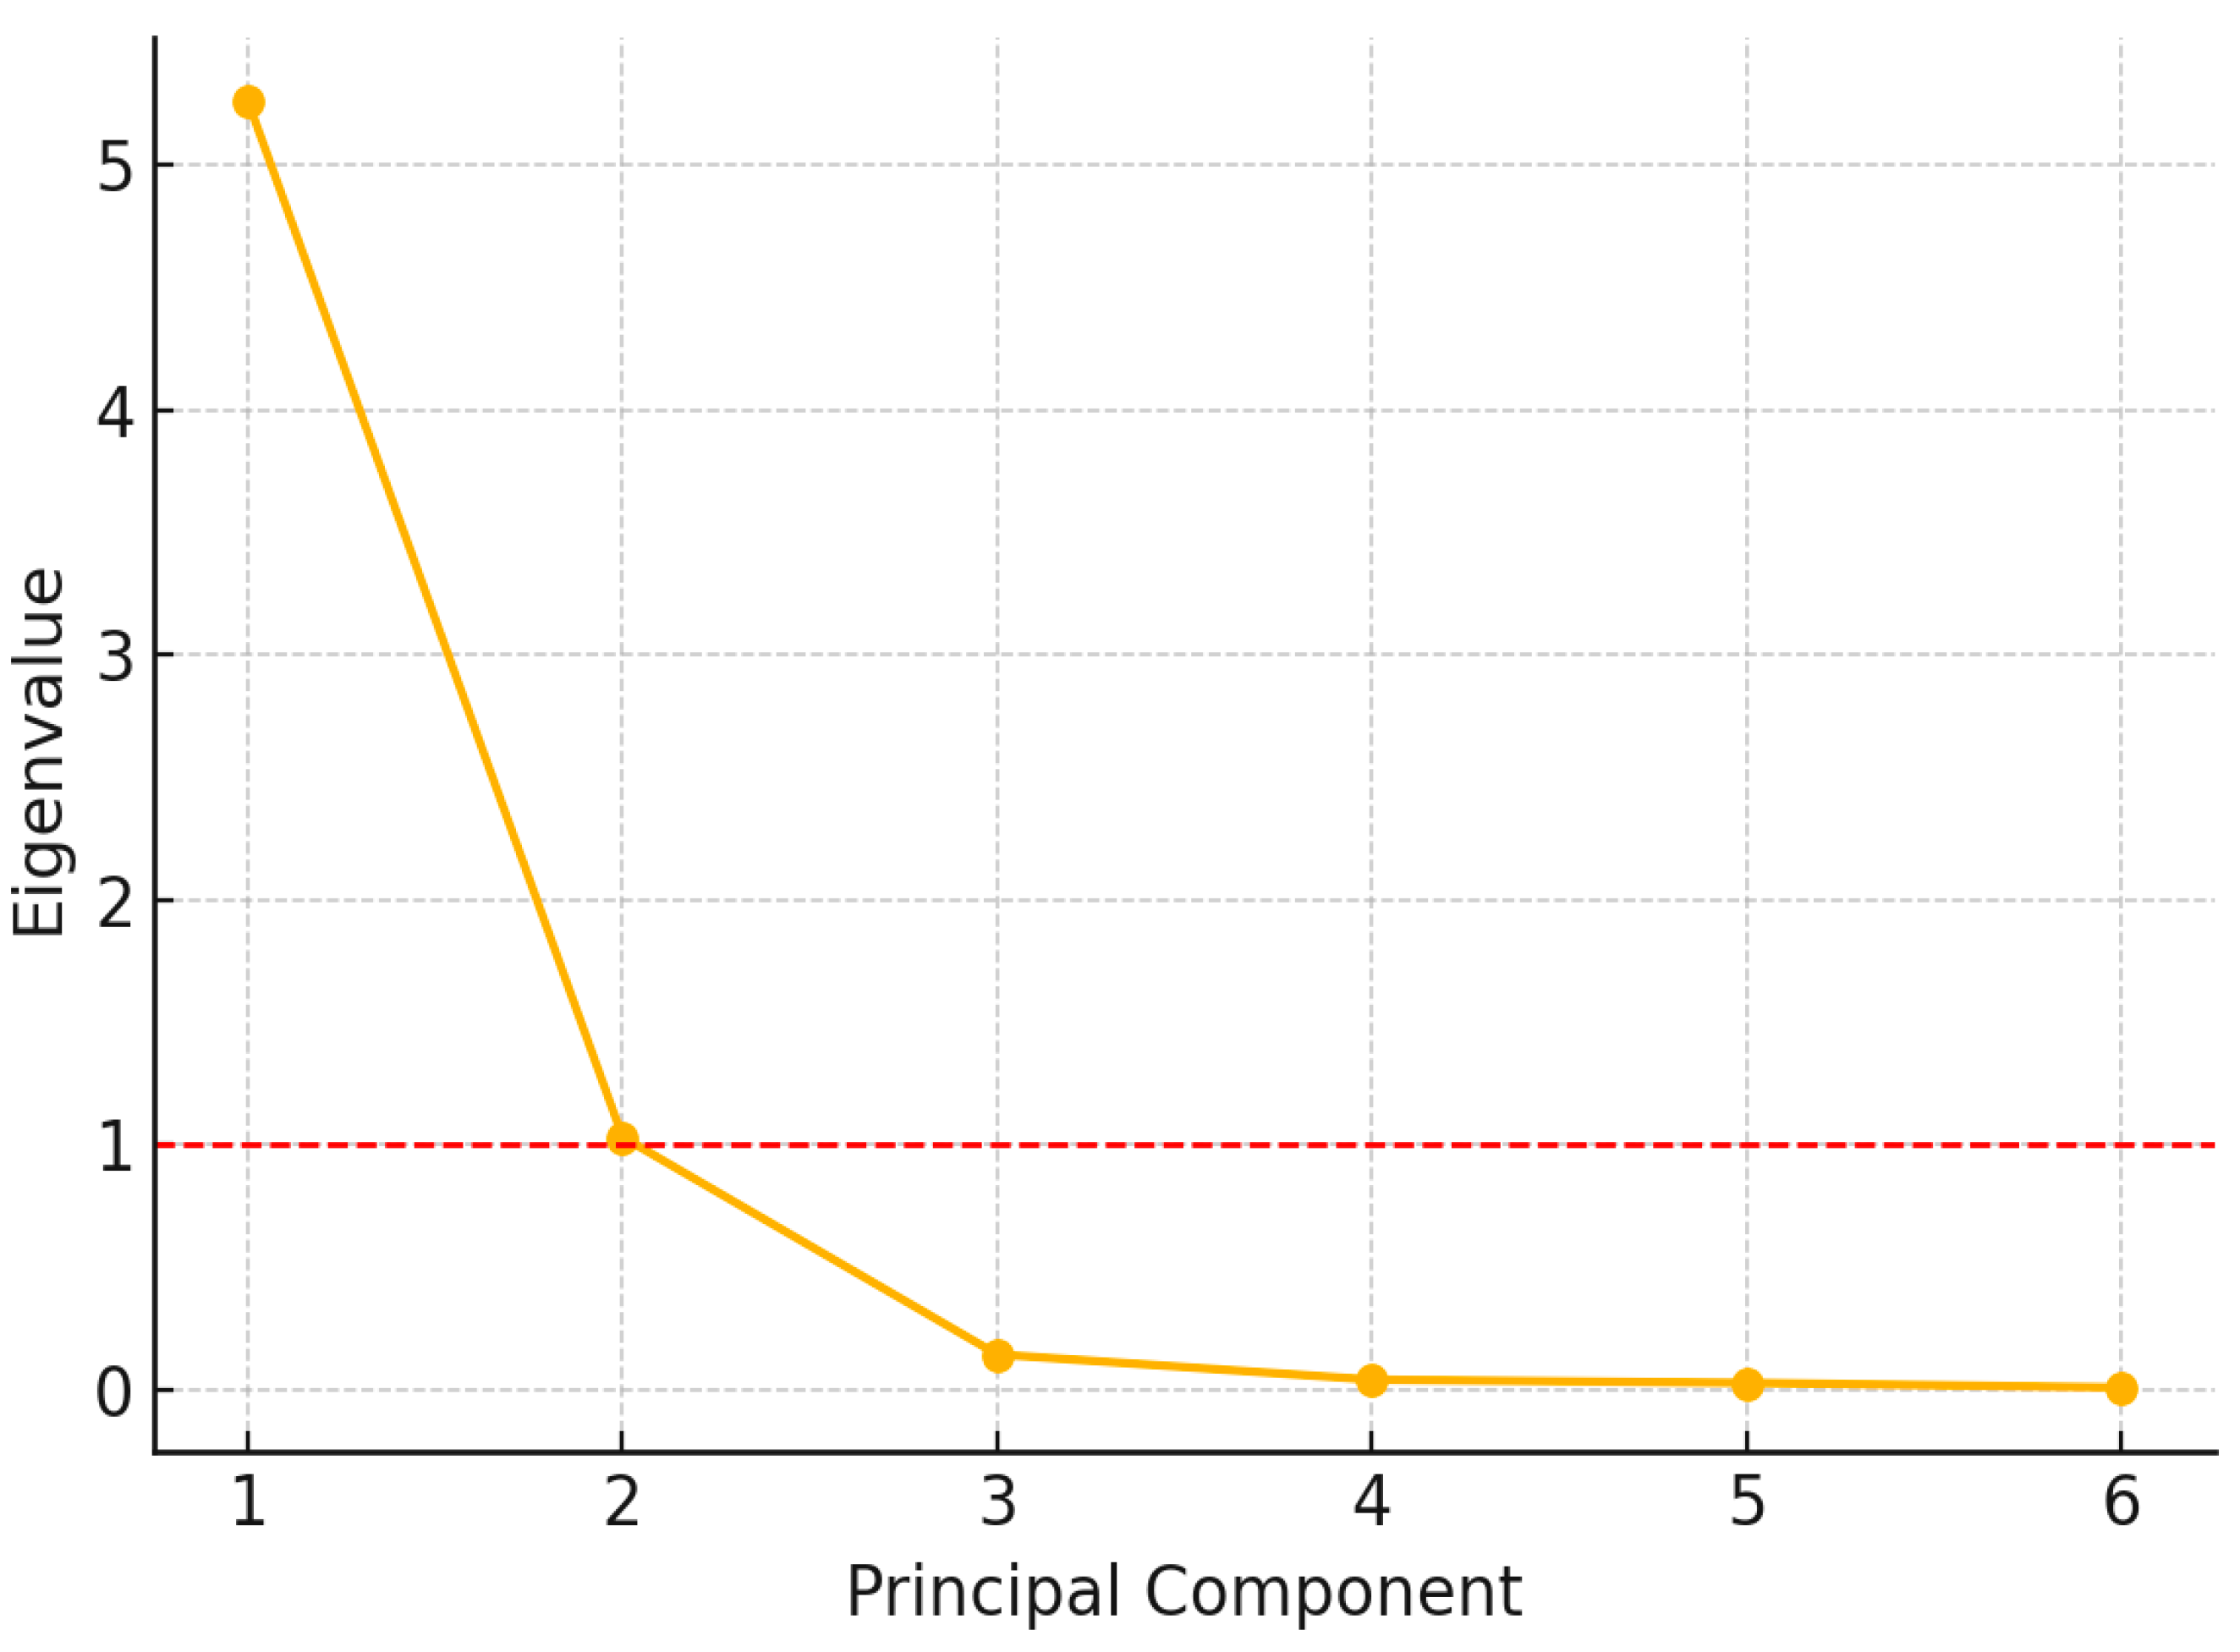
Finally, a principal component analysis (PCA) was performed on the six underlying built infrastructure indicators as a robustness check. The first principal component (PC1) has an eigenvalue of 4.854 and explains 80.9% of the total variance, with all variables loading positively and relatively evenly (Table 8 and Table 9 reports eigenvalues and explained variance). This indicates that a single latent factor (overall infrastructure intensity) underlies the various hard infrastructure measures, consistent with the construction of the composite Hard index. The second component (PC2, eigenvalue 0.948, 15.8% variance) captures a secondary contrast among indicators—for example, it differentiates areas by transport mode emphasis (e.g., road length vs. accommodation capacity; see loadings in Table 8)—but is much less influential. Only the first component has an eigenvalue above 1 (Figure 5). In regression, using PC1 and PC2 instead of the Hard index did not substantially improve fit given the small sample (and introduced multicollinearity), further justifying the simpler index approach. Overall, the PCA confirms that the built infrastructure metrics are highly collinear and that the composite Hard index effectively captures their common variance.

4. Discussion

The results indicate a clear hierarchy of effects: built infrastructure shows the strongest and most consistent association with regional tourism performance, in line with destination-competitiveness research that emphasizes access and accommodation as foundational enablers [32,33]. Green infrastructure contributes conditionally rather than uniformly: the negative, statistically significant Hard × Green interaction in the OLS models indicates diminishing marginal returns to greening as built capacity increases—i.e., within the observed hard-capacity range, the marginal association of Green is non-positive and becomes more negative at higher hard levels. Methodologically, interpreting the interaction via mean-centering and simple-slope probes (with HC1 inference) prevents product-term misreading and clarifies that “synergy” here is bounded, context-dependent complementarity rather than a universally multiplicative effect [31]. Exploratory spatial diagnostics further reveal non-uniform patterns across regions, reinforcing the need for place-specific policy rather than one-size-fits-all prescriptions [28]. Taken together, the evidence supports sequencing: ensure adequate built capacity first, then deploy targeted green upgrades where they yield the greatest marginal gains.
The findings also contribute to debates on spatial heterogeneity in tourism development. Considerable spatial variation was observed in the strength of infrastructure–tourism relationships: for instance, entertainment and accommodation capacity yield the largest payoffs in metropolitan business hubs, whereas green amenities are comparatively more influential in smaller mountain regions where natural landscape value is central to destination appeal. This resonates with multi-scalar perspectives linking infrastructure effectiveness to local context—urban form, environmental endowments, and demand composition [28,34]—and reinforces that one-size-fits-all policies may be suboptimal; instead, tourism strategies should account for regional differences in how built and natural assets translate into outcomes.
Policy implications:
The results have practical implications for infrastructure investment and tourism planning, particularly in the context of sustainable development goals. Because built capacity is foundational, emerging regions with low infrastructure endowment must prioritize baseline investments in transport, accommodation and utilities. In high-capacity urban hubs, by contrast, the strategy should shift from sheer expansion to quality upgrades, better management and the enhancement of the public realm. For instance, congested city destinations might focus on improving transit efficiency, urban design (e.g., shaded walkways, green roofs) and event curation rather than building new hotels. In built-dominant regions that currently lack green amenities, targeted introduction of green belts, urban parks or linear green corridors connecting key attractions can help extend visitor length-of-stay and improve the overall experience. Green-rich regions with moderate built capacity (such as nature-based destinations) should invest in eco-lodging, trail networks and visitor management plans that leverage their natural assets while preserving ecological integrity. In all cases, integrated planning is crucial: the findings support the view that jointly scheduling transportation, accommodation and green-space developments is preferable to pursuing “green only” or “built only” expansion in isolation [12,16,20,32,33]. An integrated approach can create complementary effects—ensuring that, for example, new attractions are accessible and well-serviced, or that new parks are connected to tourist circuits—thereby maximizing the sustainable competitiveness of destinations.
Limitations and future research:
This study has several limitations. The use of cross-sectional regional data limits the ability to infer dynamic effects or causal relationships over time. The small sample of regions (N = 13) reduces statistical power and constrains the complexity of models can be reliably estimated; in particular, it limits the number of control variables and interaction terms that can be included. The composite indices used equal weights, which, while transparent, are a simplification that may not capture the true importance of each component. It was attempted to address this through alternate weighting (PCA, entropy, DEA), but future research could benefit from more sophisticated index construction or validation. Moreover, the Green Infrastructure measure is relatively coarse (focused on parks and green space area); it does not directly account for quality aspects like biodiversity, ecosystem health or maintenance level. Future studies should incorporate richer green infrastructure metrics—such as habitat connectivity, canopy cover, or water quality in natural attractions—to more fully capture the environmental dimension of tourism infrastructure. A longitudinal approach (assembling panel data over multiple years) would allow examination of lagged effects and the trajectory of development (e.g., testing for tourism area life-cycle dynamics in infrastructure impacts). Such time-series (panel) designs are essential to disentangle transitory shocks from structural trends, identify dynamic and lagged effects, and strengthen causal interpretation of infrastructure–tourism linkages under Vision 2030 timelines. With more data, researchers could also explore non-linear models to detect thresholds or tipping points (for example, identifying at what level of infrastructure investment diminishing returns set in). There is also scope to apply multi-level or multiscale spatial models: finer-grained data (e.g., at city or district level within regions) could enable hierarchical modeling or multiscale GWR to test how neighborhood-level amenities and city-level capacities interact. Such approaches, along with modern spatial analysis techniques, can provide a more nuanced understanding of how infrastructure and tourism outcomes are linked across different scales [11,14,18,19,20]. Despite these limitations, this study provides an integrative framework and initial evidence to inform sustainable tourism infrastructure planning in Saudi Arabia and comparable contexts.
These results align with international evidence that tourism performance emerges from the joint provision of access, accommodation and high-quality public realm. In metropolitan hubs, marginal gains increasingly come from quality upgrades and place-making (e.g., shaded streets, green roofs, and urban design) rather than sheer capacity expansion. In nature-based destinations, targeted eco-lodging, trail networks and visitor-management systems can translate environmental amenities into longer stays and higher willingness-to-pay while safeguarding ecological integrity.
From a measurement perspective, using both composite indices and dimensionality-reduction techniques (e.g., PCA) helps validate constructs and mitigate multicollinearity. Robustness checks that contrast equal-weight indices with data-driven weights are especially important when indicators capture heterogeneous infrastructure domains. Complementary clustering can reveal tractable regional typologies that support differentiated policy strategies.
Policy should therefore be sequenced: baseline transport and accommodation where endowments are low; integration and experience design where networks are mature; and ecological safeguards in green-rich regions. Integrated planning timelines that coordinate transport links, event calendars and green-space connectivity maximize complementarities and reduce the risk of stranded investments.

5. Conclusions

This study demonstrates that regional tourism performance in Saudi Arabia is anchored primarily in built infrastructure, with green infrastructure adding value in a conditional manner. Where access and accommodation remain below saturation, incremental green investments are associated with higher visitation; where built capacity is already extensive, returns to additional greening appear smaller, indicating conditional complementarity rather than universal multiplicative synergy. Exploratory spatial diagnostics and clustering further reveal meaningful heterogeneity across regions, cautioning against uniform policy prescriptions.
For policy and planning, our results support a sequenced and integrated approach: (i) prioritize foundational transport and accommodation where endowments are low; (ii) shift toward quality upgrades, visitor-flow management, and public-realm enhancement (e.g., connected green corridors, shading, and walkability) in mature urban hubs; and (iii) leverage targeted, conservation-aligned green infrastructure in nature-based destinations to extend length of stay while safeguarding ecological integrity. Methodologically, the evidence base would benefit from richer measures of environmental quality (e.g., canopy cover, habitat connectivity) and panel data to identify non-linearities and temporal thresholds in infrastructure–tourism relationships. Overall, the findings refine the synergy narrative by framing it as bounded, context-dependent complementarity and emphasize integrated, place-specific planning to advance sustainable tourism outcomes.
Funding

This work was supported and funded by the Deanship of Scientific Research at Imam Mohammad Ibn Saud Islamic University (IMSIU) (grant number IMSIU-DDRSP2504).

Data Availability Statement

Data are available upon request.

Conflicts of Interest

The author declares no conflicts of interest.

References

  1. World Travel & Tourism Council (WTTC). Travel & Tourism Economic Impact 2011: World; WTTC: London, UK, 2011. [Google Scholar]
  2. Valánszki, I.; Fóris, E.D.; Kovács, K.F. Parallel development of green infrastructure and sustainable tourism: Case studies from Hungary. Pol. J. Nat. Sci. 2018, 33, 625–647. [Google Scholar]
  3. Musah, M.; Kong, Y.; Mensah, I.A.; Antwi, S.K.; Osei, A.A.; Donkor, M. Modelling the connection between energy consumption and carbon emissions in North Africa: Evidence from panel models robust to cross-sectional dependence. Environ. Dev. Sustain. 2021, 23, 15225–15239. [Google Scholar] [CrossRef]
  4. Li, Q. Reservoir Science: A Multi-Coupling Communication Platform to Promote Energy Transformation, Climate Change and Environmental Protection. Reserv. Sci. 2025, 1, 1–2. [Google Scholar] [CrossRef]
  5. Li, Q.; Wu, J.; Li, Q.; Wang, F.; Cheng, Y. Sediment instability caused by gas production from hydrate-bearing sediment in Northern South China Sea by horizontal wellbore: Sensitivity analysis. Nat Resour Res. 2025, 34, 1667–1699. [Google Scholar] [CrossRef]
  6. Ritchie, B.W.; Crouch, G.I. A model of destination competitiveness and sustainability. J. Sustain. Tour. 2011, 19, 757–768. [Google Scholar] [CrossRef]
  7. Bramwell, B.; Lane, B. Critical research on the governance of tourism and sustainability. J. Sustain. Tour. 2011, 19, 411–421. [Google Scholar] [CrossRef]
  8. Tussyadiah, I.P. Toward a theoretical foundation for technology adoption in tourism. J. Travel Res. 2014, 53, 1–13. [Google Scholar] [CrossRef]
  9. Higgins-Desbiolles, F. Sustainable tourism: Sustaining tourism or something more? Tour. Manag. Perspect. 2018, 25, 157–160. [Google Scholar] [CrossRef]
  10. Ceballos-Lascurain, H. Tourism, Ecotourism and Protected Areas; IUCN: Gland, Switzerland, 1996. [Google Scholar]
  11. Gearing, C.E.; Swart, W.W.; Var, T. Establishing a measure of touristic attractiveness. J. Travel Res. 1974, 12, 1–8. [Google Scholar] [CrossRef]
  12. Khadaroo, J.; Seetanah, B. Transport Infrastructure and Tourism Development. Ann. Tour. Res. 2007, 34, 1021–1032. [Google Scholar] [CrossRef]
  13. Naudé, W.; Saayman, A. Determinants of tourist arrivals in Africa: A cross-sectional analysis. Tour. Econ. 2004, 10, 365–391. [Google Scholar] [CrossRef]
  14. Onat, G. The Effect of Food and Beverages Served in Accommodation Businesses on Destination Attractiveness. Tour. Destin. 2024, 2, 69–80. [Google Scholar] [CrossRef]
  15. García-García, A.R.; Jacobo-Hernández, C.A.; Ochoa-Jiménez, S.; Valdez-del Río, S. Sustainable Development and Tourism: A Review of the Literature of the Last 20 Years. Sustainability 2023, 15, 16805. [Google Scholar] [CrossRef]
  16. Boers, B.; Cottrell, S. Sustainable tourism infrastructure planning: A GIS-supported approach. Tour. Geogr. 2007, 9, 1–21. [Google Scholar] [CrossRef]
  17. Sampieri, S.; Bagader, M. Sustainable tourism development in Jeddah: Protecting cultural heritage while promoting travel destination. Sustainability 2024, 16, 9148. [Google Scholar] [CrossRef]
  18. Lane, B. Will Sustainable Tourism Research Be Sustainable in the Future? An Opinion Piece. Tour. Manag. Perspect. 2018, 25, 161–164. [Google Scholar] [CrossRef]
  19. Lee, T.H.; Jan, F.H. Can community-based tourism contribute to sustainable development? Evidence from Taiwan. Asia Pac. J. Tour. Res. 2019, 70, 368–380. [Google Scholar] [CrossRef]
  20. Yang, Z.; Homma, R. Research on the synergistic relationship between urban tourist attractions and green infrastructure in Japanese cities based on green tourism. City Built Environ. 2025, 3, 3, (In Chinese with English Summary). [Google Scholar] [CrossRef]
  21. World Tourism Organization (UNWTO). Tourism and Sustainable Development: A Guide for Policy Makers; UNWTO: Madrid, Spain, 1998. [Google Scholar]
  22. Kumar, V.; Vuillomenet, A. Urban nature: Does green infrastructure relate to the cultural and creative vitality of European cities? Sustainability 2021, 13, 8052. [Google Scholar] [CrossRef]
  23. Guerrero-Moreno, M.A.; Oliveira-Junior, J.M.B. Approaches, Trends, and Gaps in Community-Based Ecotourism Research: A Bibliometric Analysis of Publications between 2002 and 2022. Sustainability 2024, 16, 2639. [Google Scholar] [CrossRef]
  24. Idris, N.A.; Khalid, M.S.; Yusof, N. The role of tourists, infrastructure and institutions in sustainable tourism: A structural equation modeling approach. Sustainability 2025, 17, 2841. [Google Scholar] [CrossRef]
  25. González-Rodríguez, M.R.; Díaz-Fernández, M.C.; Pulido-Pavón, N.; Borrero-Molina, D.V. Redefining the tourism destination competitiveness index beyond a purely economic approach. Curr. Issues Tour. 2025. online ahead of print. [Google Scholar] [CrossRef]
  26. James, E.E.; Essien, A.U. Infrastructure and sustainable tourism development in Nigeria. IOSR J. Humanit. Soc. Sci. 2019, 24, 72–80. [Google Scholar]
  27. Hartigan, J.A.; Wong, M.A. A K-means clustering algorithm. Appl. Stat. 1979, 28, 100–108. [Google Scholar] [CrossRef]
  28. Fotheringham, A.S.; Yang, W.; Kang, W. Multiscale geographically weighted regression (MGWR). Ann. Am. Assoc. Geogr. 2017, 107, 1247–1265. [Google Scholar] [CrossRef]
  29. Abdi, H.; Williams, L.J. Principal component analysis. Wiley Interdiscip. Rev. Comput. Stat. 2010, 2, 433–459. [Google Scholar] [CrossRef]
  30. Candia, S.; Giuffrida, S.; Nicolosi, P.; Pezzino, G.; Salvo, F. Tourism Environmental Impacts Assessment to Guide Public Authorities towards Sustainable Choices for the Post-COVID Era. Sustainability 2021, 14, 18. [Google Scholar] [CrossRef]
  31. Schneider, A.L.; Hommel, G.; Blettner, M. Linear regression analysis: Part 14 of a series on evaluation of scientific publications. Dtsch. Ärzteblatt Int. 2010, 107, 776–782. [Google Scholar] [CrossRef]
  32. Cracolici, M.F.; Nijkamp, P.; Rietveld, P. Assessment of tourism competitiveness by analysing destination efficiency. Tour. Econ. 2008, 14, 325–342. [Google Scholar] [CrossRef]
  33. Crouch, G.I.; Ritchie, J.R.B. Tourism, competitiveness and societal prosperity. J. Bus. Res. 1999, 44, 137–152. [Google Scholar] [CrossRef]
  34. Mowforth, M.; Munt, I. Tourism and Sustainability: Development, Globalisation and New Tourism in the Third World; Routledge: London, UK, 2003. [Google Scholar]
Figure 1. Simple slopes: Predicted overnight visitors vs. Green Infrastructure Index at low, median, and high Hard Index levels.
Sustainability 17 09295 g001
Figure 2. Synergy Index (Hard × Green) versus annual overnight visitors for the 13 regions. Higher synergy tends to correspond to greater visitation (Blue × markers denote individual regions; the red × highlights Makkah).
Sustainability 17 09295 g002
Figure 3. Bubble chart mapping Hard infrastructure index (x-axis) vs. Green infrastructure index (y-axis), with bubble size proportional to annual visitors. Regions with higher values on both axes (upper-right quadrant) generally exhibit larger bubbles, indicating superior tourism performance.
Sustainability 17 09295 g003
Figure 4. PCA profile map (PC1 × PC2) on standardized indicators (Hard, Green, Visitors); points are coded by k = 3 Ward clusters. Riyadh and the Eastern Province plot near each other in multivariate profile space, yet the k = 3 cut separates Riyadh as a singleton cluster due to its distinct overall profile.
Sustainability 17 09295 g004
Figure 5. Scree plot of eigenvalues for the built infrastructure PCA. The sharp drop after the first component and the Kaiser criterion (red dashed line at eigenvalue = 1) both suggest retaining only the first principal components.
Sustainability 17 09295 g005
Table 1. Descriptive statistics of key variables.
VariableCountMeanStdMin25%50%75%Max
y13.02,109,502.7694,772,251.39614,850.0126,253.0196,708.0357,820.017,014,574.0
hard13.00.1920.2640.0040.0240.0690.2260.803
green13.00.3100.2870.0000.0980.2220.4331.000
Table 2. Pearson correlation matrix (N = 13).
VariableyHardGreen
y1.00.8140.541
hard0.8141.00.899
green0.5410.8991.0
Table 3. OLS regression results with Hard × Green interaction (robust SE).
VariableCoefficientStd. Errorp-Value
Intercept−67,645.512601,835.46050.9105
Hard46,630,672.72545,223,327.69180.0000
Green−12,556,194.87493,725,246.48980.0008
Hard × Green−23,584,663.88957,485,504.29330.0016
Note: Predictors were mean-centered prior to forming the interaction. HC1 robust standard errors reported. Simple-slope and Johnson–Neyman probes were used to interpret the Hard × Green term.
Table 4. OLS interaction models (baseline vs. residualized).
ModelΒ (Hard)pΒ (Green/Green_Resid)pΒ (Hard × Green[(_Resid)])pAdj. R2VIF RangeCondition Index
Baseline (Hard, Green, Hard × Green)3.73 × 10⁷<0.0001−1.54 × 10⁷<0.0001−2.54 × 1070.00080.9114.76–4.762.37
Residualized (Hard, Green_resid, Hard × Green_resid)1.23 × 10⁷<0.0001−7.76 × 10⁶<0.0001−3.68 × 10⁷<0.00010.9451.00–1.001.36
Table 5. Regional synergy categories (by median split of Hard and Green indices).
RegionHardGreenVisitorsSynergy_Category
Riyadh0.7051.0003,010,057High synergy
Makkah0.8030.67917,014,574High synergy
Madinah0.2260.404321,068High synergy
Qassim0.1230.453126,253High synergy
Eastern Province0.2930.4335,667,364High synergy
Asir0.1130.307186,905High synergy
Tabuk0.0690.142138,049Medium synergy
Hail0.0670.217357,820Low synergy
Northern Border0.0090.098356,241Low synergy
Jazan0.0400.22214,850Medium synergy
Najran0.0230.00017,390Low synergy
AL-Baha0.0040.03516,257Low synergy
AL-Jouf0.0240.045196,708Low synergy
Table 6. Cluster membership by region (Ward method, k = 3 clusters).
RegionHardGreenVisitorsCluster
Madinah0.2260.404321,0681
Qassim0.1230.453126,2531
Eastern Province0.2930.4335,667,3641
Asir0.1130.307186,9051
Tabuk0.0690.142138,0491
Hail0.0670.217357,8201
Northern Border0.0090.098356,2411
Jazan0.0400.22214,8501
Najran0.0230.00017,3901
AL-Baha0.0040.03516,2571
AL-Jouf0.0240.045196,7081
Riyadh0.7051.0003,010,0572
Makkah0.8030.67917,014,5743
Table 7. Region-level marginal effect of Green infrastructure on visitors (derived from interaction model).
RegionHardGreenMarginal dY/dGreenSECI95_LowCI95_Highp_Value
Riyadh0.7051.000−29,173,7873,928,759−36,874,155−21,473,4200.0000
Makkah0.8030.679−31,494,0504,480,965−40,276,741−22,711,3600.0000
Madinah0.2260.404−178,930,102,883,244−23,544,168−12,241,8530.0000
Qassim0.1230.453−15,455,0233,184,824−21,697,278−9,212,7670.0000
Eastern Province0.2930.433−19,465,1602,787,130−24,927,935−14,002,3850.0000
Asir0.1130.307−15,226,1073,221,247−21,539,751−8,912,4630.0000
Tabuk0.0690.142−14,181,8063,402,176−20,850,071−7,513,5410.0000
Hail0.0670.217−14,132,8053,411,221−20,818,798−7,446,8120.0000
Northern Border0.0090.098−12,764,1083,681,476−19,979,800−5,548,4160.0005
Jazan0.0400.222−13,509,7293,530,189−20,428,899−6,590,5580.0001
Najran0.0230.000−13,108,0353,610,553−20,184,720−6,031,3500.0003
AL-Baha0.0040.035−12,655,2783,704,305−19,915,715−5,394,8390.0006
AL-Jouf0.0240.045−13,116,4853,608,835−20,189,801−6,043,1690.0003
Table 8. PCA loadings (built infrastructure indicators on principal components).
IndicatorPC1PC2PC3PC4PC5PC6
Number of Tourists Accommodation0.356−0.6310.097−0.380−0.1460.548
Number of Entertainment Events0.4140.362−0.484−0.5240.435−0.014
Total of cars movements between cities0.423−0.3360.2300.4310.645−0.231
Total of Roads Length in Km between cities0.3660.5430.725−0.089−0.0960.170
Internal Flights daily average0.4360.200−0.4210.607−0.3070.361
External Flights daily average0.446−0.155−0.031−0.139−0.520−0.697
Table 9. PCA eigenvalues and explained variance.
ComponentEigenvalueExplainedVarianceRatio
PC14.8540.809
PC20.9480.158
PC30.1320.022
PC40.0360.006
PC50.0240.004
PC60.0060.001
Note: PCA was performed on the correlation matrix (z-standardized indicators; p = 6).
Disclaimer/Publisher’s Note: The statements, opinions and data contained in all publications are solely those of the individual author(s) and contributor(s) and not of MDPI and/or the editor(s). MDPI and/or the editor(s) disclaim responsibility for any injury to people or property resulting from any ideas, methods, instructions or products referred to in the content.