Article

Constructing a “Clustered–Boundary–Cellular” Model: Spatial Differentiation and Sustainable Governance of Traditional Villages in Multi-Ethnic China

by
Yaolong Zhang
1,* and
Junhuan Li
2
1
School of Geography and Urban-Rural Planning, Longdong University, Qingyang 745000, China
2
School of Architecture, Xi’an University of Architecture and Technology, Xi’an 710055, China
*
Author to whom correspondence should be addressed.
Sustainability 2025, 17(20), 9268; https://doi.org/10.3390/su17209268 (registering DOI)
Submission received: 1 September 2025 / Revised: 15 October 2025 / Accepted: 16 October 2025 / Published: 18 October 2025
(This article belongs to the Section Sustainable Urban and Rural Development)

Abstract

Understanding the spatial patterns of ethnic inter-embeddedness is essential for promoting sustainable development in multi-ethnic regions. This study develops a novel “Clustered-Boundary-Cellular” typological model to interpret the spatial differentiation of traditional villages in China’s Hehuang region. Using an integrated approach that combines GIS spatial analysis (Kernel Density Estimation, Ripley’s K-function, and Standard Deviational Ellipse), spatial statistics (Global Moran’s I), and other statistical tests (Kruskal–Wallis tests and multinomial logistic regression), we categorized and analyzed 153 nationally designated traditional villages. The results indicate the following: (1) The villages exhibit significant spatial differentiation, falling into three distinct scenarios. Clustered–Isolation villages (107/153, 69.9%) are predominantly located in topographically constrained areas and display strong spatial clustering; Boundary–Permeation villages (24/153, 15.7%) are distributed along transport corridors and show the highest road density (0.55 km/km2); Cellular–Symbiosis villages (22/153, 14.4%) occur in multi-ethnic cores areas and exhibit a relatively random spatial distribution. (2) This differentiation results from the synergistic effects of multidimensional drivers: natural environmental constraints (notably elevation and proximity to rivers), religious–cultural adaptation (Global Moran’s I analysis confirms the strong clustering of Tibetan and Salar groups, reflecting distinct religious spatial logics), and economic transition dynamics (transportation infrastructure serves as a key catalyst). This study demonstrates the value of the proposed model as an analytical tool for diagnosing ethnic spatial relations. The findings offer important insights and spatial guidance for formulating context-sensitive strategies for sustainable governance, cultural heritage preservation, and ethnic integration.

1. Introduction

The spatial organization of multi-ethnic settlements constitutes a critical interdisciplinary frontier in human and cultural geography, carrying profound implications for social stability and sustainable development. In China, home to 56 ethnic groups, the concept of “ethnic inter-embeddedness” has emerged as a pivotal framework. It conceptualizes the development of interdependent territorial communities through multidimensional integration across residential, economic, cultural, and social spheres within shared geographical spaces [1]. Unlike Western approaches that frequently emphasize ethnic segregation and spatial justice [2], this paradigm prioritizes comprehensive intergroup engagement, pluralistic coexistence, and spatially embedded relationships. Meanwhile, the spatial turn in social exclusion theory underscores that spatial isolation serves not only as a consequence but also as a reinforcement mechanism of social exclusion [3], thereby providing a cross-cultural comparative basis for understanding the spatial logic underlying ethnic inter-embeddedness.
Traditional villages act as crucial repositories of these socio-spatial patterns, embodying historical memories of migration and cohabitation. They provide the material foundation for cultural transmission and function as key sites for fostering local identity. However, under pressures from urbanization and economic transformation, their spatial structures and interethnic dynamics are undergoing profound changes. Understanding the mechanisms of their spatial differentiation has therefore become central to regional governance and ethnic cohesion [4,5]. As research on spatial isolation demonstrates, marginalized spaces often exacerbate social exclusion due to insufficient public services, limited employment opportunities, and other factors [3]. This perspective provides a theoretical framework for understanding the transformation of traditional villages.
Although spatial analysis techniques such as spatial autocorrelation and geographical detectors have demonstrated their utility in quantifying settlement patterns [6,7,8,9,10,11,12], a significant research gap remains. Existing studies frequently concentrate on villages of a single ethnicity or lack a comparative examination of the driving factors operating across different inter-embeddedness scenarios. Furthermore, the integration of quantitative spatial metrics with qualitative, field-based insights to systematically unravel the complex interplay among natural, cultural, and economic drivers remains limited.
The Hehuang region, a transitional zone between the Tibetan and Loess Plateaus, offers an ideal case for investigating multi-ethnic spatial patterns. Its complex topography, combined with a long history of migration and trade, has fostered a distinctive landscape of co-settlement among Han, Tibetan, Hui, Tu, and Salar groups [13]. This region is characterized not only by its geographical periphery but also as a pronounced area of ethnic inter-embeddedness. Its spatial structure embodies both the marginality associated with core–periphery dynamics and the capacity of ethnic inter-embeddedness to foster social integration. This combination makes Hehuang a critical and highly relevant setting for examining the configuration and drivers of multi-ethnic spatial patterns. Its dual identity as both a geographical periphery and a zone of intensive ethnic interaction enables a nuanced analysis of spatial differentiation mechanisms, offering insights applicable to similar multi-ethnic transitional regions worldwide.
Guided by the theory of ethnic inter-embeddedness, this study investigates the spatial differentiation of traditional villages in the Hehuang region by addressing three objectives:
(1) To characterize their spatial distribution patterns;
(2) To identify the key driving factors and their operational mechanisms through an integrated approach of GIS spatial analysis and ethnographic fieldwork;
(3) To elucidate how natural geography, economic connectivity, and particularly, religious–cultural beliefs interact to shape village spatial configurations.
Through this endeavor, this study seeks to advance theoretical understanding in ethnic geography while generating a spatially explicit evidence base. This foundation is critical for formulating context-sensitive and sustainable governance strategies that balance cultural preservation, social stability, and development in multi-ethnic regions.
Guided by these objectives, this study is structured around the following central research question: “How can a ‘Clustered–Boundary–Cellular’ typological model elucidate the spatial differentiation and its underlying driving mechanisms of traditional villages in the multi-ethnic context of China’s Hehuang region?”
This question serves as the analytical lens linking our theoretical framework with an empirical investigation. The remainder of this paper is structured as follows: Section 2 constructs the theoretical framework of the “Clustered–Boundary–Cellular” model. Section 3 details the study area, data sources, and methodology. Section 4 presents the empirical results. Finally, Section 5 discusses the findings, outlines theoretical and practical implications, and concludes the study.

2. Theoretical Framework

2.1. Theoretical Foundation and Evolution

The concept of ethnic inter-embeddedness is rooted in the broader theory of embeddedness, which posits that economic actions are not autonomous but are shaped by social relations and institutional contexts [14]. A foundational contribution was made by Polanyi, who, in The Great Transformation, argued that “the economy is embedded in society,” emphasizing how market mechanisms are enmeshed within social relational networks and governed by a “double movement” [15]. This macro-sociological perspective was later refined by Granovetter, who advanced the theory at a micro-level by stressing that individual economic actions are influenced by ongoing social networks and relational structures [16]. The dialog between Polanyi’s macro-institutional and Granovetter’s micro-relational embeddedness offers a powerful, multidimensional lens for analyzing the intricate interweaving of society, economy, and space.
Building on this foundation, the Chinese discourse on ethnic inter-embeddedness has extended the framework to address socio-spatial integration in multi-ethnic contexts. It extends beyond purely economic relations to encompass a holistic form of integration spanning spatial, cultural, economic, social, and psychological dimensions [17]. This approach conceptualizes a symbiotic system defined by shared values, mutually enriching cultures, interconnected economies, convergent livelihoods, and overlapping residential spaces [18]. Thus, ethnic inter-embeddedness in China manifests as an interwoven coexistence among ethnic groups—reflected in their spatial distribution, cultural syncretism, economic interdependence, and affective ties—forming a practical foundation for building cohesive social structures and community environments [19].
Notably, this dynamic of inter-embeddedness differs sharply from the “spatial isolation” and “social exclusion” seen in Western urban studies [20]. In Western contexts, spatial isolation often results from and also reinforces social exclusion. In contrast, China’s ethnic inter-embeddedness model actively counters socio-spatial fragmentation. It does so through planned spatial integration and by building intergroup social networks. This approach offers a distinct form of “socio-spatial integration” for multi-ethnic regions.
This dynamic appears not only in physical space—such as nested village patterns and permeable community layouts—but also in socio-cultural interactions and identity formation. Case studies from Hui–Han integration in Ningxia’s Minning Town [21] and multi-ethnic cohabitation in Yunnan’s mountain-basin settlements [22] show how inter-embeddedness improves intergroup relations. It does so by reorganizing space, restructuring social networks, and reshaping cultural identity, from village-level interactions to wider regional societies. This theoretical advance turns abstract social relations into clear socio-spatial logic, forming a distinct Chinese model of society–space–culture coevolution.

2.2. The “Clustered–Boundary–Cellular” Model: A Contextual Framework

This study combines ethnic inter-embeddedness theory with spatial sociology. It also considers the unique environment, cultures, and history of the Hehuang region. Based on this, we propose the “Clustered–Isolation–Boundary–Permeation–Cellular–Symbiosis” model (Figure 1). This model classifies the spatial relationships between ethnic groups in multi-ethnic areas. The three types are defined below:
(1) Clustered–Isolation: This type features settlements that are geographically separate and mostly occupied by a single ethnic group. These communities form clusters with clear boundaries. This leads to clear spatial and social separation from other ethnic settlements.
This pattern is similar to “residential segregation” and “social exclusion” found in other countries. In such cases, limited access to public services, economic opportunities, and educational resources can be both a cause and result of spatial isolation. This often creates a cycle of marginalization [23].
(2) Boundary–Permeation: This type describes settlements where two or more ethnic groups live next to each other. In these areas, ethnic boundaries become less distinct. Spatial overlap begins, and regular interactions occur. This represents an early stage of integration and boundary negotiation.
The success of this Boundary–Permeation depends largely on shared mobility and overlapping activity spaces. For example, good transport links and shared public spaces are thought to encourage contact between groups. In contrast, poor accessibility may strengthen group separation [24].
(3) Cellular–Symbiosis: This type describes the cohabitation of multiple ethnic groups within a single traditional village. It creates a fine-grained, mixed spatial pattern where different ethnicities interact closely in daily life and achieve functional interdependence.
This form represents a micro-level realization of “socio-spatial integration”. It fosters a community marked by deep cultural accommodation and multi-dimensional embedding across residence, economy, and social life. As such, it represents the most advanced stage of ethnic inter-embeddedness.
We apply this model by mapping the distribution and interaction of ethnic groups onto the region’s vertically stratified spatial pattern [25]. This pattern, shaped by elevation and livelihood strategies, consists of three main zones:
(1) The Lowland Farming Belt (below 2500 m, slopes <10°);
(2) The Submontane Agro-Pastoral Ecotone (2500–3200 m, slopes 3–20°);
(3) The Subalpine Pastoral Zone (above 3200 m, slopes > 20°).
This overlay helps the model track the ongoing evolution of spatial structure, social relations, and cultural interactions in multi-ethnic settlements. It also shows that village spatial patterns result not only from natural conditions and cultural adaptation but also from historical events, policy intervention, and broader social transformations.
The main features and proposed driving mechanisms of each type are summarized in Table 1. This typology moves beyond the traditional segregation–integration divide. It does so by including a range of intermediate scenarios. As a result, it offers a clearer framework for identifying village types in practice and for conducting a detailed analysis of their spatial differentiation mechanisms.
The “Clustered–Boundary–Cellular” model and its theoretical framework (Table 1) form the basis for this empirical study. We propose the following research hypotheses to guide our analysis:
(1) The traditional villages in the Hehuang region can be systematically classified into three distinct types: Clustered–Isolation, Boundary–Permeation, and Cellular–Symbiosis. Each type shows statistically significant differences in spatial patterns.
(2) These spatial patterns result from the combined effect of multiple factors: natural environment (e.g., topography and hydrology), socio-cultural forces (especially religion), and infrastructural–economic conditions (e.g., transport and urbanization).
(3) The importance of these driving factors varies significantly across the three types.
We test these hypotheses using GIS-based and statistical methods, as described in the following section.

3. Materials and Methods

3.1. Study Area

The Hehuang region (35°–38° N, 100°–103° E) is located in the eastern Qinghai Province, China, forming a key transitional zone between the Tibetan Plateau and the Loess Plateau. It encompasses the vital valley corridors of the Yellow River and its major tributary, the Huangshui River. This area has served as one of the earliest cradles of human civilization in the Yellow River Basin and represents an important zone for hydropower resources in China [26].
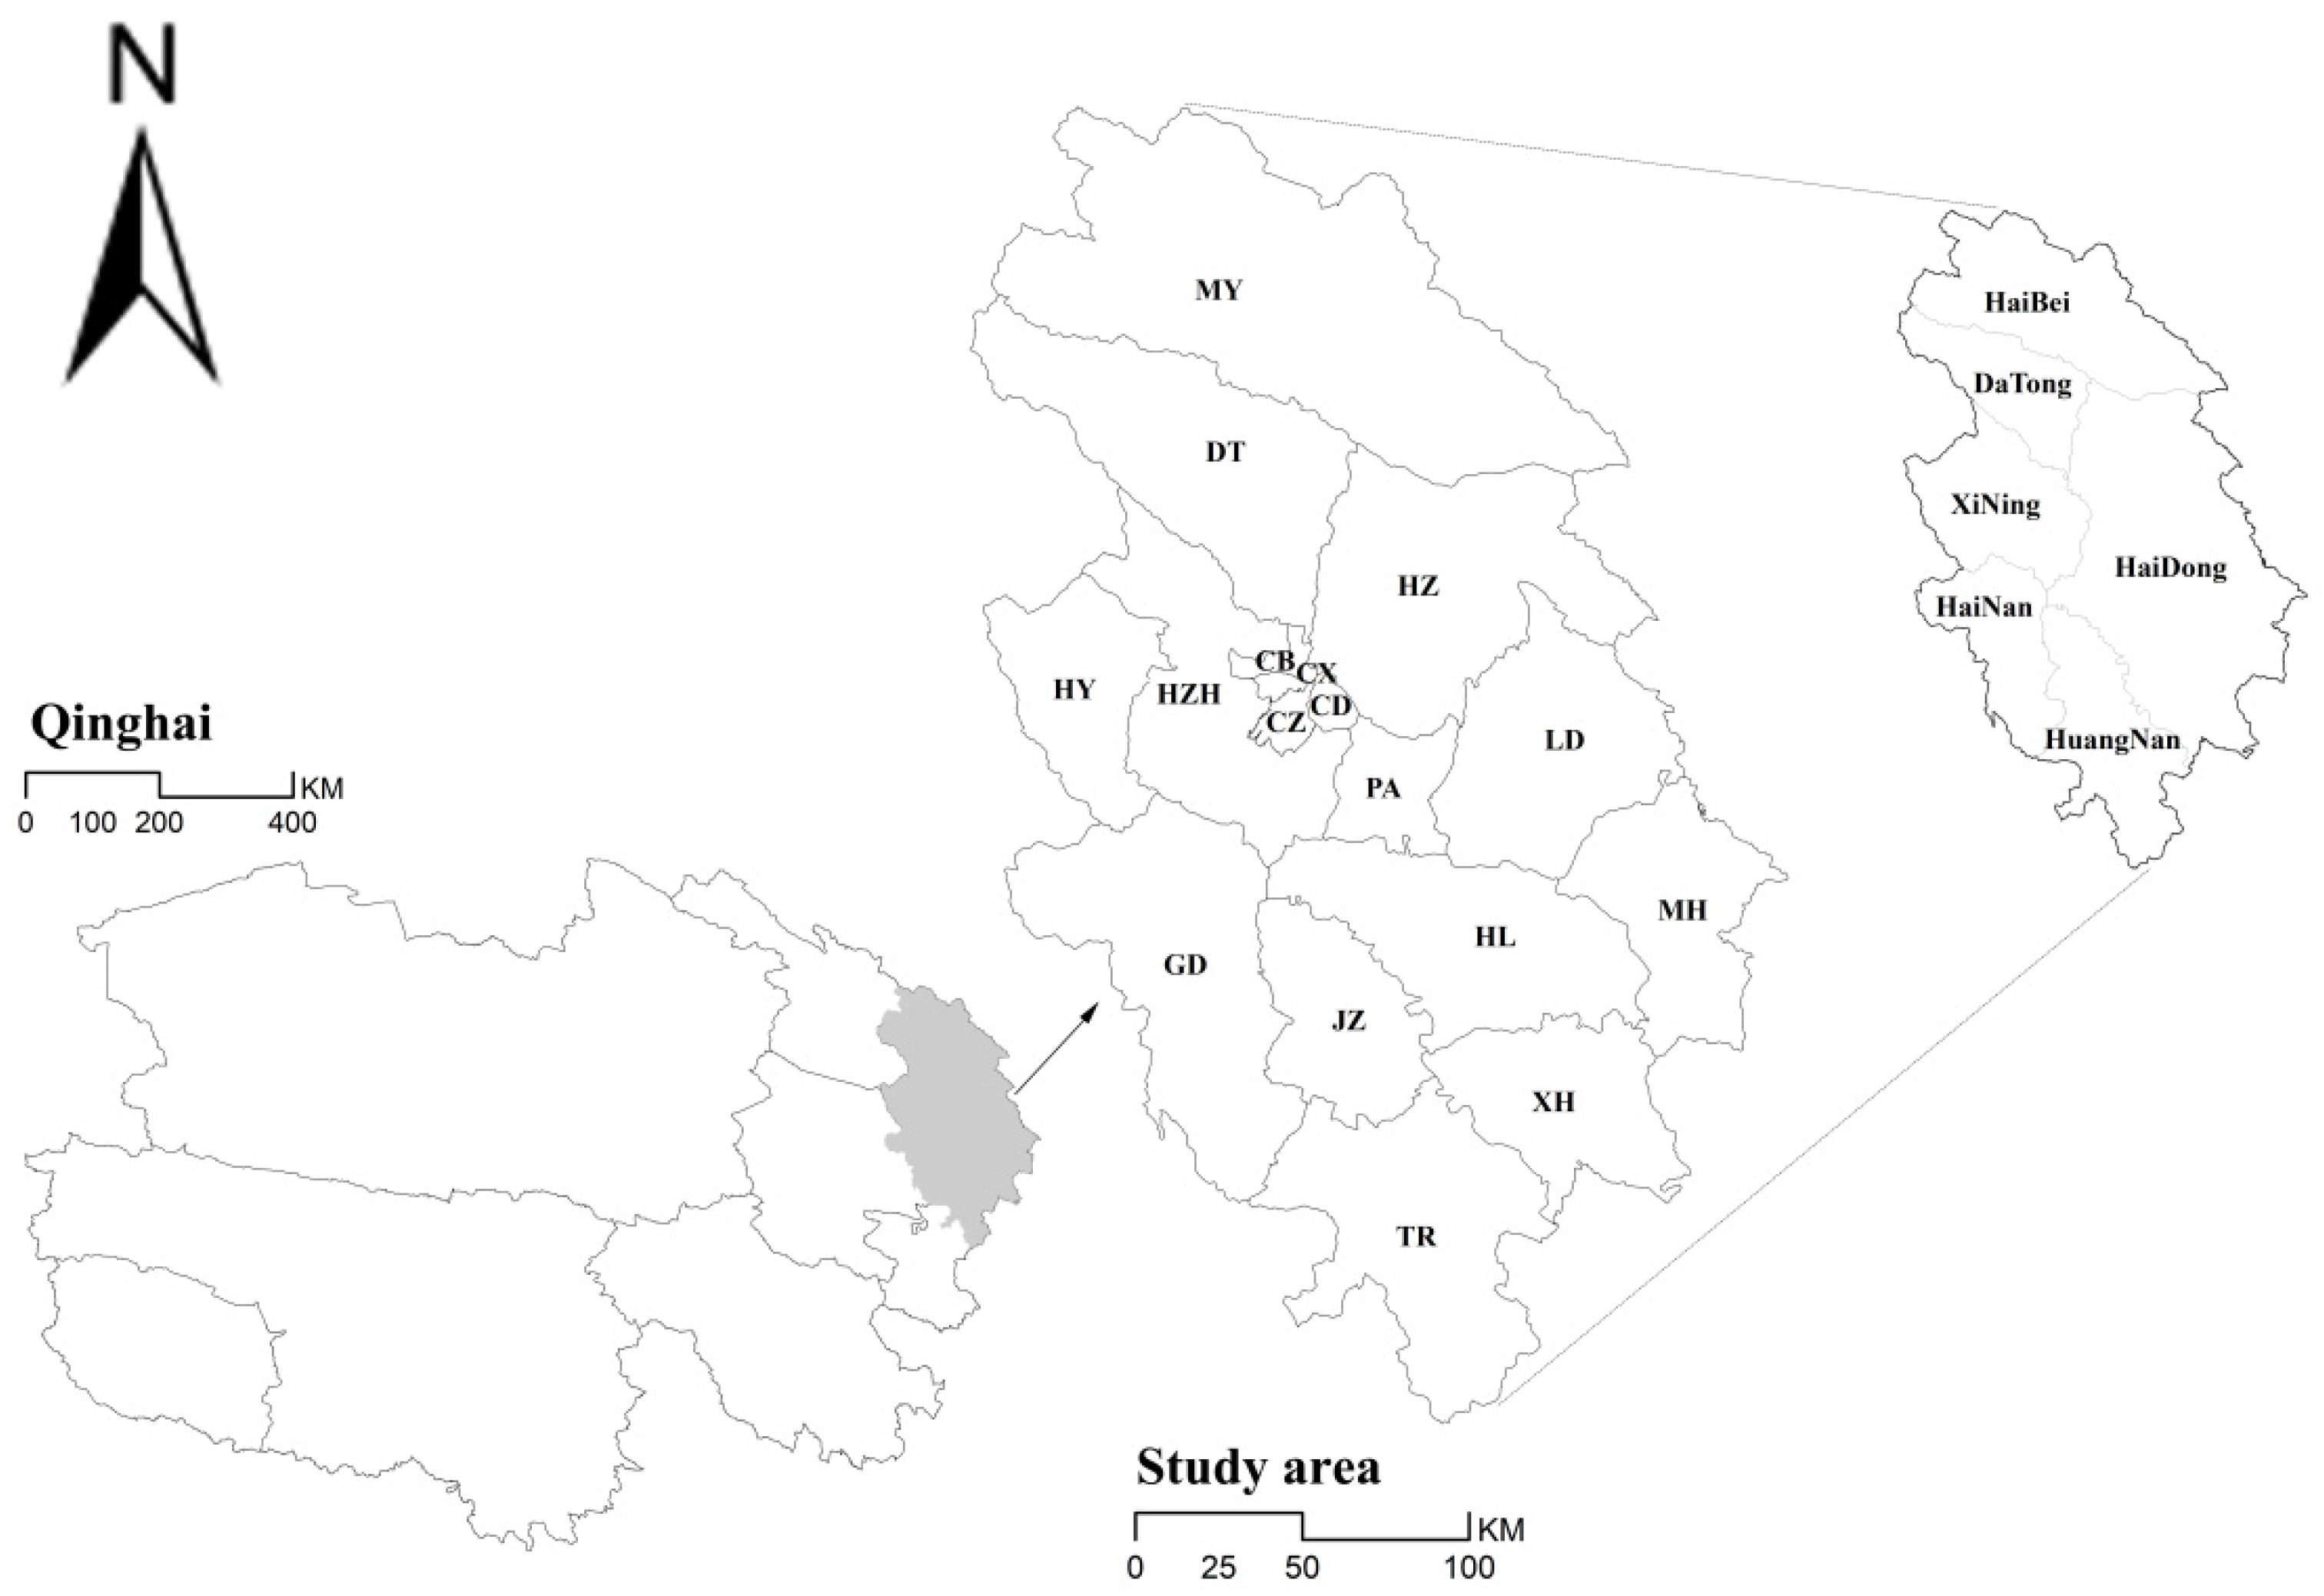
Administratively, the study area includes 14 counties and districts: Xining (XN), Datong (DT), Huangzhong (HZH), Huangyuan (HY), Ledu (LD), Ping’an (PA), Minhe (MH), Huzhu (HZ), Hualong (HL), Xunhua (XH), Tongren (TR), Jianzha (JZ), Guide (GD), and Menyuan (MY) (see Figure 2).
The Hehuang region is a convergence zone of nomadic and agrarian cultures. Over the centuries, this has led to the development of intricate cultural patterns through multi-ethnic integration. The area’s complex topography and rich ecological diversity create a vertically stratified spatial pattern [25]. This pattern consists of three primary zones:
(1) The Lowland Farming Belt (below 2500 m);
(2) The Submontane Agro-Pastoral Ecotone (2500–3200 m);
(3) The Subalpine Pastoral Zone (above 3200 m).
This environmental stratification has preconditioned the region for diverse livelihood strategies and settlement patterns.
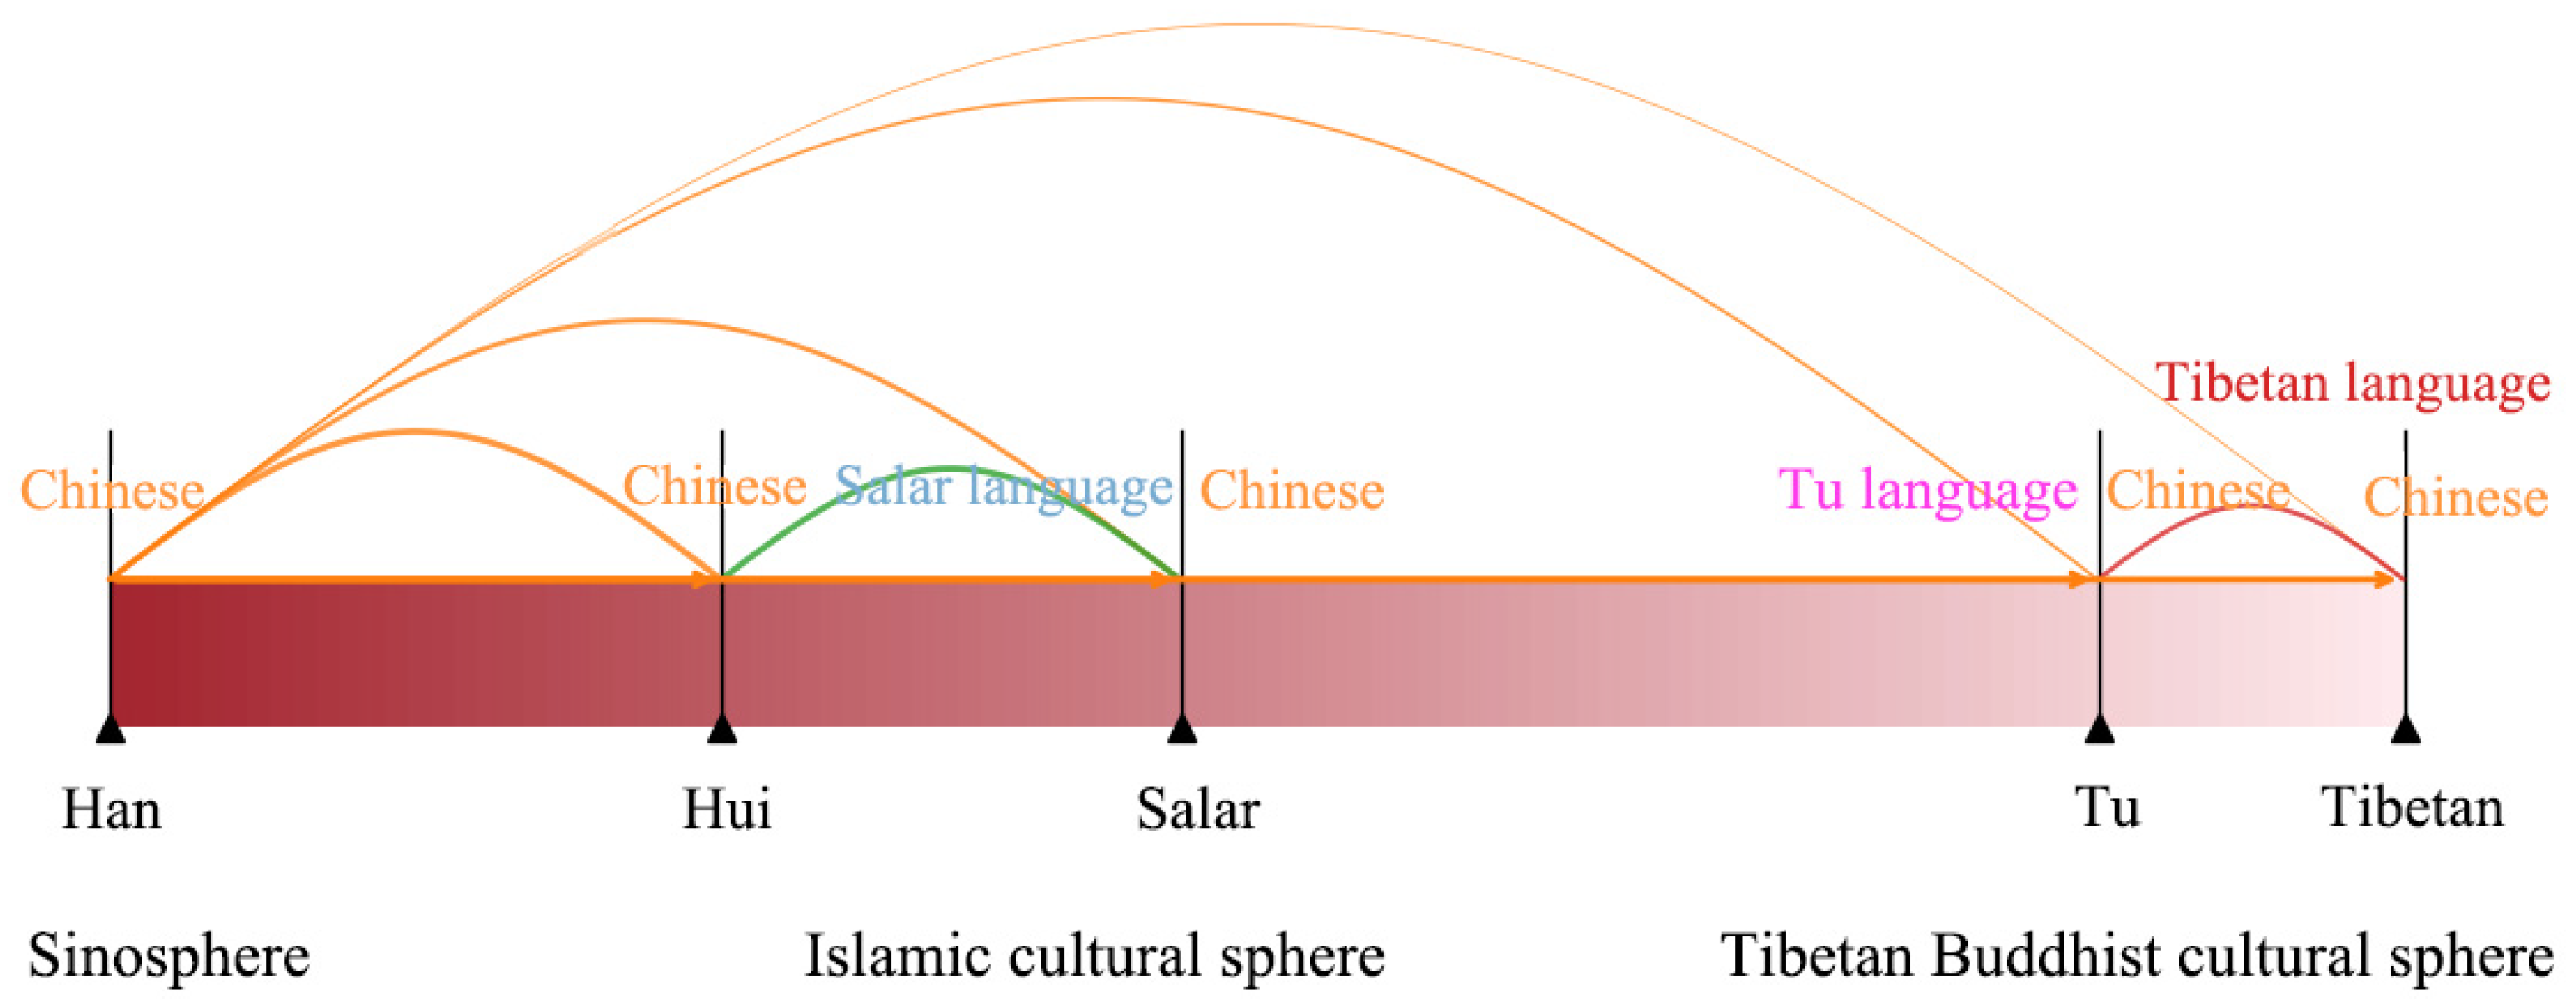
Linguistically, “language affinity” significantly influences geo-cultural identity formation in this region [27]. The Han and Hui populations both use the Chinese linguistic system, facilitating smooth communication. While the Salar employ their own language in daily life, they typically use Chinese as a lingua franca. Tibetan communities mainly rely on the Tibetan language, which creates some communication barriers. The Tu people, however, often act as a linguistic bridge by speaking both Chinese and Tibetan.
Religiously, the region features several distinct cultural spheres: (1) the Han’s Sino-cultural sphere, (2) the Tibetan Buddhist sphere, (3) the Tu’s dual-influence sphere, (4) and the Islamic sphere shared by the Salar and Hui [28].
Together, these form a unique ethno-cultural affinity schema in the Hehuang region (Figure 3). This pluralistic structure, deeply rooted in the region’s geographical patterns, has fostered landscapes of multi-ethnic co-settlement.
The Hehuang region contains 153 traditional villages protected at the national level. These villages collectively represent the diverse scenarios of ethnic integration found in the area. The co-existence of clear spatial differentiation with deep ethnic inter-embeddedness, set within a context of complex geography and culture, makes the Hehuang region an ideal living laboratory for studying multi-ethnic spatial configurations.

3.2. Data Sources and Preprocessing

This study relied exclusively on publicly available datasets to ensure transparency and reproducibility. All data were integrated into a unified geodatabase in ArcGIS 10.8, with a consistent spatial reference system (WGS 84/UTM Zone 48N, EPSG:32648).
(1) Settlement and Administrative Data: The vector data for 153 nationally protected traditional villages, including their names, locations, and administrative codes, were sourced from the National Traditional Villages Catalogue (Ministry of Housing and Urban-Rural Development, China). Geographic coordinates were initially obtained via the Amap API, then manually verified and corrected using high-resolution satellite imagery (±10 m accuracy). County-level administrative boundaries were obtained from the National Geomatics Center of China and reprojected to Zone 48N.
(2) Ethnic Composition Data: Primary ethnic composition data were obtained from the foundational database of the National Traditional Villages Catalogue. Missing details were supplemented from publicly available demographic records released by village committees. City- and county-level ethnic population data came from the Seventh National Population Census of China (2020), all reprojected to the unified CRS for analysis.
(3) Topographic and Environmental Data: A 30 m DEM (SRTM V4.1) was downloaded from the Geospatial Data Cloud (www.gscloud.cn, accessed on 30 August 2025), from which elevation, slope, and aspect were derived. River and road network data, including all road classes, were from the National Geomatics Center of China. Road density was calculated as the total length of non-highway roads within a 3 km buffer around each village centroid, divided by the buffer area:
Road Density = (Total Road Length in Buffer)/(Area of Buffer)
For overlapping buffers in dense areas, union polygons were applied to avoid double-counting.
(4) Socioeconomic Data: GDP and urbanization rates were sourced from the 2023 Qinghai Statistical Yearbook and county statistical bulletins. These values were assigned to each village based on its host county.

3.3. Research Methodology

This study followed a sequential, hierarchical workflow consisting of three main stages: (1) village typology classification, (2) spatial pattern analysis, and (3) examination of environmental, infrastructural, and socio-cultural drivers.

3.3.1. Linking Methods to Hypotheses

To ensure a clear alignment between analytical techniques and research objectives, each method was assigned to address a specific hypothesis, as outlined in Table 2.

3.3.2. Village Typology Classification: Operationalizing the Theoretical Framework

We classified villages into the three inter-embedded types using a two-step procedure:
(1) Identify Cellular–Symbiosis Villages: Villages where two or more ethnic groups live together, based on ethnic composition data, were directly classified as Cellular–Symbiosis.
(2) Distinguish Clustered–Isolation and Boundary–Permeation Villages: For the remaining mostly single-ethnicity villages, we calculated Euclidean distances between all village centers. We used a 3 km threshold to define potential interaction, based on typical daily travel in rural areas and supported by our field experience. To check the robustness of this threshold, we tested other distances (1, 2, 4, and 5 km).
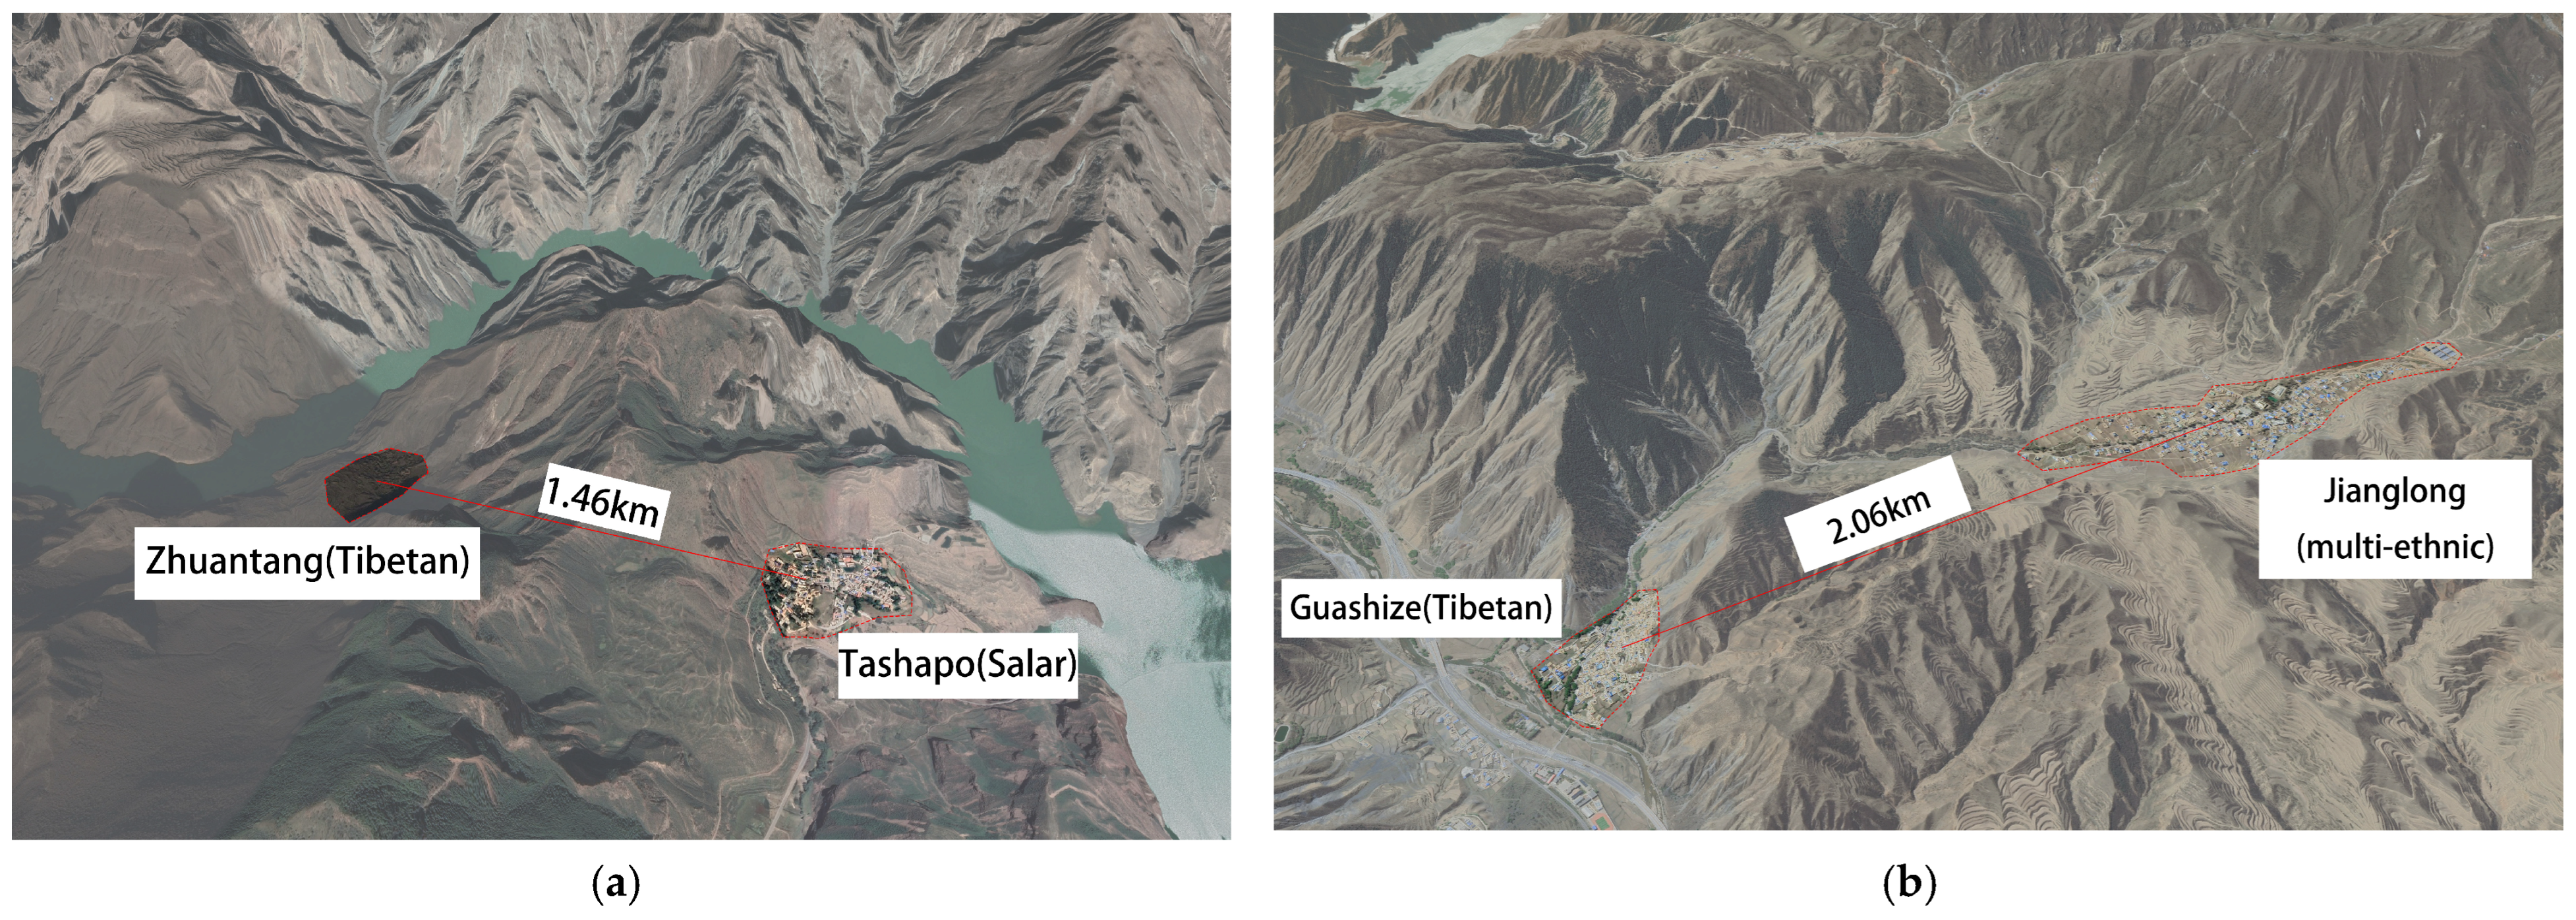
We then verified village pairs within 3 km using satellite images and topographic maps. If villages were close in straight-line distance but separated by major barriers like unbridged rivers or steep ridges, they were not considered Boundary–Permeation. These pairs remained in the Clustered–Isolation category, as the straight-line distance did not reflect real access (Figure 4).

3.3.3. Spatial Pattern Analysis of Village Types

We used spatial statistics to analyze the distribution patterns of each village type:
(1) Kernel Density Estimation (KDE) was applied to visualize and compare the spatial intensity and concentration of each village type [29]. The KDE method estimates the probability density of point features by applying a kernel function that assigns weights to all villages within a specified bandwidth ( h ) of each reference location, thereby smoothing the discrete point data into a continuous density surface. The quartic (biweight) kernel function was employed in this analysis, as defined by the following equation:
f x = 1 n i = 1 n k h x x i = 1 n h i = 1 n k x x i h
where
f ( x ) is the estimated density at location x ,
n is the total number of villages,
h is the search bandwidth ( h > 0 ),
k ( ) is the kernel function, and
d i is the Euclidean distance from village i to location x .
The search bandwidth ( h ) was determined using Silverman’s rule of thumb, resulting in an optimal bandwidth of 10 km for our dataset. To evaluate the sensitivity of our results to this parameter, we conducted supplementary analyses using alternative bandwidths of 5 km and 15 km, representing local and broad neighborhood scales, respectively. The core spatial patterns of village types were found to be robust across these different bandwidths.
(2) Ripley’s K-function was employed to assess the degree of spatial clustering or dispersion of village points across multiple spatial scales, testing the null hypothesis of Complete Spatial Randomness (CSR) for each village type. The K-function is defined as
K ( d ) = A n 2 i = 1 n j = 1 ,   j i n w ij 1 I ( d ij d )
where
A is the total area of the study region,
n is the total number of villages,
d is the distance threshold,
d i j is the Euclidean distance between villages i and j ,
I is the indicator function, which equals 1 if d i j d and 0 otherwise, and
w i j is an edge correction weight to account for boundary effects.
For easier interpretation and to stabilize variance, the K-function was transformed to the L-function:
L ( d ) = K ( d ) π d
Under the assumption of CSR, the expected value of L ( d ) is 0. Observed values L(d) > 0 indicate significant spatial clustering at distance d, whereas L ( d ) < 0 indicates significant spatial dispersion. Statistical significance was assessed by constructing 99% confidence envelopes ( α = 0.01 ) based on 999 Monte Carlo simulations of a CSR process. The analysis was performed at 100 m distance intervals up to a maximum of 50 km, which is approximately half the length of the study area’s shortest axis, ensuring a robust assessment of spatial patterns.
(3) Standard Deviational Ellipse (SDE) analysis was utilized to capture the directional trends, dispersion, and orientation of each village type’s distribution. The SDE method calculates the standard deviation of the x-coordinates and y-coordinates from the mean center to define the axes of the ellipse. We generated both unweighted ellipses, which represent the pure spatial distribution of villages, and weighted ellipses, where the weighting field was the road network density within the 3 km buffer of each village, to analyze the influence of transportation infrastructure.
The weighted mean center, which forms the centroid of the weighted ellipse, was calculated as
X w = i = 1 n       w i x i i = 1 n       w i , Y w = i = 1 n       w i y i i = 1 n       w i
where
X w , Y w are the coordinates of the weighted mean center,
w i is the weight (road density) of village i ,
x i , y i are the coordinates of village i , and
n is the total number of villages.
The direction of the ellipse is determined by aligning the major axis along the axis of maximum dispersion. The standard distances along the major and minor axes ( σ x and σ y ) are then computed based on the rotated coordinates.
All ellipses were calculated at one standard deviation to encompass approximately 68% of the input features. Differences in ellipse area, orientation (the rotation angle of the major axis from north), and eccentricity e = 1 σ y 2 σ x 2 between the weighted and unweighted versions were quantitatively compared to infer the influence of transportation infrastructure on the spatial structure of village distributions.

3.3.4. Statistical Testing of Driving Factors

To quantitatively assess the effects of potential drivers and test for significant differences across village types, we employed the Kruskal–Wallis H test, a non-parametric method suitable for comparing more than two groups with non-normally distributed data. This test was used to determine if the median values of key continuous variables differed significantly among the three village types. The variables tested included the following:
(1) Elevation (m) and slope (°) derived from the DEM.
(2) Distance to nearest river (m).
(3) Road network density (km/km2) within the 3 km village buffer.
(4) GDP per capita (CNY) and county-level urbanization rate (%).
For any variable where the Kruskal–Wallis test indicated a significant difference (p < 0.05), post hoc Dunn’s test with Bonferroni correction was applied to identify which specific pairs of village types differed.

3.3.5. Analysis of Driving Factors

(1) Global Spatial Autocorrelation Analysis
To assess the spatial clustering or dispersion characteristics of key driving factors, we applied the Global Moran’s I statistic. This measure evaluates whether the spatial pattern of a variable exhibits significant clustering (positive autocorrelation), dispersion (negative autocorrelation), or randomness. The Global Moran’s I was calculated as follows:
I = n S 0 i = 1 n j = 1 n w i j x i x ¯ x j x ¯ i = 1 n x i x ¯ 2
where
n is the total number of spatial units (villages),
x i and x j are the values of the variable at locations i and j ,
x ¯ is the mean value of the variable across all locations,
w i j is the spatial weight between locations i and j , and
S 0 = i = 1 n j = 1 n w i j is the aggregation of all spatial weights.
The spatial weight matrix was defined using queen contiguity, assigning a weight of 1 to neighboring villages and 0 otherwise. The statistical significance of Moran’s I index was tested using a z-score based on 999 permutations, with results indicating the strength and direction (positive or negative) of spatial autocorrelation.
(2) Multinomial Logistic Regression Analysis
To quantitatively identify the key factors differentiating the village types, we employed a multinomial logistic regression model. This model estimates the probability of a village belonging to a specific typology relative to a reference category. The model is formulated as
l n P Y = k P Y = 1 = β 0 k + β 1 k X 1 + β 2 k X 2 + + β m k X m
where
P Y = k is the probability of a village belonging to the non-reference type k (e.g., Boundary–Permeation or Cellular–Symbiosis),
P Y = 1 is the probability of a village belonging to the reference type (Clustered–Isolation),
β 0 k is the intercept for the k -th category,
X m are the predictor variables (e.g., elevation, road density, GDP per capita), and
β m k are the logistic regression coefficients for the m -th predictor in the k -th category.
The Odds Ratio for each predictor, which quantifies the change in the relative probability for a one-unit increase in the predictor, is calculated as exp( β m k ). Coefficients were estimated via Maximum Likelihood Estimation (MLE) and tested for significance using the Wald z-test. Model fit was assessed using McFadden’s R2 and the Likelihood Ratio Test, with only predictors achieving p < 0.05 retained in the final model.

4. Analysis and Results

4.1. Typology and Spatial Distribution

We classified the 153 traditional villages into the three inter-embeddedness types using the two-step procedure described in Section 3.3.2.
A sensitivity analysis tested the robustness of this classification, particularly for the Clustered–Isolation and Boundary–Permeation types that depend on a spatial proximity threshold (Table 3). We examined thresholds of 1 km, 2 km, 4 km, and 5 km. The results show the following:
(1) The Cellular–Symbiosis type is conceptually consistent, as its classification—based on internal multi-ethnic composition—remained unchanged across all thresholds.
(2) The overall model is structurally stable, with Clustered–Isolation consistently appearing as the dominant pattern despite variations in absolute counts.
We selected the 3 km threshold because it best balances the identification of meaningful interaction potential between villages against excessive spatial aggregation.
Table 4 presents descriptive statistics of key environmental and infrastructural attributes for each village type, revealing clear spatial differentiators:
(1) Boundary–Permeation villages are located closest to rivers (mean distance: 1.44 km) and show the highest post-merging road network density, indicating strong functional connectivity.
(2) Cellular–Symbiosis villages are the most hydrologically isolated (mean river distance: 18.14 km).
(3) Clustered–Isolation villages maintain an intermediate position regarding river proximity but are marked by moderate road density.

4.2. Spatial Pattern Tests

4.2.1. Kernel Density Distribution Patterns

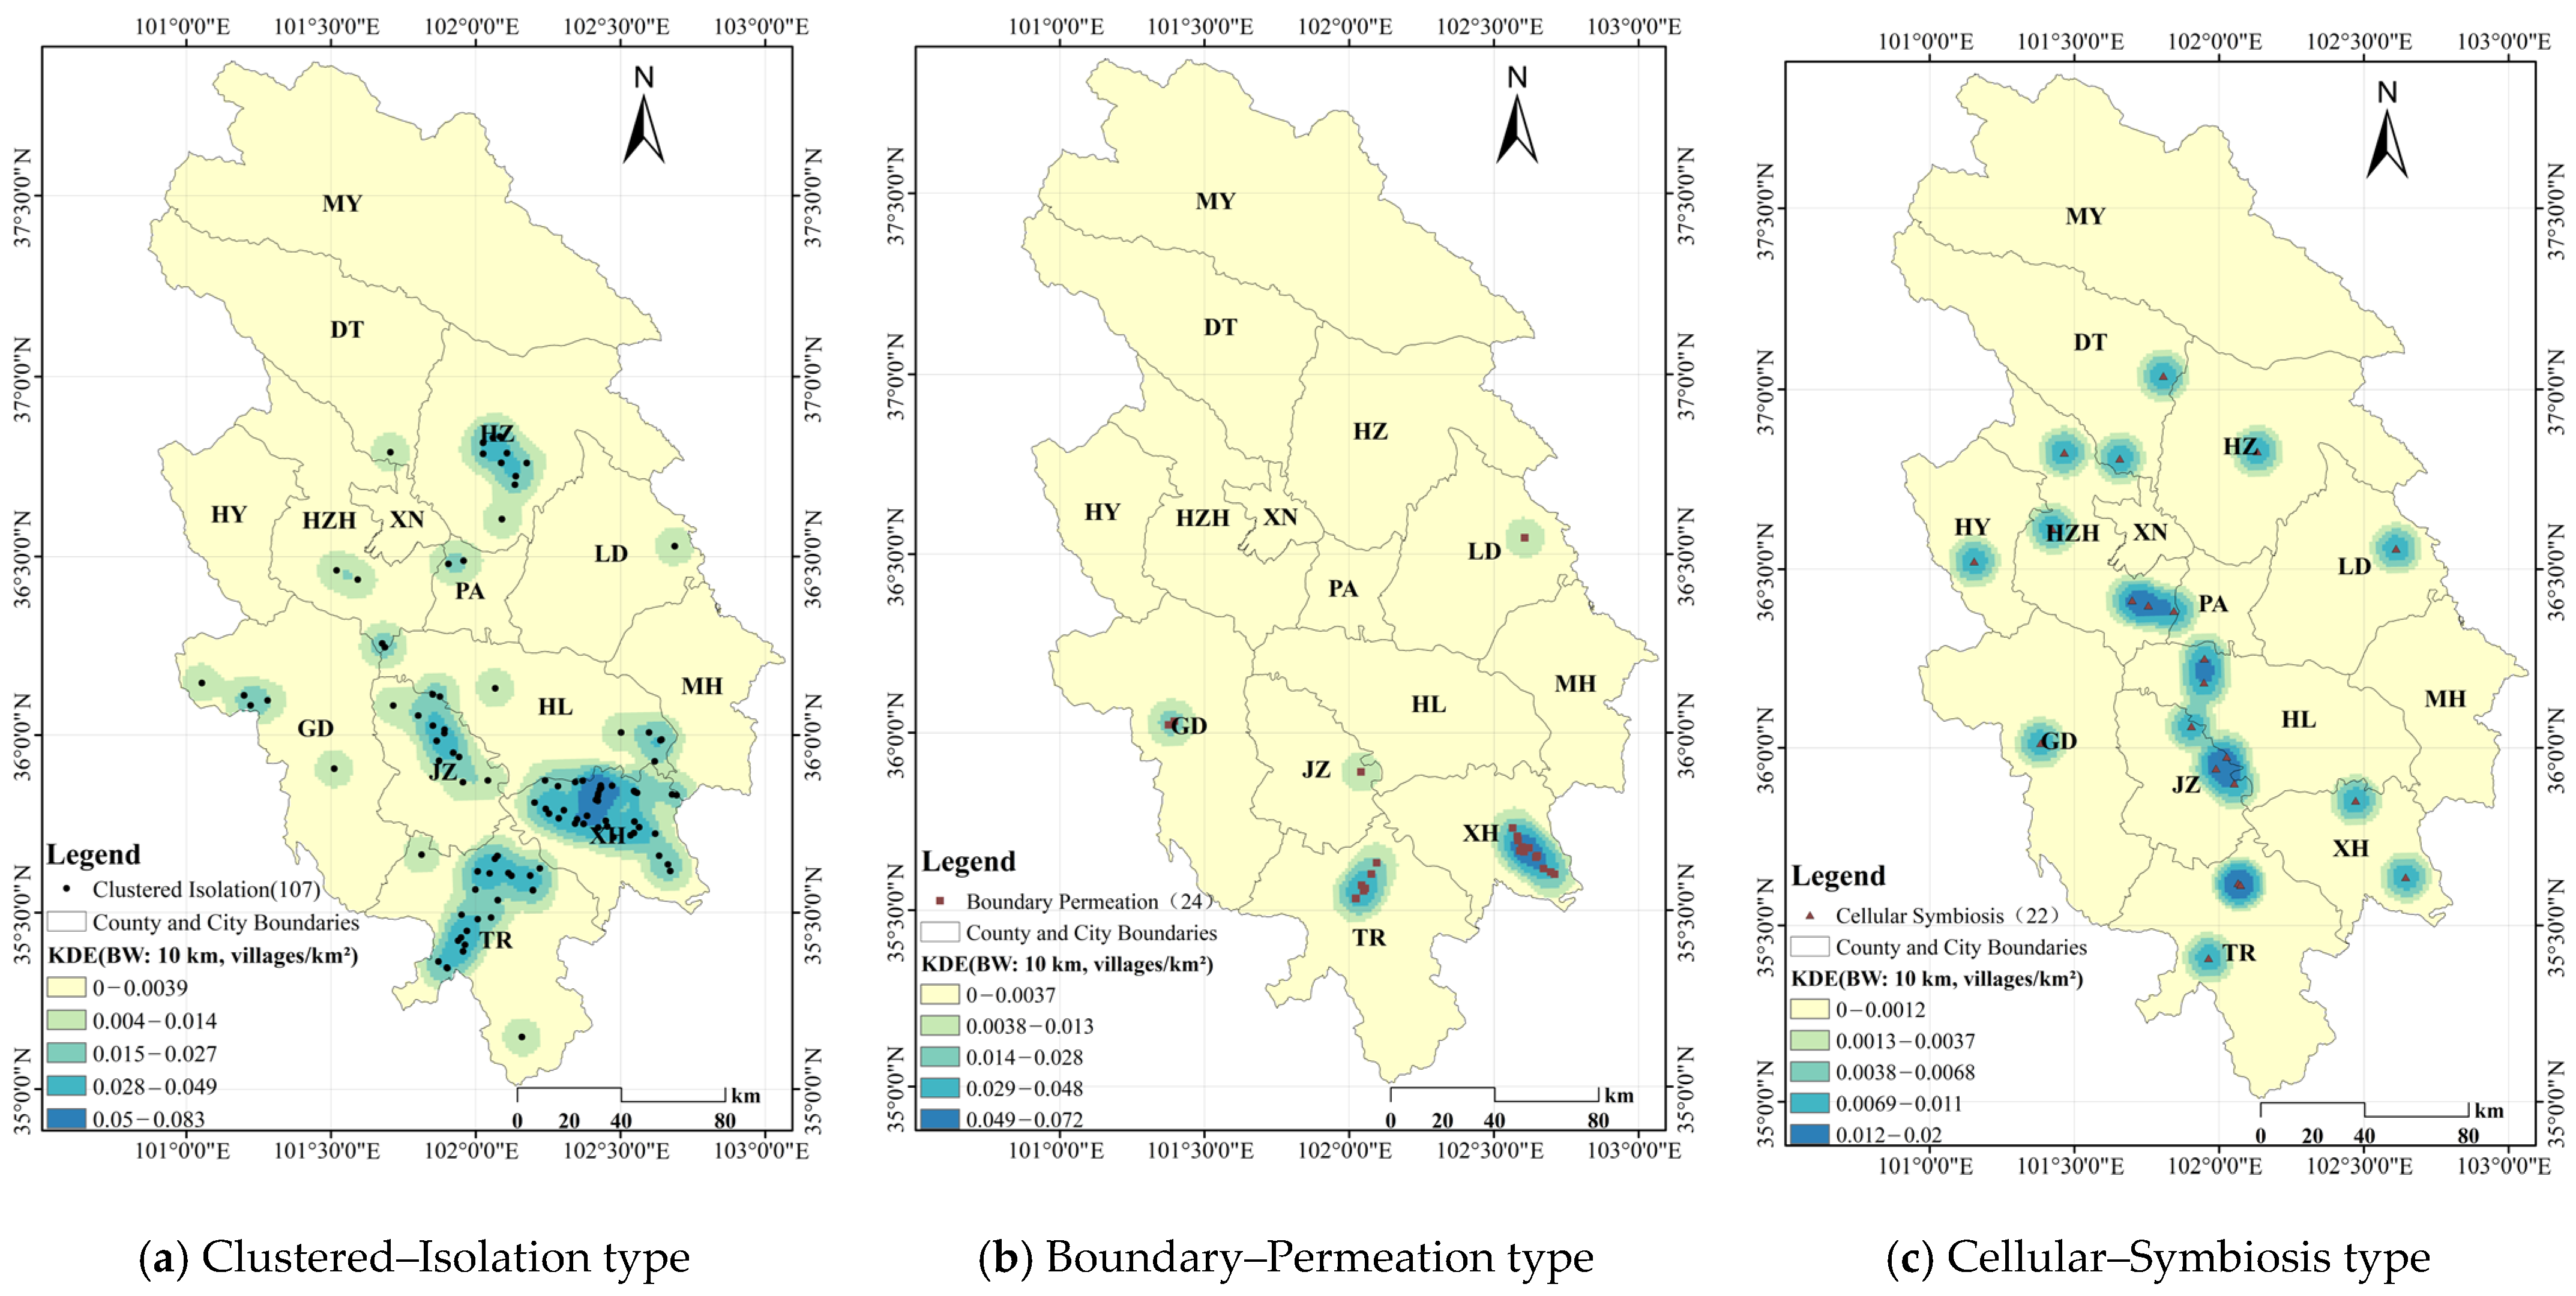
The Kernel Density Estimation (KDE) results (Figure 5) show distinct spatial clustering patterns for each village type.
(1) Clustered–Isolation villages (n = 107): These form the most extensive and dense clusters. A primary hotspot appears in southern Xunhua (XH) county (density of up to 0.083 villages/km2), with secondary clusters in the central and northern parts of the region, creating a multi-core spatial structure.
(2) Boundary–Permeation villages (n = 24): These are mainly concentrated in Xunhua (XH) county, forming a high-density core-oriented northeast–southwest pattern (density: 0.049–0.072 villages/km2). This core extends southwestward, with some villages near the Tongren (TR) county boundary, though not strictly following administrative borders. Small, high-density clusters also appear sparsely in Guide (GD) county.
(3) Cellular–Symbiosis villages (n = 22): These show a dispersed, multi-center pattern with several small, low-density clusters across the region. The highest density is only 0.012–0.02 villages/km2 near Jianzha (JZ) county.

4.2.2. Ripley’s K/L Spatial Significance Test

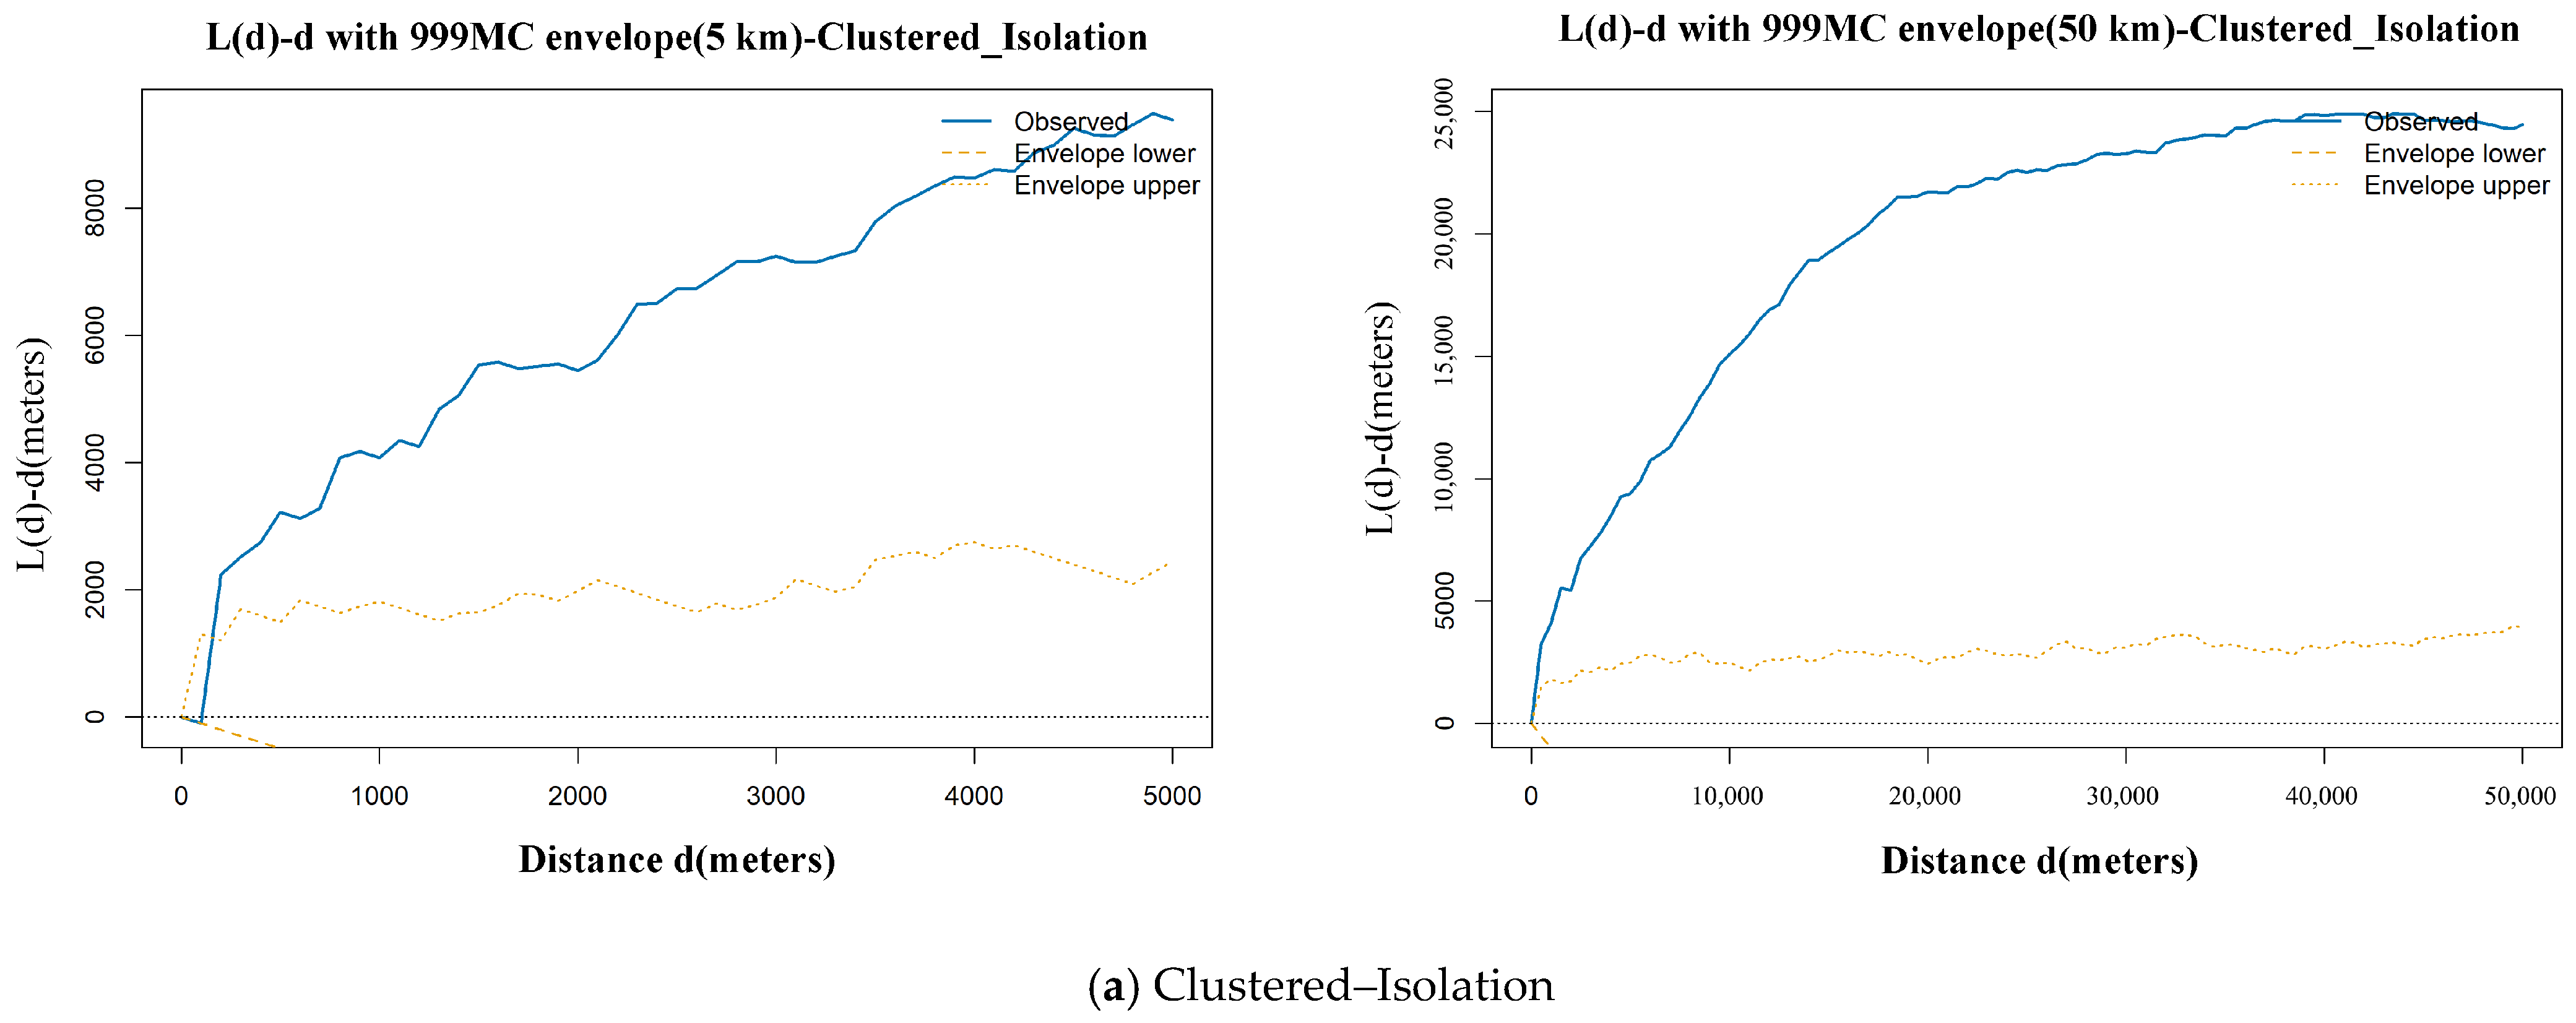
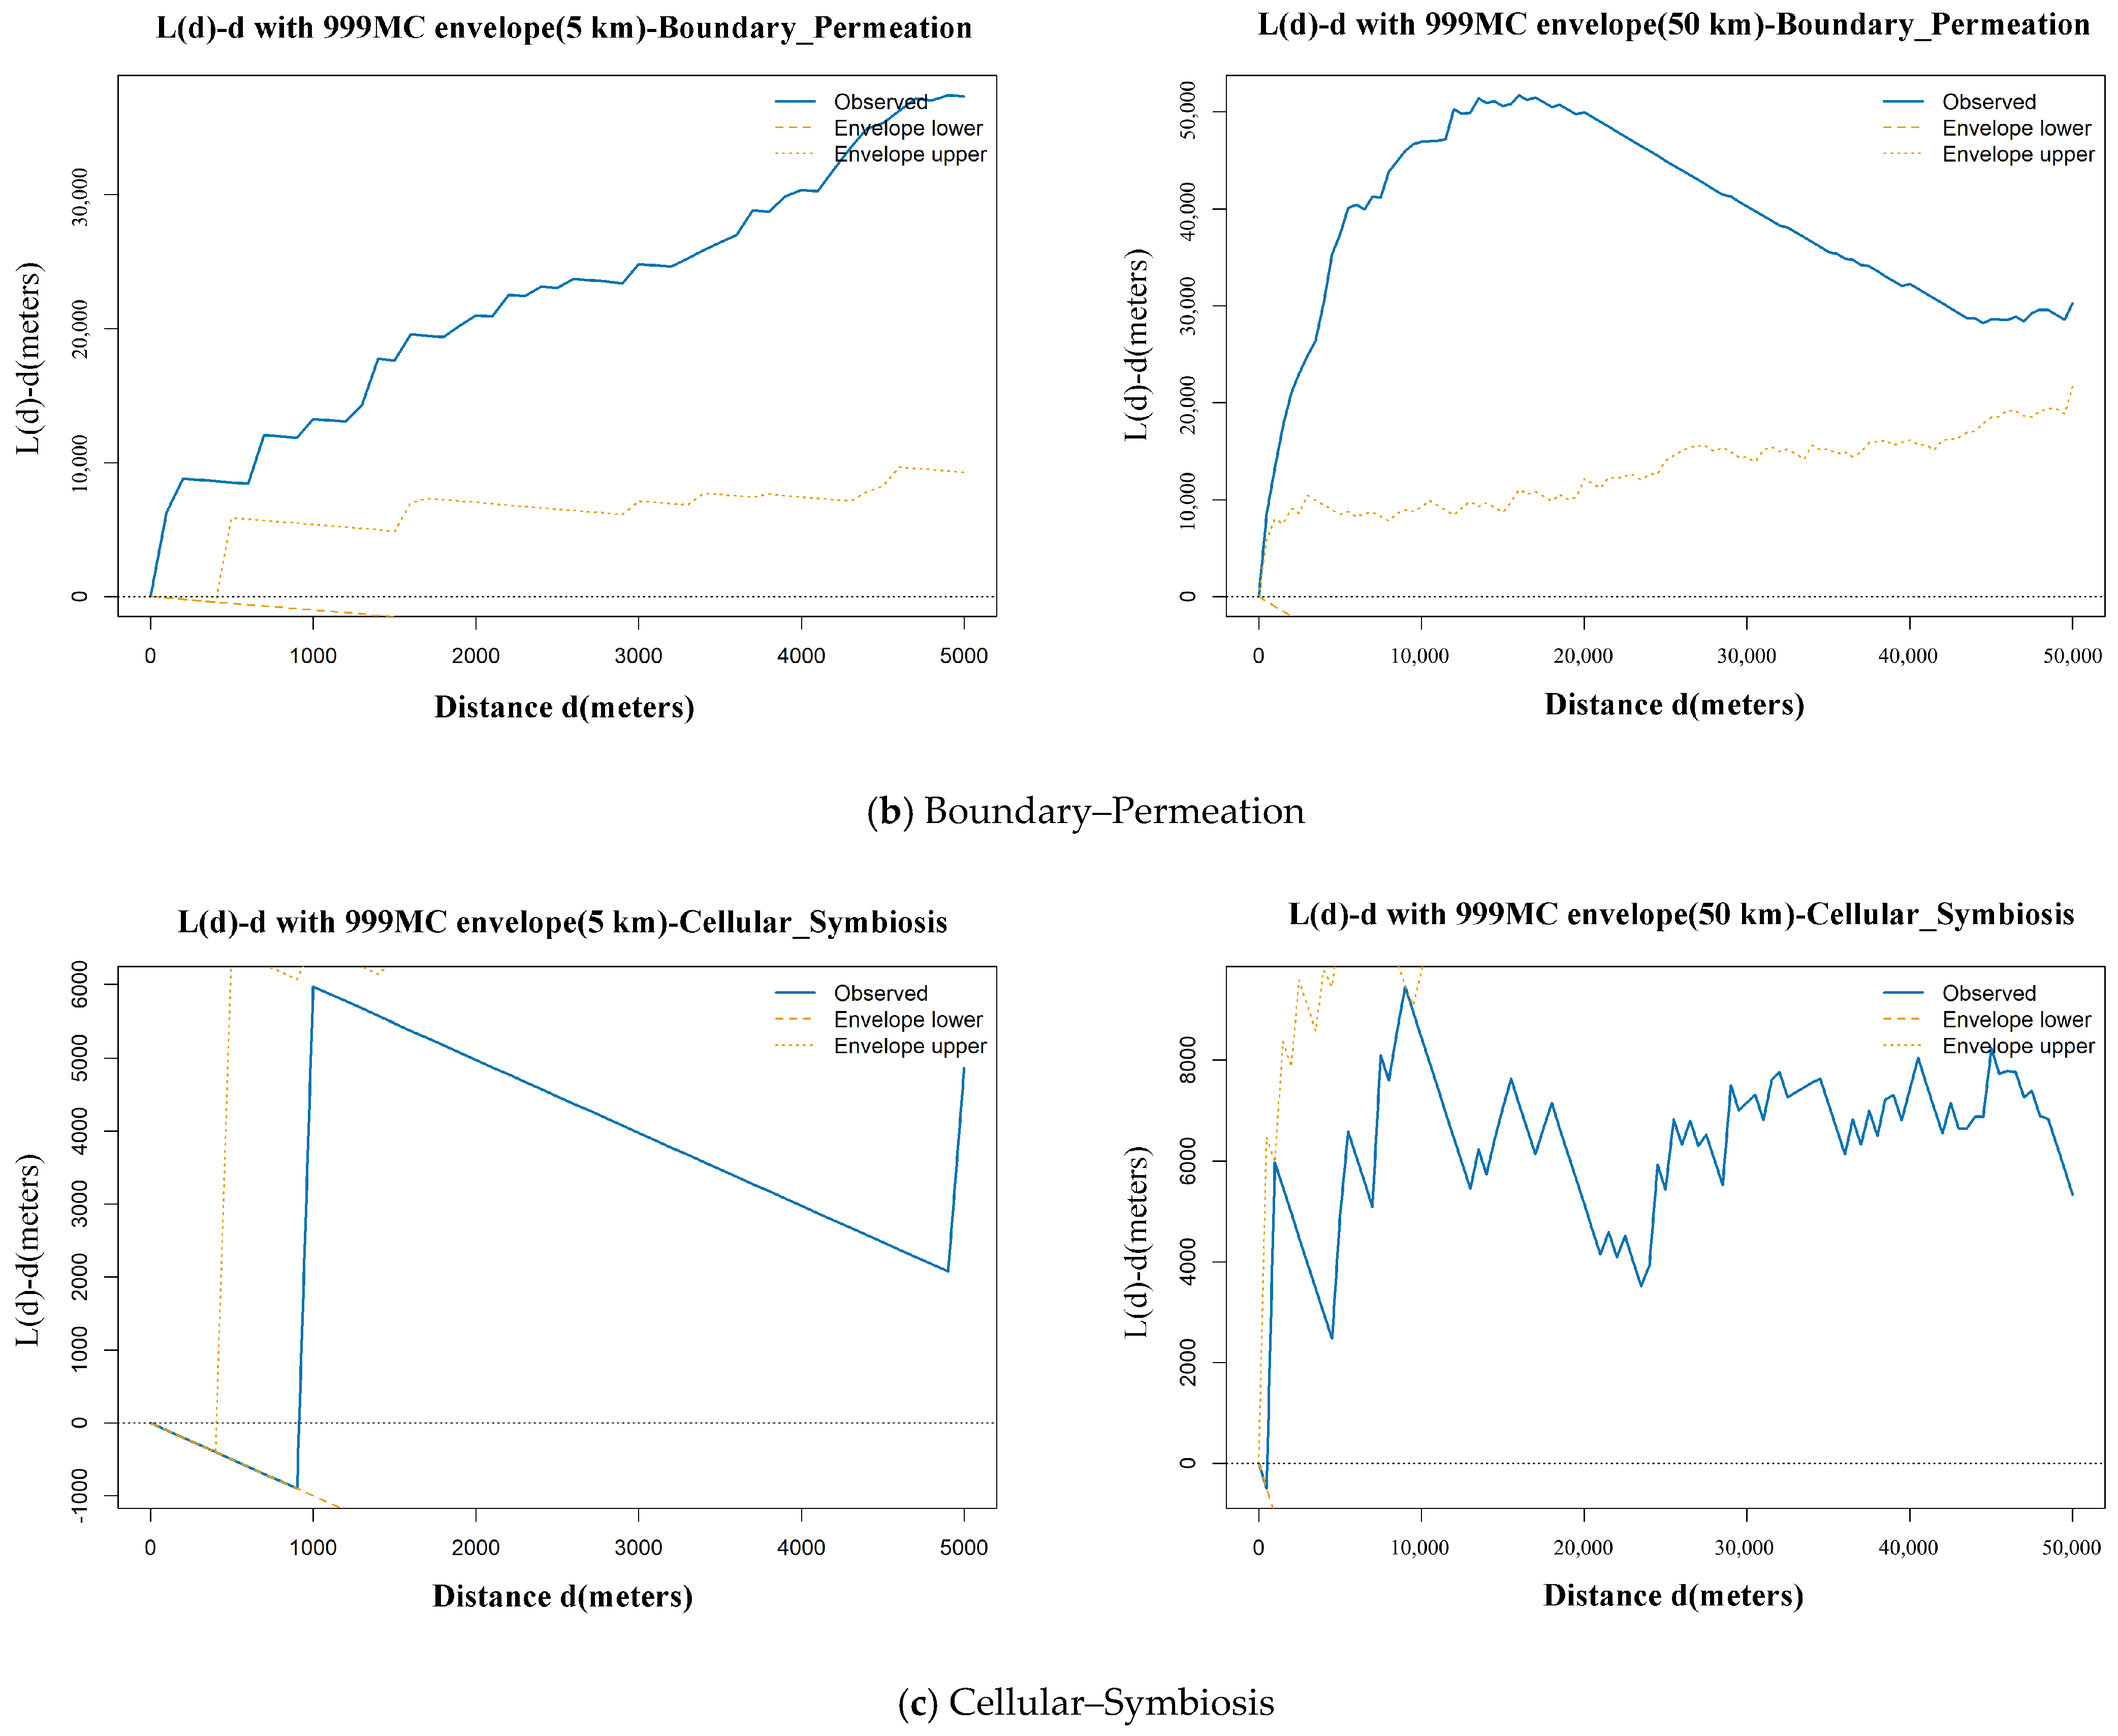
Ripley’s K-function analysis, transformed to L(d), provided scale-dependent evidence of spatial clustering (Figure 6, Table 5). The results show clear differences among village types:
(1) Both Clustered–Isolation and Boundary–Permeation villages showed significant clustering (p < 0.01) at local distances (0.5 km, 1 km, 2 km). This confirms their aggregated, non-random distribution at fine scales.
(2) In contrast, Cellular–Symbiosis villages displayed no significant deviation from spatial randomness at any tested distance. This indicates that their distribution is not simply based on proximity.

4.3. Directional and Anisotropy Analysis

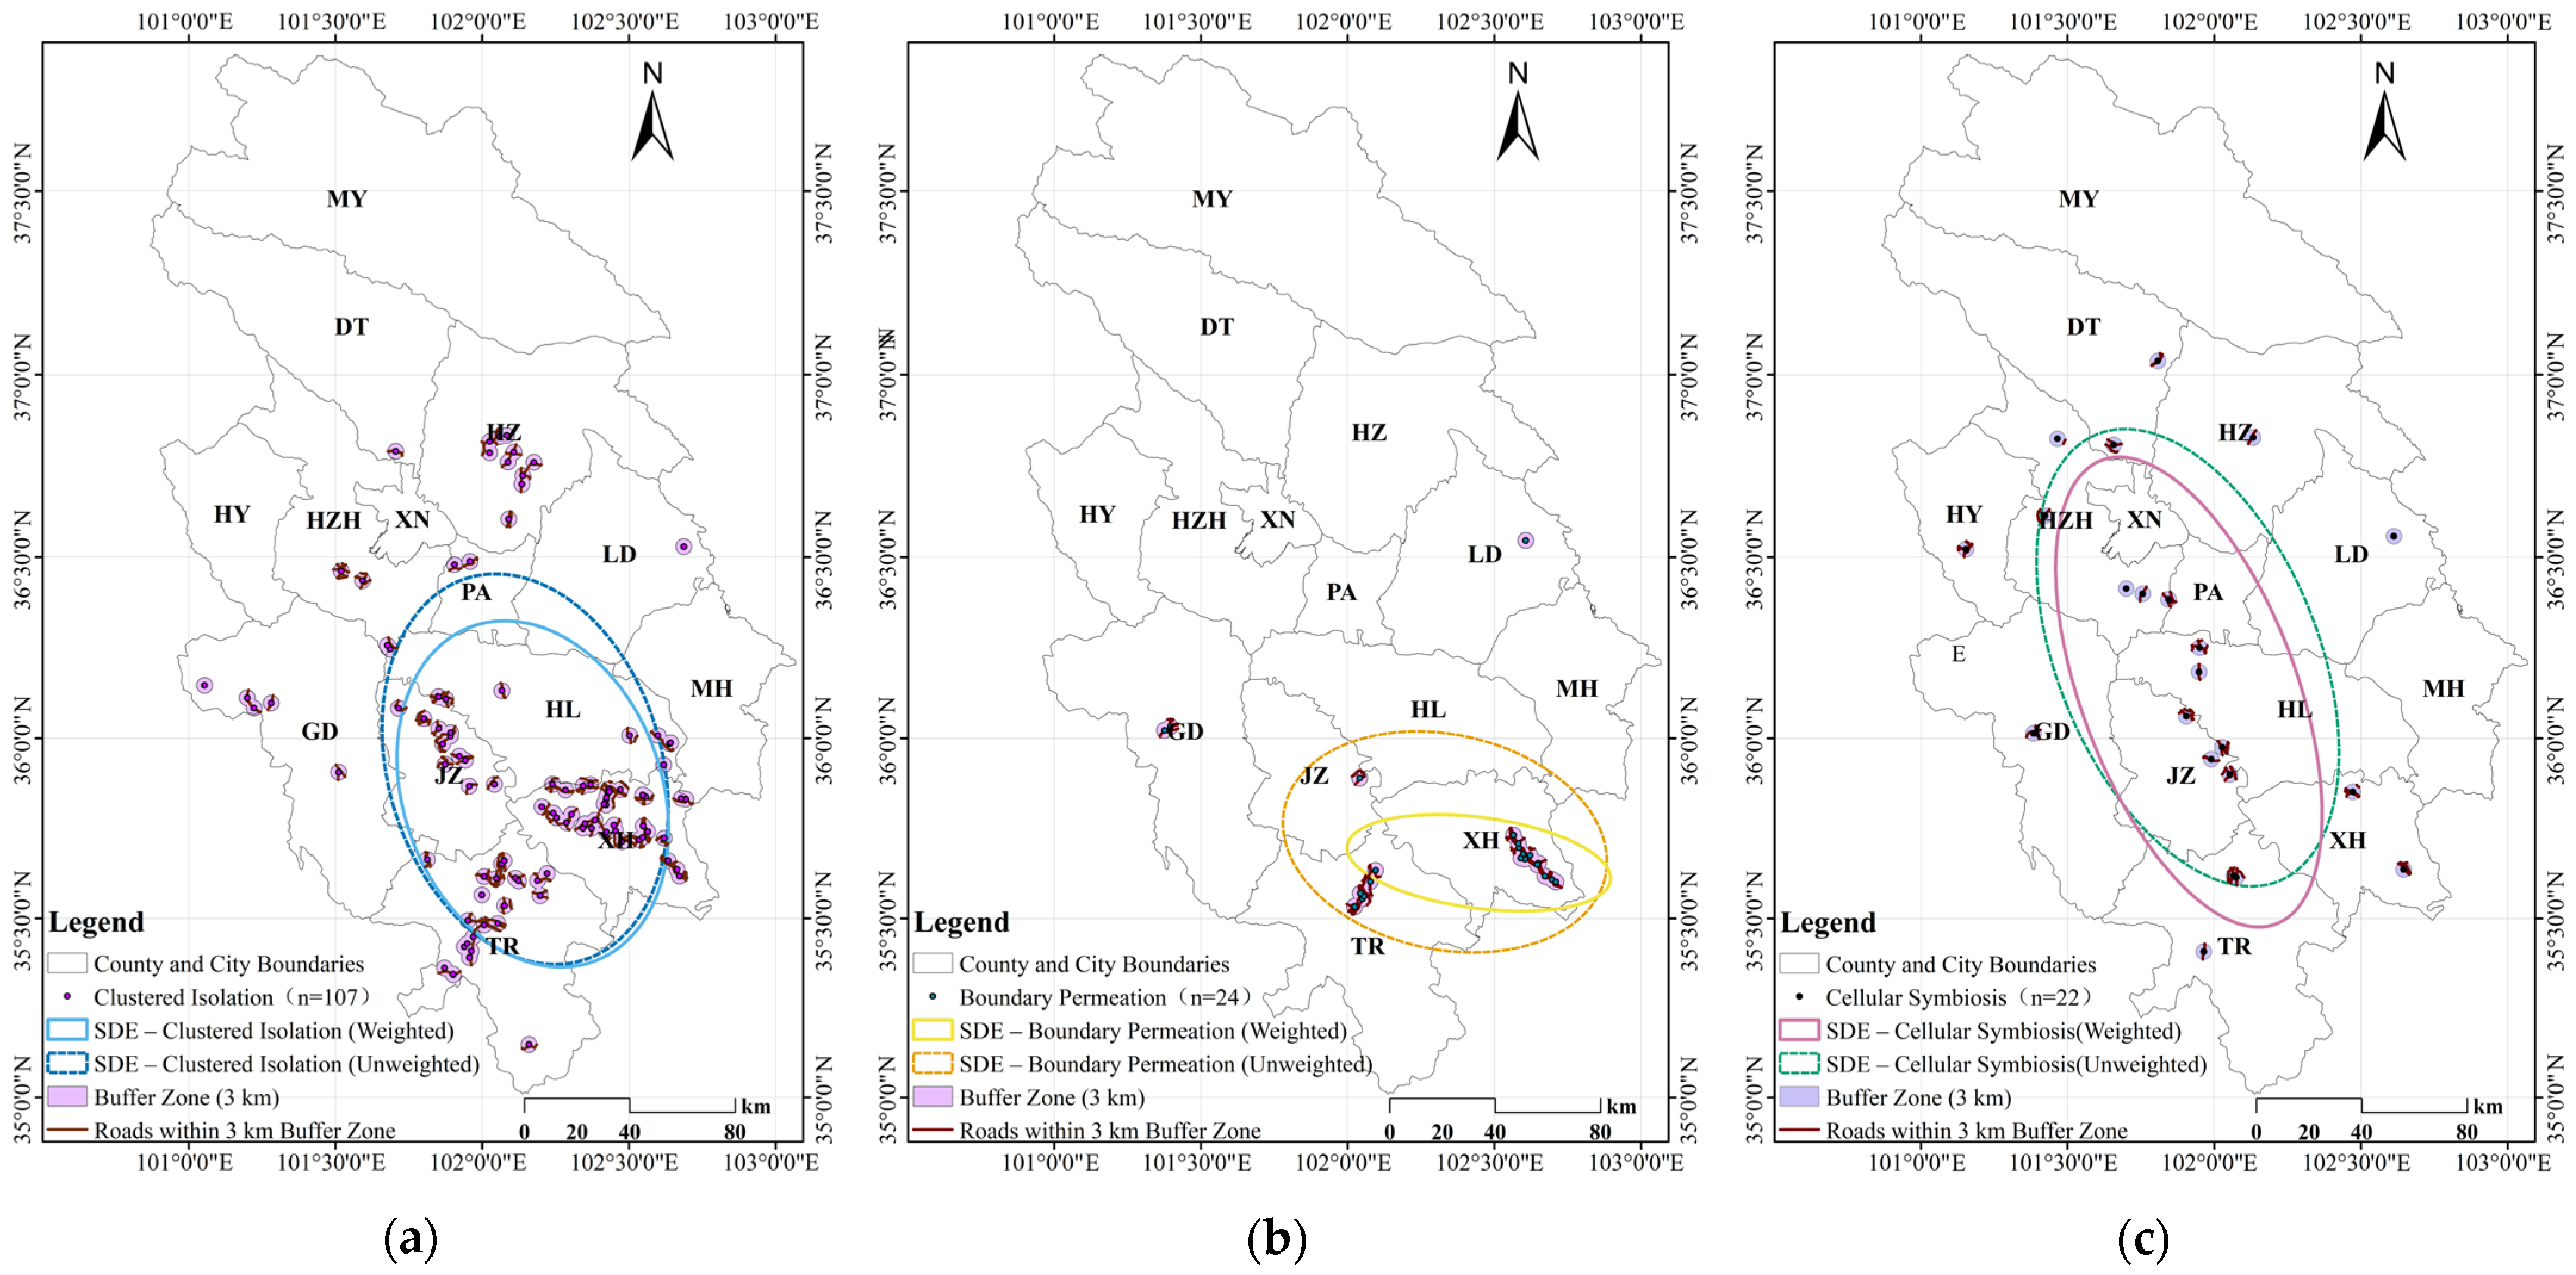
Standard Deviational Ellipse (SDE) analysis, conducted both with and without road density weighting, shows how transportation infrastructure shapes the spatial structure of each village type (Table 6, Figure 7).
(1) For Clustered–Isolation villages, both unweighted and weighted ellipses maintain an NNW-SSE orientation. The weighted ellipse exhibits a reduction in major axis length (from 122.81 km to 109.73 km) and a more compact form (axis ratio from 1.46 to 1.38), with the area decreasing from 8120.55 km2 to 6845.96 km2. This indicates that while their overall distribution is widespread, areas of higher road density define a more concentrated and slightly less elongated core within the broader cluster, consistent with their relative spatial insularity.
(2) For Boundary–Permeation villages, the ellipses are oriented ESE-WNW. The introduction of road density weighting causes the most dramatic transformation: the ellipse contracts sharply (major axis from 101.17 km to 81.92 km) and becomes markedly more elongated (axis ratio from 1.53 to 2.92), resulting in an area decrease from 5263.03 km2 to 1802.95 km2. This indicates that their spatial distribution is not merely adjacent to boundaries but is strongly channeled and confined along specific transportation corridors.
(3) For Cellular–Symbiosis villages, characterized by an SSE-NNW orientation, weighting led to increased elongation (axis ratio from 1.85 to 2.30) despite a similar major axis length (~150 km). The resultant area decreased from 9272.54 km2 to 7883.72 km2. This suggests that despite their diffuse distribution, these multi-ethnic villages rely on linear road networks for connectivity and integration, which shapes their spatial footprint into a more linear pattern.
The consistent orientation across weighted and unweighted analyses confirms the robustness of the underlying geographical patterns. However, the changes in size and shape clearly demonstrate how road infrastructure modifies the spatial expression of each village type.

4.4. Integrated Spatial Analysis of Influencing Factors

4.4.1. Global Spatial Autocorrelation

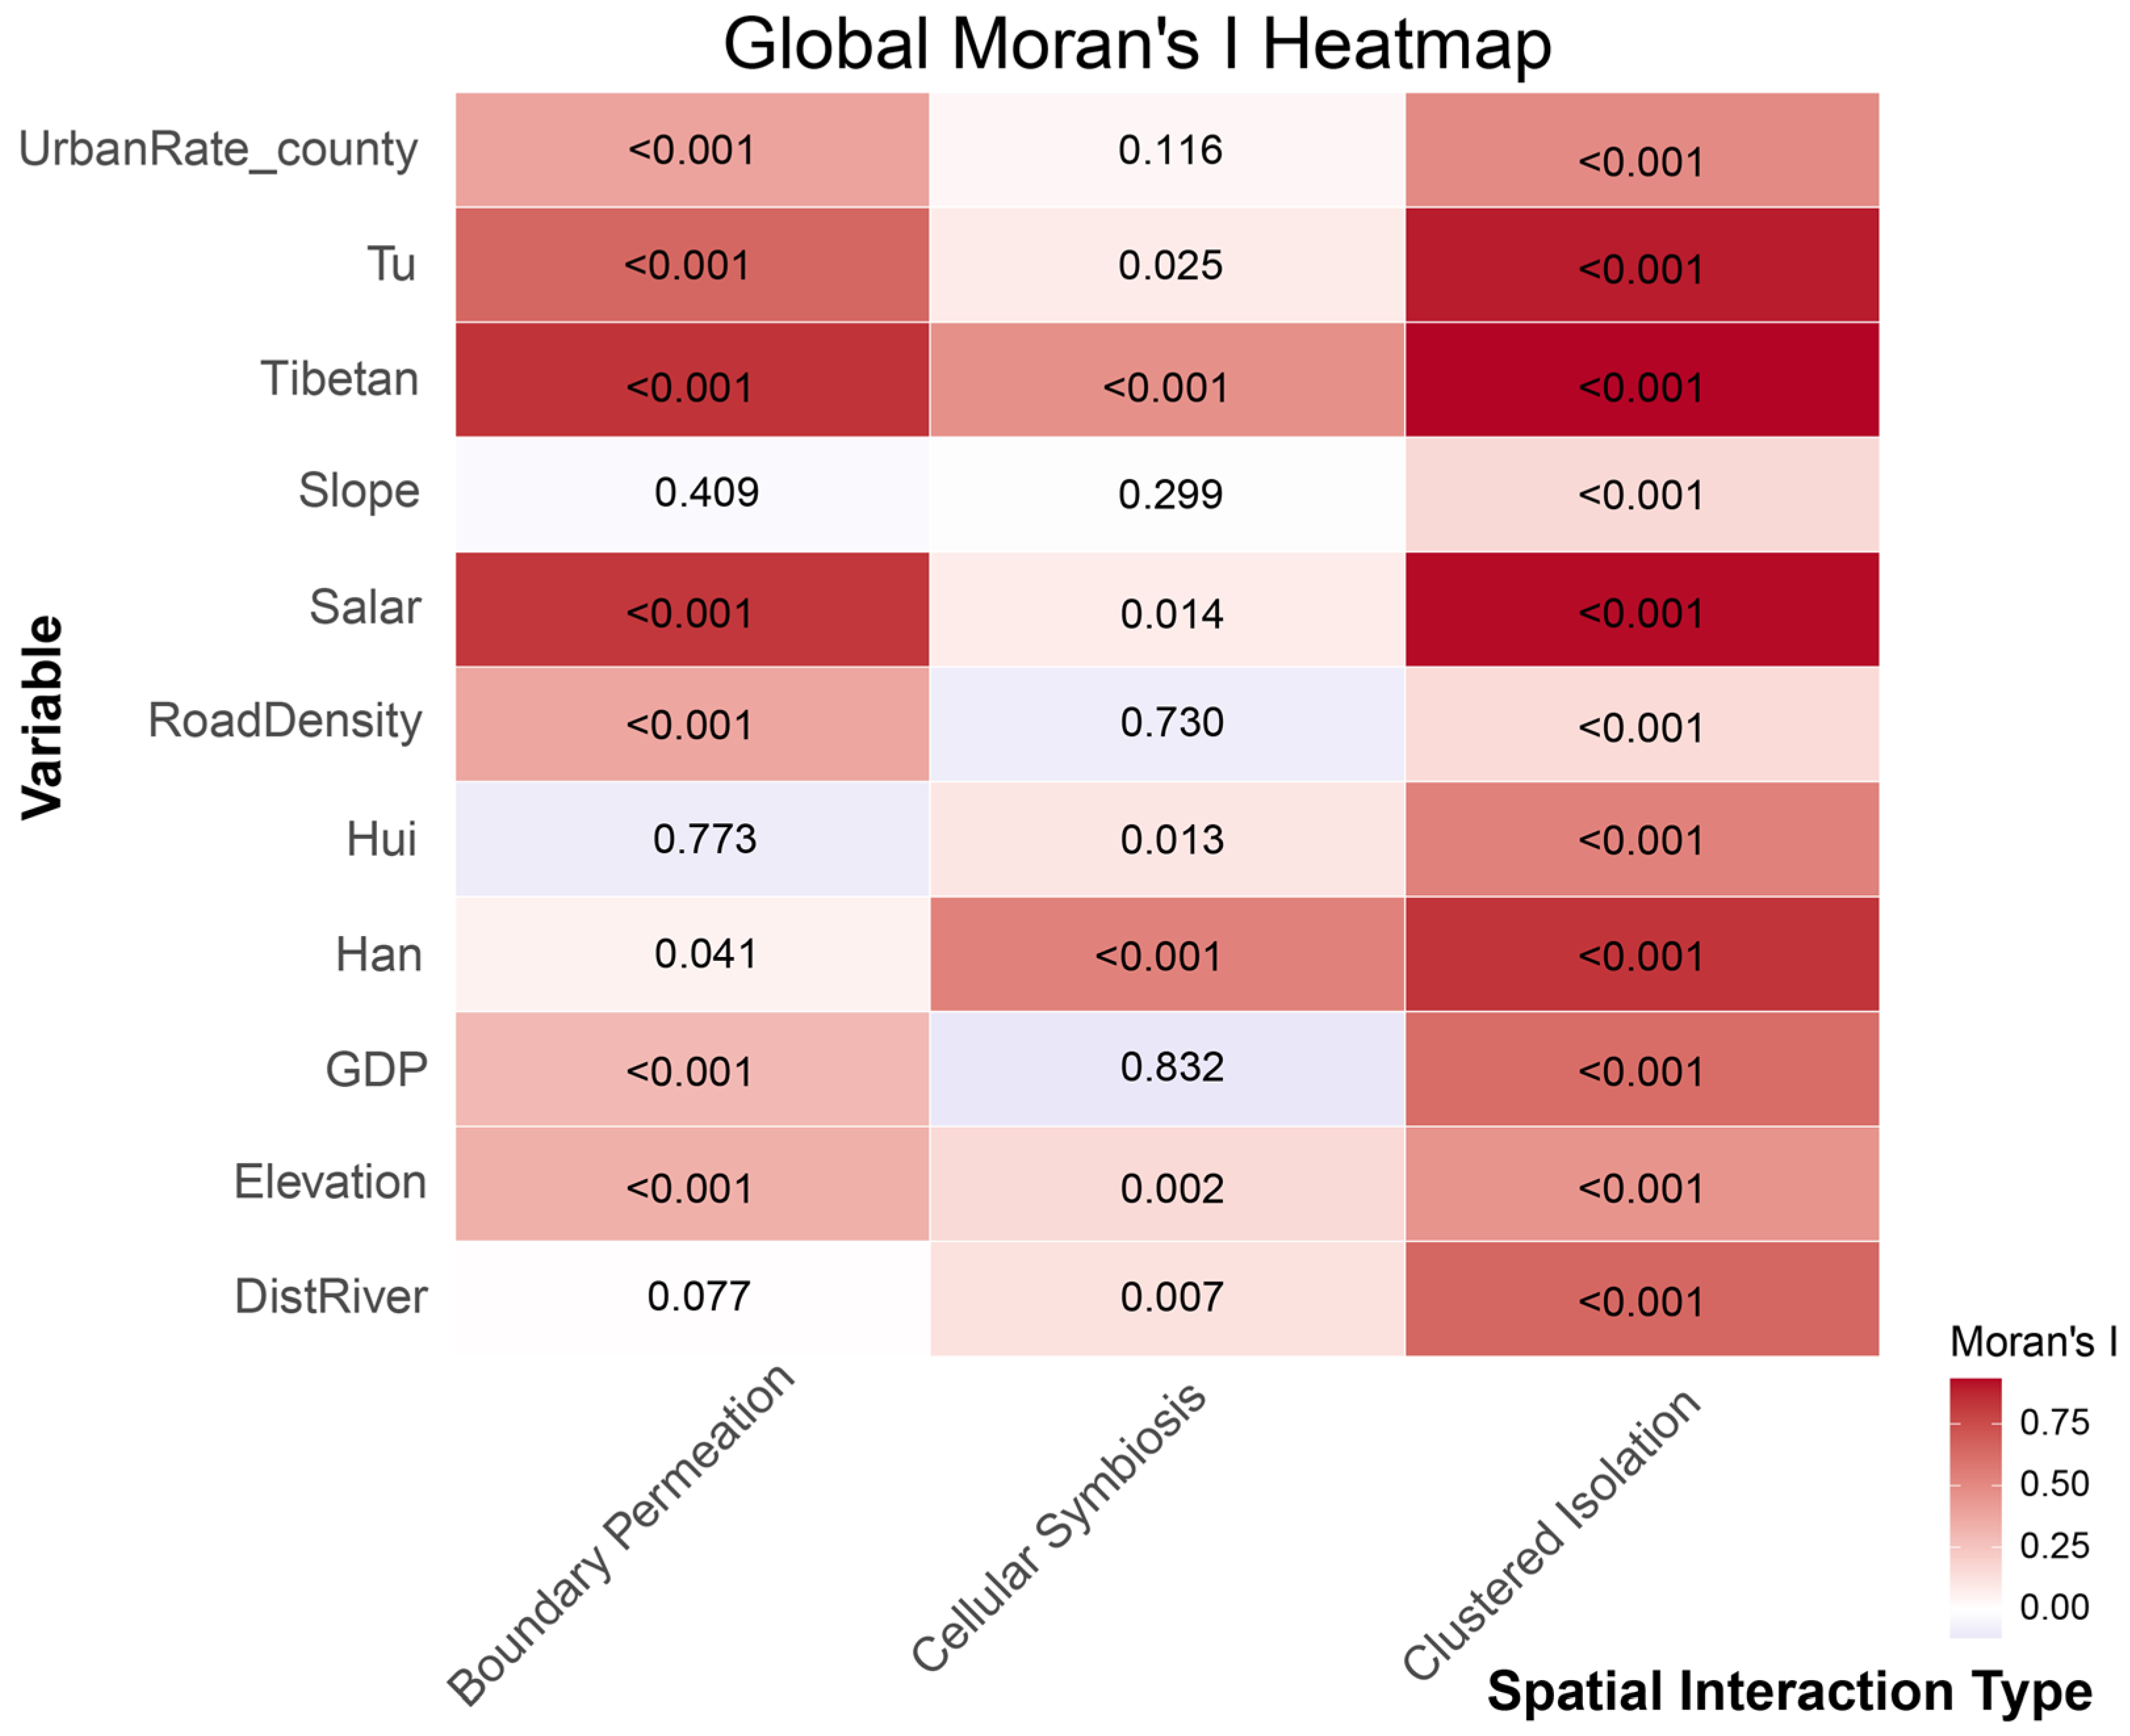
We used Global Moran’s I to measure the spatial clustering of key driving factors across the three village types (Table 7, Figure 8). The results show clear differences in their spatial patterns.
(1) Clustered–Isolation villages (n = 107): These show strong spatial clustering across almost all variables. This is evidenced by high Moran’s I values for natural factors (e.g., Distance to river: I = 0.646, p < 0.001), economic indicators (e.g., per capita GDP: I = 0.623, p < 0.001), and particularly ethnic composition (e.g., Tibetan: I = 0.934, p < 0.001). This pattern reflects their formation in homogeneous socio-environmental settings.
(2) Boundary–Permeation villages (n = 24): These show a selective and transitional clustering pattern. They show significant spatial dependence for factors like elevation (I = 0.335, p < 0.001), road density (I = 0.380, p < 0.001), and the proportions of Tibetan (I = 0.836, p < 0.001), Tu (I = 0.646, p < 0.001), and Salar (I = 0.825, p < 0.001) populations. However, slope and Hui population show no significant spatial structure. This indicates their location in specific transition zones where connectivity matters.
(3) Cellular–Symbiosis villages (n = 22): These show the weakest spatial autocorrelation overall. Significant clustering is primarily confined to elevation (I = 0.159, p = 0.002), distance to rivers (I = 0.124, p = 0.010), and all measured ethnic proportions (e.g., Han: I = 0.535, p < 0.001). Notably, their economic and infrastructural variables (e.g., per capita GDP, road density) show no significant spatial patterning, aligning with their more random distribution and highlighting that their multi-ethnic character is not contingent on localized economic or infrastructural hotspots.
In summary, spatial autocorrelation is stronger for physical geography and historical ethnic patterns than for local topography or infrastructure. The distinct clustering profiles confirm that the three types represent different socio-spatial constructs, shaped by different environmental and cultural forces.

4.4.2. Spatial Differentiation of Influencing Factors Across Village Types

We compared six key indicators across the three village types to assess factor differentiation. These included elevation, slope, road density, distance to river, GDP per capita, and county-level urbanization rate. Since several variables violated normality assumptions, we used the non-parametric Kruskal–Wallis H test. For significant results, we conducted post hoc pairwise comparisons using the Wilcoxon rank-sum test with Benjamini–Hochberg adjustment (detailed results available in the Supplementary Materials).
The analysis revealed significant differences in two factors:
(1) Road density (p < 0.001);
(2) Distance to nearest river (p < 0.001).
No significant differences were found in
(1) Elevation (p = 0.766);
(2) Slope (p = 0.555);
(3) GDP per capita (p = 0.470);
(4) Urbanization rate (p = 0.950).
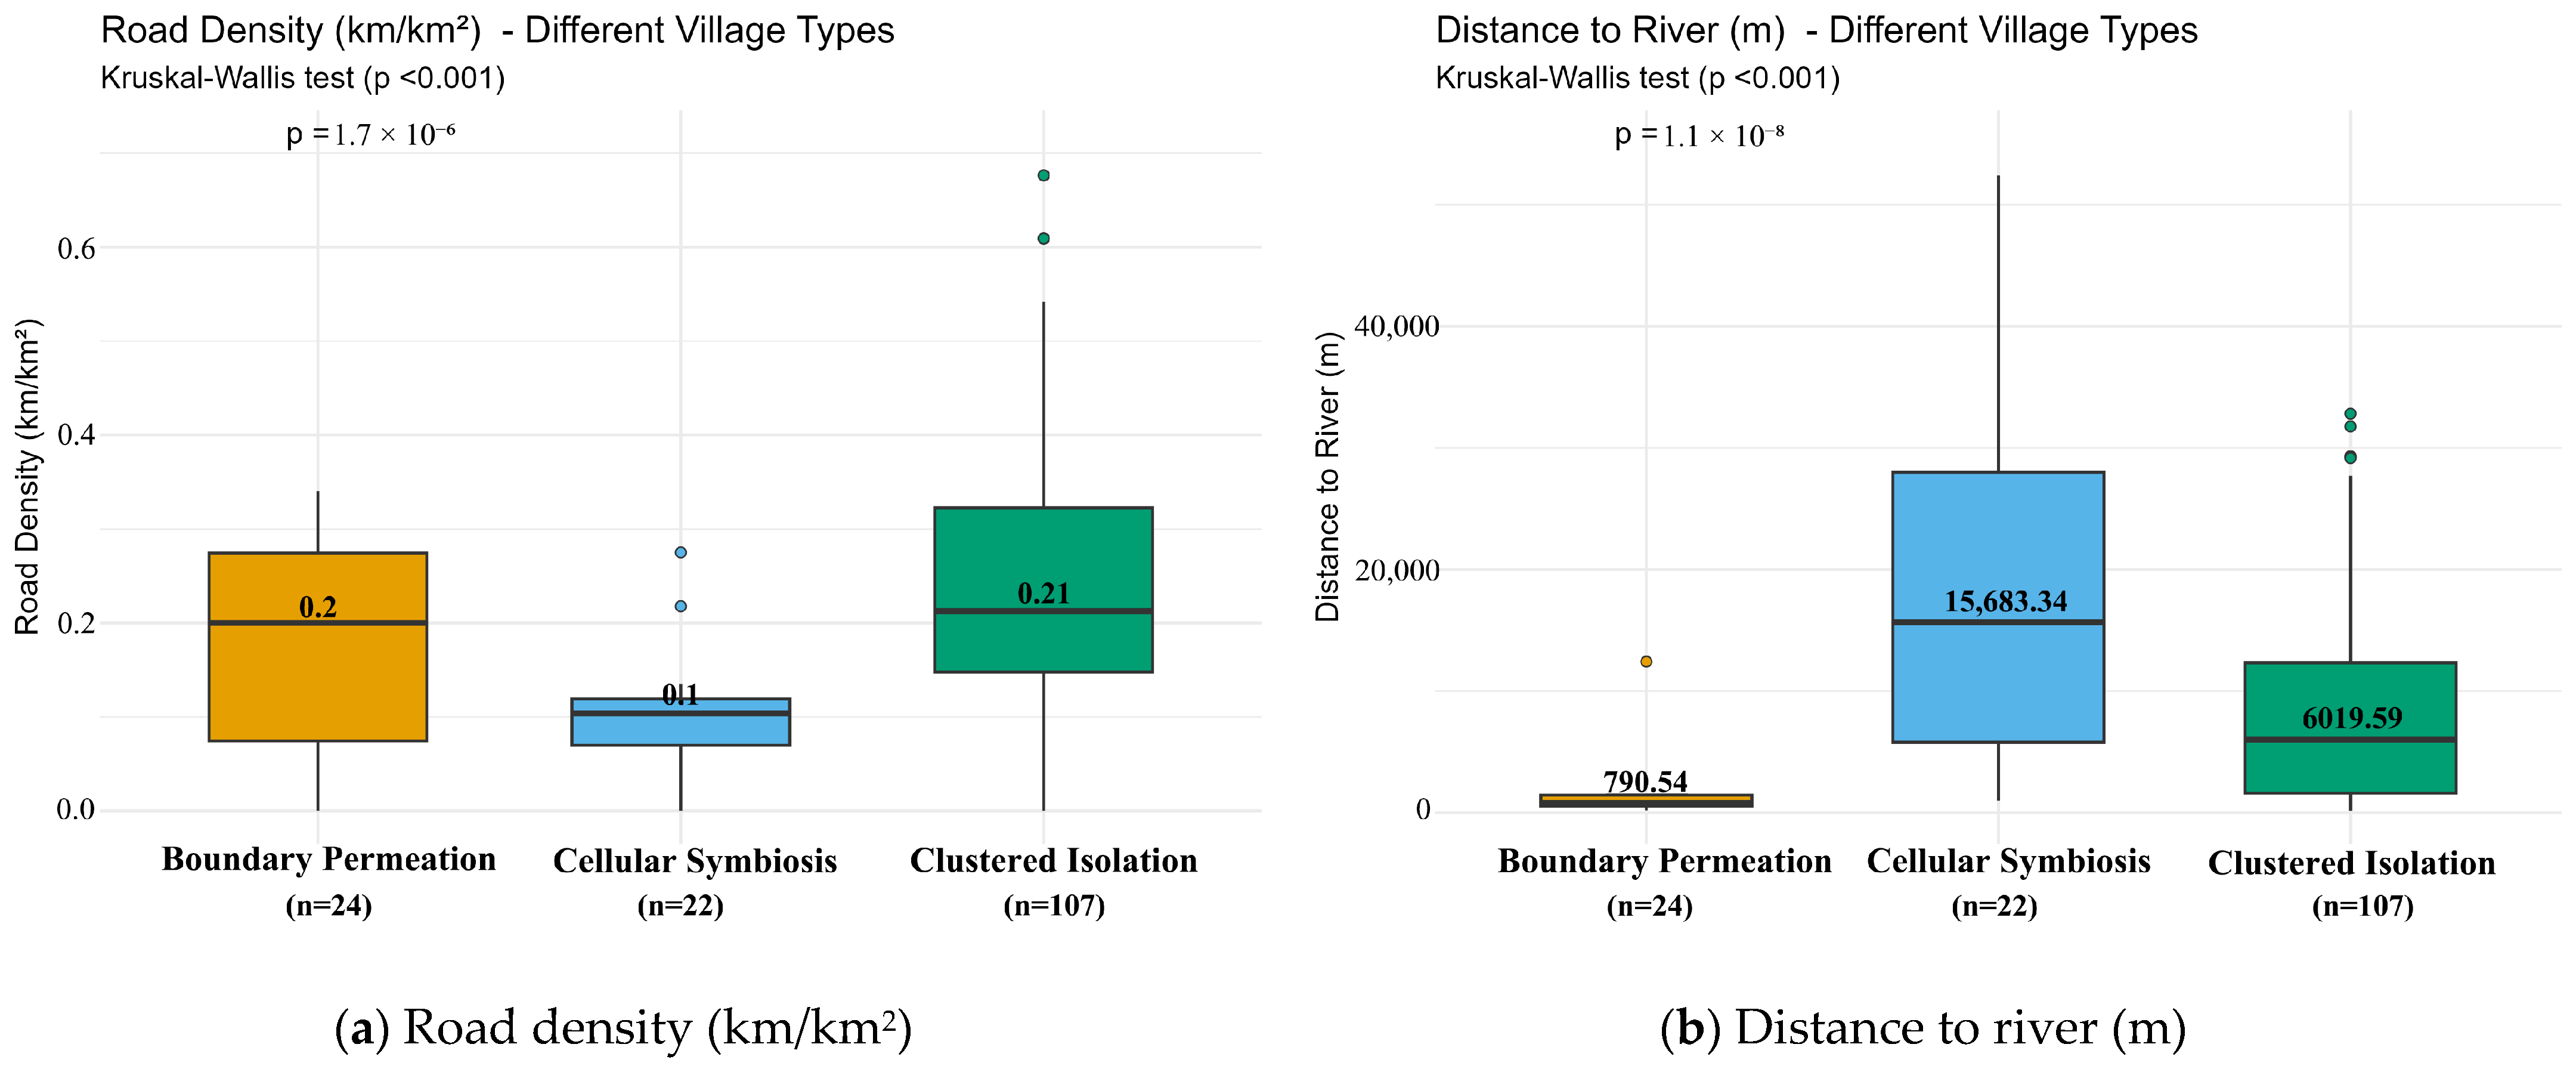
As shown in the boxplots (Figure 9), the patterns of these differences are distinct.
(1) An analysis of road density (Figure 9a) revealed a clear gradient across village types, with median density highest in Clustered–Isolation villages (0.21 km/km2), followed by Boundary–Permeation (0.20 km/km2), and markedly lower in Cellular–Symbiosis villages (0.10 km/km2), a pattern that statistically confirmed the low overall p-value (p < 0.001).
(2) Distance to river analysis (Figure 9b) showed striking spatial stratification, with Boundary–Permeation villages uniquely clustered near rivers (median distance: ~0.79 km), Clustered–Isolation villages occupying an intermediate position (median: ~6.02 km), and Cellular–Symbiosis villages being distinctly the most distant (median: ~15.68 km), supported by the highly significant overall p-value (p < 0.001).
These findings reveal a fundamental spatial logic where the three inter-embeddedness types are strongly differentiated by accessibility settings—both infrastructural connectivity through road density and natural hydrological access through river proximity. The consistent, significant gradients observed in Figure 9 provide a tangible, measurable foundation for their distinct spatial structures.

4.4.3. Analysis of Differentiated Influencing Factors of Village Types: Multinomial Logistic Regression Results

We performed a multinomial logistic regression to identify factors that predict membership in the Boundary–Permeation or Cellular–Symbiosis types, using Clustered–Isolation as the reference category. This choice was based on its spatial dominance, evidenced by multiple KDE hotspots and significant short-range clustering in Ripley’s K analysis, and its largest sample size (n = 107), which provides greater statistical power.
The regression results (Table 8) show distinct drivers for the two non-reference types compared to the clustered baseline:
(1) Boundary–Permeation vs. Clustered–Isolation Boundary–Permeation Clustered–Isolation is characterized by a combination of topographic, hydrological, and socio-economic factors. Elevation shows a strong positive effect (OR = 38.87), while distance to river (OR = 0.98), GDP per capita (OR = 0.96), and county urbanization rate (OR = 0.002) all have negative effects. This profile suggests that Boundary–Permeation villages typically occupy higher yet accessible locations near water sources, yet paradoxically associate with lower economic development levels.
(2) Cellular–Symbiosis vs. Clustered–Isolation shows a different pattern. While both elevation (OR = 0.9994) and slope (OR = 1.0001) are statistically significant, their Odds Ratios are practically negligible. This indicates that while topography plays a discernible role, its practical effect is minimal. The formation of Cellular–Symbiosis villages likely depends more on complex, fine-scale historical, social, or cultural processes rather than the broad environmental and economic factors measured here.
In summary, the regression confirms that the three village types represent distinct socio-spatial outcomes. Boundary–Permeation emerges from specific environmental accessibility and socio-economic conditions, while Cellular–Symbiosis represents a unique integration pathway largely independent of the macro-scale variables in our model.

5. Discussion

5.1. Interpreting Spatial Patterns Through a Complementary Theoretical Lens

This study developed a “cluster–boundary–cellular” model to analyze the spatial differentiation of traditional villages. By employing GIS spatial analysis with multi-source data, it systematically uncovers the multidimensional drivers behind these patterns. This empirically grounded model contributes to international scholarship by providing a perspective that complements the traditional segregation–integration framework prevalent in Western research.
While concepts like “ethnic segregation” and “spatial justice” have shaped discourse in North American and European contexts [30,31,32,33], our model frames ethnic inter-embeddedness in the Hehuang region as a dynamic spatial gradient. This approach captures nuanced transitional forms between segregation and integration, offering a flexible tool for analyzing socio-spatial evolution in multi-ethnic areas.
This gradient perspective shares similarities with—yet remains distinct from—other international studies. For instance, the “Boundary–Permeation” type aligns with research on ethnic “contact zones” [34], where economic exchange occurs alongside maintained social boundaries. Similarly, the “Cellular–Symbiosis” type reflects ideals related to “everyday multiculturalism” [35]. However, the Hehuang case is unique. Its gradient patterns are systematic and historically stable, rooted in vertical environmental stratification and the enduring spatial logic of organized religions. This presents a paradigm shaped by China’s specific socio-spatial context, illustrating ethnic inter-embeddedness as a multidimensional process forged through long-term environmental adaptation, cultural practices, and socio-political frameworks.

5.2. Synthesizing the Interplay of Natural Constraints and Socio-Cultural Adaptation

Topography and river systems critically shape the spatial heterogeneity of traditional villages in the Hehuang region [36]. Village differentiation results from the dynamic interplay between environmental constraints and the adaptive capacities of ethnic cultures. Our findings reveal a complex process where topography and hydrology establish foundational possibilities and constraints for livelihood strategies, to which different ethnic groups have developed distinct adaptive responses.
Statistical evidence shows a clear hydrological gradient across village types (Section 4.1, Table 4). Boundary–Permeation villages maintain the closest mean distance to rivers (~1.4 km), Clustered–Isolation villages show intermediate distance (~8.4 km), and Cellular–Symbiosis villages are most distant (~18.1 km). This pattern indicates that river proximity alone cannot explain settlement patterns. The closest hydrological association appears in the initial contact Boundary–Permeation type rather than the deeply integrated Cellular–Symbiosis type, suggesting that while the natural environment provides an interaction template, socio-cultural factors—including social organization, cultural traditions, and historical trajectories—play equally crucial roles in shaping inter-embeddedness.
These findings align with broader research on the Qinghai–Tibet Plateau’s environmental constraints [37]. Statistical differences in temperature and aridity across ethnic settlements further demonstrate how the geographical environment influences ethnic groups [38], while the vulnerability of alpine grasslands to degradation constrains population distribution at a broader scale [39]. This perspective moves beyond environmental determinism to reveal active socio-ecological adaptation, where ethnic groups develop distinctive spatial strategies within shared constraints—a pattern also observed in the poverty-stricken Liangshan mountains, where elevation and slope critically determine village distribution [40].
Historically, the region’s ethnic distribution has been shaped by institutions like military farming settlements and the Tea–Horse Exchange. Ming and Qing dynasty military settlements established the foundation for Han village distribution, while historical migration routes predetermined spatial relationships between ethnic villages. These historical legacies, combined with modern Regional Ethnic Autonomy policies, collectively shape the path dependency of village spatial structures.

5.3. Religion as a Profound Organizing Logic in Socio-Spatial Formation

Religious belief serves as a core cultural driver whose spatial distribution not only reflects geographical variations in practice but also reveals dynamic interactions between religion, socioeconomic factors, and cultural environments [41,42]. This theoretical understanding finds clear expression in the multi-ethnic settlements of the Gan-Qing’s multi-ethnic culture development, which is closely tied to its specific geographical conditions, ethnic origins, and frontier governance policies [38]. Rural settlement patterns in this region integrate natural, socio-economic, and cultural factors, displaying distinct regional and ethnic characteristics [43]. Specifically, ethnic culture significantly shapes settlement morphology, with patterns in the Gan-Qing highlands emerging from long-term co-adaptation among rugged terrain, diverse cultures, and sacred beliefs [44]. In particular, the mechanistic links between religious belief and secular space are also recognized as key in shaping the morphological features of multi-ethnic settlements’ morphology in this region [45].
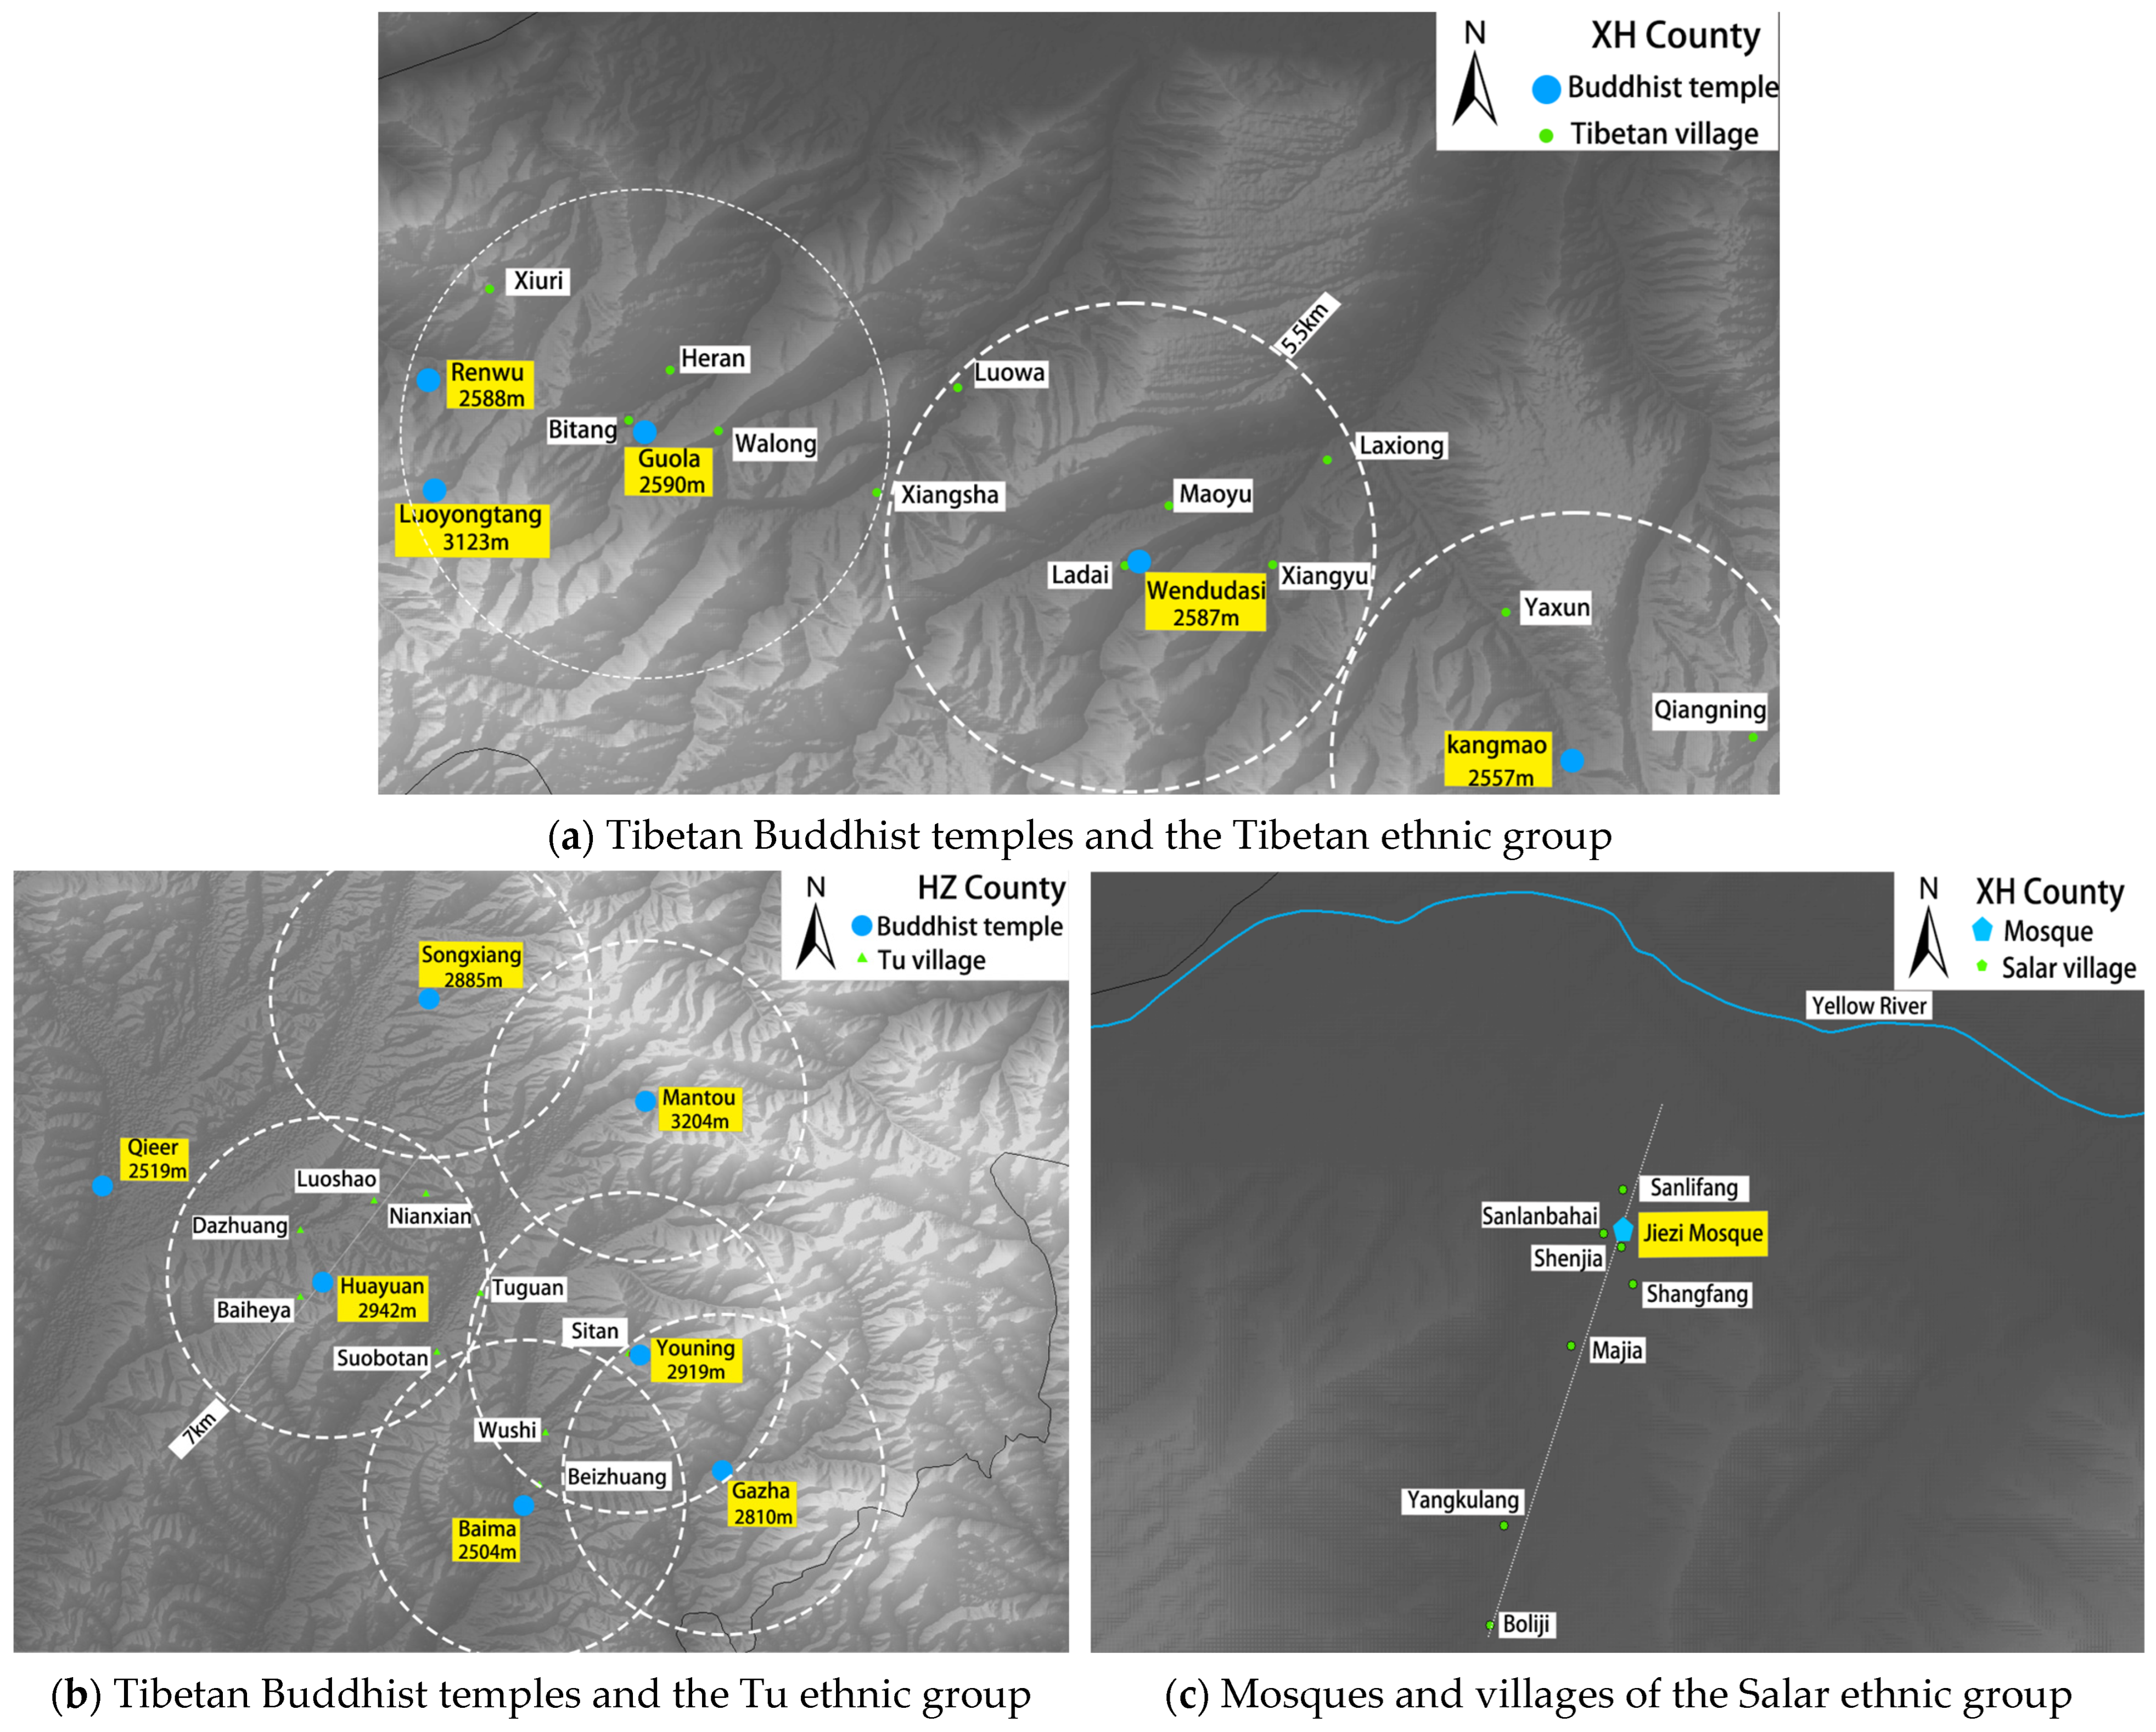
Our analysis confirms religious belief as a primary cultural driver that profoundly influences village spatial patterns. This religion-driven pattern differentiation is not unique to our study area; similar high-aggregation characteristics appear in other multi-ethnic regions [46]. We found a strong statistical association between religious affiliation—represented by Tibetan (Tibetan Buddhism), Salar and Hui (Islam), and Han (more secular orientation), and settlement types [13]. Satellite imagery (Figure 10) visually demonstrates this spatial logic: Tibetan and Tu communities show “monastery–village isomorphism,” clustering around Tibetan Buddhist monasteries, while Islamic groups form dense, linear settlements oriented around mosques.
This deep connection between belief systems and settlement patterns appears at a finer scale as well. Research on Jiarong Tibetan villages in western Sichuan reveals a similar nested relationship between defensive watchtowers and settlements [47], providing micro-scale evidence that supports our macro-level findings.
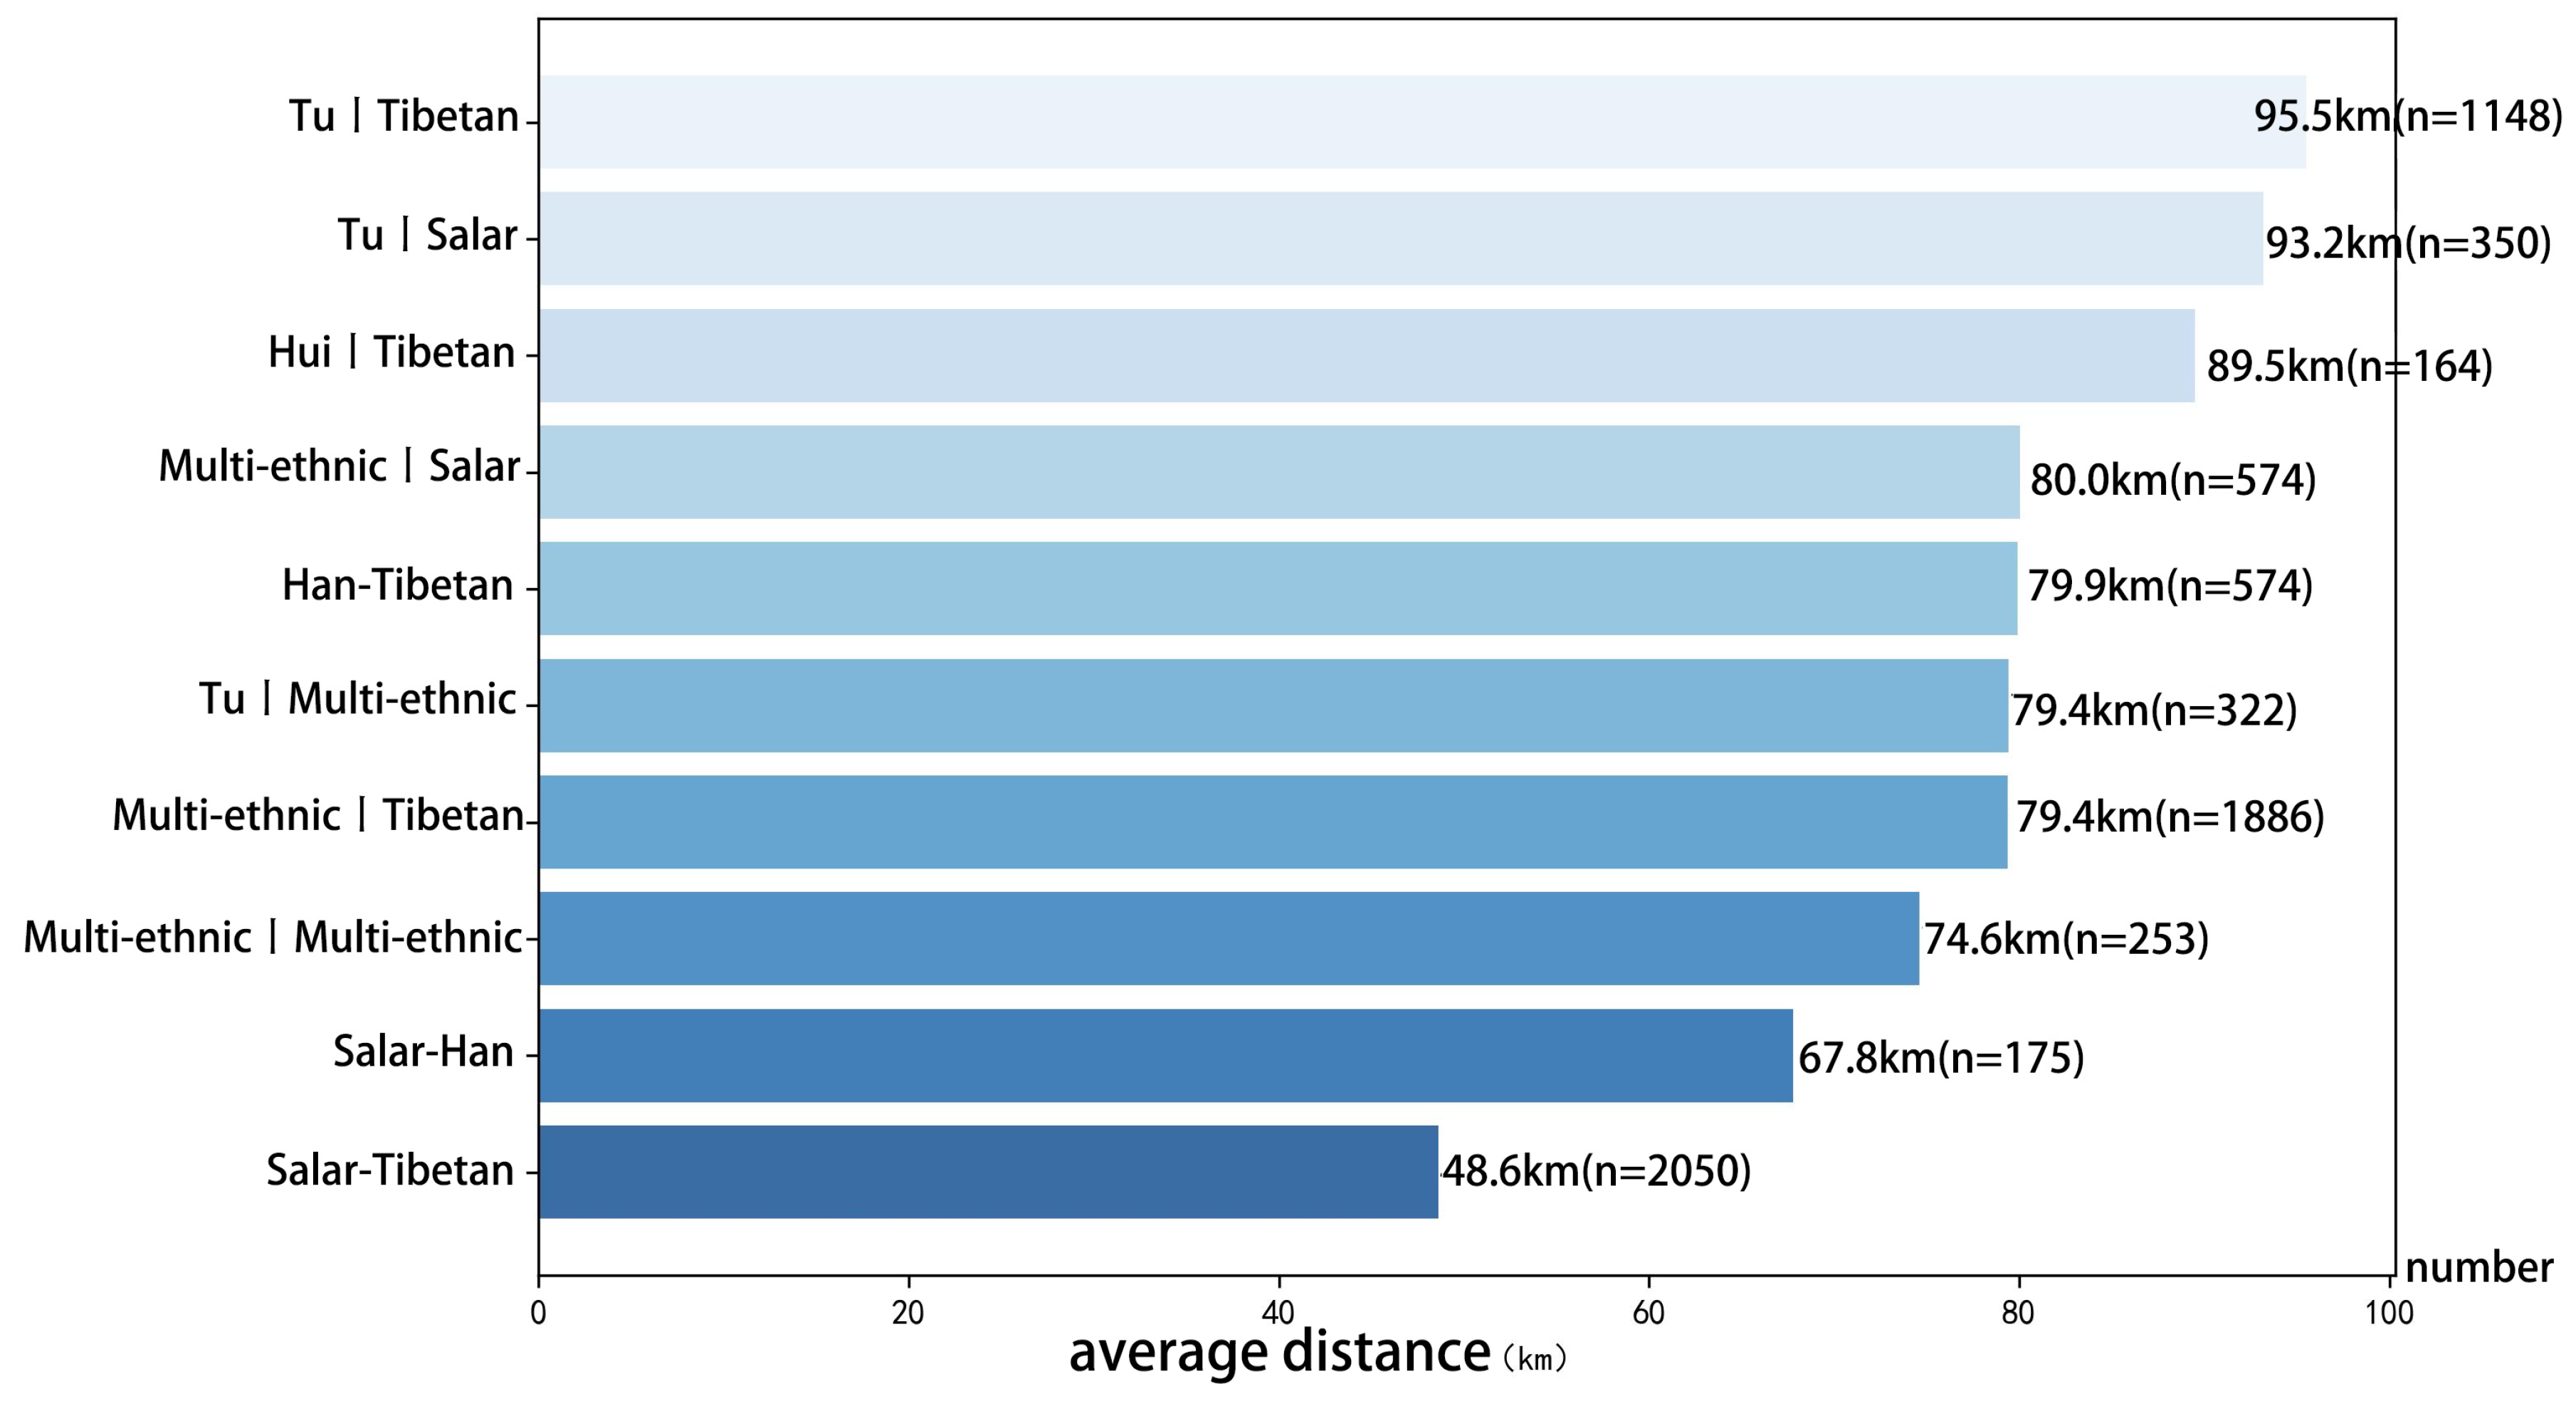
However, religion acts as a double-edged sword in spatial organization. It strengthens internal cohesion and preserves identity, as shown by the strong Clustered–Isolation patterns of Salar and Tibetan villages. The village distance matrix (Figure 11) reveals a more complex reality. Salar and Tibetan villages are relatively close (average 48.6 km), but this reflects “vertical stratification”; they remain separated by elevation despite spatial proximity.
In contrast, the average distance between Hui and Tibetan villages is much greater (89.5 km), showing how different religious identities can strengthen socio-spatial boundaries. Multi-ethnic (Cellular–Symbiosis) villages are even farther from homogeneous religious settlements (74.5–95.5 km), suggesting that deep inter-ethnic embeddedness often develops away from areas dominated by any single religious group. The Han population, with a more flexible religious identity, shows greater adaptability. They more readily form Boundary–Permeation and Cellular–Symbiosis relationships across ethnic lines. Together, these patterns indicate that while shared religion builds internal unity, religious differences lead to distinct geographical strategies—either maintaining separation or creating new, shared spaces outside of traditional religious cores.

5.4. Infrastructure and Economic Change as Catalysts for Spatial Reorganization

Road network density varies significantly across village types, demonstrating transportation infrastructure’s profound influence on traditional villages’ spatial distribution and form [48,49]. Boundary–Permeation villages show the highest road density (0.552 km/km2), followed by Cellular–Symbiosis villages (0.436 km/km2), while Cluster Isolation villages have the lowest (0.35 km/km2). This clear statistical relationship confirms transportation infrastructure’s catalytic role in reshaping historical spatial settlement patterns.
The Standard Deviational Ellipse analysis (Section 4.3, Figure 7) visually illustrates this transformation. For Boundary–Permeation villages, weighting by transportation factors caused dramatic spatial contraction and elongation, illustrating how transport corridors channel inter-ethnic interaction. For Cellular–Symbiosis villages, multi-nodal connectivity via secondary road systems appears to support the functional integration of multiple ethnic groups.
Concurrently, economic transformation presents a dual effect. While high urbanization may lead to a loss of traditional villages, moderate urbanization levels correlate with diverse embeddedness types. This tension is particularly evident in the Qinghai highlands, where rapid urbanization and secularization threaten multi-ethnic settlements’ spatial integrity [50]. Research shows varying urban integration levels among ethnic migrant groups, with Tibetan migrants integrating most readily, followed by Han and Hui migrants [50].
Policy interventions have influenced village spatial restructuring. The Western Development Strategy, transportation investments, and New Countryside Construction program have directly impacted different village types’ development trajectories. For example, protective policies for Clustered–Isolation villages and transport corridor investments in Boundary–Permeation areas have either reinforced or altered pre-existing embeddedness patterns.
Overall, infrastructure development, economic transition, and targeted policy interventions continue to reshape ethnic relationships’ spatial organization in the Hehuang region, highlighting the dynamic nature of socio-spatial configurations in rural China.

5.5. Implications for Context-Sensitive Governance

The “Clustered–Boundary–Cellular” model provides spatially explicit insights for governing multi-ethnic regions. This differentiated approach aligns with core principles of rural transformation development (RTD), which emphasize coordinated economic, social, and ecological development through targeted policies to address regional disparities [51]. Based on our findings, we propose the following context-sensitive strategies:
(1) For Clustered–Isolation villages, focus on cultural preservation and targeted poverty reduction. Improve basic infrastructure like roads and communication networks to connect these villages to regional economies while protecting their socio-cultural integrity. Support development initiatives that leverage unique cultural assets, such as ethnic tourism and specialty pastoral products, ensuring that local communities directly benefit.
(2) For Boundary–Permeation villages, prioritize managing interactions and building economic synergy. Upgrade transport corridors between villages, establish shared marketplaces, and organize joint cultural festivals. These measures can transform spatial adjacency into active cooperation, reducing potential ethnic tensions through mutual economic interdependence.
(3) For Cellular–Symbiosis villages, maintain and strengthen the existing integration. Invest in shared public services like schools and clinics that serve all ethnic groups. Promote intercultural dialog and support community-based organizations in managing common resources. The goal is to preserve existing multicultural harmony while preventing new social divisions.
Overall, our findings caution against uniform urbanization policies that could undermine the organically formed embeddedness structure. Spatial planning should recognize these inherent patterns and use them as a foundation for resilient governance that balances economic development, cultural preservation, and social stability.

5.6. Limitations and Avenues for Future Research

This study has several limitations that point to valuable directions for future inquiry.
(1) The reliance on Euclidean distance, while justified for this regional-scale analysis, does not capture travel time or cost. Future work should incorporate network-based or least-cost path distances to better model interaction potential in complex terrain.
(2) The operationalization of socio-cultural drivers, particularly religion, relied on proxies and spatial pattern analysis due to data availability. Deep qualitative investigations, including ethnographic fieldwork and social network analysis, are needed to unravel the micro-level mechanisms of daily interaction, identity negotiation, and the role of community institutions.
(3) The cross-sectional nature of our data limits causal inference. Longitudinal studies tracking the evolution of specific villages over time would be invaluable for understanding the pathways and triggers of transition between embeddedness types.

6. Conclusions

This study developed a novel “Clustered–Boundary–Cellular” model to analyze the spatial differentiation of 153 traditional villages in the Hehuang region. Through integrating GIS spatial analysis and statistical tests, three principal findings emerge.

6.1. Principal Findings

(1) Quantified Spatial Hierarchy
Traditional villages exhibit a clear spatial gradient: Clustered–Isolation (107/153 villages, 69.9%), followed by Boundary–Permeation (24/153 villages, 15.7%) and Cellular–Symbiosis (22/153 villages, 14.4%). Spatial statistics confirm this pattern: both Clustered–Isolation and Boundary–Permeation villages show significant clustering at local scales (p < 0.01, Ripley’s K-function), whereas Cellular Symbiosis villages lack significant spatial autocorrelation.
(2) Statistically Verified Driving Mechanisms
The spatial differentiation of traditional villages in the Hehuang region is shaped by three mutually reinforcing drivers, each quantitatively verified by spatial statistical analyses:
(i) Natural Geographical Constraints: Most villages lie between 1800 and 2800 M elevation and slopes <12°. Kruskal–Wallis tests (p < 0.001) reveal significant differences in river proximity: Boundary–Permeation villages are closest (mean: 1.44 km), Clustered–Isolation are intermediate (8.4 km), and Cellular–Symbiosis are most distant (18.14 km).
(ii) Religious–Cultural Organization: Very high positive spatial autocorrelation (Moran’s I > 0.9, p < 0.001) in Tibetan and Salar populations confirms strong religious clustering. Islamic (Hui) and Tibetan Buddhist villages are separated by a substantial mean distance (89.5 km), reflecting distinct cultural boundaries structured by religious institutions.
(iii) Transportation Infrastructure Catalysis: Road density varies significantly (p < 0.001), peaking in Boundary–Permeation villages (0.55 km/km2) and lowest in Cellular–Symbiosis (0.10 km/km2). Spatial ellipse analysis shows transport corridors strongly confine Boundary–Permeation distribution, reducing the spread area by ~66% when weighted by road density. In contrast, Cellular–Symbiosis villages, though diffusely distributed, rely on linear roads for connectivity.
For Boundary–Permeation villages, road density weighting caused the most dramatic transformation: the SDE contracted sharply (major axis from 101.17 km to 81.92 km) and became markedly more elongated (axis ratio from 1.53 to 2.92), with the area decreasing by ~66% (from 5263.03 km2 to 1802.95 km2). This proves that their distribution is not merely adjacent but is strongly channeled and confined along specific transportation corridors. In contrast, the SDE for Cellular–Symbiosis villages became more elongated (axis ratio from 1.85 to 2.30) despite a similar major axis length, indicating their reliance on linear road networks for connectivity across a diffuse distribution.
Multinomial logistic regression quantifies these drivers: Boundary–Permeation formation is positively associated with elevation (OR = 38.87, p < 0.001) and slope, but negatively with river distance, GDP, and urbanization rate; the Cellular–Symbiosis type shows only minor topographic effects, implying a stronger influence from historical and socio-cultural integration processes.

6.2. Theoretical and Practical Contributions

Theoretically, this study contributes a nuanced, gradient-based model to the international literature on ethnic geography, complementing the prevalent segregation–integration binary. Empirically operationalized and validated through the spatial analysis methods above, the “Clustered–Boundary–Cellular” framework demonstrates that ethnic inter-embeddedness is a dynamic, multidimensional coupling process rather than a static outcome.
Practically, the spatially explicit findings offer a scientifically grounded framework for policymakers. The distinct drivers and characteristics of each scenario, as quantitatively mapped and tested, call for context-sensitive governance strategies: fostering “managed connectivity” for Clustered–Isolation villages, “orchestrating interaction” in Boundary–Permeation zones, and “sustaining synergy” through shared governance in Cellular–Symbiosis communities. This approach advocates for leveraging the inherent socio-spatial patterns, now rigorously defined, as a foundation for sustainable development and ethnic solidarity.
This study has several limitations. First, the cross-sectional data limits causal inference regarding the evolution of embeddedness types. Second, while spatial patterns and statistical associations are robust, the deep, qualitative mechanisms of daily interaction require further investigation. Future research should pursue longitudinal designs, incorporate network-based distance metrics, and employ mixed-methods approaches—including in-depth ethnography and social network analysis—to unravel the complex human dynamics underlying the “ethnic embeddedness” process.

Supplementary Materials

The following supporting information can be downloaded at: https://www.mdpi.com/article/10.3390/su17209268/s1.

Author Contributions

All authors contributed to the study’s conception and design. Material preparation, data collection, and analysis were performed by Y.Z. and J.L. The first draft of the manuscript was written by Y.Z., and J.L. reviewed and revised the manuscript and approved the final manuscript, as submitted. All authors commented on previous versions of the manuscript. All authors have read and agreed to the published version of the manuscript.

Funding

This research was funded by 1. Humanities and Social Sciences Planning Fund of the Ministry of Education of China, grant number 23YJC760165. 2. Soft Science Special Project of Gansu Basic Research Plan, grant number 23JRZA496. 3. Gansu Provincial University Teachers’ Innovation Fund Project 2025B-207.

Institutional Review Board Statement

Not applicable.

Informed Consent Statement

Not applicable.

Data Availability Statement

Data are contained within the article.

Acknowledgments

We express our gratitude for the insightful comments and constructive suggestions provided during the peer-review process.

Conflicts of Interest

The authors declare no conflicts of interest.

References

  1. Li, J.; Yu, M. Ethnic Inter-embeddedness: Current Situations and Prospects of the Research about the Path to the Construction of the Chinese National Community. J. Southwest Minzu Univ. 2024, 45, 28–37. [Google Scholar] [CrossRef]
  2. Yiftachel, O. Critical theory and ‘gray space’: Mobilization of the colonized. City 2009, 13, 240–256. [Google Scholar] [CrossRef]
  3. Han, Y.; He, M.-L.; Gao, J.-B.; Zheng, Q. Review on urban social exclusion in China and the Western countries from the perspective of space isolation. Hum. Geogr. 2020, 35, 26–34. [Google Scholar] [CrossRef]
  4. Sun, L.; Deng, A.; Zhang, H. On the Predicament and Solution of Ethnic Traditional Villages’ Tourism Activation: A Case Study of Leishan County, Qiandongnan. Guizhou Ethn. Stud. 2019, 40, 53–58. [Google Scholar] [CrossRef]
  5. Wei, X.; Hao, Y. Ethnic integration and inter-embeddedness: Formation mechanism of agro-pastoral interlace pattern in Hetao region. J. Hubei Minzu Univ. 2024, 42, 1–9. [Google Scholar]
  6. Getis, A. A history of the concept of spatial autocorrelation: A geographer’s perspective. Geogr. Anal. 2008, 40, 297–309. [Google Scholar] [CrossRef]
  7. Yuan, S.; Tang, G.; Zhang, H.; Gong, Q.; Yin, X.; Huang, G. Spatial distribution pattern of traditional villages and brief analysis of Han Chinese subgroup characteristics in Guangdong. Trop. Geogr. 2017, 37, 318–327. [Google Scholar] [CrossRef]
  8. Duan, C.; Bi, Z.; Huang, F. Spatial inter-embeddedness patterns of ethnic populations in China since the 21st century. Guangxi Ethn. Stud. 2021, 1–11. Available online: https://qikan.cqvip.com/Qikan/Article/Detail?id=7106083494 (accessed on 17 October 2025).
  9. Wang, H.-y.; Meng, Y.; Wu, W.; Zuo, Y.l. Study on Spatial Distribution Characteristics and Influencing Factors of Ethnic Villagesin Southwest Hubei Province. Resour. Environ. Yangtze Basin 2024, 33, 1273–1285. [Google Scholar]
  10. Fan, N.; Han, R.; Liang, K. Study on the spatial characteristics and influencing factors of rural tourism villages in Guizhou Province. World Reg. Stud. 2021, 30, 1308–1319. [Google Scholar] [CrossRef]
  11. Guo, S.; Yang, J.; Ma, C.; Gong, Y.; Gao, C.; Kang, X.; Li, R. Study on the Spatial Distribution Pattern of Traditional Villages and Its Influencing Factors in Yunnan Based on Geo-detector and GIS. J. Yunnan Norm. Univ. 2024, 44, 69–78. [Google Scholar] [CrossRef]
  12. Huang, L.; Xiong, K.; Jia, X.; Bao, G.; He, Y. The Spatial Distribution and Influencing Factors of Traditional Villages in Yunnan Province Based on GIS. J. Yunnan Agric. Univ. 2024, 18, 141–149. [Google Scholar] [CrossRef]
  13. Zhang, Y.; Li, J.; Wang, J.; Xin, A. Spatial correlation between traditional villages and religious cultural heritage in the Hehuang region, Northwest China. J. Asian Archit. Build. Eng. 2024, 24, 3190–3202. [Google Scholar] [CrossRef]
  14. Zukin, S. Structures of Capital: The Social Organization of the Economy; Cambridge University Press: Cambridge, UK, 1990. [Google Scholar]
  15. Lin, Y.; Lin, X. Karl Polanyi’s socio-economic thought and its contemporary relevance. Economist 2009, 47–52. [Google Scholar] [CrossRef]
  16. Wang, S. Embedded development of social work in China. Soc. Sci. Front. 2011, 206–222. [Google Scholar]
  17. Cao, F. The fourfold logic of promoting Chinese national community consciousness through cultural interconnectedness of all ethnic groups. Inn. Mong. Soc. Sci. 2025, 46, 21–28. [Google Scholar] [CrossRef]
  18. Wu, Y.; Li, H. Conceptualizing ethnic inter-embedding: A theoretical exploration. Natl. Forum 2015, 5–9. [Google Scholar] [CrossRef]
  19. Pei, S. Mutual embedding: A new direction in building an ethical community environment. Heilongjiang Natl. Ser. 2015, 111–115. [Google Scholar] [CrossRef]
  20. Silver, H. National conceptions of the new urban poverty: Social structural change in Britain, France, and the United States. Int. J. Urban Reg. Res. 1993, 17, 336–354. [Google Scholar] [CrossRef]
  21. Ma, W.; Li, X. Practical pathways for effective linkage between poverty alleviation and rural revitalization in ethnic regions: Investigation of Minning Town, Ningxia. Guizhou Ethn. Stud. 2022, 43, 49–55. [Google Scholar] [CrossRef]
  22. Li, Y.; Cao, J. Analysis of Ethnic Integration through Recent Changes in Ethnic Distribution of “Mountain and Flatland Structure” in Contemporary Yunnan: Three Cases from Xinping Yi and Dai Autonomous County. Ethn. Stud. 2021, 53–62. [Google Scholar]
  23. Gu, C.; Liu, J. Urban Sociology; Tsinghua University Press: Beijing, China, 2013; pp. 1196–1205. [Google Scholar]
  24. Church, A.; Frost, M.; Sullivan, K. Transport and social exclusion in London. Transp. Policy 2000, 7, 195–205. [Google Scholar] [CrossRef]
  25. Xiong, Y. Division and characteristics of river valley, low mountain, high mountain, and rocky forest areas in the Huangshui River Basin. Water Conserv. Sci. Technol. Econ. 2012, 18, 14–15. [Google Scholar] [CrossRef]
  26. Li, H.; Huang, Y.; Guo, W.; Hou, H.; Fan, M.; Qi, X.; Jia, P.; Guo, Q. Impacts of land use and spatial patterns on water quality at multi-spatiotemporal scales in Hehuang Valley. Environ. Sci. 2022, 43, 4042–4053. [Google Scholar] [CrossRef]
  27. Chang, Q. Structure and Prospective of Chinese Vernacular Architectural Pedigrees: An Objective Based on a Systematic Study of Sample Preservation and Holistic Regeneration. Archit. J. 2016, 1–9. [Google Scholar] [CrossRef]
  28. Li, D.; Li, J.; Jin, Y.; Zhang, C. Construction logic and spatial concepts of earth-walled dwellings in multi-ethnic Hehuang region. Built Herit. 2024, 1–12. [Google Scholar] [CrossRef]
  29. Tong, Y. GIS-based spatial differentiation of traditional villages in China. Hum. Geogr. 2014, 29, 44–51. [Google Scholar] [CrossRef]
  30. Enos, R.D.; Celaya, C. The Effect of Segregation on Intergroup Relations. J. Exp. Political Sci. 2018, 5, 26–38. [Google Scholar] [CrossRef]
  31. Florida, R.; Mellander, C. The Geography of Economic Segregation. Soc. Sci. 2018, 7, 123. [Google Scholar] [CrossRef]
  32. Uwayezu, E.; de Vries, W.T. Exploring the connection between spatial justice and land tenure security: Insights from inclusive urban (re)development schemes in Recife, Brazil. GeoJournal 2020, 87, 3365–3386. [Google Scholar] [CrossRef]
  33. Álvarez Velasco, S.; Liberona Concha, N. Irregularized Transits to the South: A Social Force in the Cross-Border Spatial Dispute in South America. J. Lat. Am. Caribb. Anthropol. 2025, 30, e70008. [Google Scholar] [CrossRef]
  34. Costa Bomfim, L. How Social Justice Planning Can Address Urban Inequities through Social Housing: From Theory to Practice. U. Porto J. Eng. 2024, 10, 85–100. [Google Scholar] [CrossRef]
  35. Wise, A.; Velayutham, S. (Eds.) Everyday Multiculturalism; Palgrave Macmillan: London, UK, 2009. [Google Scholar] [CrossRef]
  36. Li, T.; Li, C.; Zhang, R.; Cong, Z.; Mao, Y. Spatial Heterogeneity and Influence Factors of Traditional Villages in the Wuling Mountain Area, Hunan Province, China Based on Multiscale Geographically Weighted Regression. Buildings 2023, 13, 294. [Google Scholar] [CrossRef]
  37. Jia, X.; Li, F.; Cui, M.; Cheng, G.; Zhao, Y.; Ding, H.; Yu, B.; Lu, H. The geographical environmental characteristics of the distribution of Tibetans and other major ethnic groups in the Hehuang Valley and the differences in their production modes. China Sci. Earth Sci. 2019, 62, 706–716. [Google Scholar] [CrossRef]
  38. Zhu, P. Formation and Integration of the Multi-National Culture in Qinghai. J. Tibet. Natl. Inst. 2006, 27, 75–80. [Google Scholar]
  39. Xu, Y.; Dong, S.; Shen, H.; Xiao, J.; Li, S.; Gao, X.; Wu, S. Degradation significantly decreased the ecosystem multifunctionality of three alpine grasslands: Evidences from a large-scale survey on the Qinghai-Tibetan Plateau. J. Mt. Sci. 2021, 18, 357–366. [Google Scholar] [CrossRef]
  40. Chen, Y.; Shu, B.; Chen, Y.; Wei, D. Spatial distribution and potential poverty-returning factors of former poverty-stricken villages in the Liangshan Mountains, China. J. Mt. Sci. 2023, 20, 2692–2707. [Google Scholar] [CrossRef]
  41. Zhu, J.; Xu, W.; Xiao, Y.; Shi, J.; Hu, X.; Yan, B. Temporal and spatial patterns of traditional village distribution evolution in Xiangxi, China: Identifying multidimensional influential factors and conservation significance. Herit. Sci. 2023, 11, 261. [Google Scholar] [CrossRef]
  42. Hao, Z.; Jiang, L.; Feng, Y.; Yu, Y. Morphology of earth-walled dwellings in Tongren under religious-cultural influences: Case study of Wutun Village. Huazhong Archit. 2025, 43, 153–157. [Google Scholar] [CrossRef]
  43. Banban, D. Harmony in diversity: An empirical study of harmonious co-existence in the multi-ethnic culture of Qinghai. Int. J. Anthropol. Ethnol. 2018, 2, 1. [Google Scholar] [CrossRef]
  44. Jiang, B.; Jiang, T.; Si, J.; Huang, Y.; Du, Y.; Chen, Y. Mechanism of the connection between sacred and secular space: Settlement morphology characteristics in the multi-ethnic areas of the Gansu-Qinghai Plateau. Front. Earth Sci. 2025, 13, 1674493. [Google Scholar] [CrossRef]
  45. Puxuan, Z. The Spatial and Temporal Distribution of Tibetan Buddhism Temples of Ming in Qinghai. J. Tibet. Natl. Inst. 2010, 32–35. [Google Scholar] [CrossRef]
  46. Chen, Y.; Shu, B.; Amani-Beni, M.; Wei, D. Spatial distribution patterns of rural settlements in the multi-ethnic gathering areas, southwest China: Ethnic inter-embeddedness perspective. J. Asian Archit. Build. Eng. 2023, 23, 372–385. [Google Scholar] [CrossRef]
  47. Lei, Z.; Han, W.; Li, J. Spatial–Environmental Coupling and Sustainable Planning of Traditional Tibetan Villages: A Case Study of Four Villages in Suopo Township. Sustainability 2025, 17, 8766. [Google Scholar] [CrossRef]
  48. Lu, S.; Zhang, X. Temporal-Spatial Distribution Characteristics and Impact Factors of Traditional Villages in Huizhou Area. Econ. Geogr. 2019, 39, 204–211. [Google Scholar] [CrossRef]
  49. Yang, Y.; Hu, J.; Liu, D.; Jia, Y.; Jiang, L. Spatial structure identification and influencing mechanisms of Miao traditional villages in Guizhou Province. Econ. Geogr. 2021, 41, 232–240. [Google Scholar] [CrossRef]
  50. Tian, M.; Wei, J.; Liu, J. A comparative ethnic study on the urban integration of the migrant populations in the Qinghai-Tibet Plateau during the process of urbanization. J. Urban Aff. 2023, 47, 1063–1080. [Google Scholar] [CrossRef]
  51. Chen, Y.; Zhang, R.; Beni, M.A. Rural transformation development: Spatiotemporal evolution and mechanisms in the Garze-Ngawa-Liangshan region, Southwest China. J. Asian Archit. Build. Eng. 2024, 24, 4119–4135. [Google Scholar] [CrossRef]
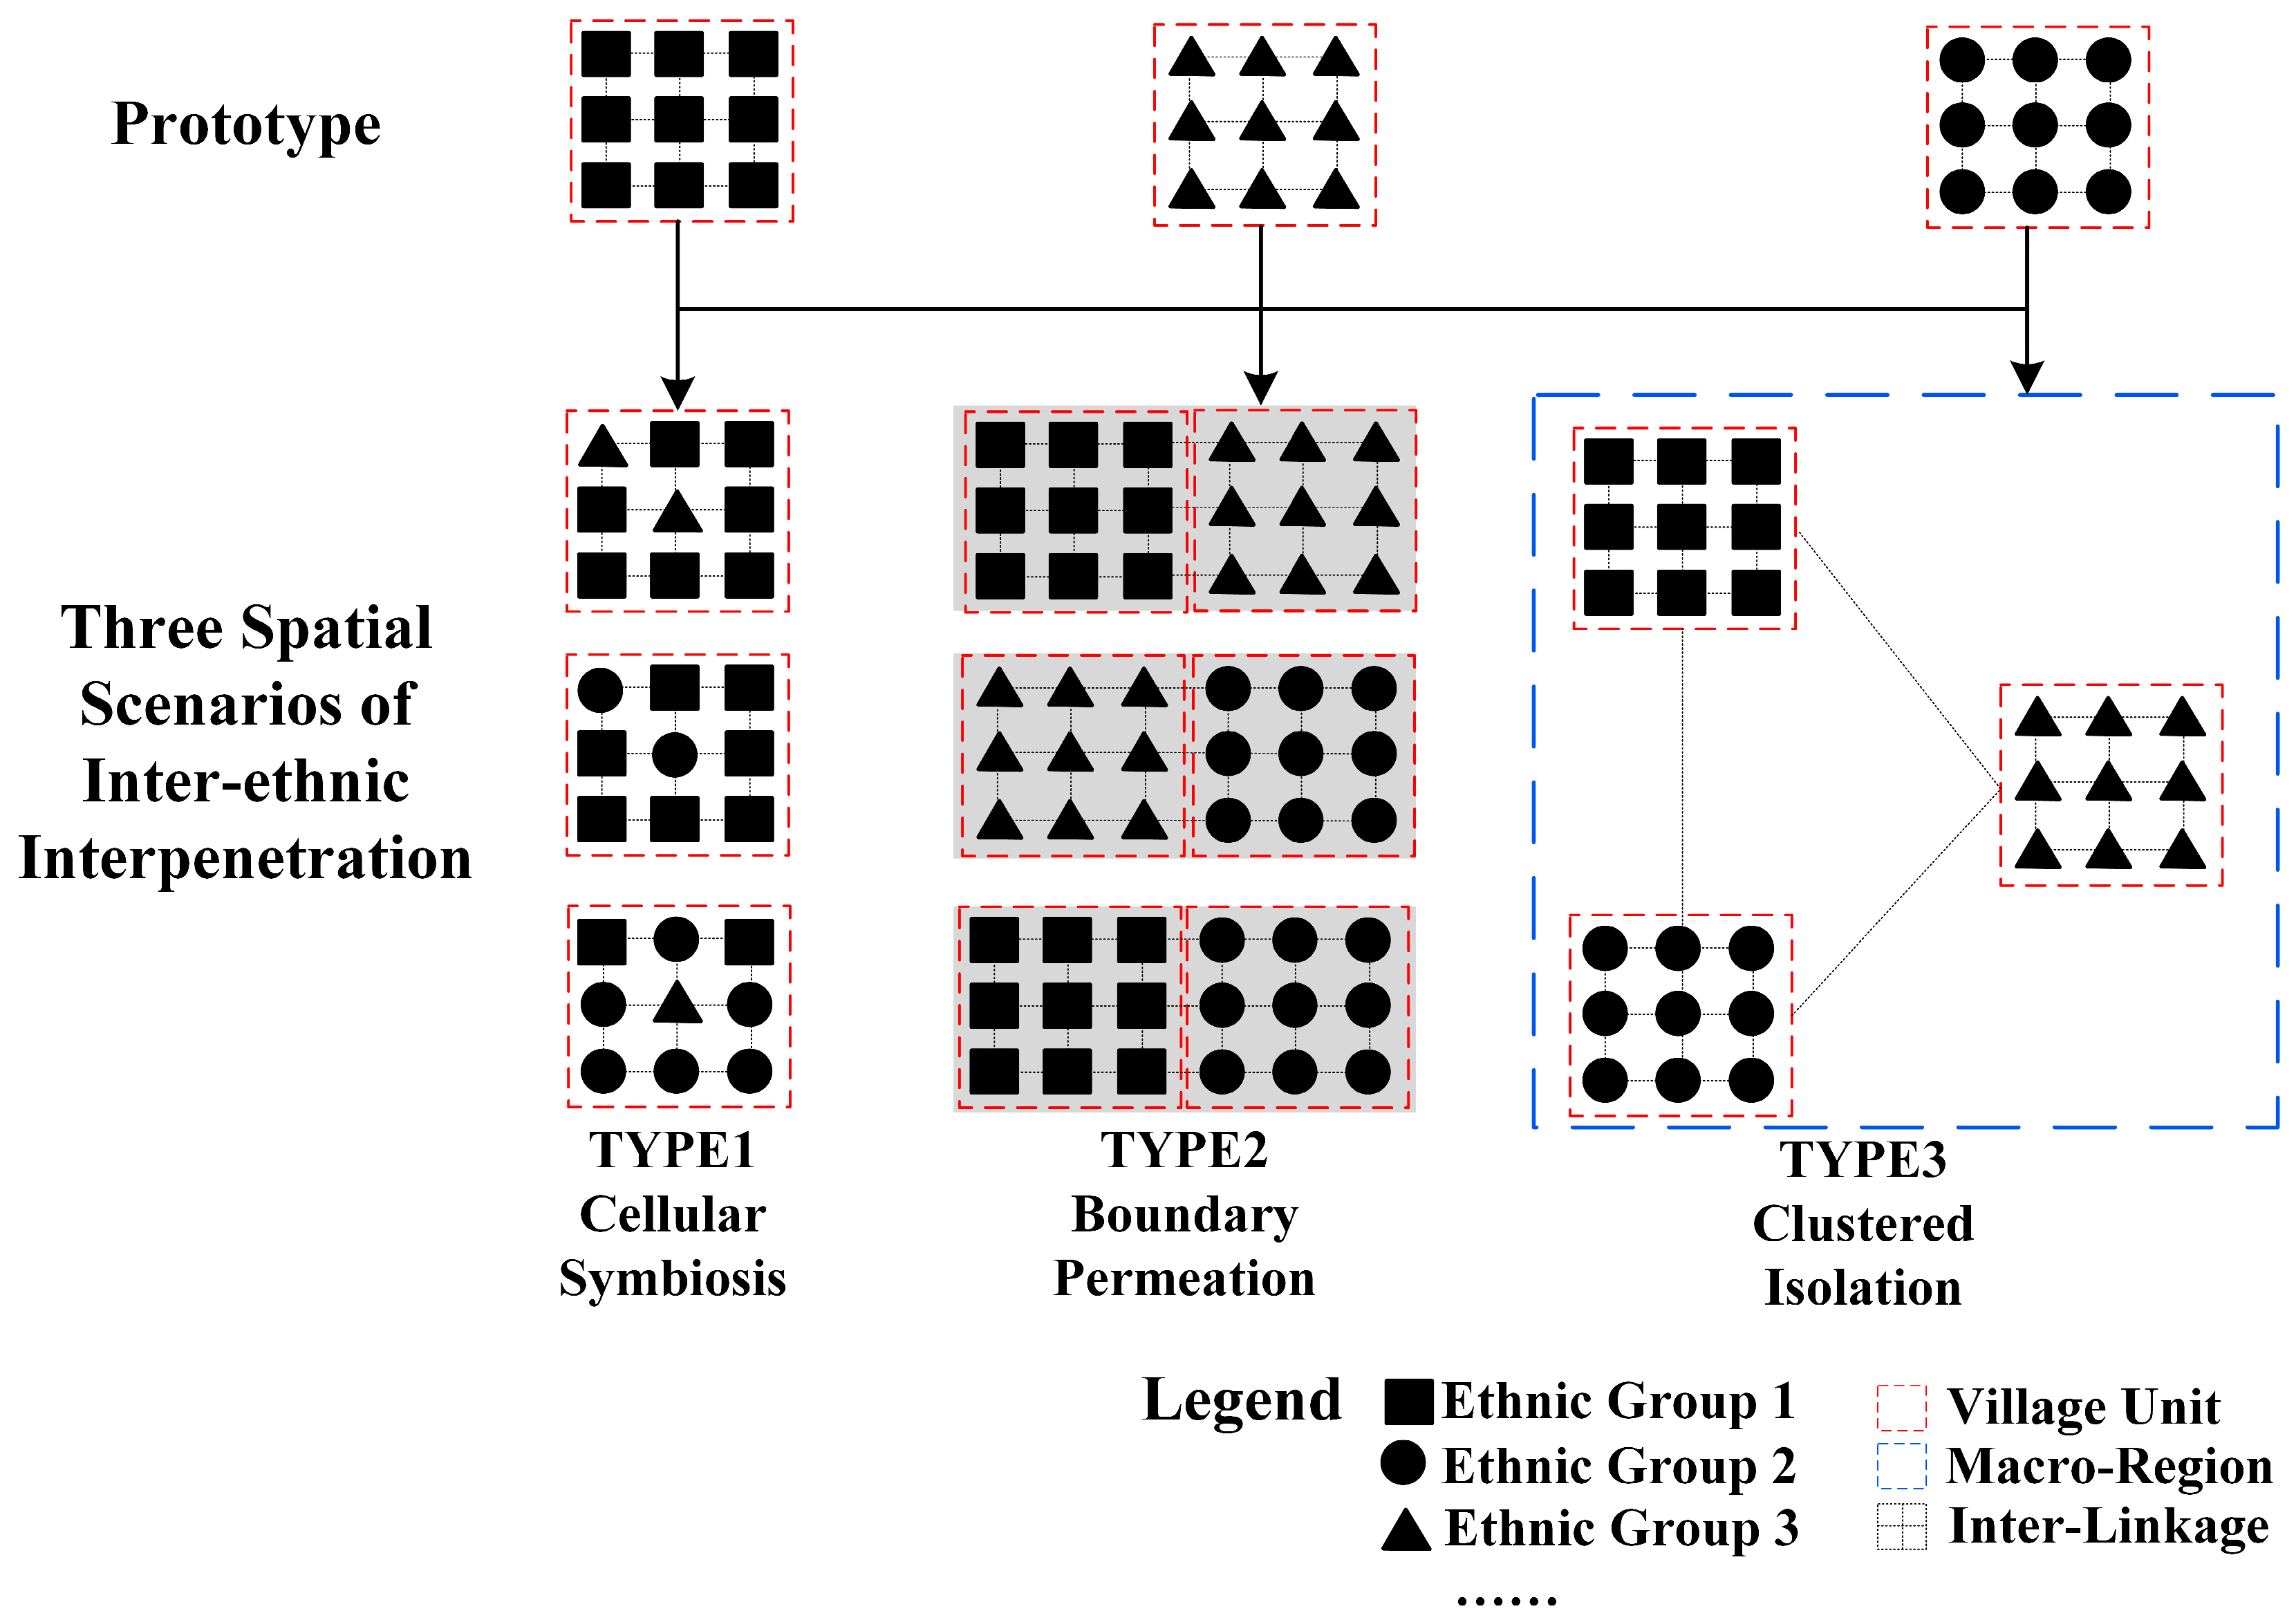
Figure 1. Overall prototype of three coexisting spatial scenarios of inter-ethnic village distribution.
Sustainability 17 09268 g001
Figure 2. Location of the study area.
Sustainability 17 09268 g002
Figure 3. The cultural and linguistic phylogeny of the Hehuang region.
Sustainability 17 09268 g003
Figure 4. Neighboring traditional villages isolated by geographical factors. (a) Distinct geographic separation between Tibetan and Salar settlements. (b) Distinct geographic separation between Tibetan villages and multi-ethnic mixed settlements.
Sustainability 17 09268 g004
Figure 5. Kernel density map of the three types of inter-embedded traditional villages.
Sustainability 17 09268 g005
Figure 6. Ripley’s L-function analysis of spatial clustering in three village types at local (left panels) and broad (right panels) scales. Left panels show local-scale results (0–5 km, 100 m intervals). Right panels show broad-scale results (0–50 km, 500 m intervals). Dashed lines indicate 95% confidence envelopes from 999 Monte Carlo simulations.
Sustainability 17 09268 g006aSustainability 17 09268 g006b
Figure 7. Spatial distribution comparison of Weighted and Unweighted Standard Deviation Ellipses for three village types. (a) Weighted and Unweighted SDE (Clustered–Isolation villages). (b) Weighted and Unweighted SDE (Boundary–Permeation villages). (c) Weighted and Unweighted SDE (Cellular–Symbiosis villages).
Sustainability 17 09268 g007
Figure 8. Heatmap visualization of spatial clustering significance (p-values) from Global Moran’s I.
Sustainability 17 09268 g008
Figure 9. Boxplots of road density and distance to river across three village types (Kruskal–Wallis tests revealed significant differences for both variables among the three types).
Sustainability 17 09268 g009
Figure 10. The cases where neighboring settlements are isolated by geographical factors.
Sustainability 17 09268 g010
Figure 11. Distance matrix of the top ten cross-ethnic traditional villages. Notes: n represents the number of inter-ethnic village combinations.
Sustainability 17 09268 g011
Table 1. Theoretical framework: defining characteristics and hypothesized drivers of the three inter-embeddedness scenarios.
DimensionClustered–Isolation ScenarioBoundary–Permeation ScenarioCellular–Symbiosis Scenario
Defining Spatial PatternSpatially segregated, mono-ethnic clusters with definitive boundaries.Settlements of distinct ethnic groups are adjacent, creating interfaces for interaction.Multiple ethnic groups co-reside within a single village, creating a fine-grained, nested pattern.
Level of Inter-EmbeddednessLowMedium (Functional)High (Structural)
Hypothesized Primary Drivers1. Environmental determinism: Strong constraints from topography and hydrology.
2. Cultural Cohesion: Internal homogeneity reinforced by shared religion/culture, leading to spatial closure.
1. Economic interdependence: Complementarity in production modes and trade.
2. Connectivity: Proximity to transport networks facilitates contact.
1. Functional integration: Shared access to economic, administrative, or social services.
2. Cultural accommodation: Emergence of syncretic practices and shared identities over time.
Theoretical Spatial-Social LogicGeographic segregation → cultural autonomy and preservation.Geographic adjacency → socio-economic complementarity and limited exchange.Spatial integration → functional interdependence and cultural symbiosis.
Table 2. Mapping of analytical methods to research objectives.
MethodResearch Question/Hypothesis
Kernel Density Estimation (KDE)To visualize and compare the spatial intensity and concentration of each village type.
Ripley’s K-functionTo test deviations from Complete Spatial Randomness (CSR) and identify clustering/dispersion across scales.
Standard Deviational Ellipse (SDE)To assess directional trends and examine the influence of transport infrastructure.
Kruskal–Wallis H test + Dunn/WilcoxonTo compare environmental, infrastructural, and socio-economic attributes among village types.
Global Moran’s ITo evaluate the spatial autocorrelation of key driving factors.
Multinomial Logistic RegressionTo identify key predictors influencing the probability of a village belonging to each typology.
Table 3. Sensitivity analysis of classification thresholds.
Village Type1 km2 km3 km (Baseline)4 km5 km
Clustered–Isolation
(Unadjusted)
122108998370
Clustered–Isolation
(Adjusted for Geographic Barriers)
1241121079384
Boundary–Permeation
(Unadjusted)
923324861
Boundary–Permeation
(Adjusted for Geographic Barriers)
719243847
Cellular–Symbiosis2222222222
Note: “Unadjusted” refers to classification results derived solely from the inter-village distance matrix (1–5 km). “Adjusted for Geographic Barriers” refers to the results after manual inspection of high-resolution satellite imagery, excluding village pairs rendered inaccessible due to geographical barriers such as rivers, mountain ridges, or deep valleys, and recalculating proximity relationships. The difference between Unadjusted and Adjusted reflects the effect of barrier adjustments on the type counts.
Table 4. Basic characteristics and key statistical indicators of the three inter-embedded traditional village types.
Category Number of VillagesPercentage
(%)
Dominant Ethnic GroupsElevation
(m)
Slope
(°)
Distance to Nearest River
(m)
Local Road Network Density
(km/km2)
Mean ± SDPre-MergingPost-Merging
Clustered–Isolation10769.9%Tibetan (68), Salar (23), Tu (11), Han (3), Hui (2)2493.36
±362.22
6.71
±5.27
8399.31
±8239.21
0.25 ± 0.160.35
Boundary–Permeation2415.7%Tibetan (15), Han (4), Salar (2), Tu (3)2476.25
±225.19
8.87
±4.76
1437.90
±2396.73
0.18 ± 0.100.55
Cellular–Symbiosis2214.4%Tibetan–Han (12), Tibetan–Han–Tu (3), Tibetan–Han–Hui–Tu (3), Tibetan–Han–Hui (3), Salar–Hui (1), Han–Hui (1)2485.09
±316.45
8.91
±4.96
18,139.72
±14,438.50
0.10 ± 0.060.44
Table 5. Significance of clustering at selected distances for three village types based on Ripley’s L-function.
Village TypeScale 0.5 km 1.0 km2.0 km
Clustered–IsolationLocal scale******
Broad scale******
Boundary–PermeationLocal scale******
Broad scale******
Cellular–SymbiosisLocal scalensnsns
Broad scalensnsns
Notes: ** = p < 0.01 (highly significant clustering). ns = not significant (random pattern). Distances selected (0.5, 1.0, 2.0 km) represent key points in local (0–5 km) and broad (0–50 km) scale analyses. p-values are derived from 999 Monte Carlo simulations comparing L(r) against the simulation envelope.
Table 6. Weighted and Unweighted Standard Deviational Ellipse (SDE) parameters for three village types (3 km buffer road density weighting).
Village TypeAnalysis Major Axis Length (km)95% CI (km)Minor Axis Length (km)95% CI (km)Axis Ratio Ellipse Area
(km2)
95% CI (km2)Rotation Angle
(°)
Main Direction
Clustered–IsolationUnweighted122.81111.17–134.4584.2576.27–92.231.468120.557598.55–8642.55164.99NNW–SSE
Weighted109.7399.33–120.1379.5071.95–87.051.386845.966415.39–7276.53161.57NNW–SSE
Boundary–PermeationUnweighted101.1791.16–111.1866.2559.74–72.761.535263.034590.48–5935.58103.52ESE–WNW
Weighted81.9273.87–89.9728.0425.93–30.152.921802.951572.53–2033.3798.96ESE–WNW
Cellular–SymbiosisUnweighted147.82134.00–161.6479.9472.39–87.491.859272.548301.43–10,243.65159.60SSE–NNW
Weighted152.02137.99–166.0566.0859.84–72.322.307883.727036.04–8731.40161.23SSE–NNW
NOTE: All 95% confidence intervals (CIs) were calculated using the formula CI = mean ± 1.96 × (SD/√n), where n is the number of points for each village type (Clustered–Isolation: 107, Boundary–Permeation: 24, Cellular–Symbiosis: 22). SD for each axis was derived from ArcGIS Standard Deviational Ellipse (SDE) output with 1 standard deviation (SD = 1) as SD = axis length ÷ 2. Ellipse area CI values were computed using standard error propagation from the major and minor axis standard deviations.
Table 7. Global Moran’s I statistics for natural, economic, and cultural factors across three village inter-embeddedness types.
Village TypeClustered–IsolationClustered–IsolationBoundary–PermeationBoundary–PermeationCellular–SymbiosisCellular–Symbiosis
IpIpIp
Elevation0.457<0.0010.335<0.0010.1590.002
Slope0.162<0.001−0.0270.410−0.0100.300
Road Density0.154<0.0010.380<0.001−0.0880.730
Dist River0.646<0.0010.0070.0770.1240.010
Per capita GDP0.623<0.0010.298<0.001−0.1160.832
Urban Rate_county0.498<0.0010.391<0.0010.0360.116
Han0.833<0.0010.0540.0410.535<0.001
Tibetan0.934<0.0010.836<0.0010.471<0.001
Tu0.900<0.0010.646<0.0010.0850.025
Salar0.926<0.0010.825<0.0010.0800.014
Hui0.534<0.001−0.0900.7730.1050.013
Note: Moran’s I represents the spatial autocorrelation coefficient, and the p-value indicates the statistical significance of the test. Positive Moran’s I values (I > 0) denote positive spatial autocorrelation, whereas negative values (I < 0) denote negative spatial autocorrelation. Ethnic variables (Han, Tibetan, Tu, Salar, Hui) refer to the proportion of the respective ethnic group at the county level.
Table 8. Significant factors affecting different village types (p < 0.05).
CategoryVariableCoefficientStd. Errorz-Valuep-ValueOR
Boundary–PermeationElevation3.66030.000140,420.193<0.00138.8747
Slope0.00220.00082.8920.00381.0022
DistRiver−0.02050.0016−12.703<0.0010.9798
GDP−0.03810.0035−11.013<0.0010.9626
UrbanRate_county−6.30510.0000−154,522.035<0.0010.0018
Cellular–SymbiosisElevation−0.00060.0002−3.7650.00020.9994
Slope0.00010.00002.2430.02491.0001
Notes: 1. Only variables with statistical significance (p < 0.05) are retained; intercept terms and non-significant variables are omitted. 2. p-values less than 0.001 are uniformly reported as “<0.001”. 3. OR (Odds Ratio) values are derived by exponentiating the regression coefficients, indicating both the direction and magnitude of the effect on the probability of occurrence.
Disclaimer/Publisher’s Note: The statements, opinions and data contained in all publications are solely those of the individual author(s) and contributor(s) and not of MDPI and/or the editor(s). MDPI and/or the editor(s) disclaim responsibility for any injury to people or property resulting from any ideas, methods, instructions or products referred to in the content.