Article

Groundwater–Surface Water Interactions and Pollution Assessment Using Hydrochemistry and Environmental Isotopes δ18O, δ2H, and 3H in Puebla Metropolitan Area, Mexico

by
Ronald Ernesto Ontiveros-Capurata
1,
Manuel Martínez Morales
2,
Maria Vicenta Esteller Alberich
3,
Juan Manuel Esquivel Martínez
4,
Tania Gutiérrez-Macias
1,
Edith Rosalba Salcedo Sanchez
1,* and
Ariadna Ocampo Astudillo
2
1
SECIHTI-Instituto Mexicano de Tecnología del Agua, Paseo Cuauhnáhuac 8532, Progreso, Jiutepec 62550, Morelos, Mexico
2
Instituto Mexicano de Tecnología del Agua, Paseo Cuauhnáhuac 8532, Progreso, Jiutepec 62550, Morelos, Mexico
3
Instituto Interamericano de Tecnología y Ciencias del Agua (IITCA), Universidad Autónoma del Estado de México, Carretera Toluca-Atlacomulco km 14.5, Toluca 50120, Estado de México, Mexico
4
SECIHTI-Instituto Interamericano de Tecnología y Ciencias del Agua (IITCA), Universidad Autónoma del Estado de México, Carretera Toluca-Atlacomulco km 14.5, Toluca 50120, Estado de México, Mexico
*
Author to whom correspondence should be addressed.
Sustainability 2025, 17(20), 9258; https://doi.org/10.3390/su17209258
Submission received: 12 August 2025 / Revised: 14 October 2025 / Accepted: 14 October 2025 / Published: 18 October 2025
(This article belongs to the Section Pollution Prevention, Mitigation and Sustainability)

Abstract

The Puebla Metropolitan Area, one of the most industrialized regions in Mexico, shows severe contamination of both surface and groundwater. In this study a multi-tracer approach combining hydrochemistry with environmental isotopes (δ2H, δ18O, 3H) was applied to evaluate groundwater–surface water (GW–SW) interactions and their role in water quality degradation. Elevated concentrations of aluminum, iron, zinc, and lead were detected in the Alseseca and Atoyac Rivers, exceeding national standards, while arsenic, manganese, and lead in groundwater surpassed Mexican and WHO drinking water limits. The main sources of contamination include volcanic inputs from Popocatepetl activity (e.g., arsenic) and untreated discharges from industrial parks (e.g., lead), which together introduce significant loads of Potentially Toxic Elements (PTEs) into surface and groundwater. Isotopic analysis identified three sources for aquifer recharge: (1) recharge from high-altitude meteoric water, (2) mixed GW–SW water recharged at intermediate elevations with heavy metal presence, and (3) recharge from lower altitudes (evaporate water). Tritium confirmed both modern and old recharge, while isotope-based mixing models indicated surface water contributions to groundwater ranging from 18% to 72%. These interpretations were derived from the integrated analysis of hydrochemical and isotopic data, allowing the quantification of recharge sources, residence times, and mixing processes. The results demonstrate that hydraulic connectivity, enhanced by fractures and faults, facilitates contaminant transfer from polluted rivers into the aquifer.

1. Introduction

GW–SW interactions play a critical role in water supply, water quality, contaminant transport, and ecosystem health [1,2]. Their quantification is essential for the sustainable management and protection of water resources. Over the past decades, diverse methods have been developed to investigate GW–SW connectivity under different hydrogeological settings. These include hydrogeological balances, hydraulic gradient analyses, tracer tests, geophysical surveys, chemical monitoring, and numerical modeling [3,4,5]. Among these, hydrochemical data and environmental isotopes (δ2H, δ18O, 3H) have become indispensable tools to evaluate recharge sources, residence time, water–rock interactions and mixing between GW–SW [6,7,8,9,10,11,12]. The integration of isotopic and hydrochemical approaches is especially valuable, as it provides a more robust characterization of aquifer processes compared to single-method studies while also capturing the influence of anthropogenic pressures [13,14,15].
Most research on GW–SW interactions has focused on alluvial systems with high-permeability sediments or aquifers connected through low-permeability streambeds [16,17,18]. Although these studies have advanced the understanding of exchange dynamics, fewer have examined how such interactions influence groundwater hydrochemical evolution in urbanized and industrialized regions, particularly with respect to Potentially Toxic Elements (PTEs). This gap is critical in areas where aquifers constitute the main water supply, but at the same time receive inputs from heavily polluted rivers [18,19,20,21,22].
The Puebla Metropolitan Area (PMA) is located in central Mexico, exemplifies these challenges. With more than three million inhabitants, it is the country’s fourth-largest urban agglomeration and an important industrial hub [23,24]. Groundwater is the main water source for the population [25], yet intensive pumping and urban growth have led to declining water levels, reduced availability, and deterioration of water quality [26,27,28]. At the same time, the Alseseca and Atoyac rivers, which traverse the metropolitan area, are considered among the most polluted in Mexico due to untreated or partially treated municipal and industrial discharges [29,30,31,32]. These rivers transport organic matter, fecal bacteria, volatile organic compounds, and significant concentrations of PTEs such as As, Pb, Mn, and Zn, which pose ecological and public health risks due to their persistence, toxicity, and bioaccumulation potential [33,34].
Several studies have analyzed the PMA aquifer system, its hydrochemistry, and river pollution [25,26,27,28]. Others have addressed volcanic inputs, such as ash deposition from Popocatépetl, which also influences water chemistry [24,32]. However, no study has explicitly assessed the role of GW–SW interactions in controlling groundwater quality and the mobility of PTEs, despite the region’s dependence on groundwater as its primary water source. This represents a significant research gap for water management in one of Mexico’s most industrialized regions. This study addresses this gap by applying a multi-tracer approach that integrates hydrochemical data with stable and radioactive isotopes (δ2H, δ18O, 3H) to evaluate GW–SW interactions in the Puebla Metropolitan Area. Specifically, this study aims to (1) characterize groundwater quality and hydrochemical evolution with emphasis on PTEs, (2) identify recharge sources and residence time using δ2H, δ18O, and H3 isotopes (3) quantify river water contributions to groundwater. This combined approach provides novel insights into contaminant pathways, aquifer vulnerability, and the implications of GW–SW connectivity for the sustainable management of water resources in an urbanized volcanic region.

2. Materials and Methods

An integrated methodology was employed. Hydrogeological data facilitated the delineation of subsurface geological structures and groundwater flow regimes. Hydrochemical signatures are analyzed to determine the sources, evolution, and geochemical transformations of water during its transit through the hydrological system. Stable isotopes of δ2H and δ18O were utilized to elucidate recharge mechanisms and GW–SW interactions. Furthermore, the application of radioactive tritium isotope (3H) provides insights into groundwater residence time, renewal rates, and flow dynamics within the aquifer system.

2.1. Study Area Description and Hydrogeological Settings

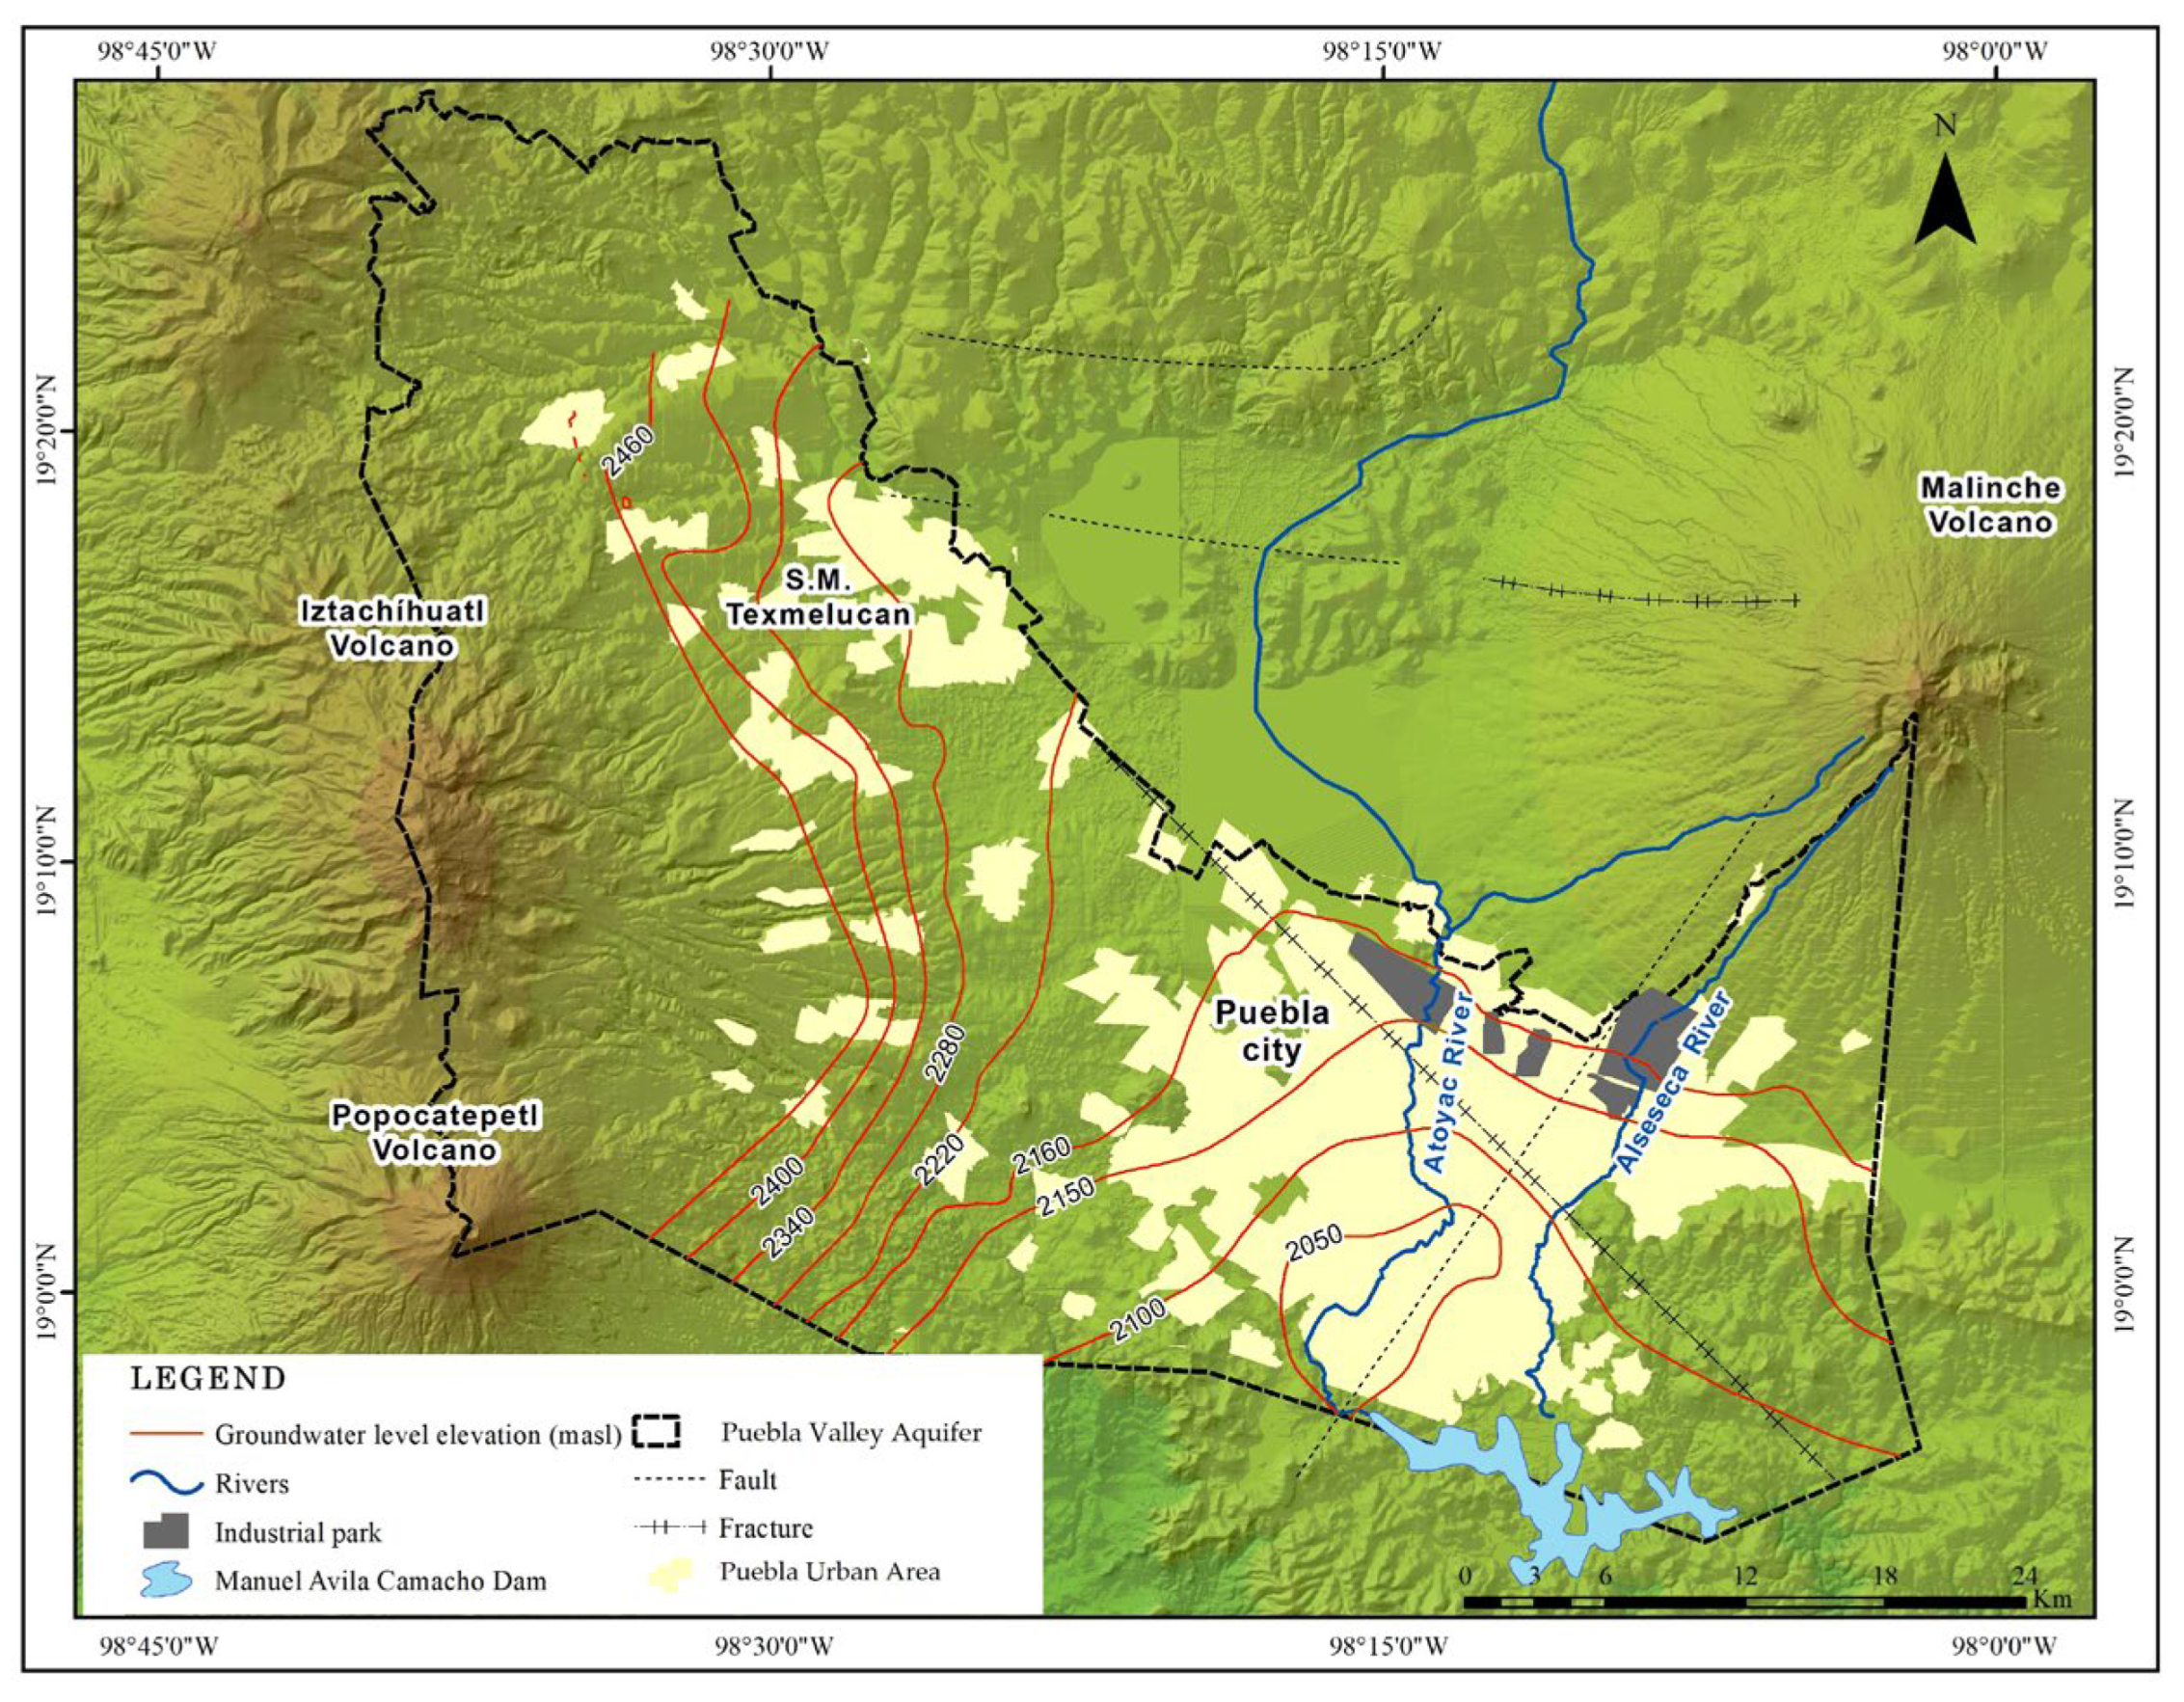
Puebla Metropolitan Area is situated in the central region of the Mexican Republic at an altitude of 2160 masl (meters above sea level) in the Balsas hydrological region (Figure 1). The volcanoes of the Trans-Mexican Volcanic Belt surround it. Popocatépetl and Iztaccíhuatl volcanoes are located to the East and La Malinche volcano to the North of Puebla city [26,27,29,30]. The mean annual temperature is 16.6 °C, with a maximum of 21.3 °C in May and a minimum of 5.5 °C in January [30]. The dry season is from November through May, and the rainy season is from June through October, with an average annual rainfall of 960.1 mm/year. The valley has a mild climate, while at higher elevations the climate is cold [35,36]. The month with the most precipitation on average is September with 195.6 mm.
The month with the least precipitation on average is December, with an average of 5.1 mm. In terms of liquid precipitation, there is an average of 111.9 days of rain, with the most occurring in September with 18.7 days of rain and the least occurring in December with 1.2 days of rain [36]. The hydrological system in the study area consists of two main rivers: Atoyac and Alseseca, draining into the Manuel Avila Camacho dam (see Figure 1). The Atoyac River is fed by the snowmelt and runoff from the Iztaccíhuatl volcano and by the runoff from the Sierra de Tlaxco. In contrast, the Alseseca River is fed by snowmelt and runoff from the western side of La Malinche volcano [28,29].
The hydrological region presents significant deterioration in the quality of the surface water and a water deficit to meet the demand authorized by the federal government [24]. The degradation of the Atoyac River is historical and complex due to the industrialization processes and accelerated population growth in region [31]. The population in the PMA is approximately 3,303,679 inhabitants [26]. Five industrial parks constitute the industrial zone, encompassing a total of 14,982 industries that span diverse sectors, including textiles, machinery, automobile and heavy equipment manufacturing, food production, clothing, leather, chemical and petroleum processing, rubber, plastics, and wood-based products [26,32,33,37]. The Atoyac River in this section receives discharges from three industrial parks: El Conde, San Francisco, and Atoyac Sur, and it also collects wastewater from industries located on both margins [37].
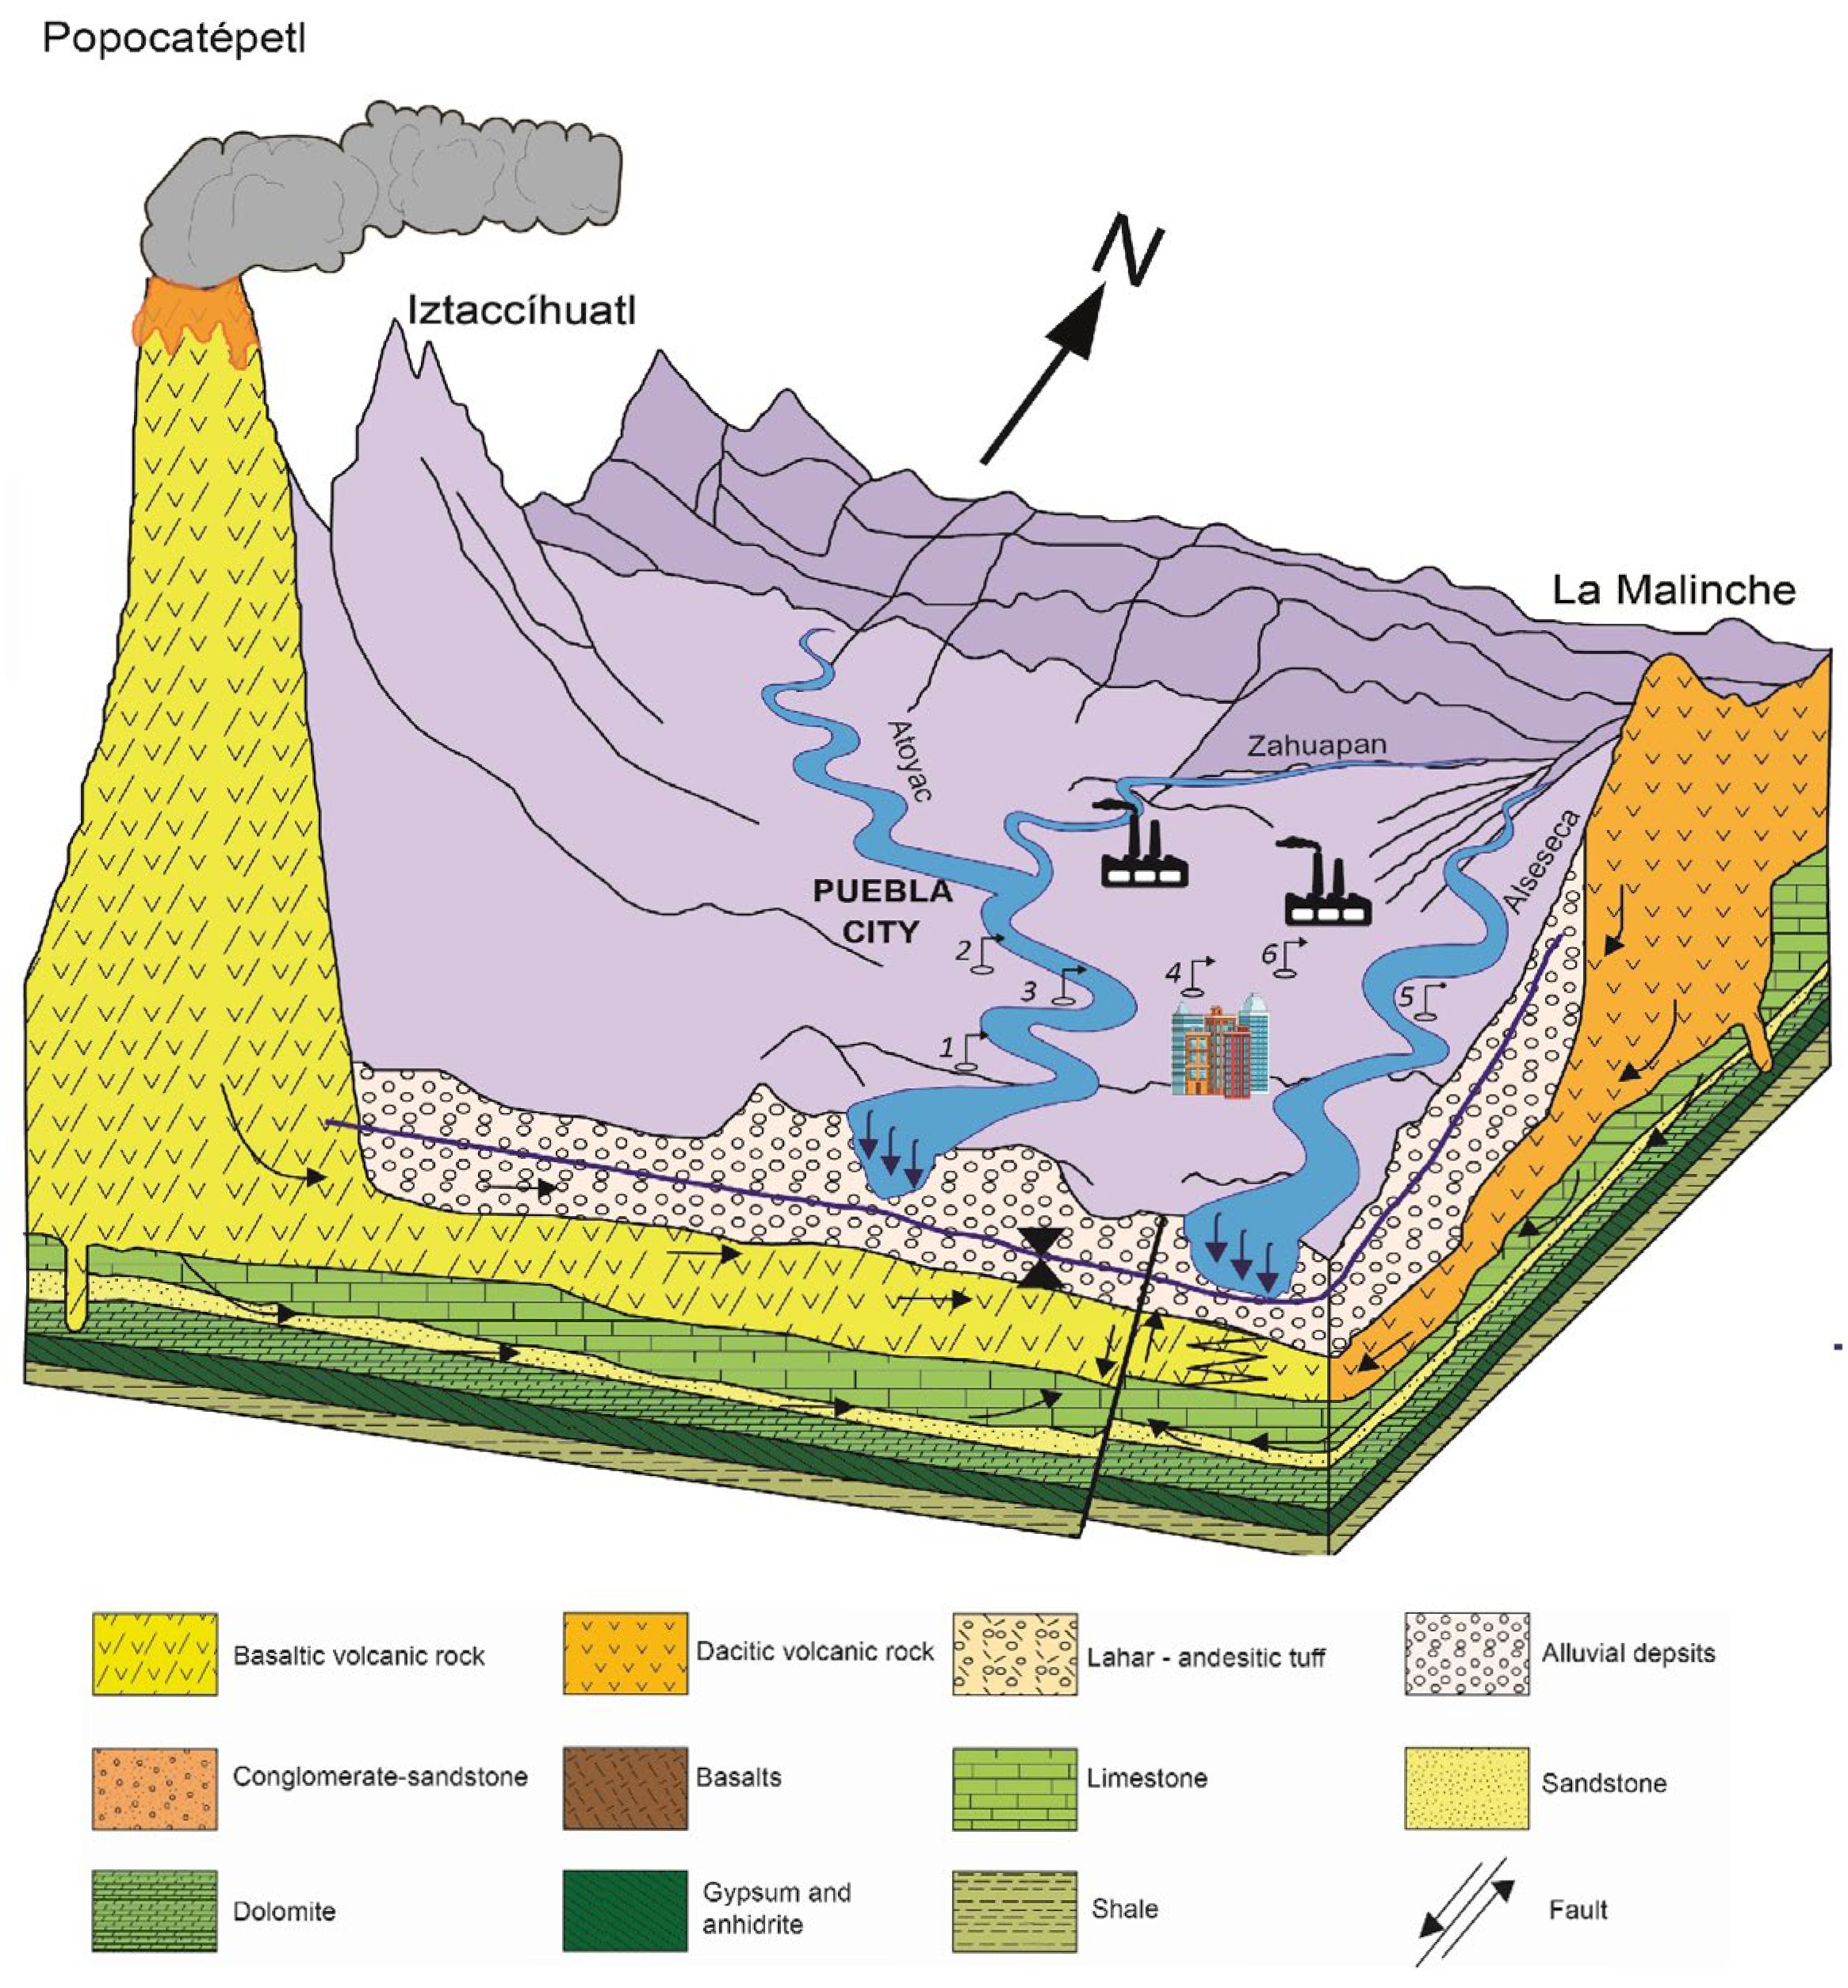
Groundwater is the primary source of water supply in the PMA. Intensive extraction of groundwater has led to a decline in groundwater levels and changes in water quality [26,27,30,38]. The hydrogeological system contains three aquifers and an aquitard, as shown in Figure 2. The upper aquifer involves granular deposits and fractures in Quaternary rock formations; it is formed by sediments and rocks that come from the surrounding volcanoes (lava flow, pyroclastic deposits, and tuffs). This upper aquifer hydraulically functions as an unconfined unit and in some areas like a semi-confined aquifer [26,30,38]. The piezometric head distribution for the upper aquifer shows two recharge zones, coming from Iztaccihuatl and Popocatépetl Volcanoes on the north-western side of the valley and from the La Malinche Volcano on the north-eastern side of the valley [38].
The middle aquifer is confined with middle to low hydraulic conductivities due to its secondary permeability. Rocks composing this include basalts, andesites, conglomerates, and ignimbritic tuffs of the Balsas Group. The underlying aquitard functions as an almost impermeable unit, connecting the middle and deep aquifers through fractures, and is composed of shales and interfingered marls and limestones. The deep aquifer is mainly formed by limestone, sandstone, and some shale layers of the Tecomasuchil and Atzompa Formations, and dolomite, sandstone, evaporites, and shales of the Tecocoyunca Group of Cretaceous Age [30,38].

2.2. Sampling and Analysis

A water sampling campaign was performed to collect detailed groundwater and river water information, including on-site physicochemical data and chemical analyses of major components and environmental isotopes. Twelve water samples were collected, four from the river (surface water) and eight from the wells (groundwater), according to the protocols explained in the norm NOM-230-SSA1-2002 [39] in compliance with APHA, AWW, and WEF guidelines [40]. The results of previous studies [26,27,30,38] allowed us to select the sampling points most representative of the conditions existing in the study area (wells near rivers, wells located in areas affected by industrial activity, and sampling points in rivers near discharge points). Temperature, dissolved oxygen (DO), electrical conductivity (EC), pH, oxidation-reduction potential (ORP), and total dissolved solids (TDS) field measurement of water samples were performed during sampling using a Hanna multi-parametric electrode probe. For each site, six water samples were taken: one to analyze anions, one to measure cations and PTEs, one for total alkalinity and total hardness, one collected in a sterile plastic bag for coliforms, and one more for environmental water isotopic analysis.
The samples of cations and PTEs were filtered through a 0.40–0.45 μm diameter of nitrocellulose membrane and were acidified to pH < 2 with HNO3 at the time of collection, the anion samples were filtered through 0.40–0.45 μm nitrocellulose membrane, without acidification, all the samples were stored at a temperature of 4 °C. Cations and anions were analyzed by Thermo Fisher Scientific (Waltham, Massachusetts, USA) Inductively Coupled Plasma-Optical Emission Spectrometry (ICP-OES) Thermo iCAP 6500 Duo and Thermo Fisher Scientific (Waltham, Massachusetts, USA) High-Performance Liquid Chromatography (HPLC) with a Dionex ICS-1100 brand chromatograph at the Laboratory of Geosciences of the National Autonomous University of Mexico. The detection and quantification limits are shown in Table 1. Analytical blanks were implemented throughout the field campaign and analytical process. Replicate samples and standards were processed to determine the precision, and spiked samples were employed to determine accuracy. Total alkalinity, total hardness, and fecal coliforms were analyzed by conventional techniques, such as Titration and the Most Probable Number test (MPN), in the Water Quality Laboratory of the Mexican Institute of Water Technology (IMTA). The charge balance error (CBE) for the samples analyzed ranged from 0.75% to 5.48%, indicating acceptable analytical accuracy (see Table 1).

2.3. Isotopic Analysis Methods

The water samples were taken and stored at a temperature of 4 °C for study of δ2H, δ18O and 3H, the analysis were conducted in the laboratory of Isotopic Hydrology at the Mexican Institute of Water Technology by Laser Absorption Spectroscopy technique using a Cavity Ringdown Spectrometer model L2110-i Picarro for δ2H and δ18O and a Liquid Scintillation Spectrometer model Quantulus GCT 6220 following the protocols of the International Atomic Energy Agency (IAEA) and National Institute of Standards and Technology for 3H. The error associated with the oxygen was ±0.05 and ±0.1 for deuterium, for the tritium measurements correspond to 1σ, and the detection limit of the used methodology was ±0.6 UT. Isotopic data of δ18O and δ2H of the present study were compared to the isotopic data of pumping wells and springs reported by Garfìas et al. [30] using the Global Meteoric Water Line (GMWL) of Craig et al. [44]. Mixing between the groundwater and surface water for both O and H isotopes is calculated with the following equation.
( δ 18 O s a m p l e δ 18 O g w ) δ 18 O s w δ 18 O g w 100 = s u r f a c e   w a t e r   %
where δ 18 O s a m p l e , δ 18 O g w ,   and   δ 18 O s w are the delta values of the sample, the groundwater reference sample, and the surface water reference sample, respectively. The average value of the calculation results for oxygen and hydrogen is then used as the mixing percent for each separate sample.

2.4. Data Processing, Water Quality Assessment, and Spatial Analysis

The Geochemist’s Workbench (GWB) model was used to identify reaction pathways and water mixing by constructing Piper and Ternary diagrams [45]. The software provides a clear visualization of the hydrochemical facies and interaction processes. Groundwater quality was assessed according to criteria established for human use and consumption by Mexican standards NOM-127-SSA1-1994 [41] and the World Health Organization [42]. The river water was assessed with the Mexican Ecological Criteria of Water Quality for Aquatic Life Protection (ALP) [43]. The PTEs, like arsenic, chromium, lead, and zinc concentrations, were spatially interpolated to create interpolated predicted maps of the concentrations. The interpolated maps and a geostatistical analysis were generated using Kriging spatial interpolation method with an exponential model and omnidirectional variogram (nugget from 0.25 to 0.93, sill from 0.14 to 0.74, and range from 7983 to 23,516 m) in ArcGIS (version 9.3).

3. Results and Discussion

3.1. Water Quality and Hydrochemical Composition

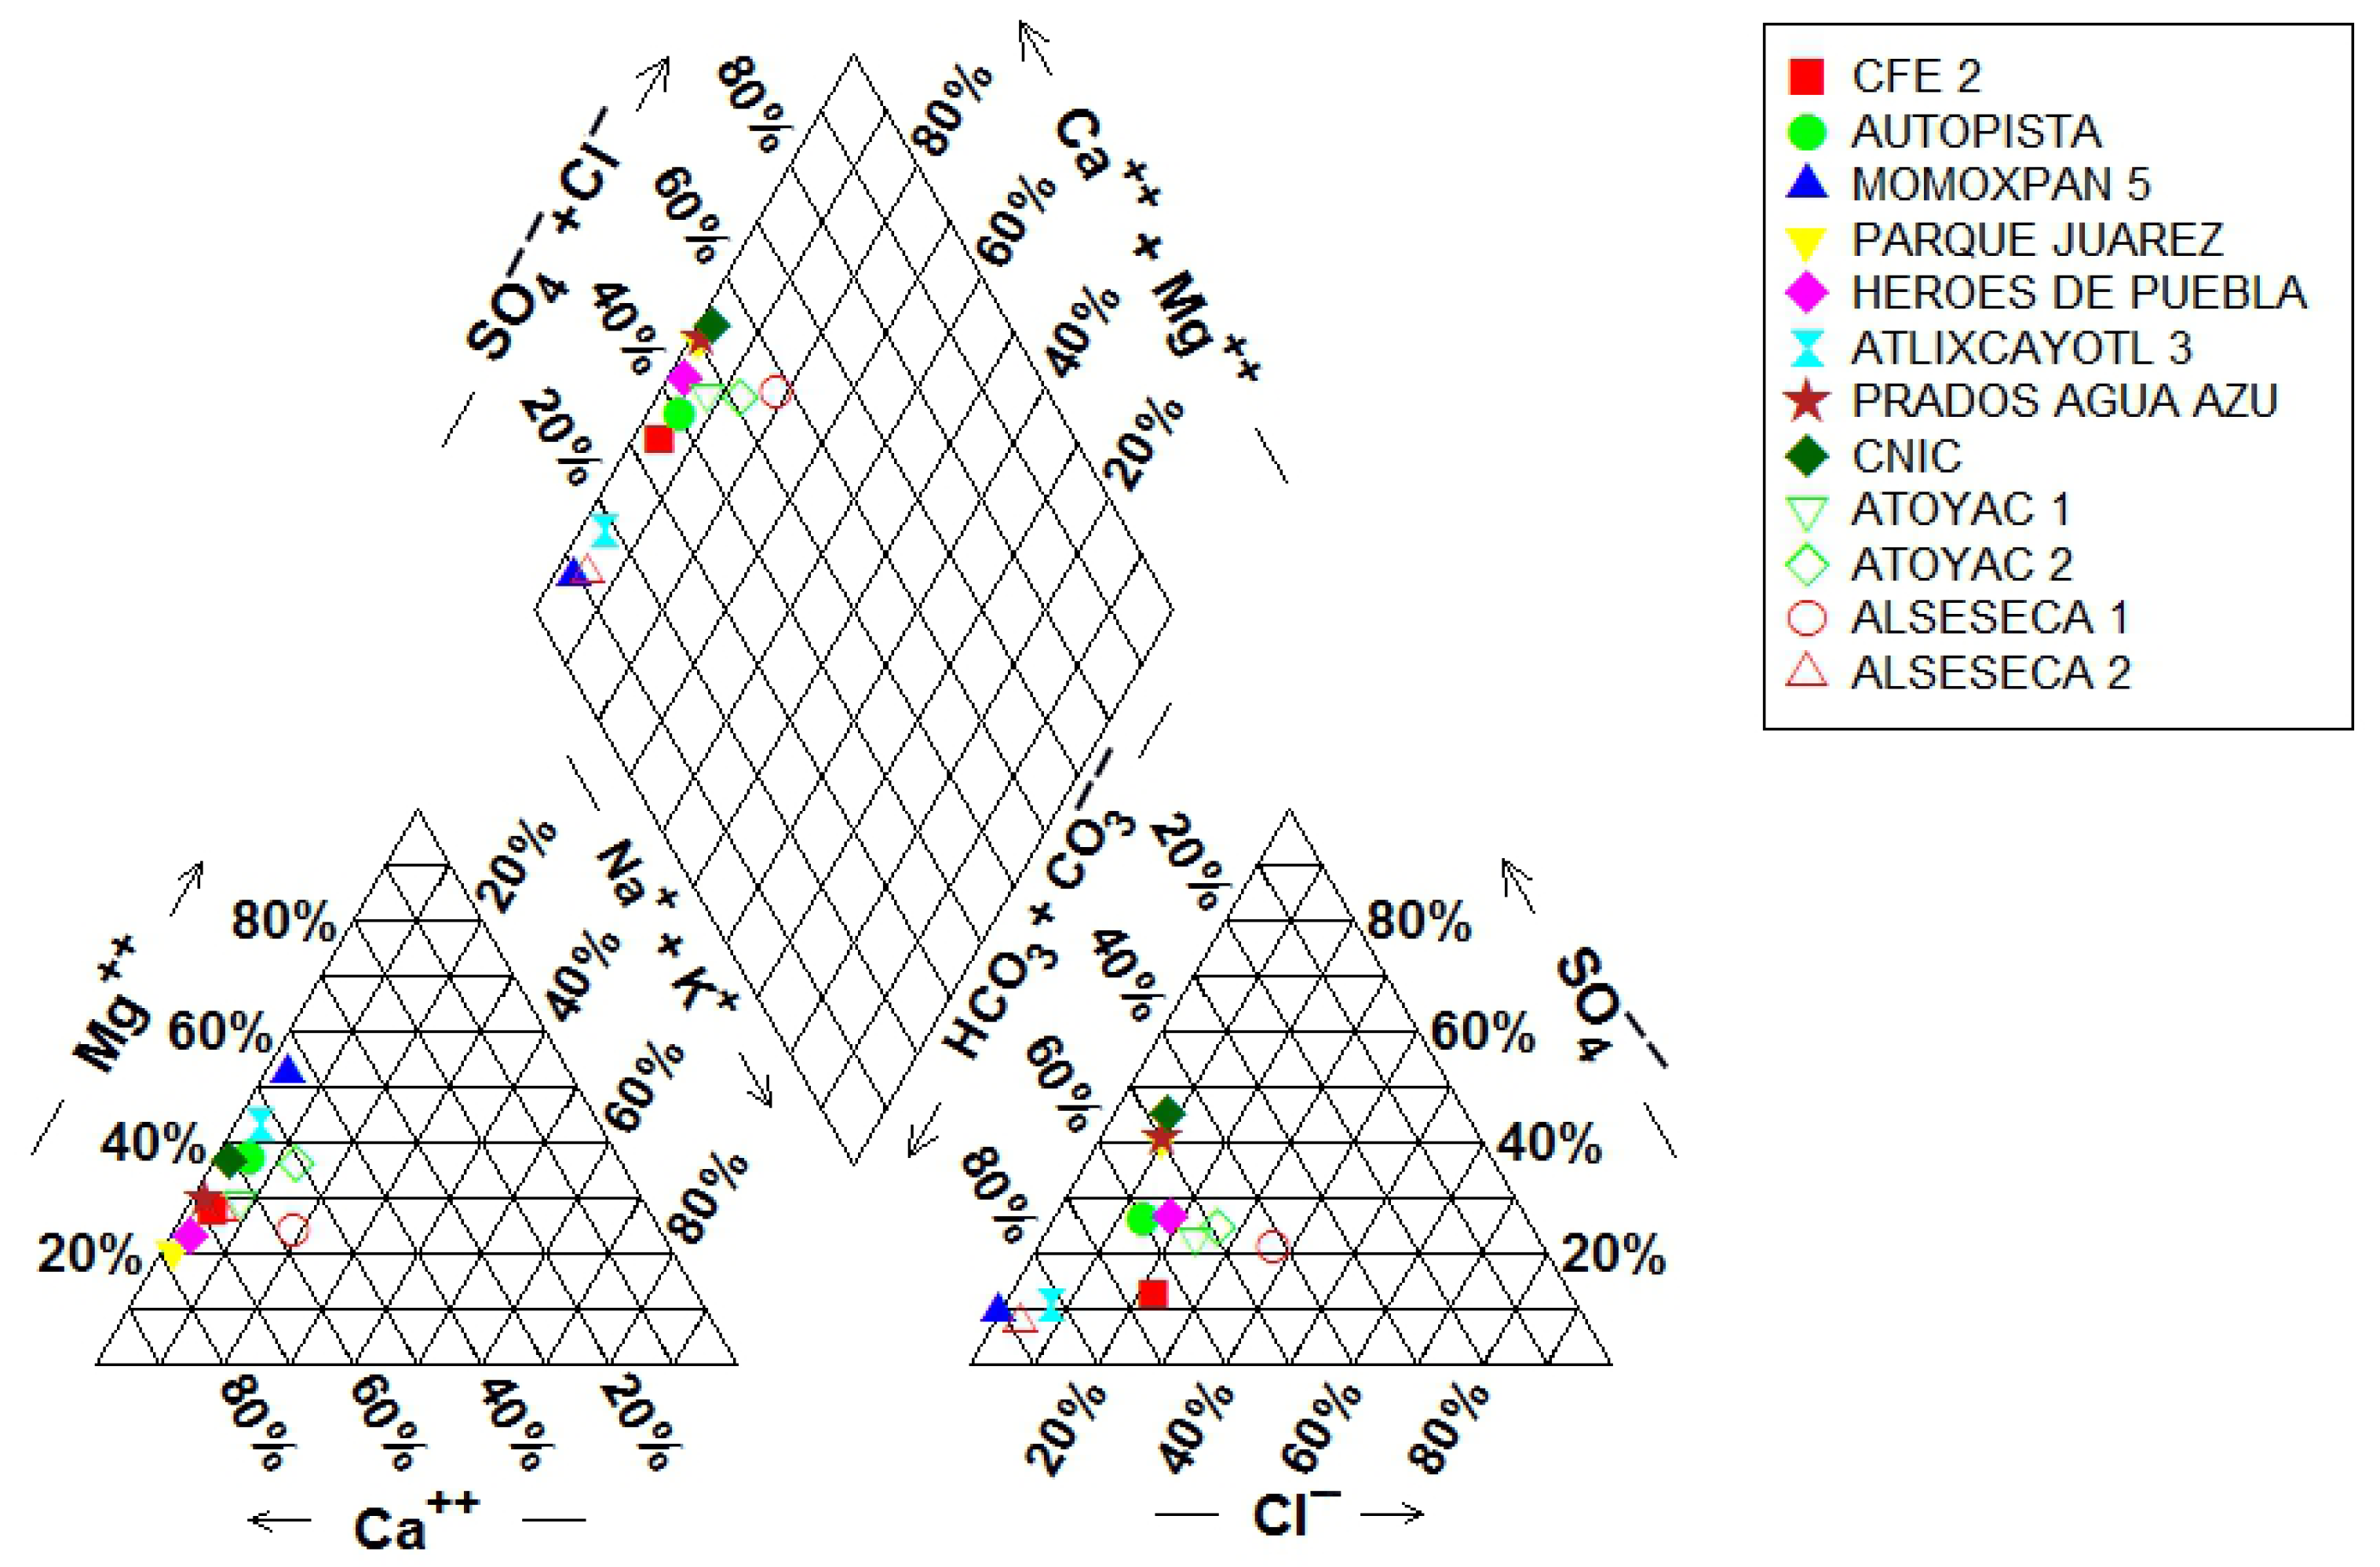
The hydrochemical and isotopic characteristics of groundwater and surface water samples are presented in Table 1. The predominant hydrochemical facies is the Ca-HCO3 type, although some groundwater samples exhibit Mg-HCO3 and SO4-HCO3 signatures (Figure 3), reflecting variations in lithological composition and water–rock interactions. Surface waters exhibited alkaline pH values ranging from 7.7 to 8.4, while groundwater samples showed a broader pH range from 6.7 to 8.0. Electrical conductivity (EC) varied between 485 and 3614 µS·cm−1 in surface waters and between 591 and 4311 µS·cm−1 in groundwater, indicating moderate to high mineralization. Total dissolved solids (TDS) in surface waters ranged from 242 to 1808 mg·L−1, whereas in groundwater they varied from 296 to 2156 mg·L−1. Notably, four groundwater wells exceeded the maximum permissible limit of 1000 mg·L−1 established by both the Mexican standard and WHO guidelines for drinking water [41,42]. The concentrations of major cations (Ca2+, Mg2+, K+, Na+) in surface water ranged from 38–273.6 mg·L−1, 9.6–110.3 mg·L−1, 5.3–37 mg·L−1, and 11.4–264.1 mg·L−1, respectively. Groundwater samples presented similar concentration ranges: 39–274 mg·L−1 for Ca2+, 9.5–110.3 mg·L−1 for Mg2+, 5.3–23.1 mg·L−1 for K+, and 11.4–119.0 mg·L−1 for Na+, all of which fall below the 200 mg·L−1 guidelines for sodium in drinking water.
The SO42− concentration in surface water ranged from 31.7 to 182.8 mg L−1 above the limit for protection of aquatic life of 0.005 mg L−1 in all samples, while groundwater varied from 18.7 to 622.9 mg L−1. Only in two wells, Prados Agua Azul and CNIC (samples 3 and 7), do the levels exceed the limit of 400 mg L−1of the Mexican standards for human consumption. The concentrations of Cl in groundwater ranged from 0.12 to 88.9 mg L−1, while in surface water, they ranged from 14.0 to 48.9 mg L−1. All values fell within the limits of the Mexican criteria for human consumption and aquatic life protection, respectively. The NO3- in the samples was below the established limits by the Mexican and WHO criteria (44 and 50 mg L−1, respectively) and the aquatic life protection limit of 50 m gL−1 (Table 1). Groundwater levels ranged from 1 to 86.3 m gL−1, and surface water levels ranged from 3 to 20.5 mg L−1.
Fecal coliforms were detected in both groundwater and surface water samples. In groundwater, fecal contamination was observed in only three wells—Momoxpan, Parque Juárez, and Heroes de Puebla (samples 5, 8, and 6)—where concentrations exceeded the recommended absence criterion established by the Mexican drinking water standard and the WHO guidelines [42]. Conversely, all river water samples exhibited fecal coliform levels far above the permissible threshold of 200 MPN/100 mL set for the protection of aquatic life, reflecting a critical level of microbiological pollution in the surface water system.

3.2. Potentially Toxic Elements (PTEs) and GW–SW Interactions

Most of the collected samples, both from groundwater (wells) and surface water (rivers), exhibited detectable concentrations of Al, As, Ba, Cr, Cu, Fe, Li, Mn, Ni, Si, Sr, V, and Zn (Table 2). Several of these samples exceeded the permissible limits established by Mexican and WHO drinking water guidelines [43,44], as well as the criteria for the protection of aquatic life, primarily due to the presence of PTEs. Specifically, groundwater samples 2, 4, 6, and 8 surpassed the guideline values for As (0.025 mg L−1), B (0.3 mg L−1), Pb (0.01 mg L−1), and Mn (0.15 mg L−1), respectively. In the Alseseca and Atoyac Rivers, concentrations of Al (0.05 mg L−1), Ba (0.01 mg L−1), Cu (0.01 mg L−1), Fe (1 mg L−1), and Zn (0.02 mg L−1) exceeded the aquatic life protection thresholds in nearly all samples. In contrast, Pb concentrations exceeded the guideline in only two river samples (0.03 mg L−1).
Industrial activity in the Puebla Metropolitan Area (PMA) is diverse and intensive, encompassing metallurgy (43%), machinery and heavy equipment, the food sector (25%), textiles (14%), clothing, leather, chemicals (10%), oil, rubber, plastics, and wood-based products (3%), with other sectors contributing the remaining 1% [27,29]. The region hosts five industrial parks, making it one of the most important textile hubs in Latin America and a major center for automobile manufacturing. The presence of PTEs such as As, Cr, Pb, and Zn in the area originates from both natural sources—primarily rock weathering and volcanic emissions—and anthropogenic inputs from industrial processes.
Arsenic (As) has a geogenic origin linked to volcanic activity and is associated with mineralized zones rich in sulfates. Salinization processes promote arsenic mobilization through ion exchange processes [27,29,46,47,48,49]. Chromium (Cr) was found in both supply wells and surface water, mainly as Cr (VI), though concentrations remain below regulatory limits [47,48,49]. Its environmental accumulation is primarily attributed to untreated industrial discharges [29]. Lead (Pb) was detected in all samples (groundwater and surface water), reflecting strong anthropogenic influence and high toxicity [28,50]. Zinc (Zn) is present in both surface and groundwater, originating from industrial activities and natural leaching [51]. Boron (B) concentrations in the PMA ranged from 0.03–1.99 mg L−1 in groundwater and 0.04–0.38 mg L−1 in surface water, with volcanic emissions as the dominant source [29,52,53,54]. Manganese (Mn) and iron (Fe) showed higher concentrations in deep aquifers due to water–rock interaction, while elevated Fe in surface waters likely results from wastewater discharges [29,53]. Aluminum (Al) was only found in surface waters, linked to lithogenic inputs and industrial effluents [27,29,33,55]. Barium (Ba) occurs in both groundwater and surface waters, derived from volcanic and sedimentary rocks (e.g., limestones and sandstones) with additional contributions from industrial activities [26,53]. This dual origin evidence the complexity of water quality in the region, where both geological processes and human activities interact.
The concentrations of PTEs like As, Pb, Cr, and Zn were higher in surface waters than in groundwater, indicating contamination that originates at the surface and gradually infiltrates into the aquifer. Interpolated concentration maps for these metals exposed clear spatial patterns consistent with dual origins: elevated As near volcanic zones, reflecting geogenic contributions (e.g., ash from volcanic eruptions of Popocatepetl volcano), and higher Pb, Cr, Zn, and Fe nearby industrial parks (e.g., metallurgy, textiles, and automotive manufacturing industries), represent anthropogenic contributions (Figure 4). These results underline the combined influence of volcanic activity and industrial discharges on water quality in the PMA. Additionally, they highlight the vulnerability of the aquifer system to surface-derived pollution, mainly where faults, fractures, and recharge zones coincide with intense industrial activity.
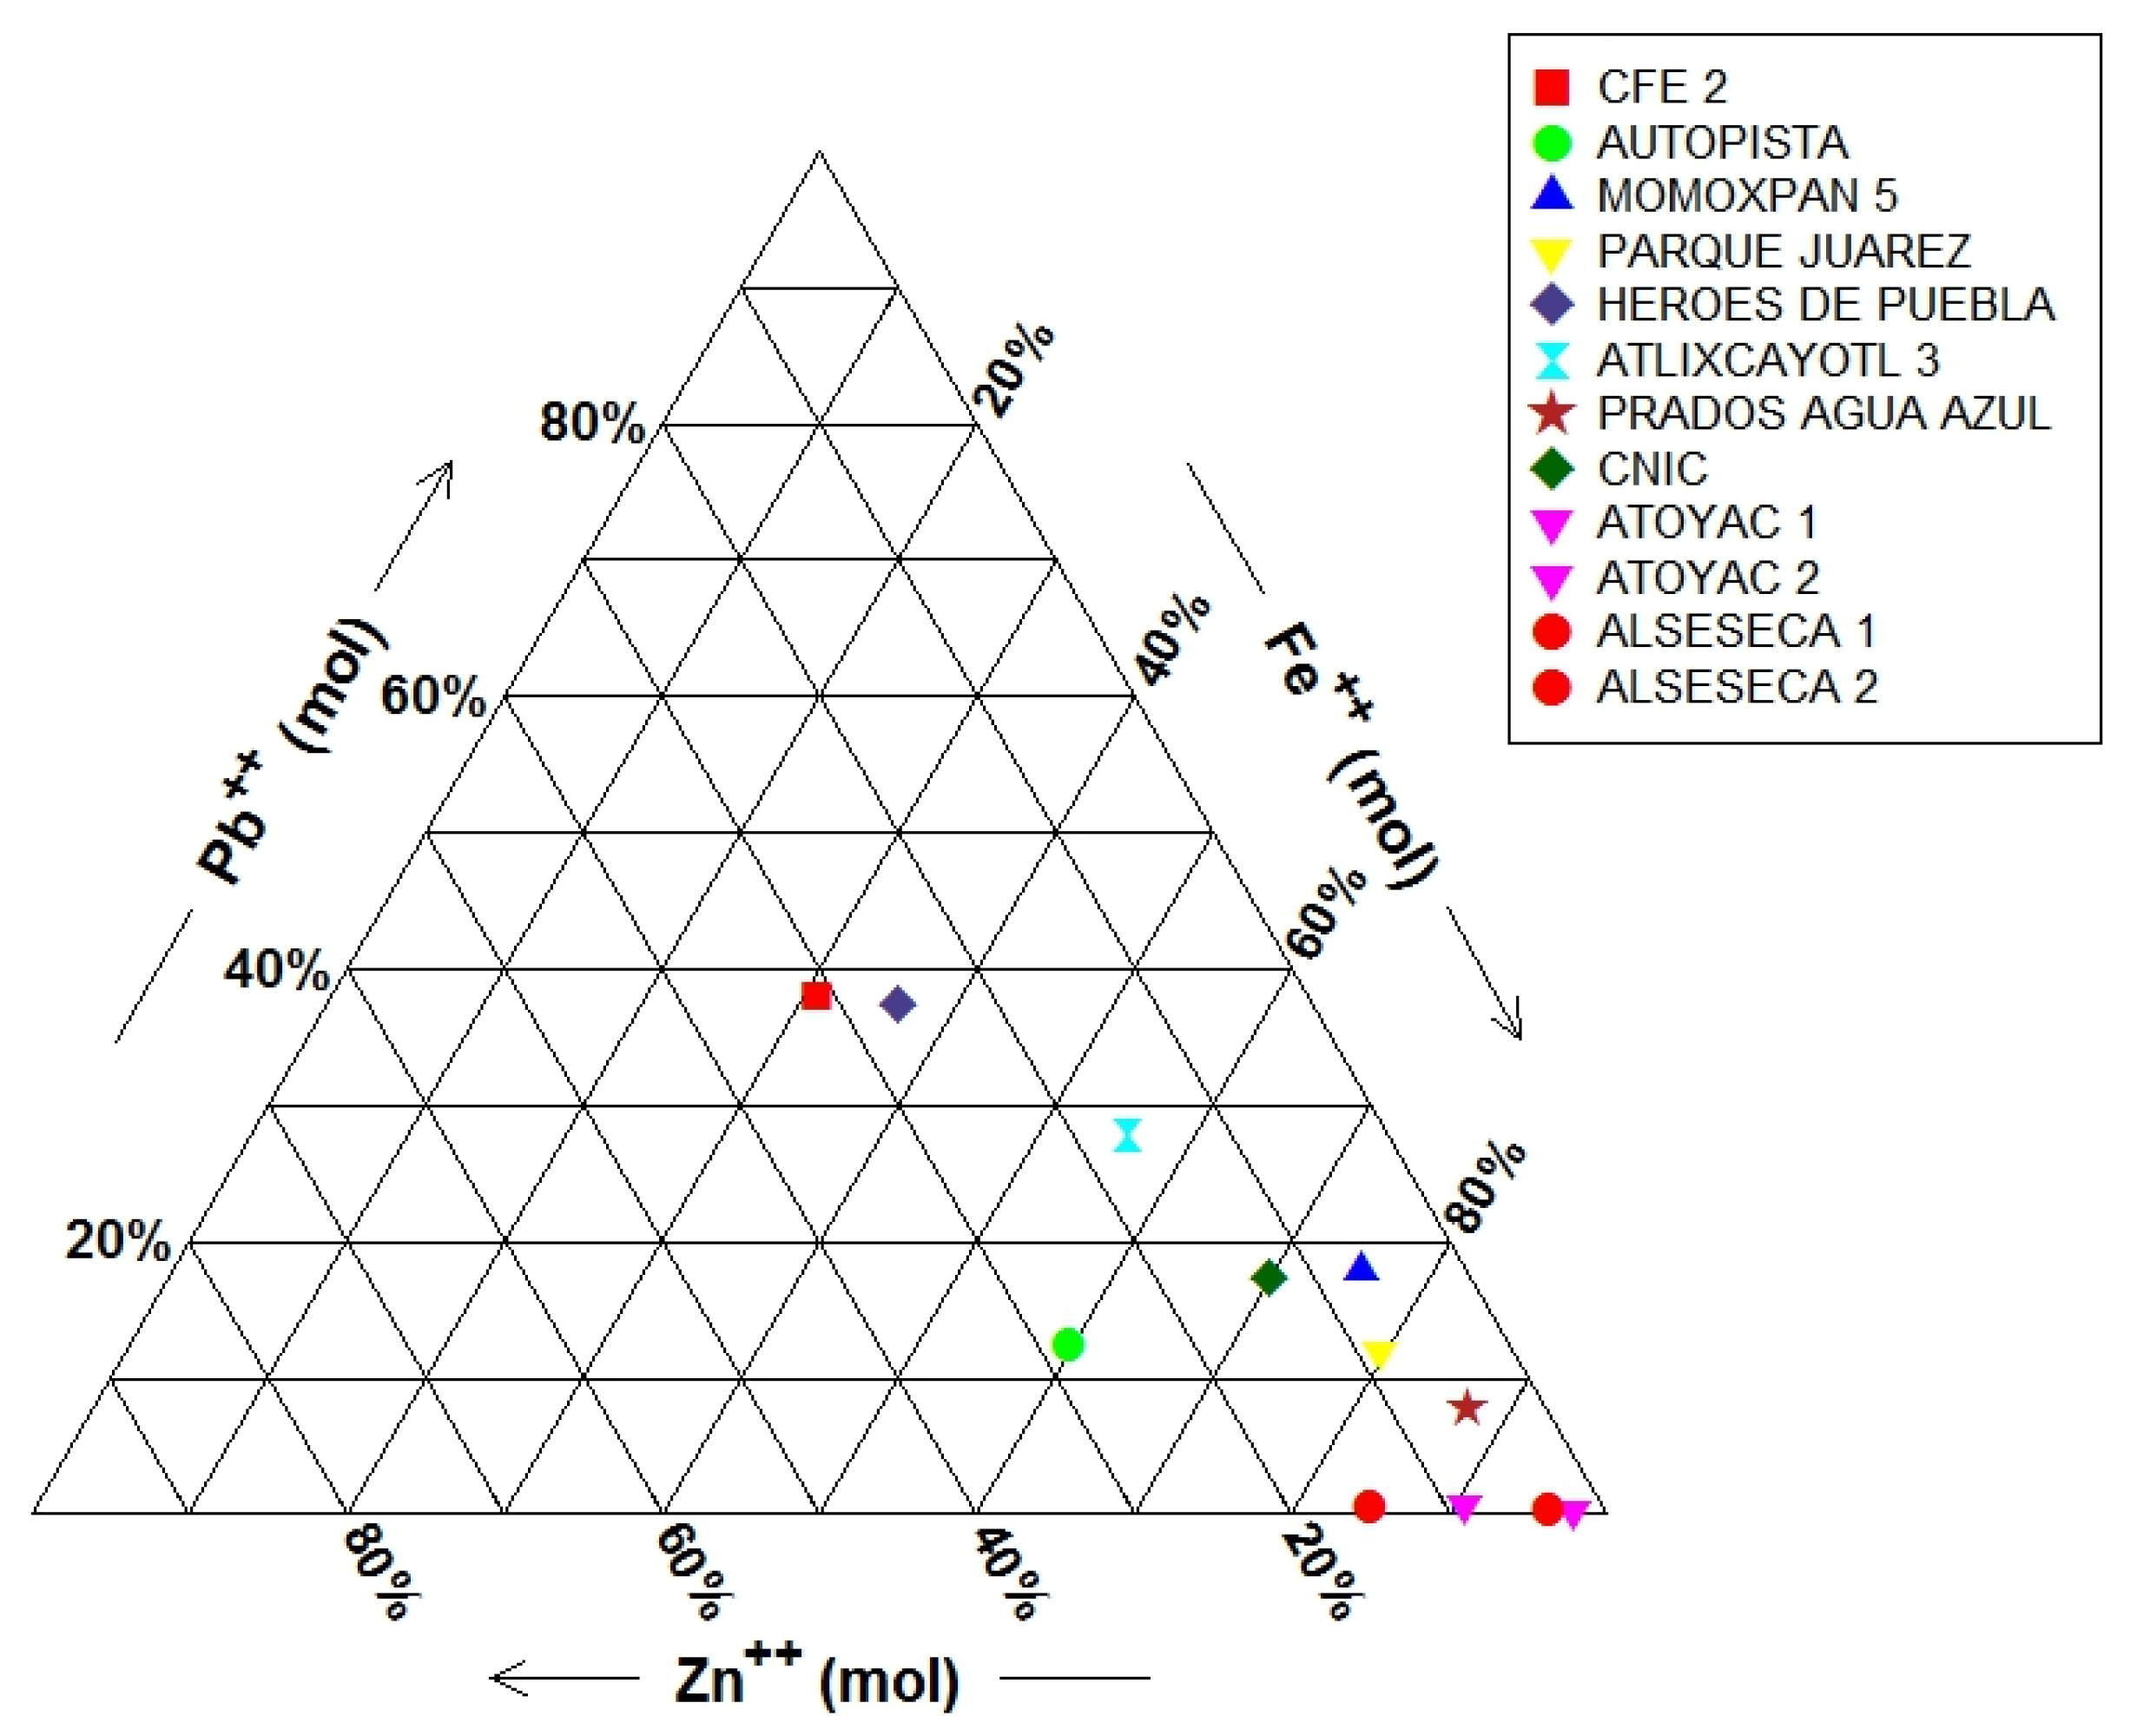
The ternary Pb–Fe–Zn diagram showed Fe as the dominant component in most supply wells, particularly Atlixcáyotl, Autopista, CNIC, Momoxpan, Parque Juárez, and Prados Agua Azul, where it exceeded 50%. In contrast, only the CFE and Héroes de Puebla wells revealed notable Pb contributions (≈40%), suggesting localized anthropogenic influence or variable redox conditions (Figure 5).

3.3. GW–SW Interaction and Residence Time

3.3.1. Isotopic Composition

Hydrochemical analyses and environmental isotopes were conducted to assess the GW–SW interaction; these have been used effectively by different authors [11,17,56,57,58]. Isotopic data from groundwater allows the identification of sources of water and solutes, identifying geochemical reactions [58,59]. The stable isotopes of hydrogen (deuterium, D or 2H) and oxygen (oxygen-18 or 18O) are influenced by processes that affect water, rather than solutes. They can identify water that has undergone evaporation, recharge in different climatic conditions than current conditions, and the mixing of water from different sources [56,57,58,59].
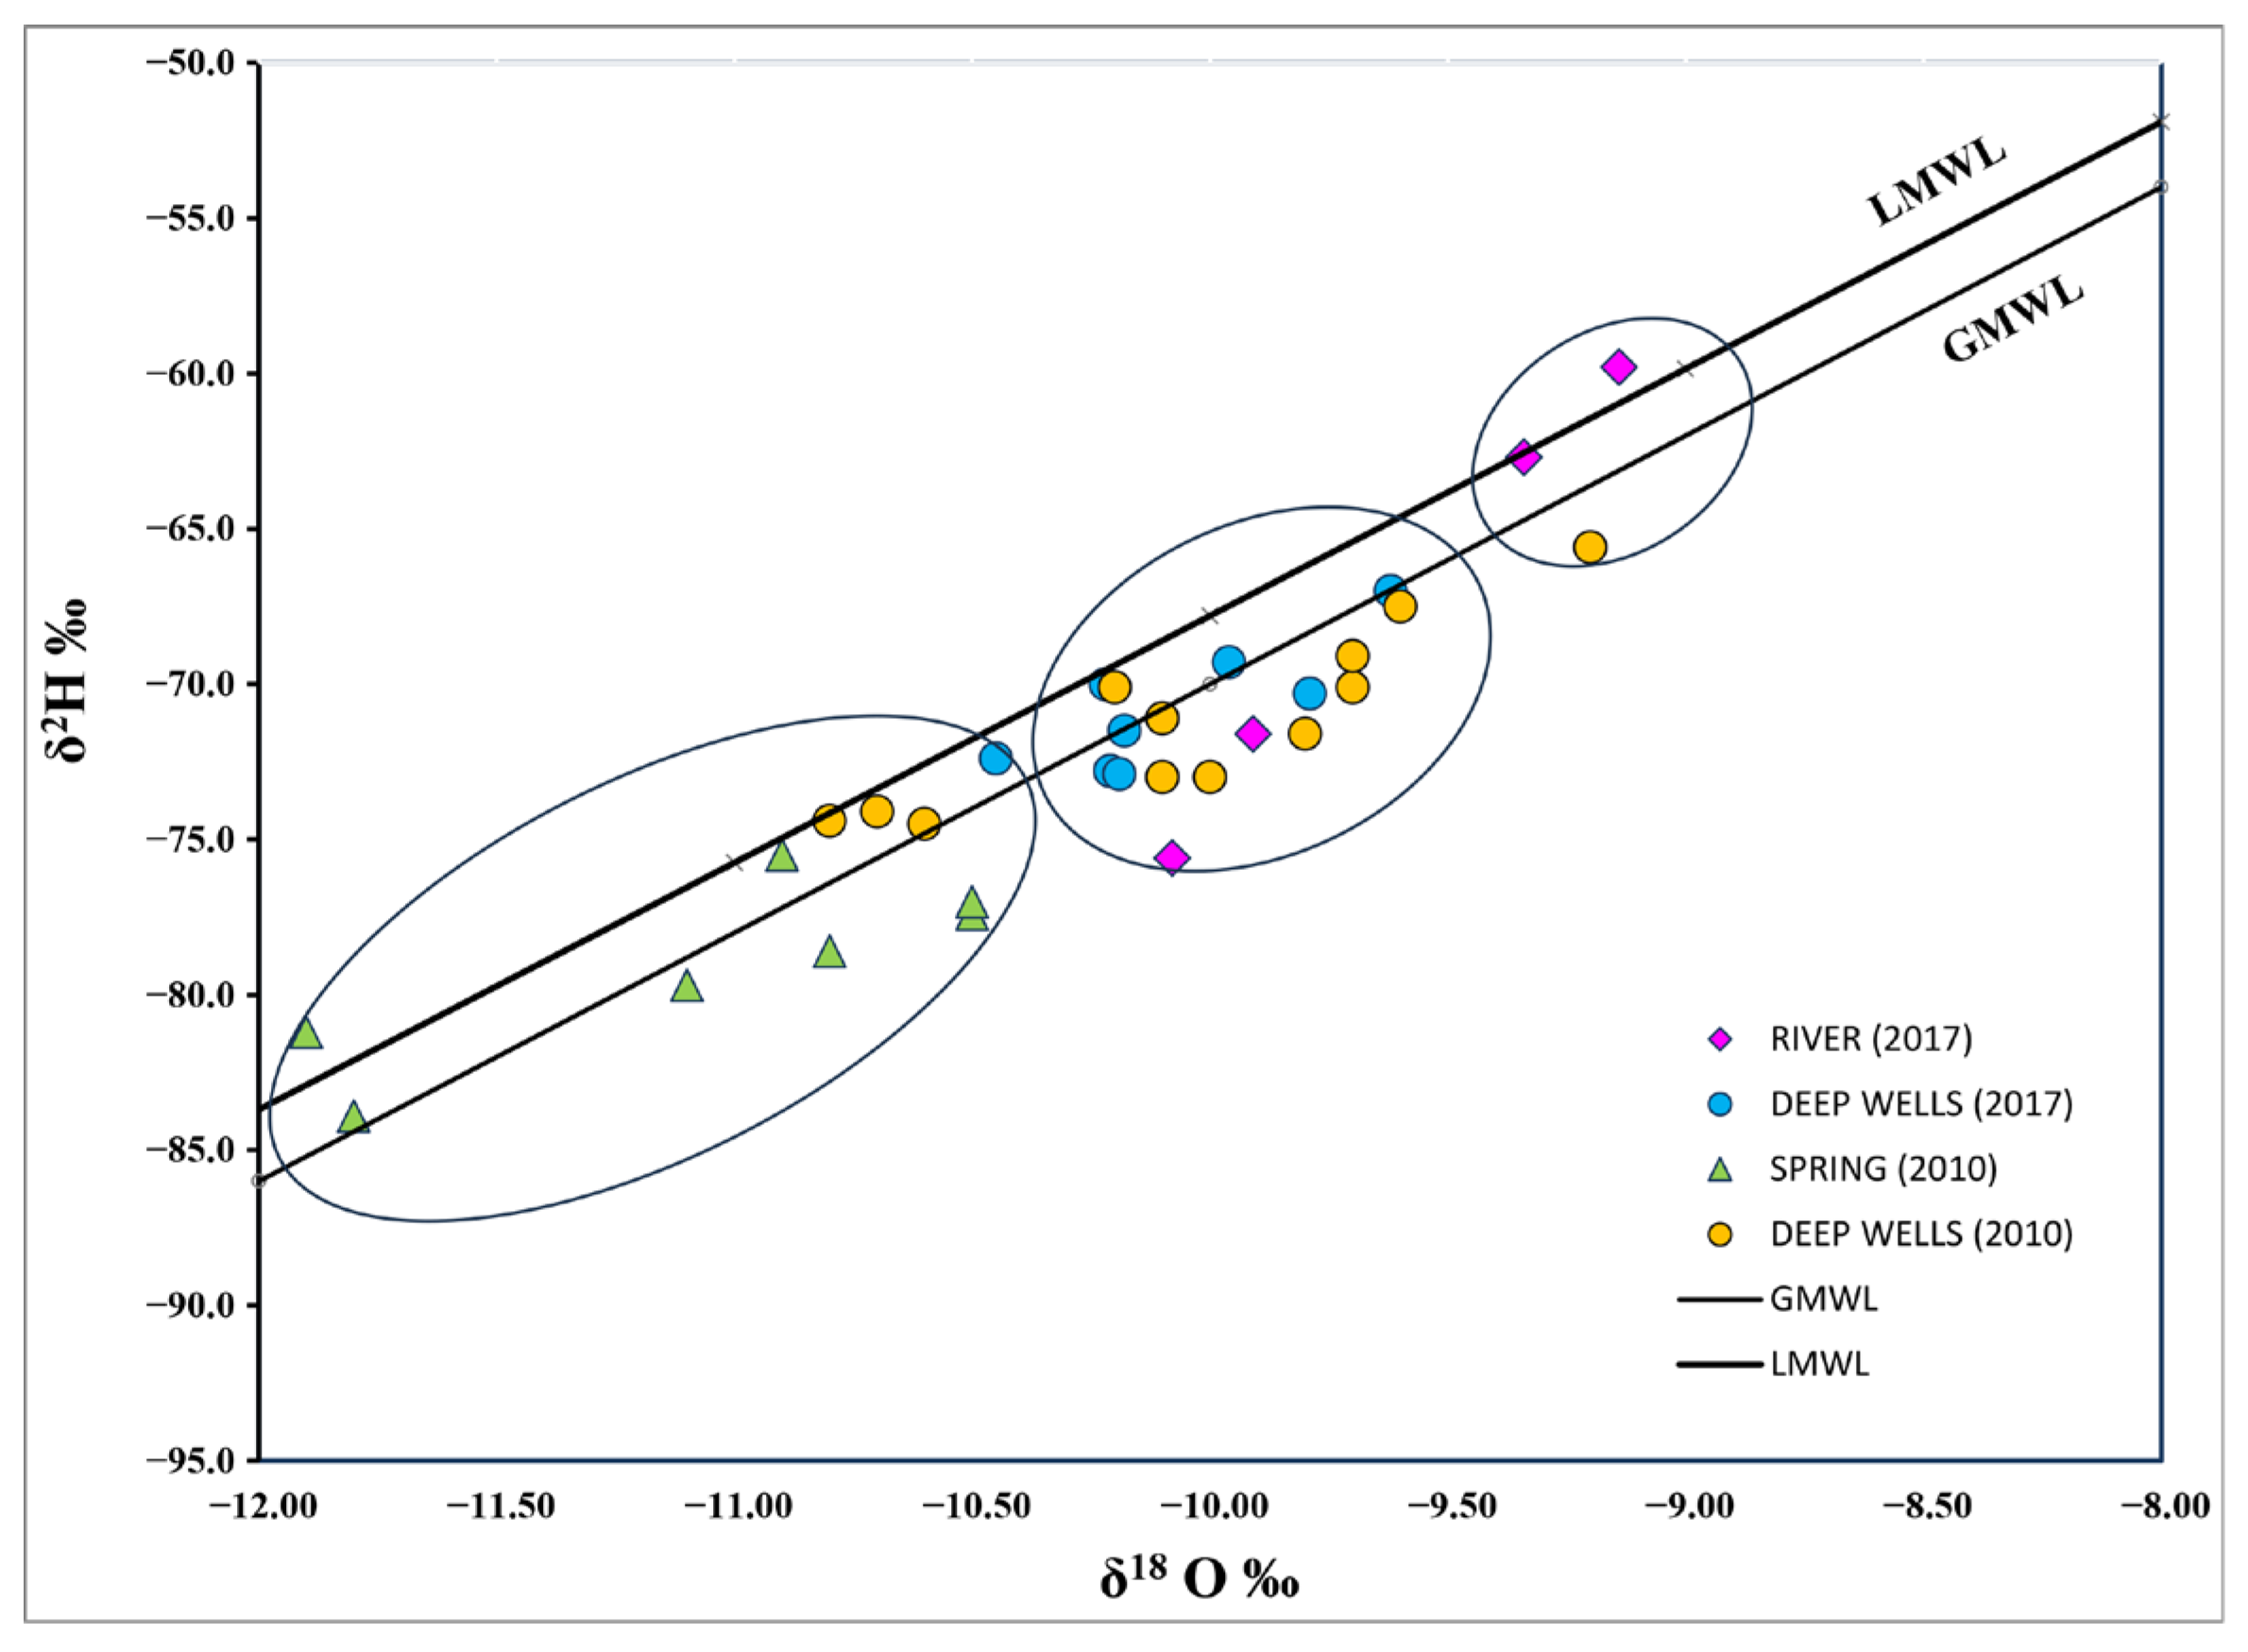
Isotopic analysis δ18O and δ2H indicate that the groundwater comes from the rain in the recharge area at a higher altitude, and water with experienced some degree of isotopic fractionation by atmospheric evaporation in some samples at lower altitudes. The isotopic composition of 18O and 2H analyzed in the present investigation (2017) was compared to the isotopic composition of groundwater reported by Garfìas et al. [30] and summarized in Table 3. The samples were plotted (Figure 6) along the Global Meteoric Water Line (GMWL), δ2H = 8 δ18O + 10 [44] and the Local Meteoric Water Line (LMWL) for the central region of Mexico, δ2H = 7.95 δ18O + 11.7 [57].
In Figure 6, three groups can be observed. The first group includes springs and some deep wells (samples 16, 23, 25, 26, and 27, 2010 sampling). The δ2H and δ18O composition indicates the presence of meteoric water with low evaporation, and the water is isotopically heavy because it was recharged from precipitation in higher elevations by the thaw on the volcano’s slopes. The wells in this group have a similar isotopic signature, which indicates that the groundwater of the deep aquifer was recharged at these altitudes. Present concentrations of 3H (Table 3), SO42−, and B (Table 1 and Table 2) confirm its route through the deep parts of the aquifer and the influence of volcanic activity.
The second group includes groundwater from wells and surface water from the Alseseca and Atoyac rivers. The stable isotope values of δ2H and δ18O (Table 3) suggest that these waters are of meteoric origin, recharged at intermediate altitudes. The isotopic composition observed during 2010 (samples 1, 2, 6, 7, 8, 13, 15, 18, 19, and 20) and 2017 (samples 1 to 8) samplings indicates a mixture between surface waters and downgradient groundwater. These δ2H and δ18O signatures reflect river–aquifer interactions, where surface water from the Alseseca and Atoyac rivers infiltrates and mixes with groundwater within the regional fracture systems trending NW–SE, which cut across the PMA. This hydrogeological connection is supported by the presence of PTEs (Pb, Fe, and Zn) detected both in the surface waters and water supply wells (130–195 m), further indicating vertical and lateral connectivity between these systems (Table 3).
The third group corresponds to rainwater infiltration from lower topographic areas near the Alseseca and Atoyac rivers, which has undergone evaporation prior to infiltration. The isotopic signatures in this group are consistent with recharge from low altitudes (~2000 masl), exhibiting more enriched δ18O and δ2H values due to evaporative effects. To further distinguish between hydrological processes affecting groundwater and surface water, the relationship between chloride concentration (Cl) and δ18O was analyzed. This approach has been used in various hydrogeochemical studies to detect mixing and evaporation processes [58,59]. As shown in Figure 7, the spatial distribution of the data reveals evidence of mixing processes between wells located near the Alseseca and Atoyac rivers, particularly those influenced by regional faults and fractures. Wells 3, 6, and 8 are located near the Atoyac River and show isotopic and chemical signatures indicative of river influence. Well 7, positioned near both a geological fault and the Atoyac River, exhibits similar mixed characteristics. Wells 4 and 5 are under the influence of the Alseseca River and major structural features, suggesting a strong interaction with surface waters through fault-mediated infiltration pathways (Figure 1). These findings highlight the importance of structural geology in facilitating river water infiltration into the aquifer system and emphasize the need to consider fault zones as preferential recharge pathways in urbanized volcanic basins.
Mixing calculations indicate varying proportions of groundwater and surface water in the wells influenced by the Alseseca and Atoyac Rivers. For wells 3 and 6, located near the Atoyac River, the mixture was composed of approximately 82% GW and 18% SW. In well 8, the contribution increased to 60% GW and 40% SW, while well 7 showed a nearly equal contribution of 50% GW and 50% SW, indicating a strong hydraulic connection with the Atoyac River. Regarding the Alseseca River, well 5 exhibited a mixing ratio of 75% GW and 25% SW, and well 4 showed 61% GW and 39% SW. These results suggest that a significant proportion of surface water—potentially impacted by contamination—can infiltrate and mix with the underlying groundwater system, emphasizing the vulnerability of the aquifer to surface-derived pollutants.
Several hydrogeological and anthropogenic factors facilitate the infiltration of river water into the aquifer. The presence of fault and fracture systems (NW–SE) serves as a preferential flow path, enhancing vertical and lateral connectivity between surface and subsurface hydrological systems. The hydraulic gradients induced by groundwater extraction can promote the downward movement of contaminated surface water into deeper zones, especially in areas where pumping wells penetrate multiple aquifer layers [26]. The spatial configuration and depth of well screens play a critical role in determining the extent of river water intrusion. Wells located near structural discontinuities or in zones of significant drawdown exhibit greater susceptibility to surface water mixing (Figure 8). This GW–SW interaction is evidenced not only by isotopic signatures but also by hydrochemical changes in the groundwater, particularly the presence of anthropogenic contaminants such as Pb, Zn, and Fe, commonly found in both surface waters and adjacent wells. The alteration of groundwater chemistry reflects mixing processes, redox conditions, and mineral dissolution/precipitation reactions triggered by the introduction of surface water.
Moreover, the vulnerability of groundwater in the PMA is amplified by the interplay between natural recharge–discharge dynamics and anthropogenic activities. When river water affected by urban and industrial pollution infiltrates through fractured media or poorly protected recharge zones, it can degrade the chemical quality of the aquifer [23]. It highlights the need for integrated management strategies that consider the hydraulic connectivity between surface and groundwater systems, especially in urban volcanic basins where geological complexity and intensive water use coexist.

3.3.2. Tritium (3H)

Tritium (3H) is a powerful environmental tracer for identifying modern groundwater recharge. Its presence in groundwater is primarily attributed to historical atmospheric nuclear weapons testing, which began in 1952 and peaked between 1963 and 1964, causing a sharp global increase in tritium levels in precipitation. As a result, measurable concentrations of 3H in groundwater indicate recharge events after 1952, while its absence suggests recharge occurred prior to that date [19,60]. Due to its relatively short half-life of 12.3 years, tritium decays significantly over time. Water recharged with an initial tritium level of approximately 2–3 Tritium Units (TU) would decay to below detection limits (˂0.1 TU) after about four half-lives, or approximately 50 years, allowing qualitative estimation of recharge age [19,61,62,63,64,65].
Near the study area, Horst et al. [62] estimated the tritium input function using data from the International Atomic Energy Agency’s Global Network of Isotopes in Precipitation (GNIP), based on records from two nearby Mexican stations (Chihuahua and Veracruz). These studies show that tritium activity in rainwater in central Mexico has been steadily decreasing since the 1960s, falling below 3 TU in 2007 and stabilizing in recent years at around 2–3 TU [62,63]. Measured 3H concentrations in groundwater samples from the study area range from 0.00 to 2.18 TU (Table 3), reflecting a range of recharge periods and processes:
  • ▪ Samples with values close to 0 TU indicate pre-bomb water, likely recharged before 1952, representing older groundwater with no tritium left due to radioactive decay.
  • ▪ Tritium levels between 0.5 and 1 TU are typically interpreted as a mixture of submodern and modern water, with recharge likely occurring after 1970 but before the complete decay of bomb-derived tritium.
  • ▪ Values around 1–2 TU suggest recharge during the late 1980s to early 2000s, while values above 2 TU, such as the 2.18 TU found in surface water (sample ID 10), are consistent with recent recharge events occurring between 1990 and 2017.
The tritium activity of 2.18 TU in river water reflects the modern tritium input from precipitation, supporting the use of surface water as a reference for recent recharge. Groundwater samples with activities around 1 TU indicate some decay from this estimated input, suggesting an apparent recharge age around the 1990s. In summary, the presence of tritium in groundwater confirms recharge after 1952, with most values indicating modern recharge periods between 1978 and 2014. These results align with regional tritium input trends and support the identification of active recharge processes from meteoric and surface sources in the aquifer system.

3.4. PTE Comparison Studies

Comparative studies were carried out with the PTE concentrations of other rivers and aquifers in environments in Mexico and worldwide; the data were also compared with permissible limits set forth by different organizations (Table 4). Al, Fe, Ba, Cu, Pb, Zn, and Mn values were observed above the Aquatic Life Protection criteria [43]. The concentrations of Ba, Cr, Cu, Ni, Fe, Pb, Mn, and Zn in the Atoyac and Alseseca Rivers were higher compared to the metal concentrations of the Mississippi and Yellow Rivers, considered among the most polluted rivers in the World [66].
The concentrations of Fe, Cu, Pb, Zn, Mn, and Ni were higher than those measured in the Major River (Argentina), and Fe, Cr, Pb, Zn. At Upper Ganga River in India [67], while the Fe, Zn, Mn, Ni concentrations in the present study were observed to be higher than those in the Ajay River in India [67], Cu and Pb were higher compared to Coruh River in Turkey [68]. The Alseseca and Atoyac Rivers presented concentrations of metals such as Al, Cu, Mn, and Zn above the concentrations measured in rivers such as Lerma, Tula, and Nexcapa, considered in Mexico among the most emblematic and polluted [69,70,71,72].
The present study exposes concentrations of several elements, like Al, Fe, Ba, Cu, Mn, Ni, and Zn, compared to the concentrations of previous studies in the Atoyac River [24,28,31]. The presence of PTEs in the city’s drinking water supply wells had not been documented prior to 2016. That year, Salcedo et al. [27] reported the occurrence of elements such as Pb, B, Mn, Ba, Fe, F, and Zn in groundwater, with most concentrations falling below national and international guideline values for human consumption. However, boron (B), lead (Pb), and manganese (Mn) exceeded the permissible limits, raising concerns about long-term exposure and cumulative health risks [26,27,28,29,31,70,73]. These findings are consistent with concentrations reported in other national and international studies that characterize groundwater with poor or deteriorating water quality; see Table 4 and Table 5. The co-occurrence of these elements suggests similar geogenic and anthropogenic origins. Specifically, the presence of PTEs in both groundwater and surface sources can be attributed to a combination of natural processes—such as rock weathering and volcanic inputs—and anthropogenic influences, particularly industrial discharges and inadequate wastewater management. This multifactorial contamination highlights the vulnerability of urban aquifers in rapidly industrializing regions and underscores the need for continuous monitoring and remediation strategies.
Table 4. PTE concentrations in rivers reported in national and international studies (ND: non detected).
AlFeAsBaCrCuPbZnMnNi
(µg L−1)
Local studies rivers
Pérez et al. [24]Atoyac River0–21,160.0770.0–16,500.0 0–70–89.00–70.00–156.0
Hernández et al. [28]Atoyac River4.0–50.020.0–300.00.2–13.515.5–83.10.5–54.00.6–5.20.03–4.242.0–2.80.4–417.00.6–5.2
Present studyAtoyac River958.0–2,545.03461.0–6779.0ND–50.0111.0–159.05.0–10.067.0–74.030.0–57.0160.0–393.0355.0–420.024.0–26.0
Alseseca River373.0–4576.01688.0–3153.0 115–5304.0–6.056.0–76.028.0–34.0134.0–221.0364.0–838.012.0–30.0
Worldwide studies
in rivers
Mitra and Bianchi [74]
Goolsby et al. [75]
Bussan et al. [76]
Mississippi River (USA)4.9–27.23.6–28.9 26.0–98.00.2–27.00.4–1.20.04–0.0240.34–1.71.8–10.0
Hou et al. [65]Yellow River (China) 0.02–0.1 0.03–0.063.9–6.220.02.0–2.520.0–60.05.0–47.0
Bilgin and Konanç [68]Coruh River
(Turkey)
0–12,449.0 ND–6.162.2–1427.1ND–404.5ND–914.0ND–674.0
Prasad et al. [66].Upper Ganga River (India) 1476.0 ND–33.0 0.0–5.0ND–289 ND–140.0
Avigliano and Schenone [77]Major River
(Argentina)
ND-172 ND-3.1ND-1.2ND-220.0ND-220.0ND-0.16
Canovas et al. [78]Tinto River (Spain) ND-151,000.0 ND-18,900.0ND-130.0ND-26,000.0ND-8000.0ND-170.0
Singh and Kumar [67]Ajay River (India) ND-1951.0 ND-720.0ND-530.0ND-242.0ND-160.0ND-17.0
Table 5. PTE concentrations in groundwater reported in national and local studies.
AlFeAsBaCrCuPbZnMn
(µg L−1)
Mexican studies
Fonseca-Montes de Oca et al. [70]Toluca Valley 20–26814.0–20.0 1.4–1.260.0–459.07.0–150.0
Barats et al. [73]Sierra Huautla1.75–844.0 1.8–30.43.4–872.0 0.7–14.60.021–2.45.5–563.00.2–504.0
Daesslé et al. [79]Guadalupe Valley0.5–100.00.9–600.00.23–100.04.8–1400.05–2.00.13–15.00.005–1.00.5–81.00.5–740.0
Guédron et al. [80]Mezquital Valley (deep wells)120.0 17.0 1.051.0380.08.0
Local studies
Salcedo et al. [27,38]Puebla Valley 0–90.0 30.0–350.0 11,232.00–10.00–1130.0
Present studyPuebla Valley -6.0–81.035.0–69.023.0–292.02.1–5.011.0–12.023.0–32.04.0–19.01–1037.0

4. Conclusions

GW–SW interactions in the Puebla Metropolitan Area (PMA) were studied using hydrochemical and isotopic approaches. The hydrochemical characterization shows ion concentrations remain within the permissible limits established by Mexican drinking water standards, groundwater quality shows signs of deterioration when evaluated under World Health Organization (WHO) guidelines due to elevated levels of nitrates and total dissolved solids (TDS). PTEs were detected: arsenic (As), lead (Pb), manganese (Mn), and copper (Cu) exceeding drinking water limits in water supply wells. These highlight such contamination and underline the aquifer’s vulnerability to both natural and anthropogenic pressures. Surface water quality in the Alseseca and Atoyac rivers was found to be below that found in the Mexican Ecological Criteria for Aquatic Life Protection, based on physico-chemical, microbiological, and PTE concentrations that exceeded regulatory thresholds.
The results indicate that groundwater recharge has multiple pathways influenced by topographic elevation and structural geology. High-altitude recharge supply to the deep aquifer system, while mid- and low-altitude recharge is strongly influenced by mixing with surface waters from the Alseseca and Atoyac rivers.
Tritium evidence indicates that groundwater in wells influenced by river–aquifer mixing corresponds to recharge from 1990 to 2014, reflecting intermediate residence times. Regional fault systems play a fundamental role as preferential infiltration pathways, favoring GW–SW connectivity, with river contributions varying between wells from 18% to 50% (Atoyac) and 25% to 39% (Alseseca).
The isotopic and hydrochemical evidence demonstrates that PTE occurrence is linked to volcanic activity (Popocatépetl), structural geology, and intensive industrial activities such as automotive manufacturing, metallurgy, and textile production, which are associated with untreated wastewater discharges. The presence of PTEs in both surface water and water supply wells supports the existence of vertical and lateral hydrological connectivity, reflecting a complex and vulnerable GW–SW system.
These findings indicate the urgent need for integrated groundwater management and protection in the PMA. Recommended measures include regulating industrial discharges, protecting recharge zones, reducing groundwater overexploitation, and establishing continuous monitoring of groundwater quality and water levels. Incorporating structural geological features into water resource management is fundamental for understanding GW–SW interactions in urban volcanic basins. The combined use of hydrochemical and isotopic represents a valuable tool that can be applied to other metropolitan areas with similar conditions, supporting the development of conceptual and numerical models to predict future variations and to guide sustainable water resource management.

Author Contributions

R.E.O.-C.—data analysis and paper writing; M.M.M.—isotopic assessment and writing review; M.V.E.A.—geochemical assessment, writing review; J.M.E.M.—data analysis, maps editing, and writing; T.G.-M.—data analysis and editing; E.R.S.S.—conceptualization, sampling collection, data analysis, geochemical and isotopic analysis, writing—review and editing, and supervision; A.O.A.—map editing and editing. All authors have read and agreed to the published version of the manuscript.

Funding

This research received no external funding.

Institutional Review Board Statement

Not applicable.

Informed Consent Statement

Not applicable.

Data Availability Statement

All processed data used in the study are shown in the article. Raw data may be available on request from the corresponding author.

Acknowledgments

We would like to express our gratitude to the staff of the Environmental Geochemistry Laboratory, Institute of Geosciences, UNAM.

Conflicts of Interest

The authors declare no conflicts of interest.

Abbreviations

The following abbreviations are used in this manuscript:
PTEPotentially Toxic Elements
PMAPuebla Metropolitan Area

References

  1. Fakhari, M.; Raymond, J.; Martel, R. Complementarity of multiple in-situ techniques for spatiotemporal assessment of groundwater/surface-water exchanges. Hydrogeol. J. 2025, 33, 219–235. [Google Scholar] [CrossRef]
  2. Lin, J.; Ma, R.; Hu, Y.; Sun, Z.; Wang, Y.; McCarter, C. Groundwater sustainability and groundwater/surface-water interaction in arid Dunhuang basin, northwest China. Hydrogeol. J. 2018, 26, 1559–1572. [Google Scholar] [CrossRef]
  3. Zhao, D.; Wang, G.; Liao, F.; Yang, N.; Jiang, W.; Guo, L.; Shi, Z. Groundwater-surface water interactions derived by hydrochemical and isotopic (222Rn, deuterium, oxygen-18) tracers in the Nomhon area, Qaidam Basin, NW China. J. Hydrol. 2018, 565, 650–661. [Google Scholar] [CrossRef]
  4. Zhang, L.; Li, P.; He, X. Interactions between surface water and groundwater in selected tributaries of the Wei River (China) revealed by hydrochemistry and stable isotopes. Hum. Ecol. Risk Assess. 2021, 28, 79–99. [Google Scholar] [CrossRef]
  5. McArthur, J.M.; Sikdar, P.K.; Hoque, M.A.; Ghosal, U. Wastewater impacts on groundwater: Cl/Br ratios and implications for arsenic pollution of groundwater in the Bengal basin and red river basin, Vietnam. Sci. Total Environ. 2012, 437, 390–402. [Google Scholar] [CrossRef]
  6. Bayou, W.T.; Mohammed, M.; Ayenew, T. Hydrochemistry and isotope hydrology of groundwater and surface water in the Sor and Gebba watershed, southwestern Ethiopia. Environ. Earth Sci. 2024, 83, 316. [Google Scholar] [CrossRef]
  7. Li, Z.; Fang, Y.; Meng, B.; Guo, H.; Du, X. Identification of Groundwater–Surface Water Interaction Using Combined Hydraulic and Hydrogeochemical Methods. Water 2024, 16, 2777. [Google Scholar] [CrossRef]
  8. Irvine, D.J.; Singha, K.; Kurylyk, B.L.; Briggs, M.A.; Sebastian, Y.; Tait, D.R.; Helton, A.M. Groundwater–Surface water interactions research: Past trends and future directions. J. Hydrol. 2024, 644, 132061. [Google Scholar] [CrossRef]
  9. Nguyen, T.K.H.; Nuottimäki, K.; Jarva, J. Use of a groundwater model to evaluate groundwater-surface water interaction at a riverbank filtration site: A case study in Binh Dinh, Vietnam. Sustain. Water Resour. Manag. 2025, 11, 14. [Google Scholar] [CrossRef]
  10. Banda, K.; Mulema, M.; Chomba, I.; Chomba, M.; Levy, J.; Nyambe, I. Investigating groundwater and surface water interactions using remote sensing, hydrochemistry, and stable isotopes in the Barotse Floodplain, Zambia. Geol. Ecol. Landsc. 2023, 9, 424–439. [Google Scholar] [CrossRef]
  11. Zhang, B.; Song, X.; Zhang, Y.; Ma, Y.; Tang, C.; Yang, L.; Wang, Z. The interaction between surface water and groundwater and its effect on water quality in the Second Songhua River basin, Northeast China. J. Earth Syst. Sci. 2016, 25, 1495–1507. [Google Scholar] [CrossRef]
  12. Oyarzún, R.; Jofré, E.; Morales, P.; Maturana, H.; Oyarzún, J.; Kretschmer, N.; Aravena, R. A hydrogeochemistry and isotopic approach for the assessment of surface water–groundwater dynamics in an arid basin: The Limarí watershed, North-Central Chile. Environ. Earth. Sci. 2015, 73, 39–55. [Google Scholar] [CrossRef]
  13. Kim, J.; Jeen, S.-W.; Lee, J.; Ko, K.-S.; Koh, D.-C.; Kim, W.; Jo, H. Evaluation of Temporal Contribution of Groundwater to a Small Lake through Analyses of Water Quantity and Quality. Water 2020, 12, 2879. [Google Scholar] [CrossRef]
  14. Martinez, J.L.; Raiber, M.; Cox, M.E. Assessment of groundwater–surface water interaction using long-term hydrochemical data and isotope hydrology: Headwaters of the Condamine River, southeast Queensland, Australia. Sci. Total Environ. 2015, 536, 499–516. [Google Scholar] [CrossRef]
  15. Li, J.; Liu, H.; Sheng, Y.; Han, D.; Shan, K.; Zhu, Z.; Dai, X. Investigating Groundwater–Surface Water Interactions and Transformations in a Typical Dry–Hot Valley Through Environmental Isotopes Analysis. Water 2025, 17, 775. [Google Scholar] [CrossRef]
  16. Négrel, P.; Petelet-Giraud, E.; Barbier, J.; Gautier, E. Surface water–groundwater interactions in an alluvial plain: Chemical and isotopic systematics. J. Hydrol. 2003, 277, 248–267. [Google Scholar] [CrossRef]
  17. Rodgers, P.; Soulsby, C.; Petry, J.; Malcolm, I.; Gibbins, C.; Dunn, S. Groundwater–surface-water interactions in a braided river: A tracer-based assessment. Hydrol. Process. 2004, 18, 1315–1332. [Google Scholar] [CrossRef]
  18. Khan, N.; Khan, H.H.; Siraj, G. Temporal variability in groundwater-surface water interactions using hydraulic and hydrochemical observations in a segment of Kali Nadi, Aligarh, UP, India. Discov. Geosci. 2025, 3, 69. [Google Scholar] [CrossRef]
  19. Cai, Z.; Wang, W.; Zhao, M.; Ma, Z.; Lu, C.; Li, Y. Interaction between Surface Water and Groundwater in Yinchuan Plain. Water 2020, 12, 2635. [Google Scholar] [CrossRef]
  20. Clark, I. Groundwater Geochemistry and Isotopes; Taylor and Francis Ltd.: New York, NY, USA, 2015. [Google Scholar]
  21. Yu, X.; Yuan, X.; Guo, H.; Zhang, Y.; Cao, H.; Luo, T.; Gong, Z.; Huang, H. Coupling Hydrochemistry and Stable Isotopes (δ2H, δ18O and 87Sr/86Sr) to Identify the Major Factors Affecting the Hydrochemical Process of Groundwater and Surface Water in the Lower Reaches of the Yarlung-Zangbo River, Southern Tibet, Southwestern China. Water 2022, 14, 3906. [Google Scholar] [CrossRef]
  22. Terwey, J.L. Isotopes in Groundwater Hydrology. In Harare Symposium: Challenges in African Hydrology and Water Resources; IAHS: Amsterdam, The Netherlands, 1984; pp. 155–160. [Google Scholar]
  23. Teng, Y.; Hu, B.; Zheng, J.; Wang, J.; Zhai, Y.; Zhu, C. Water quality responses to the interaction between surface water and groundwater along the Songhua River, NE China. Hydrogeol. J. 2018, 26, 1591–1607. [Google Scholar] [CrossRef]
  24. Pérez Castresana, G.; Tamariz Flores, V.; López Reyes, L.; Hernández Aldana, F.; Castelán Vega, R.; Morán Perales, J.; Handal Silva, A. Atoyac River pollution in the Metropolitan Area of Puebla, Mexico. Water 2018, 10, 267. [Google Scholar] [CrossRef]
  25. Rodriguez-Espinosa, P.F.; Jonathan, M.P.; Morales-García, S.S.; Villegas, L.E.C.; Martínez-Tavera, E.; Muñoz-Sevilla, N.P.; Cardona, M.A. Met. Metal enrichment of soils following the April 2012–2013 eruptive activity of the Popocatépetl volcano, Puebla, Mexico. Environ. Monit. Assess. 2015, 187, 717. [Google Scholar] [CrossRef] [PubMed]
  26. Salcedo Sánchez, E.R.; Garrido Hoyos, S.E.; Esteller, M.V.; Martínez Morales, M.; Ocampo Astudillo, A. Hydrogeochemistry and water-rock interactions in the urban area of Puebla Valley aquifer (Mexico). J. Geochem. Explor. 2017, 181, 219–235. [Google Scholar] [CrossRef]
  27. Salcedo-Sánchez, E.R.; Ocampo-Astudillo, A.; Garrido-Hoyos, S.E.; Martínez-Morales, M. Effects on groundwater quality of the urban area of Puebla aquifer. In Groundwater and Human Development; Thangarajan, M., Singh, V.P., Eds.; Springer International Publishing: Berlin/Heidelberg, Germany, 2019; pp. 201–214. [Google Scholar] [CrossRef]
  28. Hernández, A.G.; Martínez, E.; Rodríguez, P.F.; Mendoza, J.A.; Tabla, J.; Escobedo, D.C.; Sujitha, S.B. Detection, provenance and associated environmental risks of water quality pollutants during anomaly events in river Atoyac, Central Mexico: A real-time Monitoring Approach. Sci. Total Environ. 2019, 669, 1019–1032. [Google Scholar] [CrossRef] [PubMed]
  29. Rodriguez-Espinosa, P.F.; Sabarathinam, C.; Ochoa-Guerrero, K.M.; Martínez-Tavera, E.; Panda, B. Geochemical evolution and boron sources of the groundwater affected by urban and volcanic activities of Puebla Valley, South Central Mexico. J. Hydrol. 2020, 584, 124613. [Google Scholar] [CrossRef]
  30. Garfias, J.; Arroyo, N.; Aravena, R. Hydrochemistry and origins of mineralized waters in the Puebla aquifer system, Mexico. Environ. Earth Sci. 2010, 59, 1789–1805. [Google Scholar] [CrossRef]
  31. Dueñas-Moreno, J.; Mora, A.; Narvaez-Montoya, C.; Mahlknecht, J. Trace elements and heavy metal(loid)s triggering ecological risks in a heavily polluted river-reservoir system of central Mexico: Probabilistic approaches. Environ. Res. 2024, 262, 119937. [Google Scholar] [CrossRef]
  32. Rodríguez-Espinosa, P.F.; Shruti, V.C.; Jonathan, M.P.; Martinez-Tavera, E. Metal concentrations and their potential ecological risks in fluvial sediments of Atoyac river basin, Central Mexico: Volcanic and anthropogenic influences. Ecotoxicol. Environ. Saf. 2018, 148, 1020–1033. [Google Scholar] [CrossRef]
  33. Shruti, V.C.; Rodríguez-Espinosa, P.F.; Martinez-Tavera, E.; Hernández-Gonzalez, D. Metal concentrations in recent ash fall of Popocatépetl volcano 2016, central Mexico: Is human health at risk? Ecotoxicol. Environ. Saf. 2018, 162, 324–333. [Google Scholar] [CrossRef]
  34. Yan, N.; Liu, W.; Xie, H.; Gao, L.; Han, Y.; Wang, M.; Li, H. Distribution assessment of heavy metals in the surface sediment of the Yellow River China. J. Environ. Sci. 2016, 39, 45–51. [Google Scholar] [CrossRef]
  35. CONAGUA. Estadísticas del Agua en México; Comisión Nacional del Agua: Coyoacán, México, 2017.
  36. Weatherbase. Historical Weather for Puebla. Available online: https://www.weatherbase.com (accessed on 27 May 2021).
  37. Martinez-Tavera, E.; Rodriguez-Espinosa, P.F.; Shruti, V.C.; Sujitha, S.B.; Morales-Garcia, S.; Muñoz-Sevilla, N.P. Monitoring the seasonal dynamics of physicochemical parameters from Atoyac River basin (Puebla), Central Mexico: Multivariate approach. Environ. Earth Sci. 2017, 76, 95. [Google Scholar] [CrossRef]
  38. Salcedo-Sánchez, E.R.; Esteller, M.V.; Garrido Hoyos, S.E.; Martínez-Morales, M. Groundwater optimization model for sustainable management of the valley of Puebla aquifer, Mexico. Environ. Earth Sci. 2013, 70, 337–351. [Google Scholar] [CrossRef]
  39. DOF. Norma Oficial Mexicana PROY-NOM-230-SSA1-2002, Salud Ambiental. Diario Oficial de la Federación. 2003. Available online: https://www.gob.mx/cms/uploads/attachment/file/110536/NOM_230_SSA1_2002.pdf (accessed on 18 March 2022).
  40. APHA; AWWA; WEF. Standard Methods for the Examination of Water and Wastewater, 21st ed.; APHA/AWWA/WEF: Washington, DC, USA, 2005. [Google Scholar]
  41. DOF. Norma Oficial Mexicana NOM-127-SSA1-2021, Agua Para Uso y Consumo Humano. Límites Permisibles de la Calidad del Agua. Diario Oficial de la Federación. 2022. Available online: https://www.dof.gob.mx/nota_detalle_popup.php?codigo=5650705 (accessed on 18 April 2025).
  42. WHO. Guidelines for Drinking-Water Quality. World Health Organization: Geneva, Switzerland, 2001; Volume 4. [Google Scholar]
  43. DOF. Acuerdo por el que se Establecen los Criterios Ecológicos de Calidad del Agua, CE-CCA-001/89. Diario Oficial de la Federación, 13 de Diciembre de 1989. 1989. Available online: https://www.dof.gob.mx/index.php?year=1989&month=12&day=13 (accessed on 2 May 2025).
  44. Craig, H. Standard for reporting concentrations of deuterium and oxygen-18 in natural water. Science 1961, 133, 1833–1834. [Google Scholar] [CrossRef] [PubMed]
  45. Aqueous Solutions, L.C.C. Geochemist’s Workbench, Version 11; Department of Geology at the University of Illinois Urbana-Champaign: Urbana, IL, USA, 2016. [Google Scholar]
  46. Masuda, H. Arsenic cycling in the Earth’s crust and hydrosphere: Interaction between naturally occurring arsenic and human activities. Prog. Earth Planet Sci. 2018, 5, 68. [Google Scholar] [CrossRef]
  47. USEPA. In Situ Treatment of Soil Groundwater Contaminated with Chromium Technical Resource Guide; Office of Research Development, US Environmental Protection Agency: Washington, DC, USA, 2000.
  48. Katz, S.A.; Salem, H. The Biological and Environmental Chemistry of Chromium. VCH: New York, NY, USA, 1994. [Google Scholar]
  49. USEPA. Toxicological Review of Hexavalent Chromium; US Environmental Protection Agency: Washington, DC, USA, 1998.
  50. USEPA. Guidance for Reporting Releases and Other Waste Management Quantities of Toxic Chemicals; US Environmental Protection Agency: Washington, DC, USA, 2001.
  51. Sankhla, M.S.; Kumar, R.; Prasad, L. Zinc Impurity in Drinking Water and Its Toxic Effect on Human Health. Indian Internet J. Forensic Med. Toxicol. 2019, 17, 84–87. [Google Scholar] [CrossRef]
  52. Velázquez, M.A.; Pimentel, J.L.; Ortega, M. Estudio de la distribución de boro en fuentes de agua de la cuenca del río Duero, México, utilizando análisis estadístico multivariado. Rev. Int. Contam. Ambient. 2011, 27, 19–30. [Google Scholar]
  53. Hem, J.D. Study and Interpretation of the Chemical Characteristics of Natural Water; US Geological Survey Water-Supply Paper 2254; US Government Printing Office: Washington, DC, USA, 1992.
  54. Copat, C.; Fiore, M.; Grasso, A.; Arena, G.; Dimartino, A. Boron Levels in Drinking Water Sources from the Volcanic Area of Sicily (South Italy): Risk Evaluation of Developing Chronic Systemic Effects. Ann. Environ. Sci. Toxicol. 2016, 1, 008–012. [Google Scholar] [CrossRef]
  55. Parent, L.; Campbell, P.G.C. Aluminium bioavailability to the green alga Chlorella Pyrenoidosa in acidified synthetic soft water. Environ. Toxicol. Chem. 1994, 13, 587–598. [Google Scholar] [CrossRef]
  56. Sacks, L.A.; Herman, J.S.; Kauffman, S.J. Controls on high sulfate concentrations in the Upper Floridan aquifer in southwest Florida. Water Resour. Res. 1995, 31, 2541–2551. [Google Scholar] [CrossRef]
  57. Cortes, A.; Farvolden, R.N. Isotope studies of precipitation and groundwater in the Sierra de las Cruces, Mexico. J. Hydrol. 1988, 107, 147–153. [Google Scholar] [CrossRef]
  58. Petelet-Giraud, E.; Négrel, P.; Gourcy, L.; Schmidt, C.; Schirmer, M. Geochemical and isotopic constraints on groundwater-surface water interactions in a highly anthropized site. The Wolfen/Bitterfeld megasite (Mulde subcatchment, Germany). Environ. Pollut. 2007, 148, 707–717. [Google Scholar] [CrossRef]
  59. Yang, L.; Song, X.; Zhang, Y.; Han, D.; Zhang, B.; Long, D. Characterizing interactions between surface water and groundwater in the Jialu river basin using major ion chemistry and stable isotopes. Hydrol. Earth Syst. Sci. 2012, 16, 4265–4277. [Google Scholar] [CrossRef]
  60. Ayadi, R.; Trabelsi, R.; Zouari, K.; Saibi, H.; Itoi, R.; Khanfir, H. Hydrogeological and hydrochemical investigation of groundwater using environmental isotopes (18O, 2H, 3H, 14C) and chemical tracers: A case study of the intermediate aquifer, Sfax, Southeastern Tunisia. Hydrogeol. J. 2018, 26, 983–1007. [Google Scholar] [CrossRef]
  61. Flores Ronces, J.A.; Salcedo Sánchez, E.R.S.; Martínez Morales, M.; Esquivel Martínez, J.M.; Talavera Mendoza, O.; Esteller Alberich, M.V. Trace Metals and Metalloids Present in Springwater of a Mining Area: Assessment Based on Chemical and Isotopic Data (δ2H, δ18O, 3H and 87Sr/86Sr). Water 2023, 15, 1917. [Google Scholar] [CrossRef]
  62. Horst, A.; Mahlknecht, J.; Merkel, B.J.; Aravena, R.; Ramos-Arroyo, Y.R. Evaluation of the recharge processes and impacts of irrigation on groundwater using CFCs and radiogenic isotopes in the Silao-Romita basin, Mexico. Hydrogeol. J. 2008, 16, 1601–1614. [Google Scholar] [CrossRef]
  63. Mahlknecht, J.; Daesslé, L.W.; Esteller, M.V.; Torres-Martinez, J.A.; Mora, A. Groundwater flow processes and human impact along the arid US-Mexican border, evidenced by environmental tracers: The case of Tecate, Baja California. Int. J. Environ. Res. Public Health 2018, 15, 887. [Google Scholar] [CrossRef]
  64. Kurukulasuriya, D.; Howcroft, W.; Moon, E.; Meredith, K.; Timms, W. Selecting Environmental Water Tracers to Understand Groundwater around Mines: Opportunities and Limitations. Mine Water Environ. 2022, 41, 357–369. [Google Scholar] [CrossRef]
  65. Hou, W.; Sun, S.; Wang, M.; Li, X.; Zhang, N.; Xin, X.; Sun, L.; Li, W.; Jia, R. Assessing water quality of five typical reservoirs in lower reaches of Yellow River, China: Using a water quality index method. Ecol. Indic. 2016, 61, 309–316. [Google Scholar] [CrossRef]
  66. Prasad, M.B.K.; Ramanathan, A.L.; Shrivastav, S.K.; Anshumali, S.R. Metal fractionation studies in surficial and core sediments in the Achankovil River basin in India. Environ. Monit. Assess. 2006, 121, 77e102. [Google Scholar] [CrossRef] [PubMed]
  67. Singh, U.K.; Kumar, B. Pathways of heavy metals contamination and associated human health risk in Ajay River Basin, India. Chemosphere 2017, 174, 183–199. [Google Scholar] [CrossRef]
  68. Bilgin, A.; Konanç, M.U. Evaluation of surface water quality and heavy metal pollution of the Coruh River Basin (Turkey) by multivariate statistical methods. Environ. Earth Sci. 2016, 75, 1029. [Google Scholar] [CrossRef]
  69. Martínez-Tabche, L.; Cruz-Jiménez, G.; Castañeda-Chávez, M.d.R.; Álvarez-García, D. Evaluación de la toxicidad de los sedimentos del curso alto del río Lerma, México. Rev. Int. Contam. Ambient. 2017, 33, 65–74. [Google Scholar] [CrossRef]
  70. Fonseca-Montes de Oca, R.M.G.; Ramos-Leal, J.A.; Solache-Ríos, M.; Martínez-Miranda, V.; Fuentes-Rivas, R.M. Modification of the relative abundance of constituents dissolved in drinking water caused by organic pollution: A case of the Toluca Valley, Mexico. Water Air Soil Pollut. 2019, 230, 4210. [Google Scholar] [CrossRef]
  71. Peña-Montenegro, T.D.; Rodríguez-Espinosa, P.F.; Gómez-Salazar, S. Heavy metal contamination of soils and water in the Tula Valley, Mexico. Rev. Int. Contam. Ambient. 2008, 24, 175–182. [Google Scholar]
  72. Gutiérrez, M.; Cabrera, A.; Arriaga, M.E. Heavy metal pollution in the Nexapa River, Puebla, Mexico. Environ. Geol. 2009, 58, 611–620. [Google Scholar]
  73. Barats, A.; Renac, C.; Orani, A.M.; Durrieu, G.; Saint Martin, H.; Vicenta Esteller, M.; Garrido Hoyos, S. Tracing source and mobility of arsenic and trace elements in a hydrosystem impacted by past mining activities (Morelos state, Mexico). Sci. Total Environ. 2020, 712, 135565. [Google Scholar] [CrossRef] [PubMed]
  74. Mitra, S.; Bianchi, T.S. A preliminary assessment of polycyclic aromatic hydrocarbon distributions in the lower Mississippi River and Gulf of Mexico. Mar. Chem. 2003, 82, 273–288. [Google Scholar] [CrossRef]
  75. Goolsby, D.A.; Battaglin, W.A.; Lawrence, G.B.; Artz, R.S.; Aulenbach, B.T.; Hooper, R.P.; Keeney, D.R.; Stensland, G.J. Flux and Sources of Nutrients in the Mississippi–Atchafalaya River Basin: Topic 3 Report for the Integrated Assessment on Hypoxia in the Gulf of Mexico; NOAA Coastal Ocean Program Decision Analysis Series No. 17; NOAA: Silver Spring, MD, USA, 2000. Available online: https://www.noaa.gov/ (accessed on 2 May 2025).
  76. Bussan, D.D.; Ochs, C.A.; Jackson, C.R.; Anumol, T.; Snyder, S.A.; Cizdziel, J.V. Concentrations of select dissolved trace elements and anthropogenic organic compounds in the Mississippi River and major tributaries during the summer of 2012 and 2013. Environ. Monit. Assess. 2017, 189, 73. [Google Scholar] [CrossRef] [PubMed]
  77. Avigliano, E.; Lozano, C.; Plá, R.R.; Volpedo, A.V. Toxic element determination in fish from Paraná River Delta (Argentina) by neutron activation analysis: Tissue distribution and accumulation and health risk assessment by direct consumption. J. Food Compos. Anal. 2016, 54, 27–36. [Google Scholar] [CrossRef]
  78. Canovas, C.R.; Olías, M.; Nieto, J.M.; Galván, L. Wash-out processes of evaporitic sulfate salts in the Tinto river: Hydrogeochemical evolution and environmental impact. Appl. Geochem. 2010, 25, 288–301. [Google Scholar] [CrossRef]
  79. Daesslé, L.W.; Andrade-Tafoya, P.D.; Lafarga-Moreno, J.; Mahlknecht, J.; van Geldern, R.; Beramendi-Orosco, L.E.; Barth, J.A.C. Groundwater recharge sites and pollution sources in the wine-producing Guadalupe Valley (Mexico): Restrictions and mixing prior to transfer of reclaimed water from the US-méxico border. Sci. Total Environ. 2020, 713, 136715. [Google Scholar] [CrossRef] [PubMed]
  80. Guédron, S.; Duwig, C.; Prado, B.L.; Point, D.; Flores, M.G.; Siebe, C. (Methyl) mercury, arsenic, and lead contamination of the World’s largest wastewater irrigation system: The Mezquital Valley (Hidalgo State—Mexico). Water Air Soil Pollut. 2014, 225, 2045. [Google Scholar] [CrossRef]
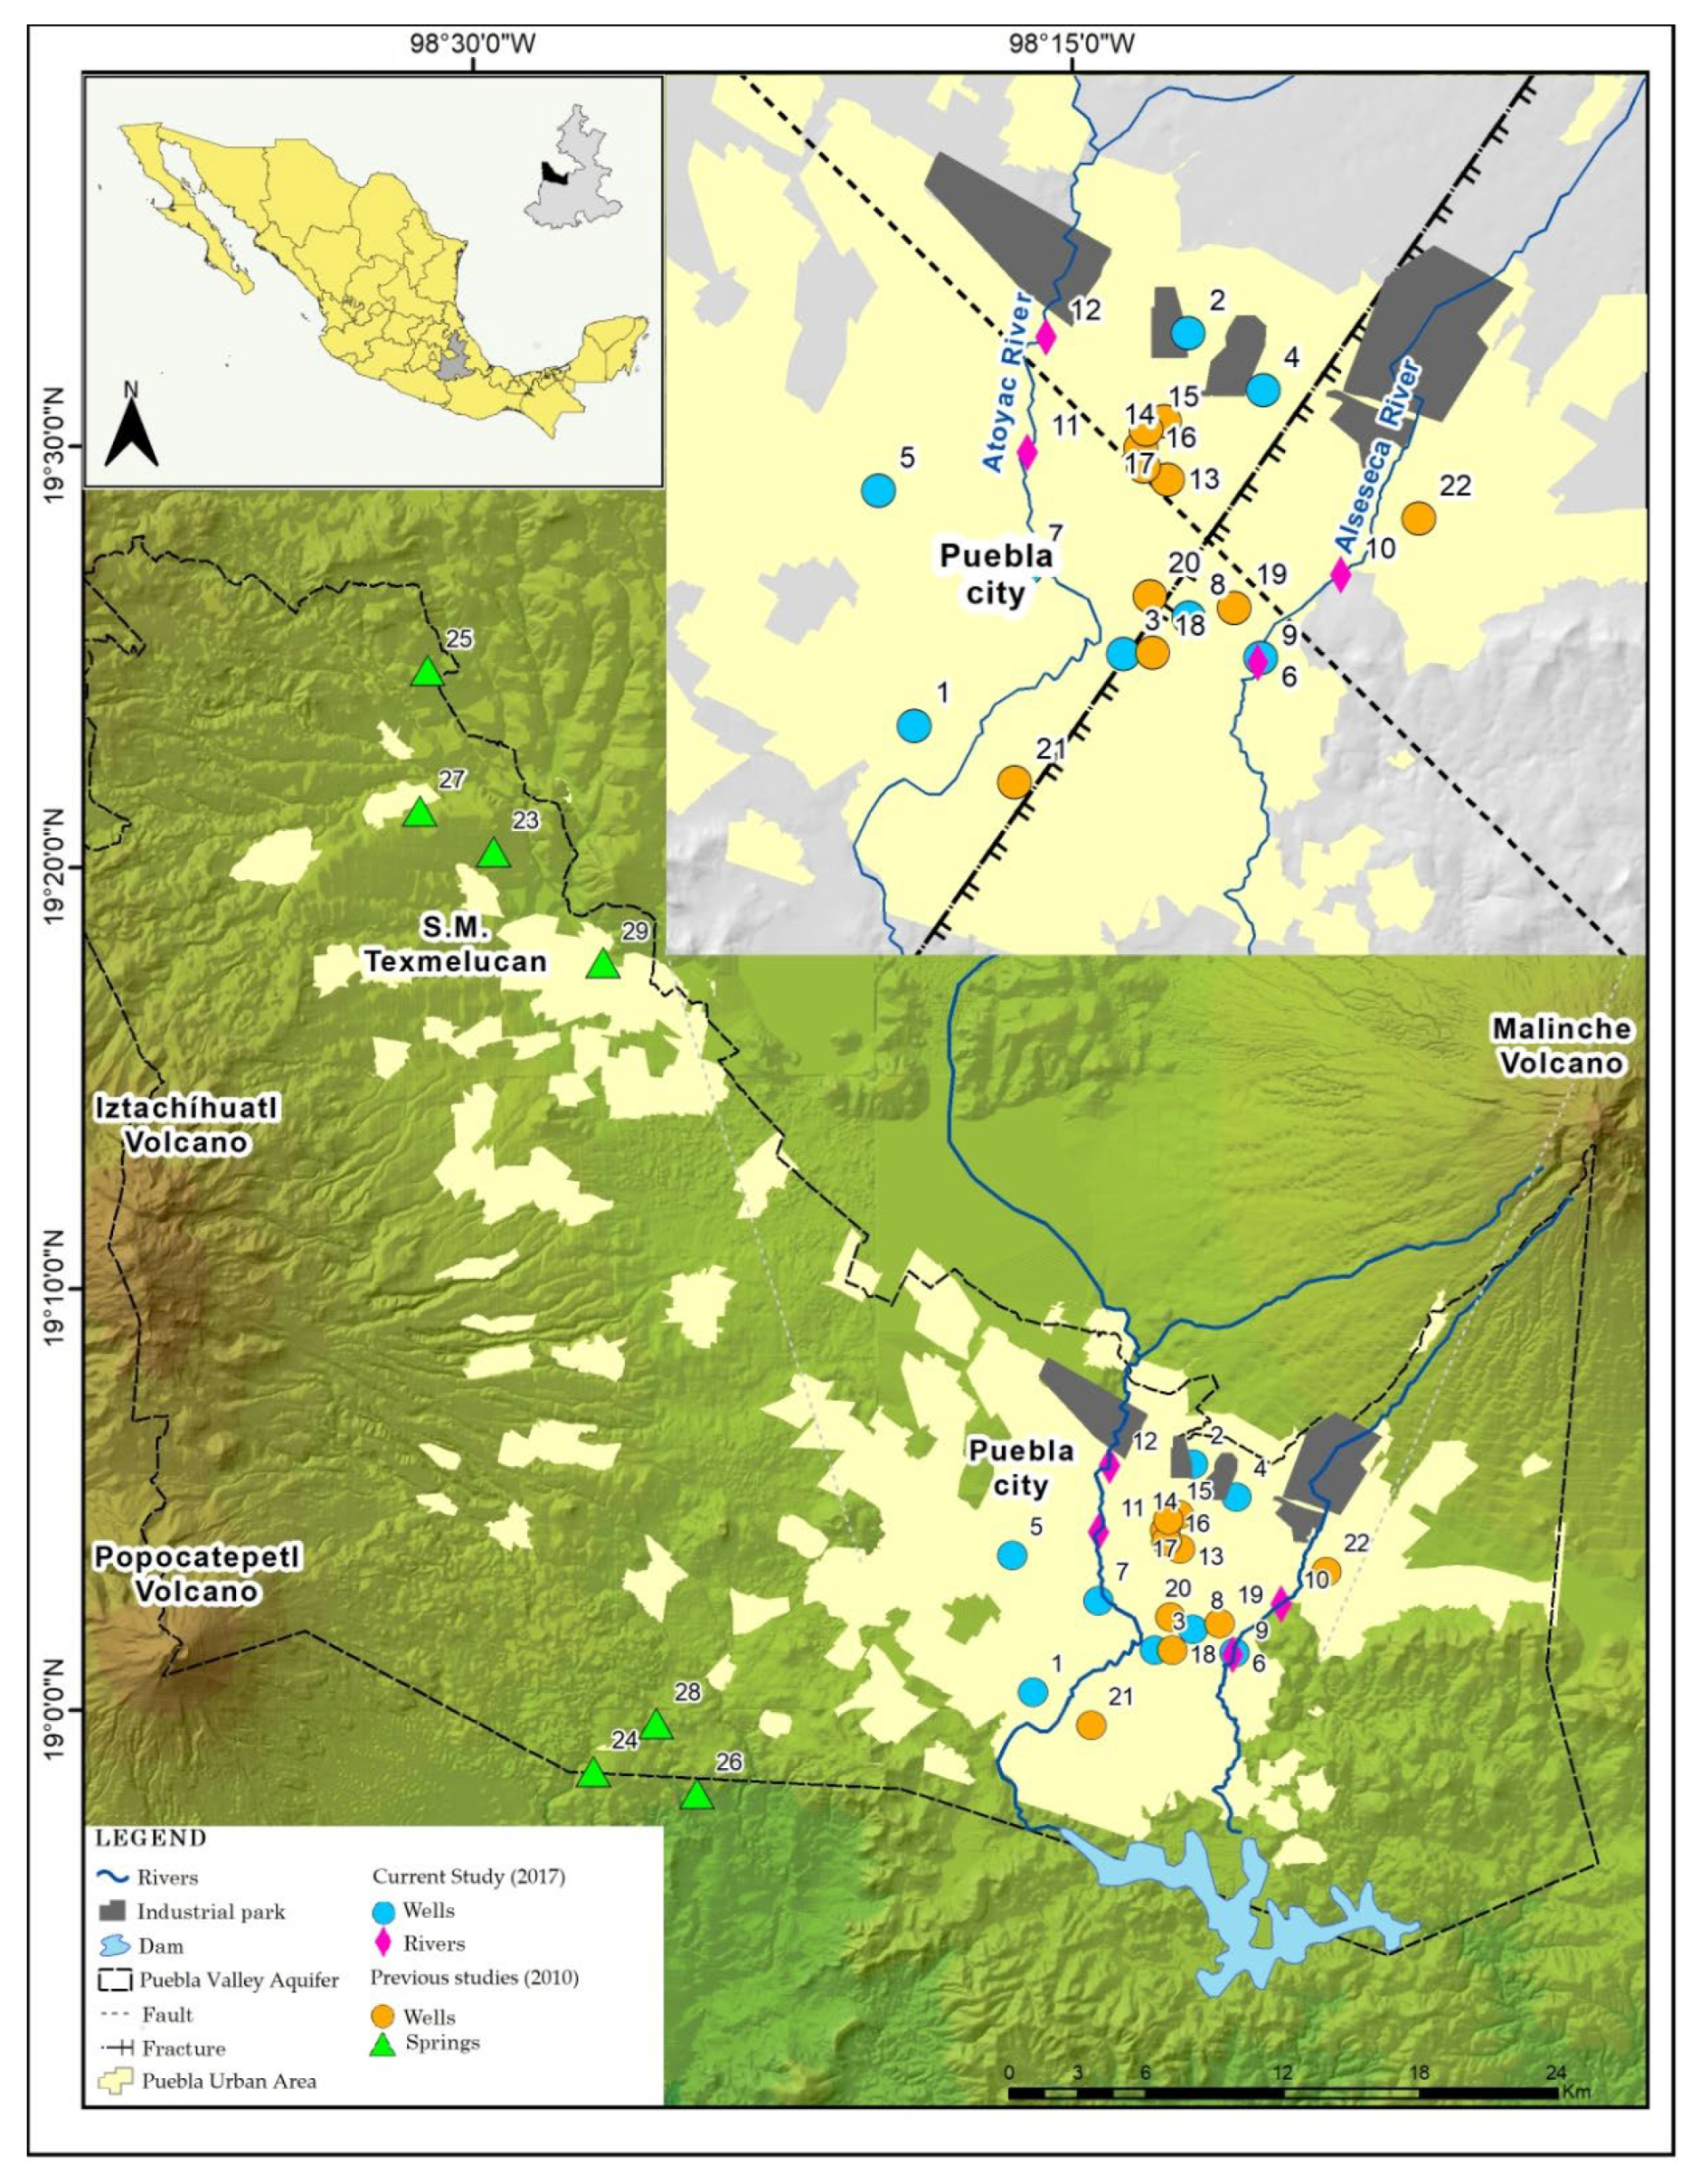
Figure 1. Location of the study area and sampling points: blue circles represent groundwater samples collected in 2017 (this study); pink diamonds indicate surface water samples collected in 2017 (this study); orange circles correspond to groundwater samples collected in 2010 [30]; green triangles denote spring water samples collected in 2010 [30].
Sustainability 17 09258 g001
Figure 2. Geological cross-section W-E of the Puebla Valley aquifer, modified from Salcedo et al. [38]. The upper aquifer involves granular deposits and fractures. Quaternary rock formations. The middle aquifer is confined with andesites, basalts, ignimbrite tuffs, and conglomerates. The deep aquifer is formed by limestone and some layers of dolomite, sandstone, and evaporites.
Sustainability 17 09258 g002
Figure 3. Piper diagram showing the hydrochemical facies of groundwater and river water in the study area.
Sustainability 17 09258 g003
Figure 4. Spatial distribution of concentration of (a) As, (b) Cr, (c) Pb, (d) Zn, and (e) Fe from groundwater samples.
Sustainability 17 09258 g004
Figure 5. Ternary diagram of Pb–Fe–Zn as a tracer of pollution in GW–SW.
Sustainability 17 09258 g005
Figure 6. Values of δ18O and δ2H showing the isotopic composition from springs, wells, and river points, sampling 2010 [30] and sampling 2017.
Sustainability 17 09258 g006
Figure 7. Relationship between Cl and δ18O of different water samples as a means to differentiate mixing processes in the Puebla Metropolitan Area.
Sustainability 17 09258 g007
Figure 8. Piezometric map of the upper aquifer Puebla, 2012, modified from Salcedo et al. [27].
Sustainability 17 09258 g008
Table 1. Physical and chemical characteristics of groundwater (1–8) and surface water (9–12) samples (Temp: temperature, ORP: oxidation reduction potential, EC: electrical conductivity, FC: fecal coliform, DO: dissolved oxygen, TH: total hardness, TDS: total dissolved solids, CBE: charge balance error; Bdl: below detection limit). ND: non detected). The limits for human consumption water NOM-SSA-127 (NS127) [41], WHO [42], and Protection of Aquatic Life are presented (PAL) [43].
IDTemppHORPECFCCBEDOTHTDSCa2+K+Mg 2+Na+FHCO3ClNO3PSO42−
°C mVμScm−1 N M P 100   m L % (mg L−1)
NS127-6.5–8.5--ND -5001000---2001.5-25044-400
WHO----ND -100100075-30---25050-200
PAL 6.0–9.0 200 531–120 1.0 1 × 10−40.005
Sampling points * 120.98.0520.2591.0ND3.5ND 146.0 296.039.05.39.611.40.1123.025.01.5 0.1 18.7
219.87.3757.0883.0ND0.8ND 212.0 441.049.08.619.216.9Bdl150.020.6 47.5 0.1 51.9
326.46.7391.83838.06.03.8ND 1000.0 1542.0 151.0 23.1 110.3 119.00.21134.00.113.6 0.1 92.9
421.47.0367.02293.091.0−1.3ND 645.0 1145.0 194.0 10.4 30.3 40.3ND401.045.7 86.3 0.1 255.3
521.07.6471.01233.070.0−2.7ND 299.0 616.0 86.0 7.416.525.4Bdl244.046.15.8ND92.5
624.47.3429.23363.0ND1.6ND 820.0 1617.0 152.0 22.4 75.1 106.00.1887.046.739.4 0.1 89.1
723.96.9356.04070.0ND−3.2ND 1125.0 2037.0 274.0 17.3 72.7 93.90.6766.088.919.0 0.1 498.2
822.06.8465.04311.02.0−5.5ND 778.0 2156.0 256.0 21.1 93.9 101.00.4810.087.711.1 0.1 622.9
924.98.1175.03614.01.9 × 106−4.02.6 227.0 1808.0 60.037.515.4 264.2 0.3464.023.43.2 6.0 182.8
1014.48.4372.0485.01.6 × 1044.37.9 773.0 242.0 87.0 12.721.974.10.2471.014.07.4 0.9 31.9
1121.27.9368.01585.01.0 × 105−5.02.8 279.0 785.069.016.419.564.50.3308.079.810.9 3.5 102.8
1220.67.7220.01093.02.6 × 1065.02.9 284.0 596.046.023.119.8117.00.2215.068.020.5 3.1 86.2
Max 26.4 8.4 757.0 4311.0 2.61 × 10⁶ 5.0 7.9 1125.0 2156.0 274.0 37.5 110.3 264.2 0.6 1134.0 88.9 86.3 6.0 622.9
Min 14.4 6.7 175.0 485.0 2.0 −5.5 2.6 146.0 242.0 39.0 5.3 9.6 11.4 0.1 123.0 0.1 1.5 0.1 18.7
Mean 21.7 7.5 407.7 2279.9 5.88 × 10⁵ −0.2 4.1 549.0 1106.8 121.9 17.1 42.0 86.1 0.3 497.8 45.5 22.2 1.3 177.1
* 1 CFE, 2 Autopista, 3 Momoxpan 5, 4 Parque Juárez, 5 H. de Puebla, 6 Atlixcayotl 3, 7 Agua Azul, 8 CNIC, 9 Alseseca River 1, 10 Alseseca River 2, 11 Atoyac River 1, 12 Atoyac River 2.
Table 2. Potential toxic element concentrations of groundwater (1–8) and river water (9–12) samples (Bdl: below detection limit, q.l. quantification limit, d.l. detection limit). The limits for human consumption water NOM-SSA-127 (NS127) [41], WHO [42], and Protection of Aquatic Life (PAL) [43] are presented.
IDAlAsBBaCrCuFeZnPbSrVNiLiMn
(mg L−1)
NS127 0.2000.025-0.7000.0502.0000.3005.0000.025----0.150
WHO 0.2000.0100.3000.7000.0501.3000.3003.0000.010----0.400
PAL0.0500.200-0.0100.0500.0101.0000.0200.030--0.600--
Sampling points * 1Bdl.Bdl.0.037 0.065 0.004 0.011 0.0060.007 0.027 0.2230.0150.0190.015Bdl
2Bdl.Bdl.0.032 0.116 0.005 0.012 0.0360.019 0.028 0.3000.0100.0210.0060.002
3Bdl. 0.069 1.337 0.110 Bdl.Bdl.0.0360.004 0.032 1.6520.0260.0290.724 1.037
4Bdl.Bdl. 0.622 0.057 Bdl.Bdl.0.0440.005 0.024 1.3860.0110.0180.1350.001
5Bdl.Bdl.0.066 0.292 0.002Bdl.0.0060.005 0.023 0.5190.0100.0270.0420.001
6Bdl. 0.035 1.424 0.065 Bdl.Bdl.0.0150.005 0.028 1.6910.0130.0250.409 0.322
7Bdl. 0.042 1.996 0.023 Bdl.Bdl.0.0810.005 0.026 2.5850.0130.0230.4670.023
8Bdl. 0.043 1.898 0.063 BdlBdl.0.0270.006 0.025 2.5130.0080.0270.486 0.553
9 0.370 Bdl. 0.381 0.115 0.006 0.056 1.088 0.221 0.028 0.3410.0100.0300.048 0.364
10 4.580 Bdl.0.047 0.530 0.004 0.076 3.153 0.134 0.034 0.1820.0320.0120.002 0.838
11 2.550 Bdl.0.139 0.159 0.010 0.067 3.461 0.393 0.057 0.2610.0320.0260.025 0.420
12 0.960 0.050 0.252 0.111 0.005 0.074 6.779 0.160 0.030 0.3020.0290.0240.042 0.355
d.l.0.0200.0010.002 - 0.0010.0020.0010.0030.005 - 0.0010.001 - 0.001
q.l. 0.0670.0230.0060.0010.0020.0070.0030.0010.015 - 0.0040.003 - 0.001
* 1 CFE, 2 Autopista, 3 Momoxpan 5, 4 Parque Juárez, 5 H. de Puebla, 6 Atlixcayotl 3, 7 Agua Azul, 8 CNIC, 9 Alseseca River 1, 10 Alseseca River 2, 11 Atoyac River 1, 12 Atoyac River 2.
Table 3. Environmental isotopes in groundwater from springs, wells, and rivers. 2010 sampling [30] and 2017 sampling (ND: non detected).
YEARID δ18O (‰)δ2H (‰)3H (TU)
20171. CFE 2Well−10.21−72.80ND
2. AutopistaWell−10.19−72.900.54
3. Momoxpan 5Well−9.96−69.300.00
4. Parque JuárezWell−10.18−71.500.27
5. Héroes de PueblaWell−9.80−70.301.30
6. Atlixcayotl 3Well−9.60−67.00ND
7. Prados agua azulWell−10.40−72.40ND
8. CNICWell−10.20−70.000.20
9. Alseseca River 1River−10.10−75.602.00
10. Alseseca River 2River−9.10−59.802.20
11. Atoyac River 1River−9.30−62.701.30
12. Atoyac River 2River−9.90−71.601.10
2010 (Garfias et al., 2010) [30]1. CFEWell−9.70−69.10
2. AutopistaWell−10.00−73.00
7. Agua AzulWell−10.60−74.50
13. Baños Paseo BravoWell−10.10−71.10
14. Crown PlazaWell−10.20−70.10
15. Rancho ColoradoWell−9.70−70.10
16. Balneario la pazWell−10.80−74.40
17. CAPUWell−10.70−74.10
18. Gabriel pastorWell−9.60−67.50
19. El An + gelWell−9.80−71.60
20. PapeleraWell−10.10−73.00
21. CastillotlaWell−9.20−65.60
22. AmalucanWell−13.00−71.20
23. ZopilocalcoSpring−10.50−77.40
24. Benito JúarezSpring−10.90−75.50
25. PreciositaSpring−11.10−79.70
26. AxcopanSpring−11.80−83.90
27. Piedra ColoradaSpring−10.80−78.60
28. San BaltasarSpring−11.90−81.20
29. Aan MartínSpring−10.50−77.00
Disclaimer/Publisher’s Note: The statements, opinions and data contained in all publications are solely those of the individual author(s) and contributor(s) and not of MDPI and/or the editor(s). MDPI and/or the editor(s) disclaim responsibility for any injury to people or property resulting from any ideas, methods, instructions or products referred to in the content.