1. Introduction
The downstream migration of salmonid smolts through regulated rivers and hydropower systems remains a persistent ecological and engineering challenge. Despite the implementation of mitigation structures, such as bypasses, surface collectors, and behavioral guidance systems, many fish fail to locate safe passage routes [
1]. As a result, smolts are frequently delayed, injured, or killed during migration, particularly when encountering turbines and spillways [
2,
3,
4,
5]. The ongoing difficulty in aligning fish behavior with hydraulic design highlights the need for more integrated, behaviorally informed approaches to fish passages [
6].
A central issue in ecohydraulics is the limited understanding of how fish respond to spatial and temporal variations in flow conditions. Atlantic salmon (
Salmo salar) smolts, for instance, migrate predominantly near the surface and are highly sensitive to hydrodynamic cues, such as flow velocity, turbulence and shear gradients [
3]. Behavioral models that incorporate these stimuli can improve predictions of fish trajectories and support the development of more effective guidance solutions [
7,
8,
9].
Combining high-resolution hydrodynamic modeling with fish telemetry offers a promising avenue for advancing this understanding. CFD simulations can resolve three-dimensional, turbulent flow structures around hydraulic infrastructure [
10,
11], while telemetry provides detailed spatial and temporal data on fish movement. Coupled analyses have already demonstrated the potential to identify behavioral thresholds, explore avoidance patterns, and evaluate passage efficiency in complex hydraulic environments [
12,
13].
By integrating CFD and telemetry data, it becomes possible to determine which flow velocities smolts tend to avoid and which they prefer to continue swimming in. Gaining deeper insights into how fish adjust their behavior in response to different hydraulic conditions allows for the refinement of existing behavioral models and supports further development of predictive frameworks. This approach has demonstrated the feasibility of linking telemetry with flow data. As a result, perspectives emerge on how smolts interact with dynamic flow fields, which can offer an opportunity to enhance the ecological effectiveness of hydropower infrastructure.
At the hydropower facility in northern Sweden, extensive telemetry infrastructure enables tracking of both upstream and downstream movement. Despite the presence of one of Sweden’s longest fishways and additional mitigation measures—such as surface booms and bubble curtains—smolts continue to struggle in locating fishway entrances [
14,
15]. These difficulties emphasize the importance of understanding the fine-scale flow conditions that influence movement decisions during migration [
16].
Investigating fish behavior in conjunction with CFD-generated flow fields enables analysis of how individual smolts respond to specific hydraulic parameters—such as velocity. Identifying consistent behavioral responses across individuals and flow scenarios provides valuable insights into the mechanisms that allow or hinder successful passage. This approach can also reduce reliance on expensive and risky physical modifications to infrastructure by providing a virtual testing environment for evaluating alternative designs.
A broader objective lies in developing a standardized, transferable method for processing and interpreting telemetry and flow data. Hydropower sites vary widely in structure and flow characteristics, making site-specific solutions essential. However, a consistent analytical framework—grounded in fluid mechanics and informed by ecological behavior—could facilitate more efficient evaluations across multiple dams and river systems.
Since conducting fine-scale behavioral studies in the field can be challenging, previous research has primarily been carried out in laboratory settings [
17,
18,
19,
20]. However, this approach has certain limitations as on-site studies in rivers are also essential due to the sensitivity of behavior to laboratory environments. While laboratory studies offer control, they often lack ecological realism. Recent field-based work has revealed generalizable patterns of smolt swimming behavior, including directional alignment with flow and adjustments in swimming speed in response to hydraulic stimuli [
8,
21]. These findings suggest that smolts actively engage with the flow field rather than drifting passively [
3].
Individual-based modeling (IBM) is a valuable tool for simulating fish behavior in relation to water flow. By modeling the behavior of individual fish within the flow, various flow–response patterns can be generated. Some models are relatively simple, allowing fish to merely follow the current [
22,
23,
24], while others are more advanced in terms of acceleration and turbulence [
25]. By extracting additional data on fish behavior in relation to flow velocity, such models can produce more accurate and realistic predictions of migratory routes across different flows.
The method is promising for further investigation as it extracts velocity data from a CFD model at the locations where smolts have been observed. While there are several similar studies in other areas using well-validated CFD models and telemetry tracks [
7,
13], this method has been shown to be effective; the method could enable data to be processed comparably, allowing cross-study comparisons and potentially revealing shared velocity preferences of smolts across different river systems.
By leveraging telemetry and CFD together, it becomes possible to identify key flow variables that correlate with migratory success or failure. This knowledge is critical for designing hydraulic conditions that support efficient fish movement and reduce mortality. Designing hydraulic structures—such as fish passages, dams, and channels—to better align with the natural behavior of fish can improve passage efficiency and reduce fish mortality. Beyond these immediate benefits, adapting such environments to reflect natural behavioral patterns may also help mitigate long-term ecological challenges [
21,
26,
27]. A deeper understanding of fish movement and behavior around hydropower dams could, therefore, enable more sustainable design solutions that better accommodate the species’ natural migratory needs. By mapping the positions of fish tracks and comparing these positions with the water velocities selected by the fish, this study provides a potential method for further analysis of telemetry data. Such an approach can offer a deeper understanding of how smolts orient themselves within the flow. Improved knowledge of smolt orientation can, in turn, inform the design of adaptive measures and contribute to the development of more effective migration routes. This ultimately supports a more sustainable hydropower system, in which environmental measures play a key role in improving the ecological status of regulated rivers. It also represents a novel approach to data analysis with potential for further application. The method offers a holistic perspective on the problem by combining hydraulic data with fish telemetry positions, thereby enabling detailed analyses and supporting future studies aimed at improving our understanding of fish behavior in regulated rivers.
2. Materials and Methods
2.1. Study Site
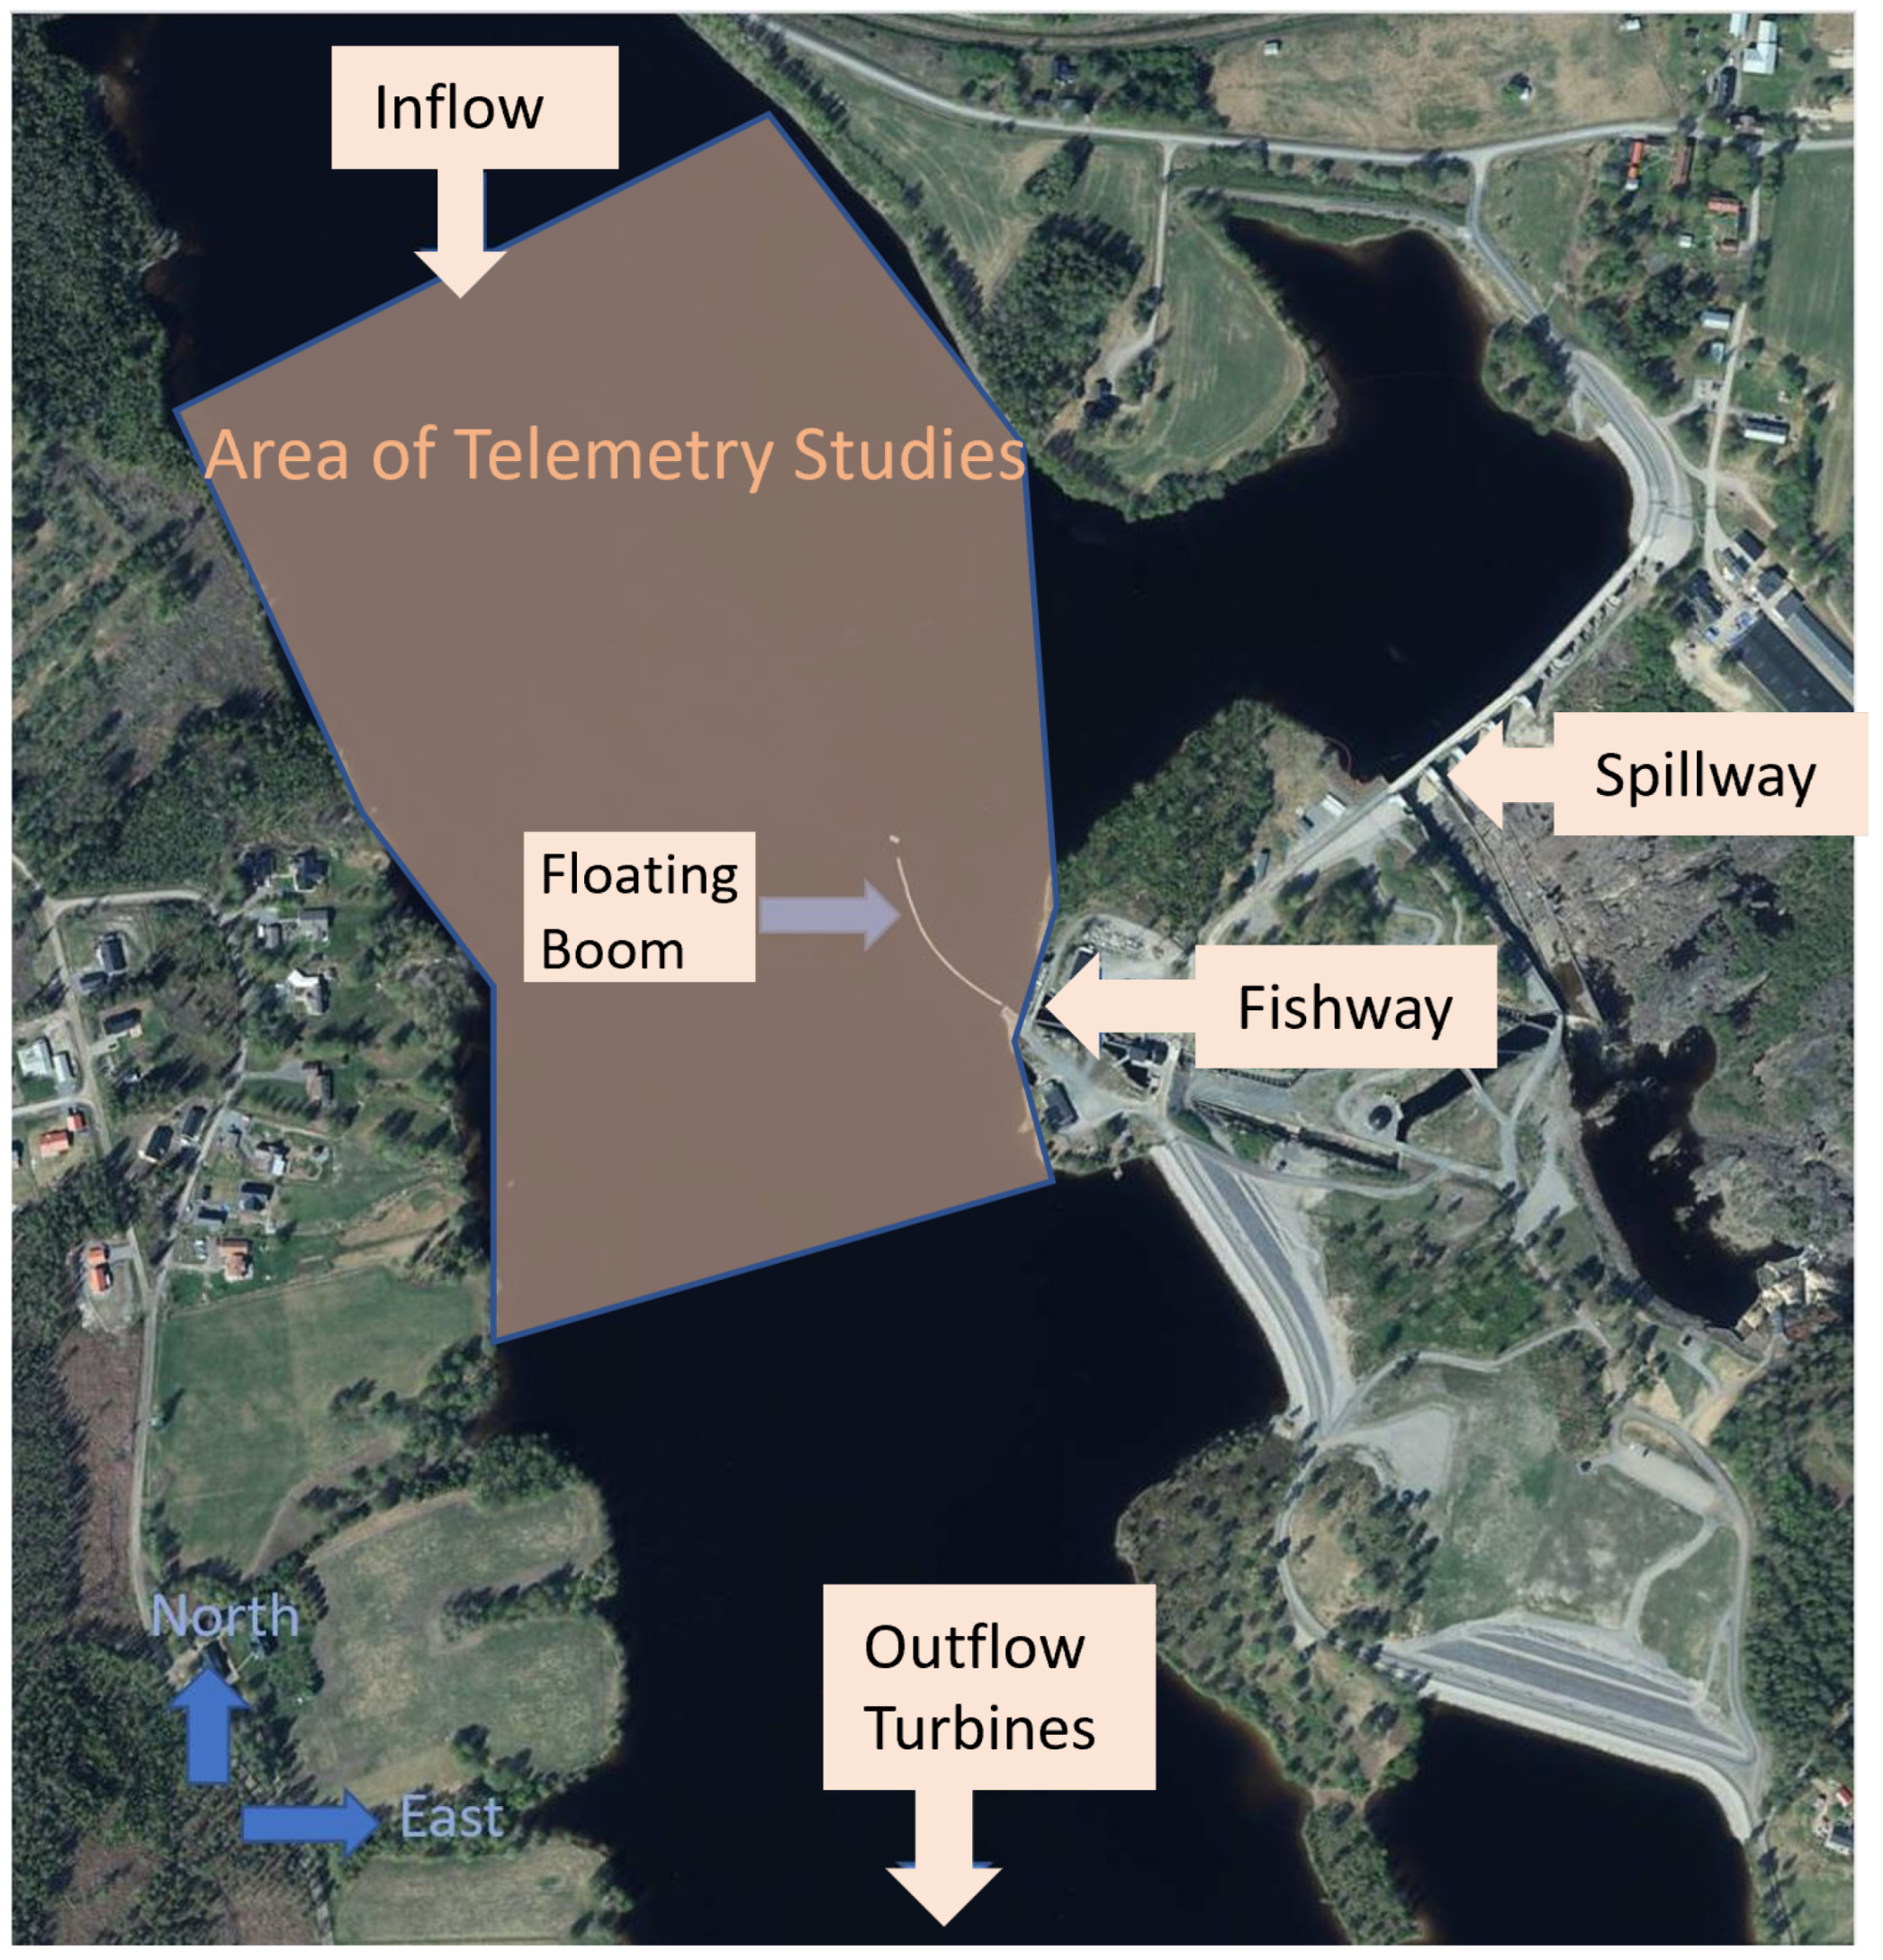
This study was conducted upstream of a hydropower plant (HPP) located in the River Umeälven in northern Sweden. The HPP consists of five turbines, with a total installed capacity of 599.4 MW. The majority of the river’s flow is directed toward the turbine intake, but during the salmonid migration season, additional flow is diverted through the fishway and spillways to facilitate fish passage.
The fishway is located on the eastern side of the riverbed, approximately 3.5 km upstream of the turbine intakes (see
Figure 1).
Telemetry studies have been conducted for several years during the migration season to monitor smolt behavior. For this study, tracks were analyzed, with telemetry measurements taken during the spring migration of 2016 and 2017 (for details, see [
15,
28]). Since the flow conditions varied during the period of data collection, the smolts were grouped based on the different flow situations encountered: 9 tracks during low flow, which resulted in approximately 5300 points; and 15 tracks during high flow, which was approximately 4300 points. The time step between the data points was, on average, 1 s.
2.2. CFD Model
The bathymetry and water velocity upstream of the power plant were measured using an Acoustic Doppler Current Q-Boat 1800 with a RiverPro 1200 kHz ADCP from Teledyne Marine, RDI in Poway, CA, USA (ADCP). The resulting point cloud of the topology was, subsequently, transformed into a bottom surface [
14] in IMAGEWARE 13, which was then imported into ANSYS 2020R2 for the creation of the CFD model. The flow is described by the Reynolds-Averaged Navier–Stokes (RANS) equations in conjunction with the continuity equation for incompressible flow:
where
are the velocity components,
is the averaged fluid pressure,
are the Reynolds stresses,
is the fluid density, and
is the kinematic viscosity. The
model with standard wall functions was chosen as the turbulent model.
The simulations were conducted as transient over each flow event. An average was then calculated for the last 200 time steps to obtain a steady representation of the flow. This approach was adopted because large-scale instabilities occur in the flow, which prevented numerical convergence for the steady-state calculations. The convergence criterion for the calculations of pressure and velocities was set at an RMS value below .
The model was simulated using a rigid-lid approximation, which is a suitable initial approach due to the stringent restrictions on water level variations in hydropower dams and has been shown to give a viable approximation when the water level variation is smaller than
of the total channel depth [
11]. The bottom was defined as a no-slip condition with a roughness of
m, which has been validated in another part of the river [
29]. The height of the tetrahedral elements is approximately 1 m in the low-resolution region and around
m in the refined mesh area. The boundary conditions are defined with the inlet as an constant flow rate, using the total discharge as the specified value, and the outlet as a discharge boundary, with flow rates recorded from the hydropower company at the relevant time for the fishway, spillways, and turbines.
2.3. Mesh Study
A mesh study was conducted using Richardson extrapolation across three different mesh sizes (according to [
30]): coarse, medium, and fine. The convergence study was made for different velocity points in the three meshes. The analysis demonstrated reliable convergence, as indicated by the apparent order of accuracy and decreasing relative errors with grid refinement. Based on the results in
Table 1, the medium-resolution mesh was selected as it is considered to provide sufficient accuracy for analysis while maintaining computational efficiency.
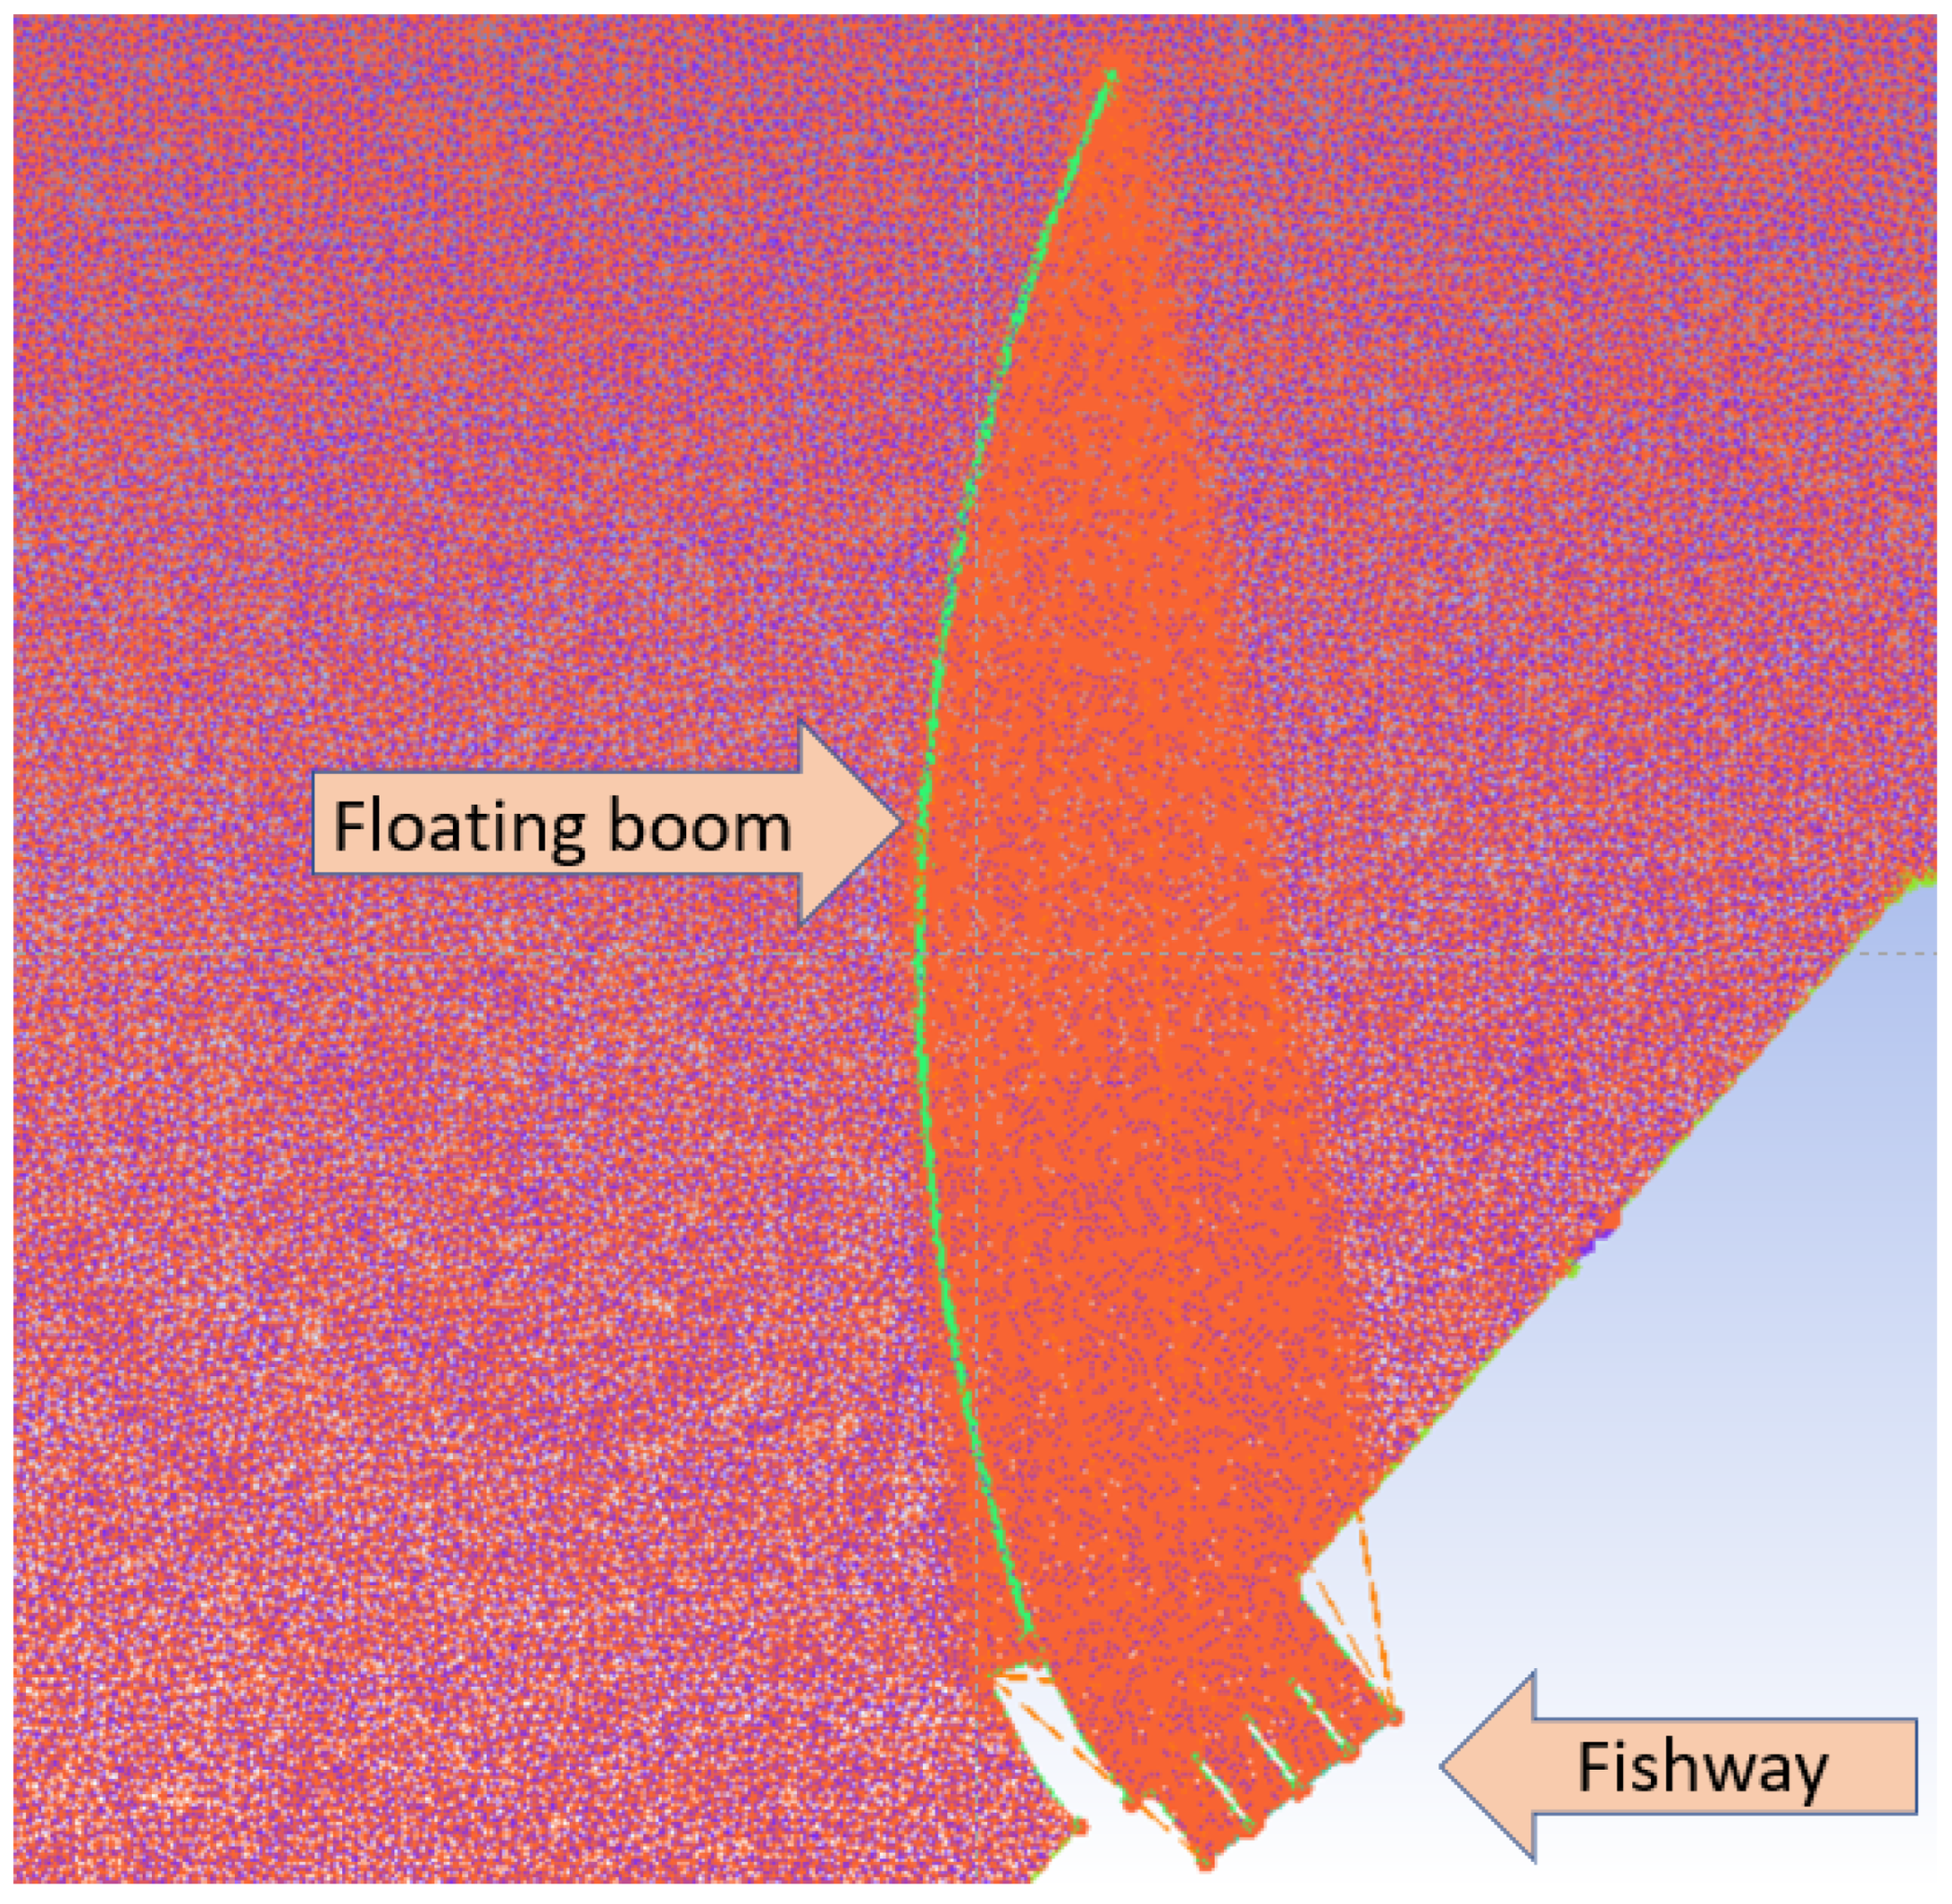
In the CFD model, the volumes were discretized using tetrahedral elements. Local grid refinement was applied to the region around the entrance to the fish and around the floating boom (see
Figure 2) as this flow area is of particular interest. The final grid consisted of approximately 3 M nodes and 18 M tetrahedral elements.
The Grid Convergence Index (GCI) of 0.0715, obtained from Richardson extrapolation, indicates the estimated numerical uncertainty due to grid resolution. The GCI of this magnitude suggests that the solution is reasonably grid-independent, with an approximately 7% estimated error between the current and the asymptotic fine-grid solution.
2.4. Validation of the CFD Model
To assess the reliability of the numerical model, validation was conducted using field measurements acquired from an Acoustic Doppler Current Profiler (ADCP). Measurements were carried out in connection with the installation of the boom, and model validation was also performed as part of this work (for further details, see [
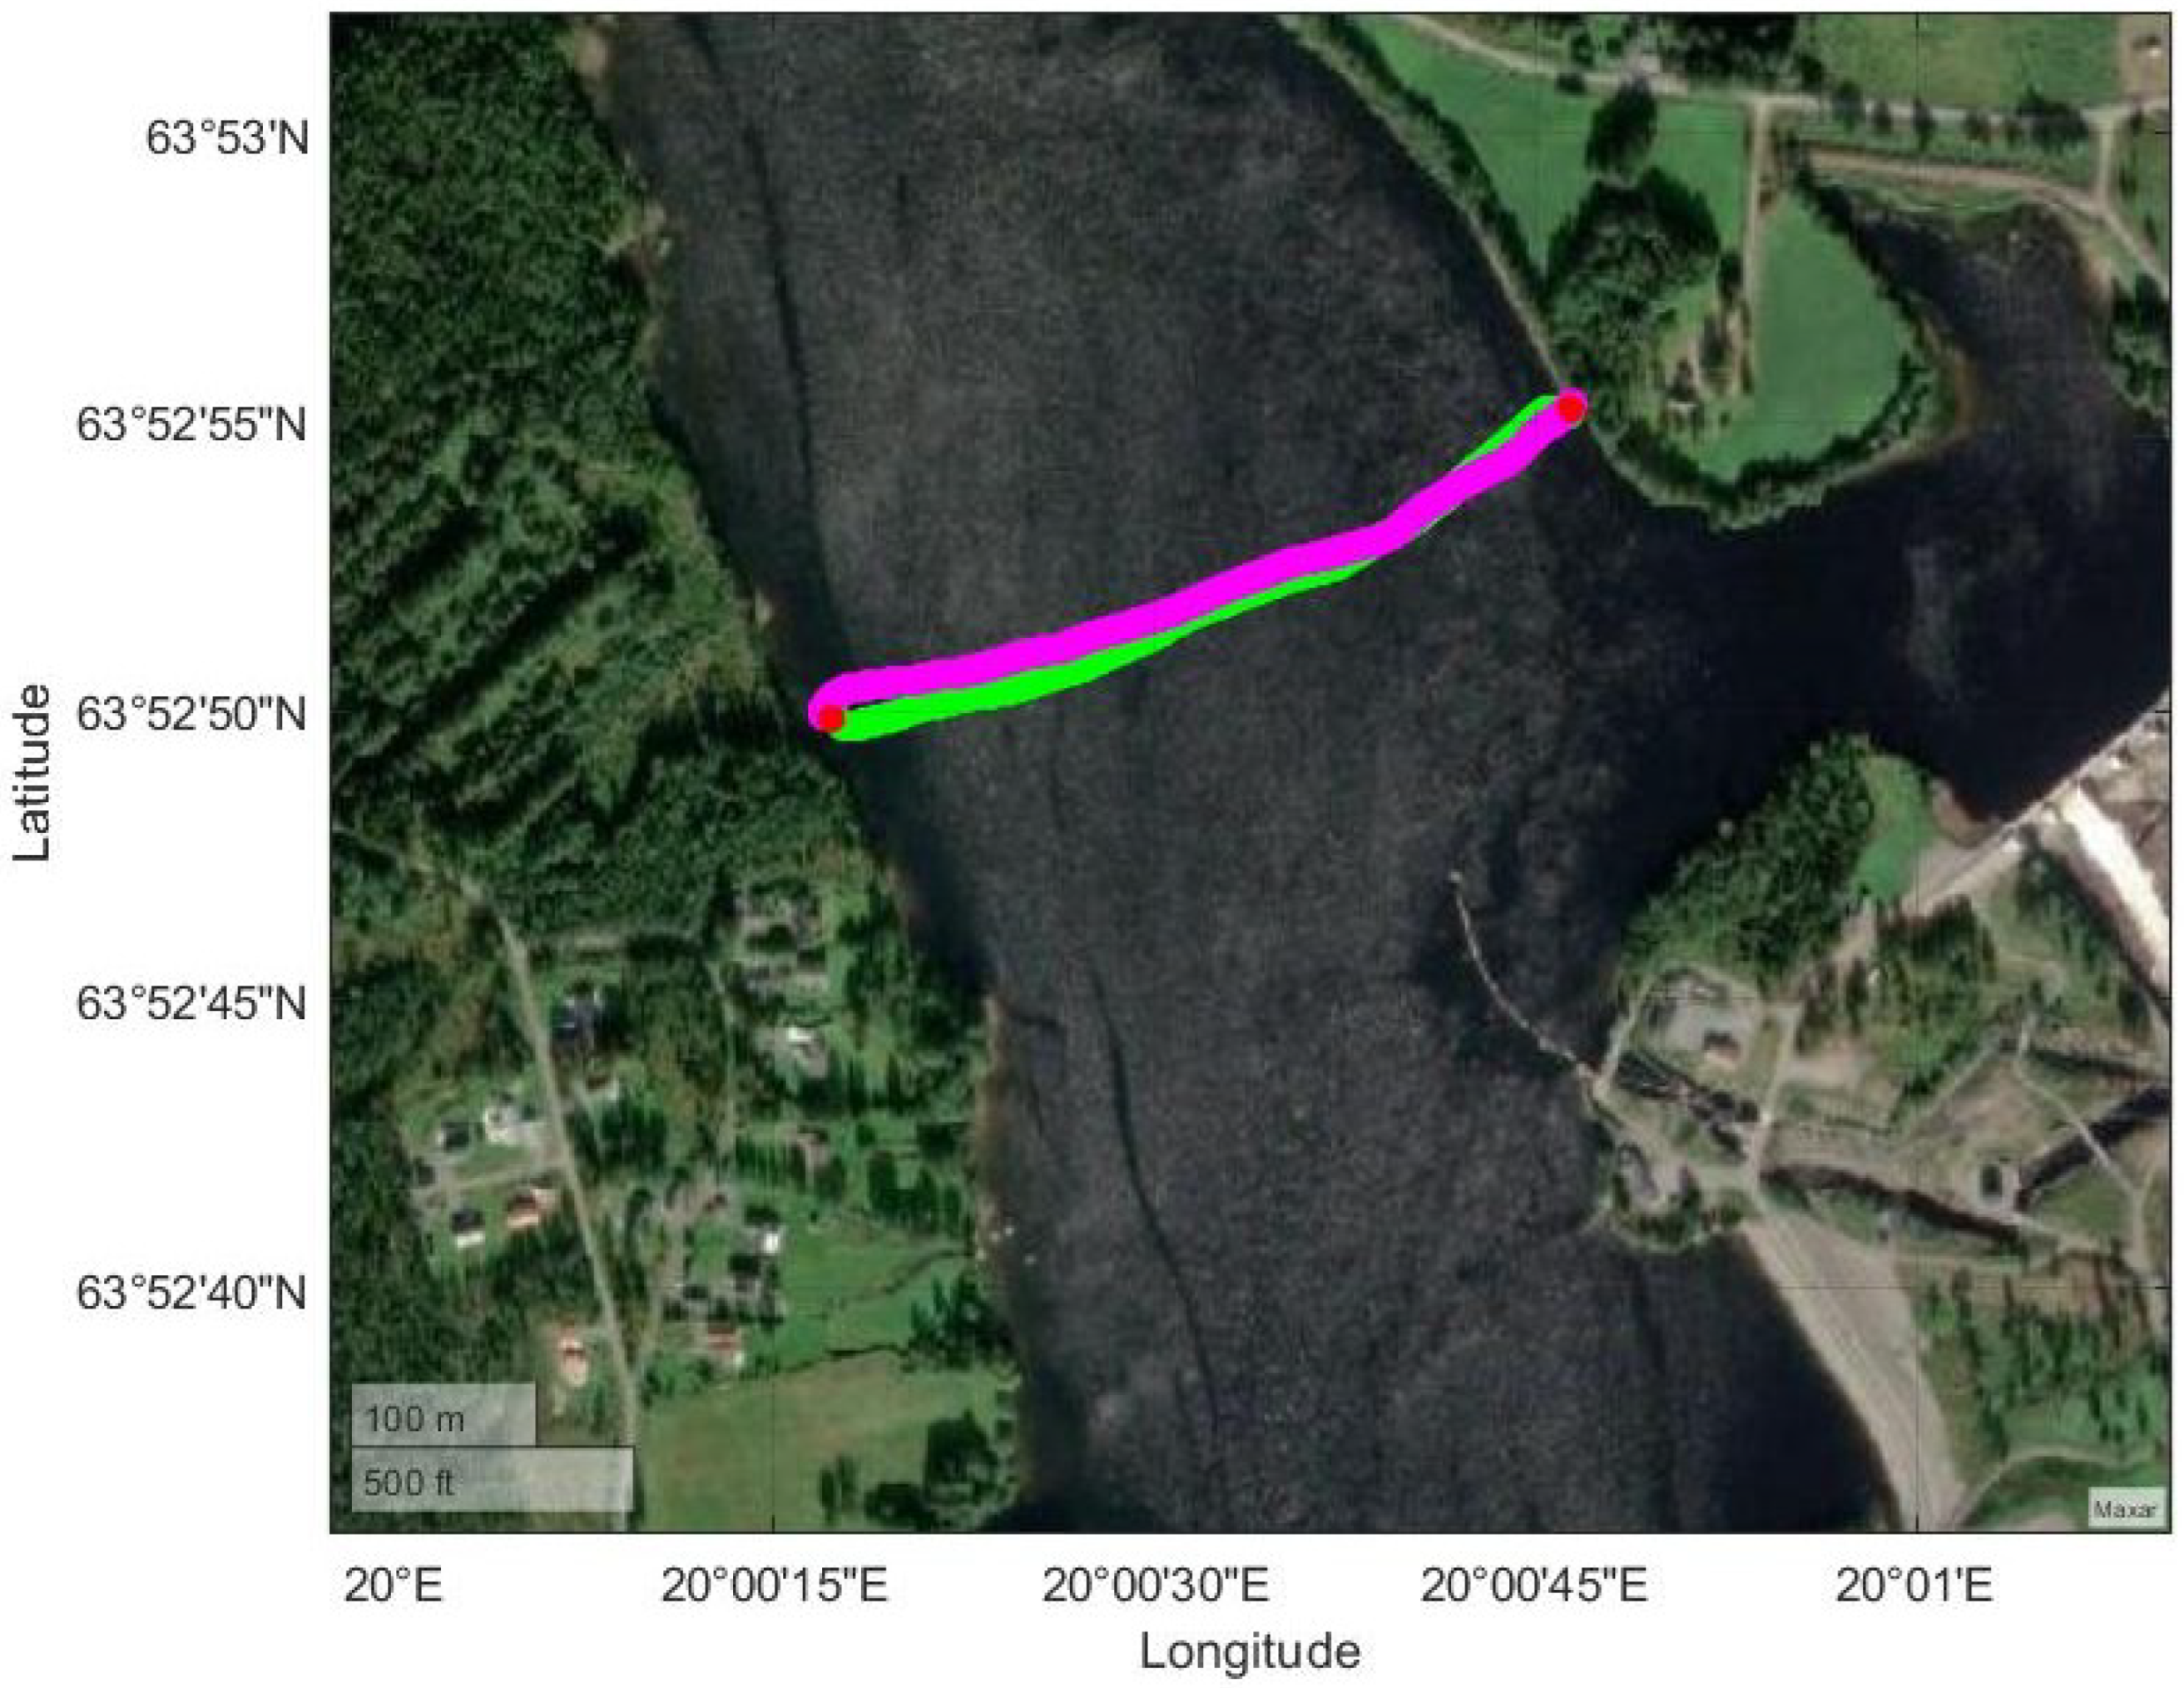
4]). The ADCP recorded data consisted of two measurements of the horizontal velocity components (U and V) along a designated transect within the study area. These measurements provide a high-resolution dataset for evaluating the model’s ability to reproduce observed flow dynamics. The placement of the transects is shown in
Figure 3.
The same transect was extracted from the numerical simulation and is presented in
Figure 4. The transect was viewed from upstream to downstream, with the deepest part of the river located on the eastern side. The measured flow rate in the river during the ADCP measurements was approximately
, and the numerical model was validated using the same flow configuration. A comparative analysis between the measured and simulated velocity contours showed a correspondence in both flow directions. This agreement indicates that the model successfully captures the spatial variation and structure of the velocity field, thereby demonstrating its capability to reproduce the key hydrodynamic features of the system under investigation. In
Figure 4, the two upper transects are derived from ADCP measurements, while the lower transect is based on simulated data.
2.5. Combining Fish Positioning and Hydraulics
The telemetry tracks were imported into Ansys CFX Post as polylines. The water velocities for each point along the tracks could then be exported for further analysis. Two flow cases for the traces were simulated. The first case was a high-flow scenario with through the turbines, through the fishway, and through the spillway. The second case was a low-flow scenario with through the turbines, through the fishway, and through the spillways. The different tracks have been grouped based on the flow case they correspond to.
Since only 2D measurements of the smolt tracks were available, it was assumed that they were swimming near the surface [
3] and the polylines were placed at two meters depth, even though studies have shown that the smolt sometimes travels near the bottom of the river structure; however, this is potentially due to anti-predator behavior [
31,
32,
33]. Previous studies in this particular area have also shown that smolts are typically found at a depth of around two meters, unless external disturbances, such as barriers or predation, occur [
15]. The positional accuracy of the telemetry system in this area was quantified. For the relevant tracks, the mean positional error was 2.54 m, the median 1.27 m, and the standard error 0.11 m. These values were determined using a reference transmitter deployed simultaneously with an RTK-GPS in the same study from which the fish tracks were obtained. Further details are provided in [
28].
2.6. Analysis of Fish Movement in Relation to Local Flow Conditions
The analysis of fish tracks was based on the flow velocities experienced by the fish at a given point in time,
, and the velocity conditions at the subsequent location chosen by the fish in the next time step,
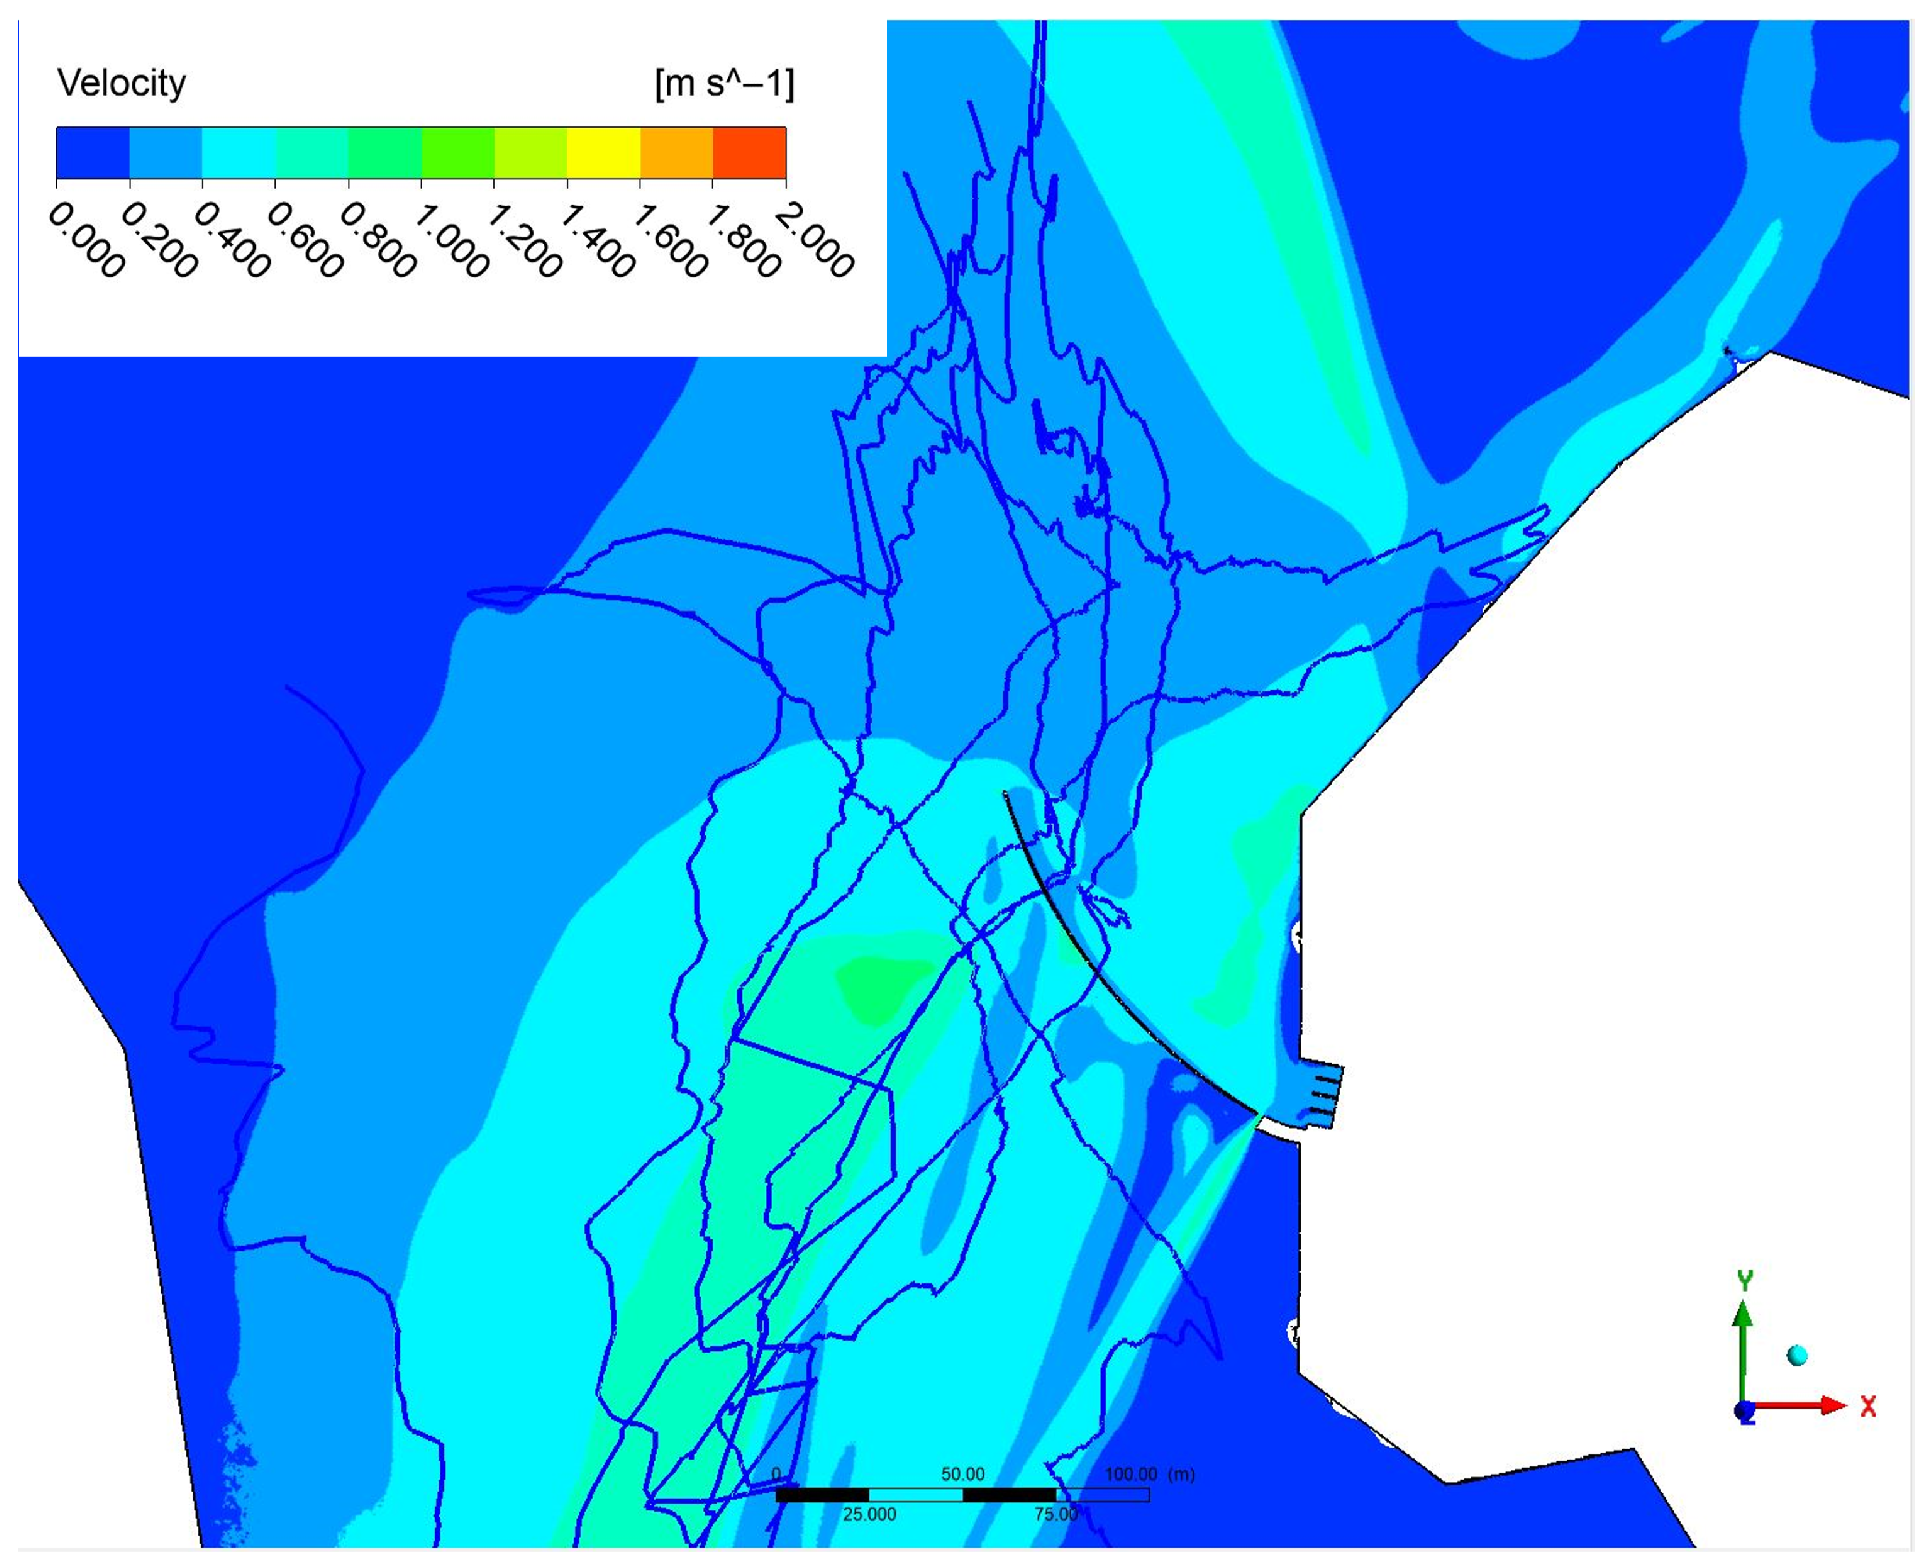
. A visualization of the fish movement through the mesh is presented in
Figure 5. The magnitude of the averaged water velocities were analyzed as
.
To facilitate analysis, the velocity data were grouped into bins of . The analysis was performed on multiple trajectories under two distinct flow rates, the abovementioned low-flow and high-flow scenarios. The resulting behavioral patterns were then compared between the two flow regimes.
The data was analyzed by evaluating the number of transitions between two time steps occurring within each velocity category. This approach makes it possible to identify the velocities at which most movements occur and to assess how velocity influences fish behavior.
The number of transitions represents the count of cases where the velocity increases:
By analyzing the magnitude of velocity changes to the next time step, one can gain insight into how the velocity influences behavior. Large velocity changes between time steps may indicate that the fish actively choose to move toward areas with higher velocity. All smolts observed during each flow condition were analyzed collectively, without consideration of individual tracks. At each point in time, the analysis focused on the transition to the subsequent time step.
For each velocity bin of , the number of points where the velocity either increased or decreased in the next time step was calculated. Additionally, the magnitude of the velocity change was determined for each time step.
The distribution of velocities at each time step was also analyzed to provide insight into the movement choices of the fish and to better understand how velocity conditions may have influenced their swimming behavior.
3. Results
3.1. Smolt Behavior at Low-Flow Conditions
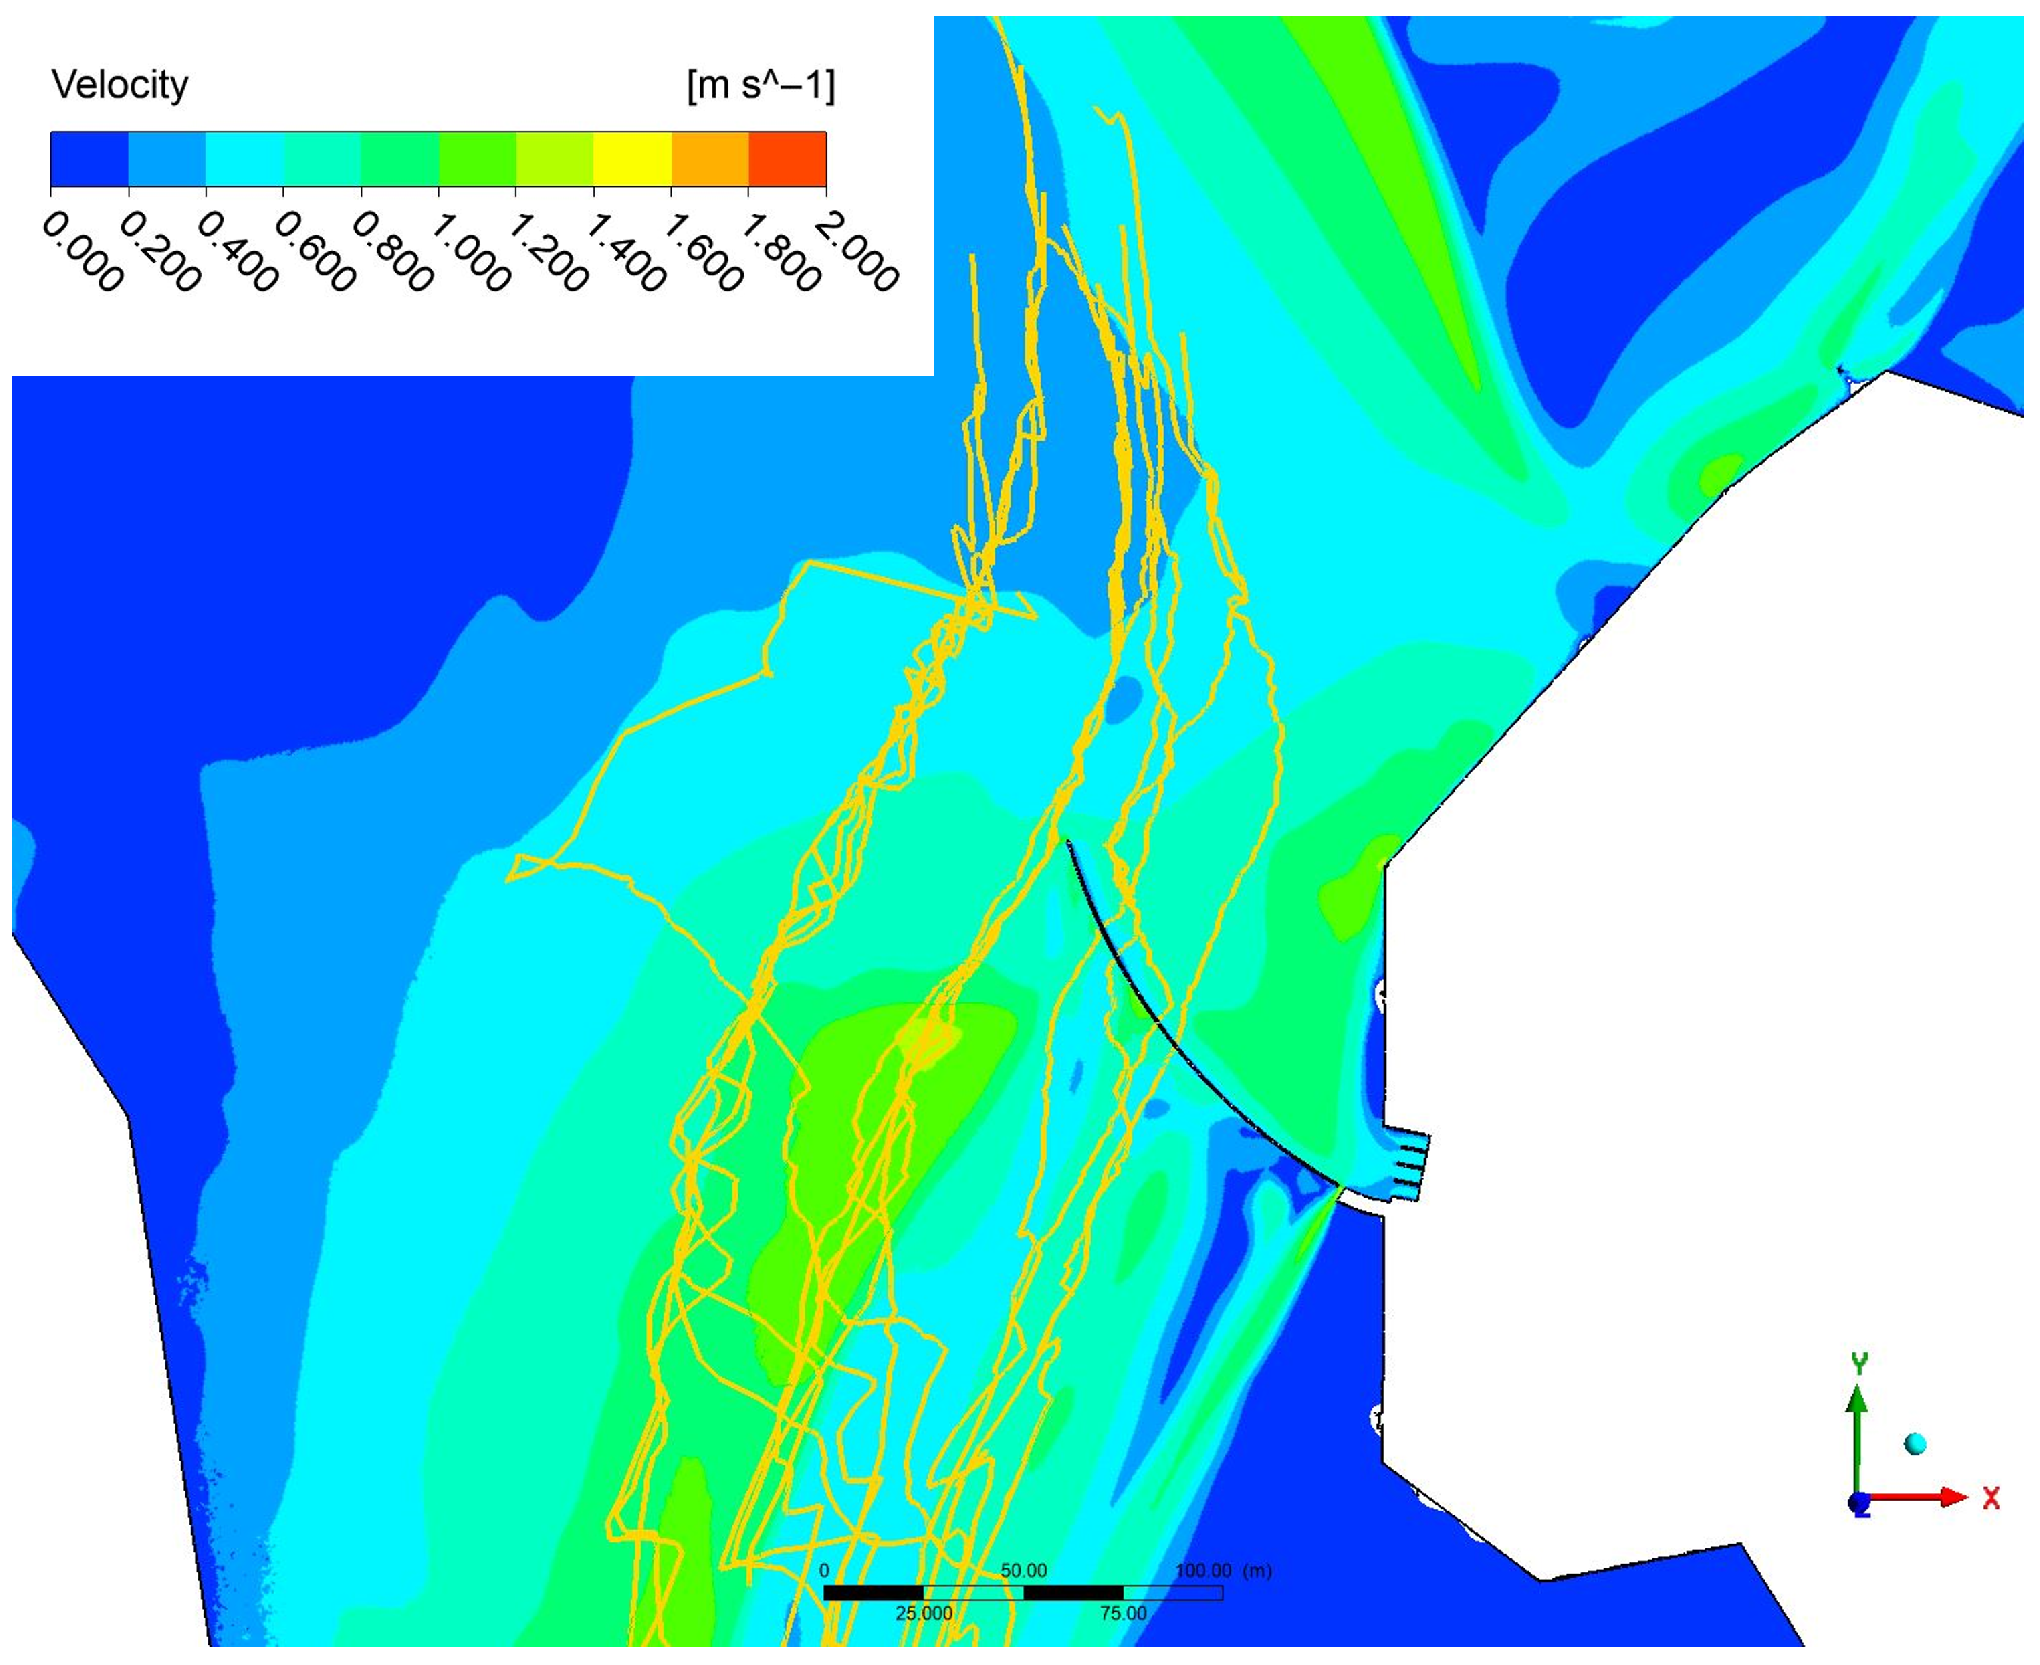
In flow scenarios with lower discharge, the smolt movement patterns tend to be more dispersed across the entire river stretch, with fish swimming back and forth across the main flow direction. The telemetry tracks from the modeled low-flow scenario with their corresponding water velocities are shown in
Figure 6.
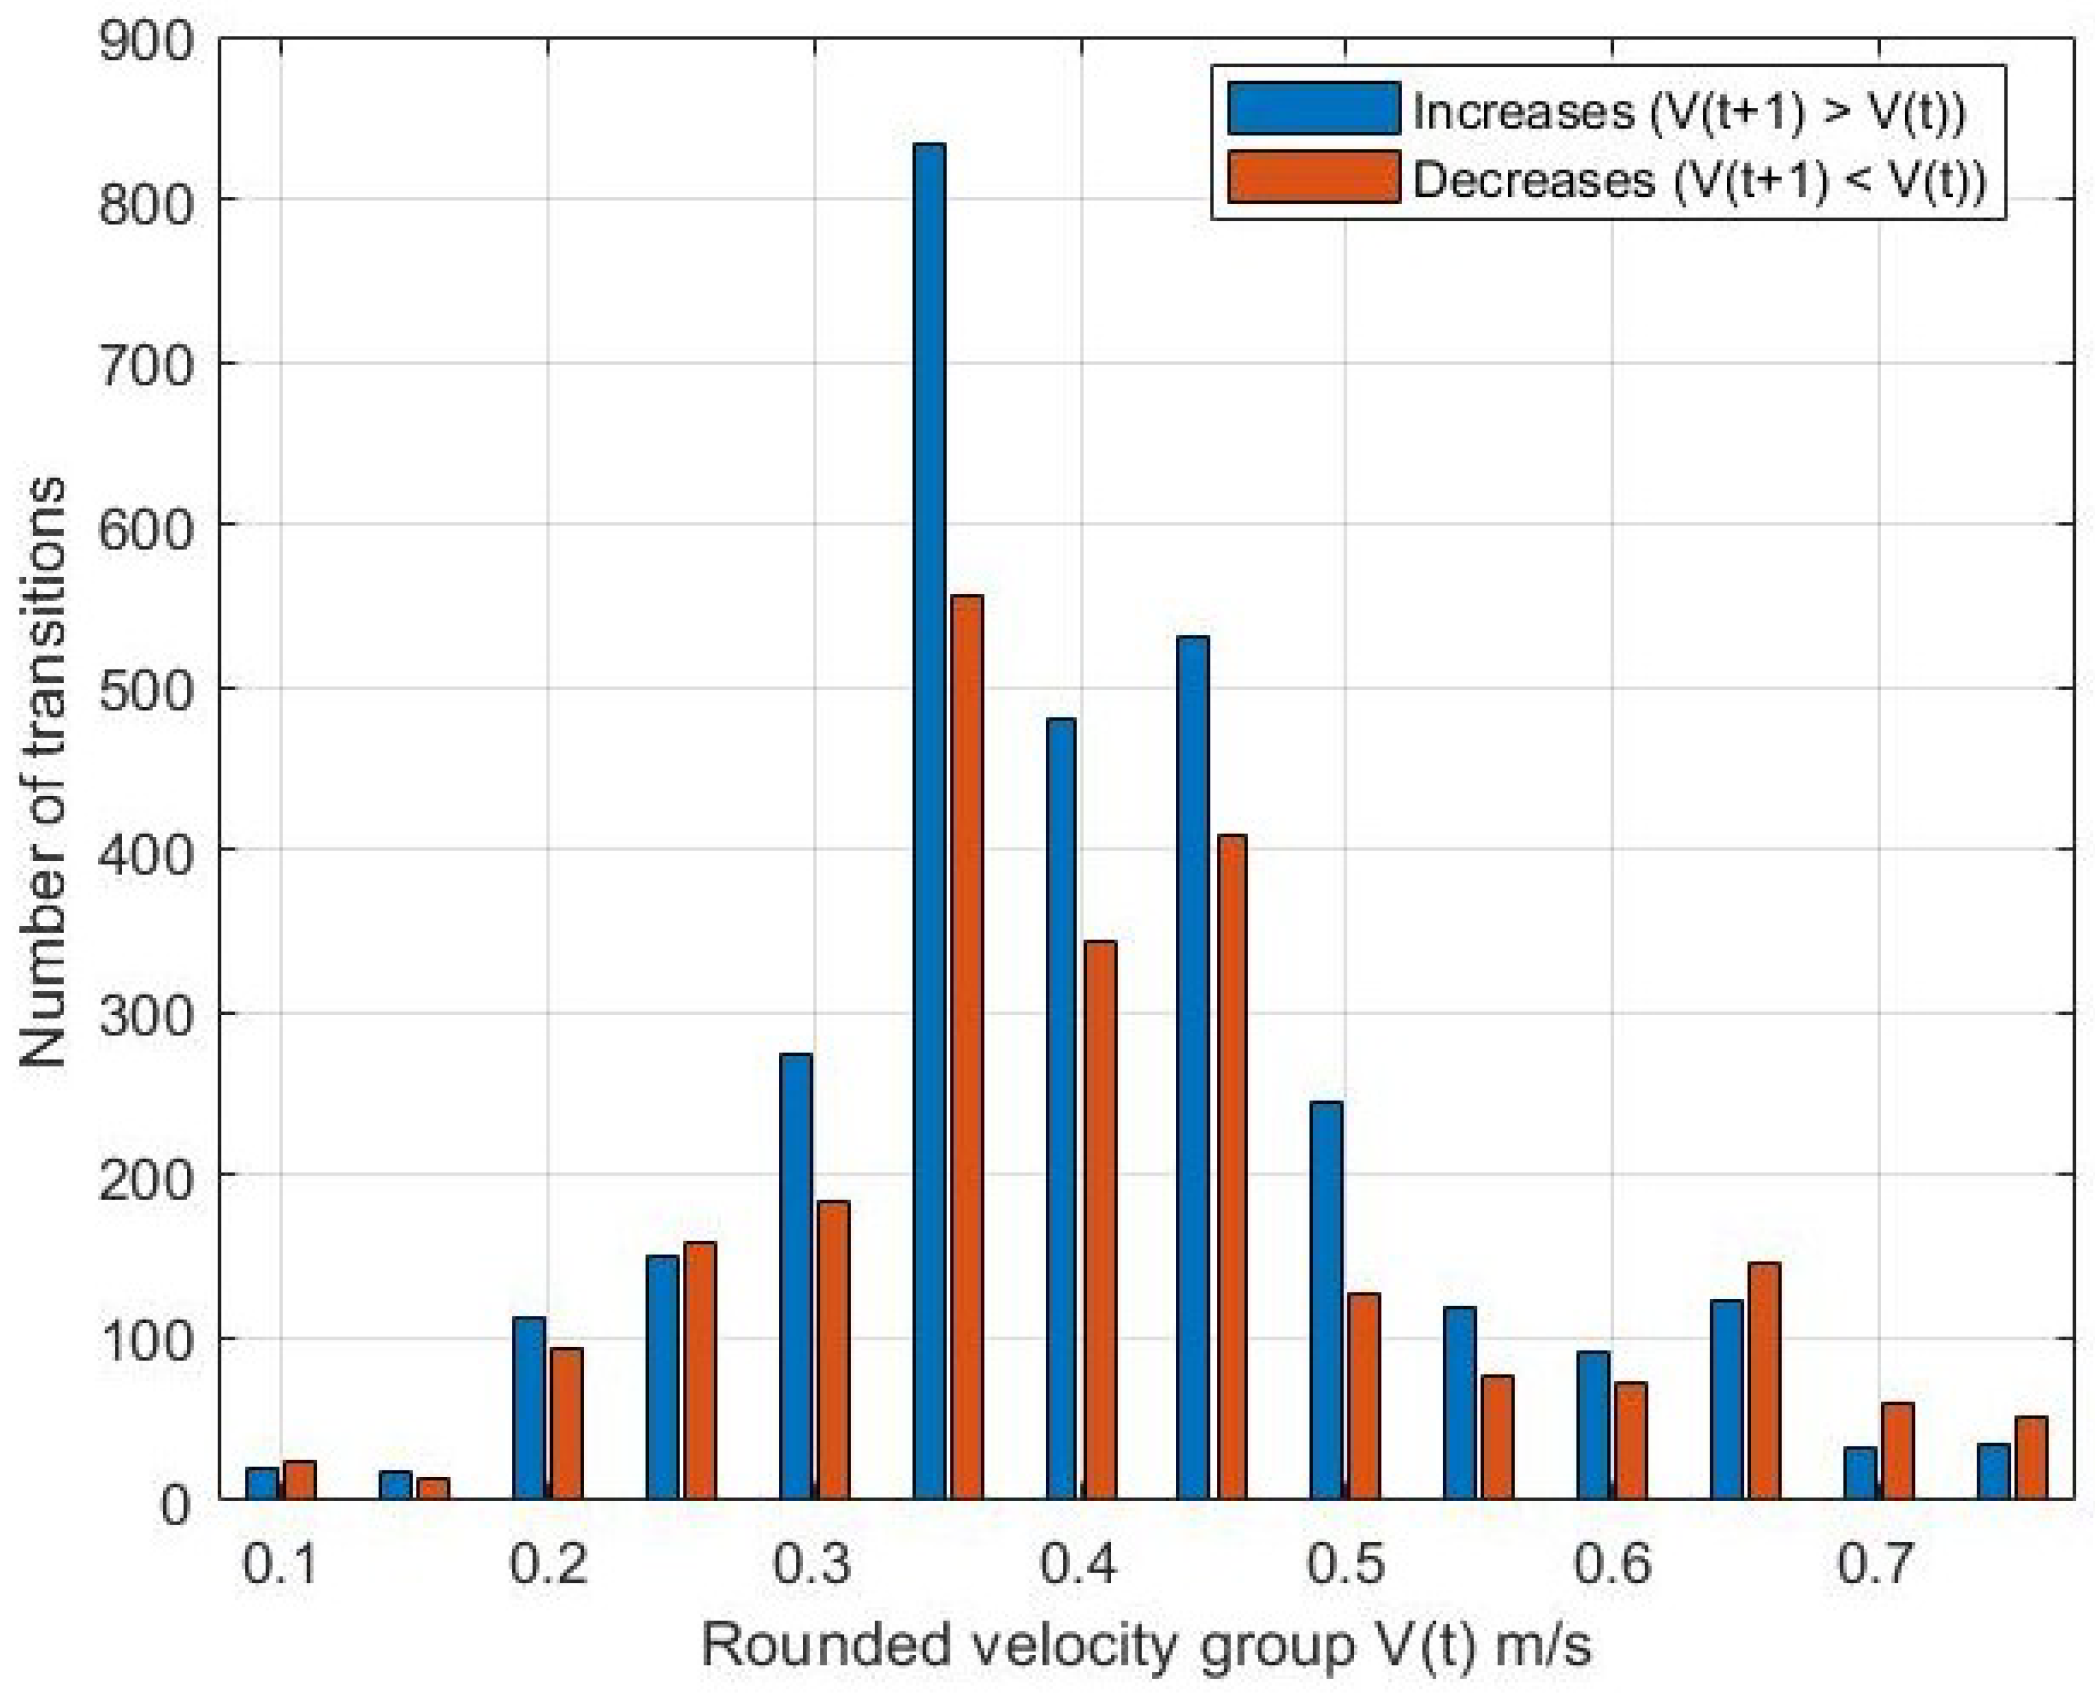
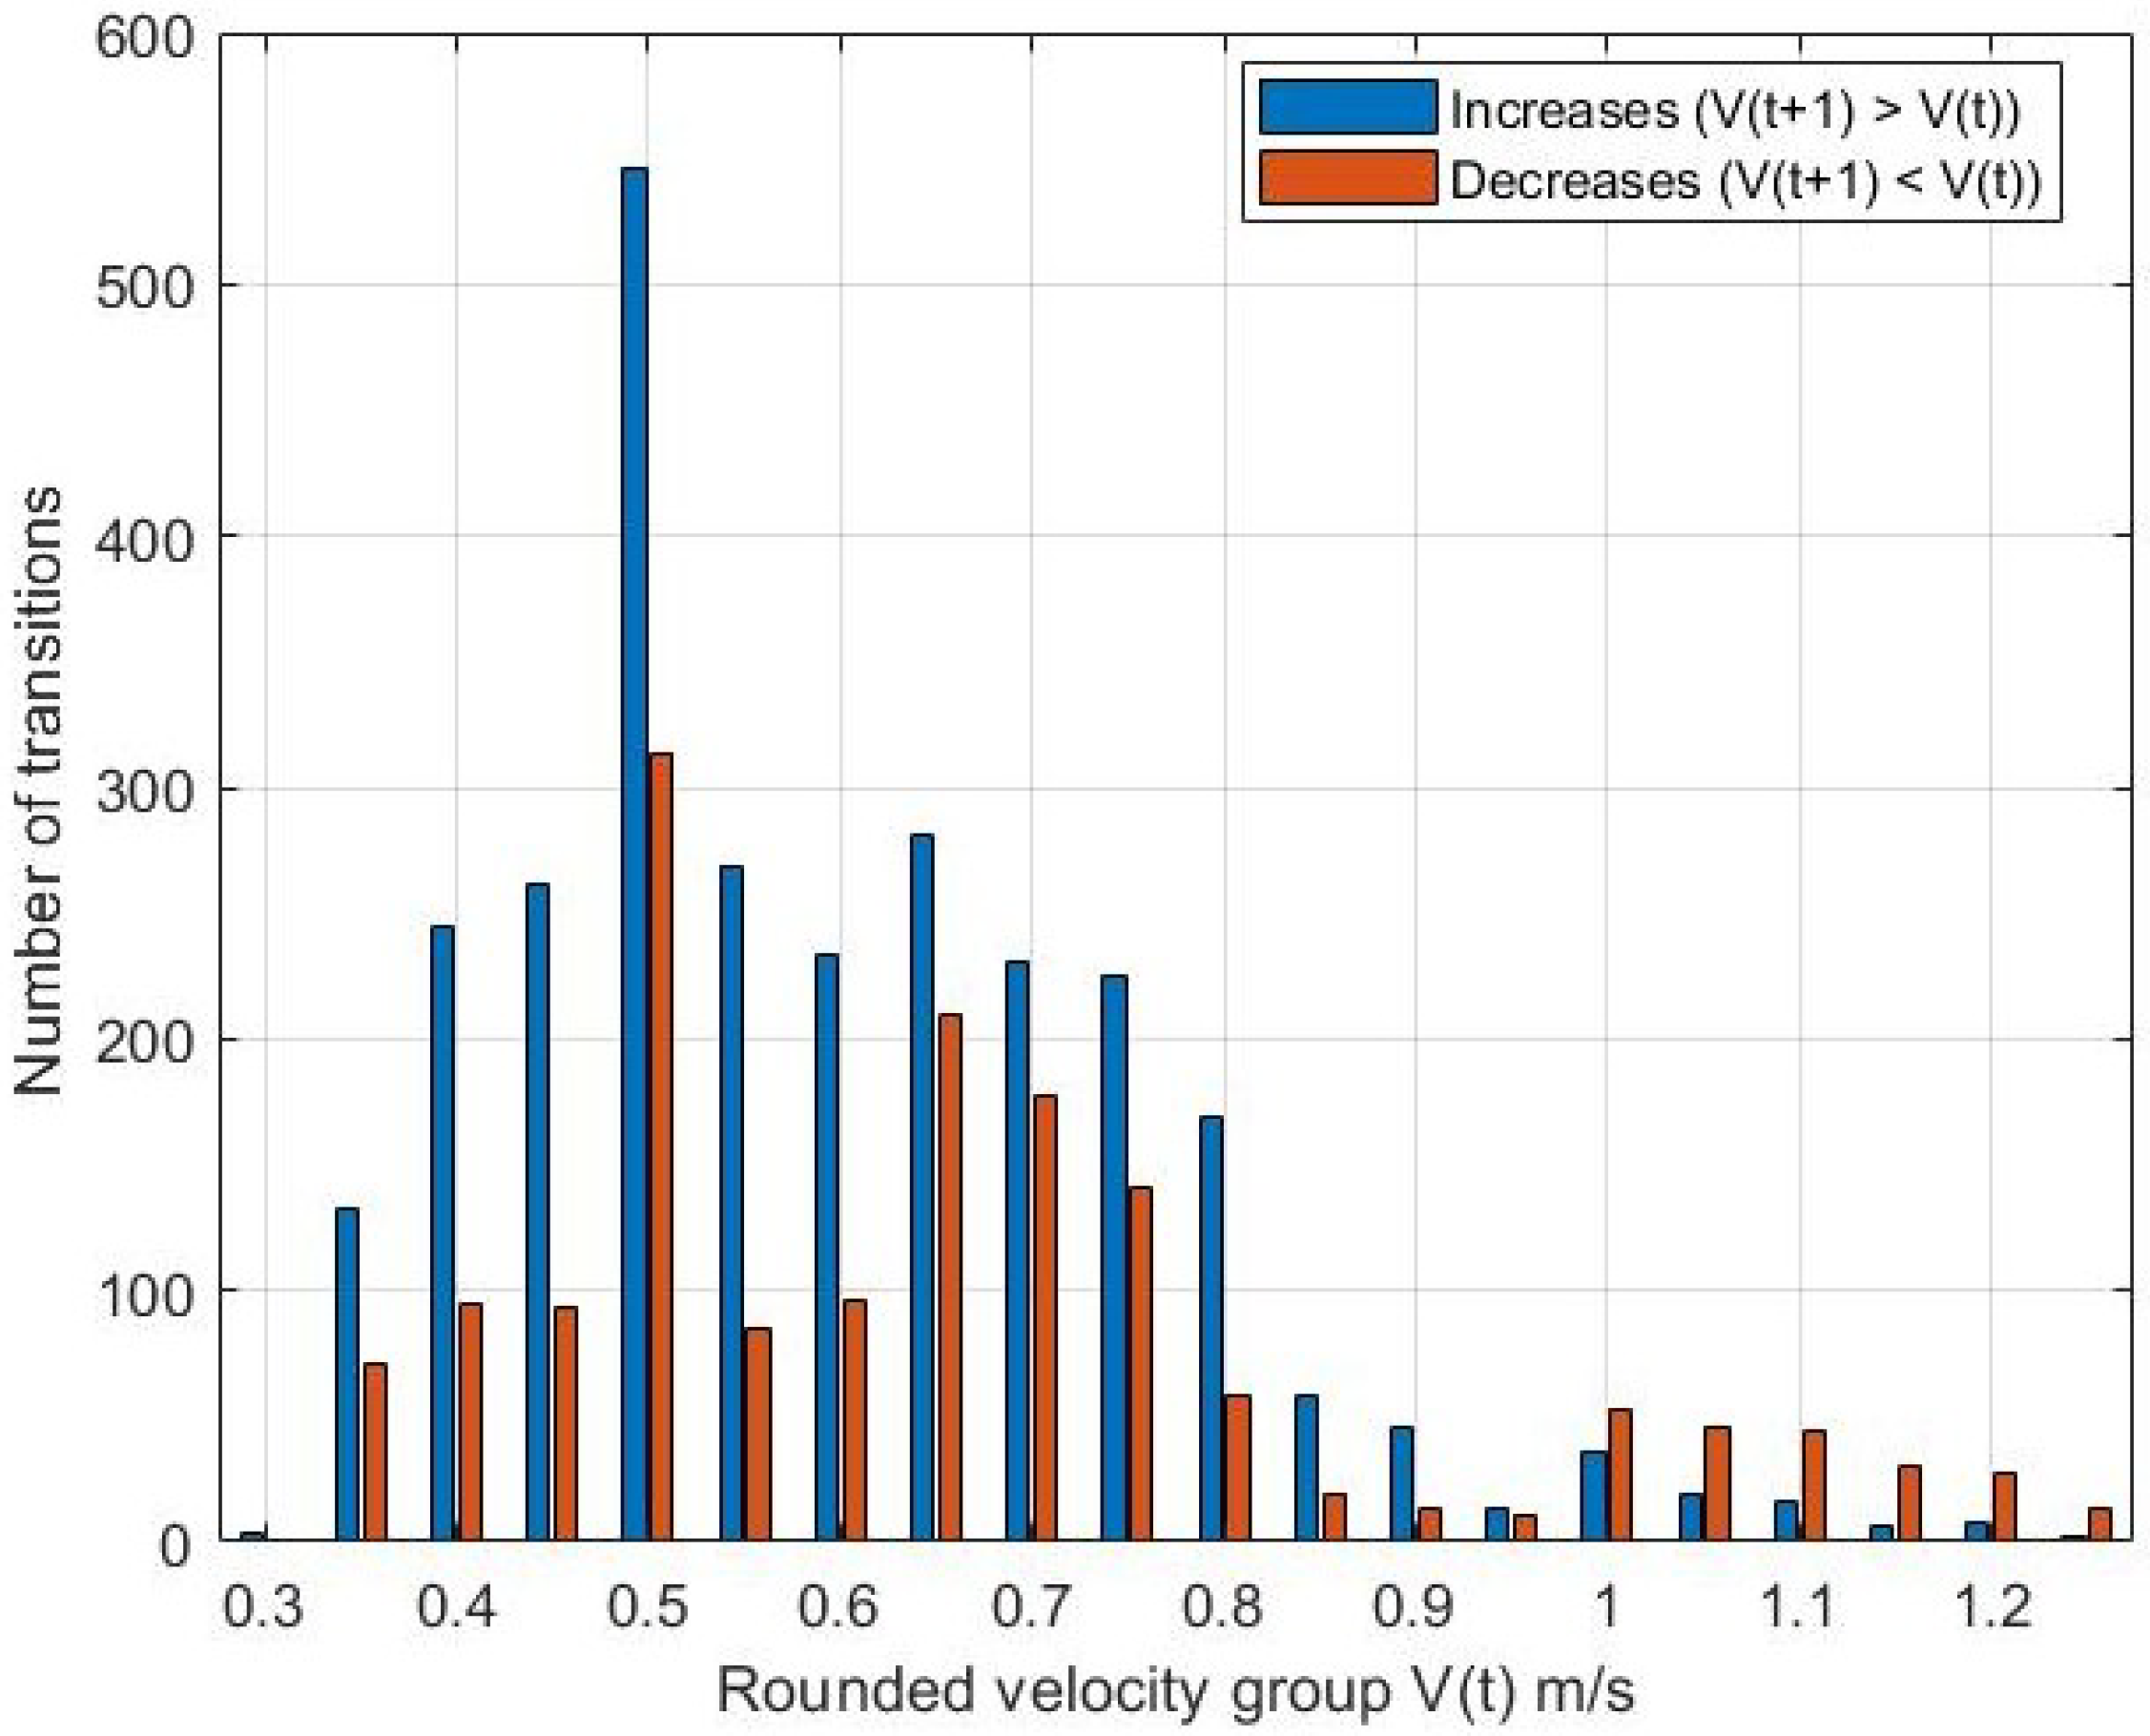
Figure 7 shows both the number of movements toward higher velocities and those occurring toward lower velocities. It can be observed that movements most often occur toward higher velocities, particularly at
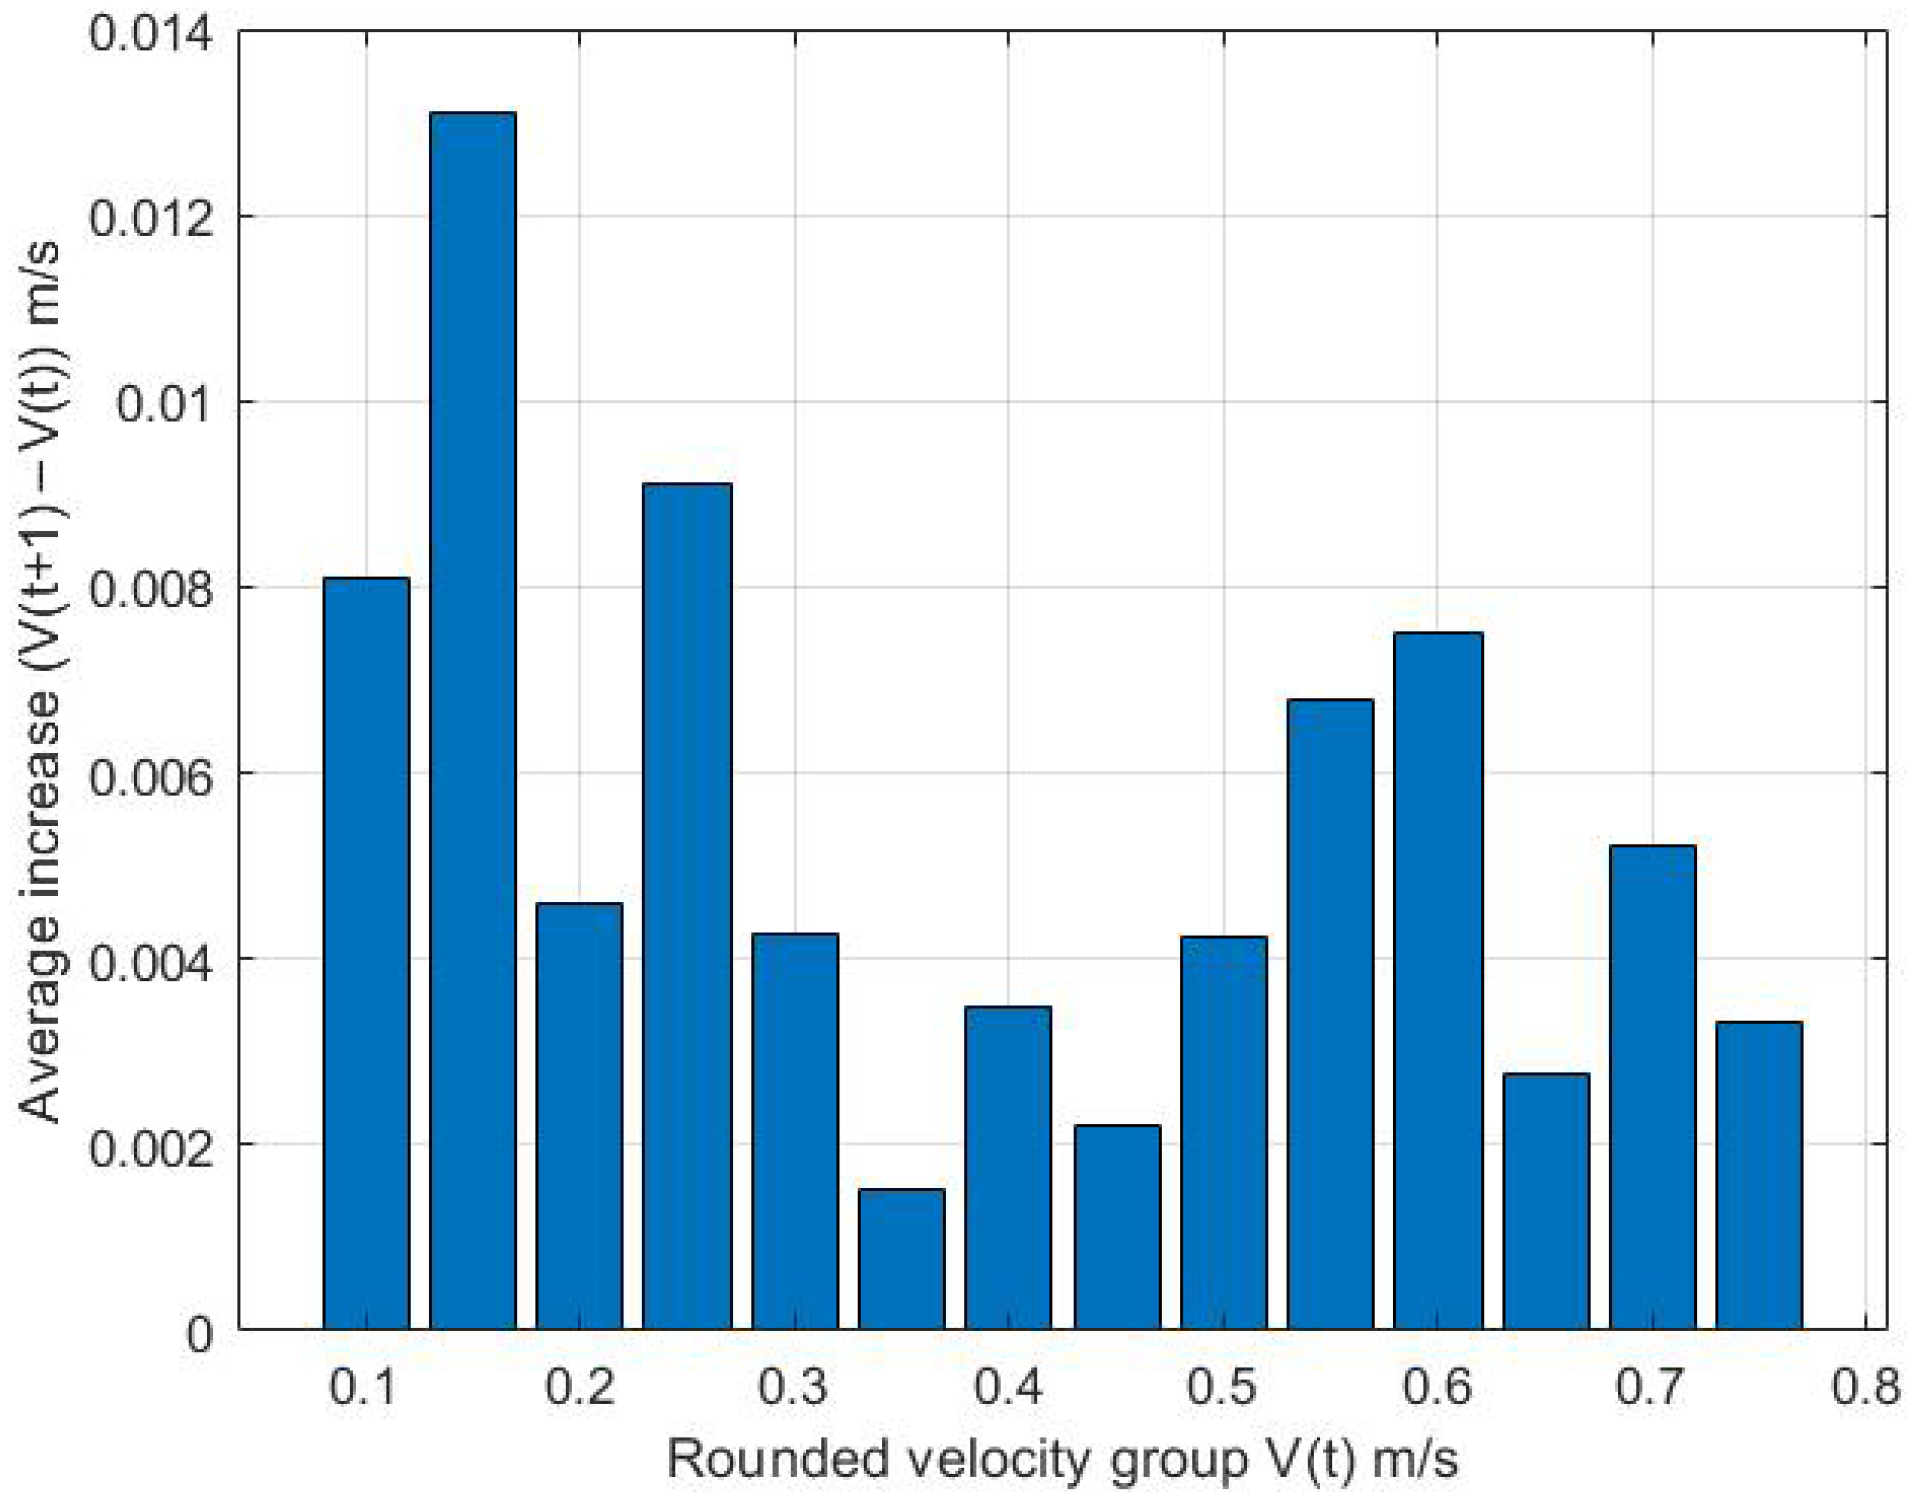
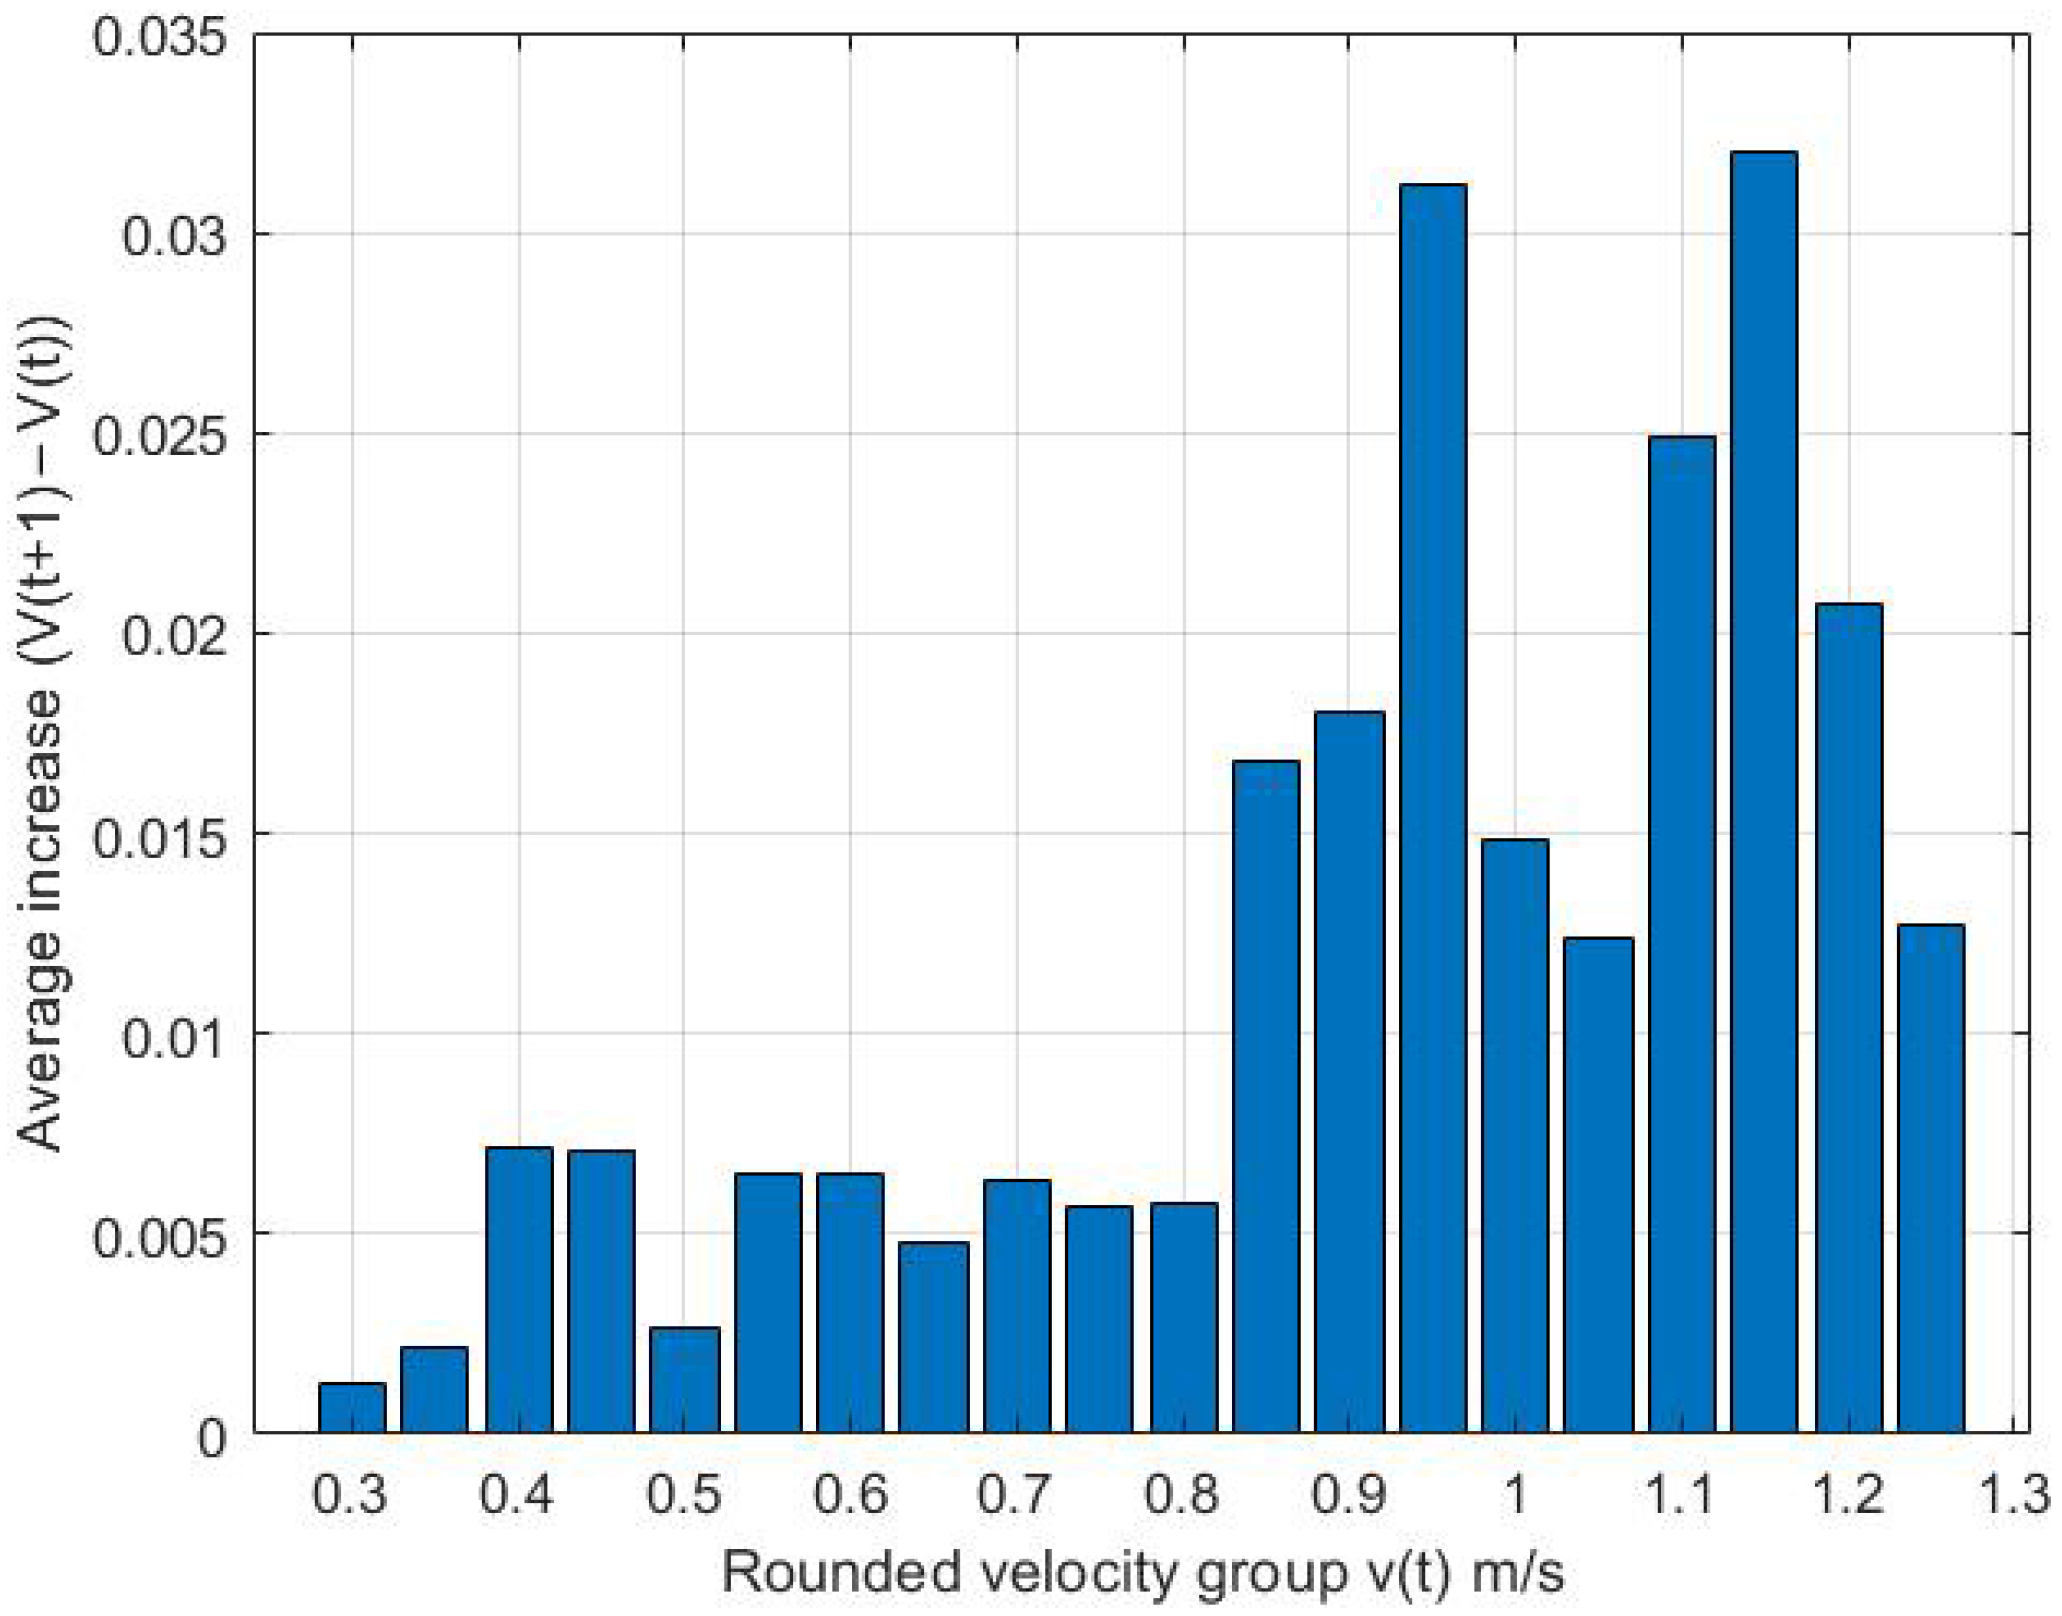
. Although the velocity changes are small, as seen in
Figure 8, this may still indicate a tendency for the fish to move toward higher velocities.
By examining the number of transitions per velocity group toward a higher flow velocity, a trend emerges: the highest number of transitions occurs around velocities of approximately
, with fewer transitions observed at lower velocity ranges. The key metric here is the ratio between increases and decreases in velocity. While most observations occur at
m/s, the largest difference—indicating the clearest tendency for fish to choose a higher velocity—is observed at
m/s (see
Figure 7).
Figure 8 illustrates the average velocity increases between consecutive time steps, from
to
, for each velocity bin. The largest increase was observed when the fish were initially located in areas with velocities around
, where they moved to regions with velocities approximately
higher. The smallest change occurred at starting velocities of
, with an average increase of only
. Overall, the trend suggests that fish tend to move toward areas with greater velocity differences when starting from lower flow conditions.
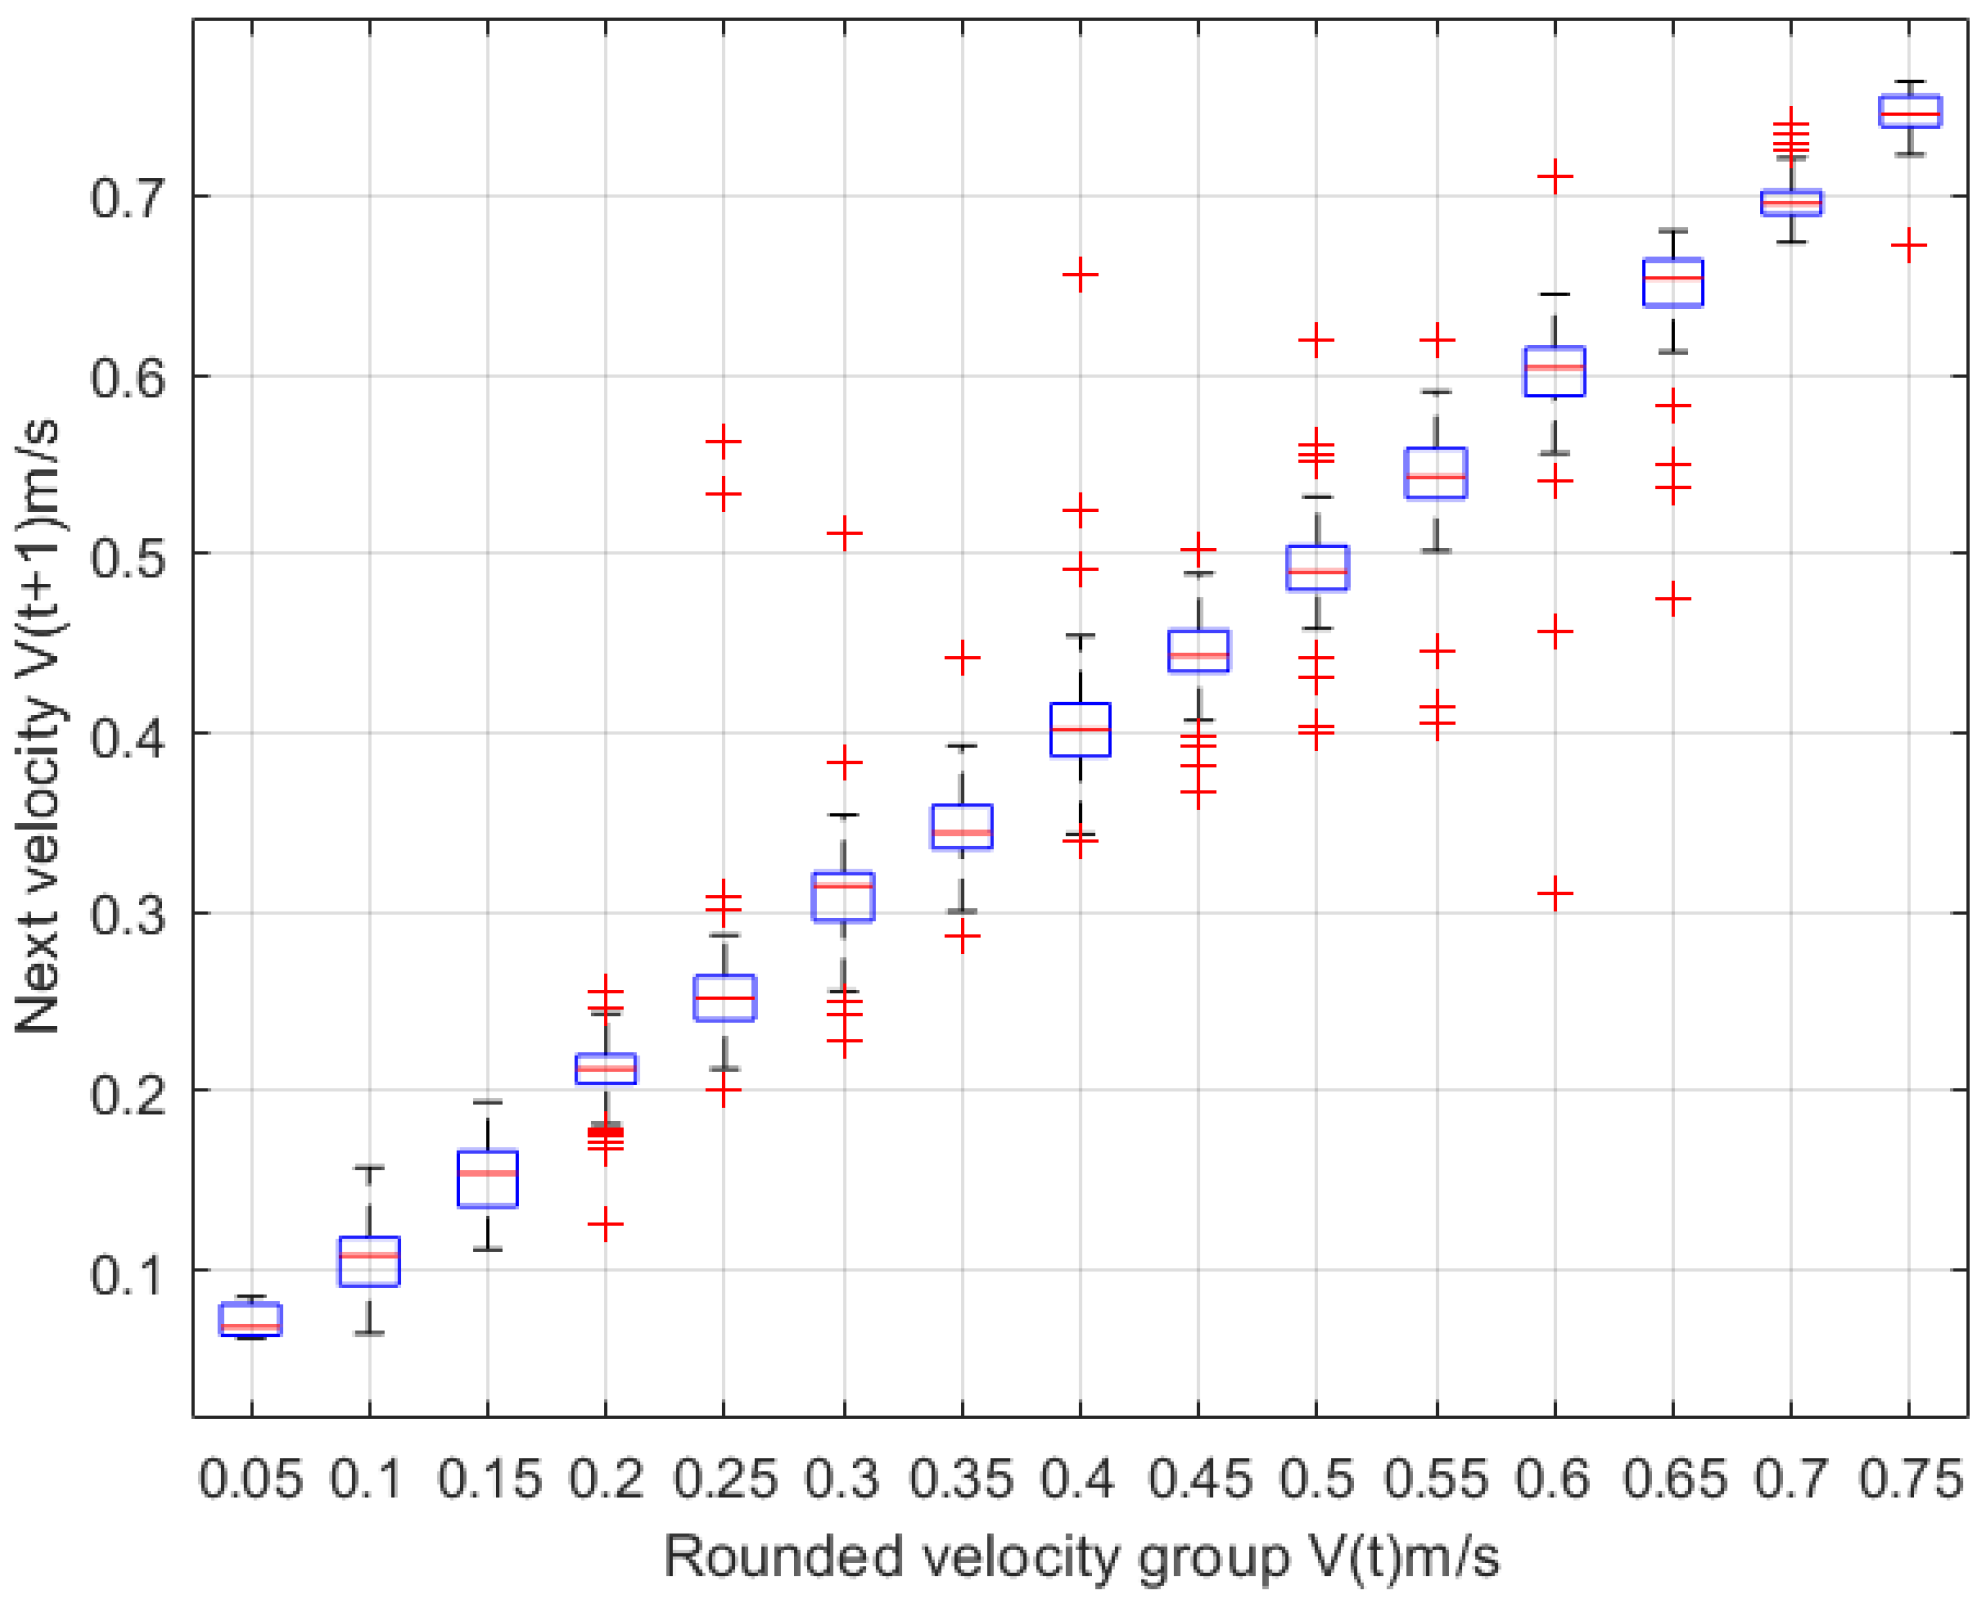
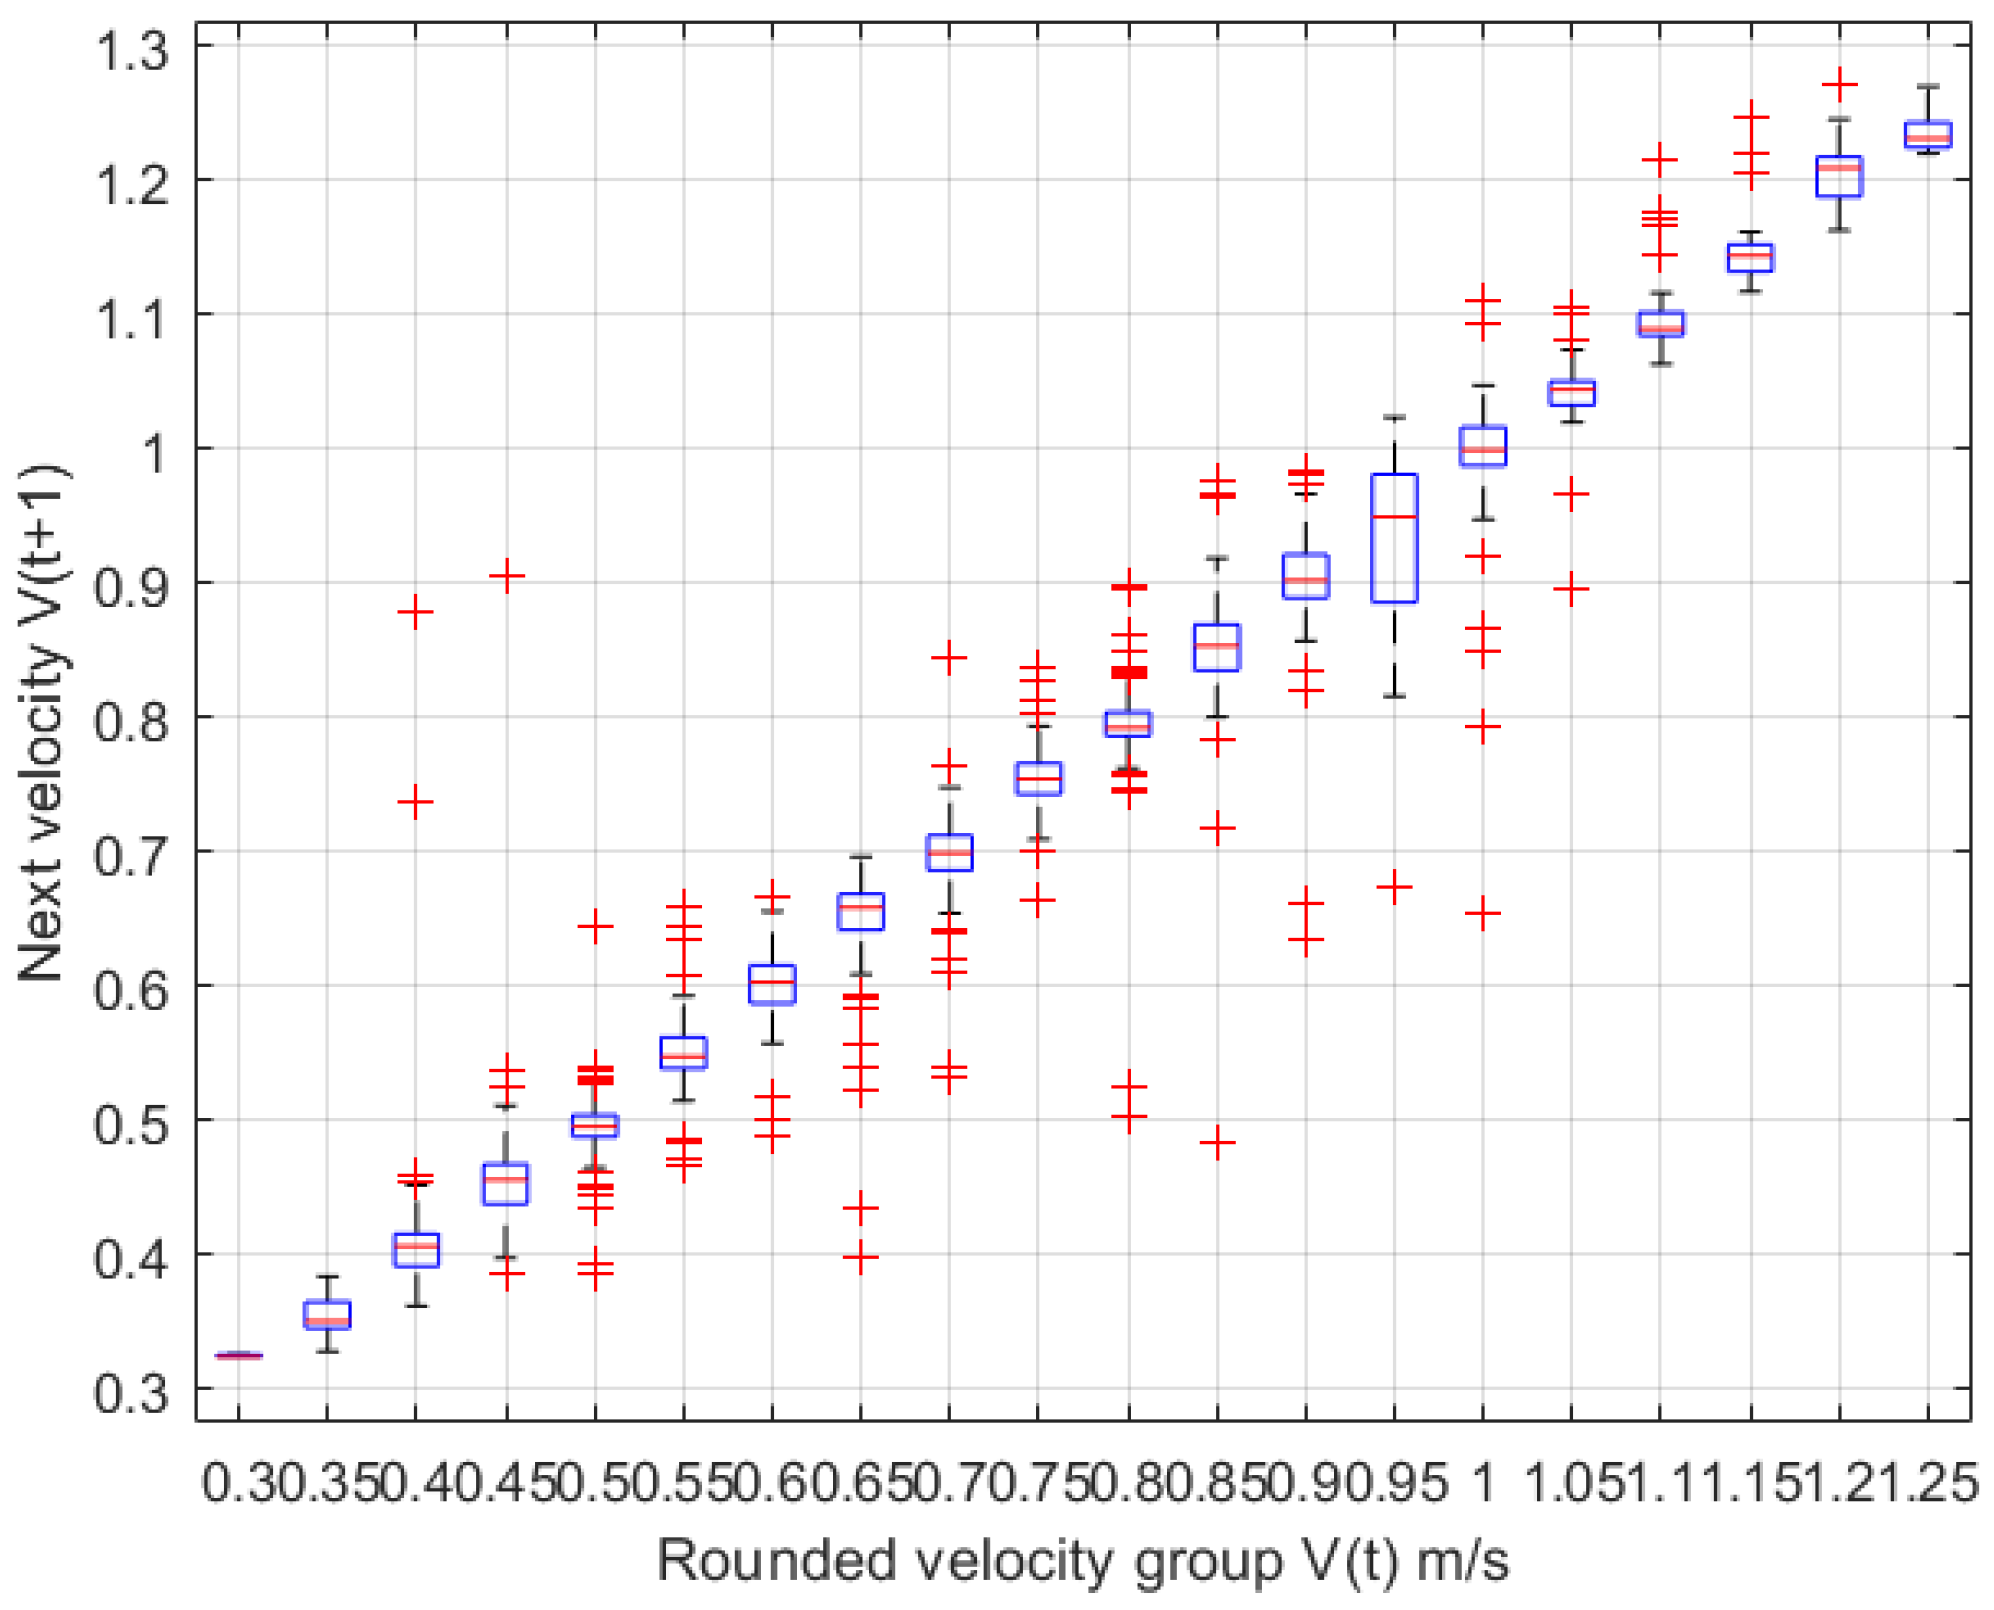
Figure 9 shows the distribution of all the transitions between the initial velocities and the velocities encountered in the next time step. At both low- and high-velocity ranges, the spread in velocity change was narrower. In contrast, for initial velocities between
and
, the variation was broader. At the lower velocity range, there were more outliers indicating movement toward higher velocities, while at the higher range, there were more outliers toward lower velocities in the next time step. This pattern suggests that fish located in lower-velocity regions tend to move toward faster-flowing areas.
3.2. Analysis of Smolt Movement During High Discharge Conditions
Below is an analysis of the smolt tracks recorded during periods of high discharge.
At higher flow conditions, the telemetry tracks showed that the smolts tend to follow the main current more closely and exhibit less cross-channel movement. The fish tracks indicate that smolts align more with the streamlines at elevated water velocities, suggesting a stronger influence of the flow direction on their swimming behavior. These patterns are illustrated in
Figure 10.
Figure 11 demonstrates that movements toward higher velocities occur more frequently than movements toward lower velocities. This is particularly evident at velocities around
. It is noteworthy that, however, these changes are very small; as shown in
Figure 12, the changes were approximately
. An interesting observation is that, at higher velocities (around
), a greater number of movements occur toward lower velocities.
The largest increase in velocity change occurred within the groups at
and
, where the general increase was
. It should be noted that, however, at these velocities, more smolt still tend to move toward lower velocities, as shown in
Figure 11. Of particular interest is the general increase observed when the majority of smolt moved toward higher velocities, which occurred around
(where the overall increase was lower). This may indicate that, at these velocities, flow changes are relatively small and that smolt generally remain within this range while tending to seek slightly higher velocities. A turning point appeared to occur around
, where variations between time steps became larger and a greater proportion of smolt once again moved toward lower velocities.
Figure 13 displays the distribution of all the transitions to the next time step. In some velocity groups, particularly within the range of
to
, transitions to lower velocities were observed in the subsequent movement step. The variability of
increased with higher initial velocities, particularly between
and
, and certain velocity groups (such as those centered at these velocities), showed a wider distribution, indicating greater variability in subsequent velocity changes.
By examining the smolt distribution in
Figure 10 and
Figure 11, a behavioral tendency can be discerned in which the smolt appeared to move toward the main current and higher flow velocities. However, there also seems to be a point at which further increases in velocity no longer had the same influence, with this threshold occurring at approximately
.
3.3. Comparison Between High-Flow and Low-Flow Conditions
Although the changes were small, a trend emerged in which most of the movements occurred within the range of
–
under both high- and low-flow conditions, as shown in
Figure 14.
By examining both the low-flow and high-flow scenarios together, it was possible to identify certain differences in the smolt behavior. Under low-flow conditions, many transitions occurred at velocities around
, as shown in
Figure 14. In this range, transitions were observed both toward higher and lower velocities. It is important to note that this trend is also influenced by the fact that the majority of fish are located within these velocities.
By examining two different flow regimes, it is possible to analyze fish behavior under varying circumstances. Despite differences in velocity between the two cases, a common range was observed where the majority of movements occur. This range also corresponds to the velocities at which the fish were most frequently located, suggesting a preference for remaining near these velocities while still tending to move toward slightly higher velocities, with a turning point around under low flow and under high flow.
4. Discussion
By integrating telemetry data into a CFD model, it has been possible to extract information about the water velocities that smolt experience and how they react and behave in various situations. This is a novel approach that shows potential for further development. This initial analysis has provided insights into the specific velocities at which smolt tend to seek out higher or lower velocities. It also reveals how they position themselves within the entire flow field. These indications of smolt positioning can be utilized for the further development of behavioral rules for smolt and help fill a knowledge gap regarding smolt behavior that needs to be addressed from multiple perspectives.
Conducting additional studies similar to this one, with a larger number of smolt tracks recorded during different flow conditions, could provide a broader understanding of smolt behavior. It would also be possible to perform similar studies on downstream-migrating kelts to extract their behavioral patterns and enable comparative analysis with smolt behavior.
The hydraulic model has a relatively high-resolution mesh that captures the key patterns of the flow. The telemetry tracks also have a certain margin of error and are only recorded in 2D, which is why all data were analyzed at a depth of 2 m. Further development of 3D telemetry tracking could provide indications of the extent to which smolt also choose to move vertically within the water column.
The analysis focused on how smolt choose to move toward higher or lower velocities, as previous studies have shown that they often follow the main current. By also studying all movements, some transitions toward lower velocities were observed. Since most smolt have been observed in areas with velocities around –, the majority of data points originate from this range. Some smolt have also been found at both higher and lower velocities. This provides an indication of the velocity ranges that smolt tend to prefer. Although the smolt in both the high-flow and low-flow scenarios could have moved closer to the riverbanks, they generally remained within these velocities.
Regarding the CFD model, there is potential for further refinement to enhance its accuracy and resolution. For the purposes of this study, however, the current model was assumed to be sufficiently accurate and reliable when considering the resolution of the available telemetry data. If this method is to be extended to future studies involving larger datasets or more detailed behavioral analyses, a higher-resolution representation of the bathymetry could be implemented. Moreover, the use of a more advanced turbulence modeling approach, such as Large Eddy Simulation (LES), could provide a more detailed characterization of turbulent structures, particularly in areas where turbulent kinetic energy (TKE) is expected to vary more substantially. Such improvements would likely yield a more robust understanding of fish–flow interactions, but it would also entail increased computational cost.
Previous studies in this particular area have also shown that smolts are typically found at a depth of around two meters, unless external disturbances such as barriers or predation occur [
15]. The positional accuracy of the telemetry system in this area was quantified. For the relevant tracks, the mean positional error was 2.54 m, the median 1.27 m, and the standard error 0.11 m. These values were determined using a reference transmitter that was deployed simultaneously with an RTK-GPS in the same study from which the fish tracks were obtained. More details are provided in [
28].
Furthermore, implementing a free surface flow simulation, rather than using a rigid-lid approximation, could provide a more accurate representation of near-surface flow dynamics, potentially providing additional insight into how surface flows may influence fish behavior. As previous studies have shown that smolts are found more frequently at a depth of approximately 2 m [
15], it is reasonable to assume that this simulation resolves the flow patterns with sufficient precision to provide a meaningful indication of this connection.
Given the limited number of telemetry tracks available in this study, the results should be interpreted with appropriate caution. Nonetheless, this initial analysis provides valuable insights into the flow velocities at which smolts tend to adjust their movement. More importantly, this study demonstrates the feasibility of integrating smolt trajectories into a corresponding flow model and extracting hydrodynamic parameters through real-time simulation.
By conducting additional telemetry measurements and simulating the respective flow conditions, it would be relatively straightforward to generate more data across a range of flow scenarios. This would also allow the investigation of other flow-related parameters—such as velocity components in different directions (
U and
V), acceleration, and turbulent kinetic energy—all of which have been shown to influence the smolt orientation choices in regulated rivers [
8].
The hope is that this method can be further developed and applied in future studies within this field, helping to close existing knowledge gaps regarding the migratory pathways of smolt.
5. Conclusions
Improving fish passage past hydropower installations is an increasing concern in many regulated rivers. By improving our understanding of how fish choose to swim, it becomes possible to facilitate their successful migration through river systems. When possible, we want to achieve this and, at the same time, minimize the impact on electricity production, making it crucial to understand fish behavior in order to effectively address this challenge. The main contribution lies in the methodology for extracting behavioral rules by combining CFD modeling with telemetry data to identify the actual observed behaviors. These behavioral rules may hopefully contribute to more balanced IBMs in the future.
The analysis of fish movement patterns suggests a general tendency for fish to follow the main current during migration, although this observation is based on a limited number of telemetry tracks and should, therefore, be interpreted with caution. Occasionally, deviations appear to be influenced by initial velocity and local flow conditions. At low starting velocities (approximately –), fish tended to move more frequently toward faster-flowing regions, a behavior observed across several velocity contours and frequency distributions. A turning point was indicated at about under low-flow conditions and under high-flow conditions, suggesting that, when initial velocities are low, fish may actively seek more favorable flow conditions.
Despite the limited dataset, these preliminary results provide an initial indication of how fish respond to varying flow conditions and demonstrate the potential of combining telemetry and flow data for studying migratory behavior. Further studies with larger datasets are required to confirm and statistically validate these trends.
By gaining a better understanding of how fish orient themselves within the flow, the placement of fish passages and other similar fish guidance structures can be optimized, potentially increasing survival during migration and contributing to a more sustainable and ecologically sound hydropower system.
Author Contributions
Conceptualization, M.L.S., J.G.I.H., A.G.A., and J.L.; methodology, M.L.S. and J.L.; software, M.L.S.; validation, M.L.S. and A.G.A.; formal analysis, M.L.S.; investigation, M.L.S.; resources, J.G.I.H. and J.L.; data curation, M.L.S. and J.L.; writing—original draft preparation, M.L.S.; writing—review and editing, M.L.S., J.G.I.H., A.G.A., and J.L.; visualization, M.L.S.; supervision, J.G.I.H.; project administration, J.G.I.H.; funding acquisition, J.G.I.H. All authors have read and agreed to the published version of the manuscript.
Funding
This project was funded by the Swedish Energy Agency within the program for sustainable hydropower, with the aim to contribute to the transition to a sustainable and renewable energy system through research on and development of technologies, systems, methods, and issues related to hydropower.
Institutional Review Board Statement
All handling and tagging of fish were approved by the animal ethics board in Sweden (Dnr 5.2.18-3060/17) 1 April 2016.
Informed Consent Statement
Not applicable.
Data Availability Statement
The raw data supporting the conclusions of this article will be made available by the authors upon request.
Acknowledgments
The authors would also like to acknowledge Kjell Leonardsson at the Swedish University of Agriculture for providing the smolt tracks and sharing experiences from the study site.
Conflicts of Interest
The authors declare no conflicts of interest.
References
- Rivinoja, P.; McKinnell, S.; Lundqvist, H. Hindrances to upstream migration of Atlantic salmon (Salmo salar) in a northern Swedish river caused by a hydroelectric power-station. Regul. Rivers Res. Manag. 2001, 17, 101–115. [Google Scholar] [CrossRef]
- Clay, C.H. Design of Fishways and Other Fish Facilities; CRC Press: Boca Raton, FL, USA, 1995. [Google Scholar]
- Thorstad, E.B.; Whoriskey, F.; Uglem, I.; Moore, A.; Rikardsen, A.H.; Finstad, B. A critical life stage of the Atlantic salmon Salmo salar: Behaviour and survival during the smolt and initial post-smolt migration. J. Fish Biol. 2012, 81, 500–542. [Google Scholar] [CrossRef]
- Lundqvist, H.; Leonardsson, K.; Lindberg, D.-E.; Westbergh, S.; Forssén, Å.; Hellström, J.G.I. Laxens Nedströmsvandring mot Fiskavledare till Stornorrfors Fisktrappa i Umeälvens Nedre del; Rapport (Sveriges lantbruksuniversitet, Institutionen för vilt, fisk och miljö); Sveriges Lantbruksuniversitet: Uppsala, Sweden, 2014. [Google Scholar]
- Marschall, E.A.; Mather, M.E.; Parrish, D.L.; Allison, G.W.; McMenemy, J.R. Migration delays caused by anthropogenic barriers: Modeling dams, temperature, and success of migrating salmon smolts. Ecol. Appl. 2011, 21, 3014–3031. [Google Scholar] [CrossRef]
- Cooke, S.J.; Hinch, S.G. Improving the reliability of fishway attraction and passage efficiency estimates to inform fishway engineering, science, and practice. Ecol. Eng. 2013, 58, 123–132. [Google Scholar] [CrossRef]
- Szabo-Meszaros, M.; Forseth, T.; Baktoft, H.; Fjeldstad, H.P.; Silva, A.T.; Gjelland, K.Ø.; Økland, F.; Uglem, I.; Alfredsen, K. Modelling mitigation measures for smolt migration at dammed river sections. Ecohydrology 2019, 12, e2131. [Google Scholar] [CrossRef]
- Szabo-Meszaros, M.; Forseth, T.; Baktoft, H.; Fjeldstad, H.P.; Silva, A.T.; Gjelland, K.Ø.; Økland, F.; Bearum, K.M.; Hedger, R.D.; Calles, O.; et al. Validation of a swimming direction model for the downstream migration of Atlantic salmon smolts. Water 2021, 13, 1230. [Google Scholar] [CrossRef]
- Bærum, K.M.; Silva, A.T.; Baktoft, H.; Gjelland, K.Ø.; Økland, F.; Forseth, T. Predicting fine-scale downstream migratory movement of Atlantic salmon smolt (Salmo salar) in front of a hydropower plant. Sci. Rep. 2024, 14, 30778. [Google Scholar] [CrossRef]
- Fuentes-Pérez, J.F.; Silva, A.T.; Tuhtan, J.A.; García-Vega, A.; Carbonell-Baeza, R.; Musall, M.; Kruusmaa, M. 3D modelling of non-uniform and turbulent flow in vertical slot fishways. Environ. Model. Softw. 2018, 99, 156–169. [Google Scholar] [CrossRef]
- Rodriguez, J.F.; Bombardelli, F.A.; García, M.H.; Frothingham, K.M.; Rhoads, B.L.; Abad, J.D. High-resolution numerical simulation of flow through a highly sinuous river reach. Water Resour. Manag. 2004, 18, 177–199. [Google Scholar] [CrossRef]
- Arenas, A.; Politano, M.; Weber, L.; Timko, M. Analysis of movements and behavior of smolts swimming in hydropower reservoirs. Ecol. Model. 2015, 312, 292–307. [Google Scholar] [CrossRef]
- Ben Jebria, N.; Carmigniani, R.; Drouineau, H.; De Oliveira, E.; Tétard, S.; Capra, H. Coupling 3D hydraulic simulation and fish telemetry data to characterize the behaviour of migrating smolts approaching a bypass. J. Ecohydraul. 2023, 8, 144–157. [Google Scholar] [CrossRef]
- Kiviloog, J.; Bergdahl, L.; Rivinoja, P.; Lundquist, H. Influence of Flow on Migratory Behaviour of Salmon Smolts. In Proceedings of the International Conference Hydro 2003, Cavtat, Croatia, 3–6 November 2003. [Google Scholar]
- Leander, J.; Klaminder, J.; Hellström, G.; Jonsson, M. Bubble barriers to guide downstream migrating Atlantic salmon (Salmo salar): An evaluation using acoustic telemetry. Ecol. Eng. 2021, 160, 106141. [Google Scholar] [CrossRef]
- Scruton, D.A.; McKinley, R.S.; Kouwen, N.; Eddy, W.; Booth, R.K. Improvement and optimization of fish guidance efficiency (FGE) at a behavioural fish protection system for downstream migrating Atlantic salmon (Salmo salar) smolts. River Res. Appl. 2003, 19, 605–617. [Google Scholar] [CrossRef]
- Coutant, C.C. Integrated, Multi-Sensory, Behavioral Guidance Systems for Fish Diversion; American Fisheries Society: Bethesda, MD, USA, 2001. [Google Scholar]
- Silva, A.T.; Santos, J.M.; Ferreira, M.T.; Pinheiro, A.N.; Katopodis, C. Effects of water velocity and turbulence on the behaviour of Iberian barbel (Luciobarbus bocagei, Steindachner 1864) in an experimental pool-type fishway. River Res. Appl. 2011, 27, 360–373. [Google Scholar] [CrossRef]
- Lacey, R.W.J.; Neary, V.S.; Liao, J.C.; Enders, E.C.; Tritico, H.M. The IPOS framework: Linking fish swimming performance in altered flows from laboratory experiments to rivers. River Res. Appl. 2012, 28, 429–443. [Google Scholar] [CrossRef]
- Tritico, H.M.; Cotel, A.J. The effects of turbulent eddies on the stability and critical swimming speed of creek chub (Semotilus atromaculatus). J. Exp. Biol. 2010, 213, 2284–2293. [Google Scholar] [CrossRef]
- Silva, A.T.; Bærum, K.M.; Hedger, R.D.; Baktoft, H.; Fjeldstad, H.-P.; Gjelland, K.Ø.; Økland, F.; Forseth, T. The effects of hydrodynamics on the three-dimensional downstream migratory movement of Atlantic salmon. Sci. Total Environ. 2020, 705, 135773. [Google Scholar] [CrossRef]
- Goodwin, R.A.; Nestler, J.M.; Anderson, J.J.; Weber, L.J.; Loucks, D.P. Forecasting 3-D fish movement behavior using a Eulerian–Lagrangian–agent method (ELAM). Ecol. Model. 2006, 192, 197–223. [Google Scholar] [CrossRef]
- Scheibe, T.D.; Richmond, M.C. Fish individual-based numerical simulator (FINS): A particle-based model of juvenile salmonid movement and dissolved gas exposure history in the Columbia River basin. Ecol. Model. 2002, 147, 233–252. [Google Scholar] [CrossRef]
- Morrice, K.J.; Baptista, A.M.; Burke, B.J. Environmental and behavioral controls on juvenile Chinook salmon migration pathways in the Columbia River estuary. Ecol. Model. 2020, 427, 109003. [Google Scholar] [CrossRef]
- Goodwin, R.A.; Politano, M.; Garvin, J.W.; Nestler, J.M.; Hay, D.; Anderson, J.J.; Weber, L.J.; Dimperio, E.; Smith, D.L.; Timko, M. Fish navigation of large dams emerges from their modulation of flow field experience. Proc. Natl. Acad. Sci. USA 2014, 111, 5277–5282. [Google Scholar] [CrossRef] [PubMed]
- Liao, J.C. A review of fish swimming mechanics and behaviour in altered flows. Phil. Trans. R. Soc. B 2007, 362, 1973–1993. [Google Scholar] [CrossRef]
- Williams, J.G.; Armstrong, G.; Katopodis, C.; Larinier, M.; Travade, F. Thinking like a fish: A key ingredient for development of effective fish passage facilities at river obstructions. River Res. Appl. 2012, 28, 407–417. [Google Scholar] [CrossRef]
- Leander, J.; Klaminder, J.; Jonsson, M.; Brodin, T.; Leonardsson, K.; Hellström, G. The old and the new: Evaluating performance of acoustic telemetry systems in tracking migrating Atlantic salmon (Salmo salar) smolt and European eel (Anguilla anguilla) around hydropower facilities. Can. J. Fish. Aquat. Sci. 2020, 77, 177–187. [Google Scholar] [CrossRef]
- Andersson, A.G.; Lindberg, D.-E.; Lindmark, E.M.; Leonardsson, K.; Andreasson, P.; Lundqvist, H.; Lundström, T.S. A study of the location of the entrance of a fishway in a regulated river with CFD and ADCP. Modell. Simul. Eng. 2012, 2012, 327929. [Google Scholar] [CrossRef]
- Celik, I.B.; Ghia, U.; Roache, P.J.; Freitas, C.J. Procedure for estimation and reporting of uncertainty due to discretization in CFD applications. J. Fluids Eng. 2008, 130, 071401. [Google Scholar] [CrossRef]
- Davidsen, J.; Svenning, M.-A.; Orell, P.; Yoccoz, N.; Dempson, J.B.; Niemelä, E.; Klemetsen, A.; Lamberg, A.; Erkinaro, J. Spatial and temporal migration of wild Atlantic salmon smolts determined from a video camera array in the sub-Arctic River Tana. Fish. Res. 2005, 74, 210–222. [Google Scholar] [CrossRef]
- Svendsen, J.C.; Eskesen, A.O.; Aarestrup, K.; Koed, A.; Jordan, A.D. Evidence for non-random spatial positioning of migrating smolts (Salmonidae) in a small lowland stream. Freshw. Biol. 2007, 52, 1147–1158. [Google Scholar] [CrossRef]
- Nash, A.J.; Vollset, K.W.; Hanssen, E.M.; Berhe, S.; Salvanes, A.G.; Isaksen, T.E.; Barlaup, B.T.; Lennox, R.J. A tale of two fishes: Depth preference of migrating Atlantic salmon smolt and predatory brown trout in a Norwegian lake. Can. J. Fish. Aquat. Sci. 2022, 79, 2216–2224. [Google Scholar] [CrossRef]
| Disclaimer/Publisher’s Note: The statements, opinions and data contained in all publications are solely those of the individual author(s) and contributor(s) and not of MDPI and/or the editor(s). MDPI and/or the editor(s) disclaim responsibility for any injury to people or property resulting from any ideas, methods, instructions or products referred to in the content. |
© 2025 by the authors. Licensee MDPI, Basel, Switzerland. This article is an open access article distributed under the terms and conditions of the Creative Commons Attribution (CC BY) license (https://creativecommons.org/licenses/by/4.0/).
