Article

Research on the Cultivation of Sustainable Innovation Dynamics in Private Technology Enterprises Based on Tripartite Evolution Game in China

1
School of Management, Wuhan University of Technology, Wuhan 430070, China
2
Business School, University of Jinan, Jinan 250022, China
*
Authors to whom correspondence should be addressed.
Sustainability 2025, 17(20), 9217; https://doi.org/10.3390/su17209217
Submission received: 23 September 2025 / Revised: 12 October 2025 / Accepted: 15 October 2025 / Published: 17 October 2025

Abstract

Against the backdrop of intensifying global technological competition and the deepening of the national innovation-driven strategy, private technology enterprises, as the core entities of technological innovation, have their sustainable innovation dynamics profoundly influenced by the strategic interactions among multiple parties such as the government, enterprises, and users. Based on evolutionary game theory, this paper constructs a tripartite evolutionary game model involving the government, private technology enterprises, and market users in the Chinese context. Through theoretical deduction and multi-scenario numerical simulation using Matlab, it systematically analyzes the logic of strategic choices and the laws of dynamic equilibrium of the three parties in the process of sustainable innovation. The research shows that the strategic evolution of multiple entities presents multiple equilibrium states. There exist critical thresholds for the intensity of policy support, the concentration of market competition, and users’ willingness to choose innovative products; beyond these thresholds, the marginal impact on sustainable innovation dynamics increases significantly. Further research finds that the government and enterprises need to compensate for the profit gap between users’ choice of innovative products and traditional products through a subsidy mechanism to form a positive cycle of “active innovation–market recognition–profit improvement”. This study enriches the theoretical system of multi-entity innovation dynamics by incorporating user behavior and provides a decision-making reference for optimizing innovation governance and fostering the development of sustainable innovation dynamics in private enterprises in China and other similar economies.

1. Introduction

At present, global scientific and technological innovation has entered a period of intense activity, and the speed of technological iteration has significantly accelerated. Private technology enterprises in China play an irreplaceable role in promoting technological breakthroughs, advancing industrial upgrading, and absorbing employment. Statistics show that private technology enterprises contribute over 70% of China’s technological innovation achievements, and have become a key force in building a new development pattern and achieving self-reliance and self-improvement in science and technology. However, these enterprises face numerous dilemmas in the process of sustainable innovation: on the one hand, internal issues such as volatile R&D investment, insufficient reserve of core technologies, and severe brain drain exist [1], with 60% of private technology enterprises having R&D investment intensity lower than the industry average. On the other hand, external environmental problems such as low efficiency in policy implementation, disorderly market competition, and insufficient user acceptance of innovative products further restrict the sustainability of innovation dynamics [2].
Sustainable innovation is not an isolated behavior of a single entity, but the result of the coordinated evolution of multiple entities (including the government, enterprises, and market users) in the innovation ecosystem. The government guides the allocation of innovation resources through policy tools; enterprises, as the main innovation entities, determine R&D investment and technological routes; users drive the adjustment of innovation directions through demand feedback and product selection. The strategic interactions among the three parties form a complex game relationship. Traditional studies mostly focus on static analysis of single entities or dual entities, making it difficult to reveal the dynamic evolutionary laws of innovation dynamics from disequilibrium to equilibrium and from short-term incentives to long-term sustainability.
Therefore, this paper employs evolutionary game theory to transform static factors into a network of strategic interactions among dynamic entities, analyzes the formation mechanism of innovation dynamics under multi-entity collaboration, clarifies the logic of strategic choices of the government, private technology enterprises, and market users in sustainable innovation, reveals the interest demands and behavioral constraints of the three parties, constructs a multi-entity evolutionary game model, deduces the replicator dynamics equations for strategic evolution, and identifies the Evolutionary Stable Strategies (ESS). Meanwhile, through multi-scenario numerical simulation using Matlab Online software, it quantifies the impact of key variables (such as policy support, enterprise innovation, and user choices) on sustainable innovation dynamics, determines critical thresholds, and proposes strategic suggestions to promote multi-entity collaborative innovation, thereby providing theoretical support and practical guidance for fostering the sustainable innovation dynamics of private technology enterprises. It is worth noting that sustainable innovation not only pays attention to economic benefits, but also needs to take into account environmental friendliness and social inclusion. With the continuous development of economy, users pay more and more attention to social and ecological benefits in the choice of innovative products. Therefore, this study emphasizes the importance of social and environmental dimensions by bringing user choices into the game process, and then responds to the requirements of the United Nations Sustainable Development Goals (SDGs). This study breaks through the traditional static analysis framework, enriches the theoretical system of multi-entity innovation dynamics, and provides path references for the government to optimize innovation policies, enterprises to formulate innovation strategies, and guiding users to choose innovative products, so as to actively promote the sustainable innovation dynamics of private technology enterprises towards a virtuous cycle of “policy guidance–enterprise innovation–user recognition”. The conclusion of this study is also of reference value to other economies. For example, the tripartite cooperation model of government-bank-enterprise in the innovation promotion of small and medium-sized enterprises in Germany and the phased funding strategy in the SBIR plan in the United States all embody similar multi-agent cooperation and innovation income sharing mechanisms.

2. Literature Review

2.1. Research on Influencing Factors of Sustainable Innovation Dynamics in Private Technology Enterprises

As an important entity in China’s technological innovation system, the formation and development of sustainable innovation dynamics in private technology enterprises are complexly affected by multiple internal and external factors. Existing studies mainly explore this issue from the dimensions of internal enterprise factors, external environment, and multi-entity collaboration.
In terms of internal influencing factors, the resource-based view emphasizes the key role of enterprises’ core technological resources and R&D investment. It has gradually become a consensus among scholars that factors such as entrepreneurial spirit [3], enterprise scale [4], employee participation [5], corporate social responsibility [6], technological diversification [7], and organizational culture [8] play a crucial role in fostering and developing enterprises’ sustainable innovation dynamics. Furthermore, the behavior of local policymakers, including their incentive structures and accountability mechanisms, significantly shapes the innovation landscape in which enterprises operate. The linkage and matching of technological conditions, organizational conditions, and environmental conditions will form different dual innovation-driven paths [9], and the optimal functioning of these paths is inseparable from digital empowerment [10]. Li Chenglong and Zheng Qiumei (2023) hold that the ability to gain benefits from technology transformation, information sharing degree, and risk coefficient are the key factors affecting collaborative innovation [11,12]. It is critical to note that innovation extends beyond mere technical advancement. As Peter Drucker (1986) conceptualized, social innovation—new strategies, concepts, and organizations that meet social needs—is equally vital [9]. This distinction between technical and social innovation is often overlooked but is essential for comprehensive sustainable innovation dynamics [12].
In terms of the external environment, factors such as institutional policies and market competition jointly shape the innovation ecosystem. For example, government subsidies can significantly promote technological innovation by enhancing enterprises’ risk-taking capacity [13]. The effectiveness of these policies, however, is not absolute. Research by Teets, Hasmath, and Lewis (2017) on Chinese local policymakers suggests that the behavior of officials implementing incentives is crucial; without proper design and accountability, incentive policies may not achieve their intended outcomes [14]. Xu Yingjie et al. (2025) found that market competition, industrial structure, and enterprise value are key factors, with SMEs and private enterprises being more susceptible to factors related to operating conditions such as tax burden and return on assets [15]. Na Li and Xianhua Zhang (2025) pointed out that the business environment empowered by digitalization generally promotes enterprise innovation [16]. Moreover, the international environment plays a pivotal role. For instance, while U.S. economic sanctions on China have suppressed the short-term innovation output and efficiency of Chinese technology enterprises, they have also forced these enterprises to increase innovation investment and enhance innovation sustainability [17]. Similarly, the “Belt and Road” Initiative has significantly improved the innovation efficiency of technology enterprises through the key intermediary of the global value chain [18].
With the development of innovation system theory, research on multi-entity collaboration has gradually deepened. The evolutionary game method is widely used in innovation decision analysis due to its ability to depict the strategic interactions of bounded rationality entities. In terms of government–enterprise bilateral games, the research by Chen Yan and Huang Chen shows that if the punishment for “fraudulent access to subsidies” is insufficient, enterprises are prone to “adverse selection” [19]. Zongqiang Ren et al. (2024) found through games that there is a threshold effect of government subsidies on the innovation of high-tech enterprises [20]. This aligns with the findings of Liang et al. (2019), whose agent-based model for energy-efficiency retrofit in China emphasized that making incentive policies more effective requires a nuanced understanding of micro-level interactions and barriers [21]. In terms of tripartite game research, Li Ji et al. (2025) constructed a tripartite evolutionary game model involving local governments, logistics enterprises, and consumers, and found that tripartite collaboration is crucial for promoting green innovation [22]. Zhang Xi et al. (2023) established a tripartite evolutionary game model of the government, enterprises, and energy supervision service centers, and argued that costs, benefits, and penalties are the main factors affecting enterprises’ independent innovation, while the impact of government subsidies is relatively small [23]. In contrast, Ning Yuan and Meijuan Li (2024) held a similar view to Li Ji et al., believing that an ideal stable strategy requires all parties to carry out collaborative innovation [24]. Jie Zhen et al. (2024) built a tripartite evolutionary game model of the government, industrial parks, and park enterprises, and found that the strategic choices of the government and industrial parks are affected by the cost of enterprise innovation management, while enterprises’ innovation willingness is restricted by multiple factors [25]. A critical review of these studies, however, reveals a common gap: they often overlook the pivotal role of the end-user, the market consumer. Most tripartite games focus on regulators and producers (e.g., government–enterprise–supervisor), neglecting the complete value chain from policy to production to market adoption. This study aims to fill this gap by explicitly incorporating market users as a fundamental third player in the game.
In general, existing studies have explored the influencing factors of innovation in private technology enterprises and the development of their innovation dynamics from multiple perspectives, but there are still the following limitations: First, while extensive research exists on government–enterprise interactions, the role of market users as a decisive force in the innovation value chain is significantly underexplored in evolutionary game models. Their willingness to adopt innovative products is the ultimate validation of sustainable innovation dynamics. Second, many studies focus on economic and institutional aspects of innovation. There is a need to more explicitly connect innovation dynamics to the broader framework of Sustainable Development Goals (SDGs), integrating environmental and social dimensions alongside economic ones [26,27]. Third, policy recommendations tend to focus on one-sided intervention, lacking systematic collaborative governance schemes. Therefore, constructing a tripartite evolutionary game model of government–enterprise–users and systematically analyzing the formation and evolutionary mechanism of sustainable innovation dynamics have important theoretical value and practical significance. This study integrates the often-overlooked user behavior, frames the analysis within the context of sustainable development, and aims to provide insights for designing more effective, dynamic policy incentives.

2.2. Research on the Analysis of Game Entities’ Behaviors

The formation of sustainable innovation dynamics in private technology enterprises is inseparable from the strategic interactions of multiple entities. Common entities include the government, private technology enterprises, market users, institutions of higher education, scientific research institutes, and innovation service organizations. Among these entities, the government, private technology enterprises, and market users can respectively represent the rule-makers, main innovators, and users of innovative products in the innovation ecosystem. The strategic interactions among the three constitute the most fundamental micro-action mechanism of sustainable innovation dynamics. Constructing a tripartite evolutionary game model can not only theoretically depict the complete dynamic evolutionary path of innovation from supply to demand, but also accurately meet the practical needs of resolving the dual dilemmas of “difficulty in policy implementation” and “slow market acceptance” in real scenarios. Therefore, this paper focuses on the three entities of the government, private technology enterprises, and market users in the game.

2.2.1. Analysis of Government Behavior

As the builder and supervisor of the innovation ecosystem, the government’s core goal is to guide the optimal allocation of innovation resources through policy tools, reduce innovation risks caused by market failure, and maximize social innovation benefits. The government’s strategic choices are divided into two categories: “strong incentives” and “weak incentives”. “Strong incentive” strategies include high-intensity R&D subsidies, strengthened intellectual property protection, and the formulation of mandatory innovation standards. These strategies reduce enterprises’ innovation costs and stimulate innovation willingness through direct investment and institutional guarantees. “Weak incentive” strategies adopt flexible tools such as post-subsidy mechanisms and innovation project filing systems to reduce administrative intervention and policy implementation costs. For example, some regions have implemented the “innovation voucher” system, where enterprises first invest in R&D independently and then apply for subsidies based on results, so as to avoid misallocation of policy resources. Government decisions are restricted by financial costs, social benefits, and reputation risks: strong incentives can quickly activate innovation dynamics, but they require bearing high financial expenditures; weak incentives reduce costs, but may lead to the decline of sustainable innovation dynamics due to insufficient policy intensity. When the industry faces disputes over technological routes, such as the transition from 4G to 5G, the government needs to use strong incentives to force enterprises to follow mainstream technologies and avoid the industry falling into inefficient competition [28]. According to research by Teets et al. [14] on local policymakers, policy implementation effectiveness depends not only on policy design but also on the behavioral patterns and accountability mechanisms of implementing officials. Drucker’s [9] social innovation theory further emphasizes that governments need to balance technological innovation and social innovation, promoting coordinated development of both through institutional design.

2.2.2. Analysis of Private Technology Enterprise Behavior

As the core carrier of innovation, enterprises’ strategic choices revolve around the trade-off between “costs and benefits” and are divided into two categories: “active innovation” and “passive innovation” [29]. “Active innovation” strategies are manifested in high-intensity R&D investment, core technology research, or the construction of global R&D networks, aiming to obtain market premiums through technological leadership. “Passive innovation” strategies include technology following and rapid market response, which pursue short-term profits by reducing R&D risks and costs. However, over-reliance on passive innovation can easily lead enterprises into homogeneous competition, compress profit margins, and result in the decline of long-term innovation capabilities. Based on the resource-based view [30] and dynamic capabilities theory [31], enterprises’ innovation choices depend not only on current resource endowments but also on their absorptive and reconfigurative capabilities: large enterprises tend toward active innovation, while small and medium-sized enterprises often choose passive innovation [32]. The exploration–exploitation ambidexterity theory proposed by March [33] further explains this difference, pointing out that enterprises need to maintain balance between radical innovation (exploration) and incremental innovation (exploitation), and this balance is closely related to their lifecycle stage.

2.2.3. Analysis of Market Users’ Behavior

As the ultimate realizers of innovation value, users’ strategic choices affect the direction of enterprises’ sustainable innovation through demand feedback, which are divided into two categories: “choosing innovative products” and “choosing traditional products”. Under the strategy of “choosing innovative products”, users are willing to pay premiums and participate in user co-creation, providing market support for enterprises’ sustainable innovation through consumption behavior. Under the strategy of “choosing traditional products”, users choose mature traditional products due to the high learning costs, high risks, or inconvenience of innovative products, so as to avoid innovation risks. In innovative product selection, user decisions are affected by multiple factors. For example, in the new energy vehicle market, user choices consider not only product performance but also usage costs and supporting facilities [34]. According to Von Hippel’s lead user theory [35], some users are not only innovation adopters but also important participants in the innovation process; while Rogers’ diffusion of innovations theory [36] reveals the decision-making process and social system influences in user innovation adoption. User behavior exhibits significant social learning characteristics—through social networks and group interactions, users’ innovation adoption behaviors produce noticeable diffusion effects. Particularly noteworthy is that in crisis contexts such as public health emergencies, research by Xie et al. [37] shows that users’ social responsibility awareness significantly influences their product choice behavior.
Based on the research of the existing literature and the analysis of the subjects of the three-way game, this paper proposes the following hypotheses:
H1. 
The user subsidy mechanism significantly improves the willingness of market users to choose innovative products.
H2. 
Tripartite collaboration is the optimal equilibrium state for sustainable innovation, and a single agent strategy cannot achieve stable evolution.

3. Construction of Multi-Entity Evolutionary Game Model for Sustainable Innovation Dynamics of Private Technology Enterprises

This research selects evolutionary game theory as the core analytical method with solid methodological justification. This approach can effectively characterize the learning and adaptation processes of bounded rational agents, better aligning with the actual characteristics of innovation decision-making; it is particularly suitable for analyzing multi-agent co-evolution dynamics and can reveal evolutionary paths from non-equilibrium to equilibrium; meanwhile, it allows for simulating policy intervention effects through system simulation, providing quantitative basis for innovation policy design.
Compared with alternative methodologies, evolutionary game theory possesses unique advantages in handling multiple equilibria and path dependence: system dynamics is more suitable for scenarios with clear causal relationships between elements, while Agent-based modeling is better suited for heterogeneous agent research. However, evolutionary game also has some limitations, such as it is difficult to capture individual heterogeneity and ignore the influence of network structure. Future research can be further expanded by combining ABM model. In a word, by constructing a tripartite evolutionary game model, this study achieves accurate characterization of the complex interactions among government, enterprises, and users, providing appropriate methodological support for sustainable innovation dynamics research. The specific steps and contents of the game are shown in Table 1 below.

3.1. Basic Assumptions

Assumption 1.
The game model involves three entities: government, private technology enterprises and market users. All parties are bounded rationality decision-makers, and their strategic choices are based on maximizing their own interests and adjusted dynamically with environment. Among them, the government’s strategy set is {Strong Incentive, Weak Incentive}; the private technology enterprise’s strategy set is {Active Innovation, Passive Innovation}; the market user’s strategy set is {Choosing Innovative Products, Choosing Traditional Products}.
Assumption 2.
The benefit of private technology enterprises from active innovation is Ra, with the cost of Ca; the benefit of passive innovation is Rp, with the cost of Cp (Cp < Ca). If the government implements strong incentives, private technology enterprises engaging in passive innovation must bear a penalty P. The benefit of the government from strong incentives is Rg (such as social innovation benefits and tax growth), with the cost of Cg; the benefit from weak incentives is Rl (such as reduced administrative costs), but it must bear the reputation loss Lg caused by innovation backwardness. The benefit of market users from choosing innovative products is Va, with the need to pay additional costs Cu (premiums or learning costs); the benefit from choosing traditional products is Vp (Vp < Va). The net benefit of choosing innovative products is less than the full benefit of choosing traditional products, i.e.,Va − Cu < Vp. If private technology enterprises engage in passive innovation and the government implements weak incentives, market users choosing innovative products must bear a risk loss S. When the government implements strong incentives and enterprises carry out active innovation, the subsidy for market users choosing innovative products is K.
Assumption 3.
The probability that private technology enterprises choose “active innovation” is x, and the probability of choosing “passive innovation” is 1 − x; the probability that the government chooses “strong incentive” is y, and the probability of choosing “weak incentive” is 1 − y; the probability that market users choose “innovative products” is z, and the probability of choosing “traditional products” is 1 − z, where 0 ≤ x, y, z ≤ 1. This probability distribution reflects the dynamic adjustment of strategies by entities through long-term games under bounded rationality, and finally tends to a stable state.
Based on the above assumptions, the relevant parameters for the evolutionary game of behavior decisions among the government, private technology enterprises, and market users are summarized in Table 2.

3.2. Game Benefits of Behavior Decisions

In the process of the evolutionary game of sustainable innovation dynamics among private technology enterprises, the government, and market users, the selection of behavior decision strategies by the three parties is restricted by various factors. In the game process, each participant has two strategic choices, and the benefit payment matrix for obtaining benefits is shown in Table 3.
Based on the benefit matrix of the three participants (private technology enterprises, the government, and market users), the expected benefits and average expected benefits of the three parties under different strategies can be obtained.
(1) Game Benefits of Private Technology Enterprises. Define the expected benefit of private Technology enterprises choosing the “active innovation” strategy as E11, the expected benefit of choosing the “passive innovation” strategy as E12, and the average expected benefit as E1. Then:
E 11 = y z ( R a C a K ) + y ( 1 z ) ( R a C a ) + ( 1 y ) z ( R a C a ) + ( 1 y ) ( 1 z ) ( R a C a ) = ( R a C a ) y z K  
E 12 = y z ( R p C p θ P ) + y ( 1 z ) ( R p C p θ P ) + ( 1 y ) z ( R p C p ) + ( 1 y ) ( 1 z ) ( R p C p ) = ( R p C p ) y θ P  
E 1 = x E 11 + ( 1 x ) E 12
From the above three formulas, the replicator dynamics equation for the game strategy of private technology enterprises is derived as follows:
F ( x ) = d F ( x ) d t = x ˙ = x ( E 11 E 1 ) = x ( 1 x ) [ ( R a C a ) ( R p C p ) + y ( θ P z K ) ]
where x ˙ = x ( E 11 x E 11 ( 1 x ) E 12 ) = x [ ( 1 x ) E 11 ( 1 x ) E 12 ] = x ( 1 x ) ( E 11 E 12 ) .
(2) Game Benefits of the Government. Define the expected benefit of the government choosing the “strong incentive” strategy as E21, the expected benefit of choosing the “weak incentive” strategy as E22, and the average expected benefit as E2. Then:
E 21 = x z ( R g C g ) + x ( 1 z ) ( R g C g ) + ( 1 x ) z ( R g C g + θ P ) + ( 1 x ) ( 1 z ) ( R g C g + θ P ) = R g C g + ( 1 x ) θ P
E 22 = x z ( R l L g ) + x ( 1 z ) ( R l L g ) + ( 1 x ) z ( R l L g ) + ( 1 x ) ( 1 z ) ( R l L g ) = R l L g
E 2 = y E 21 + ( 1 y ) E 22
From the above three formulas, the replicator dynamics equation for the government’s game strategy is derived as follows:
F ( y ) = d F ( y ) d t = y ˙ = y ( E 21 E 2 ) = y ( 1 y ) [ R g C g + ( 1 x ) θ P ( R l L g ) ]  
where y ˙ = y ( E 21 y E 21 ( 1 y ) E 22 ) = y [ ( 1 y ) E 21 ( 1 y ) E 22 ] = y ( 1 y ) ( E 21 E 22 ) .
(3) Game Benefits of Market Users. Define the expected benefit of market users choosing the “innovative products” strategy as E31, the expected benefit of choosing the “traditional products” strategy as E32, and the average expected benefit as E3. Then:
E 31 = x y ( V a C u + K ) + x ( 1 y ) ( V a C u ) + ( 1 x ) y ( V a C u ) + ( 1 x ) ( 1 y ) ( V a C u S ) = ( V a C u ) + x y K ( 1 x ) ( 1 y ) S
E 32 = x y V p + x ( 1 y ) V p + ( 1 x ) y V p + ( 1 x ) ( 1 y ) ( V p S ) = V p  
E 3 = z E 31 + ( 1 z ) E 32
From the above three formulas, the replicator dynamics equation for the game strategy of market users is derived as follows:
F ( z ) = d F ( z ) d t = z ˙ = z ( E 31 E 3 ) = z ( 1 z ) [ ( V a C u ) ( 1 x ) ( 1 y ) S V p + ( 1 x ) ( 1 y ) S ] = z ( 1 z ) [ ( V a C u V p ) + x y K ( 1 x ) ( 1 y ) S ]
where z ˙ = z ( E 31 z E 31 ( 1 z ) E 32 ) = z [ ( 1 z ) E 31 ( 1 z ) E 32 ] = z ( 1 z ) ( E 31 E 32 ) .

3.3. Stability Analysis of Behavior Decision Strategy Evolution

The behavior strategies of private technology enterprises, the government, and market users tend to be in a stable state when their replicator dynamics equations and the probabilities x, y, z of choosing strong incentives, active innovation, and innovative products, respectively, satisfy the following conditions:
F ( x ) = 0 , F ( x ) ( x ) < 0 F ( y ) = 0 , F ( y ) ( y ) < 0 F ( z ) = 0 , F ( z ) ( z ) < 0
The following is an analysis of the evolutionary paths and stability of the independent roles of private technology enterprises, the government, and market users, as well as the joint role of the three parties, based on the constructed replicator dynamics equations.
(1) Analysis of Evolutionary Paths and Stability of Independent Roles
Analysis of the Evolutionary Path and Stability of Private Technology Enterprises. According to the replicator dynamics equation of private technology enterprises, when
y = ( R p C p ) ( R a C a ) θ P z K
F ( x ) = 0 for all x ∈ [0, 1], and the system is in a stable state within the range of [0, 1].
When
0 < ( R p C p ) ( R a C a ) θ P zK < y < 1
At this time, x = 0 is a stable point, and “passive innovation” is the final evolutionary stable strategy of private technology enterprises;
When
0 < y < ( R p C p ) ( R a C a ) θ P z K < 1  
At this time, x = 1 is a stable point, and “active innovation” is the final evolutionary stable strategy of private technology enterprises;
Therefore, when the difference between the revenue and cost brought by active innovation of private technology enterprises (RaCa) is larger, the difference between the revenue and cost brought by passive innovation (RpCp) is smaller, and the probability y of the government’s strong incentive and the penalty intensity θP for passive innovation are larger, there will be
0 < y < ( R p C p ) ( R a C a ) θ P z K < 1  
At this time, the final behavioral strategy of private technology enterprises is active innovation. It shows that the behavioral strategy selection of private technology enterprises is related to the behavioral strategy selection of the government. As the probability of the government’s behavioral strategy selection changes between 0 and 1, the behavioral strategy of private technology enterprises will tend to shift from “passive innovation” to “active innovation”.
(2) Analysis of the Evolutionary Path and Stability of the Government
According to the replicator dynamics equation of the government, when
x = 1 ( R l L g ) ( R g C g ) θ P  
F ( y ) = 0 for all y ∈ [0, 1], and the system is in a stable state within the range of [0, 1].
When
0 < 1 ( R l L g ) ( R g C g ) θ P < x < 1  
At this time, y = 1 is a stable point, so “strong incentive” is the final evolutionary stable strategy of the government.
When
0 < x < 1 ( R l L g ) ( R g C g ) θ P < 1
At this time, y = 0 is a stable point, so “weak incentive” is the final evolutionary stable strategy of the government.
Therefore, when the difference between the revenue and cost brought by the government’s strong incentive (RgCg) is larger, the difference between the revenue and loss brought by weak incentive (RlLg) is smaller, and the penalty intensity θP for non-active innovation is larger, there will be
0 < 1 ( R l L g ) ( R g C g ) θ P < x < 1
At this time, the final behavioral strategy of the government is strong incentive. It shows that the behavioral strategy selection of the government is related to the behavioral strategy selection of private technology enterprises. As the probability of the behavioral strategy selection of private technology enterprises changes between 0 and 1, the behavioral strategy of the government will tend to shift from “weak incentive” to “strong incentive”.
(3) Analysis of the Evolutionary Path and Stability of Market Users
According to the replicator dynamics equation of market users, when
V a C u V p + x y K = ( 1 x ) ( 1 y ) S
F ( z ) = 0 for all z ∈ [0, 1], and the system is in a stable state within the range of [0, 1].
When
0 < V a C u V p + x y K < ( 1 x ) ( 1 y ) S < 1
At this time, z = 0 is a stable point, so “choosing traditional products” is the final evolutionary stable strategy of market users.
When
0 < ( 1 x ) ( 1 y ) S < V a C u V p + x y K < 1
At this time, z = 1 is a stable point, so “choosing innovative products” is the final evolutionary stable strategy of market users.
Therefore, when the difference between the revenue and additional cost brought by market users choosing innovative products (VaCu) is larger, the revenue Vp from choosing traditional products is smaller, the probability (1 − x) of private technology enterprises not actively innovating is smaller, and the risk loss S borne by market users due to enterprises’ non-active innovation is larger, there will be
0 < ( 1 x ) ( 1 y ) S < V a C u V p + x y K < 1
At this time, the final behavioral strategy of market users is to choose innovative products. It shows that the behavioral strategy selection of market users is related to the behavioral strategy selection of private technology enterprises and the government. As the probability of the behavioral strategy selection of private technology enterprises and the government changes between 0 and 1, the behavioral strategy of market users will tend to shift from “choosing traditional products” to “choosing innovative products”.
(4) Stability Analysis of Evolutionary Strategies under the Joint Role of the Three Parties
The equilibrium points obtained from a single replicator dynamics equation only represent the stable strategy selection of a single entity and cannot reflect the dynamics of the game group in the evolutionary game system. Therefore, it is necessary to determine the evolutionary stable strategies under the joint role of the three game participants to conduct system stability analysis.
Let F ( x ) = 0 , F ( y ) = 0 , F ( z ) = 0 , and 8 local equilibrium points are obtained:
E 1 ( 0 , 0 , 0 ) , E 2 ( 0 , 0 , 1 ) , E 3 ( 1 , 0 , 0 ) , E 4 ( 0 , 1 , 0 ) , E 5 ( 1 , 1 , 0 ) , E 6 ( 1 , 0 , 1 ) , E 7 ( 0 , 1 , 1 ) , E 8 ( 1 , 1 , 1 )
Friedman proposed substituting these 8 equilibrium points into the Jacobian matrix to obtain the eigenvalues of each matrix, and then analyze the stability of each equilibrium point based on this. The results of the stability analysis are shown in Table 4.

3.4. Update Rules for Behavior Decision Strategies

(1) When ( R a C a ) < ( R p C p ) , ( R g C g ) + θ P < ( R l L g ) , V a C u S < V p , E1 (0, 0, 0) is the evolutionary stable equilibrium point, i.e., the evolutionary stable strategy is (Passive Innovation, Weak Incentive, Choosing Traditional Products).
(2) When θ P < ( R p C p ) ( R a C a ) , ( R l L g ) < ( R g C g ) + θ P , V a C u < V p , E3 (0, 1, 0) is the evolutionary stable equilibrium point, i.e., the evolutionary stable strategy is (Passive Innovation, Strong Incentive, Choosing Traditional Products).
(3) When ( R p C p ) < ( R a C a ) , ( R g C g ) < ( R l L g ) , V a C u < V p , E5 (1, 0, 0) is the evolutionary stable equilibrium point, i.e., the evolutionary stable strategy is (Active Innovation, Weak Incentive, Choosing Traditional Products).
(4) When ( R p C p ) θ P < ( R a C a ) , ( R l L g ) < ( R g C g ) , V a C u + K < V p , E7 (1, 1, 0) is the evolutionary stable equilibrium point, i.e., the evolutionary stable strategy is (Active Innovation, Strong Incentive, Choosing Traditional Products).
(5) When ( R p C p ) θ P < ( R a C a ) K , ( R l L g ) < ( R g C g ) , V p < V a C u + K , E8 (1, 1, 1) is the evolutionary stable equilibrium point, i.e., the evolutionary stable strategy is (Active Innovation, Strong Incentive, Choosing Innovative Products).

4. Multi-Scenario Numerical Simulation and Result Analysis

4.1. Parameter Setting

To verify the accuracy of the game model and evolutionary results, this study uses Matlab for numerical simulation. Referring to the research of relevant scholars [38], the parameters such as costs, benefits, and reward–penalty intensity for the sustainable innovation dynamics of the three parties (private technology enterprises, the government, and market users) are assigned values. The initial values of the probabilities of strategy selection for the three parties’ behaviors are set to (0.1, 0.1, 0.1), with a variation interval of 0.1, and random simulations are conducted from 0.1 to 0.9. The number of evolutionary steps is set to 50 to observe the changing trends of behavior strategy selection for sustainable innovation dynamics under different scenarios. Some fixed parameters are set as follows: Ca = 5, Cp = 2, Rl = 4, Vp = 7.5, Cu = 2.6, θ = 0.6. Other parameters are set corresponding to different local equilibrium points. Among them, the setting of cost parameters mainly refers to the research of Yu Dongping [39] and Yang Naiding [40], the setting of income parameters mainly refers to the research of Zhang Yueyue [41], the probability θ of private technology-based enterprises being punished for negative innovation mainly refers to the research of Li Yuqiong [42], and the setting of punishment and subsidy parameters mainly refers to the research of Wang Xuhui [43].

4.2. Scenario Simulation and Result Analysis

It can be seen from the game benefit matrix of enterprises, the government, and market users that the profit–cost gap is the incentive for each participant in the game to adopt different behavior decision strategies. To explore the impact of different incentive values on the evolution of their respective behavior decisions, this paper assigns different values to the behavior decision benefits or costs of different entities, and analyzes the impact of changes in the profit–cost gap on the behavior decisions of each participant [44,45].
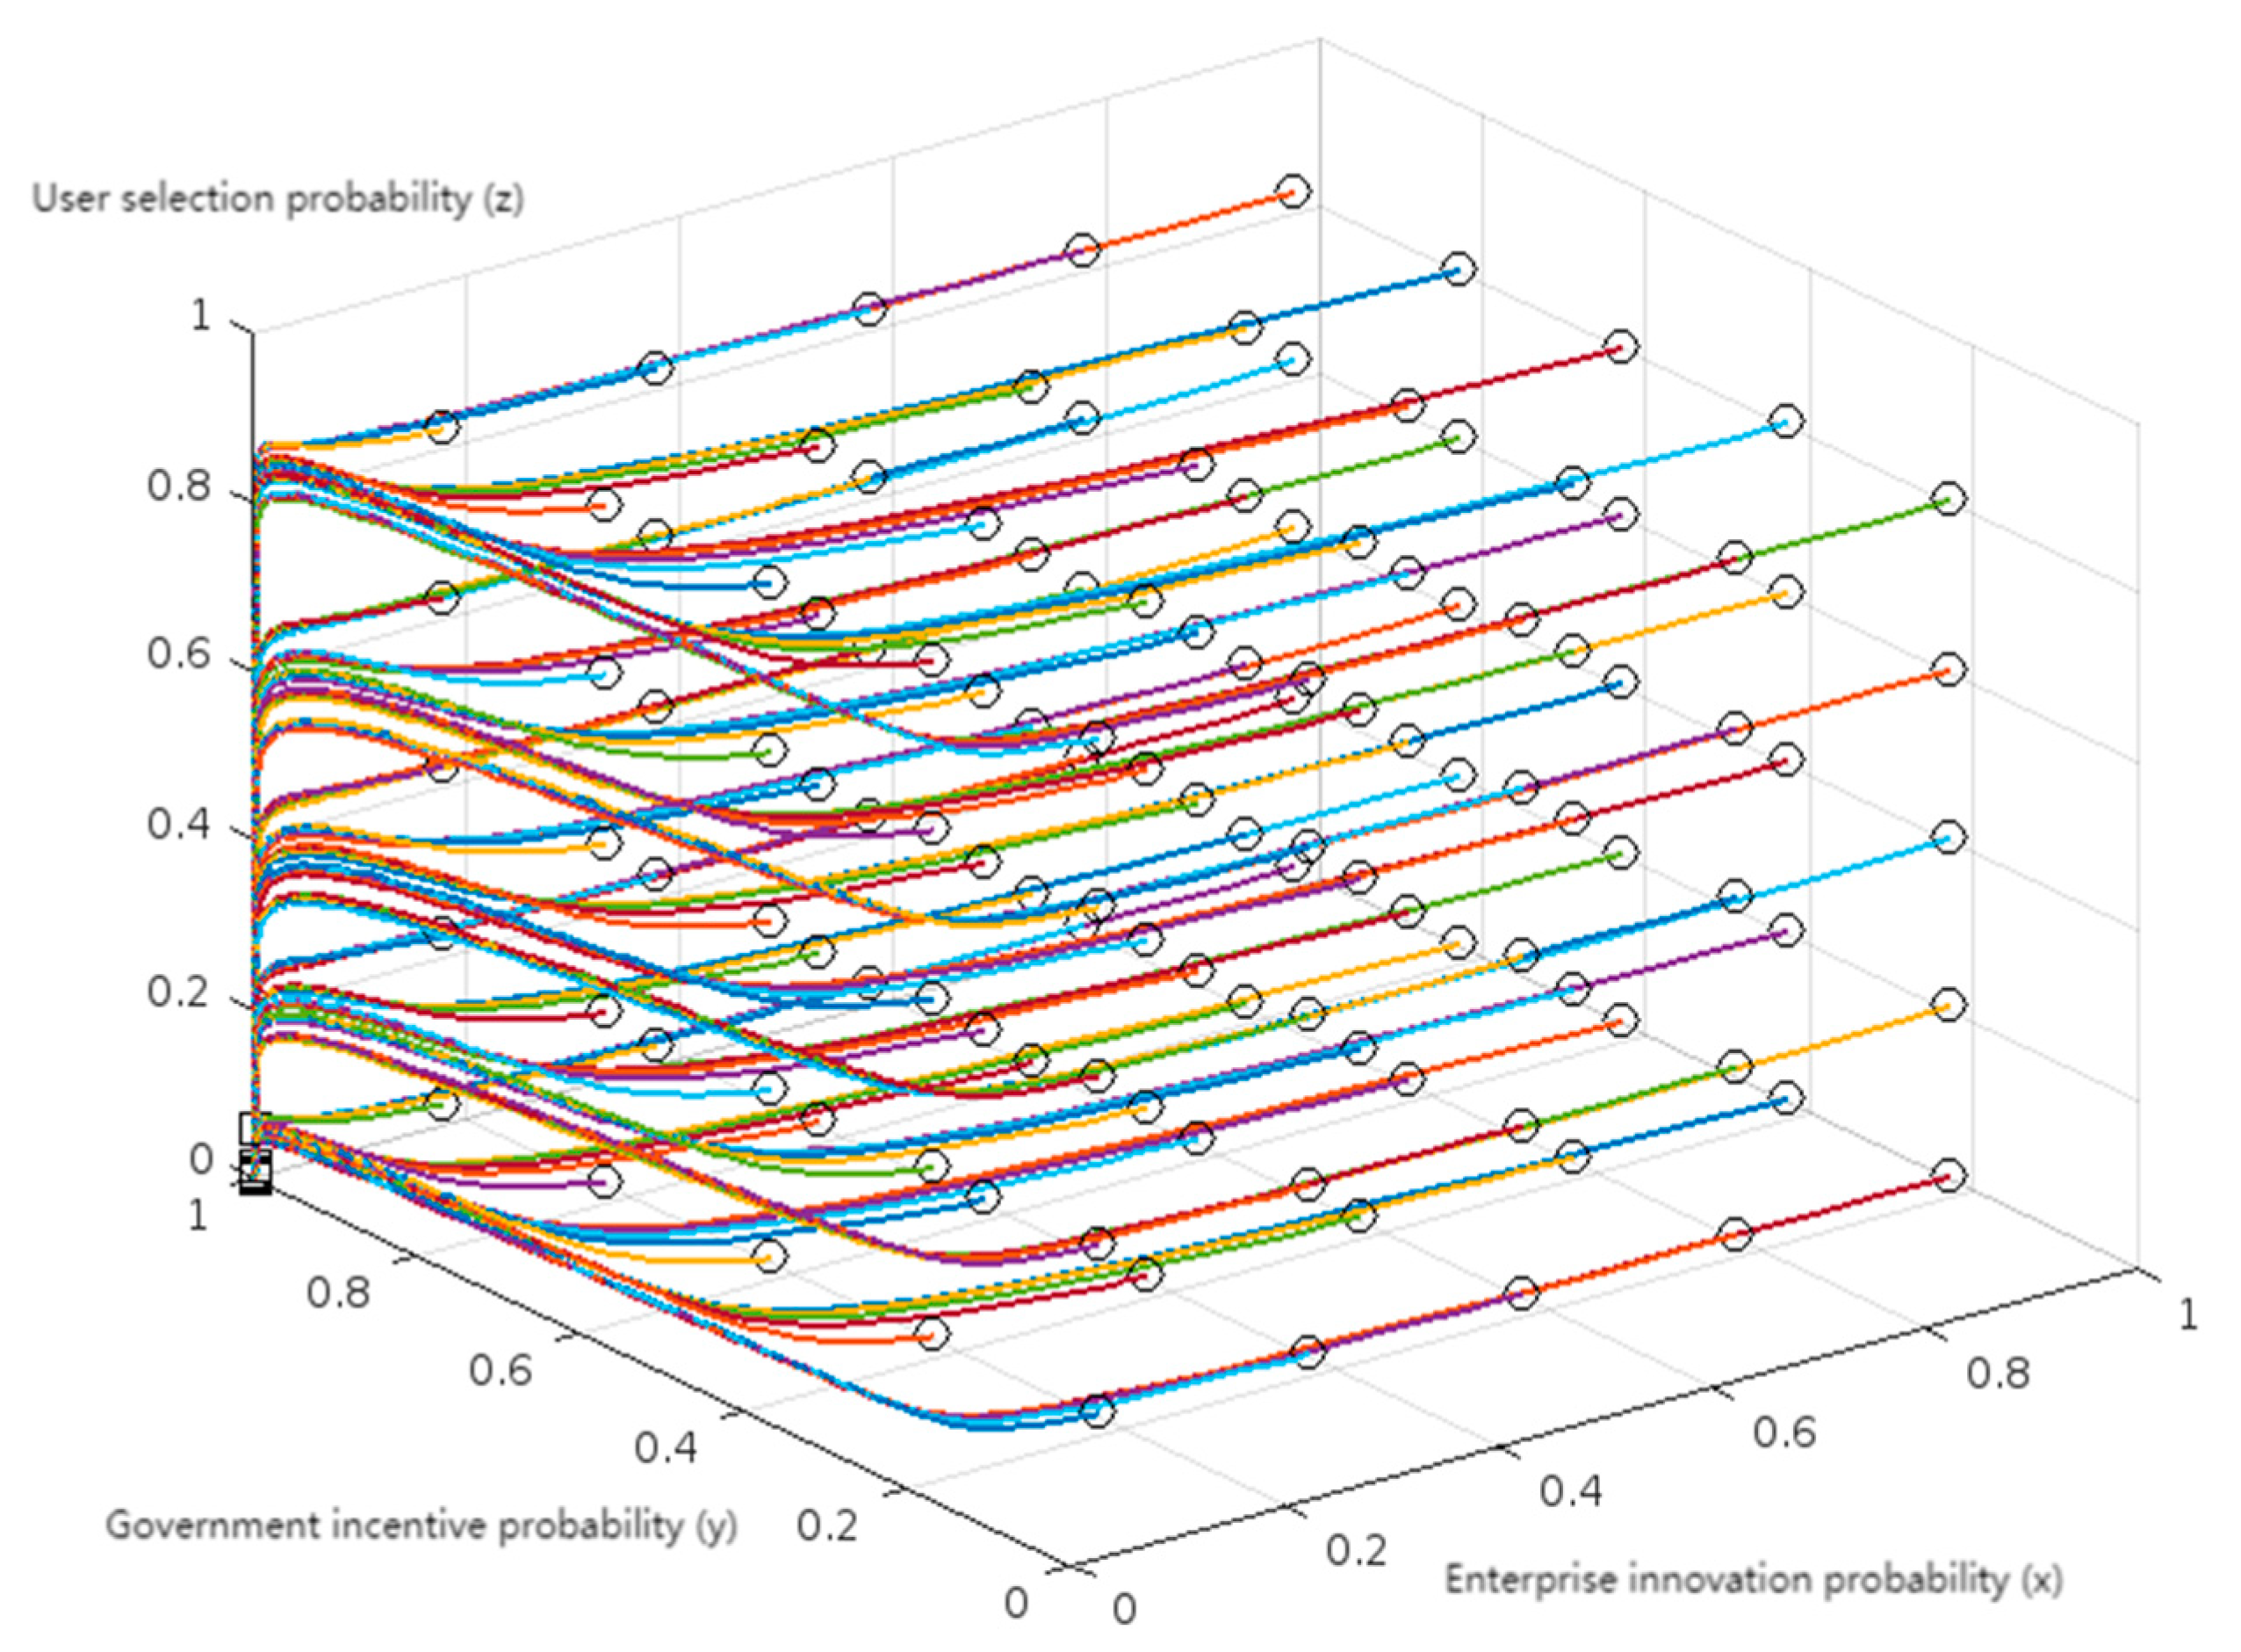
(1) Scenario 1: Weak Incentive–Passive Innovation—Choosing Traditional Products
Set the parameters:
R a = 4 , C a = 5 , R p = 5 , C p = 2 , P = 1 , R g = 4 , C g = 4 , R l = 4 , L g = 0.5 , V a = 10 , V p = 7.5 , C u = 2.6 , S = 1.5 , θ = 0.6
At this time, ( R a C a ) < ( R p C p ) , ( R g C g ) + θ P < ( R l L g ) , V a C u S < V p . E1 (0, 0, 0) is the evolutionary stable equilibrium point, and the evolutionary stable strategy is (Passive Innovation, Weak Incentive, Choosing Traditional Products). Its simulation result is shown in Figure 1.
In this scenario, the net benefit of private technology enterprises under the active innovation strategy (the difference between the revenue and cost of active innovation) is less than the net benefit under the passive innovation strategy (the difference between the revenue and cost of passive innovation). The sum of the net benefit of the government under the strong incentive strategy (the difference between the revenue and cost of strong incentive) and the penalty imposed on private technology enterprises is less than the revenue of the government under the weak incentive strategy minus the loss. Therefore, in this scenario, private technology enterprises and the government will choose the passive innovation and weak incentive strategies, respectively, while market users will ultimately choose the traditional product strategy. At this time, x = 0, y = 0, z = 0, because even if market users choose innovative products, their revenue cannot be guaranteed due to the government’s weak incentives and the enterprises’ own passive innovation. That is, when private technology enterprises engage in passive innovation and the government implements weak incentives, x = 0, y = 0, if market users choose innovative products, their expected revenue is VaCuS. Through value assignment calculation, the expected revenue can be obtained as 5.9, which is less than the expected revenue Vp = 7.5 of market users choosing traditional products. This leads market users to ultimately choose traditional products to ensure they can obtain sufficient revenue. After a period of game, private technology enterprises, the government, and market users all adopt a negative attitude, which is a relatively poor stable state and is not conducive to the development of overall innovation.
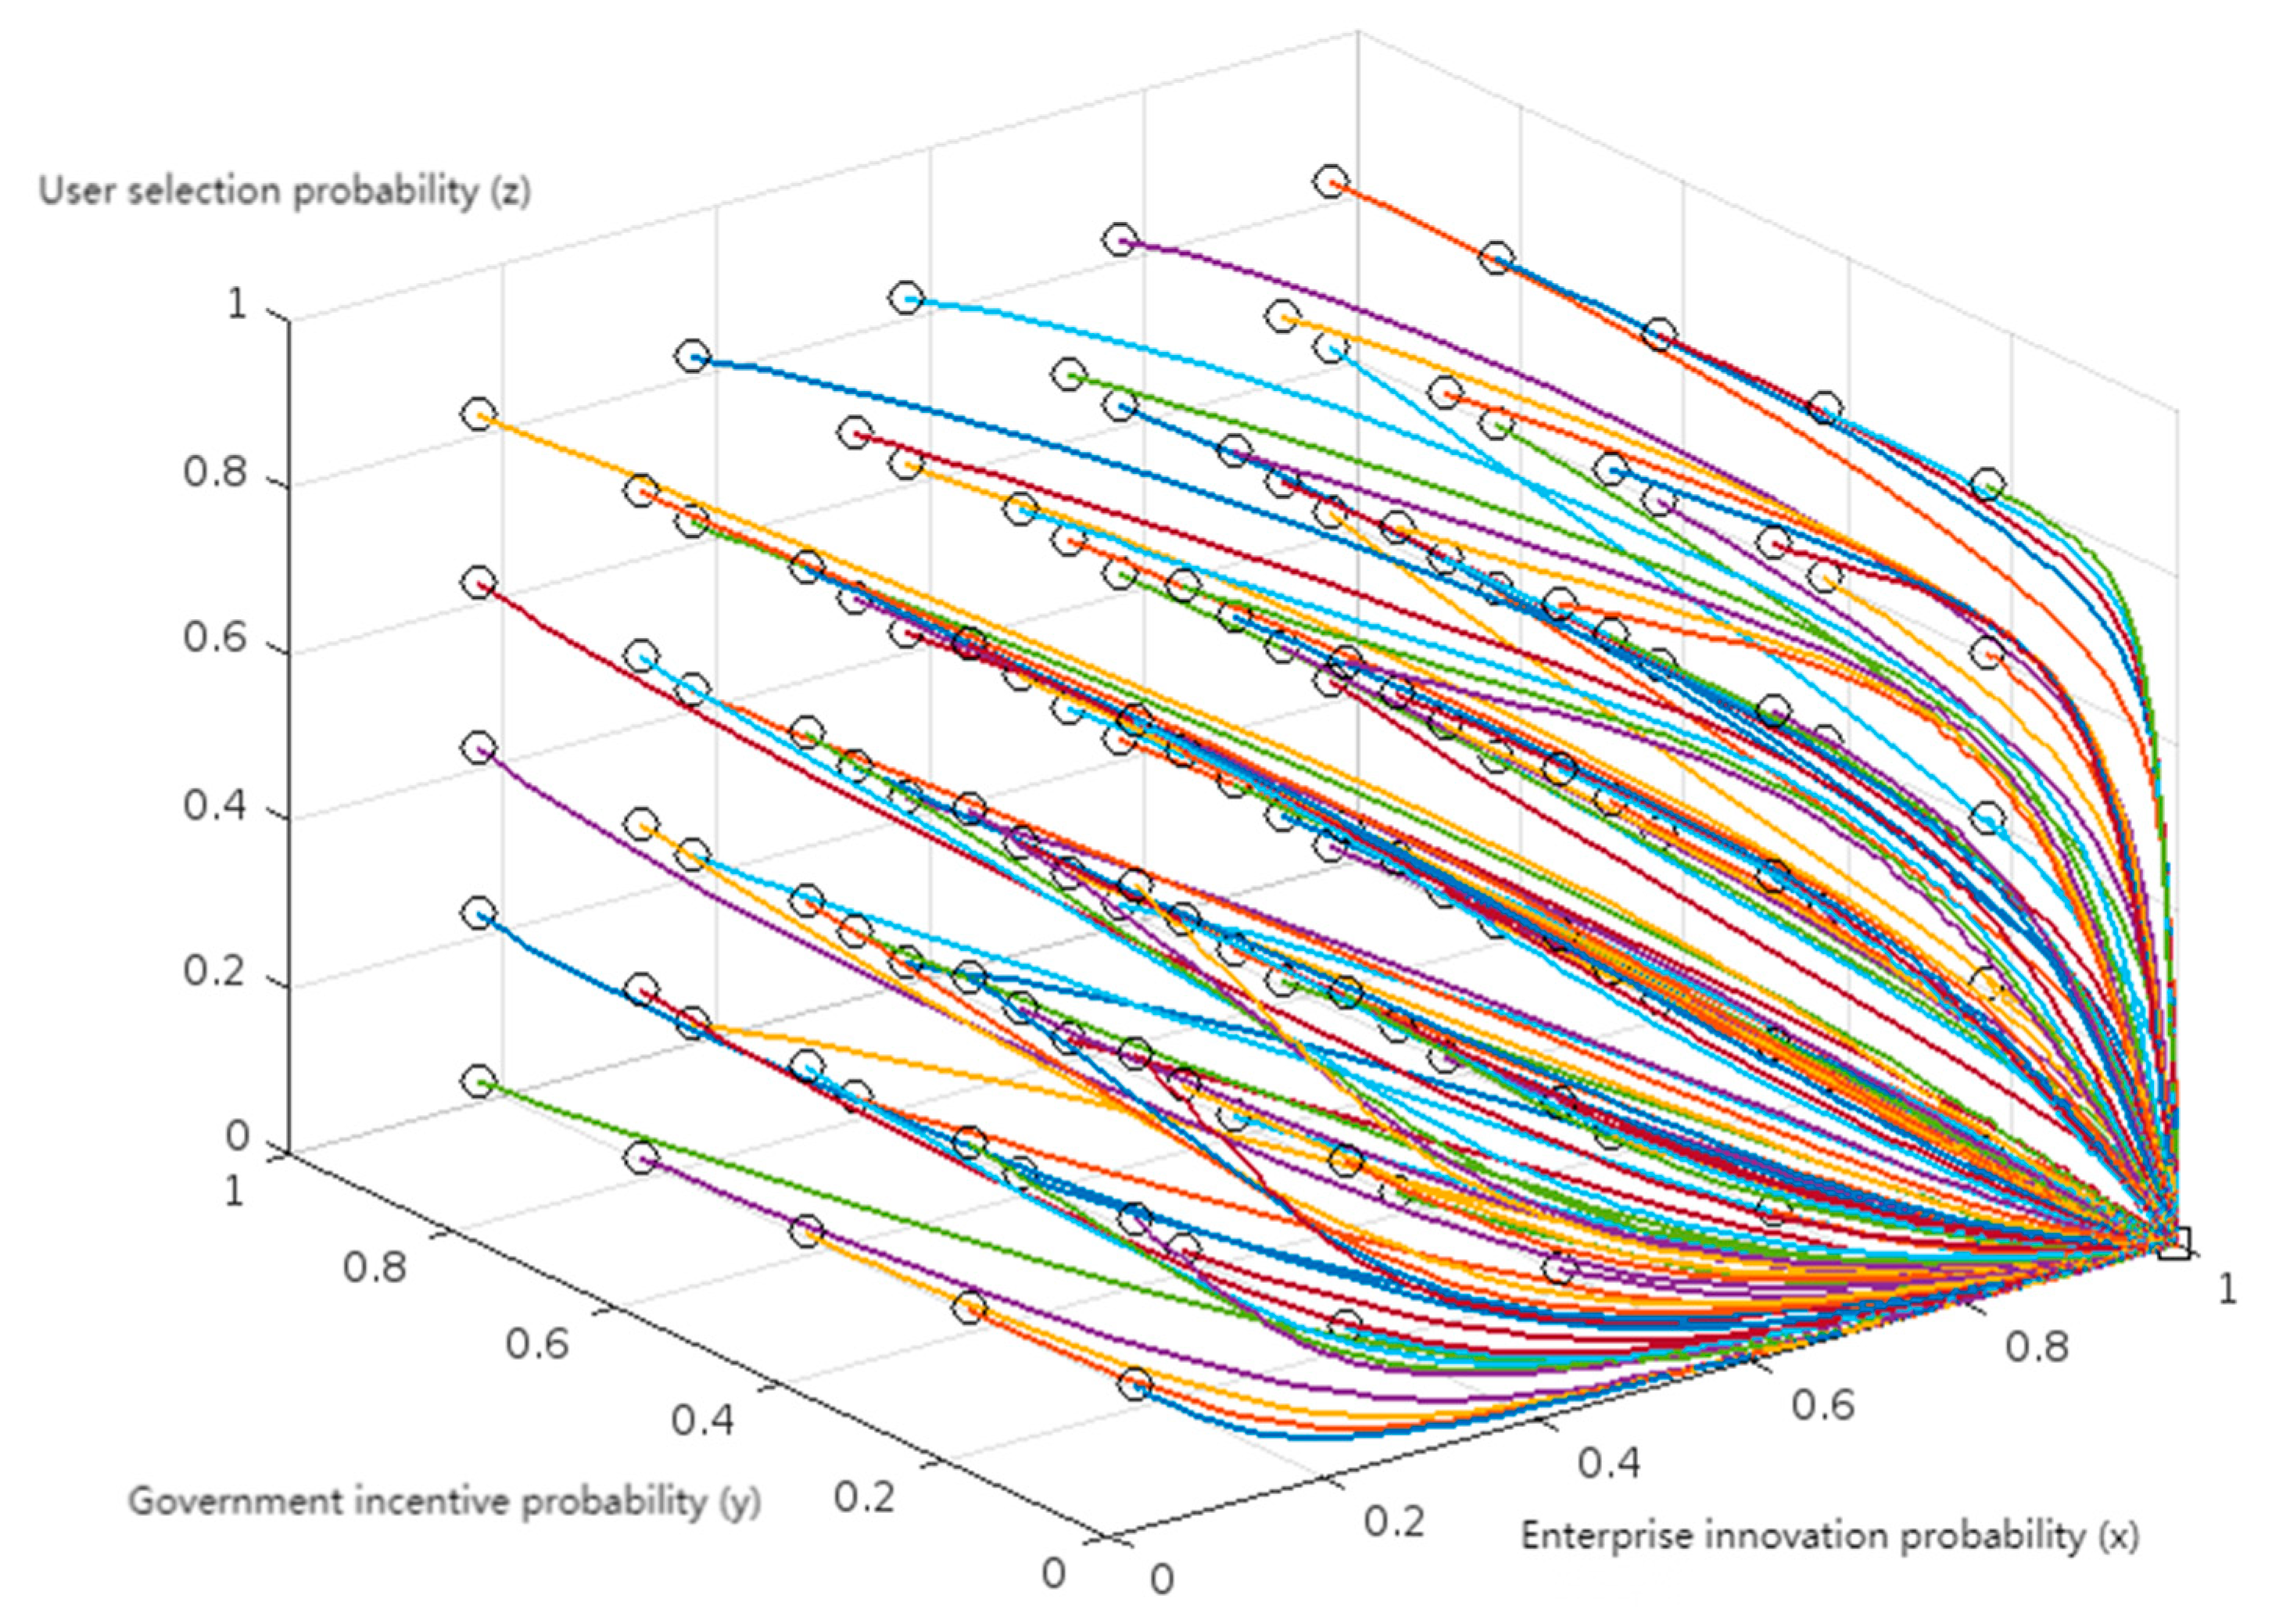
(2) Scenario 2: Strong Incentive–Passive Innovation—Choosing Traditional Products
Set the parameters:
R a = 3 , C a = 5 , R p = 5 , C p = 2 , P = 1.5 , R g = 5 , C g = 2 , R l = 4 , L g = 1 , V a = 10 , V p = 7.5 , C u = 2.6 , θ = 0.6
At this time, θ P < ( R p C p ) ( R a C a ) , ( R l L g ) < ( R g C g ) + θ P , V a C u < V p . E3 (0, 1, 0) is the evolutionary stable equilibrium point, and the evolutionary stable strategy is (Passive Innovation, Strong Incentive, Choosing Traditional Products). Its simulation result is shown in Figure 2.
In this scenario, the difference between the net benefit of passive innovation and the net benefit of active innovation for private technology enterprises is still greater than the penalty imposed by the government for passive innovation (the net benefit of passive innovation is greater than the sum of the net benefit of active innovation and the government’s penalty). The sum of the net benefit of the government from strong incentives and the penalty is greater than the net benefit of weak incentives (the revenue of weak incentives minus the loss). Market users basically do not incur costs or losses when choosing traditional products; therefore, the net benefit of choosing innovative products (the revenue of choosing innovative products minus the corresponding additional costs) is less than the revenue of choosing traditional products. At this time, x = 0, y = 1, z = 0. After a period of game interaction, among the three game entities, only the government adopts a positive attitude. Due to the relatively low penalty intensity under the government’s strong incentives, private technology enterprises do not attach sufficient importance to active innovation. Market users also switch to traditional products because the cost of choosing innovative products is relatively high. This is a less-than-ideal stable state.
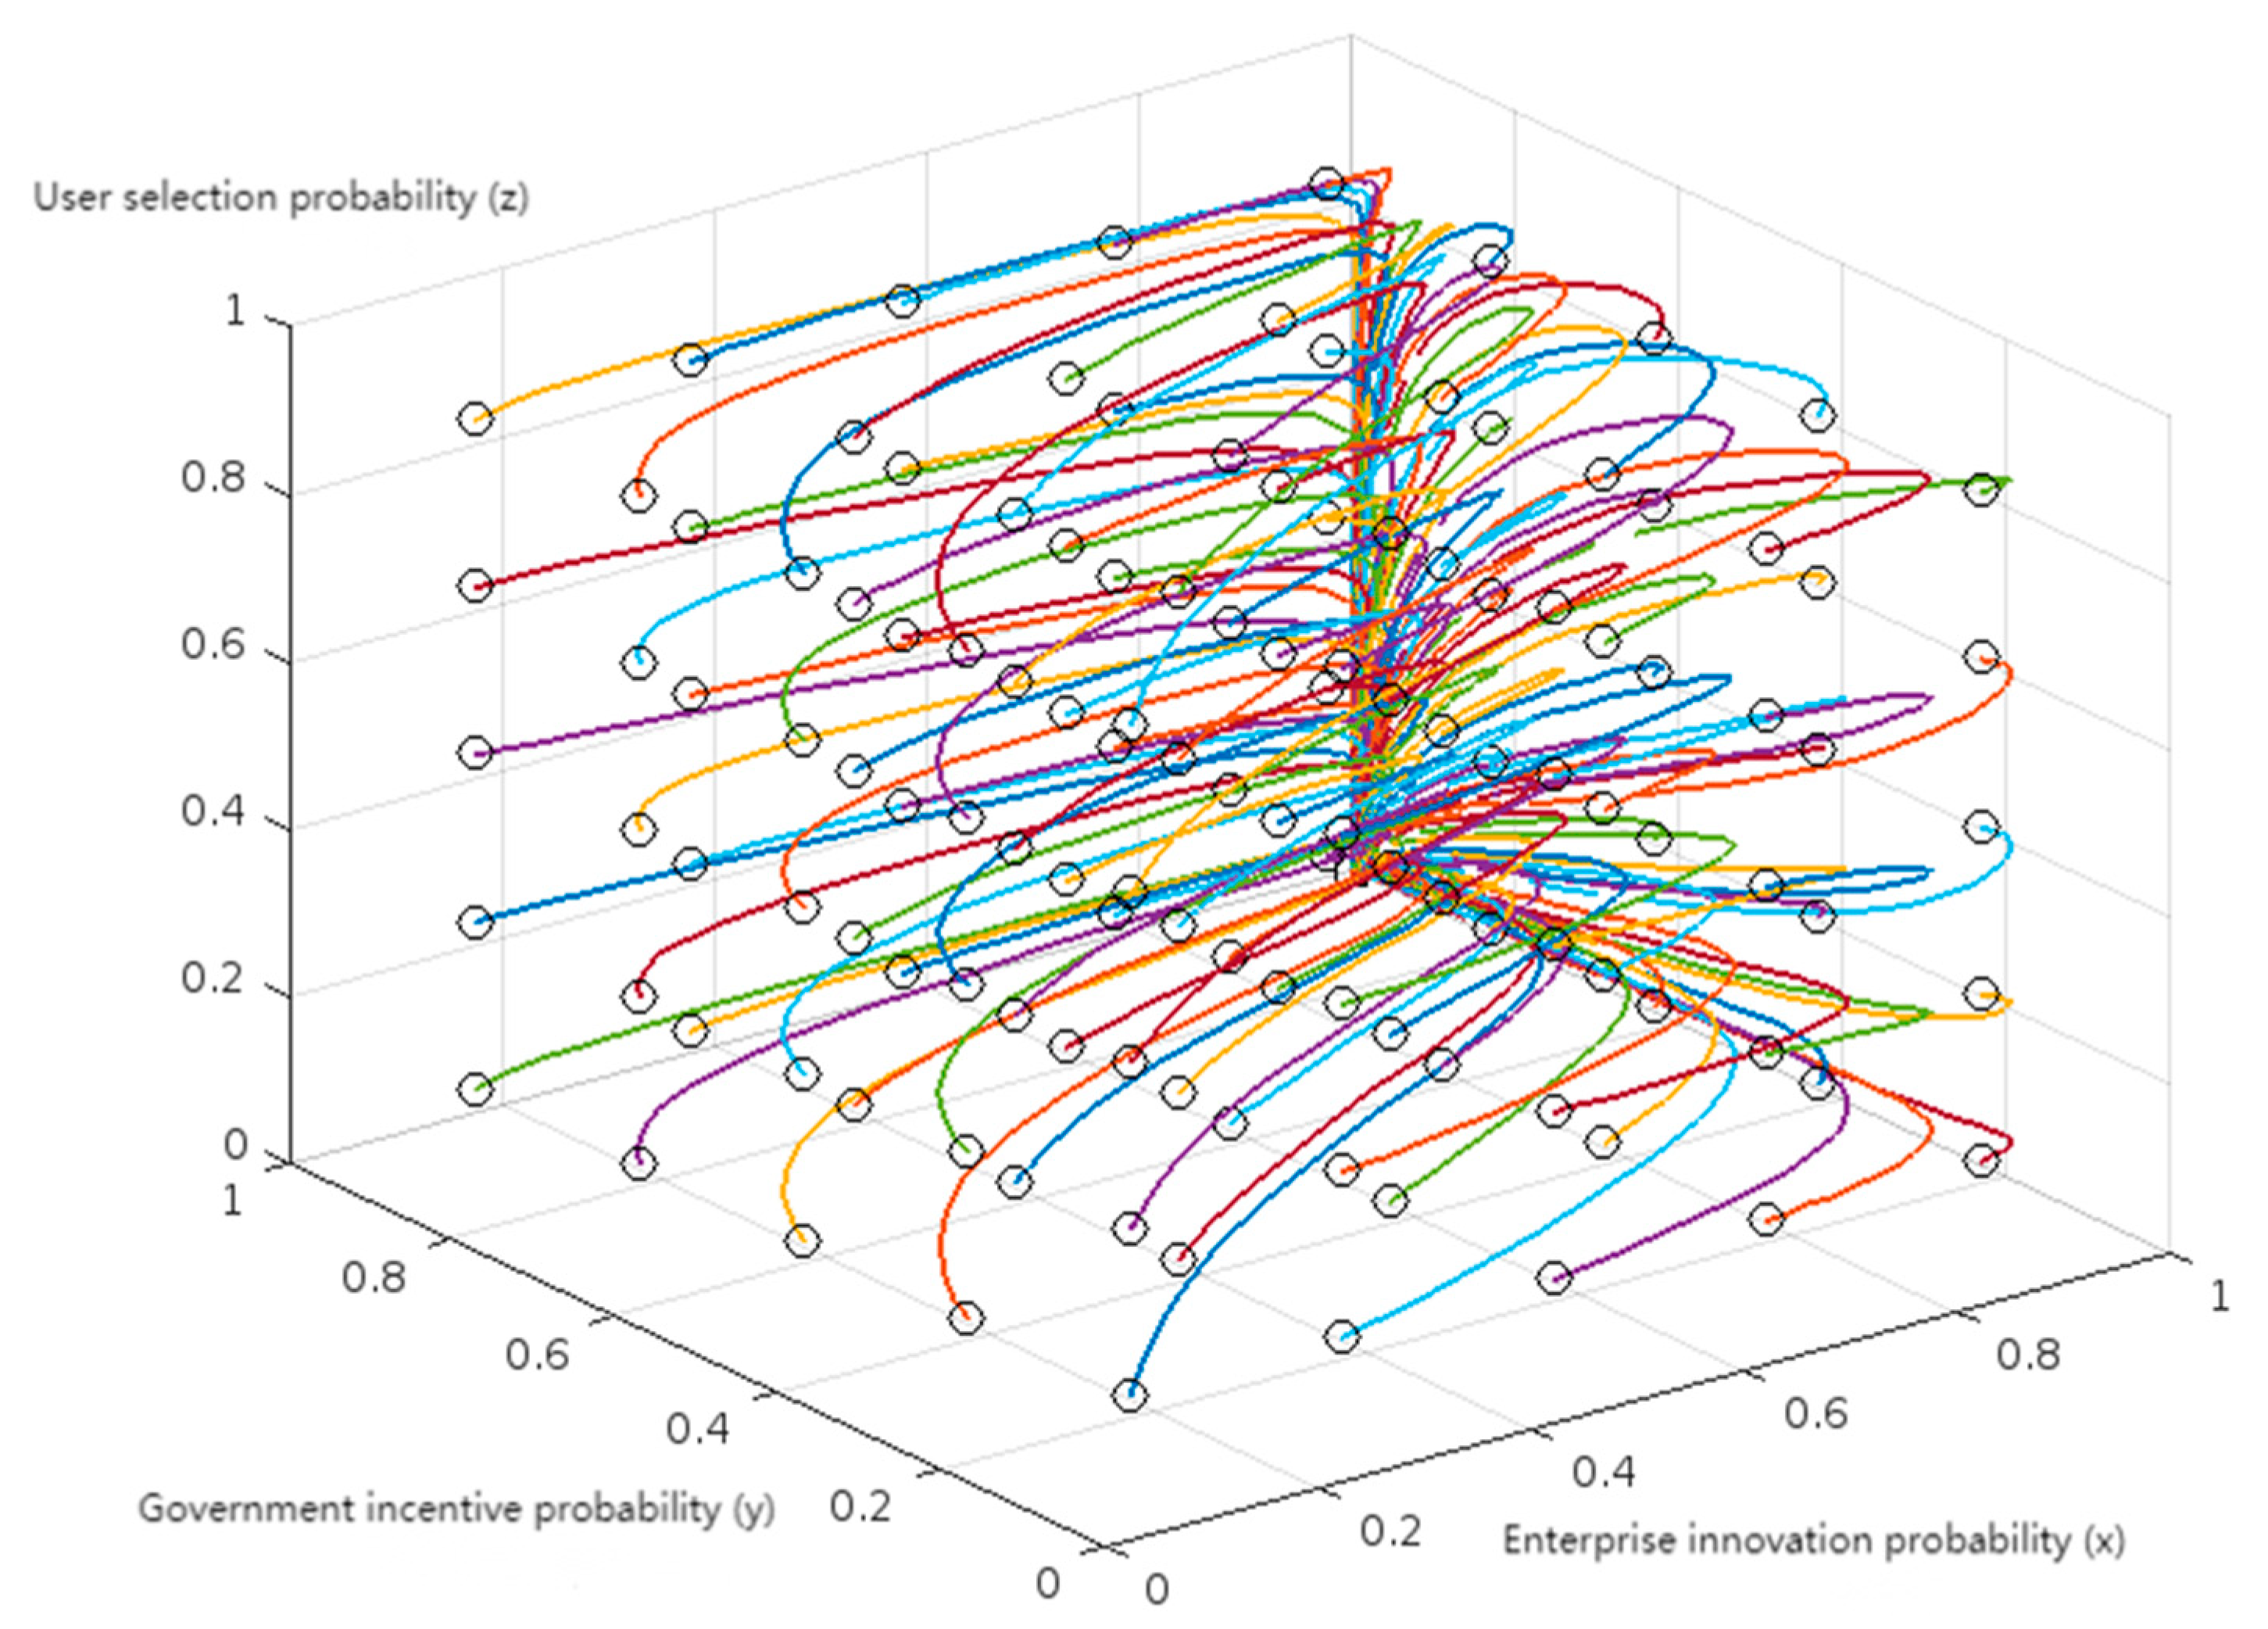
(3) Scenario 3: Weak Incentive–Active Innovation—Choosing Traditional Products
Set the parameters:
R a = 8 ,   C a = 5 ,   R p = 4 ,   C p = 2 ,   P = 1 ,   R g = 5 ,   C g = 5 ,   R l = 4 ,   L g = 0.5 ,   V a = 9 ,   V p = 7.5 ,   C u = 2.6 ,   θ = 0.6
At this time, ( R p C p ) < ( R a C a ) , ( R g C g ) < ( R l L g ) , V a C u < V p . E5 (1, 0, 0) is the evolutionary stable equilibrium point, and the evolutionary stable strategy is (Active Innovation, Weak Incentive, Choosing Traditional Products). Its simulation result is shown in Figure 3.
In this scenario, since enterprise innovation can bring relatively high benefits, the net benefit of private technology enterprises from active innovation is greater than that from passive innovation. The net benefit of the government from weak incentives (the revenue of weak incentives minus the corresponding reputation loss) is greater than the net benefit from strong incentives. Therefore, private technology enterprises are more inclined to adopt the active innovation strategy, the government is more inclined to adopt the weak incentive strategy, and market users are more inclined to adopt the strategy of choosing traditional products. At this time, x = 1, y = 0, z = 0. Because when private technology enterprises engage in passive innovation and the government implements weak incentives, that is, x = 1, y = 0, the expected revenue E31 = VaCu for market users to choose innovative products, and the expected revenue E32 = Vp for choosing traditional products. According to Assumption 2, VaCu < Vp, and according to Assumption 1, all three game parties are rational decision-makers. Therefore, market users will be more inclined to choose traditional products, that is, z = 0. In this game process, although private technology enterprises have chosen active innovation, due to the lack of strong incentive policies and measures from the government, market users cannot obtain sufficient benefits from the behavioral decision of choosing innovative products, which leads to the situation where enterprises choose to innovate but the government fails to respond in a timely manner and market users do not buy it. This is a less-than-ideal stable state.
(4) Scenario 4: Strong Incentive–Active Innovation—Choosing Traditional Products
Set the parameters:
R a = 9 ,   C a = 5 ,   R p = 4 ,   C p = 2 ,   P = 3 ,   R g = 7 ,   C g = 3 ,   R l = 4 ,   L g = 0.8 ,   V a = 9.5 ,   V p = 7.5 ,   C u = 2.6 ,   θ = 0.6 ,   K = 0.1
At this time, ( R p C p ) θ P < ( R a C a ) , ( R l L g ) < ( R g C g ) , V a C u + K < V p . E7 (1, 1, 0) is the evolutionary stable equilibrium point, and the evolutionary stable strategy is (Active Innovation, Strong Incentive, Choosing Traditional Products). Its simulation result is shown in Figure 4.
In this scenario, the net benefit of private technology enterprises choosing the active innovation strategy is greater than the net benefit of passive innovation minus the government’s penalty for passive innovation. The net benefit of the government from strong incentives is greater than the difference between the revenue and loss of weak incentives. In an ideal state, when enterprises choose active innovation and the government implements strong incentives, market users should choose innovative products, thereby forming a virtuous innovation cycle. However, in this scenario, market users still choose traditional products, that is, x = 1, y = 1, z = 0. Taking traditional fuel vehicles and new energy vehicles as an example, although new energy vehicles (as innovative products) bring greater value to users than traditional fuel vehicles, due to the implicit costs of new energy vehicles such as battery replacement costs, charging pile installation costs, and range anxiety, the net benefit of market users choosing new energy vehicles is less than the revenue of choosing traditional fuel vehicles, that is, VaCu < Vp in Assumption 2. In this dilemma, although enterprises carry out active innovation, the net benefit of innovative products is less than the complete revenue of traditional products, making it difficult for enterprises’ innovative products to gain recognition from market users. At this time, in addition to the government’s strong incentives for enterprises, subsidies from the government to users for choosing innovative products when enterprises actively innovate under strong incentives, that is, the existence of K, are also needed. In this scenario, the value of K is relatively low, making it difficult to make up for the revenue gap between VaCu and Vp. As a result, the expected revenue E31 = VaCu + K for market users choosing innovative products is less than the expected revenue E32 = Vp for choosing traditional products, which leads market users (as rational decision-makers) to choose traditional products with greater revenue. This is a less-than-ideal stable state where market users respond passively under the drive of active innovation by the government and enterprises.
(5) Scenario 5: Strong Incentive–Active Innovation—Choosing Innovative Products
Set the parameters:
R a = 9 ,   C a = 5 ,   R p = 4 ,   C p = 2 ,   P = 3 ,   R g = 7 ,   C g = 3 ,   R l = 4 ,   L g = 0.5 ,   V a = 12 ,   V p = 7.5 ,   C u = 2.6 ,   θ = 0.6 ,   K = 3
At this time, ( R p C p ) θ P < ( R a C a ) K , ( R l L g ) < ( R g C g ) , V p < V a C u + K . E8 (1, 1, 1) is the evolutionary stable equilibrium point, and the evolutionary stable strategy is (Active Innovation, Strong Incentive, Choosing Innovative Products). This is an ideal state under tripartite collaboration, and its simulation result is shown in Figure 5.
In this scenario, the profit of private technology enterprises from active innovation after deducting the subsidies issued to market users is still greater than the net benefit of passive innovation minus the government’s penalty for passive innovation, and the net benefit of the government from strong incentives is greater than the difference between the revenue and loss of weak incentives. At this time, private technology enterprises choose the active innovation strategy, and the government chooses the strong incentive strategy, that is, x = 1, y = 1. The behavioral strategies of the government and enterprises in this scenario are the same as those in the E7 (1, 1, 0) scenario, but market users ultimately choose the completely opposite behavioral strategy. This is because the assigned value of K is increased from 0.1 to 3, that is, market users can obtain higher subsidies when choosing innovative products, thereby making up for the revenue gap between the net benefit VaCu of market users choosing innovative products and the complete revenue Vp of choosing traditional products. At this time, market users receive strong incentives, and the expected revenue E31 = VaCu + K for choosing innovative products is greater than the expected revenue E32 = Vp for choosing traditional products. Therefore, market users choose innovative products to obtain higher revenue, that is, x = 1, y = 1, z = 1. This is the optimal solution under tripartite collaboration, which can effectively maintain sustainable innovation momentum and is a stable state pursued by all parties in the game.

5. Conclusions and Recommendations

By constructing a tripartite evolutionary game model of government-private technology enterprises-market users and combining multi-scenario numerical simulations, this study reveals the laws of multi-entity collaborative evolution of sustainable innovation dynamics in private technology enterprises. There are five types of stable equilibria in the tripartite game, and the core of achieving the optimal equilibrium lies in making up for the innovation profit gap. The comparison between Scenario 4 and Scenario 5 shows that when the subsidy k exceeds 2.1, the probability z of users choosing innovative products increases significantly, which verifies H1; Scenario 1 to scenario 4 are all non-optimal equilibria, and only scenario 5 realizes’ tripartite cooperation’ and the evolution is stable, which verifies H2. On this basis, the research conclusions are specifically reflected in the following three aspects: First, there is a critical threshold for the intensity of government policy support; it is difficult to effectively stimulate the sustainable innovation dynamics of private technology enterprises relying solely on a single policy tool or a fixed subsidy intensity. Second, only when the government’s subsidy K for users’ innovative products exceeds a certain threshold, that is, when the subsidy obtained by market users for choosing innovative products can make up for the profit gap between the net benefit of market users choosing innovative products and the full benefit of choosing traditional products (i.e., VaCu + K > Vp), will the system converge to the optimal equilibrium of “Active Innovation–Strong Incentive–Choosing Innovative Products”. Third, multi-scenario verification shows that a single policy or market competition cannot guarantee continuous innovation, and it is necessary to combine enterprise decision-making, policy guidance and users’ wishes to form a benign conduction of enterprise innovation, government encouragement and users’ acceptance, so as to better promote the development of private technology-based enterprises’ continuous innovation power, thus forming a positive feedback of “positive innovation–market recognition–revenue improvement”. This conclusion is consistent with the collaborative view of industry university research requested by Wu Jie et al. (2019) in their study [46]. Existing research, such as Z Jin, analyzes the supply chain subsidies of small and medium-sized enterprises based on system dynamics, and finds that the marginal effect of subsidies on innovation is decreasing [47]. This paper further verifies that government subsidies need to cooperate with users’ choices (K and Rg linkage) to make up for the limitation of ignoring users’ perspectives.
Based on the above research conclusions, this paper puts forward the following suggestions: First, accurately optimize policy tools and grasp the incentive threshold. The government needs to establish a dynamic adjustment mechanism for policy intensity, linking R&D subsidy intensity to the enterprise’s innovation stage. For example, provide R&D subsidies to enterprises in the start-up stage, and focus on tax incentives and intellectual property protection for enterprises in the mature stage. At the same time, establish policy effect monitoring indicators; when the probability of enterprises’ active innovation is lower than 50% for two consecutive quarters and the policy application success rate is lower than 60%, initiate the optimization process of subsidy intensity and approval procedures to avoid misallocation of policy resources.
Second, activate market users’ participation and improve the supervision system. Build a supervision closed-loop from user feedback to enterprise response and then to government incentives. By establishing an innovative product evaluation platform, encourage users to accumulate “innovation points” through evaluations; these points can be exchanged for consumption subsidies or policy preferences to enhance users’ willingness to choose innovative products [48]. At the same time, establish an enterprise innovation reputation file, linking user evaluations to enterprise credit ratings and policy access qualifications. When the user complaint rate of enterprises due to passive innovation exceeds 15%, or when enterprises obtain government innovation subsidies but are fined for passive innovation, suspend their eligibility for subsequent policy subsidies to strengthen market constraints.
Third, construct a tripartite collaboration mechanism to resolve the profit gap dilemma. Promote the government, enterprises, and market users to establish an innovation profit-sharing alliance. Specifically, the government sets up an innovative product promotion fund, providing users who purchase innovative products with a price subsidy of up to 30%, and the subsidy funds are shared by the government and enterprises in proportion [49]. At the same time, enterprises open up the innovation process, invite core users to participate in product design and testing, convert user creativity into innovation achievements, and provide profit sharing; regularly hold innovative product matching meetings, build a tripartite communication platform, and promptly solve problems in the promotion of innovative products, so as to promote the tripartite collaboration to evolve towards the optimal equilibrium.
This study still has some limitations: it does not consider the impact of external environments such as international technological competition and unexpected events, and the game entities are only three parties. Future research can introduce a fourth entity such as institutions of higher education and scientific research institutes, or expand to comparative analysis of enterprises in different industries or of different sizes, so as to enhance the applicability and guiding significance of the conclusions and recommendations.

Author Contributions

Conceptualization, Y.L. and R.H.; Methodology, J.W., W.P. and Z.L.; Software, J.W.; Validation, J.W.; Formal analysis, Y.L., W.P. and Z.L.; Investigation, J.W. and Z.L.; Resources, R.H.; Data curation, J.W. and W.P.; Writing—original draft, Y.L.; Writing—review & editing, Z.L.; Supervision, R.H. and W.P.; Project administration, Y.L. and R.H. All authors have read and agreed to the published version of the manuscript.

Funding

Philosophy and Social Sciences Research Project of Higher Education Institutions in Shandong Province. Project Number: 2025ZSYB064.

Institutional Review Board Statement

Not applicable.

Informed Consent Statement

Not applicable.

Data Availability Statement

The raw data supporting the conclusions of this article will be made available by the authors on request.

Conflicts of Interest

The authors declare no conflicts of interest.

References

  1. Zhang, L.; Wang, Z.; Guo, M. Strengthening the main position of private enterprises in scientific and technological innovation. Enterp. Manag. 2023, 9, 10–13. [Google Scholar]
  2. Liu, F. Five Expectations for the Development of Small and Medium-sized Private Science and Technology Enterprises. Enterp. Reform Dev. 2025, 7, 60–62. [Google Scholar]
  3. Li, Z.; Zhang, R. Research on Evaluation of Enterprise’s Sustainable Innovation Capability. Bus. Res. 2009, 8, 8–10. [Google Scholar]
  4. Duan, H. Research on the Influencing Factors of Enterprise’s Continuous Innovation. Sci. Technol. Prog. Countermeas. 2017, 34, 87–93. [Google Scholar]
  5. García-Morales, J.V.; Lloréns-Montes, J.F.; Verdú-Jover, J.A. Influence of personal mastery on organizational performance through organizational learning and innovation in large firms and SMEs. Technovation 2007, 27, 547–568. [Google Scholar] [CrossRef]
  6. Bai, M.; Wang, R. How Does Corporate’s Social Responsibility Affect the Persistence of Firm Innovation? China Sci. Technol. Forum 2020, 1, 107–115. [Google Scholar]
  7. He, Y.; Zhou, H.; Ding, J. Research on the impact of technological diversification on the persistence of innovation at firm-level. Sci. Res. 2017, 35, 1896–1909. [Google Scholar]
  8. Wang, G.; Yue, X.; Huang, H. Cooperation Culture, Enterprise Innovation and Organizational Resilience. Ind. Technol. Econ. 2023, 42, 105–114. [Google Scholar]
  9. Drucker, P.F.; Noel, J.L. Innovation and Entrepreneurship: Practices and Principles. J. Contin. High. Educ. 1986, 34, 22–23. [Google Scholar] [CrossRef]
  10. Guo, J.; Zhang, Y.; Cao, C. Research on the Driven Path of Ambidextrous Innovation of Science and Technology Enterprises: An Exploration Based on Fuzzy Set Qualitative Comparative Analysis. Math. Probl. Eng. 2022, 2022, 6173263. [Google Scholar] [CrossRef]
  11. Zhao, X.; Zhai, L.; Jiang, Y. Evolutionary Game Decision in a Platform Supply Chain with Digital Empowerment. J. Manag. 2023, 20, 925–935. [Google Scholar]
  12. Li, C.; Zheng, Q. Deep Integration of Manufacturing and Logistics Industry and Inter-firm Technological Co-innovation—An Evolutionary Game Analysis with Government Involvement. Bus. Res. 2023, 5, 29–38. [Google Scholar]
  13. Shang, H.; Fang, D. Government Subsidies, Risk-Taking and Technological Innovation of Private Science and Technology Enterprises. J. Manag. 2021, 34, 45–62. [Google Scholar]
  14. Teets, J.C.; Hasmath, R.; Lewis, O. The Incentive to Innovate? The Behavior of Local Policymakers in China. J. Chin. Political Sci. 2017, 22, 505–517. [Google Scholar] [CrossRef]
  15. Xu, Y.; Xu, X.; Tian, F. Research on the Influencing Factors of Enterprise Technological Innovation in China. Stat. Inf. Forum 2025, 40, 17–28. [Google Scholar]
  16. Li, N.; Zhang, X. Digital empowered business environment and enterprise innovation: Evidence from China. Pac. Basin Financ. J. 2025, 91, 102755. [Google Scholar] [CrossRef]
  17. Gao, Y.; Tao, S. Research on the Impact of US Economic Sanctions on Innovation in Chinese Technology Enterprises—Analysis Based on Enterprise Innovation Decision Theory Model. Mod. Econ. Discuss. 2025, 8, 53–68. [Google Scholar]
  18. Dai, W. Belt and Road Initiative: Driving innovation in tech enterprises through global value chains. Financ. Res. Lett. 2025, 74, 106796. [Google Scholar] [CrossRef]
  19. Chen, Y.; Huang, C. Government intervention and corporate technological innovation: An evolutionary theory game analysis framework. J. Harbin Univ. Commer. (Soc. Sci. Ed.) 2025, 5, 61–73. [Google Scholar]
  20. Ren, Z.; Xiang, J.; Liu, Q.; Yu, X. Evolutionary Game Analysis of Government Subsidy Mechanism and Enterprise Innovation Strategy—From the Perspective of Stock Price Crash Risk. J. Knowl. Econ. 2024, 1–23. [Google Scholar] [CrossRef]
  21. Liang, X.; Yu, T.; Hong, J.; Shen, Q.G. Making incentive policies more effective: An agent-based model for energy-efficiency retrofit in China. Energy Policy 2019, 126, 177–189. [Google Scholar] [CrossRef]
  22. Li, J.; Li, H.; Zhang, X.; Wang, J.; Yang, R. Tripartite Evolutionary Game and Simulation Analysis of Green Innovation in Logistics Enterprises under the Background of New Quality Productive Forces. Logist. Res. 2025, 1, 4–13+41. [Google Scholar]
  23. Zhang, X.; Zhu, Q.; Li, X.; Pan, Y. The impact of government subsidy on photovoltaic enterprises independent innovation based on the evolutionary game theory. Energy 2023, 285, 129385. [Google Scholar] [CrossRef]
  24. Yuan, N.; Li, M. Research on collaborative innovation behavior of enterprise innovation ecosystem under evolutionary game. Technol. Forecast. Soc. Change 2024, 206, 123508. [Google Scholar] [CrossRef]
  25. Zhen, J.; Ouyang, J.; Wang, L. An evolutionary game analysis of incentive of industrial parks, government support and enterprise innovation willingness in China. Heliyon 2024, 10, e36618. [Google Scholar] [CrossRef] [PubMed]
  26. van Tulder, R.; van Mil, E. Principles of Sustainable Business: Frameworks for Corporate Action on the SDGs; Taylor and Francis: Abingdon, UK, 2022. [Google Scholar] [CrossRef]
  27. Polman, P.; Winston, A. Net Positive: How Courageous Companies Thrive by Giving More Than They Take; Chemical Engineering Progress: New York, NY, USA, 2021; Volume 117, p. 53. [Google Scholar]
  28. Liu, C.; Yu, T.; Ma, Y. Game of Government, Enterprise and Consumer Based on Product Quality Regulation Perspective. China Manag. Sci. 2019, 27, 127–135. [Google Scholar]
  29. Chen, H. Game model construction and analysis of different stakeholders-based on the construction of technological innovation mechanism of private enterprises. China Trade 2015, 4, 133–135. [Google Scholar]
  30. Zhou, X.; Deng, J.; Su, Y.; Peng, J. On the Mechanism of the Competency Construction under Rapid Changing Environment: A Case Study based on Dynamic Capability. South. Econ. 2019, 11, 113–130. [Google Scholar]
  31. Wei, X.; Chen, W.; Lin, C. Evolution, Classification, and Relationships of the Theories of Innovation Capabilities. Manag. Q. 2019, 4, 112–150+157. [Google Scholar]
  32. Dong, X.; Yuan, P. Innovation balance mode selection and enterprise performance: The role of technological diversity and financial redundancy. J. Jinan Univ. (Soc. Sci. Ed.) 2020, 30, 100–108+159. [Google Scholar]
  33. March, J.G. Exploration and exploitation in organizational learning. Organ. Sci. 1991, 2, 71–87. [Google Scholar] [CrossRef]
  34. Wu, Z. An Analysis of the Influencing Factors of the Purchase Decision of New Energy Vehicles. J. Ezhou Univ. 2021, 28, 47–48. [Google Scholar]
  35. von Hippel, E. Democratizing innovation: The evolving phenomenon of user innovation. J. Betriebswirtsch. 2005, 55, 63–78. [Google Scholar] [CrossRef]
  36. Rogers, E.M. Diffusion of Innovations; The Free Press: New York, NY, USA, 1962. [Google Scholar]
  37. Xie, N.; Tong, Y.; He, H. Evolutionary Game Analysis of SME Social Responsibility Performance under Public Health Emergencies. Mathematics 2023, 11, 1802. [Google Scholar] [CrossRef]
  38. Alqudah, Z.M.; García, S.L.; Benau, G.A.M. Influence of ESG among Jordanian fintech businesses: The moderating role of sustainable finance technology. Discov. Sustain. 2024, 5, 496. [Google Scholar] [CrossRef]
  39. Yu, D.; Zhang, H.; Hu, J.; Zhang, J. Research on the Evolutionary Mechanism of Non-core Enterprises in the Industrial Innovation Network Based on Evolutionary Game Theory. Tech. Econ. 2022, 41, 52–62. [Google Scholar]
  40. Yang, N.; Wang, Y.; Wang, Y.; Zhang, Y. Evolutionary Game on Technological Innovation of Enterprises in Complex Product R&D Network. China Manag. Sci. 2024, 32, 242–253. [Google Scholar]
  41. Zhang, Y.; Zheng, Y.; Bai, C.; Zhou, B. Tripartite Evolutionary Game Analysis of Digital Technology Empowering Enterprise Radical Innovation. Front. Eng. Manag. Sci. Technol. 2025, 1–15. Available online: https://link.cnki.net/urlid/34.1336.N.20250626.0937.004 (accessed on 26 June 2025).
  42. Li, Y.; Wu, L. An Evolutionary Game Study on Multi-Subject Strategy Selection under Government R&D Subsidies. Math. Pract. Theory 2025, 55, 41–56. [Google Scholar]
  43. Wang, X.; Ren, X. Research on credit supervision mechanism of e-commerce platform based on evolutionary game. Syst. Eng. Theory Pract. 2020, 40, 2617–2630. [Google Scholar]
  44. Barreto, S.L.; Freitas, V.; Paula, D.F.A.V. Sustainable supply chain innovation and market performance: The role of sensing and innovation capabilities. Clean. Responsible Consum. 2024, 14, 100199. [Google Scholar] [CrossRef]
  45. Li, X.; Zhang, L.; Cao, J. Research on the mechanism of sustainable business model innovation driven by the digital platform ecosystem. J. Eng. Technol. Manag. 2023, 68, 101738. [Google Scholar] [CrossRef]
  46. Wu, J.; Che, X.; Sheng, Y.; Chen, L.; Shi, Q. Study on Government-industry-university-institute Collaborative Innovation Based on Tripartite Evolutionary Game. China Manag. Sci. 2019, 27, 162–173. [Google Scholar]
  47. Jin, Z.; Zheng, Q. An evolutionary game analysis of subsidy strategies in the supply chain of SMEs based on system dynamics. Procedia Comput. Sci. 2022, 199, 1513–1520. [Google Scholar] [CrossRef]
  48. Tu, J.; Zhang, Z. Coordination Dilemma and Subsidy Strategy of Innovation Diffusion among Heterogeneous User Groups. Tech. Econ. Manag. Res. 2016, 7, 24–28. [Google Scholar]
  49. Liu, H.; Xia, H. Research on Coordination Mechanism of Collaborative Innovation Based on Government Subsidy. Ind. Technol. Econ. 2019, 38, 13–20. [Google Scholar]
Figure 1. Results of the Impact of Revenue–Cost Differences on Behavioral Decision Evolution in Scenario 1. Source: Authors’ elaboration.
Sustainability 17 09217 g001
Figure 2. Results of the Impact of Revenue–Cost Differences on Behavioral Decision Evolution in Scenario 2. Source: Authors’ elaboration.
Sustainability 17 09217 g002
Figure 3. Results of the Impact of Incentive Mechanism on Behavioral Decision Evolution in Scenario 3. Source: Authors’ elaboration.
Sustainability 17 09217 g003
Figure 4. Results of the Impact of Incentive Mechanism on Behavioral Decision Evolution in Scenario 4. Source: Authors’ elaboration.
Sustainability 17 09217 g004
Figure 5. Results of the Impact of Incentive Mechanism on Behavioral Decision Evolution in Scenario 5. Source: Authors’ elaboration.
Sustainability 17 09217 g005
Table 1. Specific steps and contents of three-way game.
CategoryStepSpecific Implementation Points
Problem Identification & ModelingPreparationProblem Definition & Agent IdentificationTo address the triangular dilemma of “low willingness of enterprises to innovate, difficulties in policy implementation, and slow market acceptance,” the government, private technology enterprises, and market users are identified as the boundedly rational players.
Model Assumptions & Parameter DefinitionDefine the strategy spaces for the three agents (Government strategies: strong/weak incentives; Enterprise strategies: active/passive innovation; User strategies: choosing innovative/traditional products). Parameters include Ra, Ca, Rp, Cp, etc. (refer to Table 2 in the paper), with values based on empirical data from the literature.
Theoretical Analysis & ModelConstructionPayoff Matrix ConstructionConstruct a 2 × 2 × 2 three-dimensional payoff matrix based on game-theoretic payoff structures, calculating the expected payoffs for all strategy combinations (refer to Table 3 in the paper).
Replicator Dynamic Equation DerivationDerive the replicator dynamic equations for the three agents, e.g., F(x) = dx/dt = x(1 − x)[E11 − E12], describing the strategic evolution path.
Stability Analysis & NumericalVerificationEquilibrium Point Solving & Stability AnalysisSolve the eight pure-strategy equilibrium points and analyze the Evolutionarily Stable Strategy (ESS) by evaluating the eigenvalues of the Jacobian matrix, applying Friedman’s rule: a point is locally asymptotically stable if all eigenvalues λ1, λ2, λ3 < 0; E8 (1, 1, 1) is identified as the optimal ESS for tripartite collaboration (see Section 3.3).
Numerical SimulationConduct multi-scenario simulations using Matlab software, with parameter settings based on five typical scenarios.
Result Output & ValidationResult Output & ValidationGenerate evolutionary path diagrams (time-series plots), output simulation results, and perform sensitivity analysis and policy mapping.
Source: Authors’ elaboration.
Table 2. Definition and Description of Related Parameters.
ParameterParameter Description
xProbability of private technology enterprises adopting the active innovation strategy
yProbability of the government adopting the strong incentive strategy
zProbability of users choosing innovative products
RaRevenue of private technology enterprises from active innovation
CaCost of private technology enterprises for active innovation
RpRevenue of private technology enterprises from passive innovation
CpCost of private technology enterprises for passive innovation
PPenalty imposed by the government on private technology enterprises for passive innovation
RgRevenue of the government from strong incentives
CgCost of the government for strong incentives
RlRevenue of the government from weak incentives
LgReputation loss of the government from weak incentives
VaRevenue of users from choosing innovative products
VpRevenue of users from choosing traditional products
CuAdditional cost for users to choose innovative products (premium/learning cost)
SRisk loss borne by users choosing innovative products when private technology enterprises passively innovate and the government implements weak incentives
KSubsidy for users choosing innovative products when enterprises actively innovate under strong government incentives
θ Probability of private technology enterprises being penalized for passive innovation
Source: Authors’ elaboration.
Table 3. The payoff matrix for enterprises, users and government.
Game EntitiesMarket Users
Choose Innovative Products
(z)
Choose Traditional Products
(1 − z)
Private Technology EnterprisesActive Innovation (x)GovernmentStrong Incentives (y) ( R a C a K , R g C g , V a C u + K ) ( R a C a , R g C g , V p )
Weak Incentives (1 − y) ( R a C a , R l L g , V a C u ) ( R a C a , R l L g , V p )
Passive Innovation (1 − x)GovernmentStrong Incentives (y) ( R p C p θ P , R g C g + θ P , V a C u ) ( R p C p θ P , R g C g + θ P , V p )
Weak Incentives (1 − y) ( R p C p , R l L g , V a C u S ) ( R p C p , R l L g , V p )
Source: Authors’ elaboration.
Table 4. Characteristic root and Stability of Each Equilibrium Point.
Equilibrium PointEigenvaluesStability ConditionsLocal Stability
E 1 = ( 0 ,   0 ,   0 ) λ 1 = ( R a C a ) ( R p C p ) λ 2 = ( R g C g ) + θ P ( R l L g ) λ 3 = V a C u V p S ( R a C a ) < ( R p C p ) ( R g C g ) + θ P < ( R l L g ) V a C u S < V p Asymptotic ESS
E 2 = ( 0 ,   0 ,   1 ) λ 1 = ( R a C a ) ( R p C p ) λ 2 = ( R g C g ) + θ P ( R l L g ) λ 3 = ( V a C u V p S ) λ3 > 0 holds constantlyUnstable Point
E 3 = ( 0 ,   1 ,   0 ) λ 1 = ( R a C a ) ( R p C p ) + θ P λ 2 = [ ( R g C g ) + θ P ( R l L g ) ] λ 3 = V a C u V p ( R a C a ) + θ P < ( R p C p ) ( R l L g ) < ( R g C g ) + θ P V a C u < V p Asymptotic ESS
E 4 = ( 0 ,   1 ,   1 ) λ 1 = ( R a C a ) ( R p C p ) + θ P λ 2 = [ ( R g C g ) + θ P ( R l L g ) ] λ 3 = ( V a C u V p ) λ3 > 0 holds constantlyUnstable Point
E 5 = ( 1 ,   0 ,   0 ) λ 1 = [ ( R a C a ) ( R p C p ) ] λ 2 = ( R g C g ) ( R l L g ) λ 3 = V a C u V p ( R p C p ) < ( R a C a ) ( R g C g ) < ( R l L g ) V a C u < V p Asymptotic ESS
E 6 = ( 1 ,   0 ,   1 ) λ 1 = [ ( R a C a ) ( R p C p ) ] λ 2 = ( R g C g ) ( R l L g ) λ 3 = ( V a C u V p ) λ3 > 0 holds constantlyUnstable Point
E 7 = ( 1 ,   1 ,   0 ) λ 1 = [ ( R a C a ) ( R p C p ) + θ P ] λ 2 = [ ( R g C g ) ( R l L g ) ] λ 3 = V a C u V p + K ( R p C p ) θ P < ( R a C a ) ( R l L g ) < ( R g C g ) V a C u + K < V p Asymptotic ESS
E 8 = ( 1 ,   1 ,   1 ) λ 1 = [ ( R a C a ) ( R p C p ) + θ P K ] λ 2 = [ ( R g C g ) ( R l L g ) ] λ 3 = ( V a C u V p + K ) ( R p C p ) θ P < ( R a C a ) K ( R l L g ) < ( R g C g ) V p < V a C u + K Asymptotic ESS
Source: Authors’ elaboration.
Disclaimer/Publisher’s Note: The statements, opinions and data contained in all publications are solely those of the individual author(s) and contributor(s) and not of MDPI and/or the editor(s). MDPI and/or the editor(s) disclaim responsibility for any injury to people or property resulting from any ideas, methods, instructions or products referred to in the content.