Article

An Optimal Active Power Allocation Method for Wind Farms Considering Unit Fatigue Load

1
Inner Mongolia Daqingshan Laboratory Co., Ltd., Hohhot 010020, China
2
College of Electrical Engineering, Zhejiang University, Hangzhou 310027, China
3
Inner Mongolia Power (Group) Co., Ltd., Hohhot 010020, China
4
Inner Mongolia Electric Power Group Mengdian Economic and Technical Research Institute Co., Ltd., Hohhot 010020, China
*
Author to whom correspondence should be addressed.
Sustainability 2025, 17(20), 9189; https://doi.org/10.3390/su17209189
Submission received: 8 September 2025 / Revised: 3 October 2025 / Accepted: 13 October 2025 / Published: 16 October 2025

Abstract

To address the issue of premature wear and tear in wind turbines due to uneven fatigue load distribution within wind farms, this study proposes an optimal active power allocation method that considers unit fatigue loads. First, the fatigue load expressions for wind turbine shafts and tower systems with two degrees of freedom are derived, and a quantitative relationship between turbine fatigue load and active power output variations is established. Subsequently, the optimization objective is set as minimizing the total fatigue load in the wind farm during frequency regulation. This model incorporates the fatigue load differences among different turbines and ensures that the sum of the power adjustments across all turbines meets the frequency regulation power demand, resulting in an active power allocation model. To solve this optimization model, an improved Firefly Algorithm (IFA), integrating Logistic mapping and an adaptive weight strategy, is employed. Aligned with the recommended goals of sustainable development, this approach not only reduces fatigue loads, enhancing the lifespan and efficiency of wind turbines, but also ensures that the wind farm retains strong frequency regulation performance. By optimizing turbine performance and promoting a more balanced load distribution, the proposed method significantly contributes to the overall reliability and economic sustainability of renewable energy systems. Finally, a case study system consisting of nine 5 MW turbines is established to validate the proposed method, demonstrating its ability to evenly distribute the fatigue load across turbines while effectively tracking higher-level dispatch commands and reducing the same fatigue loads.

1. Introduction

As wind power continues to penetrate the energy market, the operation and maintenance (O&M) of wind farms have become increasingly central to the concerns of operators [1,2]. Unlike conventional energy sources, wind farms do not incur fuel costs, making O&M expenses a pivotal factor in determining overall economic efficiency [3]. A major contributor to these costs is the frequent fluctuation in active power output, which significantly accelerates fatigue in critical mechanical components, such as the turbine drivetrain and tower. Addressing the fatigue load on wind turbines is therefore essential—not only for improving the operational reliability of wind farms but also for enhancing the sustainability of the energy sector by extending equipment lifespan and reducing ongoing maintenance costs [4,5].
Currently, wind farms generally participate in system frequency regulation through centralized station responses [6]. Specifically, the station controller calculates the deviation in active power based on the frequency response strategy and allocates this deviation to individual turbines according to a predefined distribution scheme. There are three main methods proposed for determining this distribution. The first method employs a proportional distribution strategy to achieve optimal control of active power in the wind farm. In Reference [7], a distributed dual-gradient algorithm is employed to optimize the active power control of wind farms, based on a proportional distribution strategy. On the other hand, Reference [8] introduces a centralized frequency regulation control system, where the key mechanism is the dynamic proportional allocation of frequency regulation power, determined by the real-time output capability of the turbines as assessed by the wind farm control center. While this method is computationally simple and easy to implement, it typically lacks economic efficiency [9]. The second approach, in contrast, aims to minimize the operational cost of the wind farm, focusing on economic optimization. Reference [10] considers the economic aspect of operation and applies a three-stage stochastic robust optimization method to optimize wind power generation. Similarly, Reference [11] employs a distributed robust optimization strategy to achieve the same goal. However, this approach often faces challenges in terms of the physical interpretation of the cost function [12]. The third method takes into account the fatigue load of the turbines to optimize the active power dispatch. Compared with the first two methods, this approach optimizes the O&M costs of the turbines through the physically meaningful fatigue load. It not only effectively extends the operational life of the turbines but also enhances the overall economic performance of the wind farm [13]. This method, therefore, offers significant advantages and serves as the scheduling strategy adopted in this paper. Despite its promising theoretical and practical prospects, several challenges remain in the actual application, requiring further in-depth research.
When optimizing fatigue load, the key issue lies in accurately calculating the fatigue load on wind turbines. According to existing research, damage equivalent load (DEL) is used to describe the mechanical structure’s damage through the Rainflow Counting Method [10] and the Palmgren–Miner criterion [11], which can more accurately characterize the fatigue behavior of the drivetrain system. This method is widely recognized, but due to the complexity of DEL calculation, it is typically treated as a post-evaluation parameter rather than a direct real-time optimization guide [12]. Wang et al. [13] integrates a multi-model predictive controller with a real-time autoregressive model, proposing an adaptive multi-model predictive controller to compensate for variations in the shaft torque during frequency regulation, thereby optimizing the drivetrain load. However, this study focuses solely on the drivetrain load optimization, neglecting the analysis of the tower load. Although the drivetrain load is closely related to the fatigue behavior of the drivetrain system, it does not exhibit a perfectly linear relationship with fatigue damage. Zhang et al. [14] ensures that, while capturing the maximum power in the wind farm under wake effects, the fatigue load on both the drivetrain and tower directions is constrained within a certain range. This overall reduces the frequency load on the station, improving turbine operation, but does not provide a quantitative representation of the fatigue load. It is worth noting that some literature also applies data-driven methods to characterize fatigue load [15], optimizing power distribution by minimizing the turbine’s fatigue load. Although data-driven methods offer considerable advantages in solving complex problems, their high level of complexity brings significant challenges. The extensive processing requirements for large datasets and the need for model training result in substantial computational costs. Such a heavy computational load can make real-time implementation difficult, especially in scenarios that demand quick decision-making and immediate adjustments for turbine operations. As a result, the complexity of these methods may hinder their ability to quickly compute active power values—an essential factor for efficient power control in time-sensitive environments. Furthermore, the accuracy of data-driven models is heavily reliant on the quality and volume of the training data. If the data is incomplete, noisy, or inconsistent, it can severely impact the model’s performance, ultimately compromising the reliability of the optimization process. Therefore, in this study, we analyze the variations in fatigue load under the dual-degree-of-freedom framework of the turbine drivetrain and tower, ensuring computational efficiency.
Moreover, intelligent optimization algorithms can effectively solve the optimization allocation models for the wind turbine’s rolling active power. Existing studies have shown that Genetic Algorithms (GA) [16] and Particle Swarm Optimization (PSO) [17] have been widely used in the iterative solution of such problems. However, both of these algorithms suffer from slow convergence rates and a tendency to fall into local optima. In contrast, the Firefly Algorithm (FA) [18], due to its simple concept, fewer required parameters, lower sensitivity to parameter variations, and ease of implementation, has gained widespread attention. FA simulates the attraction behavior of fireflies based on differences in brightness and distance: brighter fireflies attract dimmer ones, guiding the search process in the solution space and progressively approaching the global optimum. However, because FA contains multiple attraction sources, this can lead to oscillations during the search process, affecting its convergence performance [19]. To improve the algorithm’s convergence speed and solution stability, this paper introduces an improved Firefly Algorithm (IFA) based on Logistic mapping and an adaptive weight strategy to enhance its optimization efficiency and global search ability.
To tackle the challenges outlined, this paper introduces an optimal active power allocation method for wind farms, specifically addressing turbine fatigue loads. The approach begins by constructing a power-load estimation model that considers the dual-degree-of-freedom systems of both the drivetrain and tower, allowing for a detailed quantitative analysis of turbine fatigue. With this foundation, the primary goal is to minimize the total fatigue load across the wind farm, factoring in differences in fatigue load between individual turbines. Additionally, constraints are introduced to ensure that the total turbine output adjustments meet the frequency regulation requirements for the entire station, thereby forming the active power allocation optimization model. To solve this model, we employ an enhanced Firefly Algorithm (IFA), which incorporates Logistic mapping and an adaptive weight mechanism. This not only boosts global search capabilities and speeds up convergence but also prevents the algorithm from getting trapped in local optima. The result is a power allocation strategy that significantly reduces fatigue loads while ensuring robust frequency regulation performance. By extending the lifespan of turbines and lowering operational costs, this method makes a meaningful contribution to the sustainability and economic efficiency of wind energy systems.

2. Mathematical Model of Fatigue Load in Wind Farms

During frequency regulation, wind turbines are subjected to aerodynamic loads, impact loads, and other forces. The alternating components of these loads can lead to fatigue damage in various turbine components, such as the drivetrain, tower, and blades. This fatigue can result in cracks, fractures, or deformations in the parts, ultimately reducing the reliability of the turbine and shortening its operational lifespan [20]. The economic performance of a wind farm is closely tied to the reliability and availability of the wind turbines, and the time required to address component failures significantly affects both the reliability and availability of the turbines.
In the study of fatigue loads in wind farms, determining the indicators for measuring the fatigue levels of wind turbines is of utmost importance. Since fatigue damage results from the accumulation of varying stresses experienced by the materials of the turbine, which cannot be directly measured, effective quantitative metrics are required to assess the extent of fatigue damage. The primary sources of fatigue load in wind turbines come from the torque exerted by the main shaft and the tower thrust, as illustrated in Figure 1. Where H t is the height of the wind turbine tower, F t is the aerodynamic thrust on the tower, ω m is the rotor speed, H w and H g are the moments of inertia of the wind turbine rotor and generator, respectively; ω g and ω s are the angular velocities of the generator and drivetrain shaft system, respectively; T m , T e , and T s are the torques acting on the wind turbine rotor, generator, and drivetrain shaft system, respectively; D s is the equivalent damping of the drivetrain shaft system; K s is the equivalent stiffness of the drivetrain shaft system; N is the gearbox transmission ratio.
In existing studies, the drivetrain and tower of wind turbines are recognized as components that typically require longer failure handling times. Therefore, this paper primarily focuses on the fatigue load of the drivetrain and tower. As shown in Figure 1, the fatigue loads on the drivetrain and tower are primarily associated with the torque acting on the main shaft drivetrain and the bending moment acting on the tower. In the process of active power control, considering the fatigue of the turbine requires a clear understanding of the relationship between active power and the torque and bending moments that cause fatigue. This chapter begins with the basic mathematical model of the wind turbine and presents the fatigue calculation method for the turbine drivetrain and tower, modeled as a two-degree-of-freedom system, establishing the relationship between the fatigue load of the wind turbine and the variation in active power output.

2.1. Aerodynamic Model

In the direction of the main shaft, the mechanical power obtained by the wind turbine from the wind is given by [21]
P m = 0.5 π ρ R 2 v 3 C p ( λ , β ) λ = R ω m v C p ( λ , β ) = 0.5176 116 λ 0.4 β 5.0 e 12.5 λ + 0.00681 λ λ = 1 1 / ( λ + 0.08 β ) 0.035 / β 3 + 1
where ρ is the air density, R is the radius of the wind turbine blade, v is the wind speed, C p is the power coefficient of the wind system, β is the pitch angle, and λ is the tip–speed ratio.
In the tower direction, the tower bending moment M t exerted on the wind turbine can be expressed as
M t = H t F t F t = 0.5 π ρ R 2 v 2 C t ( λ , β )
where C t is the thrust coefficient.

2.2. Drivetrain Model

The fatigue failure of the turbine main shaft typically results from cyclic loading, particularly fluctuations caused by unbalanced torque. The two-mass block model provides a simple yet effective way to simulate the torque transmission, vibrational response, and accumulation of fatigue loads within the system [22]. By calculating the dynamic responses (such as displacement, velocity, and acceleration) of each mass block in the model, the fatigue load on the main shaft under various operating conditions can be predicted. The dynamic equation is as follows:
H w ω ˙ m = T m T s H g ω ˙ g = T s N T e T s = D s ω s + K s φ s φ ˙ s = ω m ω g N
where φ s is the angular displacement of the drivetrain shaft system.
In Equation (3), the inertia parameters of the wind turbine and generator, as specified in the first and second constraints, govern their inertial characteristics and responses to external disturbances. These equations provide insight into how the wind turbine and generator react to external torque changes and the underlying interaction mechanisms between them. The third constraint is designed to capture the elastic and damping properties of the drivetrain system. Meanwhile, the fourth constraint establishes the relationship between the angular velocity difference of the wind turbine and generator, and the angular displacement within the drivetrain. By carefully controlling these angular velocity differences, it is possible to regulate the dynamic behavior of the entire system, thus optimizing performance and reducing fatigue loads effectively.
To quantitatively consider fatigue loads in the wind farm power optimization process, we use a fatigue sensitivity coefficient to describe the relationship between the turbine’s fatigue load and the variation in active power [23]. Using Equation (3), we can derive the calculation formula for T s :
T s = H g N 2 H t T m + H w N H t T e H t = H w + H g N 2
The increment of torque of drivetrain shaft system is derived from (4):
Δ T s = H g N 2 H t Δ T m + H w N H t Δ T e
By combining Equation (1), the mechanical torque of the turbine and its incremental form can be obtained as follows:
T m = 0.5 π ρ R 2 v 3 C p ω m = 0.5 π ρ N R 2 v 3 C p ω g Δ T m = T m ω g Δ ω g + T m β Δ β
The relationship and incremental relationship between the electromagnetic torque T e of the wind turbine, the electromagnetic power P g , and the generator speed measurement ω f can be expressed as
T e = P g ω f Δ T e = 1 ω f 0 Δ P g P g 0 ω f 0 2 Δ ω f
where ω f 0 is the sampled value of the corresponding parameter at the current time.
The partial derivatives of the mechanical torque with respect to the rotational speed and pitch angle of the wind turbine can be obtained from Equation (6).
T m ω g = N P * C p ω g 2 + N P * ω g C p ω g
T m β = N P * ω g C p β
where P * = 0.5 π ρ R 2 v 3 is the available wind power. Additionally, from Equations (8) and (9), it can be inferred that the partial derivatives of the wind energy utilization coefficient with respect to the pitch angle and rotational speed need to be calculated. The partial derivative of the coefficient of power with respect to the rotational speed can further be computed as
C p ω g = R N v C p λ
By examining Equation (10), we need to calculate the partial derivatives of C p with respect to λ and β . As shown in Equation (1), the relationship between these variables is highly nonlinear. To simplify the process, we adopt the idea of tabulation, which can be expressed as
C p λ = C p ( n + 1 , m ) C p ( n , m ) λ n + 1 λ n
C p β = C p ( n , m + 1 ) C p ( n , m ) β m + 1 β m
where n and m are the row and column indices in the table, respectively.
The measured value of the rotational speed and its incremental form are obtained by filtering, as follows:
ω f = 1 1 + s t f ω g Δ ω ˙ f = 1 t f Δ ω f + 1 t f Δ ω g
where t f represents the filtering time, and s is the complex variable. The pitch control system of the wind turbine and its incremental form can be expressed as [24]
β = K pI + K iI s ω f ω ref Δ β ˙ = K pI Δ ω ˙ f + K iI Δ ω f + K iI ω f 0 ω ref  
where ω ref   is the reference rotational speed, and K pI and K iI are the proportional and integral coefficients of the controller, respectively.
By combining Equations (4), (6) and (7), the following equation is obtained:
Δ ω ˙ g = 1 H g N Δ T s N Δ T e + 1 H g N T s 0 N T e 0 = N T m H t ω g Δ ω g + N T m H t β Δ β + N 2 P g 0 H t ω f 0 2 Δ ω f N 2 H t ω f 0 Δ P g + N T m 0 N T e 0 H t
By combining Equations (13)–(15), the state-space representation, as shown in Equation (16), can be derived. The state-space equations of the wind turbine are utilized to capture its dynamic behavior. At its core, these equations use fluctuations in the turbine’s power as input Δ P g , enabling the analysis of deviations in the generator’s angular velocity Δ ω g , pitch angle Δ β , and rotational speed measurements Δ ω f . This framework forms the mathematical basis for developing effective control strategies for the wind turbine.
x ˙ = A x + B u + E x = Δ ω g Δ β Δ ω f T u = Δ P g A = N T m H t ω g N T m H t β N 2 P g 0 H t ω f 0 2 K pI t f 0 K pI + t f K iI t f 1 t f 0 1 t f B = N 2 H t ω f 0 0 0 T E = N T m 0 N T e 0 H t K iI ω f 0 ω ref 0 T
Based on Equations (4), (6) and (7), the increment of the drivetrain torque can be expressed as follows:
Δ T s = C shaft   x + D shaft   u C shaft   = N 2 H g T m H t ω g N 2 H g T m H t β N P g 0 H w H t ω f 0 2 D shaft   = N H w H t ω f 0
Equation (17) illustrates how the drivetrain torque increment Δ T s is related to both the system state x and external inputs u . This relationship enables the analysis and control of the torque increment in the wind turbine, allowing for the optimization of its performance while minimizing mechanical load. As a key equation in the wind turbine control system, it plays a crucial role in achieving dynamic optimization and maintaining stable operation.
Based on Equation (2), the increment of the thrust can be expressed as follows:
Δ F t = C tower   x C tower = F t ω g F t β 0
The state-space of Equation (16) is discretized using the sampling period t s s :
x ( k + 1 ) = A d x ( k ) + B d u ( k ) + E d A d = e t s s B d = 0 t s s e t s s B d t E d = 0 t s s e t s s E d t
Finally, by combining Equations (17)–(19), the fatigue calculation model for the turbine drivetrain and tower can be obtained as follows:
Δ F t ( k + 1 ) =   C tower B d Δ P g + C tower A d x ( k ) + C tower E d Δ T s ( k + 1 ) = C shaft B d + D shaft Δ P g + C shaft A d x ( k ) + C shaft E d
As shown in Equation (20), the fatigue calculation model for both the drivetrain and tower in two directions establishes the relationship between the critical fatigue quantities, namely the main shaft drivetrain torque Δ T s and the tower thrust Δ F t , and the wind turbine’s active power output Δ P g . In practical implementation, the wind turbine can collect current information such as wind speed, pitch angle, rotational speed, and active power, allowing for the calculation of the corresponding fatigue sensitivity, thereby providing a foundation for optimized control.

3. Optimal Active Power Scheduling Strategy and Solution for Wind Farms

Based on the fatigue load calculation model for wind turbines established in Section 2, readily available data from the SCADA system of the wind farm (Siemens WinCC V7.5) can be used to calculate the fatigue values of the turbine drivetrain and tower in real-time. (A SCADA system serves as an integrated control system designed to oversee and manage the operation of industrial facilities, including wind farms. By gathering real-time data from sensors embedded in the turbines, such as wind speed, power output, and mechanical status, it enables operators to monitor and control the system remotely.) Therefore, the fatigue load information of the drivetrain, obtained through fast calculations, can support the active power scheduling of the wind farm. By optimizing the power distribution, effective suppression of the fatigue load on the drivetrain of turbines within the wind farm can be achieved, thereby enhancing the overall reliability and economic performance of the system.

3.1. Objective Function

The optimization algorithm proposed in this paper is designed to effectively reduce the fatigue load experienced by the turbine drivetrain while operating in active control modes (such as power limitation, participation in system peak shaving, and frequency regulation). The algorithm aims to minimize the total fatigue load of the wind farm during each frequency regulation process, while considering the fatigue load differences between turbines. The specific formulation is as follows:
min Δ P i , ref i = 1 I k 1 Δ M t , i + k 2 Δ T t , i + σ M , i ( 0 ) + σ T , i ( 0 ) σ M ¯ σ T ¯ Δ M t , i = H t Δ F t , i
where Δ M t , i is the tower bending moment; Δ P i , ref is the power adjustment of turbine i; k 1 and k 2 are the positive weight factors for the fatigue loads in the tower and drivetrain directions, respectively; σ M , i ( 0 ) and σ T , i ( 0 ) are the standard deviations of the torque in the tower and drivetrain directions; and σ M ¯ and σ T ¯ are the average standard deviations of the torque in the tower and drivetrain directions across the turbines in the wind farm.

3.2. Constraints

The constraints considered in this study primarily include the wind farm’s frequency regulation with power demand constraint and the power limits for the wind turbines. Equation (22) stipulates that the sum of the power adjustments for all turbines must equal the total frequency regulation power demand issued by the dispatch center. Equation (23) ensures that, after making power adjustments, the output power of each turbine remains within its respective operational upper and lower limits.
i = 1 I Δ P i , ref = Δ P farm  
P _ i P i , ref = Δ P i , ref + P i ( 0 ) P ¯ i
where P i ( 0 ) is the initial power of the turbine, and P ¯ i and P _ i represent the maximum and minimum power values of the turbine, respectively.

3.3. Firefly Algorithm

3.3.1. Standard Firefly Algorithm

Considering the randomness of wind speed and the complexity of the operating states of individual wind turbines, the Firefly Algorithm (FA) adjusts its position iteratively through an attraction mechanism to reach the global optimum. When applied to the optimization scheduling problem of wind farms, it not only helps avoid the errors generated when using deterministic algorithms that convert nonlinear problems into linear ones, but also provides a more accurate and efficient solution.
The Firefly Algorithm utilizes brighter fireflies to attract dimmer fireflies, continually updating their positions to find the optimal location. The adjustable parameters mainly include light absorption intensity , maximum attraction strength 0 , and the number of random components . The position t FA + 1 of the p-th firefly in the t FA + 1 -th iteration of the algorithm is expressed as
Z p ( t FA + 1 ) = Z p ( t FA ) + Z q ( t FA ) Z p ( t FA ) + p p = rand ( 0 , 1 ) 1 2
where represents the attraction between the p-th and q-th fireflies, and p is the random disturbance. can be expressed as
= 0 exp r p q 2
where r p q represents the Cartesian distance between fireflies p and q, which is expressed as
r p q ( t FA ) = Z p Z q = i = 1 I Z p i Z q i 2
where i represents the turbine index.

3.3.2. Improved Firefly Algorithm

Compared to other algorithms, the Firefly Algorithm (FA) offers higher optimization accuracy and convergence speed, and the algorithm itself has relatively few adjustable parameters, making it highly generalized [22]. However, the algorithm also has drawbacks, such as premature convergence, susceptibility to local optima, and a high dependency on initial values. Therefore, this study adopts the improved Firefly Algorithm (IFA) to more effectively address these issues.
  • Population Initialization
In the initial stage of the FA algorithm, the population is generated randomly. The quality of the initial population significantly affects the convergence speed and the ability of the algorithm to find the optimal solution. Since the initial values generated by traditional pseudo-random number generators are difficult to control in terms of quality, this study adopts a chaotic mapping method to enhance the uniformity of the initial population distribution. Specifically, the initial population is generated using the Logistic map, and the improved population is denoted as Z p + 1 ( 0 ) , with the following expression:
Z p + 1 ( 0 ) = Z p ( 0 ) 1 Z p ( 0 )
where represents the mapping parameter. For the Firefly Algorithm, the population size is ϖ , with the position of the first firefly generated randomly. Subsequently, the position of the ϖ 1 -th firefly is generated based on the Logistic map.
2.
Adaptive Weight Optimization Based on the Fitness Function
In the standard Firefly Algorithm, the position update is solely based on the brighter fireflies, lacking effective guidance from the target features, which limits the algorithm’s accuracy improvement. To overcome this issue, this paper introduces an adaptive weight mechanism based on the fitness function, improving the position update strategy as follows:
Z p ( t FA + 1 ) = ϑ ( t FA ) Z p ( t FA ) + Z q ( t FA ) Z p ( t FA ) + p ϑ ( t FA ) = e θ ( t ) θ ( t 1 ) , t FA = 1 , 2 , , T FA θ ( t ) = 1 ϖ p = 1 ϖ F Z p ( t FA ) F Z best   ( t FA ) 2
where ϑ ( t FA ) represents the adaptive weight, θ ( t ) is the smoothing factor for the weight, and Z best   is the optimal position of the firefly.
3.
Chaos Optimization
In the standard Firefly Algorithm, the random coefficient in the position update formula and the light absorption intensity are typically fixed values. The parameters are improved using the Logistic map from chaos theory, as follows:
( t FA + 1 ) = ( t FA ) ( 1 ( t FA ) )
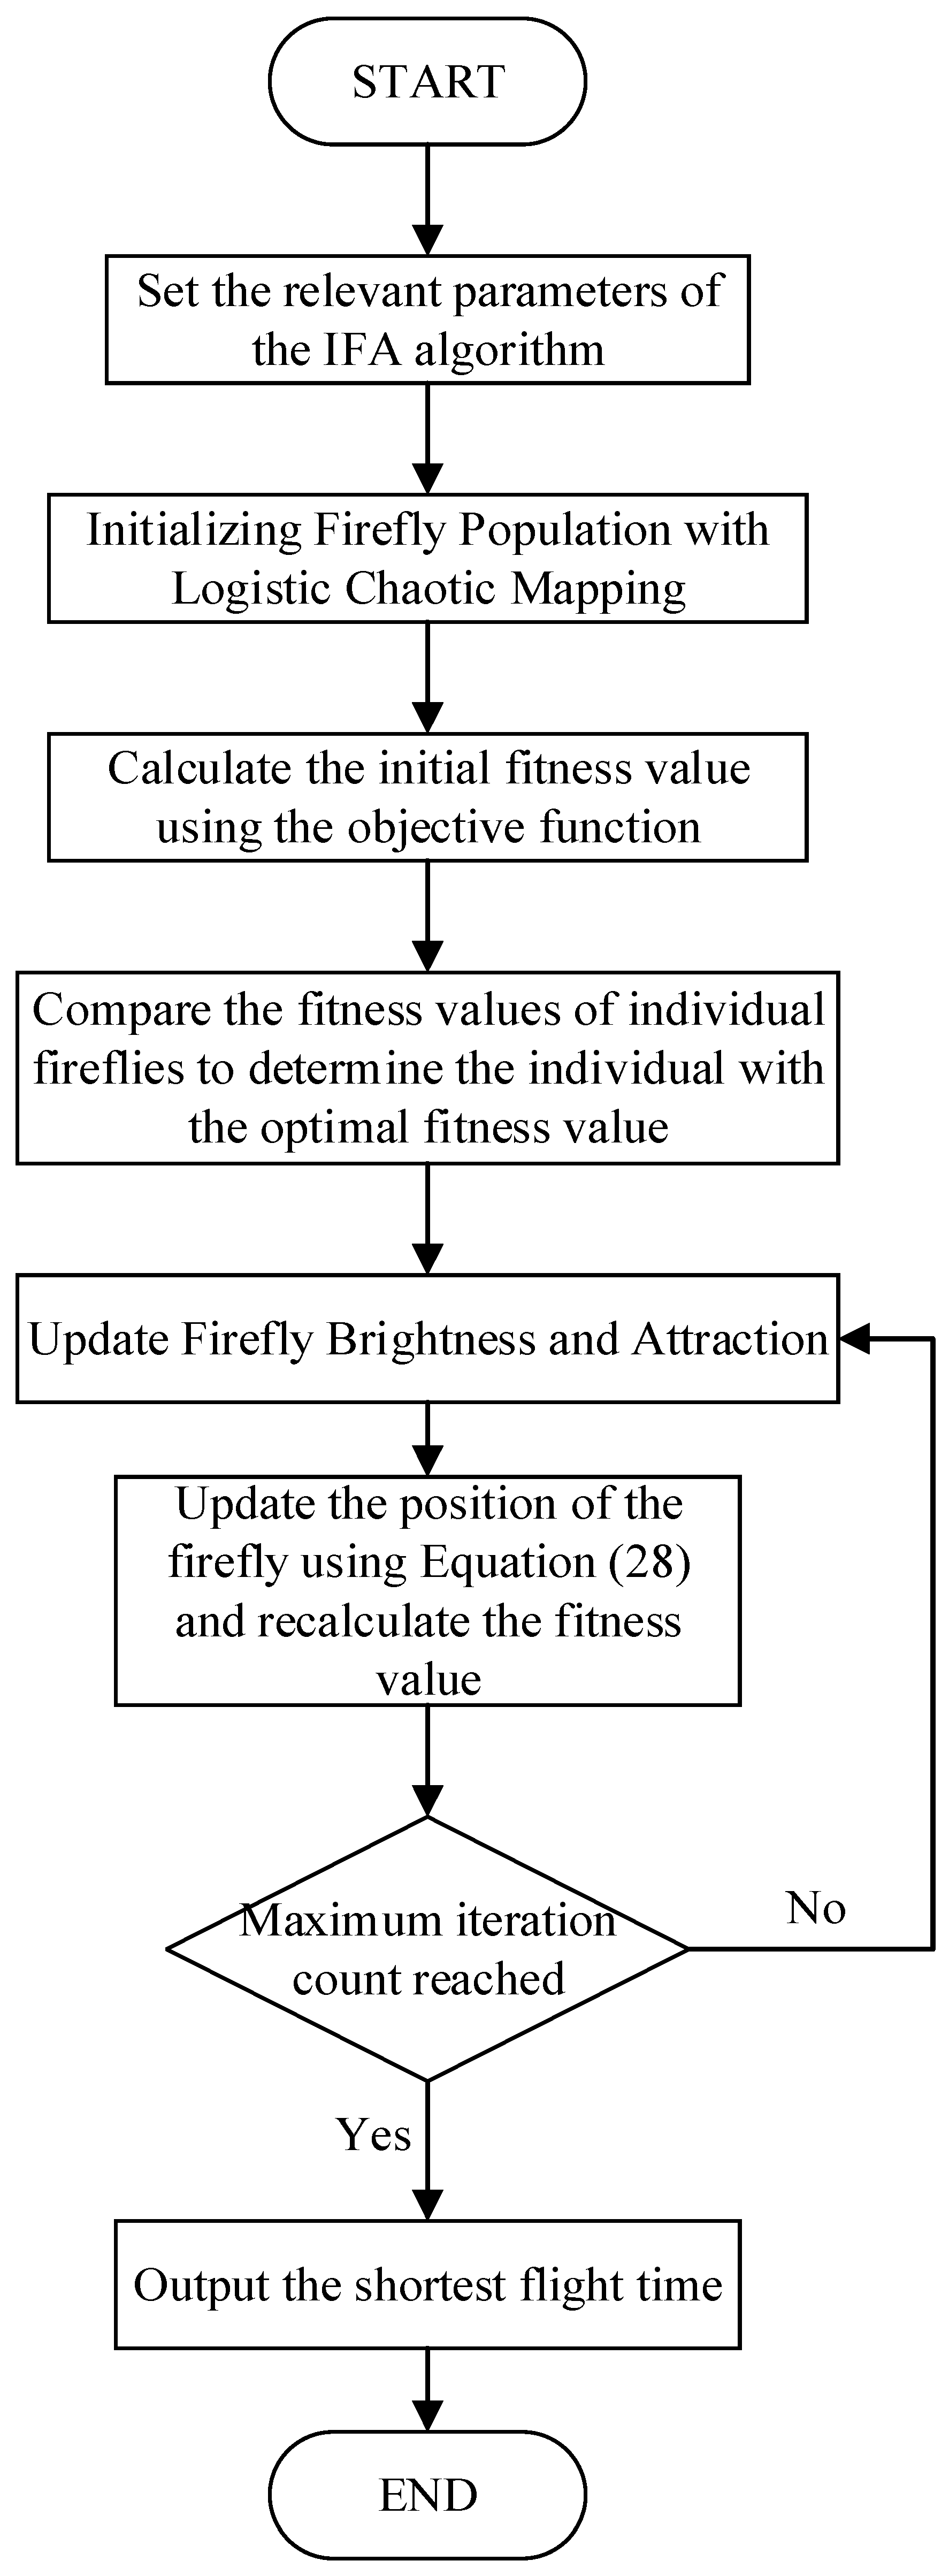
After applying chaos optimization to the random coefficient and light absorption intensity in the algorithm, the likelihood of the computed results approaching the optimal solution increases, thus preventing the fireflies from getting trapped in local optima due to randomness. The algorithm flowchart and pseudocode of IFA algorithm are shown in Figure 2 and Algorithm 1, respectively.
Algorithm 1: Improved Firefly Algorithm
Define the firefly brightness LD p based on the adaptive fitness function and generate the initial firefly population (p = 1, 2, … ϖ )
Calculate the fitness value of all individuals and select the current best solution.
Repeat
for p = 1: ϖ
 for q = 1: ϖ
  if ( LD p > LD q )
   Update the firefly’s position based on Equation (28).
  end if
 end for q
end for p
 Sort the fireflies by their brightness and find the best firefly position.
Until t FA t ¯ FA , output of the optimal result.

3.4. Execution Process of the Optimized Scheduling Strategy

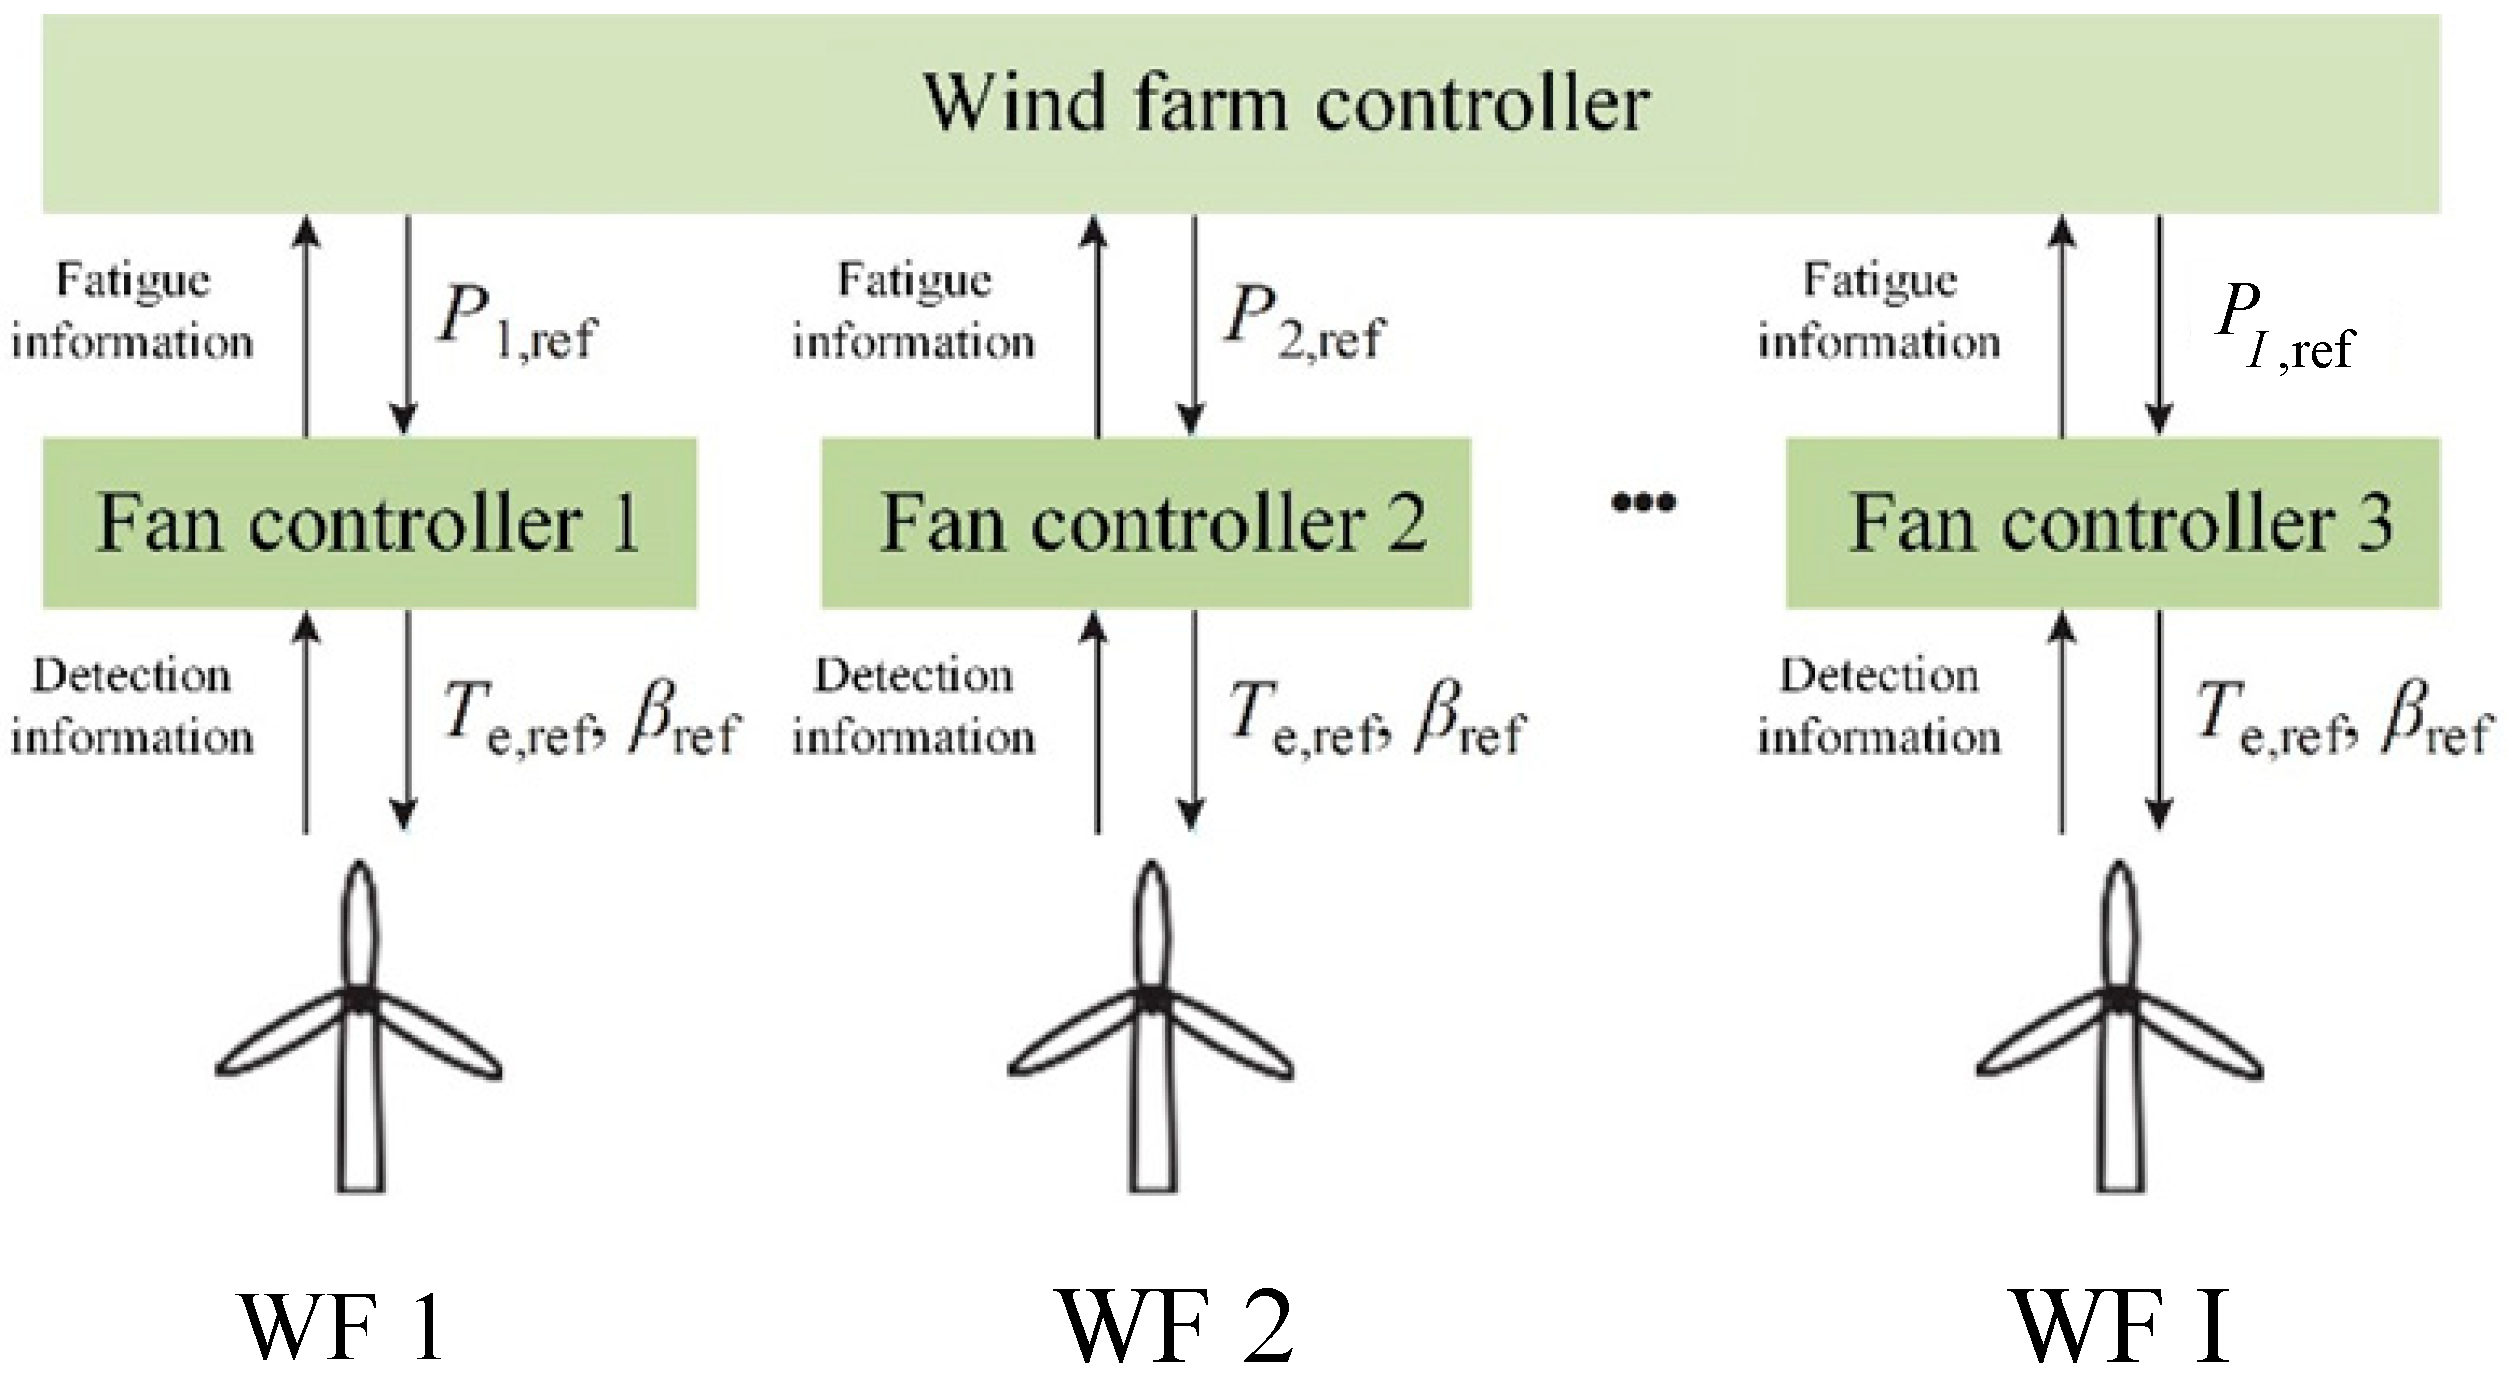
Currently, most wind farms adopt a scheduling strategy based on the active power upper limit ratio. The core principle of this strategy is to allocate scheduling commands based on the active power upper limit ratio of each wind turbine, with turbines having higher upper limits taking on more scheduling tasks [7]. However, this single-metric-based strategy does not consider critical factors such as the differences in fatigue load between turbines, the distribution of fatigue levels, and wake effects, resulting in upwind turbines more frequently adjusting their output compared to downwind turbines. Over long-term operation, this leads to an exacerbation of fatigue differences between turbines. To address these issues, the scheduling strategy proposed in this paper incorporates fatigue loads of the turbines in addition to meeting the dispatch center’s instructions, and allocates active power accordingly. The process is illustrated in Figure 3, and the specific steps are described as follows.
  • The dispatch center issues the total active power adjustment command Δ P farm   required for frequency regulation by the wind farm, and the initial active power P i ( 0 ) for each turbine is obtained through a simulation model.
  • The initial firefly population is generated using the improved Firefly Algorithm, representing the initial power adjustments for each wind turbine. Data collected from the wind turbine controllers, including pitch angle, rotational speed, wind speed, and current active power, are used to calculate the fatigue load sensitivity for each turbine using Equation (20).
  • Based on the fatigue load information for each turbine, the fitness value for all individuals is calculated, and the individual corresponding to the current best solution is selected. The algorithm then checks whether the convergence condition is met. If the algorithm has converged, the optimal power adjustment values for each turbine are output; otherwise, the iteration continues for further optimization.
In Figure 3, the fan controllers receive inputs from the central wind farm controller, which manages overall optimization and scheduling. Based on these inputs, the fan controllers adjust the settings of each turbine to optimize performance while minimizing fatigue and other operational stresses.

4. Case Study

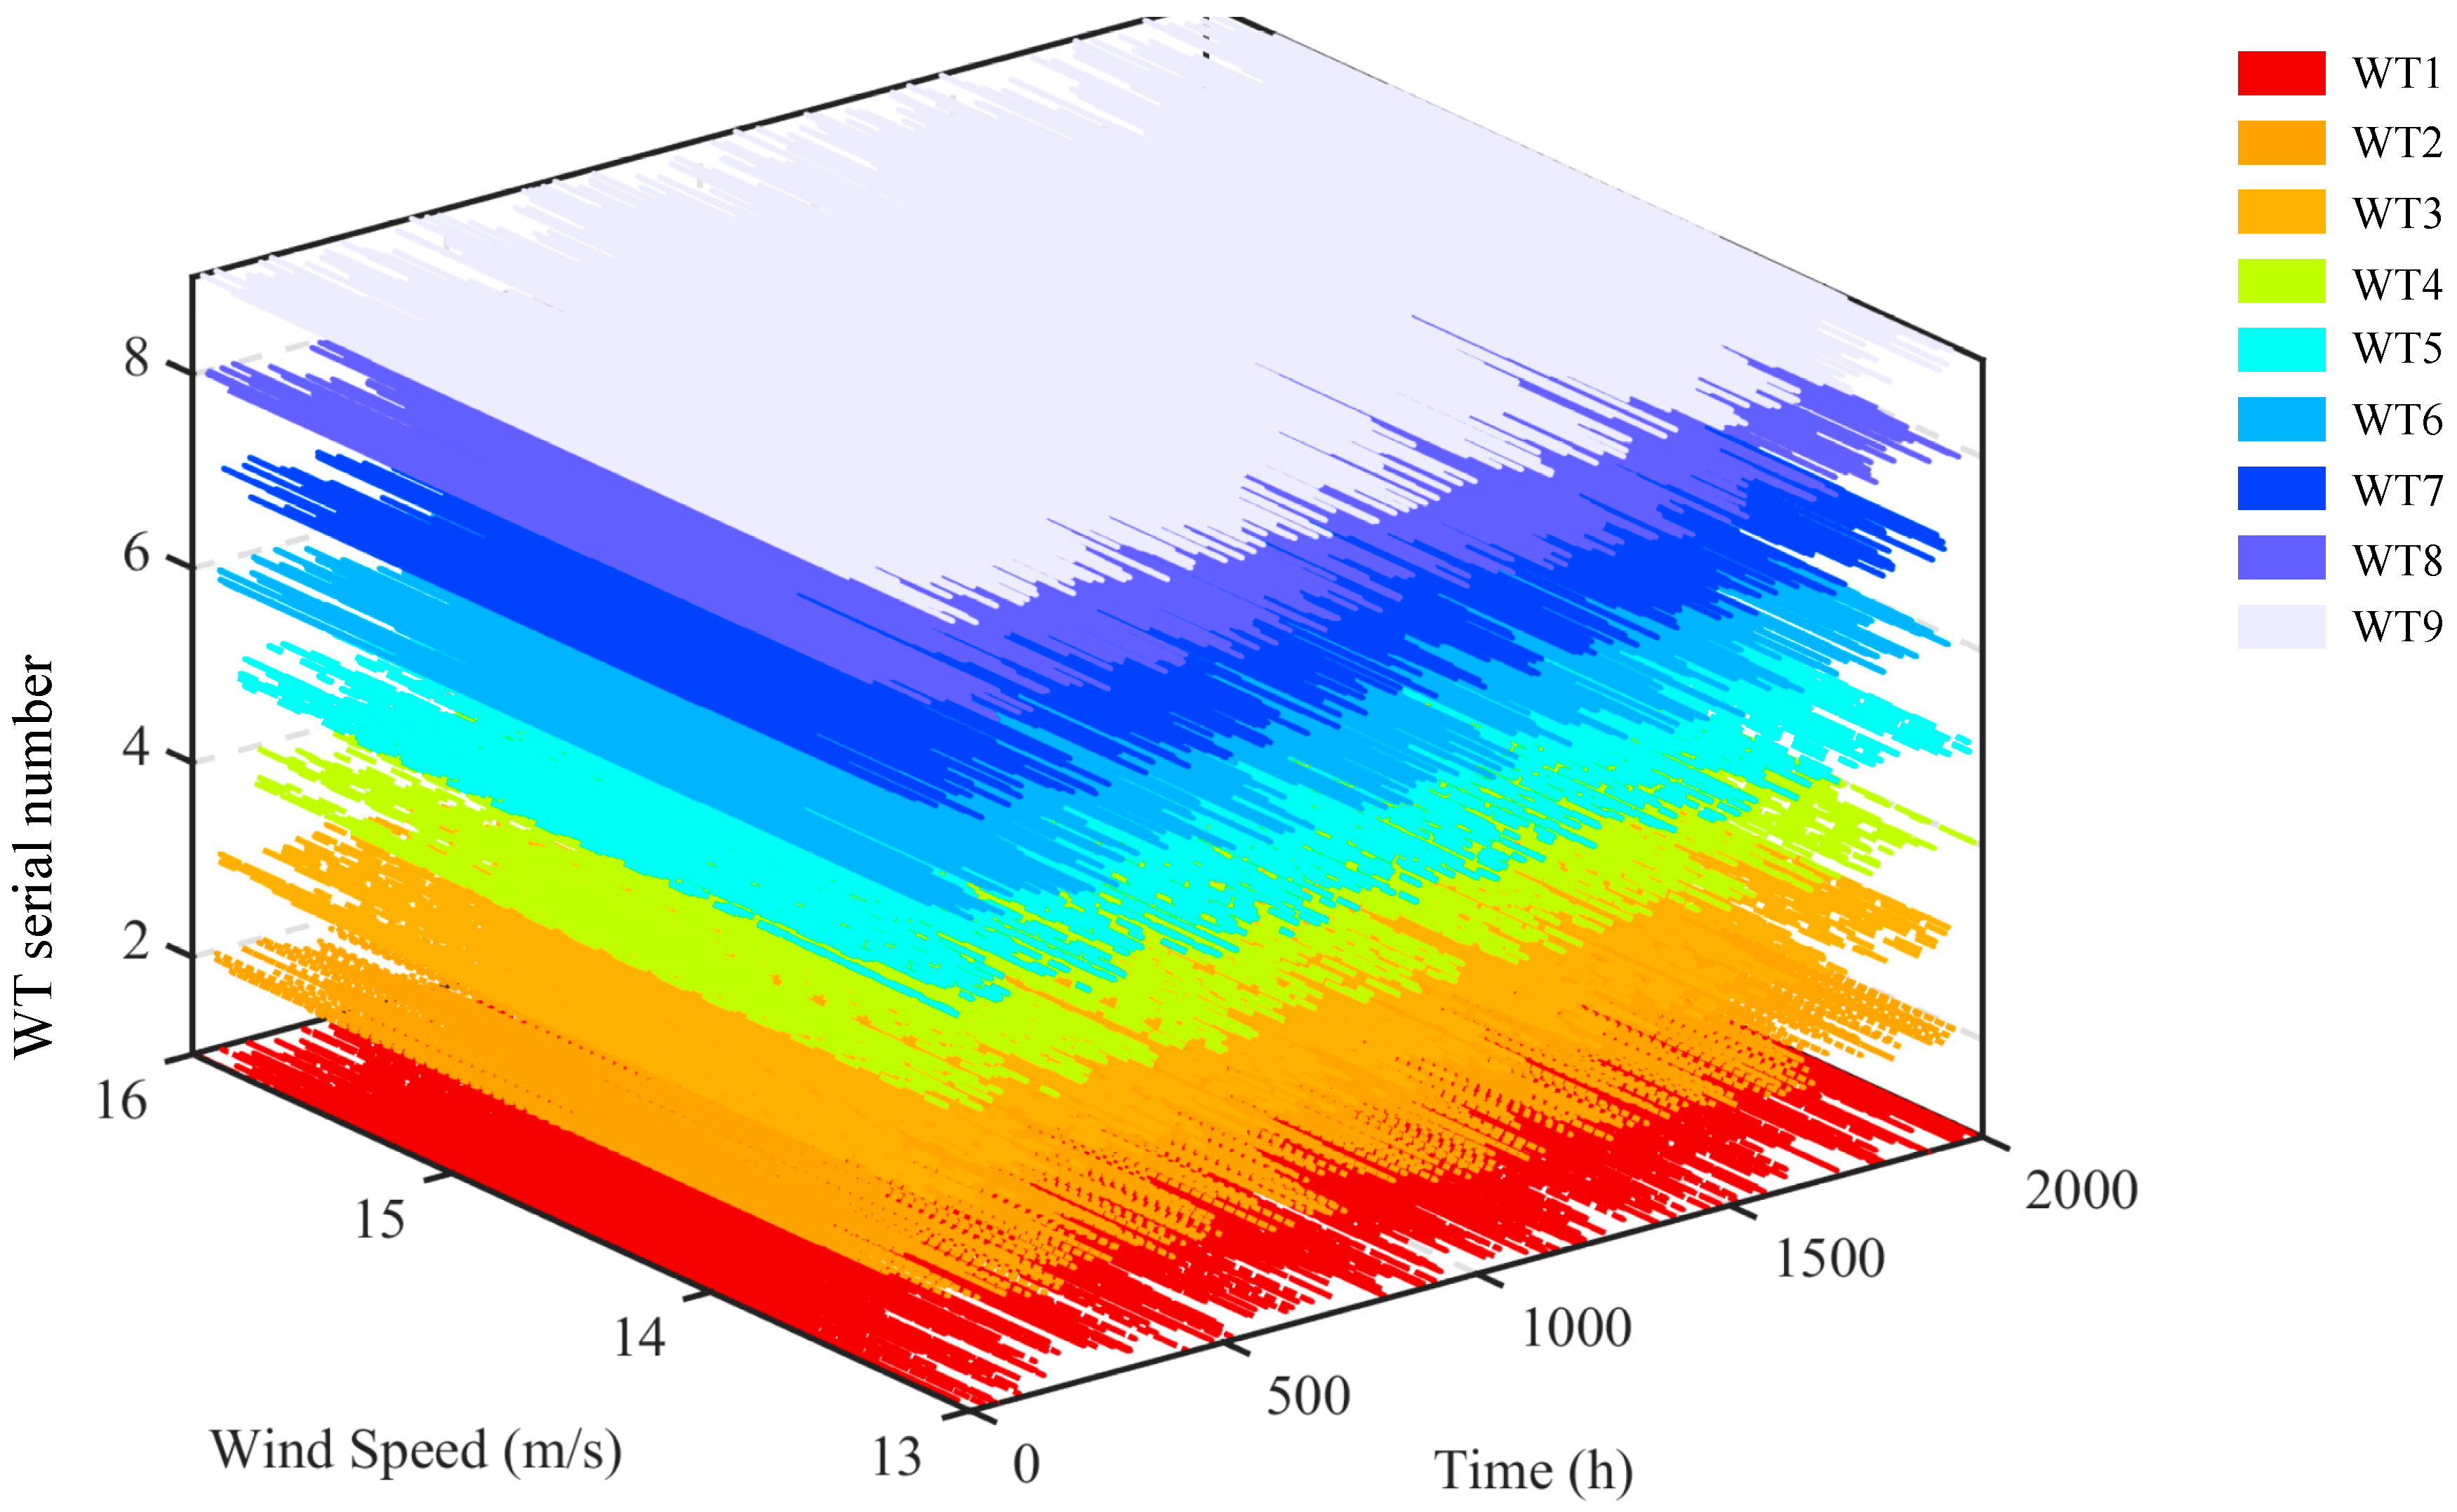
A dynamic wind farm model that accounts for the wake effects and turbulence influences in the wind farm is constructed using the SimWindFarm 3.0 toolbox. The simulation analysis is conducted using nine NREL 5 MW turbines [25]. The turbines are arranged in a 3 × 3 grid, with a turbine spacing of 300 m. The turbine parameters and experimental conditions are detailed in Table 1, and the layout of the wind farm is shown in Figure 4. The simulated wind speed distribution is presented in Figure 5. Additionally, the control period for the wind farm’s frequency response strategy is set to 1 s, with a total simulation duration of 2000 s. The initial parameters are set as follows: light absorption intensity = 1 , maximum number of iterations t ¯ FA = 500 , initial population size ϖ = 30 , and the initial attraction value 0 = 0.8 .

4.1. Iterative Process Analysis

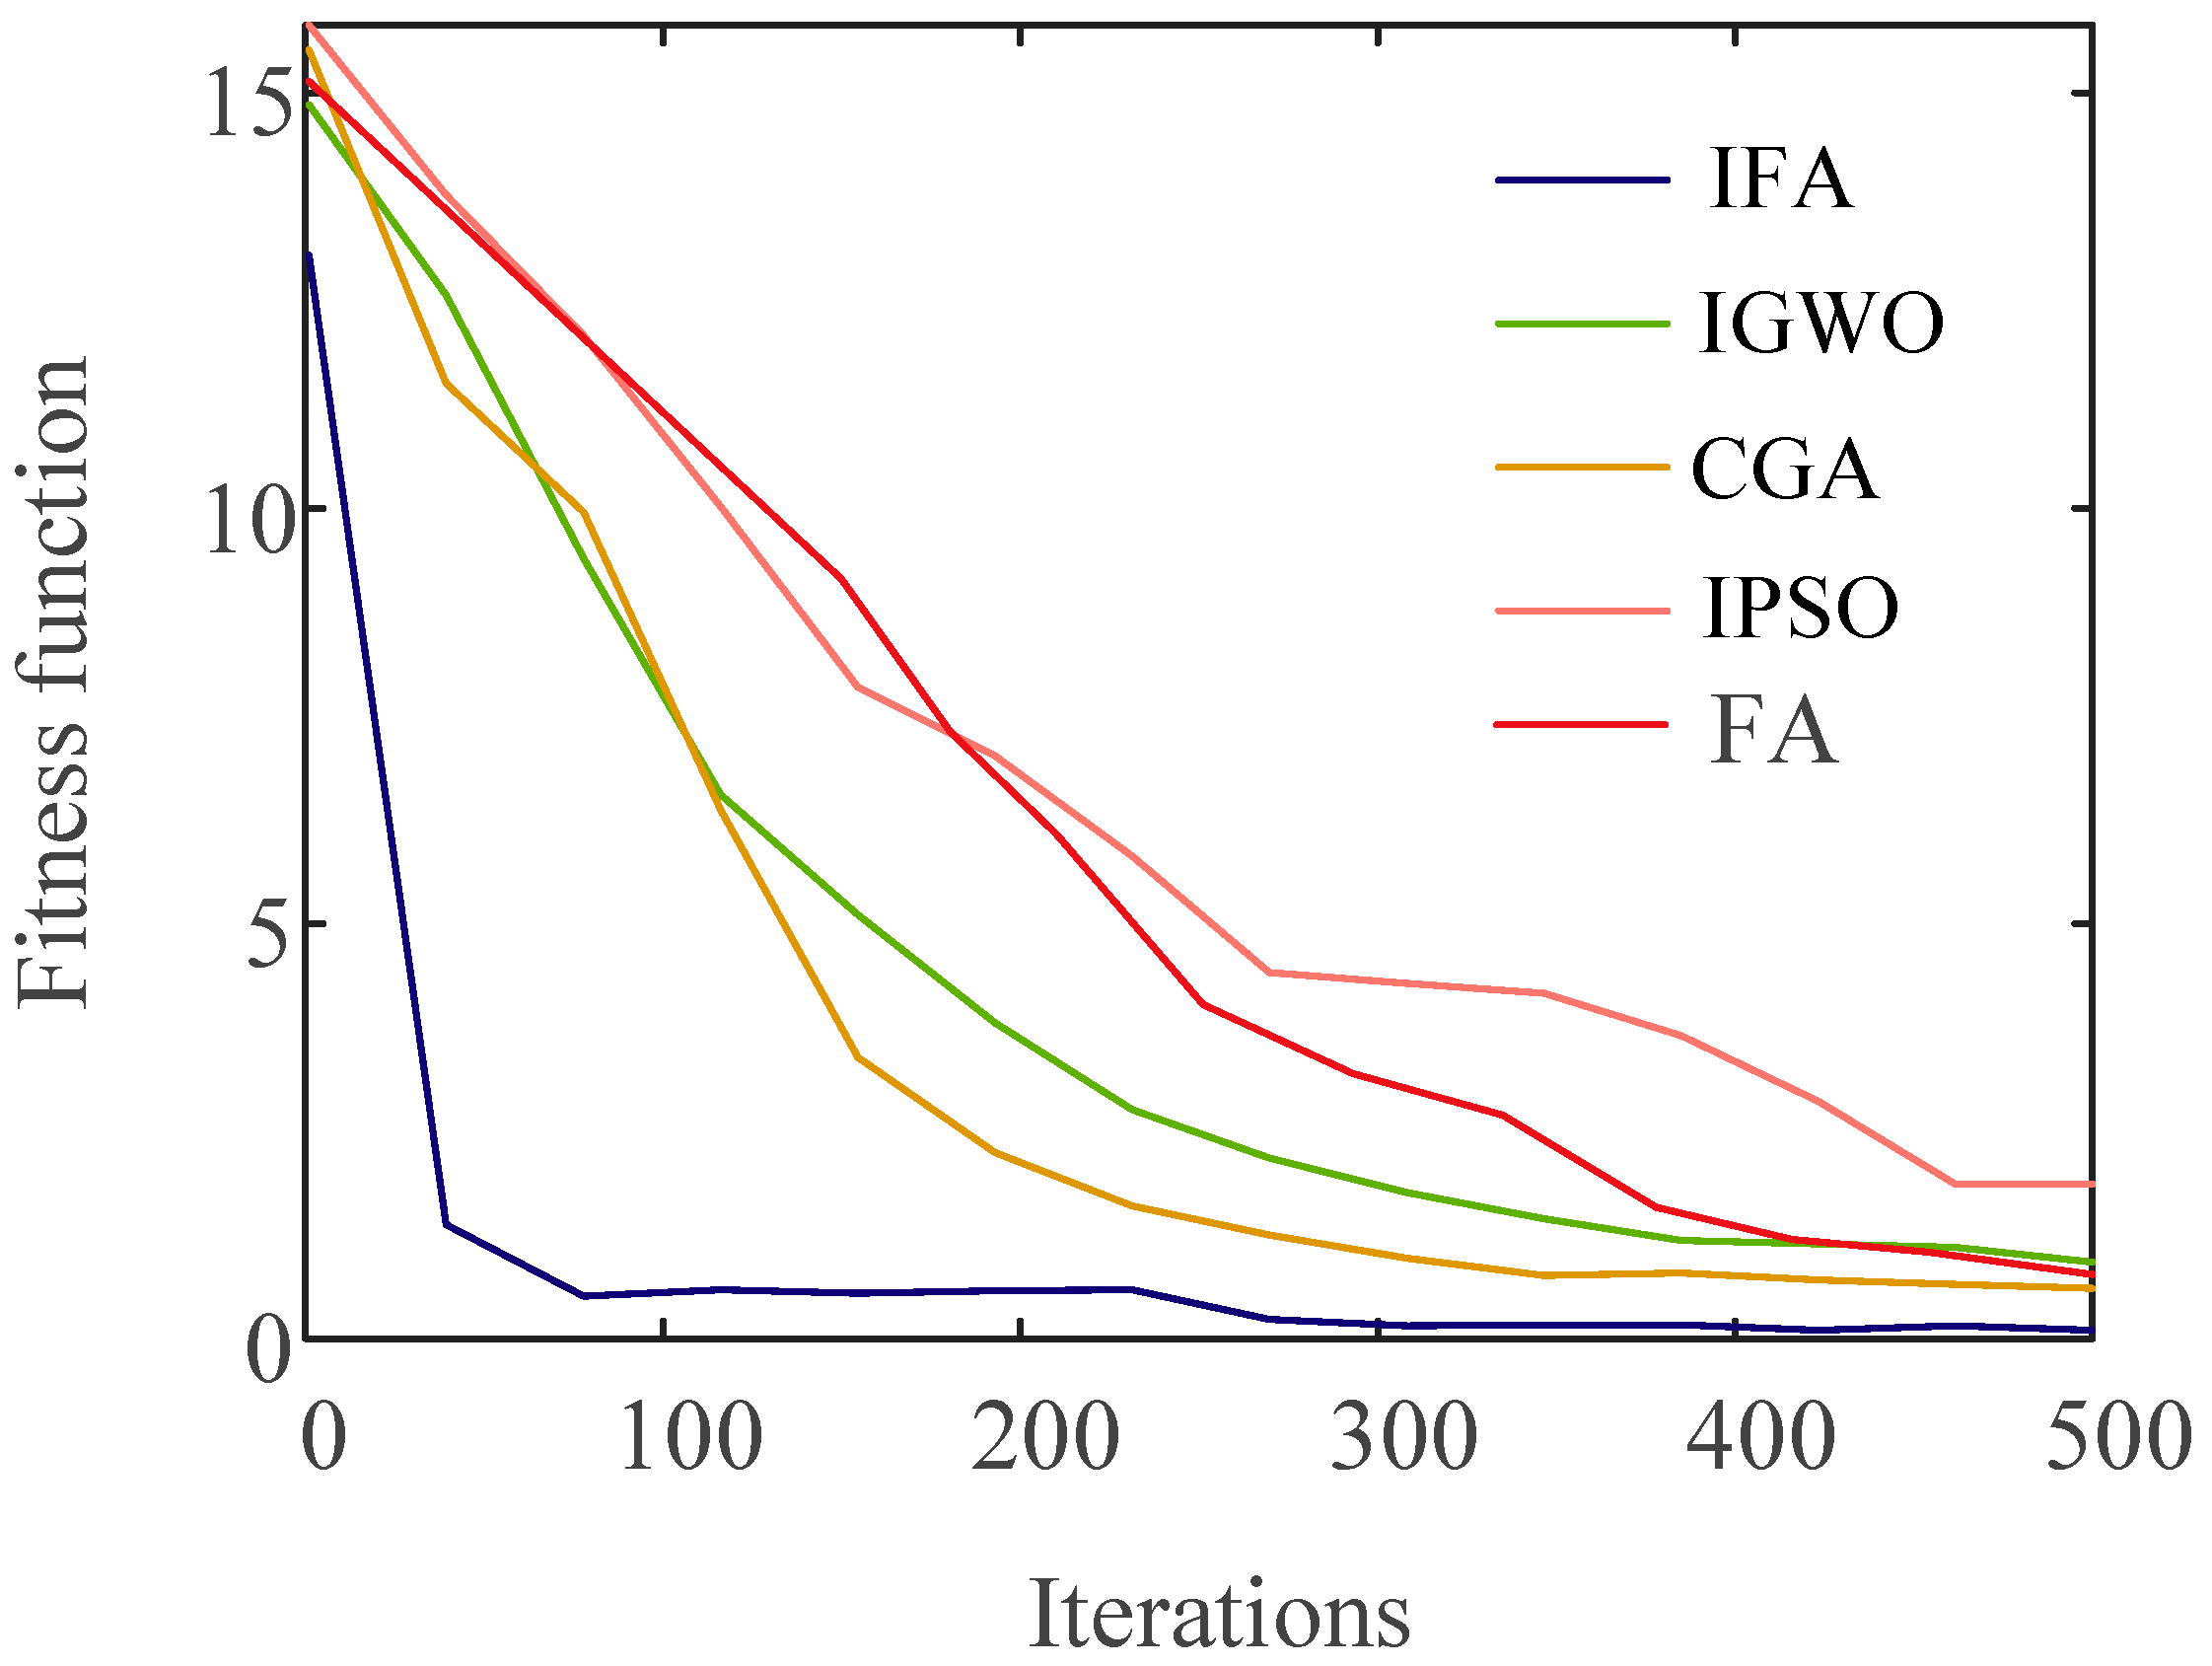
In the proposed optimal active power allocation method for wind farms considering turbine fatigue load, the objective fitness function is solved using the improved Firefly Algorithm (IFA). The computation times and average values for 10 iterations are summarized in Table 2. For comparison, we evaluated the proposed IFA algorithm against the original FA algorithm [26], the enhanced Grey Wolf Optimizer (IGWO) [27], the Continuous Genetic Algorithm (CGA) [28], and the improved Particle Swarm Optimization algorithm (IPSO) [29]. The average fitness function values are depicted in Figure 6.
As shown in Figure 6 and Table 2, the IFA method consistently achieves lower fitness values in fewer iterations compared to the FA algorithm. For instance, the average computation time for IFA is just 133.14 s across 10 simulations, which is significantly faster than the FA algorithm’s average of 255.13 s—a 91.63% decrease in time. This demonstrates that IFA not only converges more quickly but also does so more effectively. When compared to other intelligent optimization algorithms addressing the same problem, IFA clearly outshines the competition with its superior convergence rate. The IGWO, CGA, and IPSO algorithms take considerably longer, with their average computation times of 291.52, 265.72, and 354.77 s, respectively, reflecting increases of 118.96%, 99.58%, and 166.46% compared to IFA. In contrast, IFA reaches the optimal solution in the shortest time, highlighting its exceptional efficiency and accuracy. This analysis confirms that the IFA method not only accelerates the convergence of the original FA algorithm but also lowers the fitness function value more rapidly. Compared to the other baseline algorithms, IFA’s faster convergence and lower fitness values stand out, emphasizing its strong global optimization capabilities. The percentage differences further underline IFA’s performance edge over the others.

4.2. Comparative Analysis of Wind Farm Optimization Results

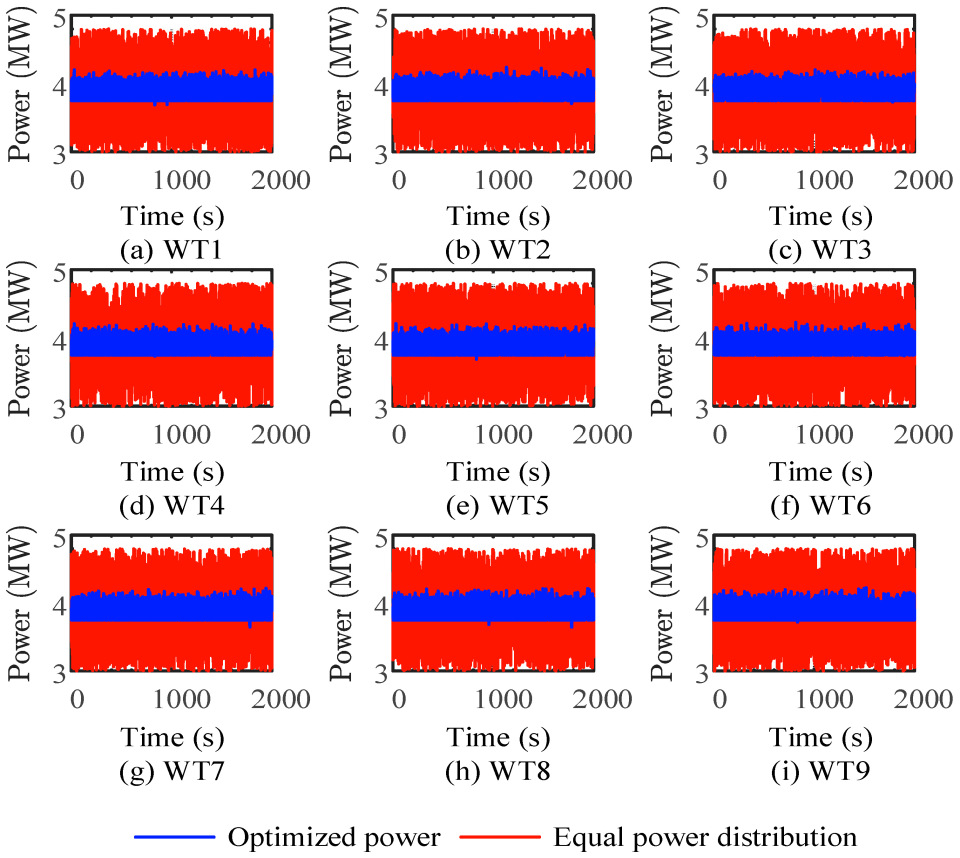
Currently, wind farms widely adopt the active power proportional distribution algorithm for power allocation. This algorithm only considers the impact of wind speed on the wind turbines. As a result, under conditions of significant wind speed fluctuations, the output power of the wind turbines tends to exhibit substantial variations. In contrast, the optimized scheduling strategy proposed in this paper not only accounts for the influence of wind speed but also introduces the turbine’s fatigue level, effectively reducing the fluctuations in power output. In this study, the proportional distribution strategy is considered as the traditional strategy, and a comparative analysis is conducted between the two strategies. The comparison of power allocation results is shown in Figure 7, with the corresponding standard deviations presented in Table 3.
Through the analysis of Figure 7 and Table 3, it can be observed that the optimized scheduling strategy proposed in this paper shows significant advantages in the power output of the wind farm. The optimized power (blue curve), compared to the proportional distribution power (red curve), exhibits lower volatility and higher stability, particularly in terms of the standard deviation of the wind turbines’ power output. According to the data in Table 3, the standard deviation of the power output of all wind turbines has been significantly reduced. For instance, the standard deviation of Turbine 1 decreased from 0.5173 MW to 0.1192 MW, a reduction of approximately 76.96%; Turbine 2’s standard deviation decreased from 0.5209 MW to 0.1204 MW, a reduction of about 76.88%; Turbine 9’s standard deviation decreased from 0.5186 MW to 0.1262 MW, a reduction of approximately 75.67%. These data indicate that the optimized scheduling strategy not only effectively mitigates the impact of wake effects on the wind farm but also significantly enhances the power output stability of each turbine, reducing power fluctuations. As a result, this reduces the burden on wind power grid integration and improves the overall operational efficiency of the wind farm.
Furthermore, we analyzed the fatigue load of the turbines under different strategies. The equivalent fatigue load of the turbines in the wind farm was calculated over the simulation period and analyzed using the Rainflow Counting method. The results are presented in Table 4 and Table 5, corresponding to the fatigue loads in the drivetrain and tower, respectively.
Based on the results presented in Table 4 and Table 5, the proposed optimized scheduling strategy significantly reduces the fatigue load on wind turbines compared to the proportional distribution strategy, demonstrating optimization effects in several aspects. Specifically, the drivetrain fatigue load decreases across all turbines, especially for Turbines 1, 2, and 9, which recorded reductions of approximately 39.12% (from 0.5389 to 0.3281), 32.47% (from 0.4454 to 0.3008), and 43.58% (from 0.6154 to 0.3472), respectively. These changes indicate that the proposed strategy effectively reduces the loads during turbine operation, leading to a more balanced fatigue distribution among the turbines.
Meanwhile, the improvement in tower fatigue load is particularly significant, with a noticeable decrease in the fatigue load for all turbines. Turbine 6 shows the largest reduction, dropping by 45.13% (from 9.4076 to 5.1623). Specifically, for Turbines 1, 2, and 6, the fatigue loads decreased by 37.62% (from 10.3878 to 6.4797), 43.14% (from 10.0648 to 5.7231), and 45.13% (from 9.4076 to 5.1623), respectively. This result suggests that the optimization strategy successfully alleviated the fatigue issues caused by uneven load distribution, effectively reducing the fatigue on the turbine tower components, thereby improving the overall stability of the wind farm.
Moreover, the implementation of the optimized scheduling strategy not only significantly reduced fatigue loads but also further improved the operational efficiency of the wind turbines and reduced the frequency of equipment failures. By balancing the load distribution, the optimization strategy not only extends the lifespan of the turbines but also effectively reduces the costs associated with frequent maintenance. Therefore, the proposed optimization strategy has significant practical value in enhancing the performance of wind farms, reducing fatigue risks, and improving the long-term stability of the wind farm.

4.3. Sensitivity Analysis

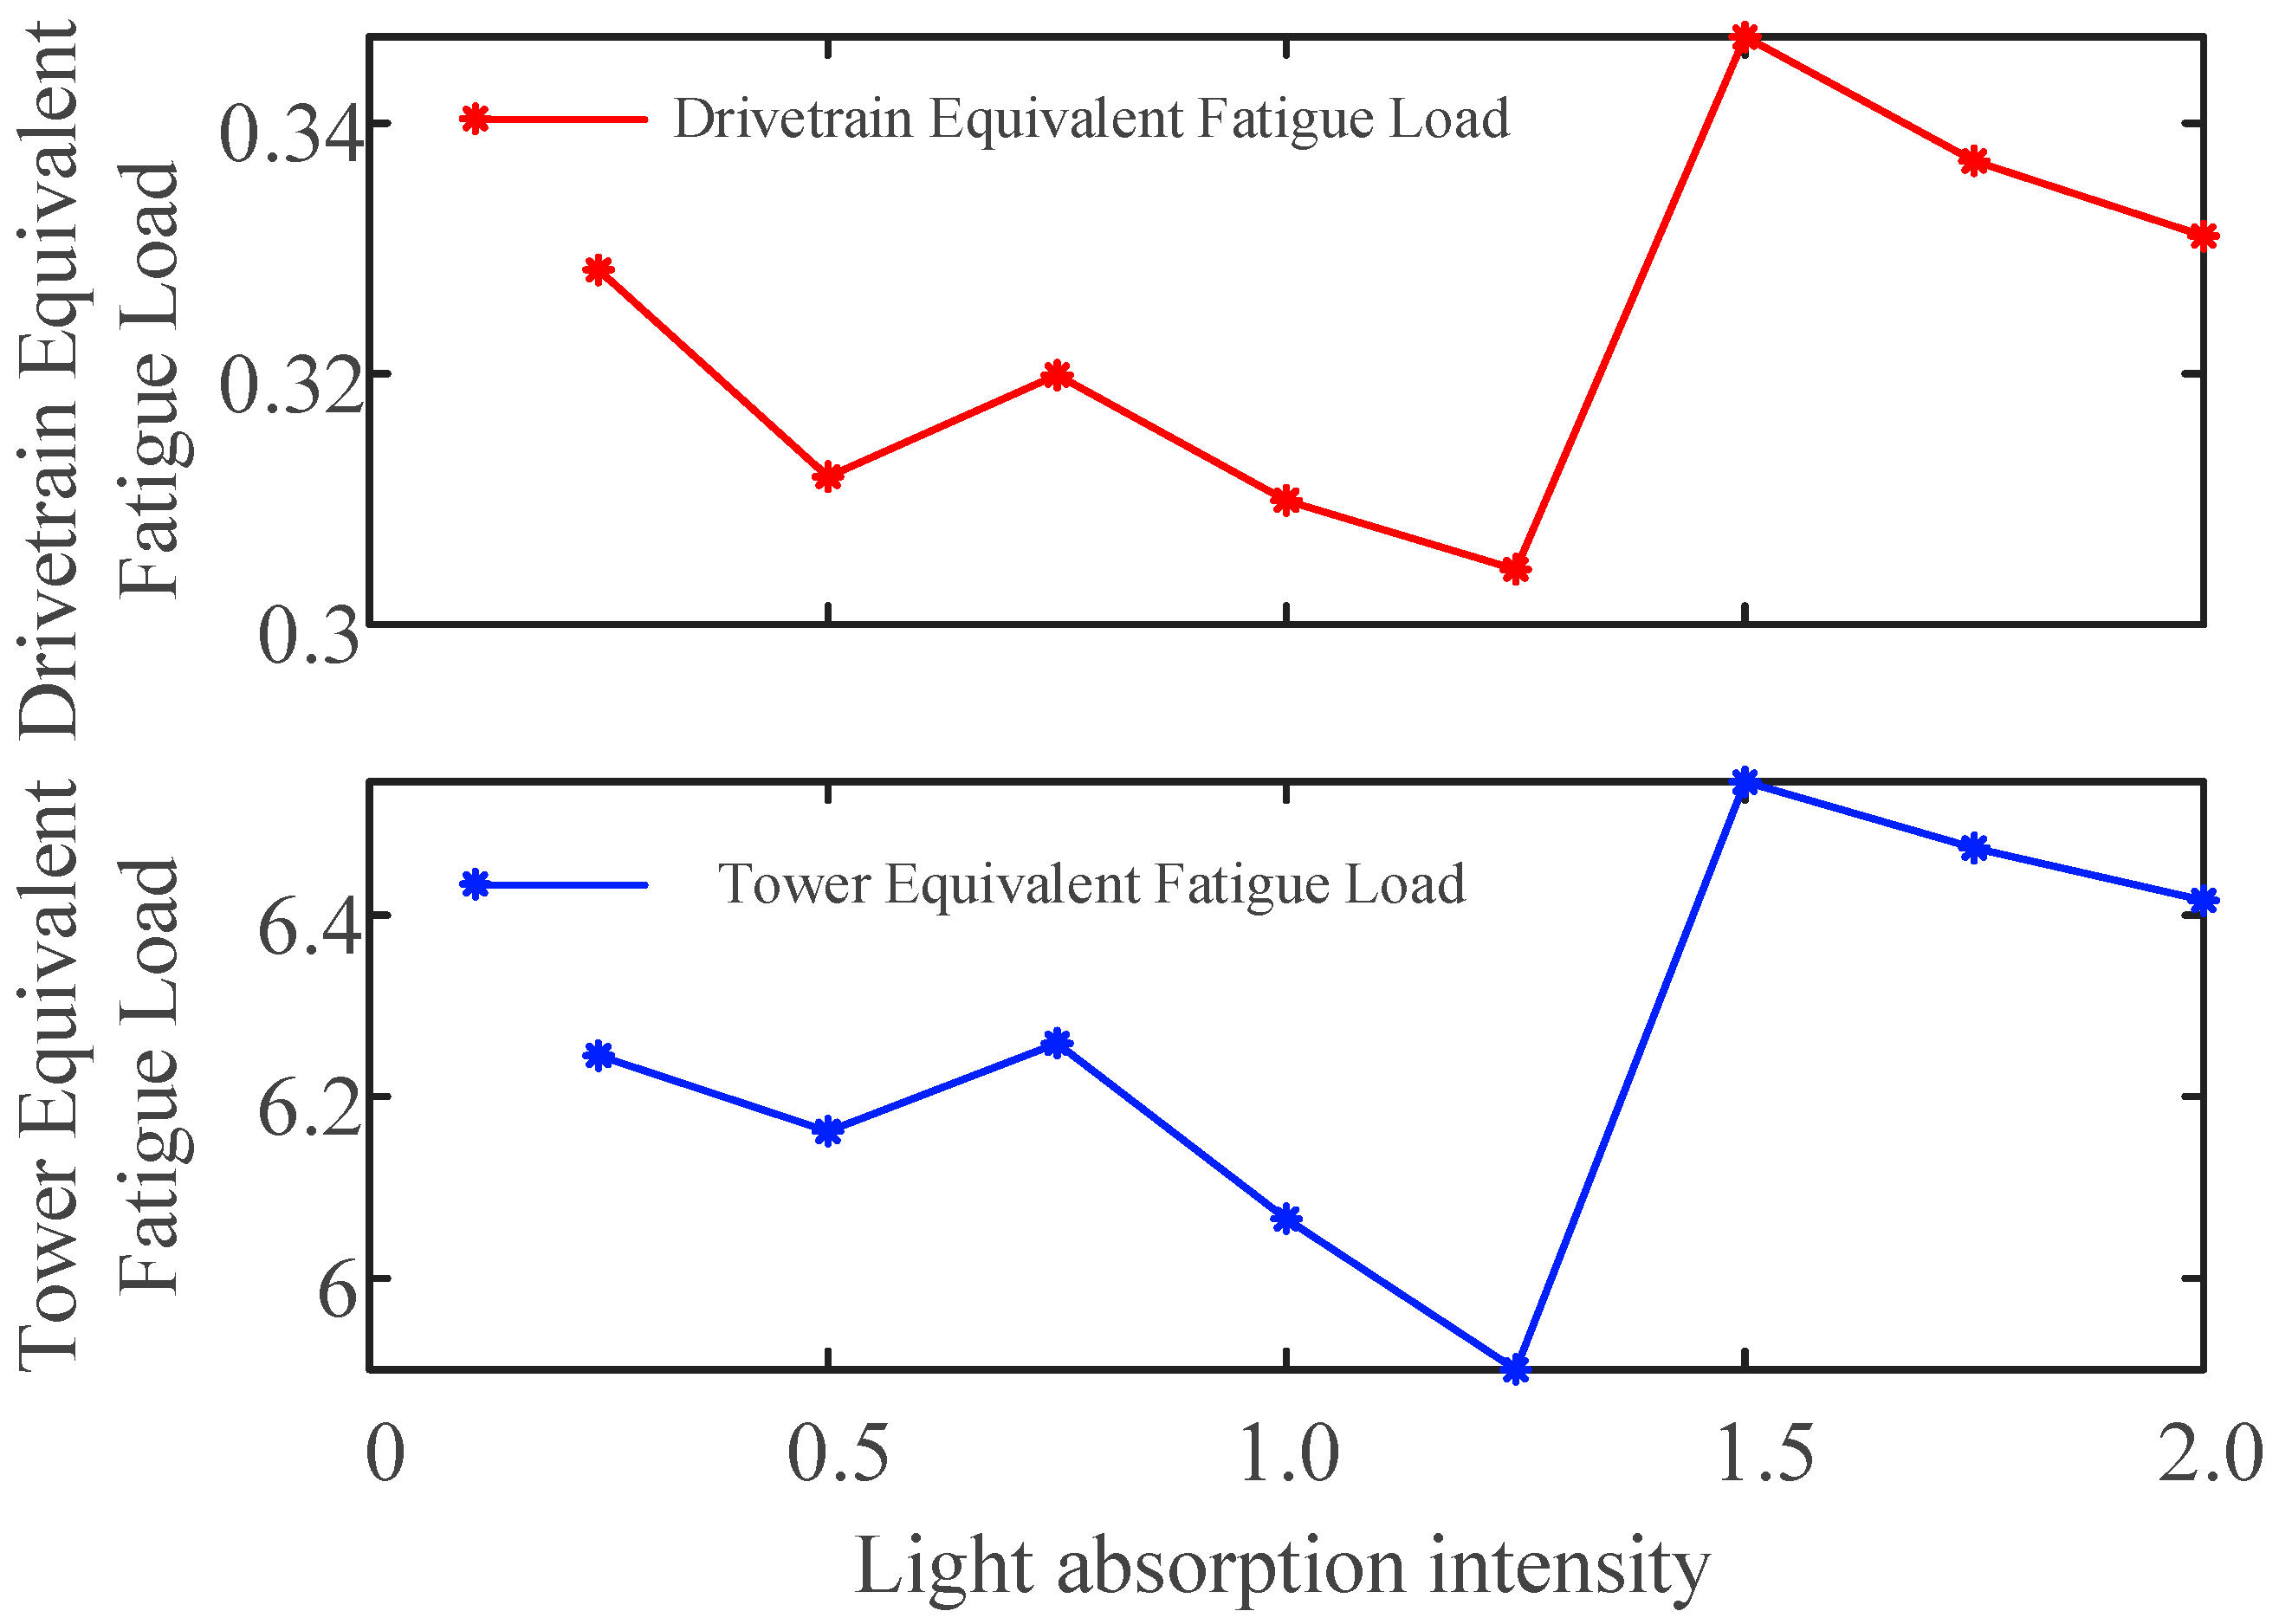
The light absorption intensity is a key factor in the FIA, as it largely determines the attraction distance within the algorithm. If this parameter is too high, it can cause instability and prevent the algorithm from converging properly. On the other hand, setting it too low may reduce the algorithm’s overall efficiency. In order to efficiently tackle the wind farm power optimization scheduling problem, a series of light absorption intensity values were tested. Ten independent simulations were run on the optimization model to identify the optimal setting. Figure 8 shows the average Drivetrain Equivalent Fatigue Load and Tower Equivalent Fatigue Load for nine wind farms, with varying light absorption intensity values. As seen in the figure, both the Drivetrain Equivalent Fatigue Load and Tower Equivalent Fatigue Load tend to increase as the light absorption intensity rises. The lowest losses occur when the light absorption intensity is set to 1.0, which is therefore chosen as the optimal parameter.

5. Discussion

The results of this study are of significant importance for the management and optimization of wind farms. By combining dynamic fatigue load analysis with advanced optimization techniques, the proposed method offers a scalable and practical solution to tackle real-world energy challenges. The findings reveal that this approach effectively reduces the fatigue load on wind turbines, addressing the issue of premature wear caused by uneven fatigue load distribution. For example, the drivetrain fatigue load of WT 1 decreased from 0.5389 MN·m to 0.3281 MN·m, a reduction of approximately 39.1%, while the tower fatigue load dropped from 10.3878 MN·m to 6.4797 MN·m. Similar improvements were observed in other WTs, with fatigue load reductions ranging from 32.5% to 45.4%, highlighting the method’s efficacy in optimizing turbine performance. The proposed method utilizes an enhanced Firefly Algorithm (IFA) to optimize fatigue load distribution across turbines, leading to significant improvements in both turbine stability and mechanical lifespan. As illustrated in the case studies shown in Figure 6 and Figure 8, the IFA algorithm demonstrates exceptional convergence performance, with changes in algorithm parameters having a notable effect on turbine fatigue load. These results underscore the method’s potential in practical applications, offering an effective solution to long-standing challenges in wind farm operations. That said, the approach still relies on complex fatigue load modeling, and further validation in diverse wind farm environments will be essential for future research. Additionally, the two-degree-of-freedom model employed in this study offers several advantages in WT modeling, such as computational simplicity, intuitive understanding, and ease of engineering application. However, it also comes with certain limitations, including the neglect of nonlinear effects, turbine interactions, and the complex dynamic response of the tower. These factors may lead to inaccuracies in real-world applications, which is an area for further exploration in future research. Furthermore, the integration of advanced machine learning techniques for real-time monitoring, along with the expansion of field testing, could significantly enhance the model’s robustness and adaptability.

6. Conclusions

This study introduces an optimal active power allocation method that considers turbine fatigue load, aiming to address the premature wear of wind turbines caused by uneven fatigue load distribution within the wind farm. The approach begins with the derivation of a fatigue load expression for the wind turbine shaft and tower system, which has two degrees of freedom. This allows for the establishment of a quantitative relationship between the turbine’s fatigue load and changes in active power output. The model then accounts for differences in fatigue loads across turbines, ensuring that the total power adjustments satisfy the frequency regulation power requirements, thus forming an active power distribution model. The primary optimization goal is to minimize the total fatigue load of the wind farm during the frequency regulation process. To solve this model, an IFA, incorporating logic mapping and adaptive weight strategies, is employed. Finally, a case study featuring nine 5 MW turbines is conducted to validate the effectiveness of the proposed method. The findings are summarized as follows:
  • The torque variation in the turbine drivetrain system and the bending moment fluctuation in the fore-and-aft directions of the tower are the primary factors contributing to the fatigue load of wind turbines. By constructing a fatigue load expression, the quantitative relationship between the fatigue load and the fluctuation of the turbine’s active power output can be clearly established. This expression not only reveals the intrinsic mechanism of fatigue load formation but also provides a theoretical foundation and basis for optimizing the fatigue load suppression during active power control in wind turbines.
  • By introducing Logistic mapping and an adaptive weight strategy, the proposed IFA shows significant advantages in convergence performance. Compared to the traditional FA algorithm, IFA achieves optimal values in fewer iterations, demonstrating higher optimization efficiency. Moreover, comparison experiments between IFA, IGWO, CGA, and IPSO show that the proposed IFA outperforms the other algorithms in global convergence and optimization ability, facilitating the development of higher-quality power distribution strategies.
  • To enhance the coordination of wind farm operations and the lifespan of turbines, the proposed optimization scheduling strategy fully considers the balance of fatigue levels among turbines in the wind farm. This strategy not only effectively reduces the fatigue differences between turbines but also significantly suppresses fluctuations in the main shaft torque and tower bending moments, thus reducing the fatigue loads on the turbines during operation. After comparing the proposed strategy with the current mainstream proportional distribution algorithm, it is found that our strategy exhibits significant advantages in multiple key metrics: the standard deviation of active power decreases by up to 76.88%, drivetrain fatigue load decreases by up to 43.1%, and tower fatigue load decreases by up to 45.4%. These results fully validate the effectiveness and practical value of the proposed method in optimizing wind farm operational performance and extending turbine lifespan.

Author Contributions

Conceptualization, methodology, and validation: X.Y.; Software: Z.H.; Writing—review and editing: Y.G. and S.H.; Supervision: Y.W. (Yuan Wang) and X.L.; Project administration: W.L., Y.W. (Yutong Wang), S.H., X.Y. and Y.G.; Funding acquisition: J.Y. All authors have read and agreed to the published version of the manuscript.

Funding

This research was funded by Technological Support Project of Daqingshan Laboratory 2024KYPT0011.

Institutional Review Board Statement

Not applicable.

Informed Consent Statement

Not applicable.

Data Availability Statement

The data presented in this study are available on request from the corresponding author. The data are not publicly available due to privacy.

Conflicts of Interest

Authors Zhi Huang, Sile Hu, Yu Guo, Yutong Wang, Xianglong Liu, Yuan Wang, and Wenjing Liang are employed by Inner Mongolia Daqingshan Laboratory Co., Ltd., Inner Mongolia Power(Group) Co., Ltd., and Inner Mongolia Electric Power Group Mengdian Economic and Technical Research Institute Co., Ltd. The remaining authors declare that the research was conducted in the absence of any commercial or financial relationships that could be construed as a potential conflict of interest.

References

  1. Lyu, X.; Liu, T. Intelligent learning based active power regulation of wind turbines considering fatigue reduction. IEEE Trans. Ind. Inform. 2022, 18, 405–414. [Google Scholar] [CrossRef]
  2. Li, B.; Zheng, D.; Li, B.; Ji, L.; Hong, Q.; Meng, Q. Research on low voltage ride-through strategies for doubly-fed wind farms during asymmetric faults. Int. J. Electr. Power Energy Syst. 2024, 160, 110138. [Google Scholar]
  3. Yao, Q.; Ma, B.; Zhao, T.; Hu, Y.; Fang, F. Optimized active power dispatching of wind farms considering data-driven fatigue load suppression. IEEE Trans. Sustain. Energy 2023, 14, 371–380. [Google Scholar] [CrossRef]
  4. Yao, Q.; Hu, Y.; Zhao, T.; Guan, Y.; Luo, Z.; Liu, J. Fatigue load suppression during active power control process in wind farm using dynamic-local-reference DMPC. Renew. Energy 2022, 183, 423–434. [Google Scholar] [CrossRef]
  5. Cai, W.; Hu, Y.; Fang, F.; Yao, L.; Liu, J. Wind farm power production and fatigue load optimization based on dynamic partitioning and wake redirection of wind turbines. Appl. Energy 2023, 339, 121000. [Google Scholar] [CrossRef]
  6. Liu, Y.; Wang, Y.W.; Wang, X.D.; Miao, Y. Optimal active power dispatch for wind farm based on the improved fatigue load sensitivity. J. Renew. Sustain. Energy 2019, 11, 033306. [Google Scholar] [CrossRef]
  7. Zhao, H.; Wu, Q.; Guo, Q.; Sun, H.; Xue, Y. Distributed model predictive control of a wind farm for optimal active power control Part II: Implementation with clustering-based piece-wise affine wind turbine model. IEEE Trans. Sustain. Energy 2015, 6, 840–849. [Google Scholar] [CrossRef]
  8. Wang, Z.; Wu, W. Coordinated control method for DFIG-based wind farm to provide primary frequency regulation service. IEEE Trans. Power Syst. 2018, 33, 2644–2659. [Google Scholar] [CrossRef]
  9. Wang, Y.; Peng, Y.; Sun, J. A review of automatic generation control technology and strategies for wind farms. Power Syst. Technol. 2025, 1–22. Available online: https://www.cnki.com.cn/Article/CJFDTotal-DWJS20250717001.htm (accessed on 2 October 2025).
  10. Gao, Y.; Tahir, M.; Siano, P.; Bi, Y.; Hu, S.; Yang, J. Optimization of renewable energy-based integrated energy systems: A three-stage stochastic robust model. Appl. Energy 2025, 377, 124635. [Google Scholar] [CrossRef]
  11. Meng, Q.; Jin, X.; Luo, F.; Wang, Z.; Hussain, S. Distributionally robust scheduling for benefit allocation in regional integrated energy system with multiple stakeholders. J. Mod. Power Syst. Clean Energy 2024, 12, 1631–1642. [Google Scholar] [CrossRef]
  12. Xu, J.; Yi, X.; Sun, Y.; Lan, T.; Sun, H. Stochastic optimal scheduling based on scenario analysis for wind farms. IEEE Trans. Sustain. Energy 2017, 8, 1548–1559. [Google Scholar] [CrossRef]
  13. Zhang, B.; Soltani, M.; Hu, W.; Hou, P.; Chen, Z. A wind farm active power dispatch strategy for fatigue load reduction. In Proceedings of the American Control Conference, Boston, MA, USA, 6–8 July 2016; pp. 5879–5884. [Google Scholar]
  14. Marsh, G.; Wignall, C.; Thies, P.R.; Barltrop, N.; Incecik, A.; Venugopal, V.; Johanning, L. Review and application of Rainflow residue processing techniques for accurate fatigue damage estimation. Int. J. Fatigue 2016, 82, 757–765. [Google Scholar] [CrossRef]
  15. Tao, T.; Yang, Y.; Yang, T.; Liu, S.; Guo, X.; Wang, H.; Liu, Z.; Chen, W.; Liang, C.; Long, K.; et al. Time-domain fatigue damage assessment for wind turbine tower bolts under yaw optimization control at offshore wind farm. Ocean. Eng. 2024, 303, 117706. [Google Scholar] [CrossRef]
  16. Yao, Q.; Liu, J.; Hu, Y. Optimized active power dispatching strategy considering fatigue load of wind turbines during de-loading operation. IEEE Access 2019, 7, 17439–17449. [Google Scholar] [CrossRef]
  17. Gao, Y.; Zhao, Y.; Hu, S.; Tahir, M.; Yuan, W.; Yang, J. A three-stage adjustable robust optimization framework for energy base leveraging transfer learning. Energy 2025, 319, 135037. [Google Scholar] [CrossRef]
  18. Zhang, B.; Soltani, M.; Hu, W.; Hou, P.; Huang, Q.; Chen, Z. Optimized power dispatch in wind farms for power maximizing considering fatigue loads. IEEE Trans. Sustain. Energy 2018, 9, 862–871. [Google Scholar] [CrossRef]
  19. Zhang, Z.; Kudashev, S.F. Distributed robust cooperative optimization of multi-integrated energy systems based on variational inequality-driven non-cooperative game theory. Appl. Energy 2025, 401, 126696. [Google Scholar] [CrossRef]
  20. Xie, M.; Wang, Y.; Zhang, K. Development and optimization of a realistic biodiesel-methanol mechanism based on genetic algorithm. Renew. Energy 2025, 250, 123301. [Google Scholar] [CrossRef]
  21. Meng, Q.; He, Y.; Gao, Y.; Hussain, S.; Lu, J.; Guerrero, J.M. Bi-level four-stage optimization scheduling for Active Distribution Networks with Electric Vehicle integration using multi-mode dynamic pricing. Energy 2025, 327, 136316. [Google Scholar] [CrossRef]
  22. Yu, Y.-F.; Wang, Z.; Chen, X.; Feng, Q. Particle swarm optimization algorithm based on teaming behavior. Knowl.-Based Syst. 2025, 318, 113555. [Google Scholar] [CrossRef]
  23. Jin, Z.; Li, X.; Qiu, Z.; Li, F.; Kong, E.; Li, B. A data-driven framework for lithium-ion battery RUL using LSTM and XGBoost with feature selection via Binary Firefly Algorithm. Energy 2025, 314, 134229. [Google Scholar] [CrossRef]
  24. Wang, L.; Peng, L.; Xiong, X.; Li, Y.; Qi, Y.; Hu, X. Research on high-speed constant tension spinning control strategy based on vibration detection and enhanced firefly algorithm-based FOPID controller. Measurement 2025, 254, 117789. [Google Scholar] [CrossRef]
  25. Wang, Y.; Guo, Y.; Zhang, D. Optimal ancillary control for frequency regulation of wind turbine generator based on improved fatigue load sensitivity. Int. J. Electr. Power Energy Syst. 2022, 137, 107751. [Google Scholar] [CrossRef]
  26. Li, Y.; Zhou, J.; Chen, F.; Sun, M. An improved particle swarm optimization for wind resistance performance design of high-rise buildings. Adv. Wind. Eng. 2025, 2, 100053. [Google Scholar] [CrossRef]
  27. Pourrajabian, A.; Dehghan, M.; Rahgozar, S. Genetic algorithms for the design and optimization of horizontal axis wind turbine (HAWT) blades: A continuous approach or a binary one? Sustain. Energy Technol. Assess. 2021, 44, 101022. [Google Scholar] [CrossRef]
  28. Luo, K. Enhanced grey wolf optimizer with a model for dynamically estimating the location of the prey. Appl. Soft Comput. 2019, 77, 225–235. [Google Scholar] [CrossRef]
  29. Shan, J.; Pan, J.-S.; Chang, C.-K.; Chu, S.-C.; Zheng, S.-G. A distributed parallel firefly algorithm with communication strategies and its application for the control of variable pitch wind turbine. ISA Trans. 2021, 115, 79–94. [Google Scholar] [CrossRef]
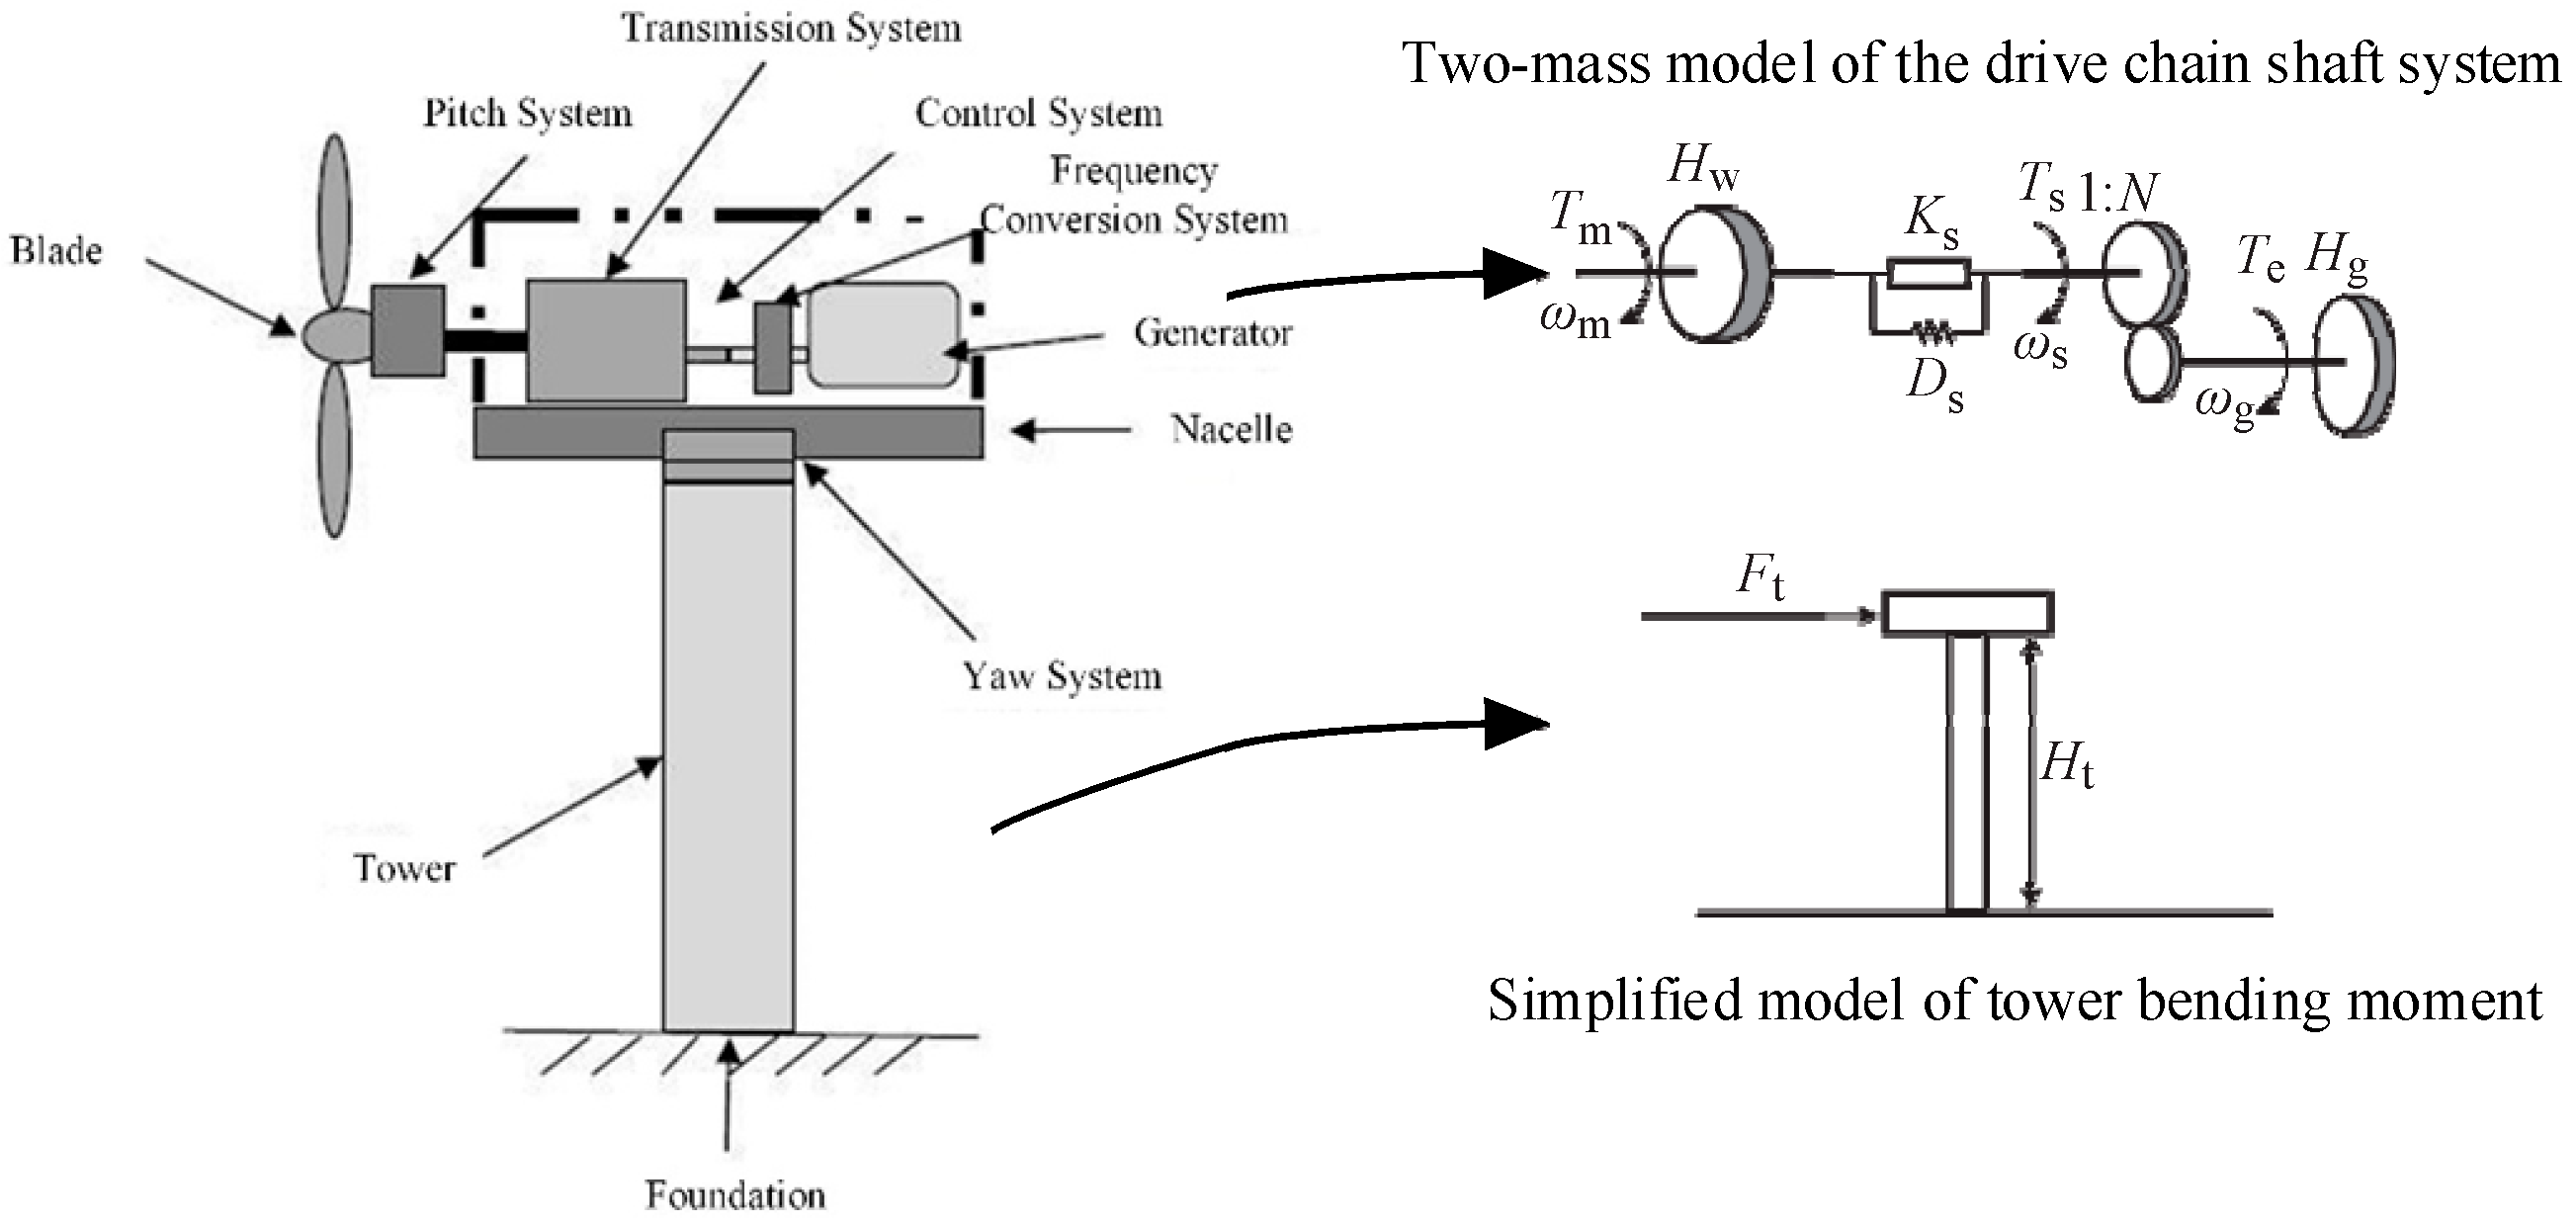
Figure 1. Configuration Diagram of the Wind Turbine.
Sustainability 17 09189 g001
Figure 2. Overall flowchart of the IFA.
Sustainability 17 09189 g002
Figure 3. Active Power Control Process.
Sustainability 17 09189 g003
Figure 4. Wind Farm Layout.
Sustainability 17 09189 g004
Figure 5. Simulated Wind Speed Distribution in the Wind Farm.
Sustainability 17 09189 g005
Figure 6. Comparison of the Iterative Process between Other Algorithms and IFA.
Sustainability 17 09189 g006
Figure 7. Output Power of Wind Turbines under Two Different Strategies.
Sustainability 17 09189 g007
Figure 8. Analysis on the impact of the light absorption intensity.
Sustainability 17 09189 g008
Table 1. Wind Turbine Parameters and Experimental Conditions.
ParameterValueParameterValue
Cut-in wind speed/Rated wind speed/Cut-out wind speed3/11.4/25 (m/s)Tower height90 (m)
Rotor diameter126 (m)Rotor inertia 3.54 × 10 7 (kg/m2)
Rated power5 (MW)Generator inertia 5.34 × 10 2 (kg/m2)
Start-up speed/Rated speed6.9/12.1 (rpm)Filter time constant10
Table 2. Comparison of computation time among different algorithms.
Numbers of Simulation1st2nd3rd4th5th6th7th8th9th10thAverage
Time/sIGWO289.6291.2292.8289.6294.4291.2292.8289.6291.2292.8291.52
CGA262.6266.5265.2263.9269.1267.8266.5265.2263.9266.5265.72
IPSO353.6356.2352.3354.9357.5353.6356.2352.3354.9356.2354.77
FA255.39253.27256.18255.22255.90256.73255.32254.28255.04253.98255.13
IFA132.08133.27131.22134.57133.69134.35133.17132.98134.28131.77133.14
Table 3. Corresponding Standard Deviation of Power Distribution.
WFStandard Deviation of Power (Proportional Distribution)/MWStandard Deviation of Power (Proposed Strategy)/MWReduction Proportion/%
10.51730.119276.96%
20.52090.120476.89%
30.51970.113178.24%
40.52490.117177.69%
50.51850.118277.20%
60.51910.116377.60%
70.51560.118677.00%
80.52160.124176.21%
90.51960.126275.71%
Table 4. Drivetrain Equivalent Fatigue Load under Different Control Strategies.
WFEquivalent Fatigue Load (MN·m)
Proportional Distribution StrategyProposed StrategyReduction Proportion/%
10.53890.3281 39.12
20.44540.300832.47
30.56610.340839.80
40.44710.312330.15
50.38930.278428.49
60.38250.260831.82
70.41310.288330.21
80.38930.283227.25
90.61540.347243.58
Table 5. Tower Equivalent Fatigue Load under Different Control Strategies.
WFEquivalent Fatigue Load (MN·m)
Proportional Distribution StrategyProposed StrategyReduction Proportion/%
110.38786.479737.62
210.06485.723143.14
310.63946.737936.67
410.21315.829842.92
59.40955.295843.72
69.40765.162345.13
79.80575.671442.16
89.51655.410343.15
910.68646.790736.45
Disclaimer/Publisher’s Note: The statements, opinions and data contained in all publications are solely those of the individual author(s) and contributor(s) and not of MDPI and/or the editor(s). MDPI and/or the editor(s) disclaim responsibility for any injury to people or property resulting from any ideas, methods, instructions or products referred to in the content.