Article

Spatial Variability of Rainfall and Vulnerability Assessment of Water Resources Infrastructure for Adaptive Management Implementation in Ceará, Brazil

by
Gabriela de Azevedo Reis
,
Larissa Zaira Rafael Rolim
,
Ticiana Marinho de Carvalho Studart
,
Samiria Maria Oliveira da Silva
,
Francisco de Assis de Souza Filho
and
Maria Aparecida Melo Rocha
*
Department of Hydraulic and Environmental Engineering, Federal University of Ceará, Humberto Monte Av., Fortaleza, Ceará 60455-900, Brazil
*
Author to whom correspondence should be addressed.
Sustainability 2025, 17(20), 9147; https://doi.org/10.3390/su17209147
Submission received: 15 August 2025 / Revised: 4 October 2025 / Accepted: 9 October 2025 / Published: 15 October 2025

Abstract

Given that a robust water resource management strategy requires the knowledge of natural and climatic factors and social and economic factors, we applied a variability and vulnerability assessment as a quantitative tool to characterize water resources in Ceará, Brazil. A methodological approach that identifies and quantifies variability and vulnerability would allow better solutions to management decision problems. This approach functions as an indicator-based framework separating areas with similar water availability and water resources infrastructure, indicating the influence of natural and anthropogenic factors in the area’s water resources. The assessment proceeded with the regions’ delimitation, classifying them according to rainfall amount and spatial variability. The Adaptive Capacity for Water Management Index (ACWM) was evaluated using georeferenced water infrastructure information based on that classification. Most of the state’s area is subjected to low rainfall (below average). Nonetheless, of the areas with low rainfall, 48% have high variability. Within those areas critical water infrastructures are located that supply water to the state’s main industrial and populated city. Thus, the acknowledgment of this characteristic can complement current water management. Lastly, the authors provided recommendations based on the coupling of variability and vulnerability assessments with adaptive management to address improvements in the current water allocation system.

1. Introduction

Natural variability and anthropogenic land-use change is an issue for water-scarce regions. In addition to these factors’ impacts, climate change can also negatively interfere with water availability [1,2,3]. Coping with unpredictable changes in complex water systems requires adaptability to their inherent variability [4]. The northeastern region of Brazil (NEB) is recognized as the most densely populated semiarid area globally and has been identified as particularly susceptible to climate change over the next century [5]. Thus, for regions such as the NEB, availability and water use are still a significant challenge regarding its development and management [1].
In addition to natural and climatic features, social and economic factors affect water supply system stress. Population growth directly impacts water demand and brings great uncertainty to stationary water supply systems [6]. Considerable efforts are being made to implement an extensive infrastructure for water supply in the NEB. However, adequate water resource management is fundamental to guarantee supply in periods of drought, which are frequent in the region. Developing a sustainable water resource system fundamentally requires integrating regional hydroclimatic characteristics with socio-economic, cultural, and institutional considerations [7]. Only a comprehensive effort that simultaneously encapsulates all water resource issues can genuinely reflect the hydrological system’s overall picture. In line with the 2030 Agenda, we frame water security as a pillar of social, economic, and environmental sustainability, connecting hydroclimatic risk to governance, equity, and infrastructure planning.
Nonetheless, identifying these implications is difficult for water managers as the uncertainty, variability, and interdisciplinary aspects significantly increase the system’s complexity [8]. Climate knowledge helps stakeholders manage water resources more effectively by providing insight into system behavior and water availability. The uncertainties inherent to hydrological variables that directly influence water system dynamics along with their anthropogenic forcing factors can be addressed by examining behavioral and governance aspects such as decision-making processes, regulatory oversight mechanisms, and methods for enforcing rules [7]. Identifying spatial variability and rainfall patterns is a crucial factor for guaranteeing efficient water management. Entropy-based approach methods are likely to help define and analyze intrinsic information of hydrological variables. They provide information about the uncertainty at a given scale and corroborate the level of variation and randomness [9]. The link between spatial variability and vulnerability assessment can help plan sustainable adaptation and mitigation strategies in an adaptive management model framework for water systems. According to the Intergovernmental Panel on Climate Change (IPCC), vulnerability can be described as a function that combines exposure and sensitivity, along with adaptability or adaptive capacity. Adaptive capacity is an inherent property of a system and refers to its potential to reduce vulnerability.
Adaptive capacity refers to a system’s ability to access resources for addressing stresses. It is a latent property that becomes active during crises or opportunities [7,10]. Adaptive management seeks to enhance policy formulation and implementation by addressing uncertainty through systematic experimentation, engaging diverse stakeholders in participatory decision-making processes, and closely monitoring outcomes and changes to enable responsive adjustments [4]. Beyond diagnosis, we target implementation pathways, investigating how variability metrics can inform allocation rules, drought operation plans, and investment prioritization, and enabling the monitoring and evaluation (M&E) of adaptation policies at the basin scale.
Most climate change vulnerability studies have been published during the last decade [11]. However, it is possible to identify gaps concerning the regions of South America and the semiarid ecosystem. Most of these studies concern European and North American regions [12,13,14,15,16]. In North Africa, a vulnerability study considering sensitivity, exposure, and adaptive capacity assessed the social impacts of climate change effects, highlighting the need for robust adaptive capacity to mitigate the impacts of climate variability [17]. Lebel et al. (2011) [18], Tucker et al. (2015) [19], and De Souza (2015) [20] also published studies concerning social vulnerability and similar aspects facing climate change in Africa and Asia. Fuentes-Castillo et al. (2020) [21] analyzed climate change vulnerability in protected areas in Central Chile and the Tropical Andes through the climate change velocity approach. In Brazil, Lemos et al. (2020) [22] linked adaptive water management to building adaptive capacity, considering aspects of participatory governance and democratic deliberation. It is possible to observe that vulnerability in climate change studies is complex and distinct, and there is no consensus over how to evaluate vulnerability.
On the other hand, various studies have covered rainfall variability in semiarid regions and its effect on water availability concerning land cover change, agriculture, and livestock [23,24,25]. In the context of hydrology, entropy-based methods have been utilized to assess the variability of rainfall [26,27], rainfall network design [28], the regionalization and clustering of catchments [9,29], and water resources availability [30]. Da Silva et al. (2016) [31] assessed the space–time variability of rainfall and streamflow in the NEB using Shannon’s entropy. Some studies also incorporated an entropy-based method in analyzing the economy-wide effects of reduced water supply [32]. Thus, entropy-based methods have been applied in the water resources field and with different purposes. Nonetheless, we identified a lack of studies connecting adaptive capacity to water management through water infrastructures and completing the vulnerability assessment by evaluating spatial rainfall variability. Applying a robust method that can quantify rainfall variability by incorporating its complex nature and the vulnerability concept that accounts for social and economic factors can help us make informed decisions on water resource management and planning.
This paper proposes a vulnerability analysis that considers spatial rainfall variability and the adaptive capacity of a water-scarce region to improve the current water system through adaptive management. The method uses an entropy-based metric to evaluate variability and develops an index of adaptive capacity for water management based on water infrastructure indicators that mitigate the impacts of climate variability and water scarcity. The study area is the state of Ceará, in Brazil’s semiarid northeast.

2. Materials and Methods

2.1. Study Area

The state of Ceará (Figure 1) is located between 3° and 7° south latitude at the NEB, with a 149,010.6 km2 area. It is a semiarid region characterized by high evaporation rates and low precipitation for most of the year, making it difficult to recharge aquifers and river flow. Another aspect that significantly influences water availability is the soil characteristics, which are shallow soils, mostly above crystalline rock basement. The state’s geohydrological characteristics also reflect the characteristics of drought events, which are severe and prolonged.
The main rainy season occurs between February and May, closely affected by the Intertropical Convergence Zone (ITCZ), which influences rainfall and depends on oceanic and atmospheric conditions. The difference in the sea surface temperature (SST) of the tropical North and South Atlantic drives the ITCZ when it reaches its southernmost position, producing the NEB’s rainy season [33,34,35]. Precipitation patterns are significantly influenced by natural variations in sea surface temperature (SST). Climate indices, including the El Niño Southern Oscillation (ENSO), the Pacific Decadal Oscillation (PDO), and the Atlantic Multidecadal Oscillation (AMO), have a direct impact on the rainfall regime of the northeast Brazil (NEB) region [36,37,38].
Water resource management in Brazil occurs at the local level, with hydrographic regions serving as management units. In Ceará, each river basin, as illustrated in Figure 1, has a River Basin Committee (RBC) that implements basin plans through the participation of government institutions, water users, and civil society. Water allocation in each basin is negotiated among stakeholders and water resources managers within the Committee. The Water Resources Company of the State of Ceará (COGERH) is responsible for carrying out water management actions in Ceará. COGERH provides technical information that guides negotiations on the quantity and quality of water in reservoirs and water resource systems, as well as projections for different supply and demand scenarios. Negotiations take place in Committee meetings between members, stakeholders, and managers. Once a majority consensus is reached, an allocation agreement is formalized, defining the water flows assigned to each user segment, such as human supply, irrigation, industries, etc. Allocation rules and mechanisms must be flexible and robust to ensure equitable and efficient water distribution [39]. Table 1 presents the water storage capacity of the three largest reservoirs of Ceará (Banabuiú, Orós, and Castanhão) and the sum of the water storage capacity of the entire state. It is possible to observe that these three reservoirs represent almost 55% of Ceará’s water storage capacity.

2.2. Methods

In order to join the concepts of variability and vulnerability, the following methodology was devised. Initially, to establish water availability zones, we integrate the SVIAE with annual average rainfall data, which enables the delineation of regions based on both the quantity and variability of precipitation. The ACWM was then calculated for each area, considering its area size and the structures situated within. Next, based on the area’s assessment, some recommendations were made to improve the water resource planning and management throughout adaptive management.
Apportionment entropy (AE) as a measure of variability
Assessing and managing water resources involves quantifying rainfall variability, which is influenced by the complex and interacting climatic variables that affect rainfall dynamics across different times and locations [30]. If we focus on temporal variability, the concept of entropy can be used to measure the degree of uncertainty of an over-a-year temporal apportionment based on the probability density function of a random apportioned variable over fragmented time [30,40]. Entropy-theoretic approaches are appealing because they quantify information, disorder, or uncertainty without requiring strict distributional assumptions of the data; as such, they are broadly applicable across hydroclimatic regimes and data types [41].
The apportionment entropy (AE), as defined by Maruyama et al. (2005) [40], can be calculated over different timescales (e.g., daily, monthly, seasonal) and can measure the over-a-year disorder. AE is determined using Equation (1), where R represents the total annual rainfall, ri denotes the rainfall amount for the specified timescale within that year, and n refers to the number of class intervals. AE was computed separately for each calendar year to quantify the within-year apportionment of rainfall.
A E = i = 1 n ( r i / R )   log 2   ( r i / R )
For equally likely events, when the annual rainfall amount is evenly apportioned to the considered timescale within the year (i.e., with the probability of 1/12 for a monthly timescale), AE takes its maximum value of H = log 2 12 . AE minimum occurs when the apportionment is made to only 1 out of the 12 months with a probability of 1.
Several studies applied this entropy-based concept to delineate potential water availability areas [30,40,42]. In order to produce results that can be compared to other regions in the world, we apply the concept of the standardized variability index (SVI) to calculate the normalized variability as proposed by Guntu et al. (2020) [30]. The SVIAE is calculated as shown in Equation (2) by subtracting the maximum possible AE (AEmax) and AE for the given time series. Then, the value is divided by the AEmax. AEmax is equal to Log2N, and it depends on the length of the data and the timescale.
SVI AE = AEmax     AE AEmax  
The SVI determines the individual series’ variability regarding the maximum possible variability, taking a value within 0 and 1 where 0 corresponds to no variability, and 1 represents high variability. For mapping and regime delineation, we summarize the interannual distribution of SVIAE. These SVI-based areas are then used as the analysis units for the infrastructure assessment. To calculate the SVI, we used monthly rainfall data from pluviometry stations provided by the National Water Agency (Agencia Nacional de Águas—ANA). For each month during 1911–2017, the stations with data available that month were interpolated across Ceará using inverse distance weighting (IDW, power = 2) onto a regular 0.01° grid (WGS84), producing a continuous mosaic. The interpolation network comprised 256 gauges deemed consistent by the screening protocol, distributed statewide. This corresponds to an areal density of ≈1.72 stations per 103 km2 (about one per ~582 km2). SVIAE can be seen as a sustainability tool for monitoring intra-annual rainfall concentration, allowing benchmarking across regions and years, a measurable indicator that supports risk screening and early-warning dialogs with stakeholders.
Adaptive capacity measurement
Adaptive capacity, as defined by the IPCC, represents improvements and solutions designed and developed by society. Building infrastructures that increase the capacity of a raw water supply system, such as canals and reservoirs, contributes to the robust adaptive management of the water resources. Therefore, the goal here was to develop a measurement that can encompass important improvements to Ceará’s water supply infrastructure.
We developed an Adaptive Capacity for Water Management Index (ACWM) composed of two indicators that represent both reservoir capacities (RC) and the raw water transportation network (T). These infrastructures are the backbone of water security in a semiarid region, as they are directly designed to buffer climatic variability, store water during wet years, and redistribute it during dry periods. While adaptive capacity can encompass broader social, institutional, and economic dimensions, these aspects are not easily mapped or normalized at the same spatial resolution. Therefore, we restricted the ACWM to physical water infrastructures, which provide a tangible, consistent, and comparable proxy of the state’s adaptive capacity to cope with water scarcity. The georeferenced data was obtained from COGERH. RC is the total capacity of water storage for all the reservoirs within a delimited area. T is the ratio between the length, in kilometers, of the canals within the same delimited class and the area measured in square kilometers. T represents a concentration of structures conducive to the transport of water for each class. The areas are as defined during the variability measurement process. Each area has its respective value for RC and T. GIS tools were used to calculate RC and T variables.
Due to the indicators being represented with different units and the ACWM being proposed to be a dimensionless index, the values were normalized. In Equation (3), RCi or Ti are the value of the indicator for each class area i, and MAX and MIN are the maximum and minimum value fixed for each indicator, respectively. NRCi or NTi represents the normalized indicator as follows:
NRC i   or   NT i = RC i   or   T i MIN MAX MIN
In the state of Ceará, the water transportation structures combined with the reservoirs are responsible for a robust network of raw water supply built throughout the decades to minimize the effects of the frequent, severe, and long periods of drought and provide water for the population. Canals represent the infrastructure that allows water stored in reservoirs to be effectively distributed to the population, industries, and irrigated agriculture. In Ceará’s semiarid context, reservoirs without connecting canals have limited capacity to reduce water scarcity, as their benefits are spatially restricted [6]. For this reason, we assigned a double weight to the transportation network indicator (T) in the ACWM calculation, reflecting its central role in guaranteeing water accessibility and security, as shown in Equation (4), where i refers to each class.
A C W M i = NRC i + 2   ×   NT i 2

3. Results and Discussion

Rainfall Variability and Adaptive Capacity Assessment

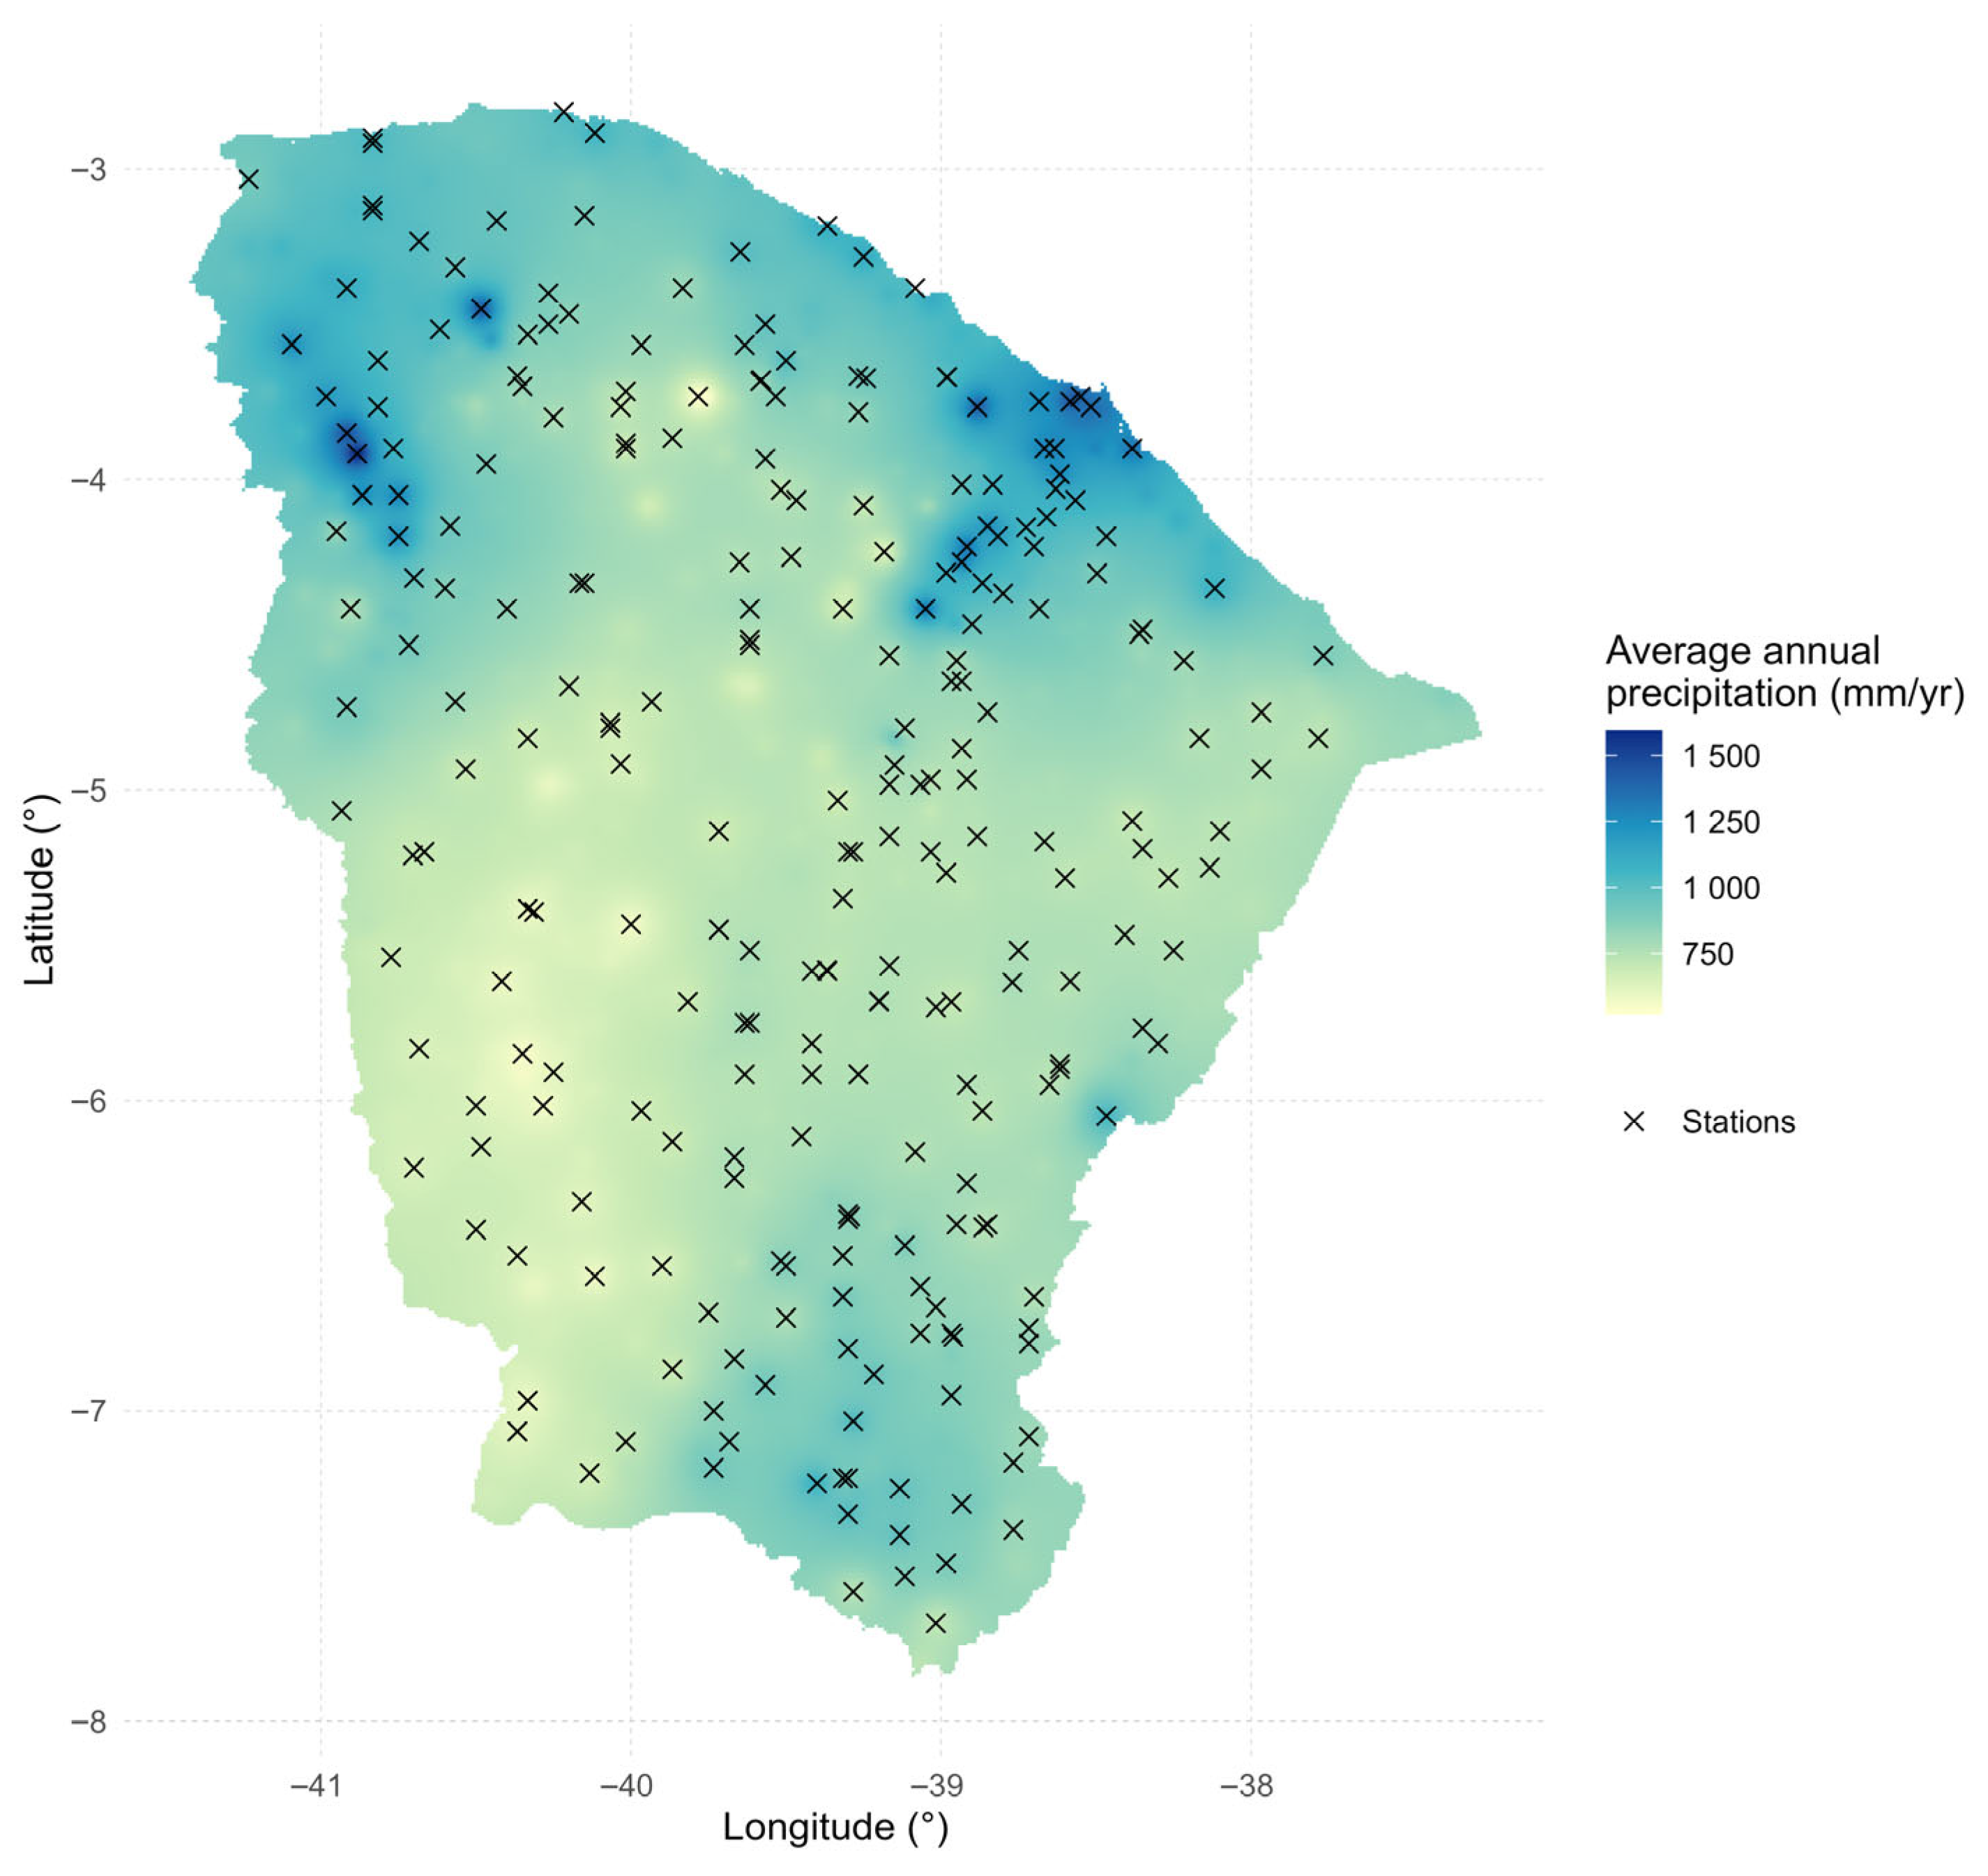
Figure 2 exhibits the average annual precipitation (mm/year), and it is possible to see that most of Ceará’s territory is below 1000 mm/year.
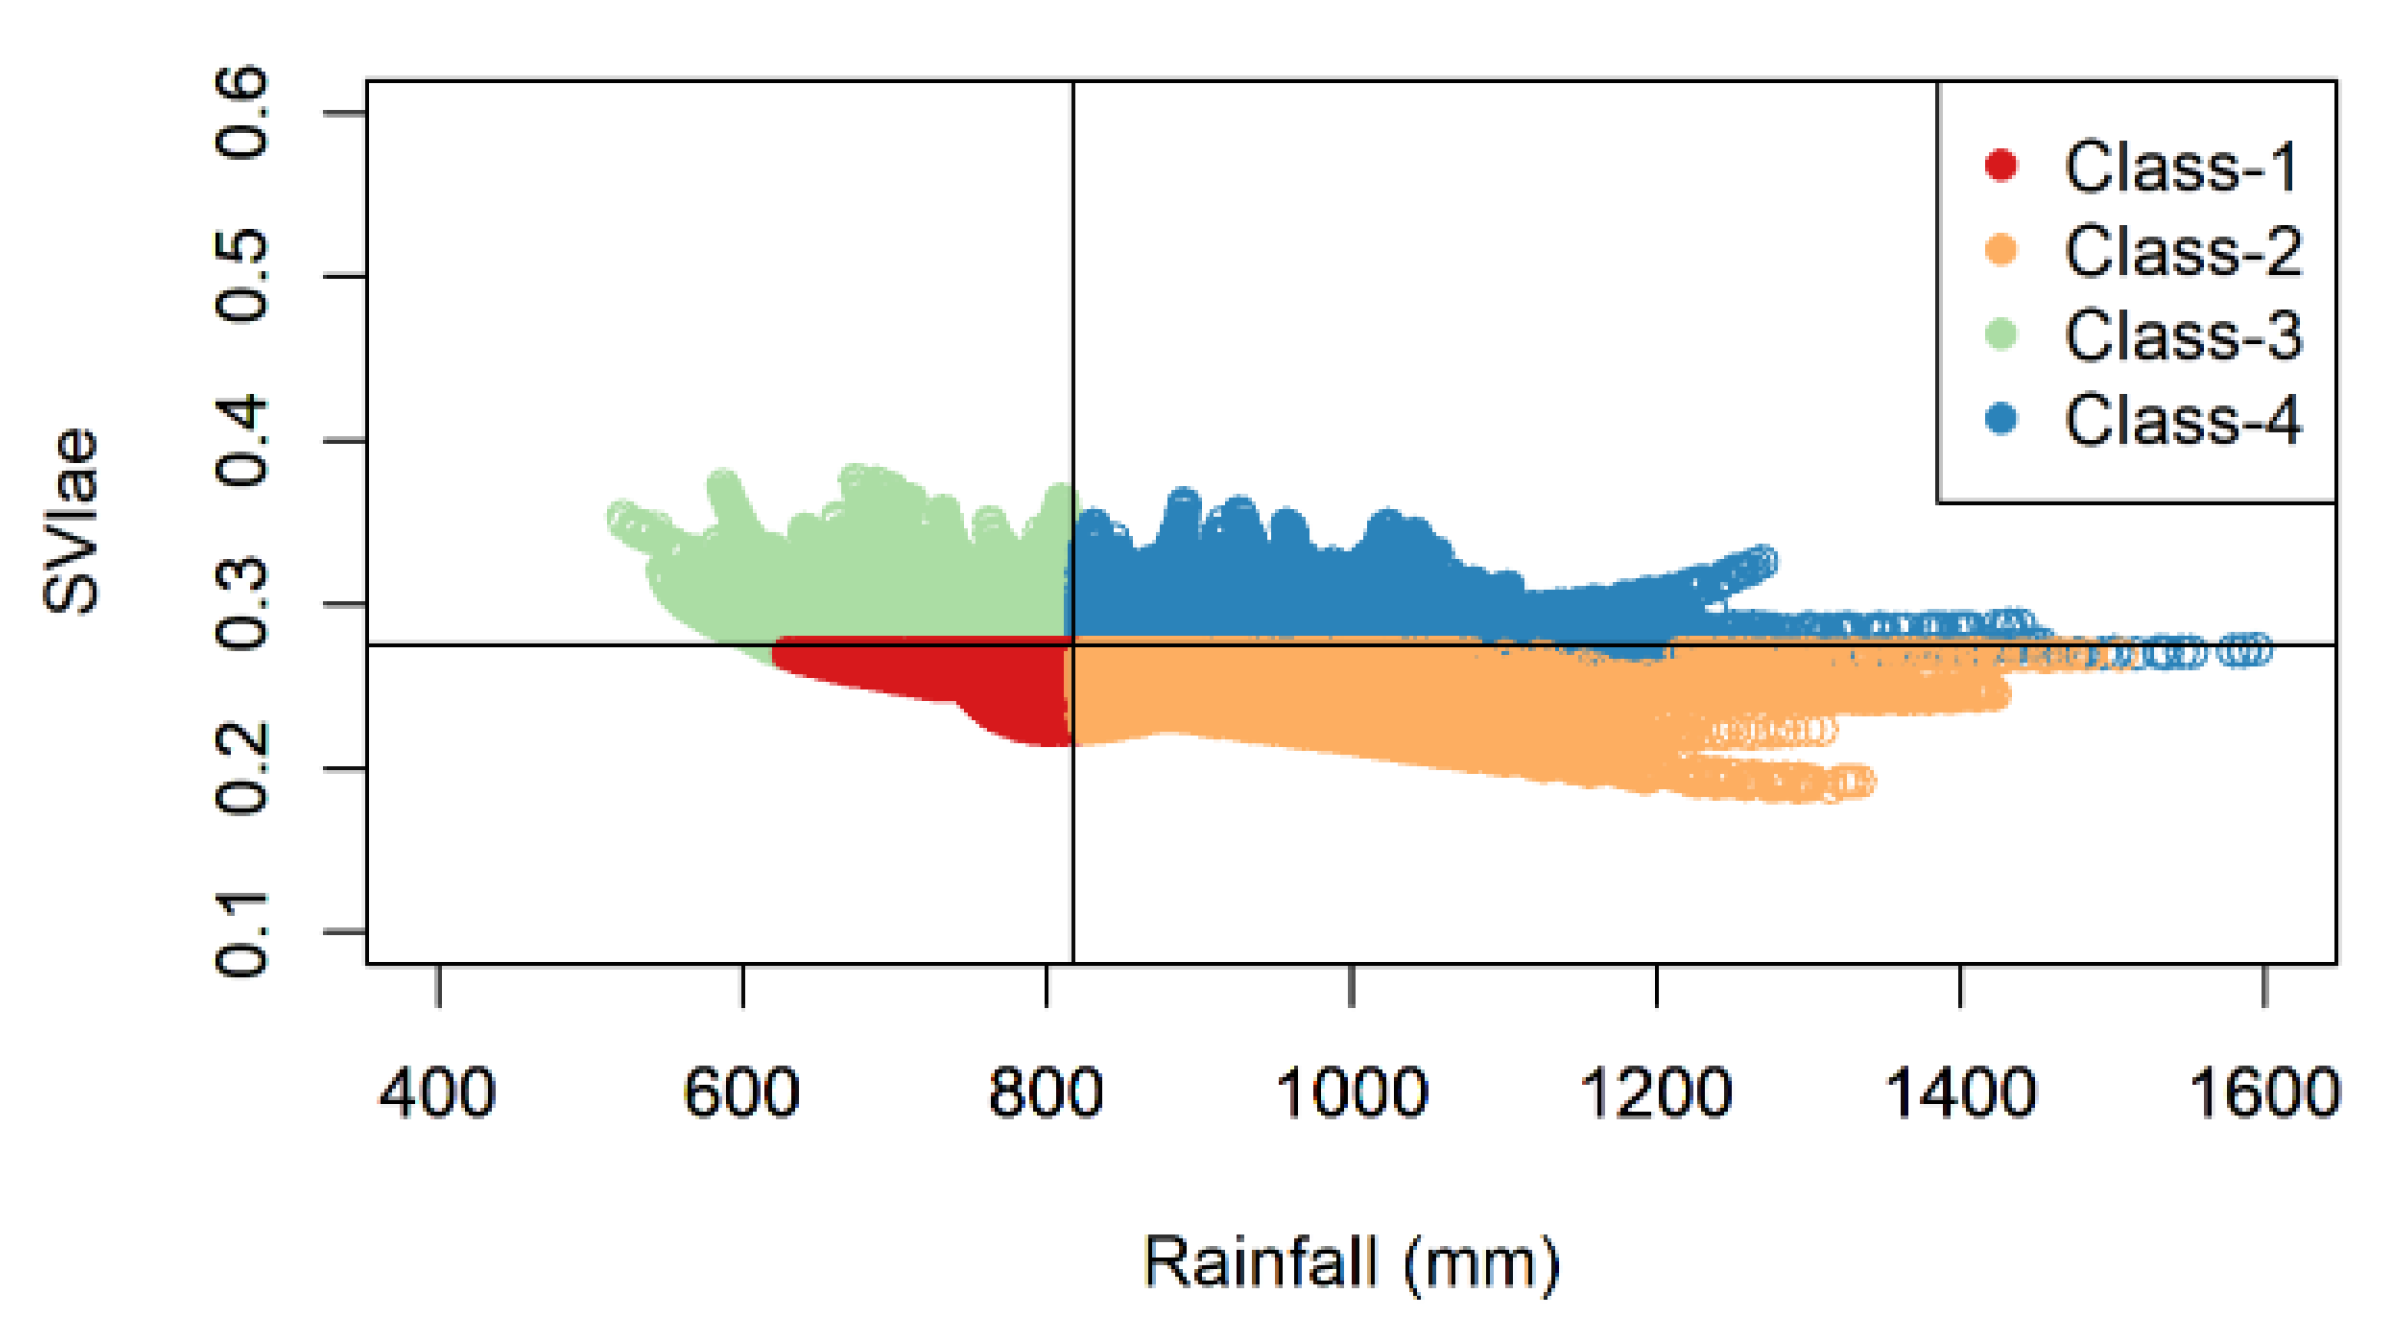
Figure 3 shows the scatter plot constructed for SVIAE (standardized variability index—apportionment entropy) on a monthly scale. We compute SVIAE year by year and map the median over 1911–2017 as a long-term descriptive characterization. The combination of entropy and rainfall over a year can measure water availability [42]. The entire graph (Figure 2) is classified into four regions by the lines passing through the mean values of SVIAE (0.27) and the average annual precipitation (823.15 mm). These four regions are Class-1, Class-2, Class-3, and Class-4, and their characteristics are presented in Table 2. Importantly, these classes are defined solely in the SVIAE–precipitation space and are entirely independent of the ACWM; ACWM is not used to form or modify these classes and is computed separately in subsequent analyses. According to Kawachi et al. (2001) [42], this method explains long-established water use practices well, although it results from simple clustering with the variables’ means.
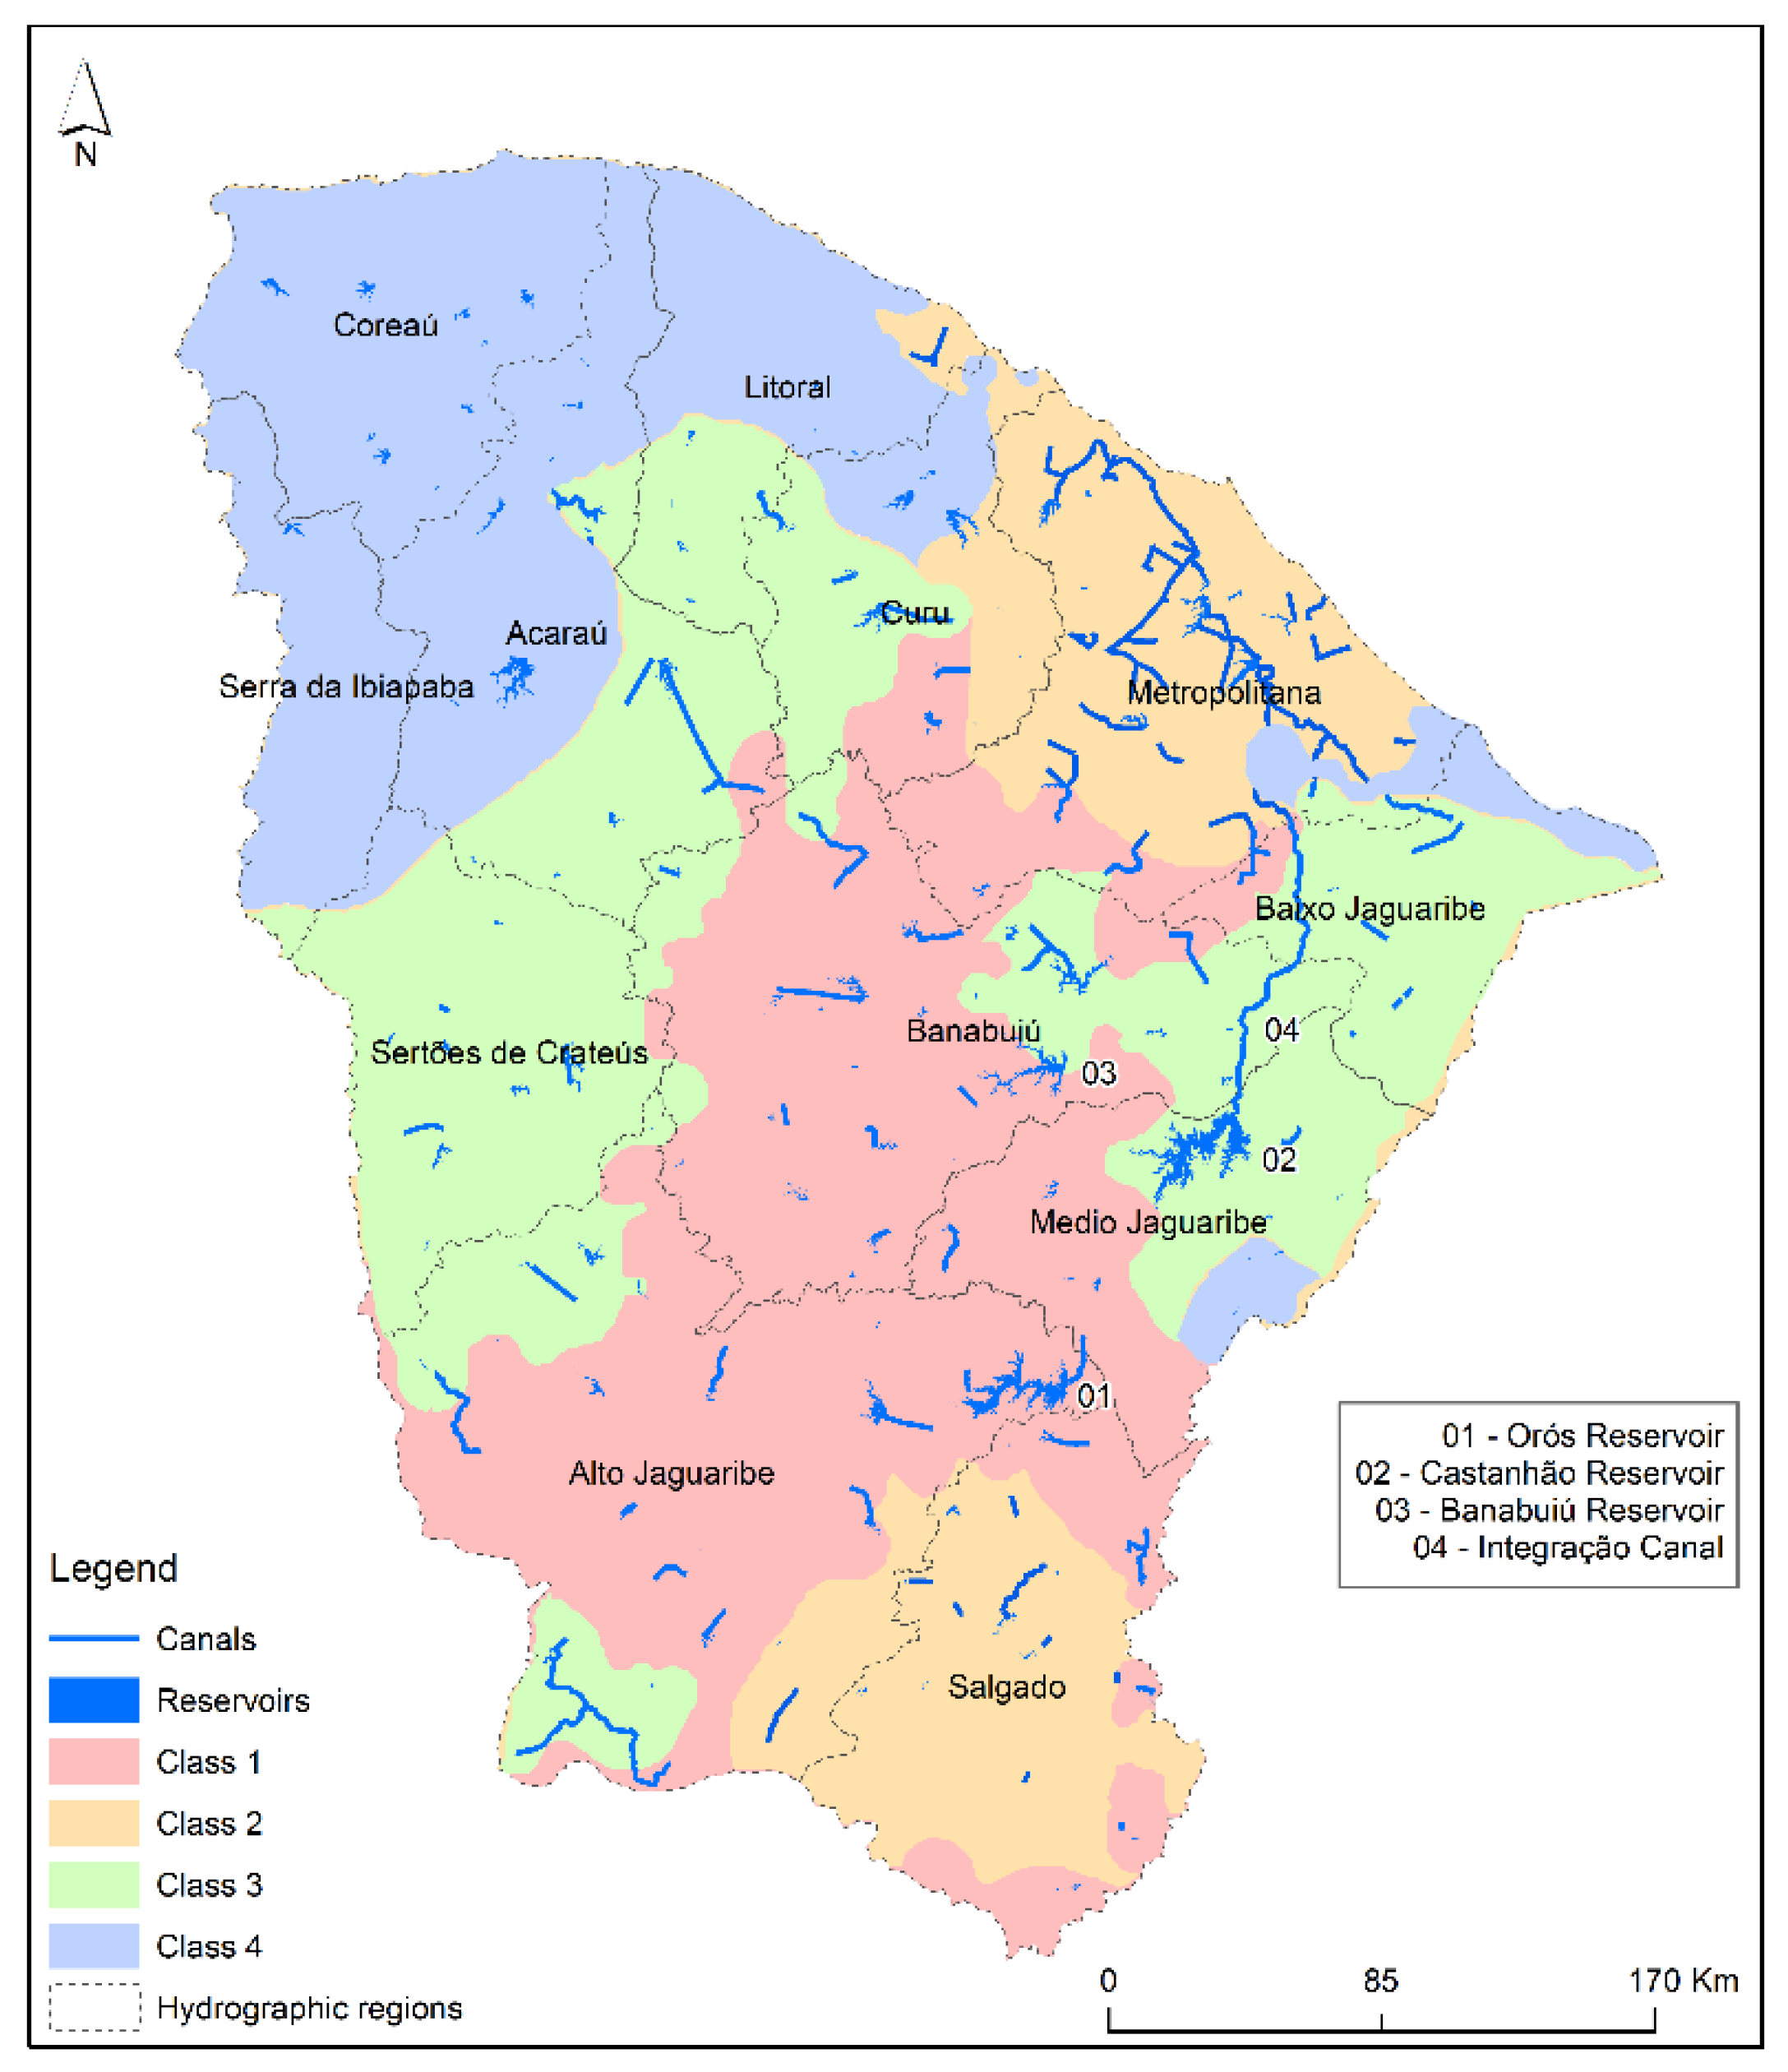
The Adaptive Capacity for Water Management Index (ACWM) provides a value, mostly between 0 and 1, for each area calculated. Higher values represent areas with more water infrastructure; thus, they are more adapted to deal with droughts and water scarcity scenarios. The classes obtained during the variability assessment process were georeferenced and spatialized, as shown in Figure 4. ACWM differences across classes translate into actionable priorities: (i) supply-oriented measures (storage/transfer reinforcement) where rainfall is low/variable; (ii) demand- and efficiency-oriented measures (loss control, tariff signals, smart metering) where water is abundant, but infrastructure is sparse; (iii) governance improvements (allocation transparency, enforcement, leak/illegal withdrawal reduction) in highly connected systems.
Table 3 exhibits the ACWM obtained for each class, calculated considering its area and the water infrastructures in each class. It is essential to highlight that the ACWM is not classified into different categories (such as ‘high,’ ‘moderate,’ and ‘low’). We used a comparative analysis for the interpretation of the results obtained.
Class-1 can be explained qualitatively as low average annual precipitation and low variability in the monthly timescale and presents the worst scenario for adaptive capacity, even though one of the state’s main reservoirs (Orós) was built within this area. It is easy to see that ACWM can indicate a lack of infrastructure that guarantees water security for the population. The hydrological conditions and the large area that this class encompasses are challenges for water management planning and decision-making. For this class, the water resource availability is deficient, and in order to guarantee the perennial or intensive water demands, there is a need to construct reservoirs for water storage.
In Class-2, the region is characterized by above-average rainfall and low variability. Water resources are abundant and permanently available in these stations. Therefore, storing excess rainfall in reservoirs can decrease fluctuations in water availability over time and increase the supply of water for users. This class covers the Metropolitana and Salgado hydrographic regions. In the Metropolitana region, the topographic conditions prevent the construction of pluriannual reservoirs. It is crucial to appoint the northern area of Class-2 is the most populated and industrial active region of the state, which justifies the high density of water canals.
For Class-3, the rainfall is low, but the variability is above average, resulting in low and ephemeral water resource availability. It is necessary to increase the available water resources, building water storage facilities to meet water demand in these locations. Class-3 covers the parts of the middle Jaguaribe, low Jaguaribe, Acaraú, Curú, and Sertões do Crateús hydrographic regions. When water demand exceeds capacity, the development and management of resources are required to increase supply, especially for irrigated areas in the Baixo Jaguaribe. The area corresponds to 34.4% (23,635 ha) of the state’s irrigated area [43].
The ACWM presented the most favorable result for Class-3. It is possible to say that the Banabuiú and Castanhão reservoirs have a strong influence on that value since both reservoirs have a capacity of 1600 hm3 and 6700 hm3, respectively. Banabuiú is considered within Class-3 because of its dam. However, part of its water body is within Class-1. It is also necessary to highlight the most important canal of Ceará, called Integração Canal, which is responsible for transporting water from Castanhão to the Metropolitana hydrographic region. Although the area has the most favorable adaptive capacity within the state of Ceará, that does not necessarily mean that it can deal with highly severe drought periods. Other factors such as illegal water abstractions and high water demand may also make an area with a high adaptive capacity vulnerable to extended dry spells.
Finally, Class-4 occurs in coastal regions, encompassing the Coreaú, Litoral, Curú, and Serra da Ibiapaba regions, and part of the Acaraú region. There is a large amount of rain with significant variability. Water infrastructure is even less developed in this area than the area contained by Class-1, and it is mainly composed of reservoirs rather than canals. Most rainfall volume is concentrated mainly at certain times of the year, which might justify storing the excess rainfall and efficient water management in the reservoirs.
Within the classes, it is notable that there is a territorial fragmentation of adaptive capacity infrastructure, as illustrated previously in Figure 4. This fragmentation is not conditioned only by natural characteristics but mainly by human decisions influenced by economic and social conditions. Class-2 presents two main areas: the northern area and the southern area. The northern area has a higher density of water infrastructure due to the intense industrial activities and to being the region with the highest population density of the state, as explained earlier in this section. The eastern areas of Class-3 and Class-4 also present a higher density of water infrastructure due to irrigated perimeters and shrimp farms. Adaptive capacity is a demand imposed by natural conditions to guarantee society’s welfare, but its application is a human decision influenced by economic, social, and even political aspects.
Based on the adaptive capacity and variability analyses, it is essential to provide recommendations for future works and research. First, the water management process is conducted with the state’s hydrographic region division, made using regions with similar social–economical and water resource characterization. During our classification process, through the variability of precipitation, it can be observed that many hydrographic regions fall within the same classification. Thus, the transparency of water management and planning with these regions could be beneficial to one another. In addition, the classification of vulnerable areas is of great importance for decision-makers, and practitioners should integrate this information into planning and decision-making process [44].
Furthermore, for every classification and its corresponding ACWM, a list of potential response strategies to cope with water scarcity can be created according to the associated risk that these regions might be exposed to and shared within a similar region to fortify the decision process. This proposed response should be further developed during meetings regarding the allocation process, or in consultation with local stakeholders, decision-makers, and the on-site scientific community to ensure context- and location-specific solutions are identified. Potential strategies fall into three main categories: measures to prevent or mitigate reductions in water availability (supply-oriented), approaches aimed at reducing water demand by enhancing efficiency (demand- and efficiency-oriented), and the implementation of structural adjustments through improvements in water resource infrastructure. Additionally, the development of responses, best practices, and strategies should carefully consider and address constraints such as water supply conditions, the availability of financial capital for expanding local infrastructure, and potential areas of policy overlap. According to Kundzewicz et al. (2018) [45], legal rules and policy are the most open to uncertainty when infrastructure does not yet exist, whereas the adaptation of existing infrastructure is a more complex matter. Lastly, setting targets for ACWM establishes a timeline for expanding water infrastructure. This approach also ensures that involved parties can be monitored regarding goal achievement and are prepared for potential extended periods of drought in the region. Additionally, monitoring and evaluating the ACWM should be conducted in the case of new infrastructure construction. These actions will help comprehend the vulnerability and variability to which the region is exposed.
It is important to emphasize that the ACWM is limited to physical infrastructures (reservoirs and canals). Although governance arrangements, social participation, and economic resources also play a major role in adaptive capacity, they are difficult to quantify spatially and were beyond the scope of this analysis. Thus, the ACWM should be interpreted as a proxy of the structural dimension of adaptive capacity. Future research could complement this assessment by incorporating institutional and socio-economic indicators to provide a more comprehensive evaluation.
We evaluate that systems with different characteristics and complexities can be addressed by adopting several potential responses and a combination of several policy enforcements as it is difficult to provide one ‘best’ solution that addresses the issues surrounding the characteristics of the different areas. Such an approach could potentially be included in the current water management strategy, allowing stakeholders to compare and help each other in the decision-making process of similar areas. More importantly, it would allow disseminating information through a quantitative methodology that evaluates important concepts in water resource modeling. It could also improve water resource management through its adaptive management. While our stratification highlights typical regime differences, we did not evaluate temporal trends or climate change influences. Future work could test for non-stationarity (e.g., trend diagnostics or sub-period contrasts) and assess the robustness of classes under a changing climate.
From the classification and ACWM results, it is possible to derive practical recommendations that can guide future improvements in Ceará’s water management system. These recommendations are not intended to be exhaustive solutions, but rather illustrative examples of measures that could be explored in greater detail and evaluated in future studies. For instance, Class-1 regions, where both rainfall and adaptive capacity are low, would benefit from prioritizing the expansion or reinforcement of reservoir infrastructure to mitigate the impacts of recurrent droughts. In Class-4 regions, where rainfall is abundant but infrastructure is sparse, extending canal systems could improve the redistribution of water stored in reservoirs and enhance regional water security. Finally, in Class-3 regions, which show strong adaptive capacity due to major reservoirs and canals but remain exposed to severe climatic stress, improvements in monitoring and allocation mechanisms would be essential to optimize the use of existing infrastructure. Together, these directions highlight how the combination of rainfall variability analysis and adaptive capacity assessment can support more effective and targeted adaptive management strategies.

4. Conclusions

The spatial distribution of rainfall coupled with human interactions directly affects the availability of water resources. Extreme events such as droughts are of great concern in water-scarce regions, as it introduces significant impacts on our water resources and environment, particularly for water allocation. Such phenomena require expanding infrastructure for water supply and adequate water resource management to relieve the stress applied to water systems. The proper planning and management of water resources are challenging tasks due to difficulties in modeling the hydroclimatic aspects and socio-economic, cultural, and institutional factors that directly influence water availability.
In order to account for variability and vulnerability in a semiarid region, we presented a methodological approach that separates areas that have similar water availability using an entropy-based method, as well as the adaptive capacity of each area based on the water resource infrastructure available, indicating the influence of natural and anthropogenic factors on water resources. Furthermore, based on this assessment, some recommendations align with the adaptive management concept to improve the current water allocation system.
The results show that the worst scenario, presenting high variability and low rainfall and named Class-3, encompasses almost 30% of the entire state area. Even though this class showed the most favorable adaptive capacity, the constraints imposed by the highly variable precipitation pattern inflict great stress on the current infrastructure available compared with the other classes. Class-3 presented the highest Adaptive Capacity for Water Management (ACWM) values due to the presence of the two largest reservoirs in Ceará (Castanhão and Banabuiú) and major canal infrastructure. However, this does not imply that Class-3 is the least vulnerable. On the contrary, this class is exposed to the worst climatic conditions, characterized by below-average rainfall and high variability. Therefore, while the adaptive capacity is structurally favorable, the climatic stress remains extreme, requiring continuous management attention to balance water availability and demand.
The best scenario is Class-1, which is characterized by low variability and above-average rainfall. This area corresponds to 18% of the state and has an average adaptive capacity mainly linked to supply needs by the northern area, which is densely populated.
Furthermore, for the water systems to cope with the risk of being variable and vulnerable, they need strategies. Thus, to improve the current management system, the same classification areas could have more transparency in the decision process and learn from one another. Also, selecting responses, best practices, and strategies for areas within the classification would help prepare areas exposed to risk during extreme events. Nonetheless, monitoring the state’s variability and adaptive capacity would improve water resources’ adaptive management in this dynamic environment. In summation, our framework operationalizes the measurement and monitoring of sustainability in water resources (SVIAE/ACWM) and offers transdisciplinary bridges between hydrology, infrastructure planning, and governance.

Author Contributions

G.d.A.R.: Conceptualization, Methodology, Formal analysis, Investigation, Writing—original draft, Supervision. L.Z.R.R.: Conceptualization, Methodology, Formal analysis, Investigation, Writing—original draft. T.M.d.C.S.: Conceptualization, Methodology, Formal analysis, Investigation, Writing—original draft, Writing—review and editing, Supervision. S.M.O.d.S.: Formal analysis, Investigation, Writing—review and editing, Supervision. F.d.A.d.S.F.: Methodology, Formal analysis, Investigation, Writing—review and editing. M.A.M.R.: Investigation, Writing—review and editing. All authors have read and agreed to the published version of the manuscript.

Funding

This research was funded by the Fundação Cearense de Apoio ao Desenvolvimento Científico e Tecnológico—FUNCAP (Ceará Foundation for the Support of Scientific and Technological Development—Brazil), under the Universal Call No. 06/2023—FUNCAP Universal (number UNI-0210-00316.01.00/23), project title “Climate Change, Adaptation, and Water Use Conflicts: New Instruments for Adaptive Water Governance.” Additional support was provided by the Conselho Nacional de Desenvolvimento Científico e Tecnológico—CNPq (National Council for Scientific and Technological Development—Brazil), grant number 314861/2023-8.

Institutional Review Board Statement

Not applicable.

Informed Consent Statement

Not applicable.

Data Availability Statement

The raw data supporting the conclusions of this article will be made available by the authors on request.

Acknowledgments

This article contributes to the Programa Cientista Chefe—Recursos Hídricos, coordinated by the Fundação Cearense de Apoio ao Desenvolvimento Científico e Tecnológico (FUNCAP—Ceará Foundation for the Support of Scientific and Technological Development).

Conflicts of Interest

The authors declare no conflicts of interest. The funders had no role in the design of the study; in the collection, analyses, or interpretation of data; in the writing of the manuscript; or in the decision to publish the results.

References

  1. Cirilo, J.A.; Montenegro, S.M.G.L.; Campos, J.N.B. The Issue of Water in the Brazilian Semi-Arid Region. In Waters of Brazil; Springer International Publishing: Cham, Switzerland, 2017; pp. 59–71. [Google Scholar]
  2. Ledru, M.-P.; Jeske-Pieruschka, V.; Bremond, L.; Develle, A.-L.; Sabatier, P.; Martins, E.S.P.R.; de Freitas Filho, M.R.; Fontenele, D.P.; Arnaud, F.; Favier, C.; et al. When Archives Are Missing, Deciphering the Effects of Public Policies and Climate Variability on the Brazilian Semi-Arid Region Using Sediment Core Studies. Sci. Total Environ. 2020, 723, 137989. [Google Scholar] [CrossRef]
  3. Rolim, L.; de Souza Filho, F. Shift Detection in Hydrological Regimes and Pluriannual Low-Frequency Streamflow Forecasting Using the Hidden Markov Model. Water 2020, 12, 2058. [Google Scholar] [CrossRef]
  4. Hasselman, L. Adaptive Management; Adaptive Co-Management; Adaptive Governance: What’s the Difference? Australas. J. Environ. Manag. 2017, 24, 31–46. [Google Scholar] [CrossRef]
  5. Pachauri, R.; Meyer, L. IPCC Climate Change Synthesis Report (2014) Topic 2 Future Climate Changes Risks and Impacts. Contribution of Working Groups I, II and III to the Fifth Assessment Report of the Intergovernmental Panel on Climate Change; IPCC: Geneva, Switzerland, 2014. [Google Scholar]
  6. de Azevedo Reis, G.; de Souza Filho, F.A.; Nelson, D.R.; Rocha, R.V.; da Silva, S.M.O. Development of a Drought Vulnerability Index Using MCDM and GIS: Study Case in São Paulo and Ceará, Brazil. Nat. Hazards 2020, 104, 1781–1799. [Google Scholar] [CrossRef]
  7. Simha, P.; Mutiara, Z.Z.; Gaganis, P. Vulnerability Assessment of Water Resources and Adaptive Management Approach for Lesvos Island, Greece. Sustain. Water Resour. Manag. 2017, 3, 283–295. [Google Scholar] [CrossRef]
  8. Kabat, P.; Schulze, R.E.; Hellmuth, M.E.; Veraart, J.A. (Eds.) Coping with Impacts of Climate Variability and Climate Change in Water Management: A Scoping Paper; DWC-Report No. DWCSSO-01; International Secretariat of the Dialogue on Water and Climate: Wageningen, The Netherlands, 2003. [Google Scholar]
  9. Tongal, H.; Sivakumar, B. Entropy Analysis for Spatiotemporal Variability of Seasonal, Low, and High Streamflows. Stoch. Environ. Res. Risk Assess. 2019, 33, 303–320. [Google Scholar] [CrossRef]
  10. Mesfin, D.; Simane, B.; Belay, A.; Recha, J.W.; Schmiedel, U. Assessing the Adaptive Capacity of Households to Climate Change in the Central Rift Valley of Ethiopia. Climate 2020, 8, 106. [Google Scholar] [CrossRef]
  11. Räsänen, A.; Juhola, S.; Nygren, A.; Käkönen, M.; Kallio, M.; Monge Monge, A.; Kanninen, M. Climate Change, Multiple Stressors and Human Vulnerability: A Systematic Review. Reg. Environ. Change 2016, 16, 2291–2302. [Google Scholar] [CrossRef]
  12. Benson, D.; Lorenzoni, I. Climate Change Adaptation, Flood Risks and Policy Coherence in Integrated Water Resources Management in England. Reg. Environ. Change 2017, 17, 1921–1932. [Google Scholar] [CrossRef]
  13. Decker, K.L.; Fink, M.M.; Rondeau, R.J. Triangulation in Climate Change Vulnerability Assessment: Examples from Colorado, USA. Reg. Environ. Change 2017, 17, 2467–2475. [Google Scholar] [CrossRef]
  14. Mateus, M.C.; Tullos, D. Reliability, Sensitivity, and Vulnerability of Reservoir Operations under Climate Change. J. Water Resour. Plan. Manag. 2017, 143, 04016085. [Google Scholar] [CrossRef]
  15. Vargas, J.; Paneque, P. Methodology for the Analysis of Causes of Drought Vulnerability on the River Basin Scale. Nat. Hazards 2017, 89, 609–621. [Google Scholar] [CrossRef]
  16. Anandhi, A.; Kannan, N. Vulnerability Assessment of Water Resources—Translating a Theoretical Concept to an Operational Framework Using Systems Thinking Approach in a Changing Climate: Case Study in Ogallala Aquifer. J. Hydrol. 2018, 557, 460–474. [Google Scholar] [CrossRef]
  17. Schilling, J.; Hertig, E.; Tramblay, Y.; Scheffran, J. Climate Change Vulnerability, Water Resources and Social Implications in North Africa. Reg. Environ. Change 2020, 20, 15. [Google Scholar] [CrossRef]
  18. Lebel, L.; Manuta, J.B.; Garden, P. Institutional Traps and Vulnerability to Changes in Climate and Flood Regimes in Thailand. Reg. Environ. Change 2011, 11, 45–58. [Google Scholar] [CrossRef]
  19. Tucker, J.; Daoud, M.; Oates, N.; Few, R.; Conway, D.; Mtisi, S.; Matheson, S. Social Vulnerability in Three High-Poverty Climate Change Hot Spots: What Does the Climate Change Literature Tell Us? Reg. Environ. Change 2015, 15, 783–800. [Google Scholar] [CrossRef]
  20. De Souza, K.; Kituyi, E.; Harvey, B.; Leone, M.; Murali, K.S.; Ford, J.D. Vulnerability to Climate Change in Three Hot Spots in Africa and Asia: Key Issues for Policy-Relevant Adaptation and Resilience-Building Research. Reg. Environ. Change 2015, 15, 747–753. [Google Scholar] [CrossRef]
  21. Fuentes-Castillo, T.; Hernández, H.J.; Pliscoff, P. Hotspots and Ecoregion Vulnerability Driven by Climate Change Velocity in Southern South America. Reg. Environ. Change 2020, 20, 27. [Google Scholar] [CrossRef]
  22. Lemos, M.C.; Puga, B.P.; Formiga-Johnsson, R.M.; Seigerman, C.K. Building on Adaptive Capacity to Extreme Events in Brazil: Water Reform, Participation, and Climate Information across Four River Basins. Reg. Environ. Change 2020, 20, 53. [Google Scholar] [CrossRef]
  23. Annys, S.; Demissie, B.; Abraha, A.Z.; Jacob, M.; Nyssen, J. Land Cover Changes as Impacted by Spatio-Temporal Rainfall Variability along the Ethiopian Rift Valley Escarpment. Reg. Environ. Change 2017, 17, 451–463. [Google Scholar] [CrossRef]
  24. Harmanny, K.S.; Malek, Ž. Adaptations in Irrigated Agriculture in the Mediterranean Region: An Overview and Spatial Analysis of Implemented Strategies. Reg. Environ. Change 2019, 19, 1401–1416. [Google Scholar] [CrossRef]
  25. Haghtalab, N.; Moore, N.; Ngongondo, C. Spatio-Temporal Analysis of Rainfall Variability and Seasonality in Malawi. Reg. Environ. Change 2019, 19, 2041–2054. [Google Scholar] [CrossRef]
  26. Mishra, A.K.; Özger, M.; Singh, V.P. An Entropy-Based Investigation into the Variability of Precipitation. J. Hydrol. 2009, 370, 139–154. [Google Scholar] [CrossRef]
  27. Zhang, Q.; Zheng, Y.; Singh, V.P.; Xiao, M.; Liu, L. Entropy-based Spatiotemporal Patterns of Precipitation Regimes in the Huai River Basin, China. Int. J. Climatol. 2016, 36, 2335–2344. [Google Scholar] [CrossRef]
  28. Su, H.-T.; You, G.J.-Y. Developing an Entropy-Based Model of Spatial Information Estimation and Its Application in the Design of Precipitation Gauge Networks. J. Hydrol. 2014, 519, 3316–3327. [Google Scholar] [CrossRef]
  29. Agarwal, A.; Maheswaran, R.; Sehgal, V.; Khosa, R.; Sivakumar, B.; Bernhofer, C. Hydrologic Regionalization Using Wavelet-Based Multiscale Entropy Method. J. Hydrol. 2016, 538, 22–32. [Google Scholar] [CrossRef]
  30. Guntu, R.K.; Rathinasamy, M.; Agarwal, A.; Sivakumar, B. Spatiotemporal Variability of Indian Rainfall Using Multiscale Entropy. J. Hydrol. 2020, 587, 124916. [Google Scholar] [CrossRef]
  31. da Silva, V.d.P.R.; Belo Filho, A.F.; Rodrigues Almeida, R.S.; de Holanda, R.M.; da Cunha Campos, J.H.B. Shannon Information Entropy for Assessing Space–Time Variability of Rainfall and Streamflow in Semiarid Region. Sci. Total Environ. 2016, 544, 330–338. [Google Scholar] [CrossRef]
  32. Bekchanov, M.; Lamers, J.P.A. Economic Costs of Reduced Irrigation Water Availability in Uzbekistan (Central Asia). Reg. Environ. Change 2016, 16, 2369–2387. [Google Scholar] [CrossRef]
  33. Brahmananda Rao, V.; de Lima, M.C.; Franchito, S.H. Seasonal and Interannual Variations of Rainfall over Eastern Northeast Brazil. J. Clim. 1993, 6, 1754–1763. [Google Scholar] [CrossRef]
  34. Hastenrath, S. Exploring the Climate Problems of Brazil’s Nordeste: A Review. Clim. Change 2012, 112, 243–251. [Google Scholar] [CrossRef]
  35. Marengo, J.A.; Torres, R.R.; Alves, L.M. Drought in Northeast Brazil—Past, Present, and Future. Theor. Appl. Climatol. 2017, 129, 1189–1200. [Google Scholar] [CrossRef]
  36. Kayano, M.T.; Andreoli, R.V.; de Souza, R.A.F. Pacific and Atlantic Multidecadal Variability Relations to the El Niño Events and Their Effects on the South American Rainfall. Int. J. Climatol. 2020, 40, 2183–2200. [Google Scholar] [CrossRef]
  37. Garreaud, R.D.; Vuille, M.; Compagnucci, R.; Marengo, J. Present-Day South American Climate. Palaeogeogr. Palaeoclimatol. Palaeoecol. 2009, 281, 180–195. [Google Scholar] [CrossRef]
  38. Andreoli, R.V.; Kayano, M.T. ENSO-Related Rainfall Anomalies in South America and Associated Circulation Features during Warm and Cold Pacific Decadal Oscillation Regimes. Int. J. Climatol. 2005, 25, 2017–2030. [Google Scholar] [CrossRef]
  39. Silva, S.M.O.d.; Souza Filho, F.d.A.; Aquino, S.H.S. Avaliação Do Risco Da Alocação de Água Em Período de Escassez Hídrica: O Caso Do Sistema Jaguaribe-Metropolitano. Eng. Sanit. Ambient. 2017, 22, 749–760. [Google Scholar] [CrossRef]
  40. Maruyama, T.; Kawachi, T.; Singh, V.P. Entropy-Based Assessment and Clustering of Potential Water Resources Availability. J. Hydrol. 2005, 309, 104–113. [Google Scholar] [CrossRef]
  41. Rolim, L.Z.R.; da Silva, S.M.O.; de Assis de Souza Filho, F. Analysis of precipitation dynamics at different timescales based on entropy theory: An application to the State of Ceará, Brazil. Stoch. Environ. Res. Risk Assess. 2022, 36, 2285–2301. [Google Scholar] [CrossRef]
  42. Kawachi, T.; Maruyama, T.; Singh, V.P. Rainfall Entropy for Delineation of Water Resources Zones in Japan. J. Hydrol. 2001, 246, 36–44. [Google Scholar] [CrossRef]
  43. Girão, A.R.; Dutra, I.; de Souza, F. Área irrigada e métodos Área irrigada e métodos de irrigação no Estado do Ceará, de irrigação no Estado do Ceará, segundo o Censo Agropecuário de 1995-1996. Rev. Bras. Eng. Agríc. Ambient. 2001, 5, 161–165. [Google Scholar] [CrossRef]
  44. Höllermann, B.; Evers, M. Integration of uncertainties in water and flood risk management. Proc. IAHS 2015, 370, 193–199. [Google Scholar] [CrossRef]
  45. Kundzewicz, Z.W.; Krysanova, V.; Benestad, R.E.; Hov, Ö.; Piniewski, M.; Otto, I.M. Uncertainty in climate change impacts on water resources. Environ. Sci. Policy 2018, 79, 1–8. [Google Scholar] [CrossRef]
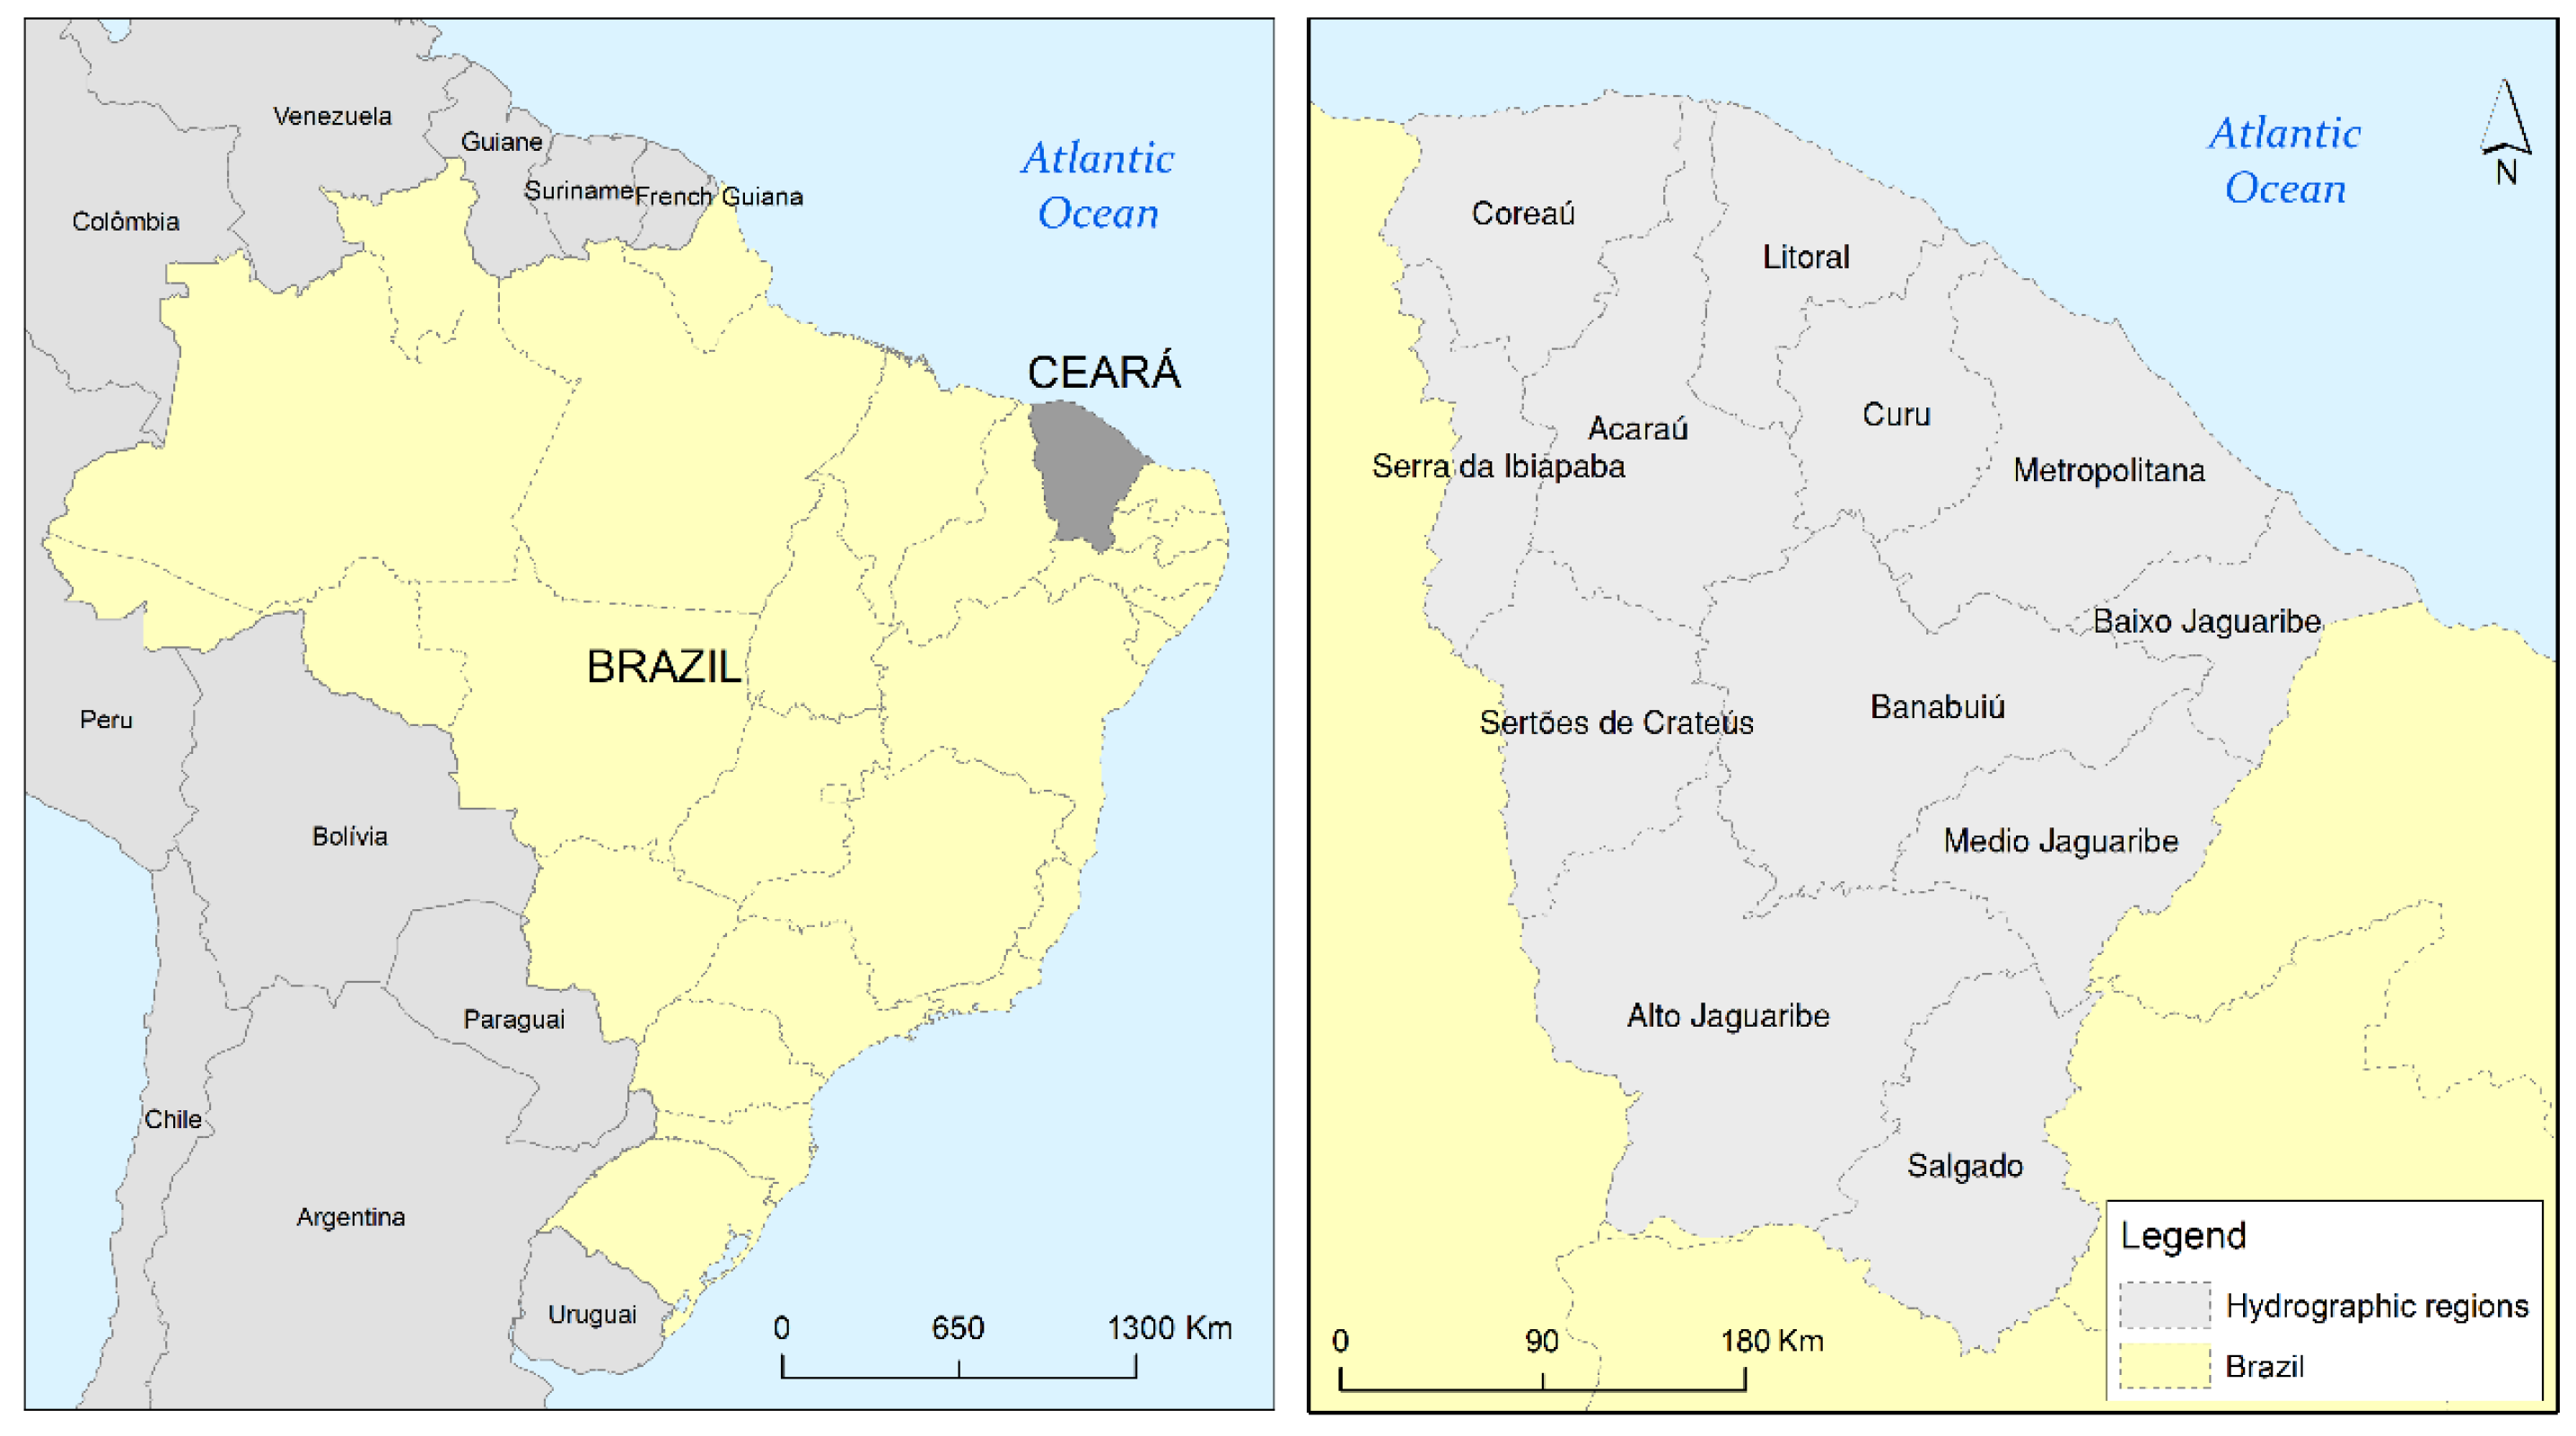
Figure 1. Location map of Ceará and its hydrographic regions.
Sustainability 17 09147 g001
Figure 2. Average annual precipitation (mm yr−1) across Ceará (1911–2017). Dots mark the rain gauge locations used for spatial interpolation.
Sustainability 17 09147 g002
Figure 3. Regions are divided into four classes according to their spatial rainfall variability.
Sustainability 17 09147 g003
Figure 4. Map of the classes generated from entropy and rainfall, exhibiting main canals and reservoirs.
Sustainability 17 09147 g004
Table 1. Water storage capacity of the main reservoirs and the state of Ceará.
ReservoirWater Storage Capacity (hm3)Hydrographic Region
Banabuiú1601Banabuiú
Castanhão6700Médio Jaguaribe
Orós1940Alto Jaguaribe
The State of Ceará18,759.90-
Table 2. The region’s classification is based on the average annual precipitation and standard apportionment entropy (SVIAE).
ClassVariability (SVIAE)Average Annual Precipitation
1Below AverageBelow Average
2Below AverageAbove Average
3Above AverageBelow Average
4Above AverageAbove Average
Table 3. The Adaptive Capacity for Water Management Index for each class of spatial rainfall variability.
ClassReservoirs Capacity (hm3)Transportation Network Length (km)Area (km2)ACWM
13872.30449.9545,627.40.178
21463.40641.6126,117.60.332
311,030.20567.0742,431.80.431
42394.00771.0234,833.80.321
Disclaimer/Publisher’s Note: The statements, opinions and data contained in all publications are solely those of the individual author(s) and contributor(s) and not of MDPI and/or the editor(s). MDPI and/or the editor(s) disclaim responsibility for any injury to people or property resulting from any ideas, methods, instructions or products referred to in the content.