Article

Effects of River Migration and Water-Sediment Regulation Scheme on Total Nitrogen Transport in the Yellow River Estuary

1
Bureau of Hydrology, Changjiang Water Resources Commission, Wuhan 430010, China
2
State Key Laboratory of Hydrology-Water Resources and Hydraulic Engineering, Nanjing Hydraulic Research Institute, Nanjing 210029, China
3
State Key Laboratory of Water Cycle and Water Security, College of Water Conservancy and Hydropower Engineering, Hohai University, Nanjing 210024, China
*
Authors to whom correspondence should be addressed.
Sustainability 2025, 17(20), 9145; https://doi.org/10.3390/su17209145
Submission received: 31 July 2025 / Revised: 11 October 2025 / Accepted: 13 October 2025 / Published: 15 October 2025
(This article belongs to the Section Sustainable Water Management)

Abstract

River migration and anthropogenic controls on hydrological processes may play important roles in estuarine system transformations and nutrient diffusion. We used a two-dimensional shallow water equation hydrodynamic water quality model to simulate total nitrogen (TN) transport under the situations of river migration and the “Water-Sediment Regulation Scheme” (WSRS). The results showed the following: (1) River migration changed the diffusion direction of high-TN-concentration water in the YRE from the east–west diffusion in 2009 to the north–south diffusion in 2019. (2) In the years the WSRS was active, the maximum diffusion distance of high-concentration-TN water is basically the same as that of the plume edge. In 2009 and 2019, it was 30 km in the southeast of the estuary and 26.5 km in the north. Concentrations of 0.5 mg/L and 1.05 mg/L in 2009 and 2019 can be used as the threshold for judging the farthest distance of diffusion. (3) In the years without the WSRS, the TN concentration in the YRE from June to July was generally lower than the same period in 2019, and the northward diffusion distance of high-concentration-TN water in 2017 was only 10% of that during the WSRS in 2019. (4) Runoff determines the diffusion range of TN in the YRE. The average runoff during the WSRS in 2019 was 6.88 times that of the same period in 2017, and the high concentration diffusion distance of TN in 2019 was 10 times that of 2017. Changes in estuary morphology determine the diffusion direction of nutrients. The results of this paper are helpful to further understand the nutrient diffusion law of estuaries and coasts under the influence of different factors, and to provide reference for the protection of water quality safety.

1. Introduction

Large rivers have an impact on the aquatic ecology of estuarine and coastal areas by transporting a large amount of particulate matter and dissolved matter from land to sea [1]. The estuary is a transitional zone connecting freshwater and seawater, which is greatly affected by terrestrial runoff into the sea [2]. In recent years, with the intensification of human activities on the land and the construction of water conservancy projects, many estuaries in the world have shown a trend of reduced freshwater runoff, erosion, and high nutrient load [3,4]. Among the various nutrients in estuarine and coastal waters, nitrogen is widely explored as it is related to many related environmental processes [5]. Eutrophication is one of the most important environmental problems in estuarine and coastal waters, and nitrogen is the primary factor causing eutrophication. Adverse impacts on the estuarine ecosystem by anthropogenic activities have been widely reported; studies and management of the estuarine environments have gained more and more attention in recent decades [6,7,8].
The Bohai sea is a semi-enclosed water area located in the northwest Pacific Ocean, which is connected to the Yellow Sea (Huanghai) through the narrow Bohai Strait in China. The area of the Bohai Sea is about 77 × 109 m2, and the average depth is about 18.7 m. Many rivers which are greatly affected by human activities are discharged into the Bohai Sea. The total annual discharge is 68.5 × 10⁹ m3, of which the discharge of the Yellow River accounts for more than 75% [9,10]. The Yellow River is one of the rivers with the largest sediment discharges in the world. From the 1950s to 1970s, about 1.08 × 10⁹ tons of sediment was transported into the Bohai Sea by the Loess Plateau in the middle reaches of the Yellow River every year due to high soil erosion [11]. The large amount of sediment sources also makes the Yellow River Estuary (YRE) one of the most turbid regions in the world [12,13]. In recent decades, due to the intensification of anthropogenic activities including soil and water conservation projects [14], and the Water-Sediment Regulation Scheme (WSRS) [15], the pattern of water and sediment transport in the lower reaches of the Yellow River has changed significantly. The maximum amount of water and sediment in a year caused by the WSRS in the Yellow River Basin was reached nearly two months earlier than that in the previous period [16]. During the period of the WSRS, the area of estuarine freshwater diffusion exceeded 700 km2, which was nearly 15 times higher than that in the previous years without the implementation of water and sediment regulation [17]. However, there are relatively few studies on the diffusion law of nutrients in the YRE with regard to water and sediment regulation. The implementation of these projects has also changed the temporal pattern of estuarine hydrological processes [14]. It is necessary to explore the effects of human activities such as the WSRS on the temporal and spatial diffusion and exchange of nutrients in the YRE.
Moreover, the influence of shoreline changes on hydrodynamic and water quality is an important research issue that has received significant attention. It is critical for understanding the pathway of freshwater runoff and nutrient load under the river channel migration in the YRE. In addition, in recent years, the shoreline morphology of the YRE has also undergone significant changes [18]. There are also temporal and spatial differences in the migration and diffusion state of the Yellow River carrying nutrient pulse runoff near the estuary [19]. However, there are few studies on the effect of shoreline morphological changes on the migration and diffusion of nutrients in the YRE. Since that time, several significant changes have occurred that directly affect the sediment dispersal pattern of the YRE: (1) The deltaic course shifted significantly in 1996, and the river mouth moved approximately 20 km northeast of the old river mouth. (2) The annual water and sediment discharges from the Yellow River into the Bohai Bay were recorded at the Lijin Gauge (some 100 km upstream from the river mouth). In 2024, the annual sediment discharge at Lijin station was 255.3 × 10⁸ m3/s, which was not much different from the multi-year average from 1952 to 2023 (288.6 × 10⁸ m3/s). The average annual sediment discharge is 1.59 × 10⁸ t, which is lower than the multi-year average of 6.38 × 10⁸ t. (3) The Yellow River water and sediment discharges into the sea have been controlled since 2000 by the operation of the Xiaolangdi Reservoir, the largest reservoir in the mainstream, through the Project of “Artificial Regulation of the Yellow River Water and Sediment” [20,21]. This project determined that high water and sediment discharges into the sea are regulated, and only occur once or twice a year for periods of nearly 15–30 days to scour the riverbed and transport a relatively large amount of sediment into the sea. As a result, low water flow with low sediment discharge into the sea is now the dominant and normal hydrographic regime for the sediment transport of the present sub-delta and the low water discharge in this study. These recent changes have altered the boundary conditions and the seasonal allocation of water and sediment in a year, which have significant impacts on the dispersion of sediment of the present sub-delta.
In situ measurement of nutrient concentration is a common method to evaluate the nutrient level near the estuary [22]. However, this method usually has the disadvantages of being time-consuming, labor-intensive, and high cost, and this method can only reflect the nutrient content in a certain period of time. In view of the typical wide area of the estuary, numerical simulation is another important method to evaluate the nutrient level in the estuary. The basis of water quality simulation is hydrodynamic simulation. Many hydrodynamic models have been developed for ocean research, such as Princeton Ocean Model-POM, the Finite Volume Coastal Ocean Model-FVCOM, Estuarine, Coastal Ocean Model with Sediment Transport-ECOMSED, Delft3D, and MIKE products by DHI [23,24]. The unstructured finite-volume technique is the mainstream method for numerical solution of shallow water equations in solving complex terrain problems in hydraulics [25]. This algorithm has been widely used in tracking water masses, pollutants, and sediments [25]. Therefore, the establishment of a hydrodynamic water quality model by this algorithm helps us to understand the diffusion process of nutrients in offshore waters.
A two-dimensional shallow water equation hydrodynamic model based on the average water depth is set up in this study to simulate the diffusion process of TN in the YRE. We selected different flow regimes in the YRE and the years with and without the WSRS to compare the TN diffusion in the estuary. The main objectives of this study include the following: (1) to explore the influence of river migration on the direction and range of TN diffusion; (2) to explore the characteristics of TN diffusion before, during, and after the WSRS; (3) to compare the diffusion characteristics of TN for the years with and without the WSRS in the YRE.

2. Materials and Methods

2.1. Study Area

The Bohai Sea (BS) is an inland shallow sea that covers an area of about 77,000 km2 with an average water depth of 18 m. A total of 55 rivers flow into the Bohai Sea. The Bohai Sea consists of four parts: Liaodong Bay, Bohai Bay, Laizhou Bay, and the central area. These rivers account for more than 80% of the total freshwater discharge and belong to the Yellow, Haihe, and Liaohe river basins. Among them, the Yellow River contributes over 75% of the total freshwater input to the Bohai Sea and is the second-longest river in China [26]. It brings in a total of approximately 155 × 108 m3 of freshwater per year into the Bohai Sea (mean value during 1987–2005 at Lijin Station).
The YRE is weakly tidal (Wang, 2017), with an average tidal range of 0.73–1.77 m [27]. The tides in the YRE are formed by the superposition of the diurnal and semi-diurnal tides [28], resulting in the coexistence of irregular semi-diurnal tides, irregular diurnal tides, and regular diurnal tides. Tidal currents are generally reciprocal currents with a tidal velocity of 0.5–1.0 m/s, running parallel to the coastline and flowing south at flood tide and north at ebb tide [27]. Waves in the estuary usually are caused by the southern wind in the summer and the northern wind in the winter, with an average wave height of 1.5 m, which enhances the resuspension of sediments along the YRE coast [21].
In the Yellow River Delta (YRD), the flow courses of the Yellow River have shifted frequently. Since 1964, it has been at the deltaic channel followed by the Diaokouhe channel (1964–1976), the Qingshuigou channel (1976–1996), then artificially shifted at Qingba channel (1996–2007), and is presently at the Qingbacha mouth channel (2007–present) [9] (Figure 1). The suspended matter in the estuary is dominated first by silt and then by clay; the lowest proportion of suspended matter is ultrafine sand [27].

2.2. Data

The Lijin hydrological gauging station is located in the village of Liujiahe, Lijin town, Dongying city, which is approximately 100 km upstream from the mouth of the YRE. It is the last hydrological station before the Yellow River enters the Bohai Sea and has been monitoring the daily amounts of runoff and sediment since 1950. Therefore, the daily monitoring runoff and sediment data for the Lijin station from 1976 to 2018 were used in this study. Monthly runoff and sediment data were calculated by accumulating daily runoff and sediment, and the annual runoff and sediment were calculated by accumulating monthly runoff and sediment. The daily freshwater discharge (Qw) and SSC during the artificial flood and the monthly data of water and sediment fluxes to the sea were obtained from the Sediment Bulletin of the Yellow River Conservancy Commission (YRCC).
Data on freshwater discharges from the Yellow River was obtained from the regularly issued China River Sediment Bulletin (MWR, 2000–2017), published papers [2], and a monograph [29]. The data for the Yellow River were collected at the Lijin hydrometric station. Nutrient (N, P, and Si) fluxes were collected from the China Environment Bulletin (MEE, 1989–2017), a published monograph [29], and previous studies [30,31]. Yearly averaged data of nutrient fluxes were used to represent the long-term variations. Data pertaining to the red tide of the BS were collected and compiled from the regularly issued China Marine Disaster Bulletin (COIN, 2000–2017) and previously published papers [29,32].

2.3. Numerical Model

2.3.1. Model Description

The topological dimensions of the Bohai Bay in the plane are more than 340 km, and the average water depth in the vertical direction is only about 18 m. For large-scale free surface flow in a plane, where the water depth scale is much smaller than the plane scale, there is no obvious vertical circulation, and the vertical velocity is small in shallow water; the hydrostatic pressure assumption can be introduced and the equation can be simplified by integrating along the water depth direction. Therefore, a depth-averaged two-dimensional shallow water model, HGPU2D, was employed to simulate the hydrodynamic processes in the Bohai Bay under the influence of limited freshwater discharge, astronomical tides, and ocean currents [33]. This model has been effectively applied to simulate environmental processes in coastal systems with complex topography, such as estuaries [34,35,36]. The hydrodynamic control equation of the model is:
U t + E U x + H U y = S ( U )
Among them, U t , U x , and U y are the partial derivatives with respect to time and the space plane in the x and y directions, respectively.
U = h h u h v ,   E = h u h u 2 + 1 2 g h 2 h u v ,   H = h v h u v h v 2 + 1 2 g h 2 ,   S = 0 g h ( S f x + S 0 x ) g h ( S f y + S 0 y )
where h is water depth; u is the velocity in x direction; v is the velocity in y direction; S 0 x , S 0 y , S f x , and S f y are the bottom slope source term and bottom friction source term in the x and y directions, respectively, which can be expressed as
S 0 x = Z b x ,   S 0 y = Z b y
S f x = n 2 u u 2 + v 2 h 4 / 3 ,   S f y = n 2 v u 2 + v 2 h 4 / 3
where n is the roughness, Z b is the river bottom elevation.
The water quality module in the model is based on the momentum equation. This module only considers the dilution and diffusion process of total nitrogen by water flow, and does not consider the biochemical reaction of total nitrogen in water. The integral transport equation along the water depth direction is:
h C t + h u C x + h v C y = x h ( μ c + μ m ) C x + y h ( μ c + μ m ) C y + S ( C )
where μ c and μ m are the dispersion caused by the uneven flow velocity and transport material along the horizontal line. μ c and μ m are parameterized by the Smagorinsky method [37]. The present model implies the Smagorinsky turbulent closure with a constant of 0.2 to parameterize horizontal diffusion of momentum and TN. S C is the source term of the transport variable.
The model domain was discretized using the finite volume method in the Godunov format, the conserved variables were stored in the center of each mesh cell, the calculation of the flux on each surface was based on Roe’s approximate Riemann solution, and the time integration was performed using the second-order TVD Runge–Kutta method [33]. Additionally, the model utilized parallel acceleration through Compute Unified Device Architecture (CUDA) [38], which was based on Graphics Processing Units (GPUs), and the increase in the calculation rate enabled the maintenance of high temporal and spatial resolution in long-duration simulations of processes at the scale of coastal systems.
Figure 2 shows the domain of the model, which centered at the Bohai Sea, and spans from 37 to 41° N in latitude and from 117.5 to 122.5° E in longitude, covering the entire Bohai Sea, as shown in Figure 2. The model uses irregular (triangular) grids and regular (quadrilateral) grids to divide the study area. The regular grid is used in the Yellow River below the Lijin station and the irregular grid is used in the Bohai Sea. For the 2009 Yellow River pathway and Bohai Sea shoreline, the number of grids includes 180,275 nodes and 207,887 elements. For the 2017 Yellow River pathway and Bohai Sea shoreline, the number of grids includes 289,988 nodes and 334,660 elements (Figure 2).
In this study, the topography data is taken from the Bohai Sea comprehensive survey. The seaward open boundary located in the northern Yellow Sea is driven by the tidal elevations and depth-averaged velocity from the TPXO7.2 database (https://www.miz.nao.ac.jp/rise/s/nao99/, accessed on 10 October 2025) with 13 tide constituents, namely M2, S2, N2, K2, K1, O1, P1, Q1, MF, MM, M4, MS4, and MN4. The upstream boundary is located at the Lijin station in the lower Yellow River, using the daily flow process in 2009, 2017, and 2019.

2.3.2. Key Parameters of the Model

The model uses the CFL condition to test iterative convergence; the CFL number was set to 0.015. Based on the in situ sediment observation performed by [9], the grain size in the lower reaches of the Yellow River (mainly silt, median size d50 = 0.0075–0.0273 mm) and the Yellow River Estuary (mainly silt and clay with d50 < 0.01 mm) are obviously different. Therefore, for the bottom stress and water depth, distinct Manning roughness coefficients were considered in the two regions and calibrated via numerous sensitivity analyses. The Manning roughness coefficient was set to 0.02 in the lower reach of the Yellow River and 0.012 in the Bohai Sea.
The nitrogen cycle, including the biogeochemical processes between different sources and different forms of nitrogen-containing substances, is usually a long-term reaction [39]. Although the interaction between various forms of nitrogen-containing substances is more complicated, the total nitrogen index can avoid the influence of the mutual transformation between different forms of nitrogen on the uncertainty of the research objectives to a certain extent. Based on this, the hydrodynamic water quality model constructed in this paper focuses on the migration and diffusion process of total nitrogen under hydrodynamic conditions, without considering the biochemical reaction of total nitrogen in water. The TN degradation coefficient used in this paper is 0.001 mg·L−1·d−1 after many comparisons and adjustments.

3. Model Verification

3.1. Verification of Hydrodynamic

The model performance is assessed by evaluating the root-mean-square error (RMSE) and the correlation efficiency (CC) between the computed results and observations with the following expressions:
R M S E = ( X c a l X o b s ) 2 N
C C = ( X c a l X c a l ¯ ) ( X o b s X o b s ¯ ) ( X c a l X c a l ¯ ) 2 ( X o b s X o b s ¯ ) 2 1 / 2
where X c a l and X o b s are the values of the model calculated and observed qualities, respectively. N is the number of X o b s , and X c a l ¯ and X o b s ¯ are the time average values of X c a l and X o b s , respectively.
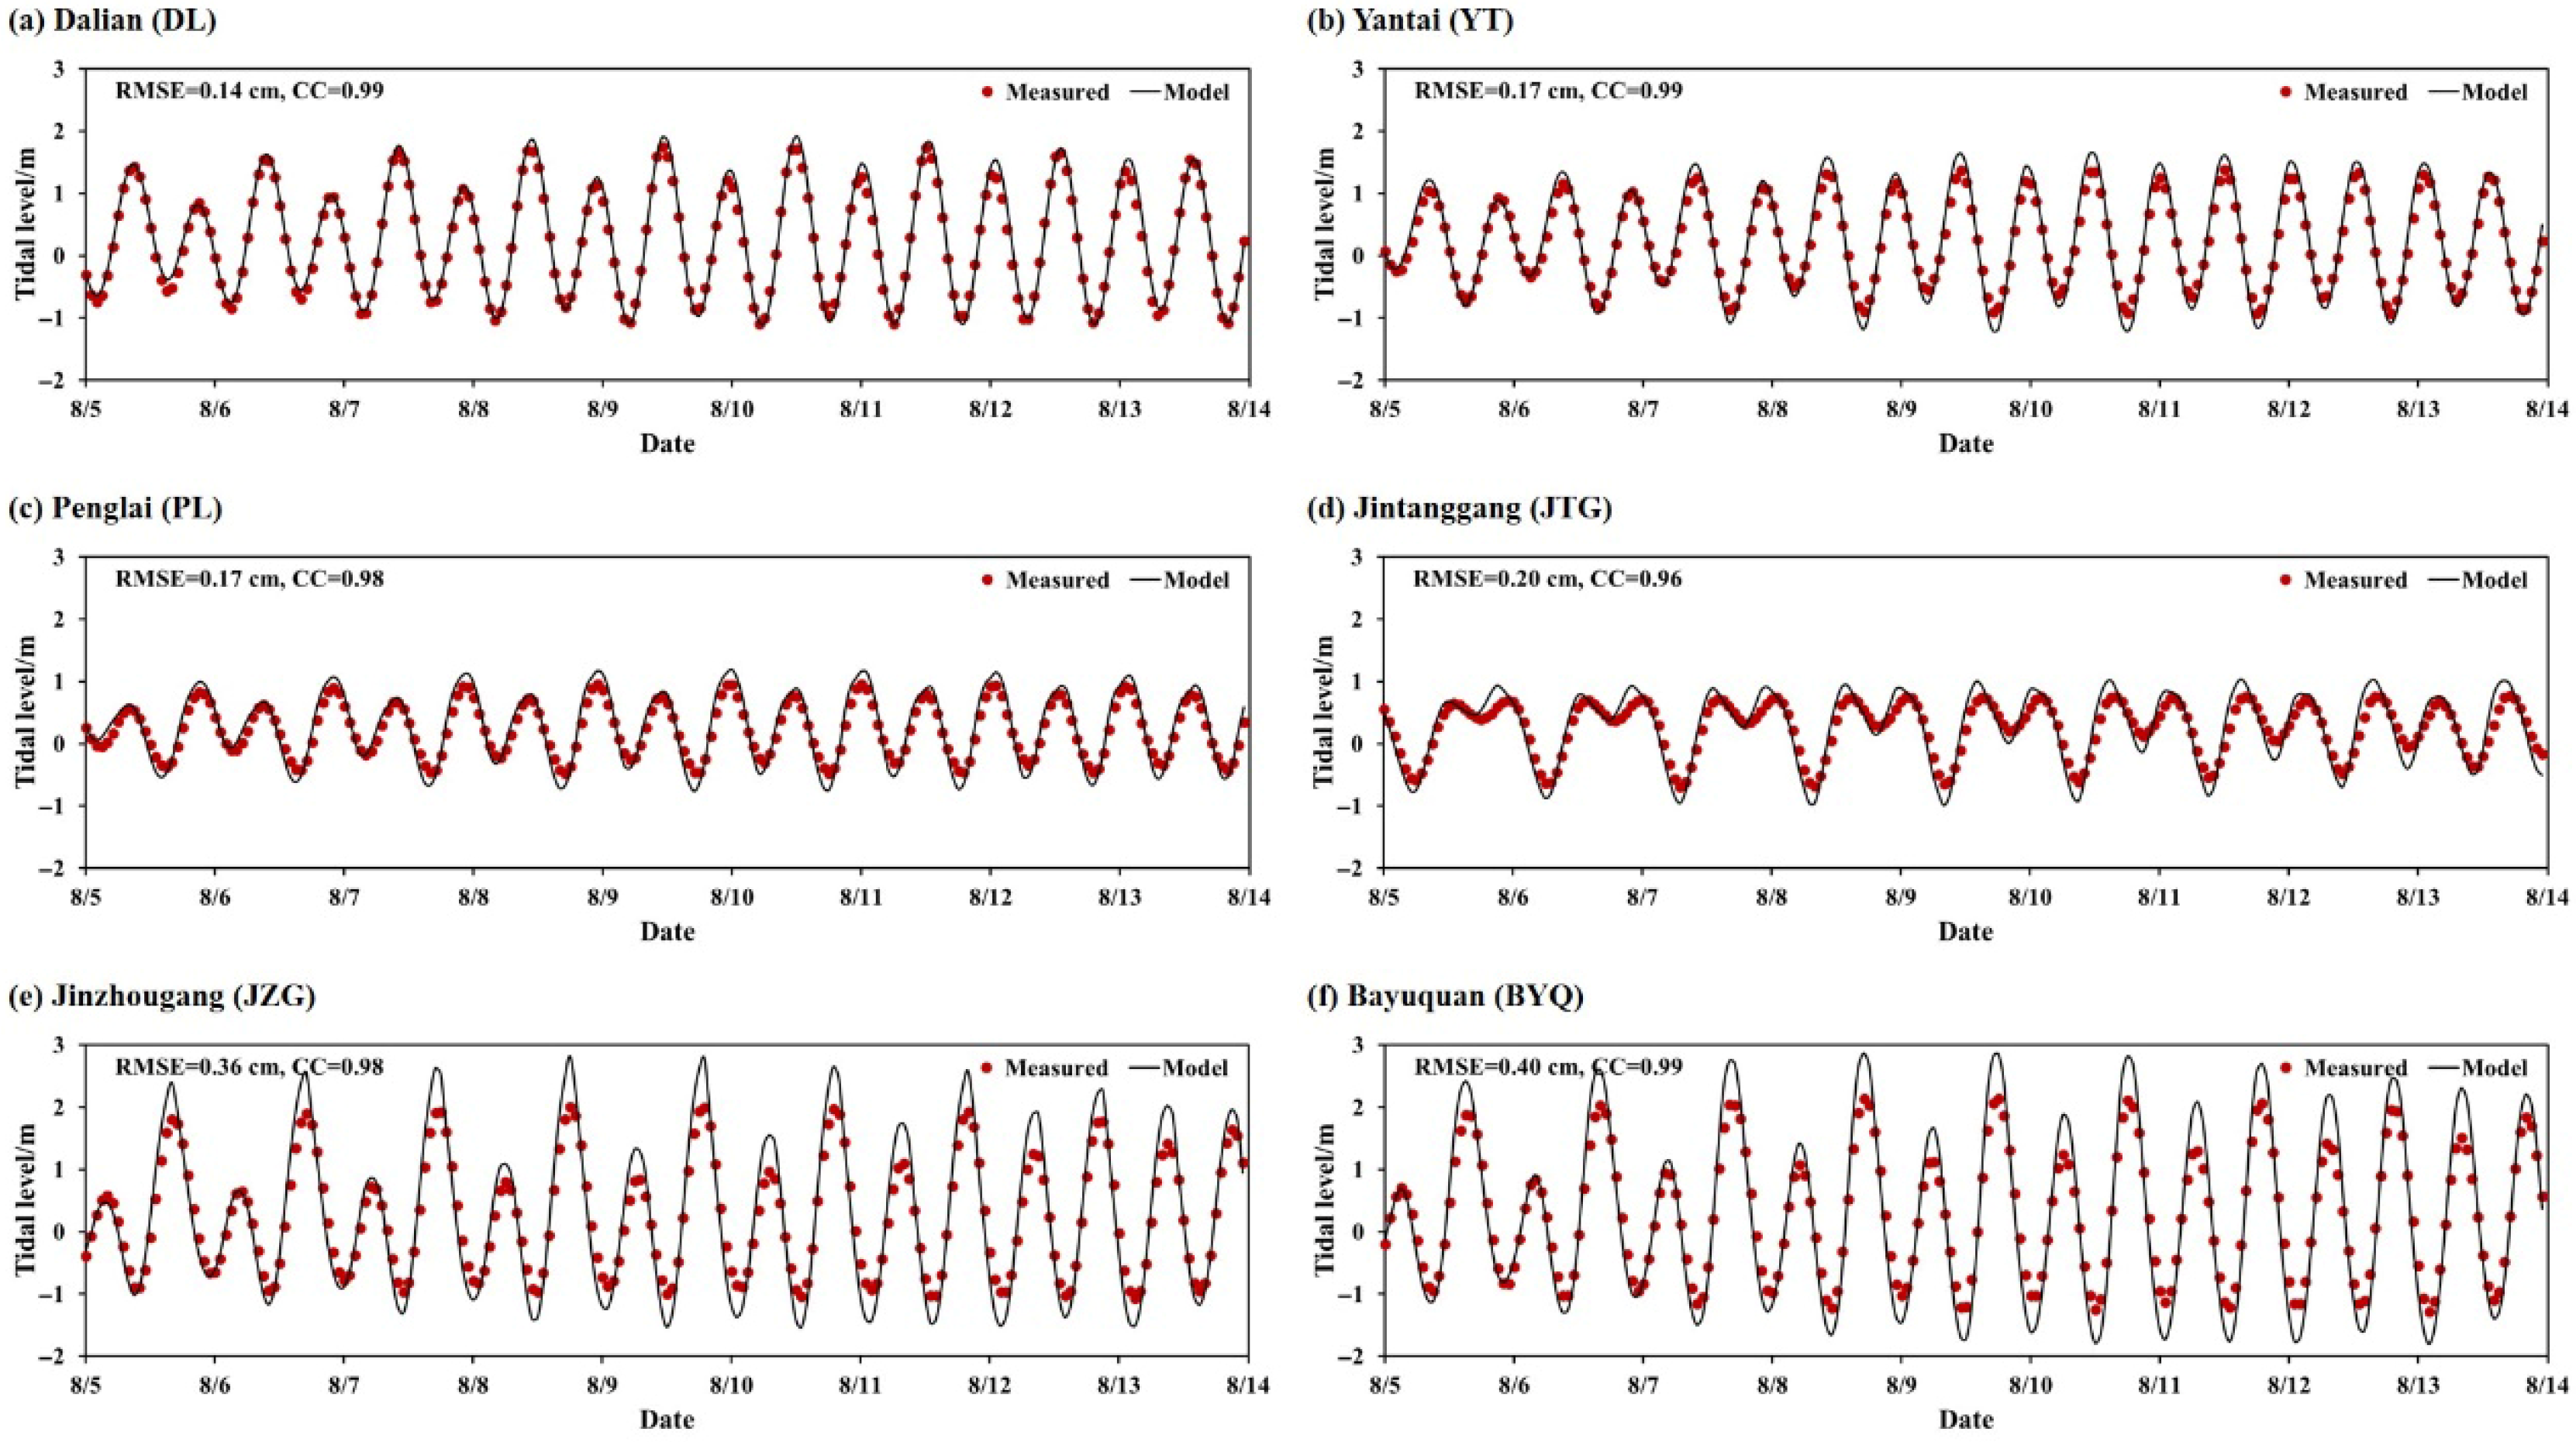
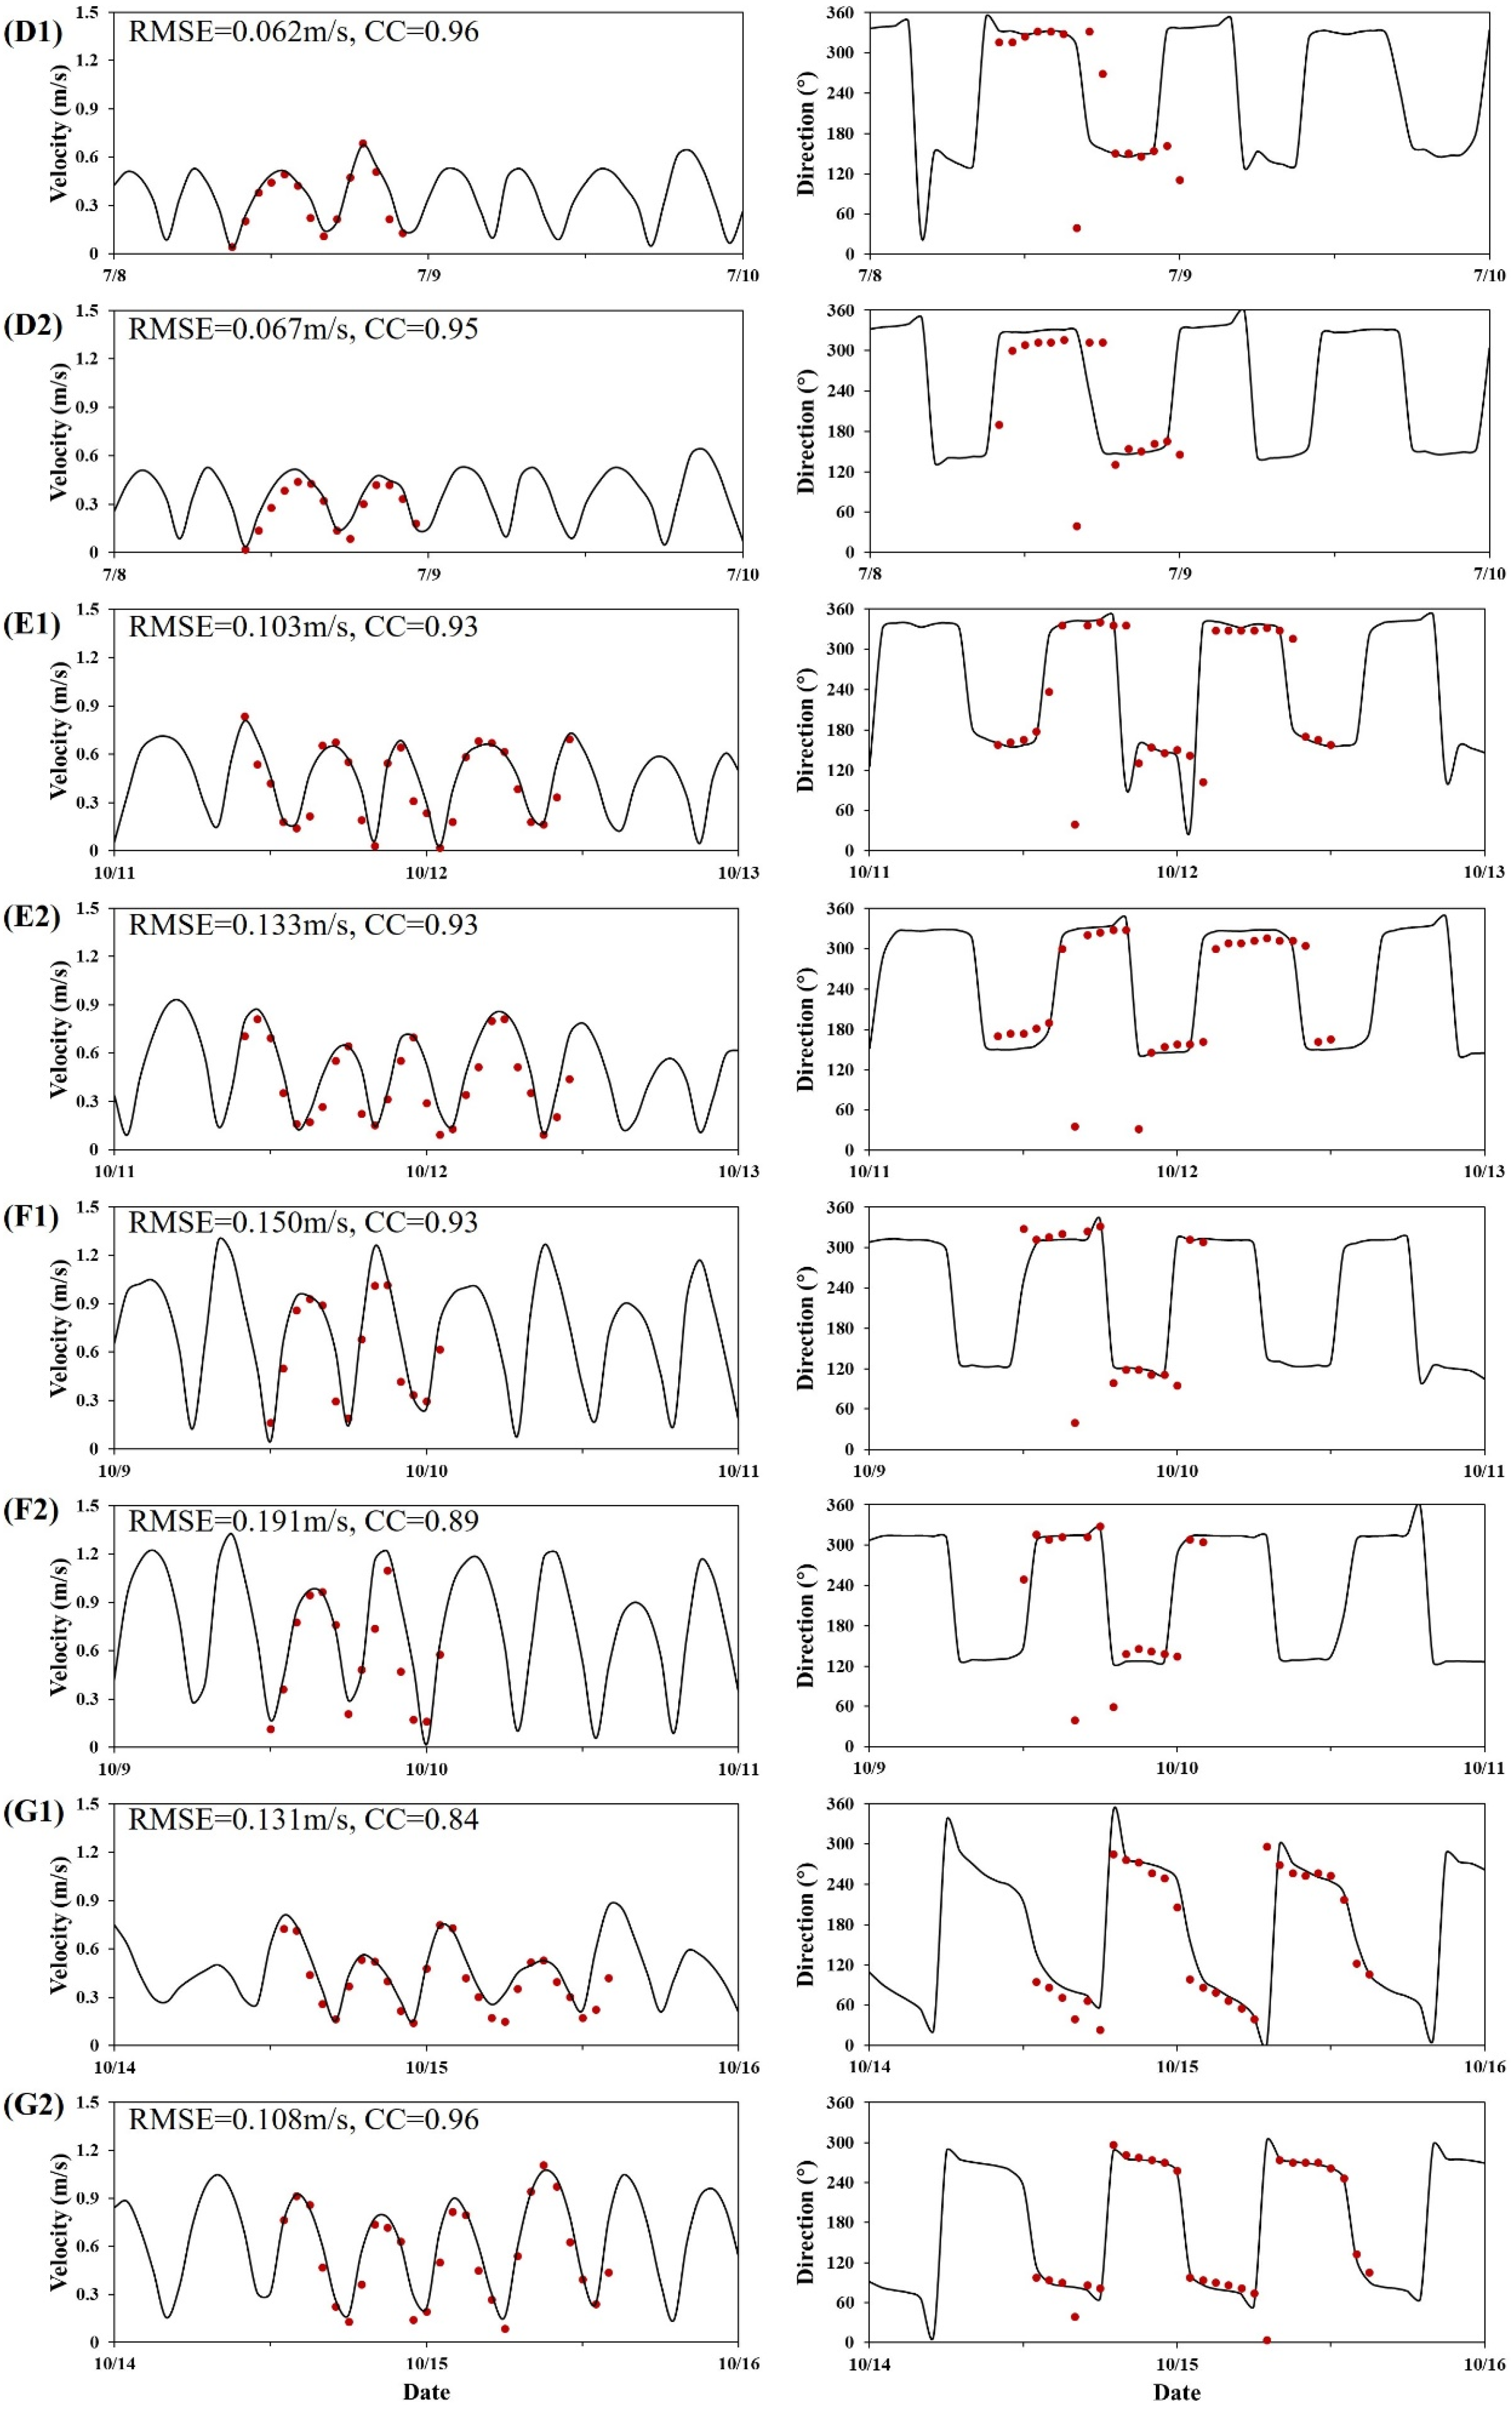
In order to test the reliability of the model, the simulation results were verified by tide, tidal current, tidal harmonic constants, and water quality. Figure 1 shows the location of each verification station. Among them, A1–A12 are the tide level measuring stations including Dalian (DL), Yantai (YT), Penglai (PL), Jintanggang (JTG), Jinzhougang (JZG), and Bayuquan (BYQ). D1–G2 are the tide current measuring stations. In model validation, the hydrodynamic and water quality are analyzed, respectively. Tidal level, tidal current, O1, K1, M2, and S2 constituents are selected for hydrodynamic verification. TN is selected for water quality verification. The simulation tidal level data are compared with the measured data in mid-August 2017. The simulation tidal current data are compared with the measured data in mid-July 2018. The fitting results are good. Partial results of tidal level and tidal current verification are shown in Figure 3 and Figure 4.
The tide level validation simulation period was from 00:00 on 1 June 2017, to 00:00 on 1 September 2017, using data from August, after the simulation results had stabilized. Tide level validation data were obtained from tide tables (2017). Tide table data from mid-to-early August were compared with the simulation results presented in this paper. As shown in Figure 3, the RMSE of tide levels at each tide station ranged from 0.14 to 0.40 m, with an average error of 0.27 m. The correlation coefficient (CC) for each tide station exceeded 0.96, indicating that the model calculation results are in good agreement with tide level data from tide stations around the Bohai Sea.
Tidal current validation was conducted from 00:00 on 1 June 2009, to 00:00 on 30 October 2009, using data from early July and mid-October, after the simulation stabilized. The results show good agreement between the flow directions calculated by the model and the measured flow directions. The calculated velocities at each tidal station differed little from the measured velocities, with RMSE ranging from 0.067 to 0.191 m/s. The correlation coefficients (CC) were all greater than 0.93, except for points F2 and G1, where they ranged from 0.84 to 0.89, indicating good correlation (Figure 4). Among them, D1-G2 is the corresponding sampling point position in Figure 2A.

3.2. Verification of TN

The monitoring of water quality indicators in the YRE is usually carried out in a short period of time in a certain range of waters. To a certain extent, it limits the monitoring frequency, range, and time of TN content in estuaries. In this paper, the TN observation data of the YRE during the WSRS are obtained by looking up the references.
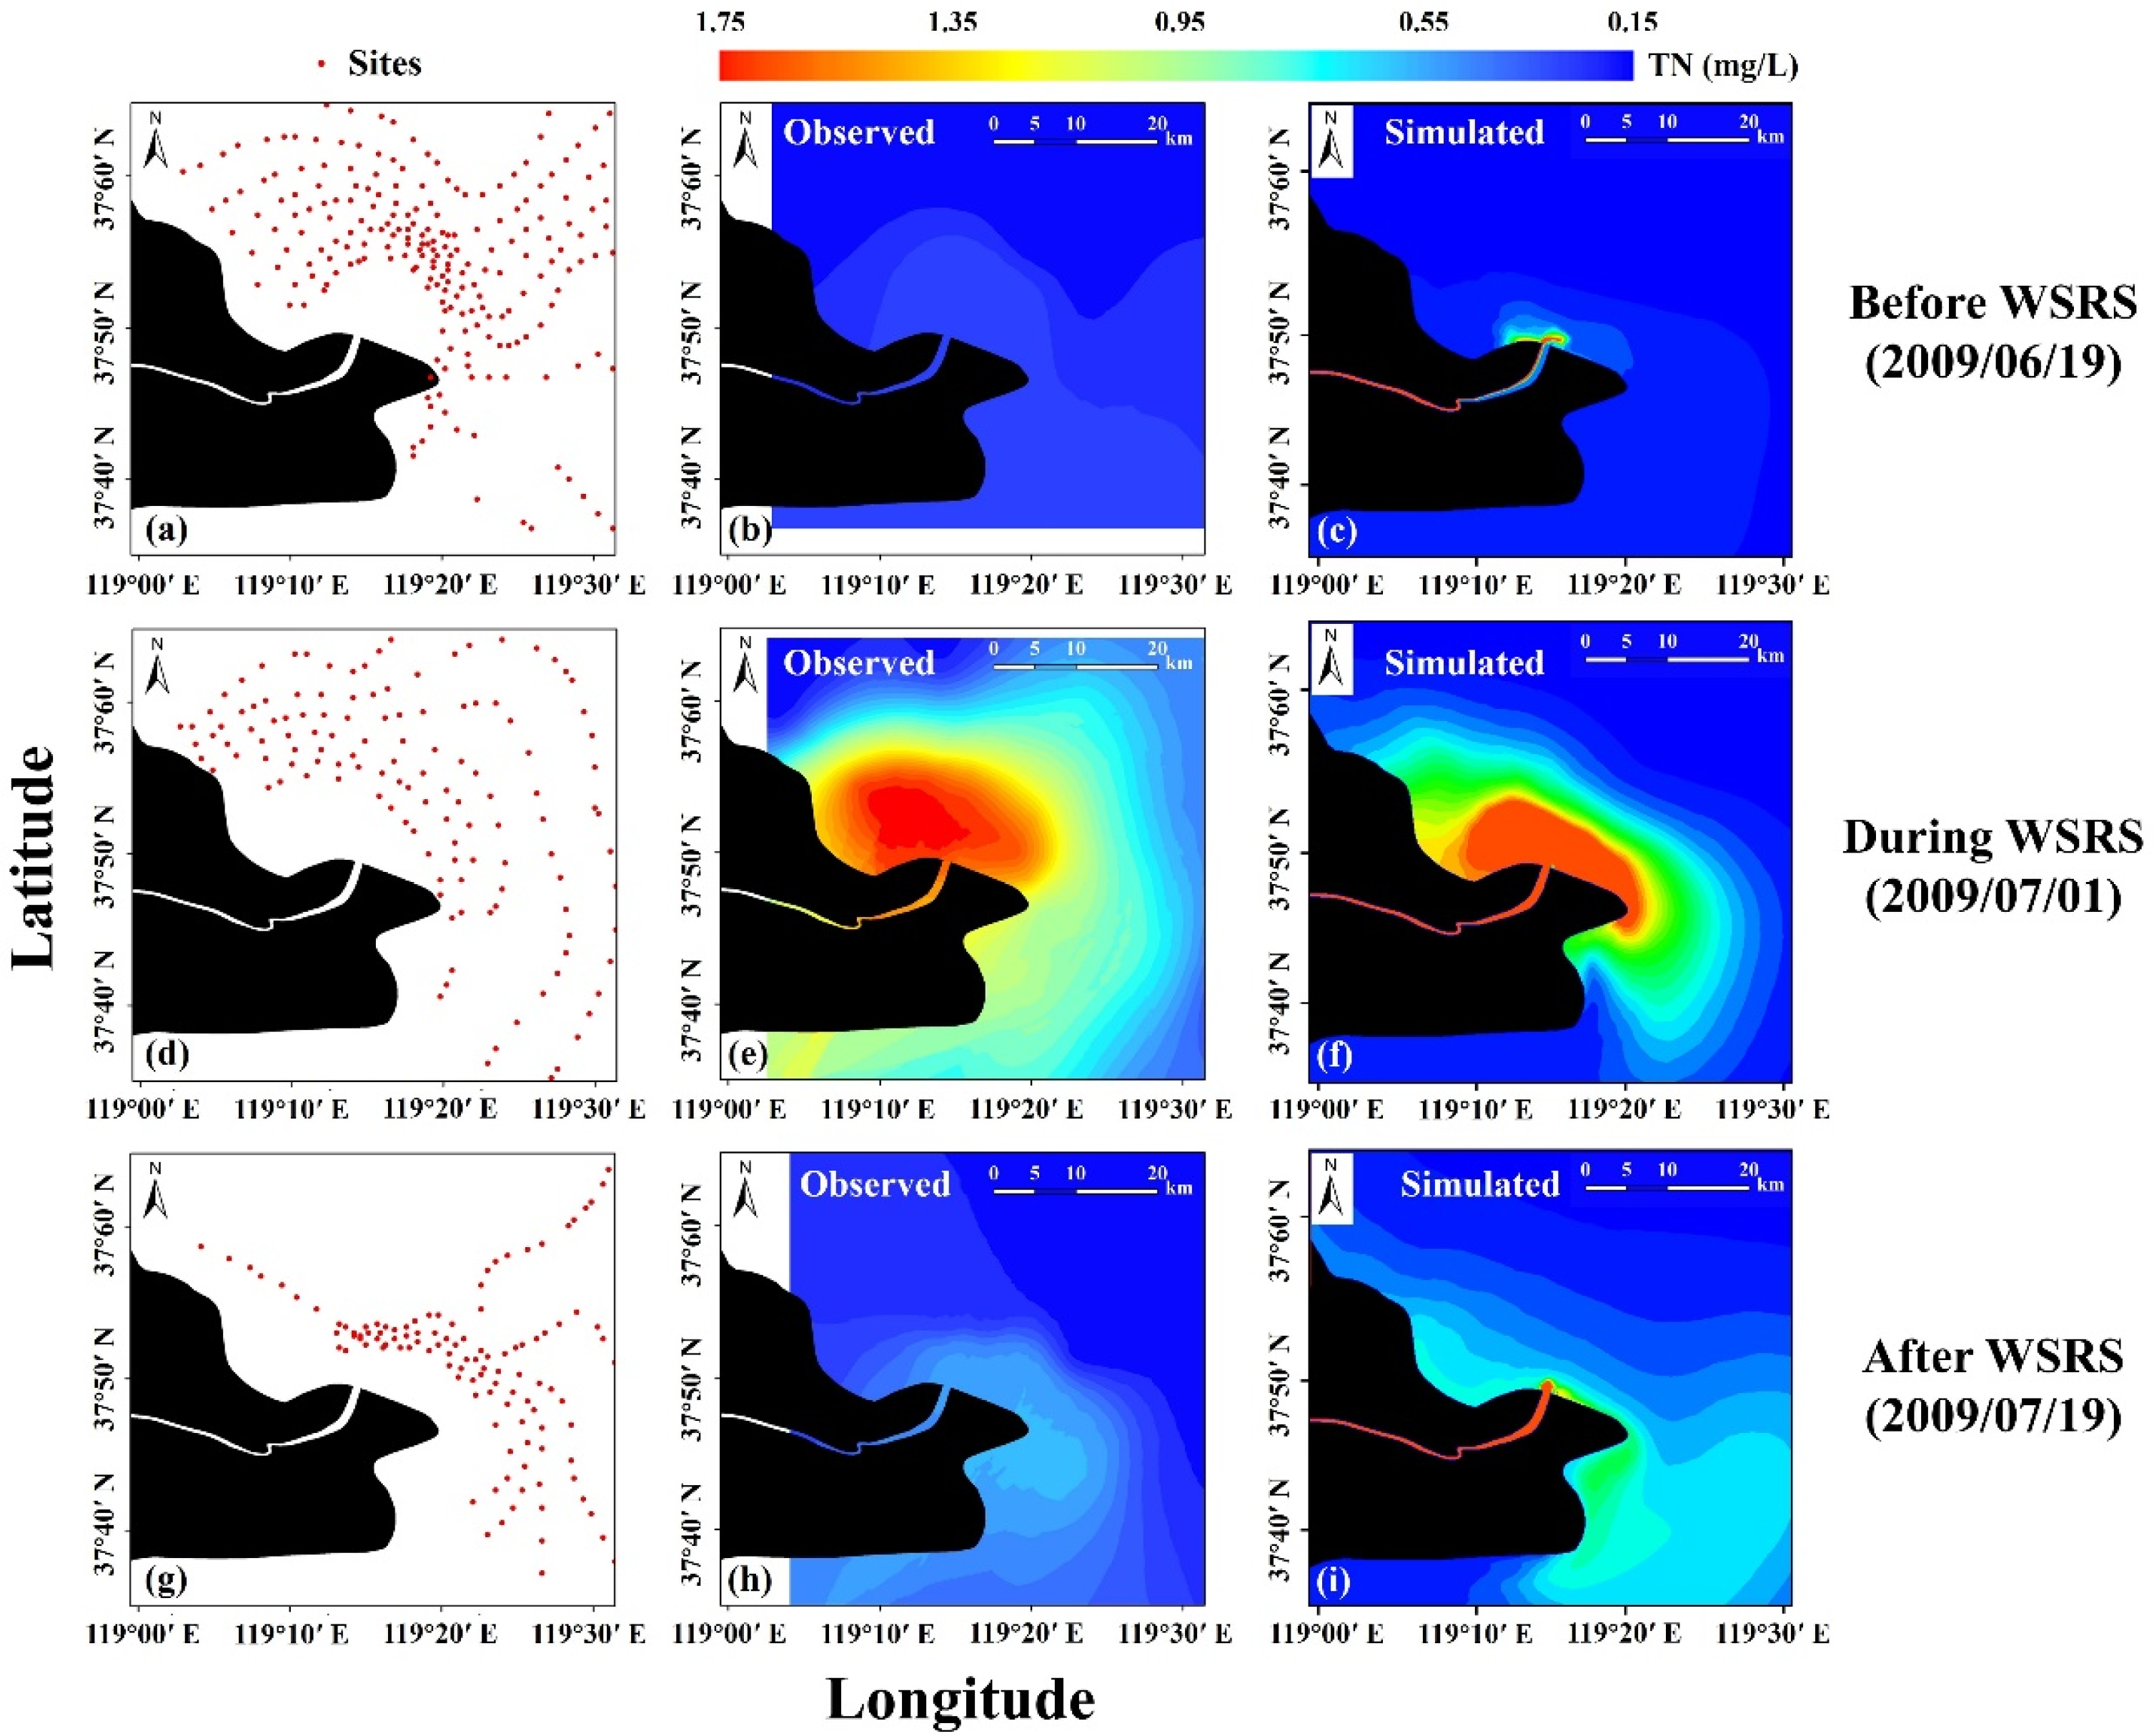
Water quality simulation is based on the validated hydrodynamic model. We selected observational data from a previous study [10]. The previous study gave the isoline results of the measured value of TN content in the YRE before and after the water and sediment regulation in 2009 [10]. In this paper, the isoline results were extracted to obtain the scatter plots (Figure 5a,d,g) before the WSRS (19 June), during the WSRS (1 July), and after the WSRS (19 July). Furthermore, the plane distribution of the measured values of TN content in the YRE before and after the WSRS is obtained by kriging interpolation. The simulated results of TN are shown in Figure 5c,f,i. As the measured data are limited, the monthly data are used for verification. The monthly simulated results are extracted and the data are averaged to obtain the annual average variation curves of TN in this area. According to the location of the observation stations in the YRE in Figure 2A, the measured values and the simulated values in this paper are extracted for verification (Figure 6). As shown in Figure 5, the simulated and measured results of the TN distribution range are similar (Figure 6).
Scattered points on the measured data contour lines were selected as validation points for the simulation values. The simulated and measured values were compared before, during, and after the WSRS (Figure 6). The results showed that the correlations (R2) between the simulated and measured TN concentrations on the contour lines for the three time periods reached 0.98 (Figure 6a), 0.96 (Figure 6b), and 0.98 (Figure 6c), respectively. Overall, the water quality simulation results met the requirements of the simulation schedule. In summary, the simulated TN concentrations in this study are basically consistent with the measured results and findings of other scholars. The water quality model is reliable.

4. Results and Discussion

4.1. The Effect of River Channel Change on TN Transport in the YRE

The WSRS was implemented both in 2009 and 2019, but there were obvious differences in river outlets between these two years (Figure 1). Therefore, the diffusion of TN before, during, and after the WSRS in these two years was selected for comparison. Previous studies have summarized the history of morphological changes in the YRE from the 1970s to the early 2010s [9,12]. During the period of 2005~2009, in order to facilitate oil exploration, the main channel of the Yellow River was artificially shifted from southeast to northeast, and then the channel gradually swung northward (Figure 1a) [27]. The shape of the YRE from 2017 to 2019 is shown in Figure 1b. In 2009, there was only one northward estuary, and the river rushed out to form a single plume. For the first time since 2013, a small delta and a new eastward channel have been observed in the estuary about two months after the WSRS in the Yellow River Basin [40]. The occurrence of the small delta may be formed by gradual deposition near the estuary or during the strong runoff period during the WSRS. It can be reasonably inferred that the WSRS plays an important role in the formation of new estuarine morphology.
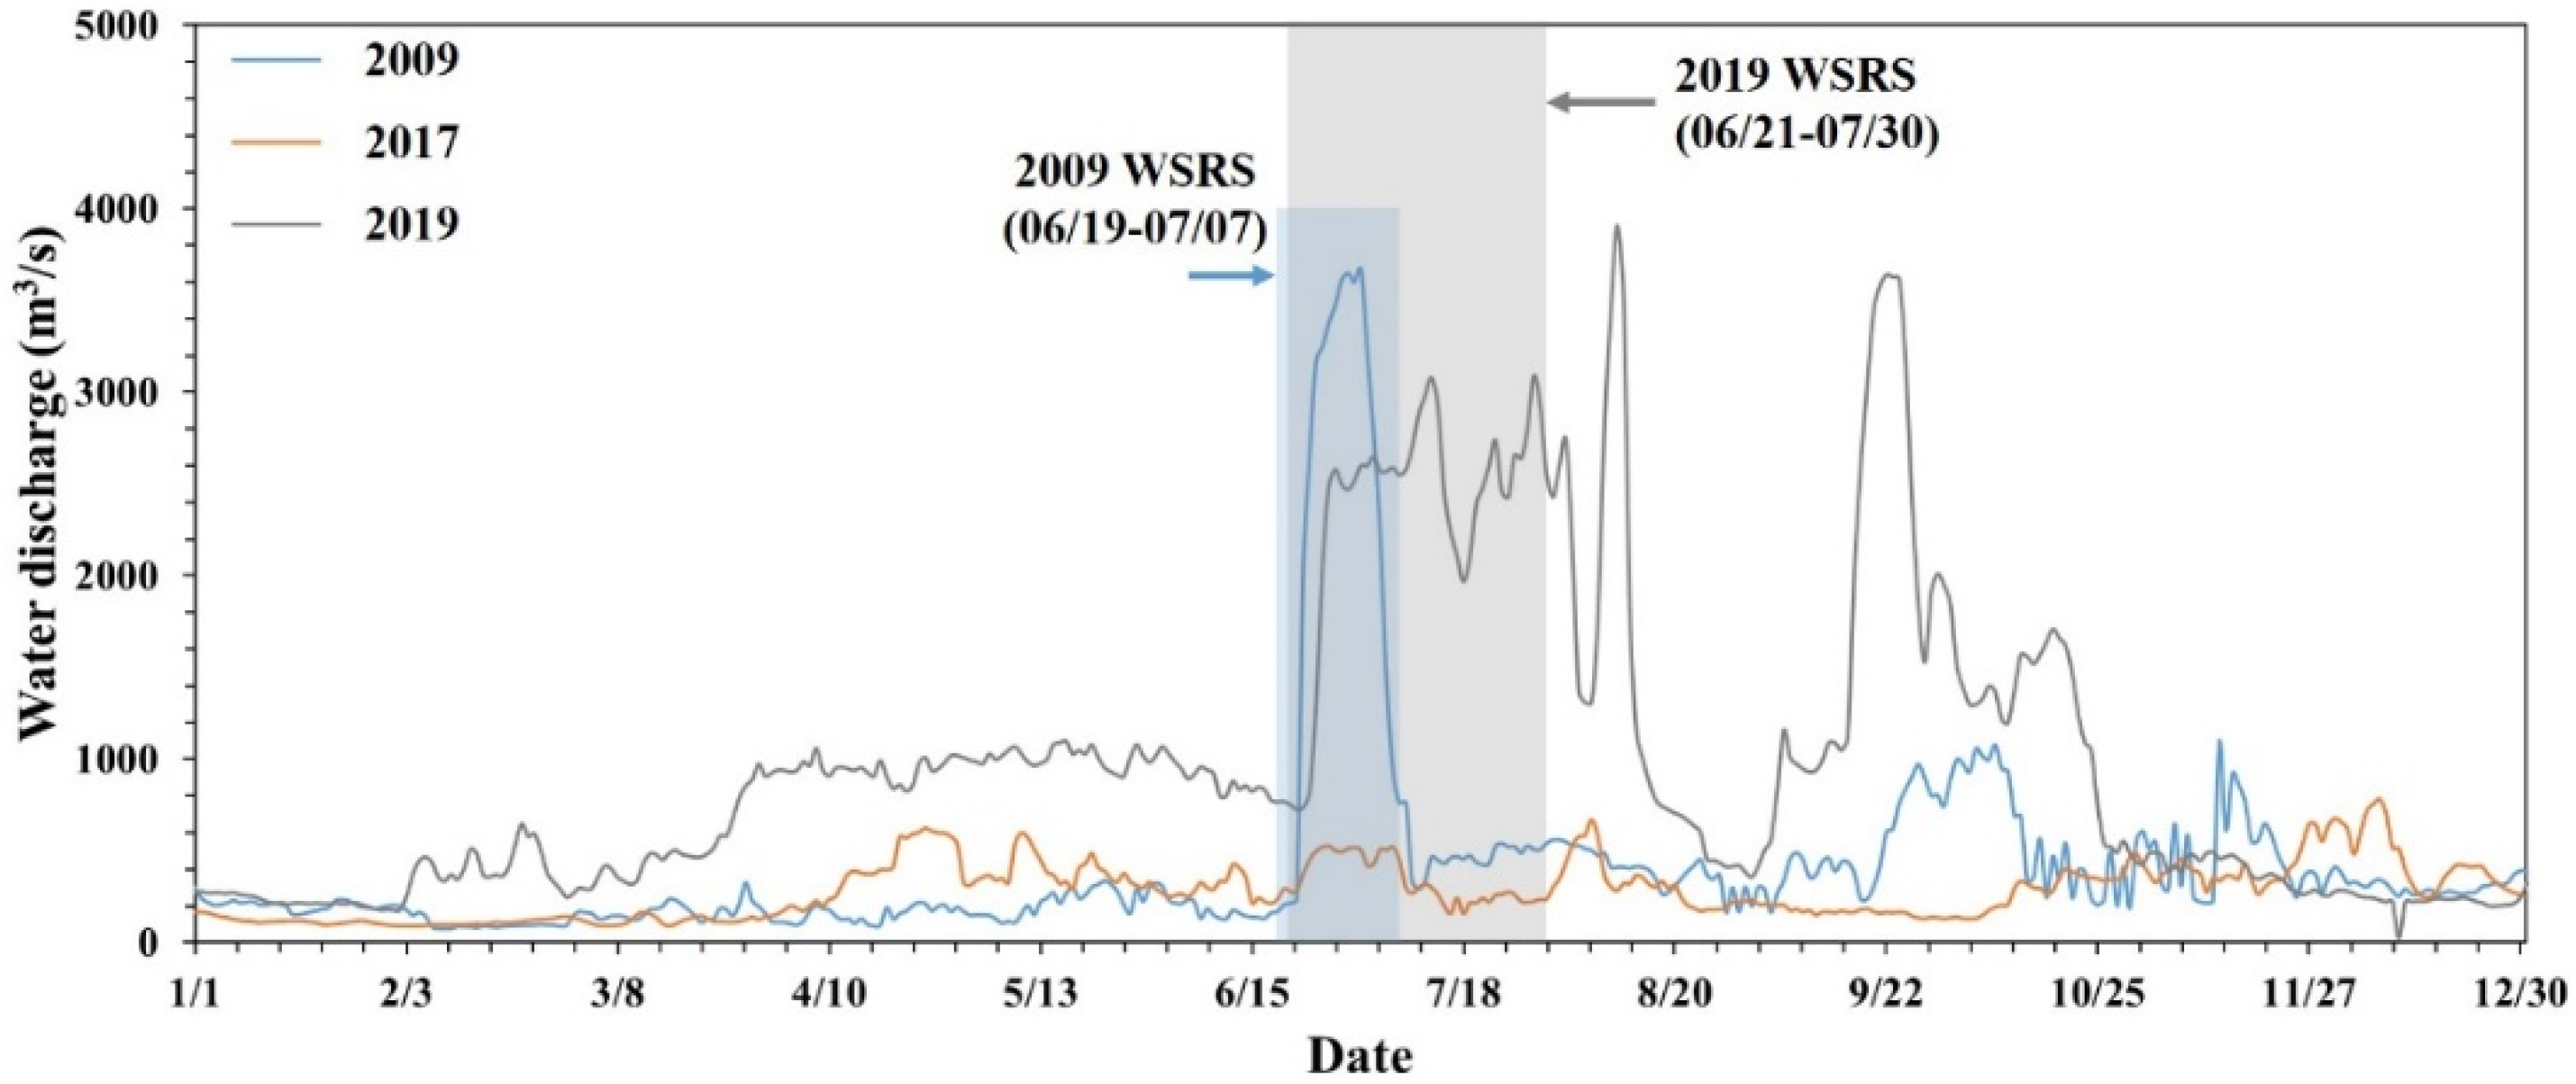
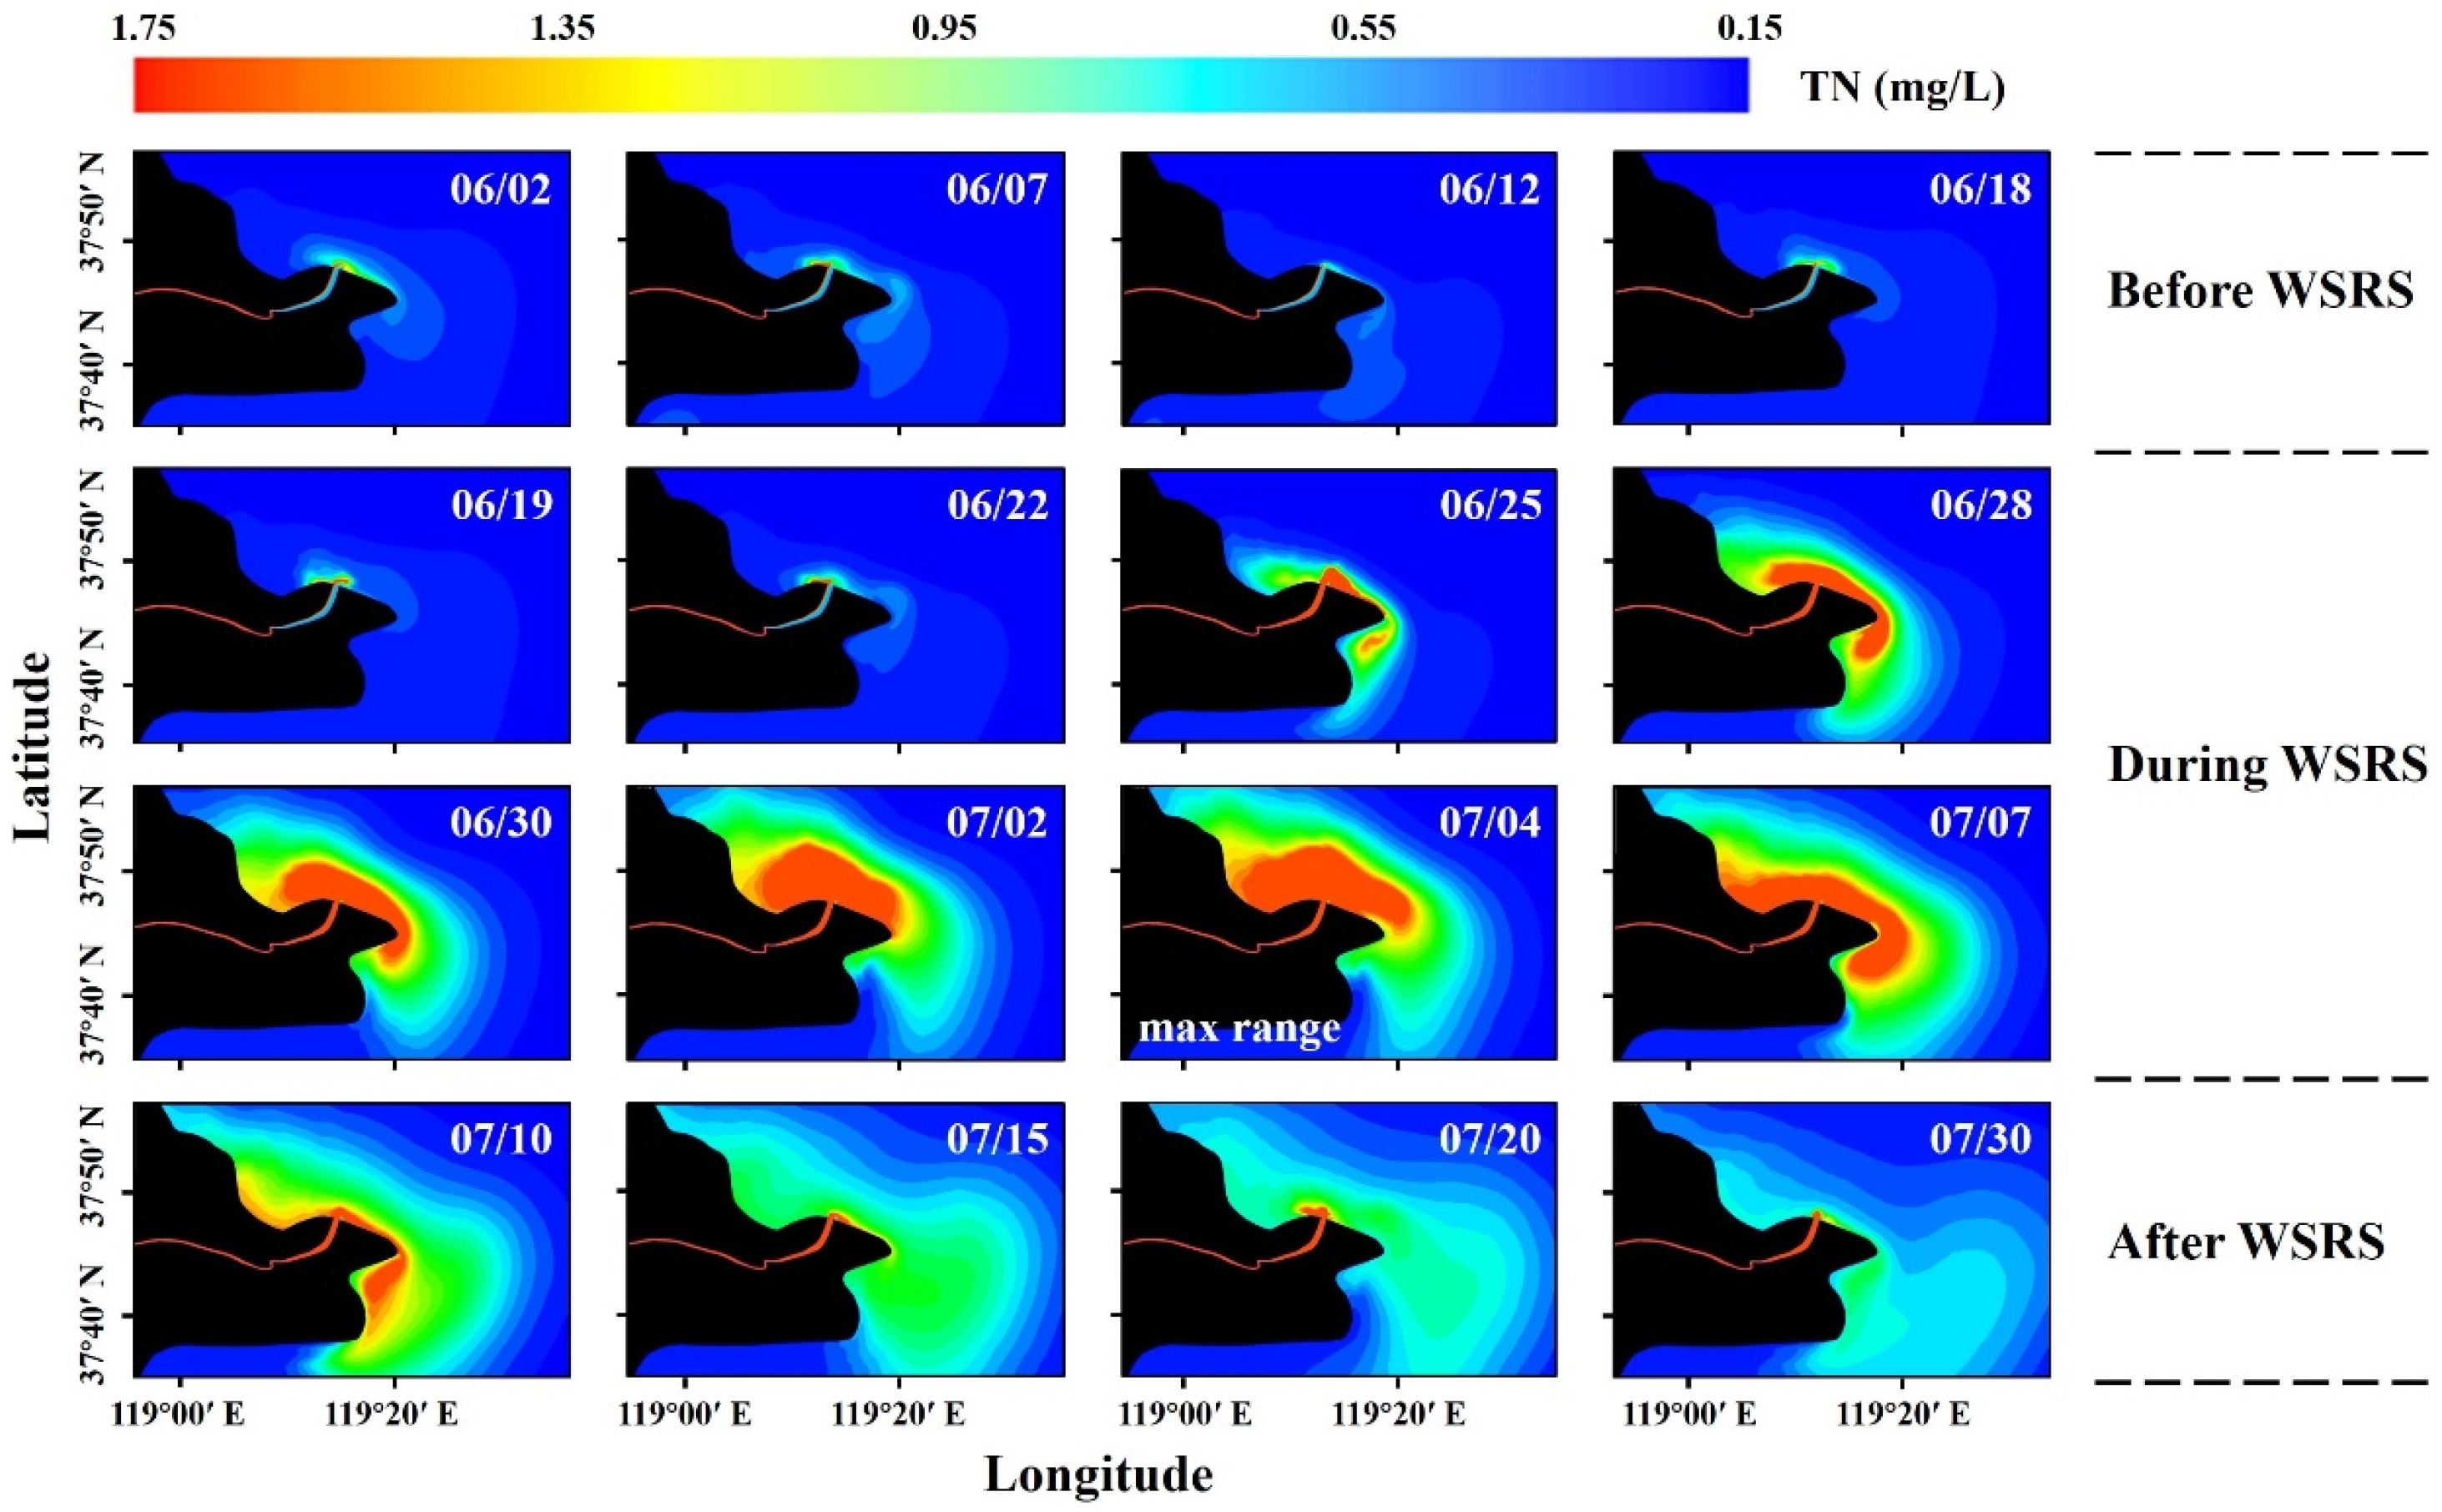
The periods of the WSRS in 2009 and 2019 were from 19 June to 7 July (19 days) and from 21 June to 30 July (40 days), respectively [15]. According to the TN concentration simulation result in 2009, higher TN concentrations appeared in the estuary around 25 June to 10 July and peaked on 4 July (Figure 7). TN concentrations in the YRE were generally lower than 1.5 mg/L before the WSRS in 2009 and were only distributed within 2 km of the estuary, with an area of about 63.9 km2 on 18 June (Figure 8). Subsequently, during the WSRS in 2009, the water with high TN concentration (>1.5 mg/L) did not appear synchronously with the higher runoff of the upstream WSRS (Figure 8). This situation obviously lags behind the WSRS for about one week, which is consistent with a previous study [15]. When waters with TN concentrations higher than 1.5 mg/L emerged from the estuary on 25 June, they were divided along the bank into two streams westward and southeastward. Furthermore, the diffusion range of high TN concentration (>1.5 mg/L) reached its maximum on 4 July: it is about 13.4 km away from the estuary and has an area of about 280.9 km2 (Figure 8). Subsequently, the range of high concentration (>1.5 mg/L) TN in the estuary gradually decreased. It should be noted that relatively high-TN-concentration water was still distributed around 30 July on the eastern coast of the YRD even after the WSRS.
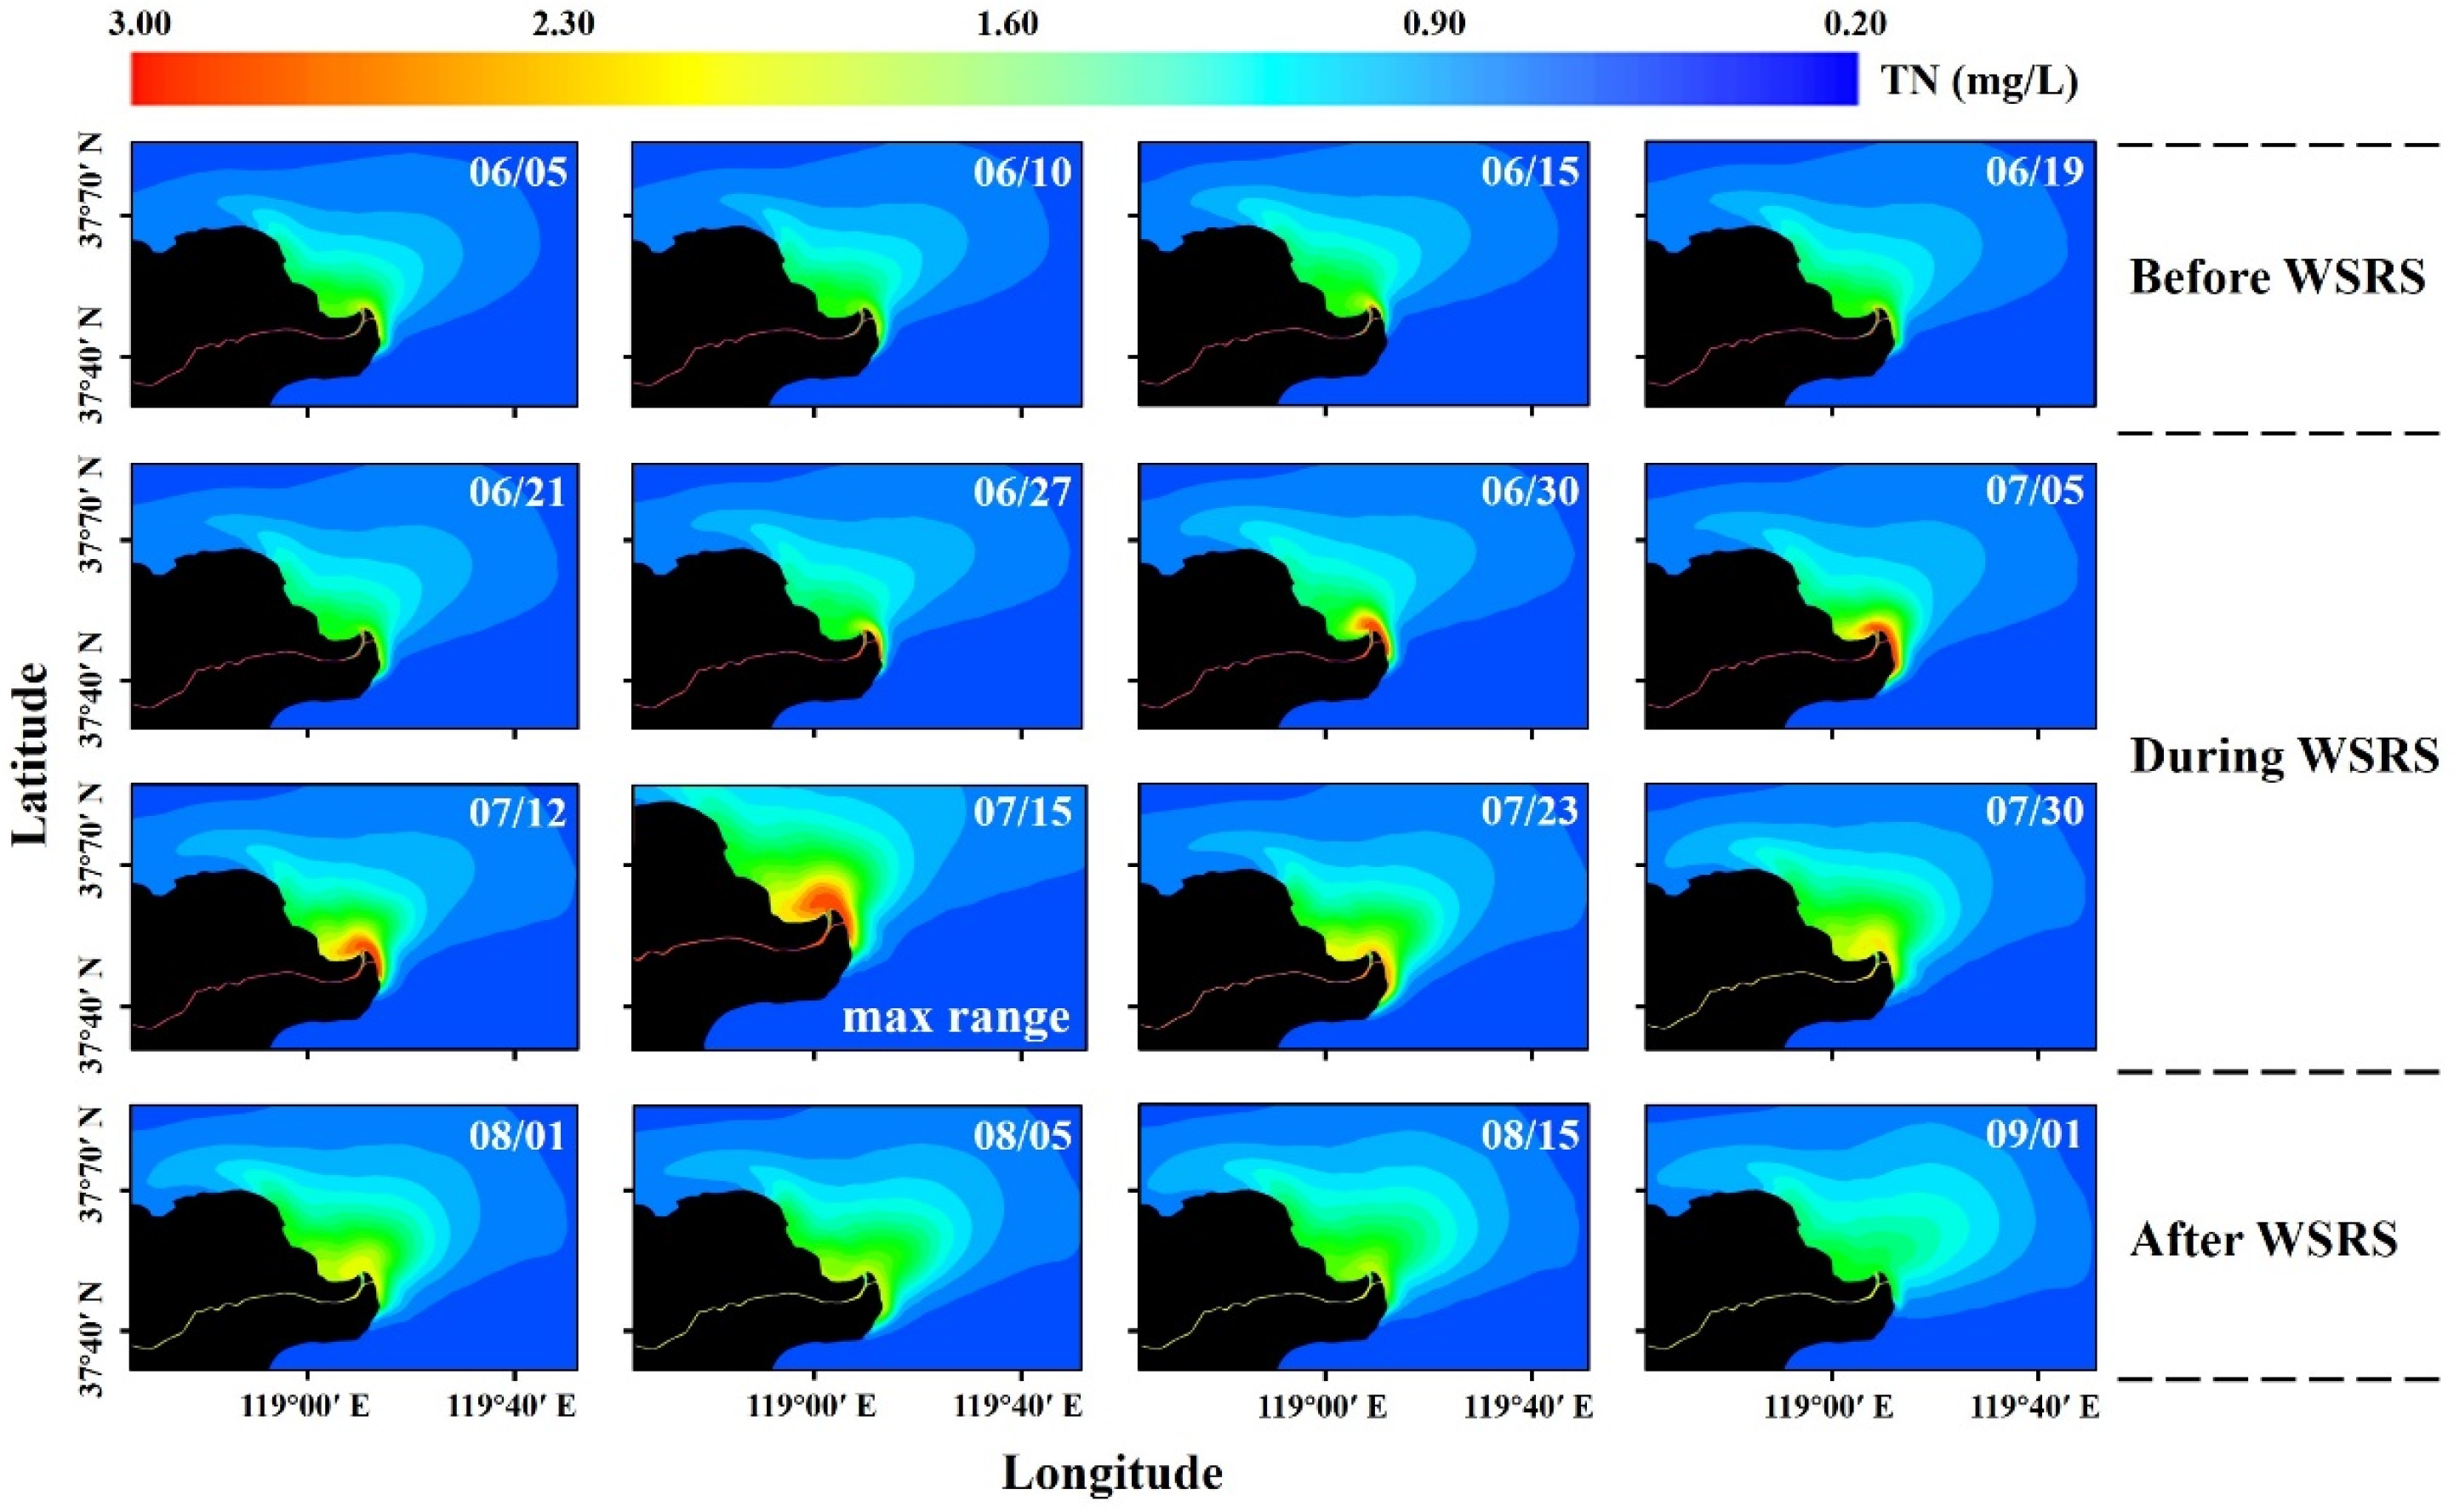
The runoff in Lijin since mid-March 2019 was about five times that of the same period in 2009 (Figure 7). This led to the emergence of a wide range of water with high TN concentration (<2.5 mg/L) in the estuary before the WSRS in 2019, and mainly distributed along the Gudong Coast in the north of the YRE (Figure 9). Similarly to 2009, high-TN-concentration water entered the Bohai Sea about one week (27 June) after the WSRS began. Higher-TN-concentration water (>2.5 mg/L) entered the Bohai Sea in two outlets from the north and east of the estuary due to the difference in the river channel between 2019 and 2009. Water from the east outlet diffused southward along the coast, and the water from the north outlet diffused westward to the Gudong Coast under the tidal current. With the diffusion of water flow, the range of higher-TN-concentration water (>2.5 mg/L) reached the furthest on 15 July, reaching 37°70 N and 119°25 E, respectively. The northern edge of the high-concentration-TN (>2.5 mg/L) water body is about 7.38 km away from the estuary, the eastern edge is about 2.2 km away from the estuary, and the overall area is about 136.5 km2 (Figure 9). The northward spread in 2019 was further than in 2009 (Figure 8 and Figure 9).
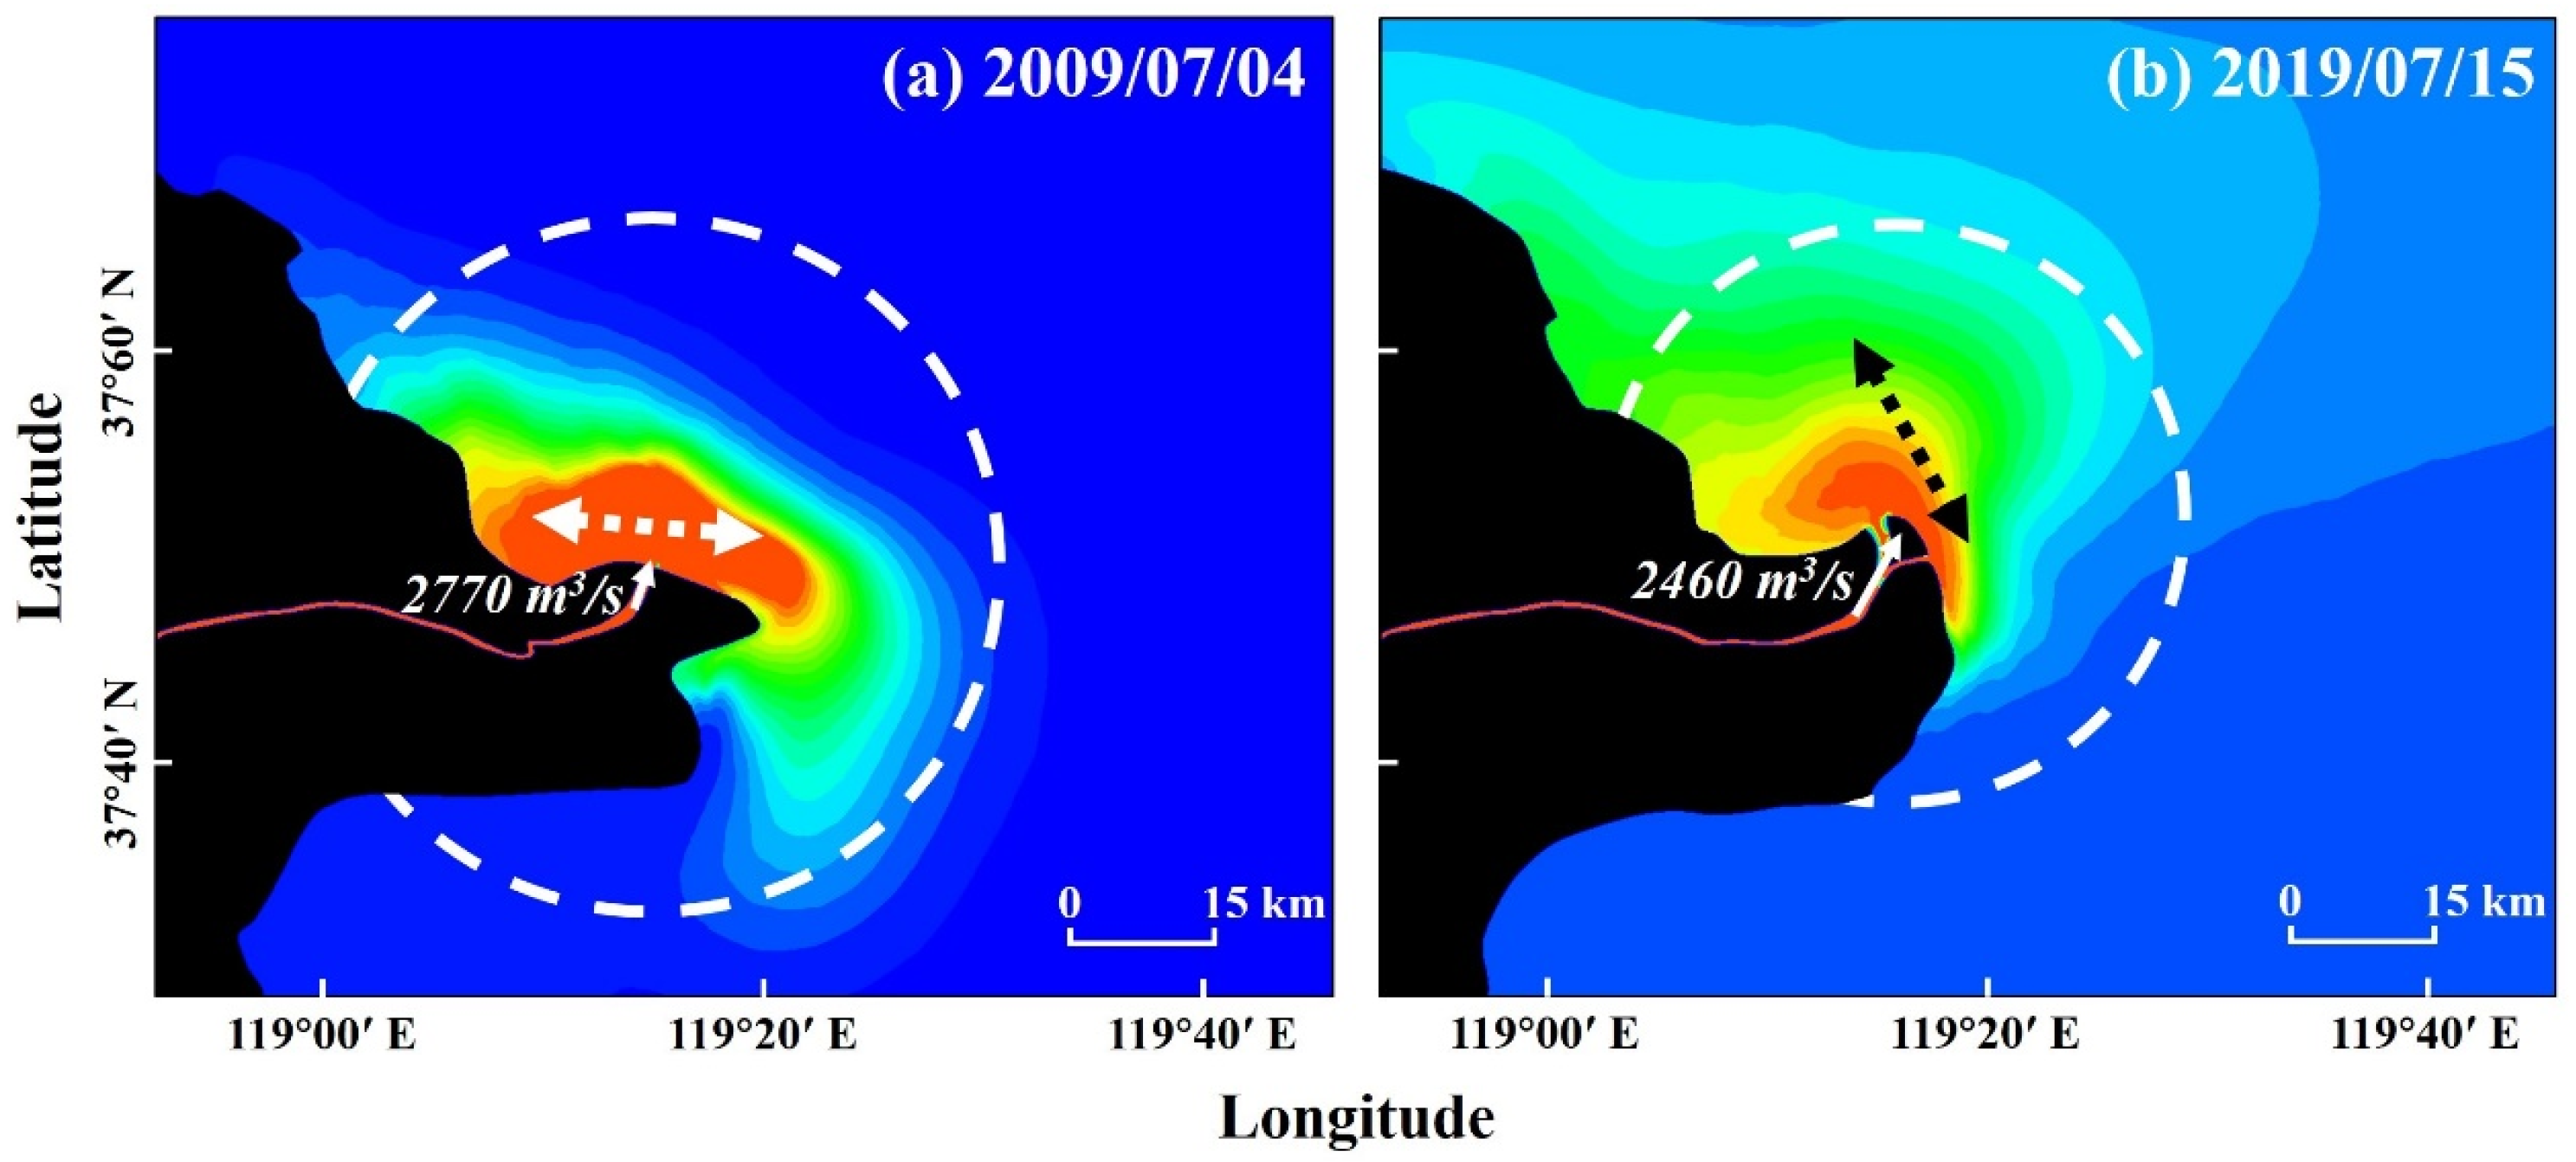
Estuarine plume is a common form of estuarine material transport to the sea, which is manifested as high-concentration and low-salinity water bodies floating above the sea [9]. The spatial and temporal variations in plumes have a direct impact on the distribution of suspended solids, nutrients, pollutants, and nitrogen-cycling processes in the estuary and its adjacent waters [41]. Thus, the estuarine plume affects the geological, chemical, biological, and physical marine environment of the estuary and its adjacent waters. Based on the temperature data of the YRE from 2002 to 2013, the previous study has calculated the relationship between the plume diffusion distance and runoff during the WSRS [42]. Based on their empirical relationship [42], we calculated the relationship between the diffusion range of high-TN-concentration water and estuarine plume distance in 2009 and 2019, respectively (Figure 10). When the runoff reached 2770 m3/s in 2009, the diffusion range of high-TN-concentration water (>0.5 mg/L) in the estuary was close to the edge of the plume, which was about 30 km away from the southeast side of the estuary (Figure 10a). The diffusion range of high-TN-concentration water (>1.05 mg/L) in 2019 is close to the edge of the plume, about 26.5 km north of the estuary (Figure 10b). In addition, the sea surface temperature corresponding to the farthest transmission distance of the estuarine plume is about 25–26 °C [42]. Therefore, according to the simulation results in this paper, the TN concentrations of 0.5 mg/L (2009 river channel) and 1.05 mg/L (2019 river channel) can be used as the threshold of the farthest transmission distance of different flow paths at this temperature (Figure 10).

4.2. The Effect of the WSRS on Nutrient Transport in the YRE

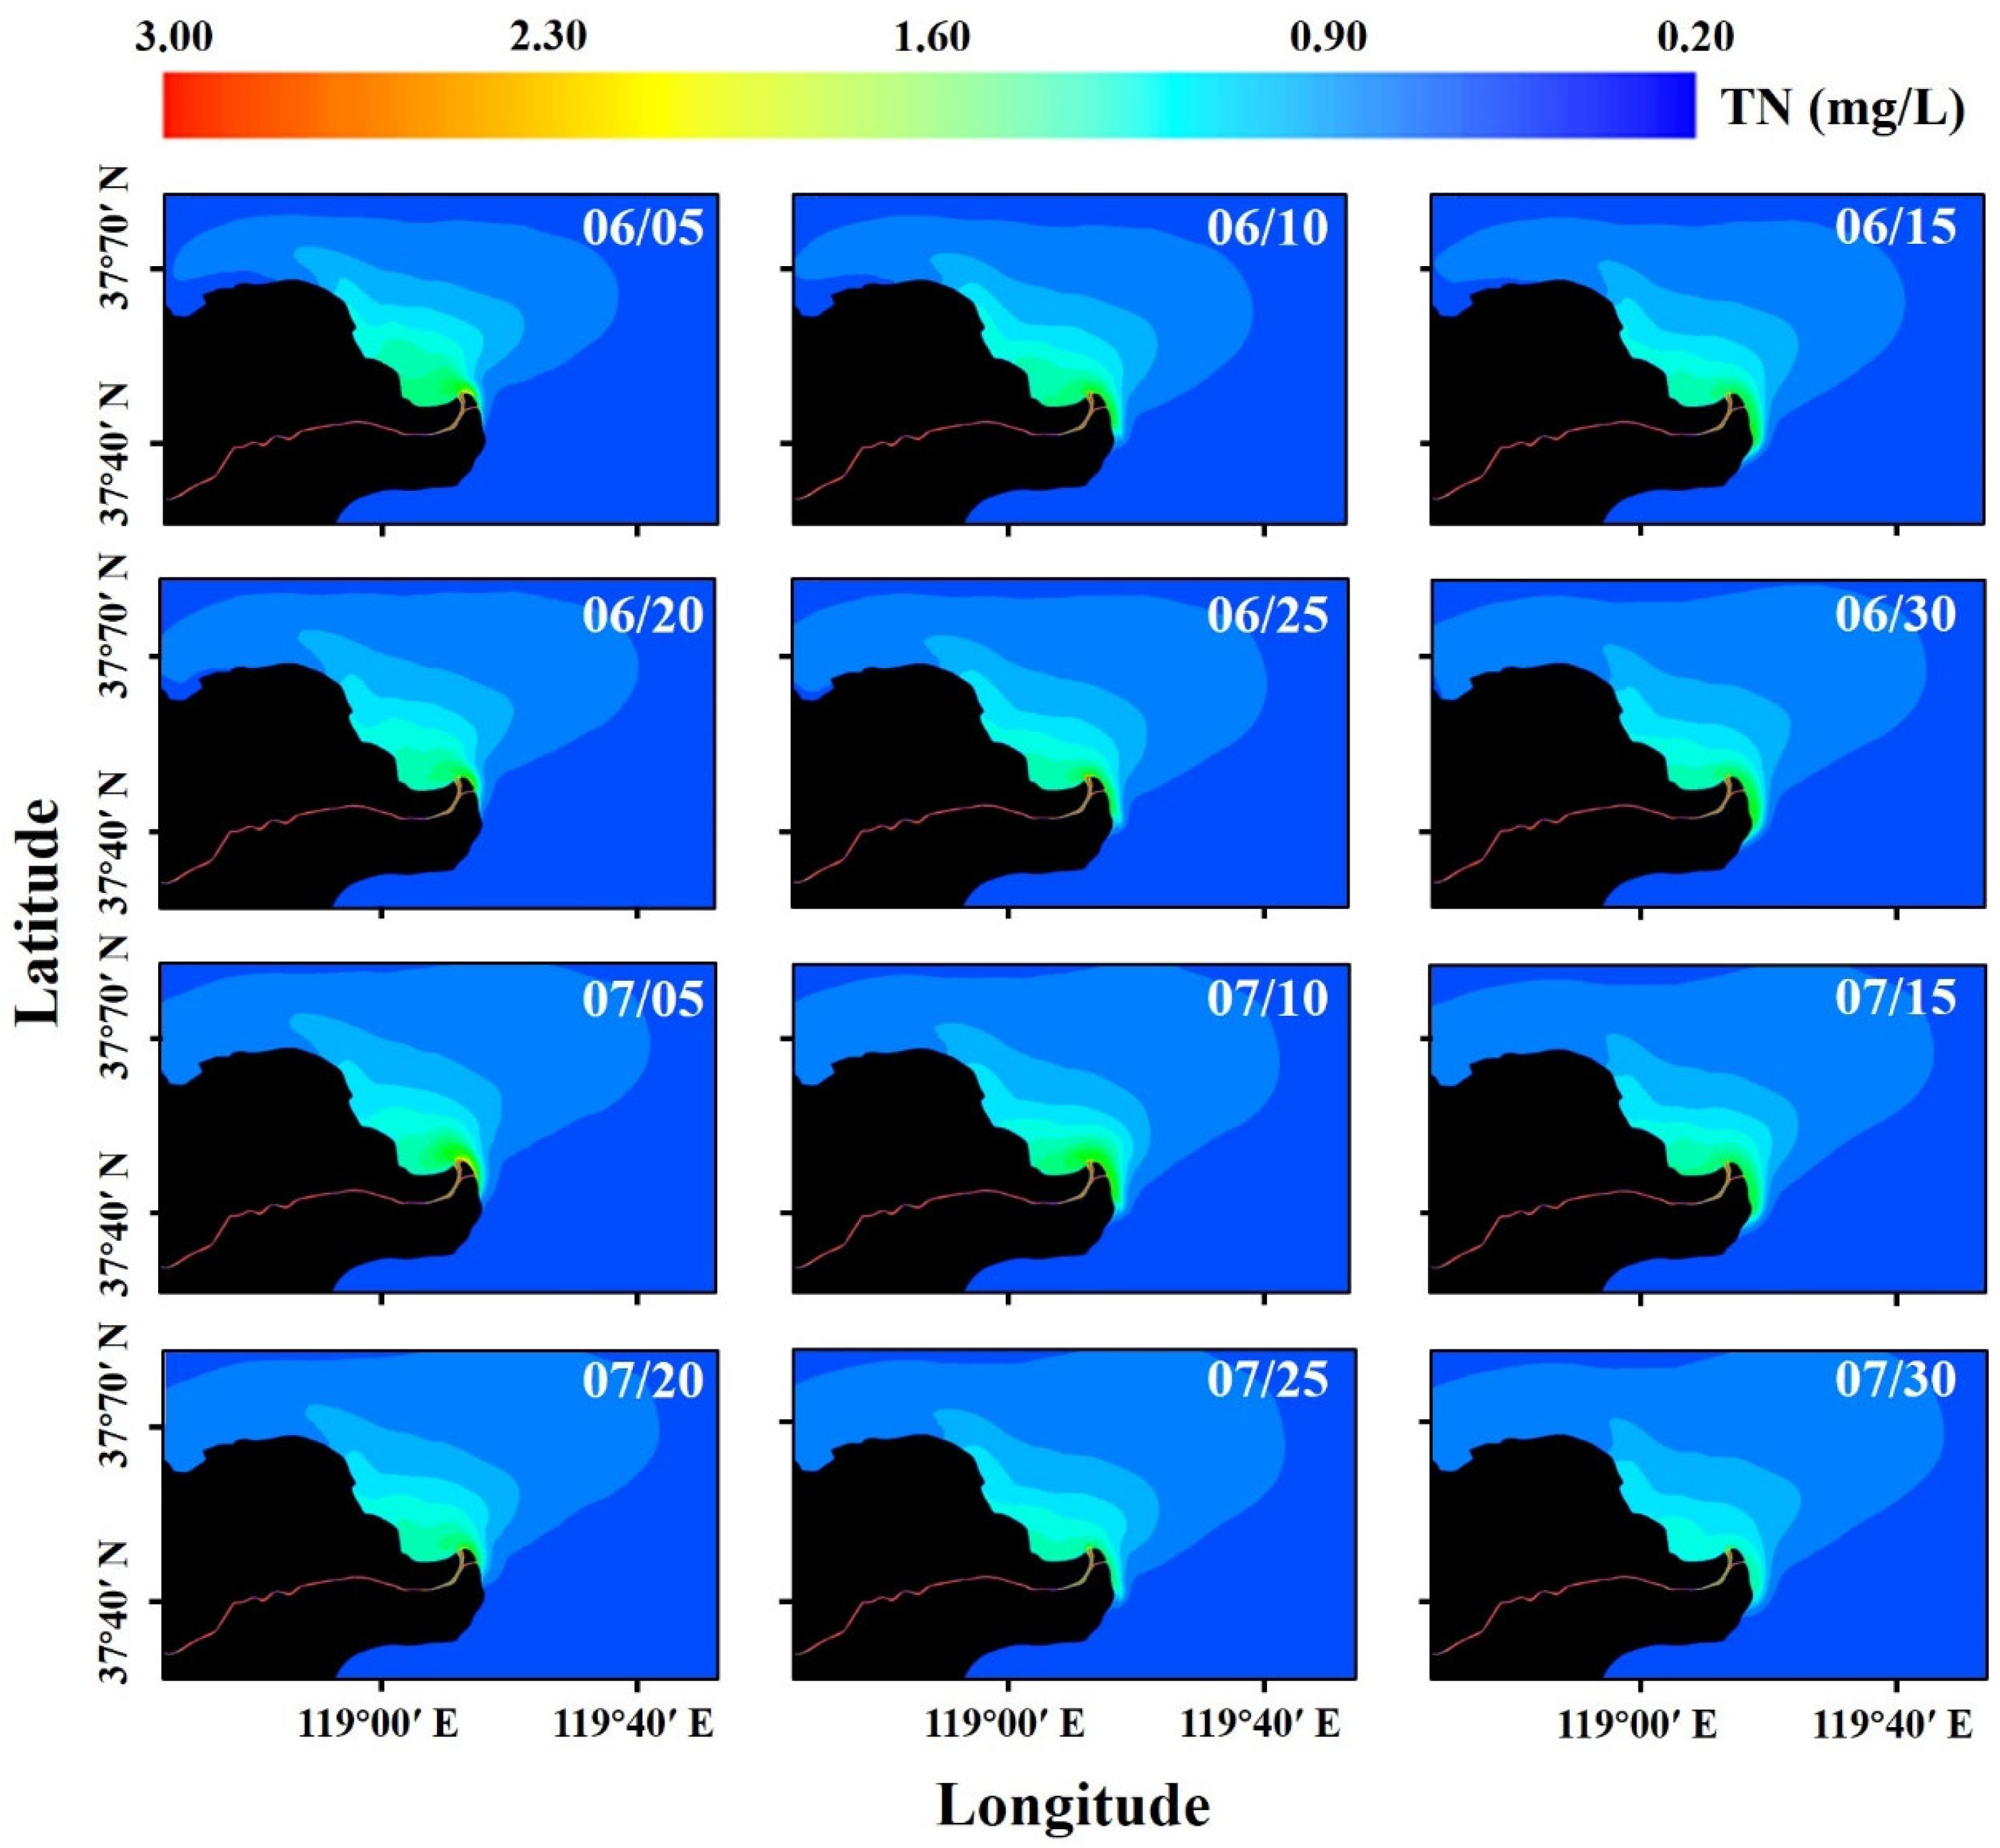
Since the implementation of the WSRS in 2002, it has continued to be implemented in all years except for 2016 and 2017, when it was suspended due to a significant reduction in upstream water and sediment discharge. In addition, the river channel of the YRD was basically unchanged from 2017 to 2019. Therefore, these two years can be used to explore the influence of the years with or without the WSRS on the TN diffusion range in the YRE. Overall, TN concentration in the YRE was lower than 2 mg/L from June to July 2017. The water with high TN concentration was mainly distributed in Gudong coastal areas, which came from the north outlet of the YRE. The water from the east outlet is distributed southward under a tidal current within 1.5 km of the coast. It can be seen that the TN diffusion range is obviously smaller in the year without the WSRS (2017) than in the year with the WSRS (2019). Some previous studies reported that riverine freshwater is one of the most dominant nutrient sources in the YRE [43,44]. From 5 June to 15 June in 2017, water with TN concentration higher than 1 mg/L diffused from the estuary to the north by about 2.17 km, with an area of about 38.7–45.2 km2. However, the northward diffusion range of TN in 2019 was about 3.4 times (7.38 km) that in 2017. (Figure 9, Figure 11). By comparing the average runoff from 5 June to 15 June over these two years, it was about 2.7 times higher in 2019 than in 2017. These results show that runoff is also an important factor that determines the range of TN diffusion.
Furthermore, the average northward diffusion range of water with TN concentration higher than 1 mg/L was about 24.95 km during the WSRS in 2019, which was nearly 10 times that in the same period in 2017 (2.38 km). By calculating the average runoff over this period of two years, the value of 2019 (2358.08 m3/s) was about 6.88 times as high as 2017 (342.65 m3/s). This indicates that the WSRS can rapidly increase TN concentration in the YRE and increase its diffusion range in a short time. Since the direction of the river channel in the YRD remained basically unchanged in 2017 and 2019, the diffusion range of TN was mainly distributed near the Gudong Coast, both before and during the WSRS. Although a large amount of freshwater enters the YRE during the WSRS, water with high TN concentration from the eastern outlet was still distributed within 3 km of the YRD. Thus, water with a high TN concentration from the north outlet became the main source of nutrient diffusion in the YRE.

5. Conclusions

In this paper, the effects of river migration and human intervention (WSRS) on the TN diffusion process in the YRE were studied by means of data analysis and numerical simulation. Among them, the WSRS was implemented in 2009 and 2019, but there were differences in the morphology of the YRE, which facilitated the analysis of the TN diffusion process in the YRE by river migration. In addition, the estuary morphology in 2017 and 2019 is similar, but the WSRS was not implemented in 2017, which facilitates the analysis of the impact of the implementation of the WSRS on the TN migration and diffusion process in the YRE. This will help in further understanding the roles of river evolution and human activities in the estuary coastal area water quality change rule, and also provide a scientific basis for improving the bay water safety quality. The main conclusions of this paper are as follows:
(1)
The change in river channel direction in the YRD affected the diffusion direction of high-concentration-TN water in the YRE, from the east–west diffusion in 2009 to the north–south diffusion in 2019.
(2)
For the years with the WSRS (2009 and 2019), the farthest diffusion distance of the high-concentration-TN water body is basically consistent with the edge of the estuary plume. In 2009, it was about 30 km to the southeast side of the estuary, and in 2019, it was about 26.5 km to the north side of the estuary. At 25–26 °C, TN concentrations of 0.5 mg/L (2009) and 1.05 mg/L (2019) can be used as the threshold for the longest diffusion distance to different river channels.
(3)
For the year without the WSRS (2017), TN concentration in the YRE was generally lower than 2 mg/L from June to July, and below the average concentration during 2019. In addition, the average northward diffusion distance in 2017 was only 10% of the average during the 2019 WSRS.
(4)
Runoff directly determines the diffusion range of TN in the YRE. The average runoff during the WSRS in 2019 was 6.88 times that during the same period in 2017, resulting in a 10-times-higher diffusion distance for high TN concentrations in 2019 compared with 2017.
While this study has provided the influence of river channel change and basin water and sediment regulation events on the process and law of TN migration and diffusion in the estuary by two-dimensional numerical simulation, there are several avenues for further research. On the one hand, there are some small rivers entering the sea along the Laizhou Bay in the south of the YRE. In the future, the TN migration process of these rivers can be simulated and calculated to understand the nutrient transport law in Laizhou Bay and other sea areas more comprehensively. On the other hand, the three-dimensional hydrodynamic water quality model of the estuary can be used to further explore the changes in vertical nutrients, and other research objects such as TP and COD can also be studied.
The original monitoring data of TN in this paper was collected by obtaining the data in the references, which limits the observation range and time of the data.

Author Contributions

Conceptualization, C.L. and Z.W.; methodology, C.L. and X.W.; software, C.L. and Z.W.; validation, C.L., Z.W., and Y.L.; formal analysis, C.L.; investigation, L.Z.; resources, C.L. and Z.W.; data curation, C.L. and Z.W.; writing—original draft preparation, C.L.; writing—review and editing, C.L., Z.W., B.D., and X.W.; visualization, C.L., Z.W., and B.D.; supervision, C.L., Z.W., and Y.L.; project administration, C.L.; funding acquisition, Z.W. and Y.L. All authors have read and agreed to the published version of the manuscript.

Funding

This research was funded by the National Key Research and Development Program of China (grant number 2018YFC1407601), National Natural Science Foundation of China (grant numbers U2340217, U2240206, 5217110695, 52071221), Natural Science Foundation of Jiangsu Province (BK20191130) and Special Funds for Basic Scientific Research Business Expenses of Central Public Welfare Scientific Research Institutes of China (Y221010).

Institutional Review Board Statement

Not applicable.

Informed Consent Statement

Not applicable.

Data Availability Statement

The original contributions presented in this study are included in the article.

Acknowledgments

The authors wish to thank the anonymous reviewers for their careful work and thoughtful suggestions that substantially improved this paper.

Conflicts of Interest

The authors declare no conflicts of interest.

References

  1. Huang, X.; Zhang, D.; Wang, F.; Zhao, Z.; Chen, A.; Zhang, J.; Zhang, C.; Wu, L.; Li, Y.; Ma, B.; et al. Porewater dissolved inorganic carbon released due to artificial scouring in the Yellow River. Appl. Geochem. 2023, 149, 105557. [Google Scholar] [CrossRef]
  2. Dai, M.; Wang, L.; Guo, X.; Zhai, W.; Li, Q.; He, B.; Kao, S.J. Nitrification and inorganic nitrogen distribution in a large perturbed river/estuarine system: The Pearl River Estuary, China. Biogeosciences 2008, 5, 1545–1585. [Google Scholar] [CrossRef]
  3. Bi, N.; Yang, Z.; Wang, H.; Hu, B.; Ji, Y. Sediment dispersion patterns off the present Huanghe (Yellow River) subdelta and its dynamic mechanism during normal river discharge period. Estuar. Coast. Shelf Sci. 2010, 86, 352–362. [Google Scholar]
  4. Domingues, R.B.; Barbosa, A.B.; Sommer, U.; Galvaoa, H.M. Phytoplankton composition, growth and production in the Guadiana estuary (SW Iberia): Unraveling changes induced after dam construction. Sci. Total Environ. 2012, 416, 300–313. [Google Scholar] [CrossRef] [PubMed]
  5. Dong, Z.J.; Yang, Q.; Sun, T.T.; Wang, Y.J.; Jiang, H.C.; Liu, D. Spatial and seasonal variability of the zooplankton community in the Yellow River Estuary’s adjacent sea. Acta Ecol. Sin. 2017, 37, 659–0667. [Google Scholar]
  6. Zhang, J.F.; Zhang, M.M.; Zhang, S.X.; Xu, Q.; Liu, X.X.; Zhang, Z.Y. Nutrient distribution and structure affect the behavior and speciation of arsenic in coastal waters: A case study in southwestern coast of the Laizhou Bay, China. Mar. Pollut. Bull. 2019, 146, 377–386. [Google Scholar] [CrossRef]
  7. Chi, Y.; Zhao, M.W.; Sun, J.K.; Xie, Z.L.; Wang, E.K. Mapping soil total nitrogen in an estuarine area with high landscape fragmentation using a multiple-scale approach. Geoderma 2019, 339, 70–84. [Google Scholar] [CrossRef]
  8. Zhang, T.; Song, B.; Han, G.X.; Zhao, H.L.; Hu, Q.L.; Zhao, Y.; Liu, H.J. Effect of coastal wetland reclamation on soil organic carbon, total nitrogen, and total phosphorus in China; A meta-analysis. Land Degrad. Dev. 2023, 34, 3340–3349. [Google Scholar] [CrossRef]
  9. Ji, H.Y.; Pan, S.Q.; Chen, S.L. Impact of river discharge on hydrodynamics and sedimentary processes at yellow river delta. Mar. Geol. 2020, 425, 106210. [Google Scholar] [CrossRef]
  10. Liu, S.M.; Li, L.W.; Zhang, G.L.; Liu, Z.; Yu, Z.G.; Ren, J.L. Impact of human activities on nutrient transport in the Huanghe (Yellow River) estuary. J. Hydrol. 2012, 430–431, 103–110. [Google Scholar] [CrossRef]
  11. Milliman, J.D.; Meade, R.H. World-wide delivery of river sediment to the oceans. J. Geol. 1983, 91, 1–21. [Google Scholar] [CrossRef]
  12. Bai, J.; Xiao, R.; Zhang, K.; Gao, H. Arsenic and heavy element pollution in wetland soils from tidal freshwater and salt marshes before and after the flow-sediment regulation regime in the Yellow River Delta, China. J. Hydrol. 2012, 450–451, 244–253. [Google Scholar] [CrossRef]
  13. Bi, N.S.; Yang, Z.S.; Wang, H.J.; Xu, C.L.; Guo, Z.G. Impact of artificial water and sediment discharge regulation in the Huanghe (Yellow River) on the transport of particulate heavy metals to the sea. Catena 2014, 121, 232–240. [Google Scholar] [CrossRef]
  14. Cheng, Q.L.; Zhou, W.F.; Zhang, J.; Shi, L.; Xie, Y.F.; Li, X.D. Spatial variations of arsenic and heavy metal pollutants before and after the water-sediment regulation in the wetland sediments of the Yellow River estuary, China. Mar. Pollut. Bull. 2019, 145, 138–147. [Google Scholar] [CrossRef]
  15. Hou, C.Y.; Yi, Y.J.; Song, J.; Zhou, Y. Effect of water-sediment regulation operation on sediment grain size and nutrient content in the lower Yellow River. J. Clean. Prod. 2021, 279, 123533. [Google Scholar] [CrossRef]
  16. Qiao, S.W.; Yang, Y.Y.; Xu, B.C.; Yang, Y.; Zhu, M.M.; Li, F.; Yu, H.M. How the Water-Sediment Regulation Scheme in the Yellow River affected the estuary ecosystem in the last 10 years? Sci. Total Environ. 2024, 927, 172002. [Google Scholar] [CrossRef]
  17. Hu, X.L.; Chen, S.L.; Liu, X.X.; Gu, G.C. Diffusion path and range of water flow and sediment in Yellow River Estuary during water-sediment regulation in 2012. J. Sediment Res. 2014, 3, 49–56. (In Chinese) [Google Scholar]
  18. Zhang, X.D.; Yang, Z.S.; Zhang, Y.X.; Ji, Y.; Wang, H.M.; Lv, K.; Lu, Z.Y. Spatial and temporal shoreline changes of the southern Yellow River (Huanghe) Delta in 1976–2016. Mar. Geol. 2018, 395, 188–197. [Google Scholar] [CrossRef]
  19. Xu, Y.; Pu, L.; Liao, Q.; Zhu, M.; Yu, X.; Mao, T.; Xu, C. Spatial Variation of Soil Organic Carbon and Total Nitrogen in the Coastal Area of Mid-Eastern China. Int. J. Environ. Res. Public Health 2017, 14, 780. [Google Scholar] [CrossRef]
  20. Li, X.Y.; Chen, H.T.; Jiang, X.Y.; Yu, Z.G.; Yao, Q.Z. Impacts of human activities on nutrient transport in the Yellow River: The role of the water-sediment regulation scheme. Sci. Total Environ. 2017, 592, 161–170. [Google Scholar] [CrossRef]
  21. Peng, J.; Chen, S.; Dong, P. Temporal variation of sediment load in the Yellow River basin, China, and its impacts on the lower reaches and the river delta. Catena 2010, 83, 135–147. [Google Scholar] [CrossRef]
  22. Bi, H.S.; Sun, S.; Gao, S.W. Ecological characteristics of zooplankton community in Bohai Sea I: Species composition and community structure. Acta Ecol. Sin. 2000, 20, 715–721. [Google Scholar]
  23. Meybeck, M. The global change of continental aquatic systems: Dominant impacts of human activities. Water Sci. Technol. 2004, 49, 73–83. [Google Scholar] [CrossRef] [PubMed]
  24. Huai, W.X.; Zeng, X.H.; Komatsu, T. Numerical simulation of residual circulation due to bottom roughness variability under tidal flows in a semi-enclosed bay. China Ocean. Eng. 2005, 19, 601–612. [Google Scholar]
  25. Kuang, C.P.; Chen, S.Y.; Zhang, Y.; Gu, J.; Pan, Y.; Huang, J. A two-dimensional morphological model based on a next generation circulation solver I: Formulation and validation. Coast. Eng. 2012, 59, 1–13. [Google Scholar] [CrossRef]
  26. Xue, S.L.; Jian, H.M.; Yang, F.X.; Liu, Q.; Yao, Q.Z. Impact of water-sediment regulation on the concentration and transport of dissolved heavy metals in the middle and lower reaches of the Yellow River. Sci. Total Environ. 2022, 806, 150535. [Google Scholar]
  27. Wang, H.J.; Wu, X.; Bi, N.S.; Li, S.; Yuan, P.; Wang, A.M.; Syvitski, J.P.M.; Saito, Y.; Yang, Z.S.; Liu, S.M.; et al. Impacts of the dam-orientated water-sediment regulation scheme on the lower reaches and delta of the Yellow River (Huanghe): A review. Glob. Planet. Change 2017, 157, 93–113. [Google Scholar] [CrossRef]
  28. Xia, X.H.; Dong, J.W.; Wang, M.H.; Xie, H.; Xia, N.; Li, H.S.; Zhang, X.T.; Mou, X.L.; Wen, J.J.; Bao, T.M. Effect of water-sediment regulation of the Xiaolangdi reservoir on the concentrations, characteristics, and fluxes of suspended sediment and organic carbon in the Yellow River. Sci. Total Environ. 2016, 571, 487–497. [Google Scholar] [CrossRef]
  29. Yu, Y.; Shi, X.F.; Wang, H.J.; Yue, C.K.; Chen, S.L.; Liu, Y.G.; Hu, L.M.; Qiao, S.Q. Effects of dams on water and sediment delivery to the sea by the Huanghe (Yellow River): The special role of water-sediment modulation. Anthropocene 2013, 3, 72–82. [Google Scholar] [CrossRef]
  30. Zhang, X.L.; Chen, H.T.; Yao, Q.Z.; Zhang, X.X. The seasonal changes and flux of trace elements in the lower reaches of Yellow River. Period. Ocean. Univ. China 2013, 43, 69–75. [Google Scholar]
  31. Zhou, Q.Q.; Yang, N.; Li, Y.Z.; Ren, B.; Ding, X.H.; Bian, H.L.; Yao, X. Total concentrations and sources of heavy metal pollution in Global River and Lake water bodies from 1972 to 2017. Glob. Ecol. Conserv. 2020, 22, e00925. [Google Scholar] [CrossRef]
  32. Seitzinger, S.P.; Mayorga, E.; Bouwman, A.F.; Kroeze, C.; Beusen, A.H.W.; Billen, G.; Van Drecht, G.; Dumont, E.; Fekete, B.M.; Garnier, J. Global river nutrient export: A scenario analysis of past and future trends. Glob. Biogeochem. Cycles 2010, 24, 2621–2628. [Google Scholar] [CrossRef]
  33. Wang, Z.L.; Geng, Y.F.; Jin, S. An unstructured finite-volume algorithm for nonlinear two-dimensional shallow water equation. J. Hydrodyn 2005, 17, 306–312. [Google Scholar]
  34. Geng, Y.F.; Wang, Z.L. A coastal ocean model of semi-implicit finite volume unstructured grid. China Ocean. Eng. 2012, 26, 277–290. [Google Scholar] [CrossRef]
  35. Hou, Q.Z.; Lu, Y.J.; Wang, Z.L.; Mo, S.P. Cumulative response of estuarine bay hydrodynamic environment to human activities: Example of Lingding Bay of the Pearl River Estuary. Water Sci. 2019, 30, 789–799. [Google Scholar]
  36. Wang, Z.L.; Lu, Y.J.; Zuo, L.Q. Unstructured 3D baroclinic model of current and salt for strong tidal estuary. Ocean. Eng. 2008, 26, 44–53. [Google Scholar]
  37. Xue, B.S.; Lu, Y.J.; Xiao, H.Q.; Wang, Z.L.; Wu, P.; Diao, M.J. Processes of stratification and vertical turbulent mixing in a choked lagoon system. Estuarine Coast. Shelf Sci. 2024, 299, 108663. [Google Scholar] [CrossRef]
  38. Zolfaghari, H.; Becsek, B.; Nestola, M.G.C.; Sawyer, W.B.; Krause, R.; Obrist, D. High-order accurate simulation of incompressible turbulent flows on many parallel GPUs of a hybrid-node supercomputer. Comput. Phys. Commun. 2019, 244, 132–142. [Google Scholar] [CrossRef]
  39. Bonaglia, S.; Deutsch, B.; Bartoli, M.; Marchant, H.M.; Bruchert, V. Seasonal oxygen, nitrogen and phosphorus benthic cycling along an impacted Baltic Sea estuary: Regulation and spatial patterns. Biogeochemistry 2014, 119, 139–160. [Google Scholar] [CrossRef]
  40. Li, G.Y.; Sheng, L.X. Model of water-sediment regulation in Yellow River and its effect. Sci. China Technol. Sci. 2011, 54, 924–930. [Google Scholar] [CrossRef]
  41. Wahl, D.H.; Goodrich, J.; Nannini, M.A.; Dettmers, J.M.; Soluk, D.A. Exploring riverine zooplankton in three habitats of the Illinois River ecosystem: Where do they come from? Limnol. Oceanogr. 2008, 53, 2583–2593. [Google Scholar] [CrossRef]
  42. Zhang, S.; Pei, H.; Wei, J.; Zhu, Y.; Wang, Y.; Yang, Z. The seasonal and spatial variations in diatom communities and the influence of environmental factors on three temperate reservoirs in Shandong province, China. Environ. Sci. Pollut. Res. 2019, 26, 24503–24515. [Google Scholar] [CrossRef]
  43. Xu, B.; Yang, D.; Burnett, W.C.; Ran, X.; Yu, Z.; Gao, M.; Diao, S.; Jiang, X. Artificial water sediment regulation scheme influences morphology, hydrodynamics and nutrient behavior in the Yellow River estuary. J. Hydrol. 2016, 539, 102–112. [Google Scholar] [CrossRef]
  44. Ying, Y.M.; Wang, X.; Shang, M.; Cun, X.R.; Huang, R.J.; Su, C.L.; Han, B.; Huang, Q. Effects of Water-Sediment Regulation on spatial-temporal distribution of nutrients in the lower Yellow River. Res. Square 2024, preprint. [Google Scholar] [CrossRef]
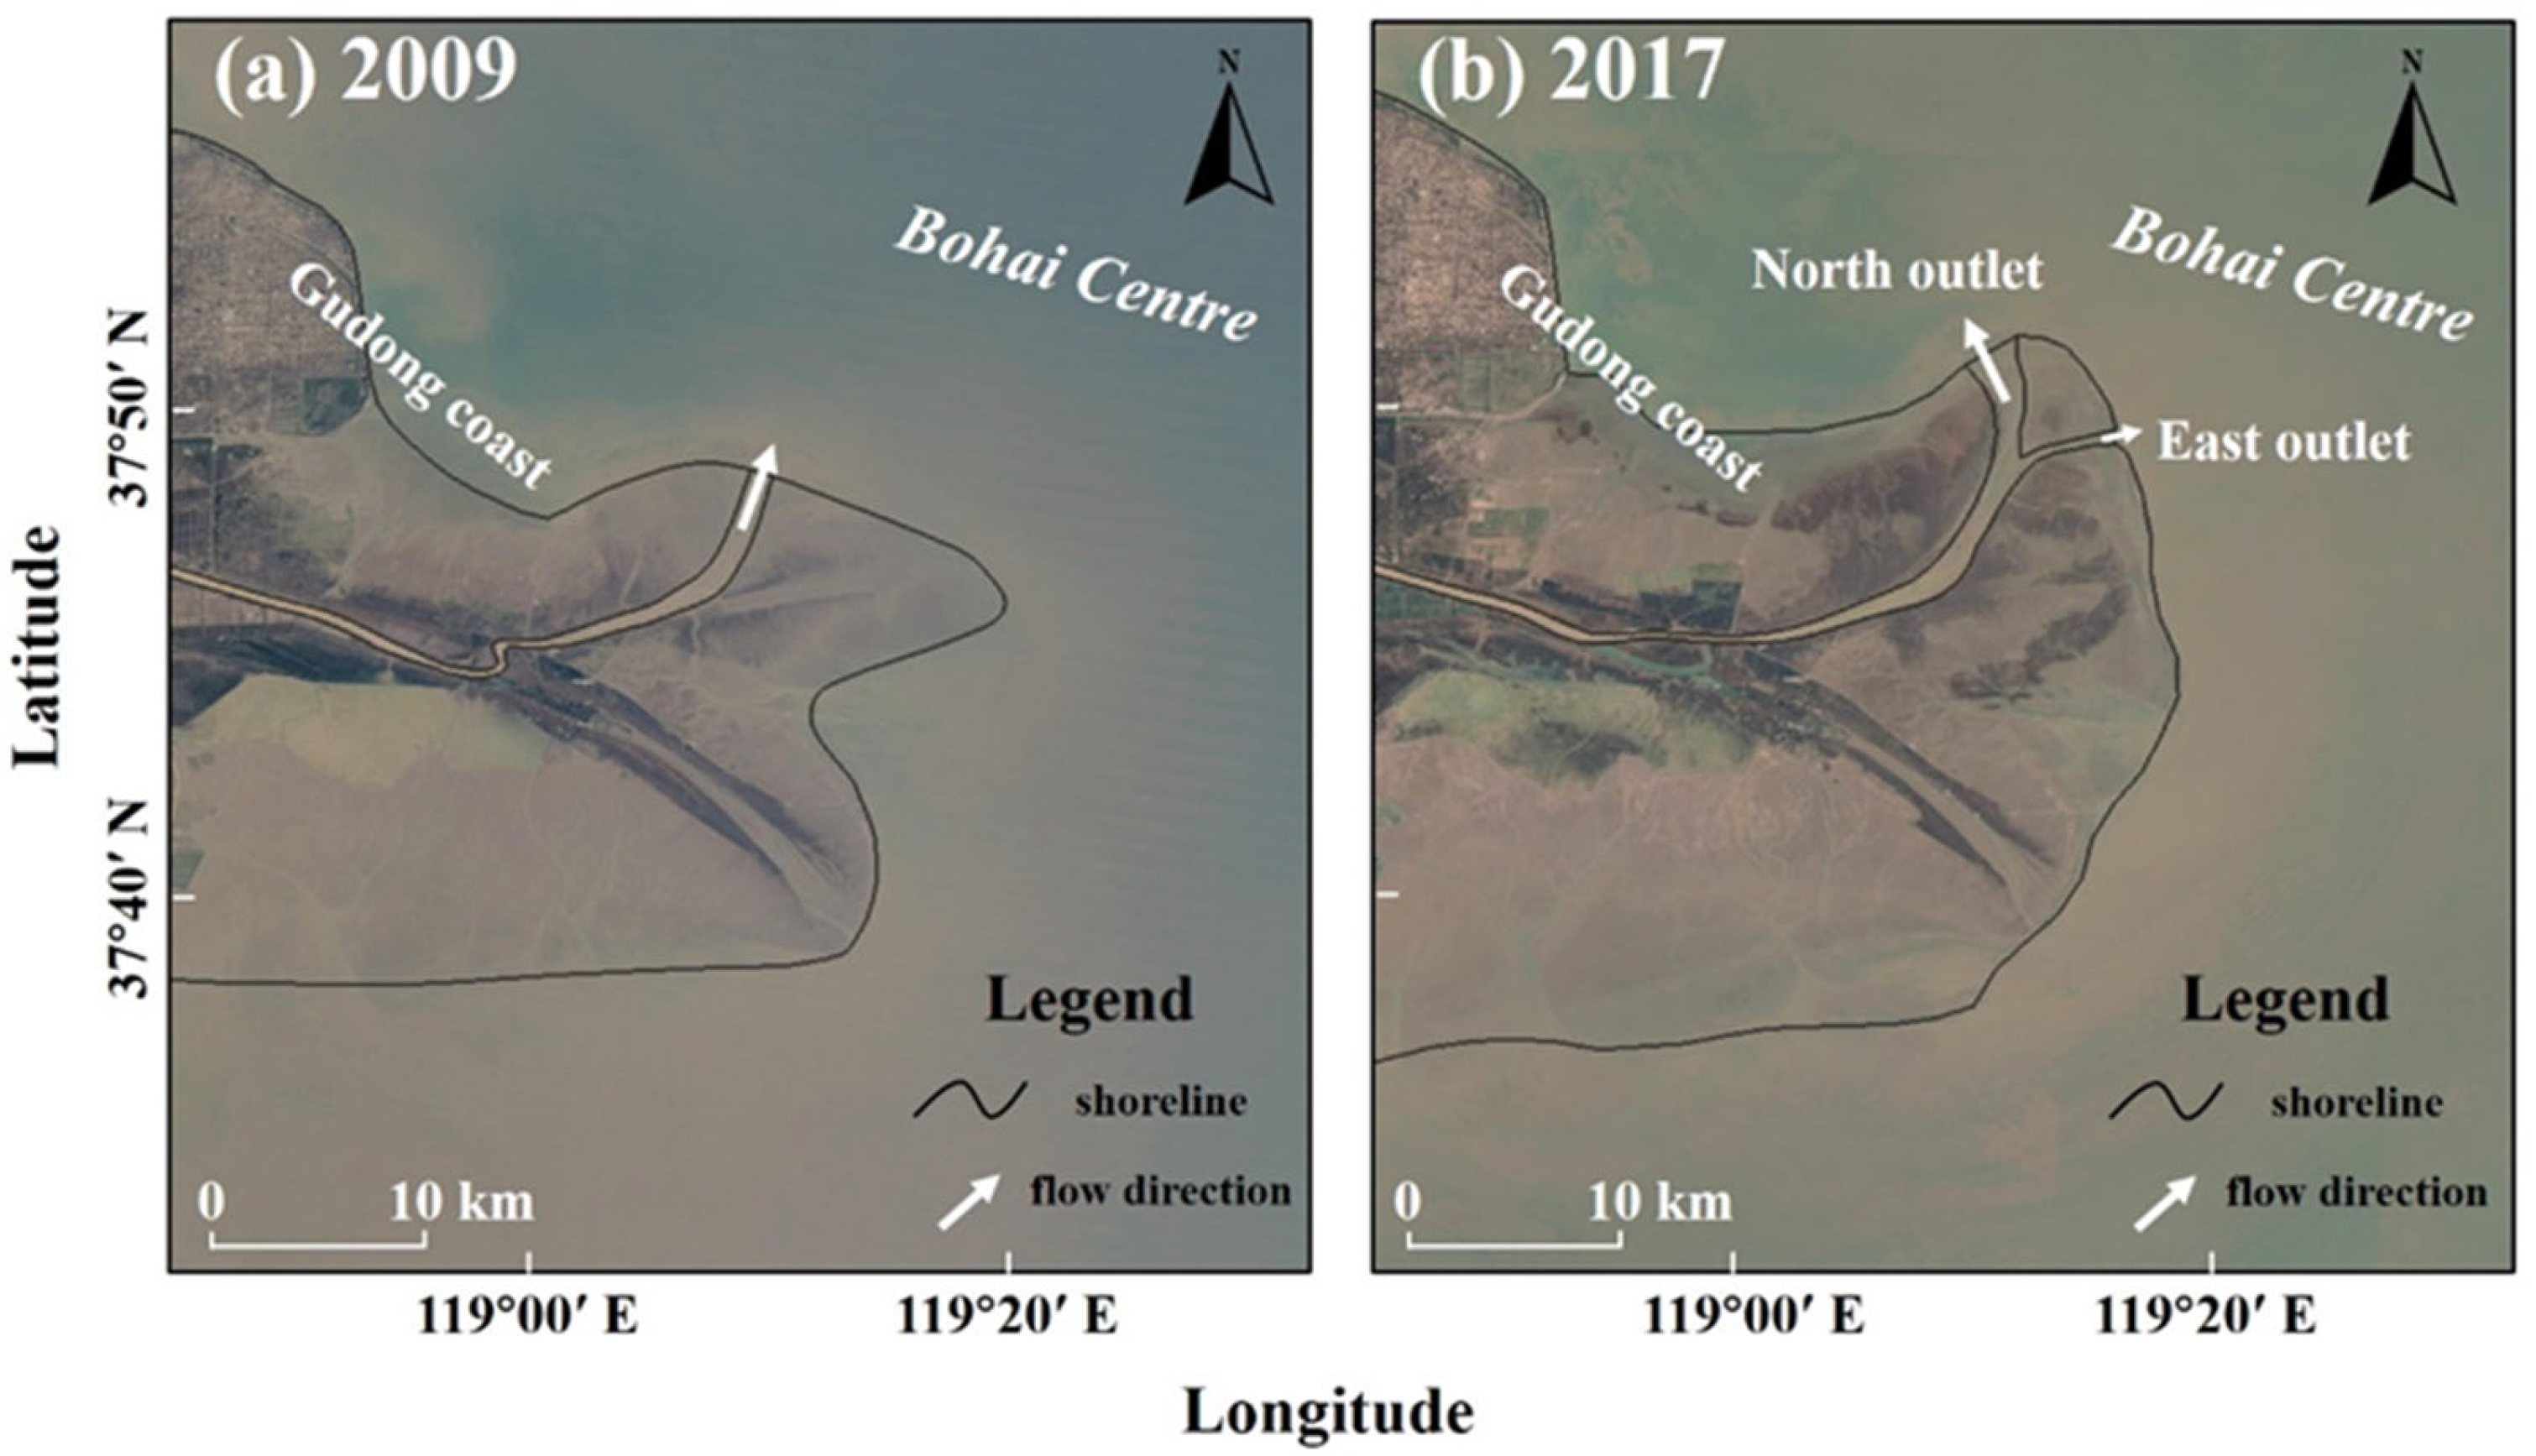
Figure 1. Comparison of the YRE and the coastline of the YRD in (a) 2009 and (b) 2017.
Sustainability 17 09145 g001
Figure 2. The location below Lijin station of the Yellow River and Bohai Bay. (A) Depth, tidal stations, and locations of fields observations; (B) model grid and model boundary position.
Sustainability 17 09145 g002
Figure 3. Comparisons between the simulated water elevation (line) and the tide table data (dots) from 5 August to 14 August 2017 at the tide gauge stations in (a) Dalian (DL), (b) Yantai YT), (c) Penglai (PL), (d) Jintanggang (JTG), (e) Jinzhougang (JZG), and (f) Bayuquan (BYQ).
Sustainability 17 09145 g003
Figure 4. Comparisons of the computed and measured flow velocities and directions. The red dot are the measured values, and the black solid lines are the simulated values.
Sustainability 17 09145 g004
Figure 5. Comparisons of the simulated and measured TN concentrations in the YRE. Scatter point extraction of TN concentration in YRE (a) before, (d) during, and (g) after the WSRS. The measured concentration of TN in the YRE (b) before, (e) during, and (h) after water and sediment regulation was obtained by kriging interpolation. The simulated value of TN content distribution in the YRE (c) before, (f) during, and (i) after water and sediment regulation.
Sustainability 17 09145 g005
Figure 6. Comparison of TN measured value and simulated value (a) before the WSRS, (b) during the WSRS, and (c) after the WSRS. The red symbol points are the comparison between the simulated values and the measured values, and the black dotted line are the fitting relationship lines between the simulated values and the measured values.
Sustainability 17 09145 g006
Figure 7. Daily average water discharge at Lijin Station, 2009, 2017, and 2019.
Sustainability 17 09145 g007
Figure 8. TN concentration distribution before, during, and after the WSRS in the YRE in 2009.
Sustainability 17 09145 g008
Figure 9. TN concentration distribution before, during, and after the WSRS in the YRE in 2019.
Sustainability 17 09145 g009
Figure 10. Maximum range of TN diffusion and estuarine plumes in (a) 2009 and (b) 2019. The White dotted line represents the boundary of estuarine plumes (TN = 0.5 mg/L in 2009, and TN = 1.05 mg/L in 2019).
Sustainability 17 09145 g010
Figure 11. TN concentration distribution before, during, and after the WSRS in the YRE in 2017.
Sustainability 17 09145 g011
Disclaimer/Publisher’s Note: The statements, opinions and data contained in all publications are solely those of the individual author(s) and contributor(s) and not of MDPI and/or the editor(s). MDPI and/or the editor(s) disclaim responsibility for any injury to people or property resulting from any ideas, methods, instructions or products referred to in the content.