Article

Use of Project Management Knowledge Areas in Civil Infrastructure Projects: Implications for Sustainability Assessment and Risk Analysis

by
Abdullah Emre Keleş
1,
Gizem Görkem Gülek
1 and
Jarosław Górecki
2,*
1
Department of Civil Engineering, Adana Alparslan Türkeş Science and Technology University, 01250 Adana, Türkiye
2
Faculty of Civil and Environmental Engineering and Architecture, Bydgoszcz University of Science and Technology, 85-796 Bydgoszcz, Poland
*
Author to whom correspondence should be addressed.
Sustainability 2025, 17(20), 9129; https://doi.org/10.3390/su17209129
Submission received: 28 August 2025 / Revised: 7 October 2025 / Accepted: 13 October 2025 / Published: 15 October 2025

Abstract

The success of civil infrastructure projects hinges on effective project management. Building on the PMBOK® Guide framework, this study investigates how project management knowledge areas are used in practice and how their use relates to the integration of sustainability and risk-management principles. 272 construction professionals in Türkiye were surveyed and their responses were analyzed using reliability testing, normality checks, and a combination of non-parametric tests (Mann–Whitney U, Kruskal–Wallis) and ANOVA. There were found significant differences in perceived use of knowledge areas by education level, project role, project profile, and prior project-management training; in applied practice, company profile explains variation, whereas project type does not. The results indicate that wider, more systematic adoption—particularly in integration, schedule/time, quality, and risk—supports transparent, traceable processes aligned with sustainability objectives. These behavioral determinants were interpreted as enablers of life-cycle sustainability assessment and risk-informed decision making across civil-infrastructure contexts. There were discussed managerial and policy implications for asset owners and contractors, identifying leverage points for training and capability building, and outlining how standardized use of PMBOK knowledge areas can accelerate sustainability assessment and risk analysis in practice.

1. Introduction

The construction sector remains a key industry, continuously evolving in response to societal needs and technological advancements [1]. It is a well-known fact that it contributes significantly to the economy with its share in national income, its impact on the development of many different sectors, and its high employment capacity.
The construction sector is of strategic importance today not only because of its contribution to economic growth and high employment potential, but also because of its environmental and social impacts. Global challenges such as population growth, the rapid depletion of natural resources, and increasing environmental pollution have highlighted the need to reassess construction projects from a sustainability perspective [2,3].
The concept of sustainability in the construction sector is not limited to the management of environmental impacts but requires a holistic approach that also encompasses the principles of economic efficiency, social responsibility, and technical suitability. In this context, the integration of sustainability principles into construction projects is made possible through an effective project management approach.
Project management provides a systematic approach that enables construction projects to be planned, executed, and monitored in accordance with specific objectives and constraints. In the classical sense, project management involves the management of fundamental elements such as time, cost, scope, and quality. However, today, sustainability has been integrated into these practices, resulting in a significant expansion of the project management process.
In project management, sustainability is not considered an additional component but rather a fundamental principle that must be integrated into the entire project management process. In this context, the application of the project management knowledge areas defined by the Project Management Institute (PMI) in construction projects is of critical importance for the effective achievement of sustainability goals.

1.1. Use of Project Management Knowledge Areas in Construction Sector

Project management is defined as the art and science of efficiently using experience, knowledge, skills, tools, and techniques to meet stakeholder’s expectations [4]. A Guide to the Project Management Body of Knowledge, also known as PMBOK® Guide published by PMI in 2017 as sixth edition [5] summarizes the elements necessary for the process to be successful under ten headings as “Project Management Knowledge Areas”. These are: integration management, scope management, schedule management (formerly: time management), cost management, quality management, resource management (formerly: human resources management), communications management, risk management, procurement management, and stakeholder management [5,6,7]. Each knowledge area can be explained in turn, with consideration given to its contribution to sustainability in the construction sector as follows.

1.1.1. Project Integration Management

Integration management aims to ensure that different areas of information work in harmony in construction projects, thereby enabling project objectives to be achieved effectively. The holistic management of elements such as design, budget, scheduling, workforce, and procurement not only supports project success but also sustainability goals [8].

1.1.2. Project Scope Management

Scope management is a systematic process consisting of planning, definition, work breakdown structure creation, verification, and control stages that ensures activities appropriate to the project’s objectives are identified and included in the process [9]. In construction projects, clearly and accurately defining the scope contributes directly to sustainability by preventing waste of resources, reducing unnecessary material use, and minimizing environmental impacts.

1.1.3. Project Schedule Management

Completing projects in accordance with specified time, cost, and quality targets is one of the fundamental challenges of project management. The time management process includes defining activities, sequencing them, estimating resources, and analyzing time frames. Time schedules created using techniques such as Gantt charts, Critical Path Method (CPM), and PERT ensure the effective use of resources and contribute to the optimization of project duration. Nowadays, this challenge can be achieved with sophisticated modeling environments based on the Building Information Modeling [10]. In this regard, the effective implementation of time management plays a critical role in achieving economic efficiency and environmental sustainability goals in construction projects.

1.1.4. Project Cost Management

The primary objective of companies in the construction industry is to complete projects cost-effectively within the specified budget [11]. Cost is the monetary value of the resources required for project [12]. Project cost management encompasses planning, estimation, budgeting, and control processes and optimizes resource utilization. Cost management supports the sustainable development of construction projects by promoting resource efficiency and preventing waste.

1.1.5. Project Quality Management

Quality management is a fundamental factor in meeting customer expectations and successfully completing projects in the construction industry [13]. Increasing competition and industry dynamics require companies to develop quality policies that comply with national and international standards. Errors and changes in projects cause time and cost losses, while lowering quality standards negatively affects the overall success of the project. Therefore, effective quality management increases efficiency and minimizes risks by ensuring control of processes.

1.1.6. Project Resource Management

It includes the processes to identify, acquire, and manage all necessary elements needed for the successful completion of the project. One of the most important types of resources is people. Human resources management encompasses the selection, management, and organization of individuals who will be involved in the project process, ensuring harmony and cooperation among employees. Construction projects are complex structures that require the interaction of interdisciplinary teams with different knowledge and skills [14]. Human resource management contributes to social sustainability by supporting employee health, safety, and professional development, while increased motivation and productivity strengthen economic sustainability.

1.1.7. Project Communications Management

Communication management in construction projects is a fundamental process that involves collecting, analyzing, and effectively communicating the information needed during the project process [15]. The multidisciplinary nature of the project and the large number of participants make communication management a complex and strategic activity. This process also indirectly contributes to sustainable project practices by promoting the efficient use of resources and preventing unnecessary duplication.

1.1.8. Project Risk Management

All events and circumstances that could negatively affect the success of the project are defined as risks [16]. Construction projects involve complex and difficult-to-control activities from design to delivery; during this process, various risks arise from design, construction, environmental, and natural disasters. Effective risk management supports economic sustainability by ensuring the efficient use of resources and facilitates the control of environmental and social impacts, thereby contributing significantly to the sustainability of construction projects.

1.1.9. Project Procurement Management

Procurement management is a strategic process that plans the type, method, and timing of delivering goods and services required for a project. Supply chain management, on the other hand, aims to effectively coordinate the flow of products, information, and finances from the manufacturer to the end user [17]. Procurement management not only provides economic advantages but also contributes to environmental sustainability by promoting the use of local resources, reducing waste, and selecting energy-efficient materials.

1.1.10. Stakeholder Management

Individuals and institutions that are directly involved in the project, use its results, or are affected by its results are defined as stakeholders; external factors that may have an indirect impact on the project are also included in this scope. The participation of stakeholders from different disciplines, with different goals and ways of working, creates a complexity that must be managed [18]. Therefore, effective stakeholder management is critical in terms of clarifying roles and responsibilities, ensuring that project objectives are understood by participants, and facilitating collaboration. Additionally, effectively managing communication and participation among stakeholders facilitates the adoption and implementation of environmental, social, and economic sustainability principles throughout the project, thereby contributing to long-term value creation.

1.2. Research Objectives, Gap Statement, and Contributions

This study aims to empirically evaluate how the use of PMBOK® knowledge areas in construction projects supports sustainability integration. Through a survey of selected practitioners, the relationship between participants’ educational level, project role, and prior project management training and their perceptions of knowledge area usage was tested, along with differences in company and project profiles in practical application. In doing so, the study addresses three key gaps: (i) the scarcity of large-sample, role-differentiated evidence from the construction sector; (ii) limited quantitative testing of the link between PMBOK® knowledge areas and sustainability implementation; and (iii) the lack of comparative insight into organizational and project-type contexts that enable or hinder systematic use of these areas. The findings are intended to inform managers, investors, and policy-makers by identifying leverage points for training and capability building and by providing an evidence-based baseline for benchmarking and improving sustainable project-management practice.
This study aligns with civil infrastructure systems by linking the organizational use of knowledge areas to enablers of life-cycle sustainability assessment and risk-inform ed decision making in civil-infrastructure projects. It contributes empirical evidence on how education, roles, training, and company context shape systematic application of integration, schedule/time, quality, risk and procurement practices, thereby supporting sustainability assessment workflows and risk analysis across diverse construction project types.
Accordingly, to operationalize these aims and address the identified gaps, the following research questions were articulated:
RQ1: Do practitioners’ education level, project role, project profile, and prior project-management training significantly differentiate the perceived use of PMBOK® project-management knowledge areas?
RQ2: Do company profiles and project profiles significantly differentiate the application level of project-management steps?
RQ3: In what ways does the systematic application of PMBOK® knowledge areas correspond with practices of sustainability integration and risk-informed decision making in civil-infrastructure projects?
The next section outlines the research design, and analytical procedures used to respond to these questions.

2. Materials and Methods

This study examined the use of project management knowledge areas in the construction industry through a total of 318 surveys collected face-to-face from project managers, team members, and other stakeholders working in three different provinces of Turkey. The surveys were administered to individuals working in departments and fields directly related to the subject matter. Invalid or incomplete data were eliminated prior to analysis, leaving 272 valid surveys. The survey included demographic questions as well as items assessing the use of PMBOK knowledge areas and their relationship with sustainability goals. The non-demographic questions were prepared on a 5-point Likert scale and consisted of questions covering all ten knowledge areas included in the project management knowledge base guide. The data obtained were organized in Excel and analyzed using the SPSS program, applying reliability, normality, and hypothesis tests; thus, this ensures that the results were evaluated in a valid and systematic manner. Detailed explanations regarding the materials and methods used are provided in the following sections.

2.1. Material

The research aims to examine the opinions of employees in the construction sector regarding the use of project management knowledge areas and the practices implemented in their workplaces. In addition, evaluating the use of project management knowledge areas within the framework of a sustainability perspective constitutes an important dimension of the study. The sample of the research consists primarily of project managers and their teams, as well as other project stakeholders operating in the construction sector in Türkiye. In this country, the construction sector is a strategic pillar of the national economy, driving domestic demand through housing, transport, energy and urban-renewal programs, while sustaining high employment and an active export market for contracting services [19,20,21,22]. Focusing on Türkiye offers a rich testbed—projects span public and industrial assets and must address seismic-risk and sustainability requirements—so the findings are informative for readers interested in civil-infrastructure contexts that combine rapid growth with resilience and environmental performance goals. A total of 272 survey responses were evaluated in the study.

2.2. Method

In the field study, the descriptive research model was used [23]. This model aims to define and predict the relationships between two or more variables. A questionnaire was used as the data collection tool. The data obtained were documented in Excel and analyzed using the SPSS 27.0 software package. Similar studies were reviewed to achieve the research objectives.

2.2.1. Questionnaire Design and Implementation

The first ten questions of the questionnaire focused on demographic information. Participants were asked about their age, gender, field of expertise, work experience, position in the project, company and project profile, and whether they had received training in project management.
The remainder of the questionnaire measured participants’ opinions on the use of project management knowledge areas and their level of application in projects. The questions were prepared based on the definitions of the PMBOK® knowledge areas. The data obtained from the questionnaire were organized to test six hypotheses (Table 1).

2.2.2. Analysis Methods

The data were analyzed using SPSS. After being structured in Excel, they were imported into SPSS. The first step after importing was to organize the data and determine the scale type [24]. Another step was defining the variables in SPSS. Distribution graphs were prepared according to demographic characteristics and scales. Statistical tests were then applied to the hypotheses. ANOVA was used for normally distributed data, and Mann–Whitney U and Kruskal–Wallis H tests for non-normally distributed data.
Reliability Analysis
Reliability analysis evaluates the characteristics and elements of the scales used in measurement. This analysis determines the stability of the measurement and provides information about the relationships between the questions in the questionnaire [25]. If the measurements are consistent, they are considered reliable.
The most commonly used model in reliability analysis is Cronbach’s alpha measure. Cronbach’s alpha estimates the proportion of variance that is consistent across a series of test scores. It can take any value between 0 and 1. A value of 0.90 means that the test is 90% reliable and 10% unreliable [26]. A negative value causes the reliability model to break down. The Cronbach’s alpha value is interpreted as follows.
0.9 ≤ α ≤ 1.00Excellent
0.7 ≤ α < 0.9Good
0.6 ≤ α < 0.7Acceptable
0.5 ≤ α < 0.6Poor
0 ≤ α < 0.5Unacceptable
Normality Test
Before performing SPSS statistical tests, the data distribution was checked. Normality testing can be performed using descriptive statistics such as skewness and kurtosis coefficients or hypothesis tests (Kolmogorov–Smirnov, Shapiro–Wilk, etc.). The two fundamental components of normal distribution are skewness and kurtosis. Skewness indicates the position of the mean, median, and mode values relative to each other. When the distribution is symmetric, the mean is located exactly in the middle of the distribution and there is no skewness. If the mean is not in the middle of the distribution, the distribution is not symmetric and skewness is present [27].
Kurtosis indicates how far the data deviates from the mean or how sharp or flat the distribution is. In other words, kurtosis is related to the standard deviation of the data. When the standard deviation is small, the distribution is more pointed and short-tailed; when the standard deviation is large, the distribution is flatter and long-tailed. The literature suggests specific cut-off points for skewness and kurtosis coefficients. Accordingly, if the distribution is normal, skewness and kurtosis coefficients are expected to be between −1 and 1. Furthermore, it is stated that if the skewness coefficient is between −1 and 1, the kurtosis coefficient can be between −2 and 2; if the kurtosis coefficient is between −1 and 1, the skewness coefficient can be between −2 and 2.
Hypothesis tests can also be used in normality assessment. Kolmogorov–Smirnov and Shapiro–Wilk tests are frequently used in statistical package programs such as SPSS. In the Kolmogorov–Smirnov test, if the distribution is normal, the results are not expected to be significant; that is, the null hypothesis should not be rejected. However, this test tends to reject normality as the sample size increases. The Shapiro–Wilk test is statistically more powerful, especially for small samples.
Based on the result of the normality test, it is determined which tests will be applied in data analysis. If the data are normally distributed, parametric tests are preferred. Among parametric tests are the t-test for independent groups and ANOVA for more than two groups. If the data does not follow a normal distribution, non-parametric tests are used. Non-parametric tests include the Mann–Whitney U test for independent groups and the Kruskal–Wallis test for more than two groups [28].
Kolmogorov–Smirnov Test
The Kolmogorov–Smirnov test is used to determine whether a sample comes from a population with a specific distribution or to compare two samples with a reference probability distribution [29].
The basic logic of the Kolmogorov–Smirnov test is based on determining the maximum difference between the cumulative distribution function of the observed data set and the cumulative distribution function of the theoretical or reference distribution. This maximum difference is called the test statistic and is evaluated for statistical significance based on the sample size. The null hypothesis of the test states that the data set conforms to the distribution it is compared to, while the alternative hypothesis indicates that the data differs significantly from this distribution.
The Kolmogorov–Smirnov test stands out for its applicability to small- and medium-sized samples due to its independence from parametric assumptions. However, when the sample size is very large, the test may reveal even very small differences in the distribution as statistically significant; therefore, context and sample characteristics should be considered when interpreting the results. The test can be applied regardless of the shape of the distribution or the presence of outliers, making it a reliable alternative when classical parametric tests cannot be used.
Additionally, the Kolmogorov–Smirnov test is often supported by visual methods. For example, the fit of the data to the theoretical distribution can also be visually assessed using Q-Q plots and box plots. This holistic approach allows for a more comprehensive understanding of the distribution structure of the data set, rather than relying solely on quantitative test results. For these reasons, the Kolmogorov–Smirnov test is considered one of the most reliable and widely used methods in both theoretical and applied research, particularly for verifying normal distribution or comparing samples with reference distributions.
Shapiro–Wilk Test
The Shapiro–Wilk test evaluates the null hypothesis that a data sample comes from a normally distributed population. The W statistic, ranging from 0 to 1, is calculated. A value close to 1 indicates normal distribution, while values far from 1 suggest deviation from normality [30].
This test is considered reliable, especially for small- and medium-sized samples, and is widely used in the data analysis process to check the assumption of normal distribution. Its primary purpose is to determine whether the data are symmetrical and follow a bell-curve distribution. Since the assumption of normal distribution forms the basis of many parametric statistical tests, the Shapiro–Wilk test serves as an important preliminary control mechanism in data analysis.
If the normal distribution hypothesis is rejected based on the test results, analyzing the data set using parametric methods may not be appropriate. If the hypothesis is not rejected, the data satisfy the normal distribution assumption. Furthermore, the test can be adapted to assess whether the data are distributed around a specific mean value in some applications. This feature is particularly important when measurement errors have a mean of zero, when dimensions or weights in production processes are distributed around a specific mean, or when differences in paired t-tests need to be examined around a specific mean value.
In conclusion, the Shapiro–Wilk test is a critical tool that enhances the reliability of data analysis, both for general normality checks and for applications focused on specific mean values.
Skewness and Kurtosis
Skewness assesses the symmetry of a variable’s distribution. A distribution skewed to the left or right tail is considered asymmetric. Kurtosis indicates how concentrated the data are around the mean compared to a normal distribution [31]. In statistics, a distribution is considered symmetric when the mean, median, and mode values coincide; if these values differ, the distribution is considered asymmetric. If the right tail is longer, the distribution is positively skewed and is ordered as mean > median > mode; if the left tail is longer, the distribution is negatively skewed and is observed as mean < median < mode.
Measures of skewness quantitatively reveal how much and in which direction a distribution deviates from symmetry. Graphical analysis only provides information about direction and may be insufficient for identifying extreme cases; therefore, numerical measures are used. A good skewness measure should be independent of units, show a value of zero for symmetric distributions, provide appropriately signed values for positive or negative skewness, and accurately reflect changes from extreme negative to extreme positive. Furthermore, while absolute measures provide the magnitude of asymmetry, relative measures are necessary for comparing distributions with different variances.
Even if the measures of central tendency, dispersion, and skewness are known, it is not possible to make a complete assessment of a distribution. In addition to these measures, another measure is needed to better understand the shape of the distribution; this measure can be examined using kurtosis. The degree of kurtosis of a distribution is determined relative to the normal distribution. Curves that are more pointed than the normal curve are called “leptokurtic”, while those that are flatter are called “platykurtic”. The normal curve is called “mesokurtic” [32].
ANOVA Test
ANOVA (Analysis of Variance) is a statistical tool used to detect differences between the means of multiple groups and is applied when the dependent variable consists of continuous measurements, and the independent variables are categorical [33]. ANOVA calculates an F statistic by comparing between-group and within-group variance and allows conclusions to be drawn about whether there is a real difference between groups through the p-value obtained; if the p-value is smaller than a predetermined significance level, the difference is considered statistically significant. For ANOVA to be applied correctly, fundamental assumptions must be met, such as the data being normally distributed within each group, the variances between groups being similar, and the observations being independent of each other. For non-parametric data, alternatives such as the Kruskal–Wallis test for independent groups and the Friedman test for repeated measures can be used. This allows ANOVA to reliably assess the effects between different groups in clinical and experimental research.
Kruskal–Wallis H Test
The Kruskal–Wallis test is a non-parametric method for comparing three or more independent groups with unequal or equal sample sizes when the data do not follow a normal distribution [34].
This test was developed for data sets that do not meet parametric assumptions and is preferred especially when data distributions are not normal, variance homogeneity is not ensured, or measurements are performed on an ordinal scale. When the assumptions required by parametric tests, such as normal distribution and homogeneity of variance, are not met, the Kruskal–Wallis test provides a reliable alternative for statistically evaluating differences between groups.
The basic logic of the test is to rank the observations in independent groups and examine whether the median differences between groups are statistically significant based on these ranks. Unlike analyses based on means used in parametric tests, this approach evaluates differences in ranked positions rather than absolute value differences between groups. Therefore, especially if the data set contains extreme outliers or deviations from normal distribution, the Kruskal–Wallis test can provide more reliable and robust results than parametric tests.
The Kruskal–Wallis test provides a one-way analysis for comparing independent groups, and the statistical significance obtained from the analysis indicates that the probability of differences between groups being purely random is low. If a significant difference is detected in the test results, pairwise comparisons can be made to determine which groups differ [35]. These analyses reveal specific median differences between groups, providing researchers with more detailed and explanatory information.
In summary, the Kruskal–Wallis test is a robust statistical method used to compare three or more independent groups when parametric assumptions cannot be met. The application of this test allows researchers to reliably determine median differences within a data set while preventing erroneous interpretations that may arise from data violating the assumptions of parametric tests. Therefore, when ordinal data are used in research or when the assumptions of normal distribution and variance homogeneity cannot be met, the Kruskal–Wallis test is considered an indispensable tool in the statistical analysis process.
Mann–Whitney U Test
The Mann–Whitney U test is a non-parametric method for comparing two independent groups when the data are not normally distributed [36].
The null hypothesis of the test assumes that the two groups come from the same population and that their distributions are similar; in other words, the groups are homogeneous and statistically equal in terms of the measured variable. The alternative hypothesis suggests that the distributions of the two groups are different or that the measurements of one group are significantly larger or smaller than those of the other group. The test can be applied bilaterally or unilaterally. In a bilateral test, the null hypothesis is evaluated for values falling in both tails of the sampling distribution of the test statistic; in this case, only the presence of a general difference between the groups is examined, without specifying the direction of the difference. In one-tailed tests, the alternative hypothesis specifies the direction of the difference, and the null hypothesis is evaluated only for values falling within the specified tail of the test statistic [37].
The Mann–Whitney U test is based on comparing each observation with the observations in the other group. First, the data are sorted in ascending order, and each observation is compared with the observations in the other group. If the two groups come from the same population, the probability of an observation being greater than or less than any observation in the other group is equal. The test determines whether there is a significant difference between the groups by evaluating the frequency of these comparisons.
When applying for the test, if the null hypothesis is not rejected, the medians or overall distributions of both groups are considered similar. However, if the null hypothesis is rejected, the groups are evaluated as if they come from different populations, indicating a significant difference in the measured variable. The Mann–Whitney U test is preferred as a reliable method, especially when data do not follow a normal distribution or when sample sizes are small.

2.3. Visual Approach to Research

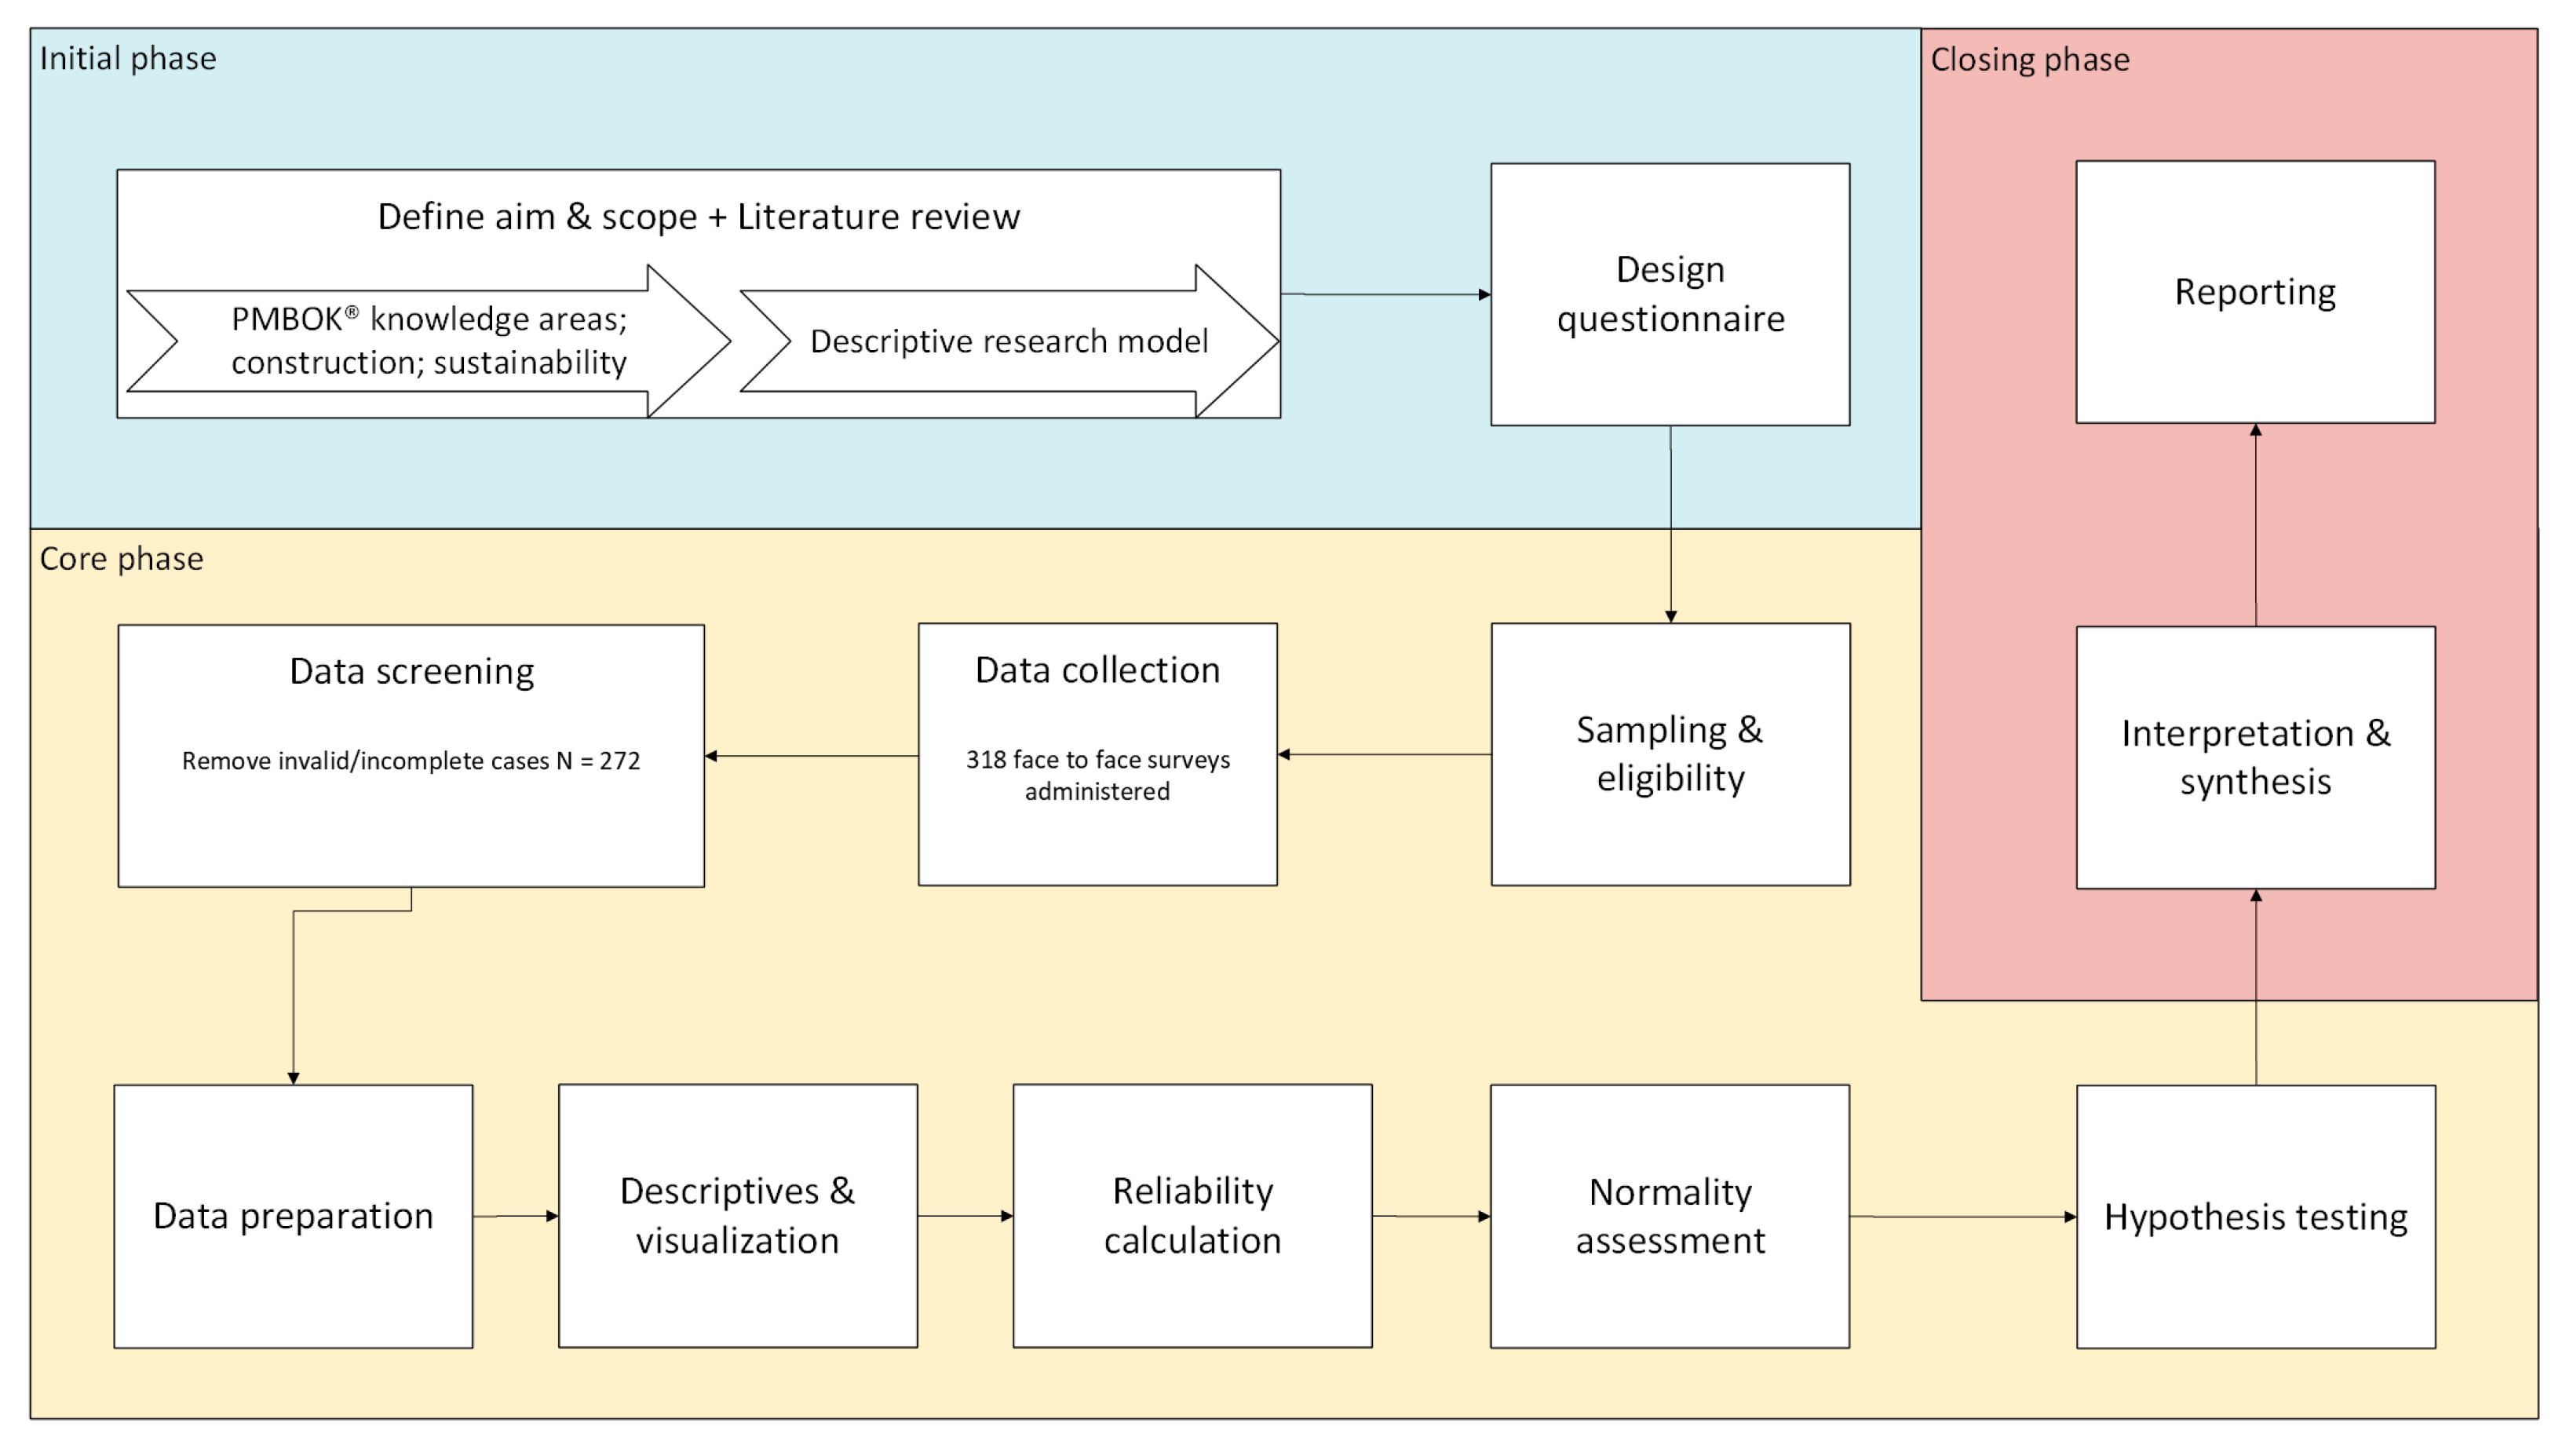
To provide a concise overview of the procedure, Figure 1 visualizes the study workflow—from questionnaire design and sampling through data preparation, reliability/normality diagnostics, and hypothesis testing.
The next section reports the empirical results in order: reliability and normality analyses, descriptive statistics, and the tests of H1–H6.

3. Results

In this section, the data obtained from the survey study are analyzed. First, the reliability of the questionnaire was examined, followed by the normality analysis of the data, and finally, the hypotheses were tested statistically and interpreted.

3.1. Reliability Analysis Results

The Cronbach’s Alpha coefficient was calculated as 0.807. Since this value falls between 0.8 and 1.00, it indicates high reliability of the questionnaire.

3.2. Demographic Distribution of Participants

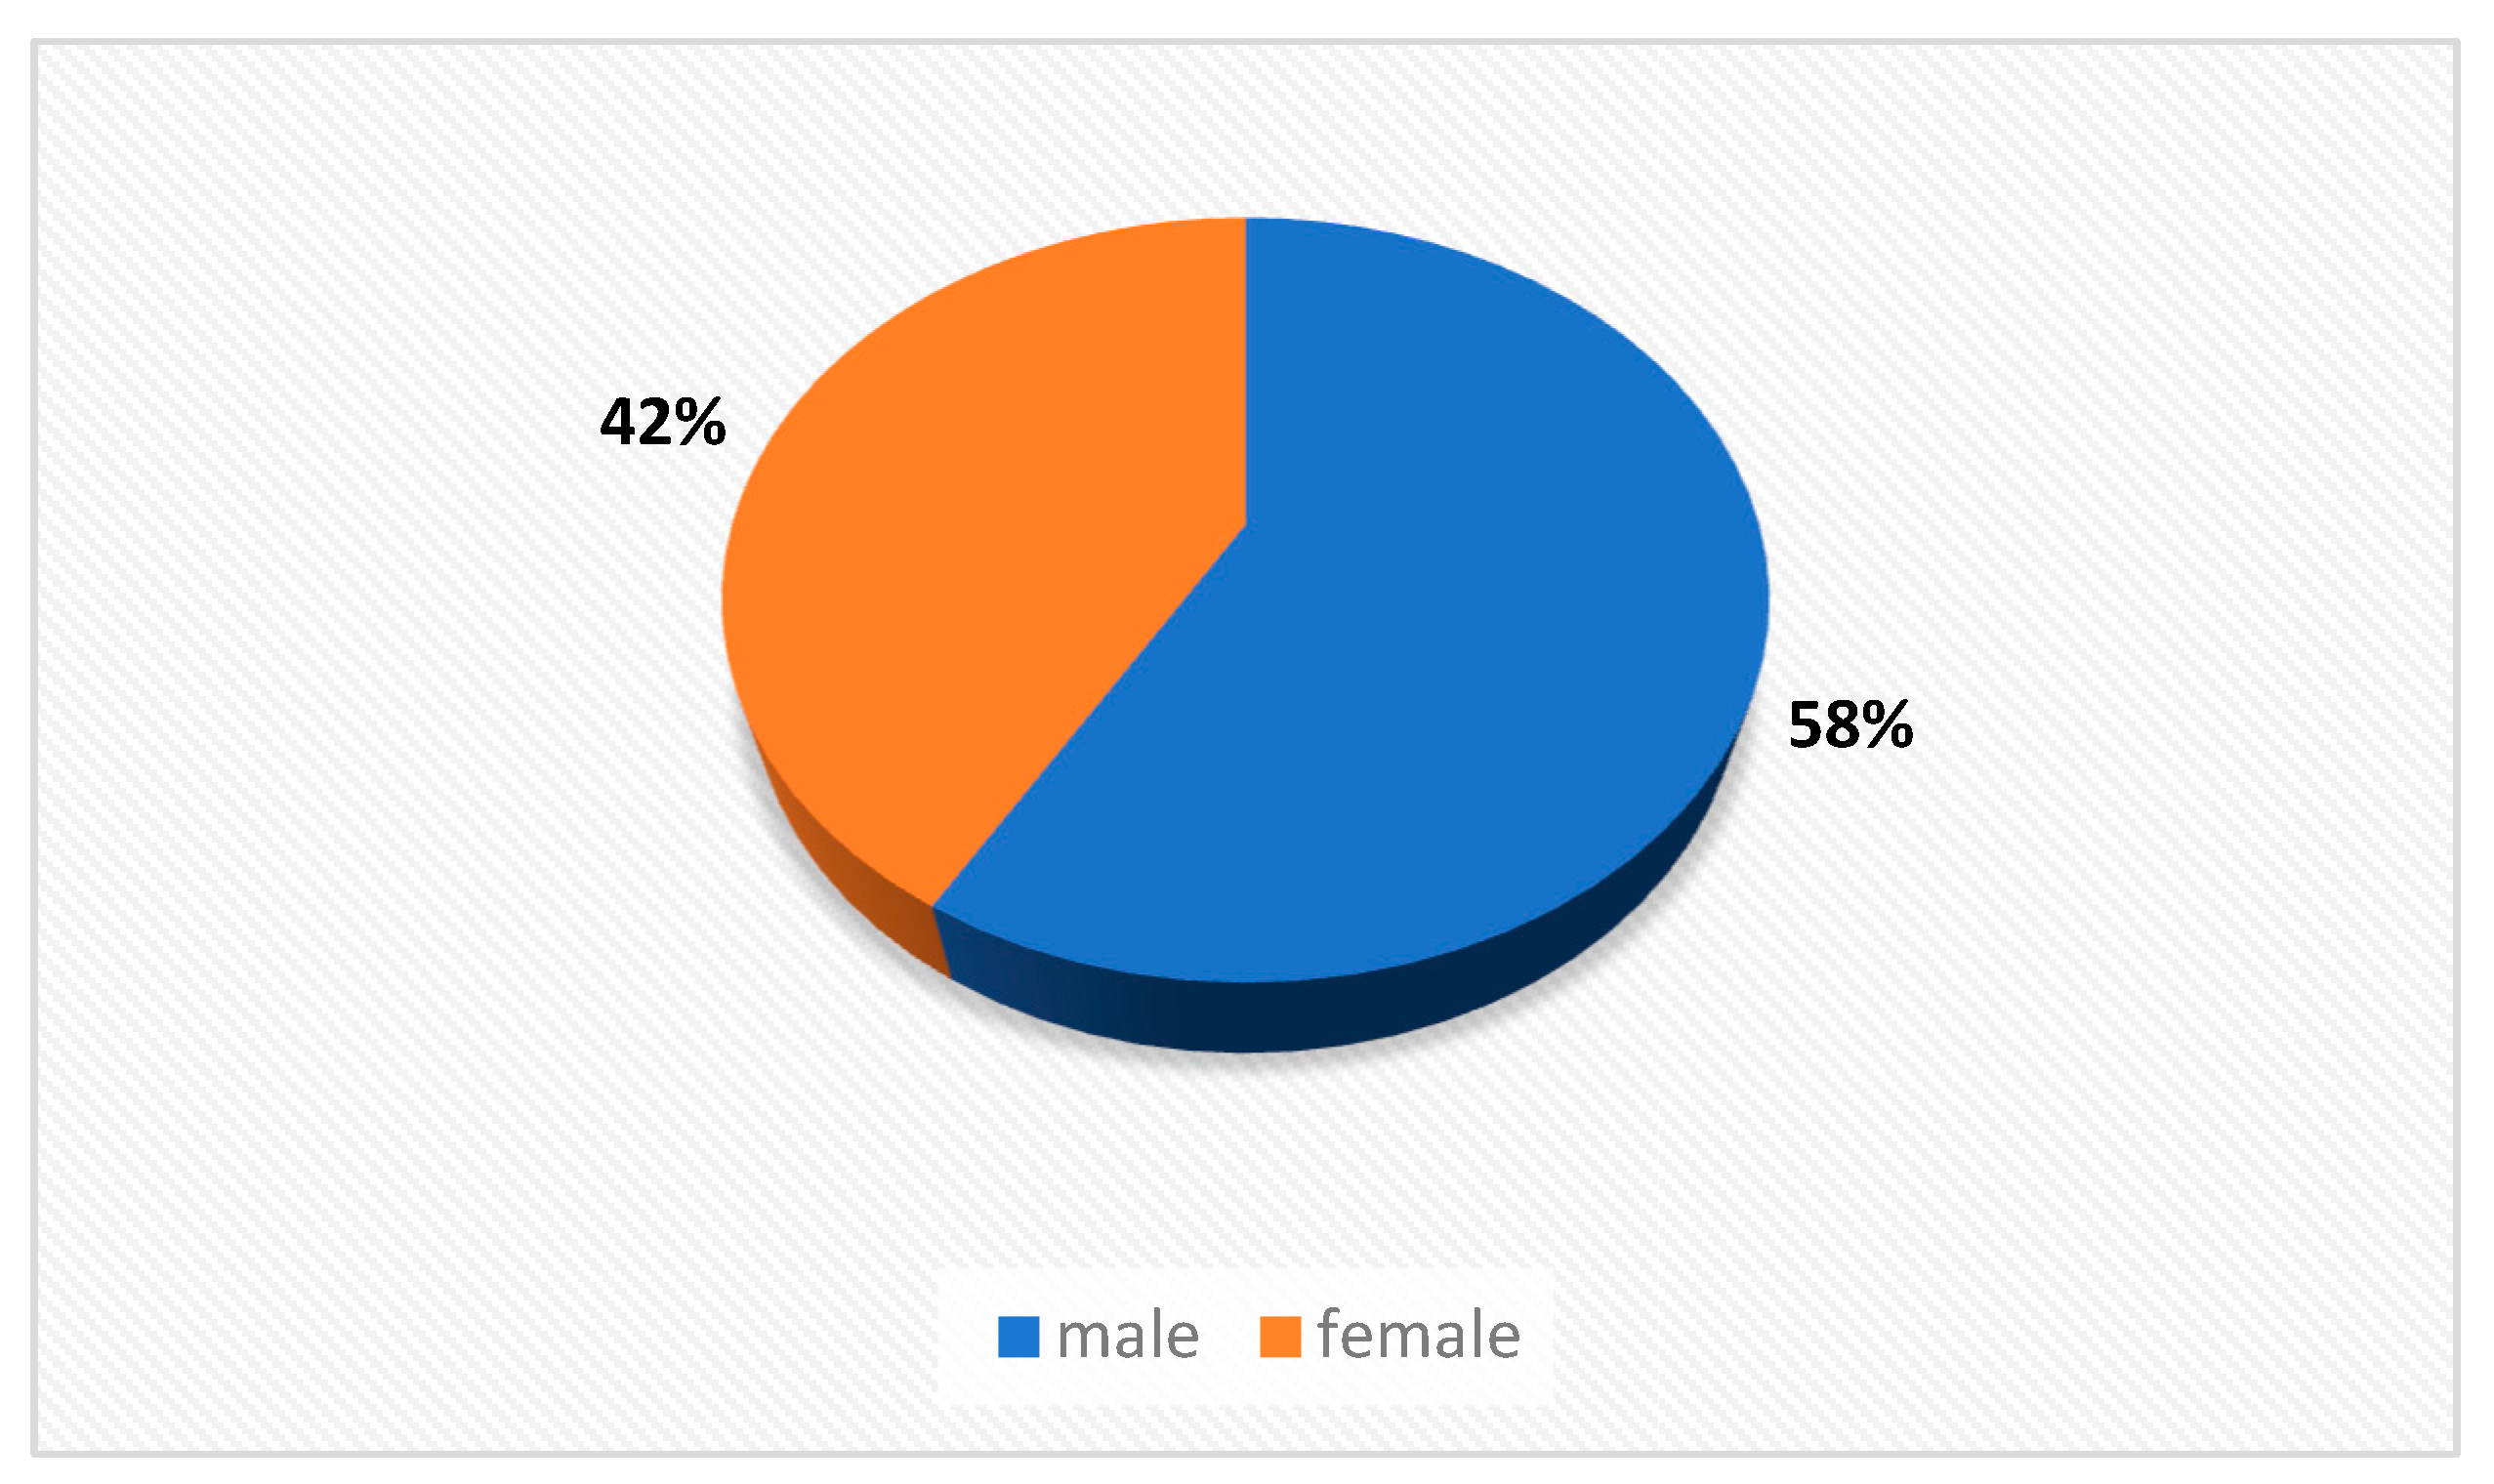
Looking at gender distribution (Figure 2), 58% of participants (n = 159) were male, and 42% (n = 113) were female.
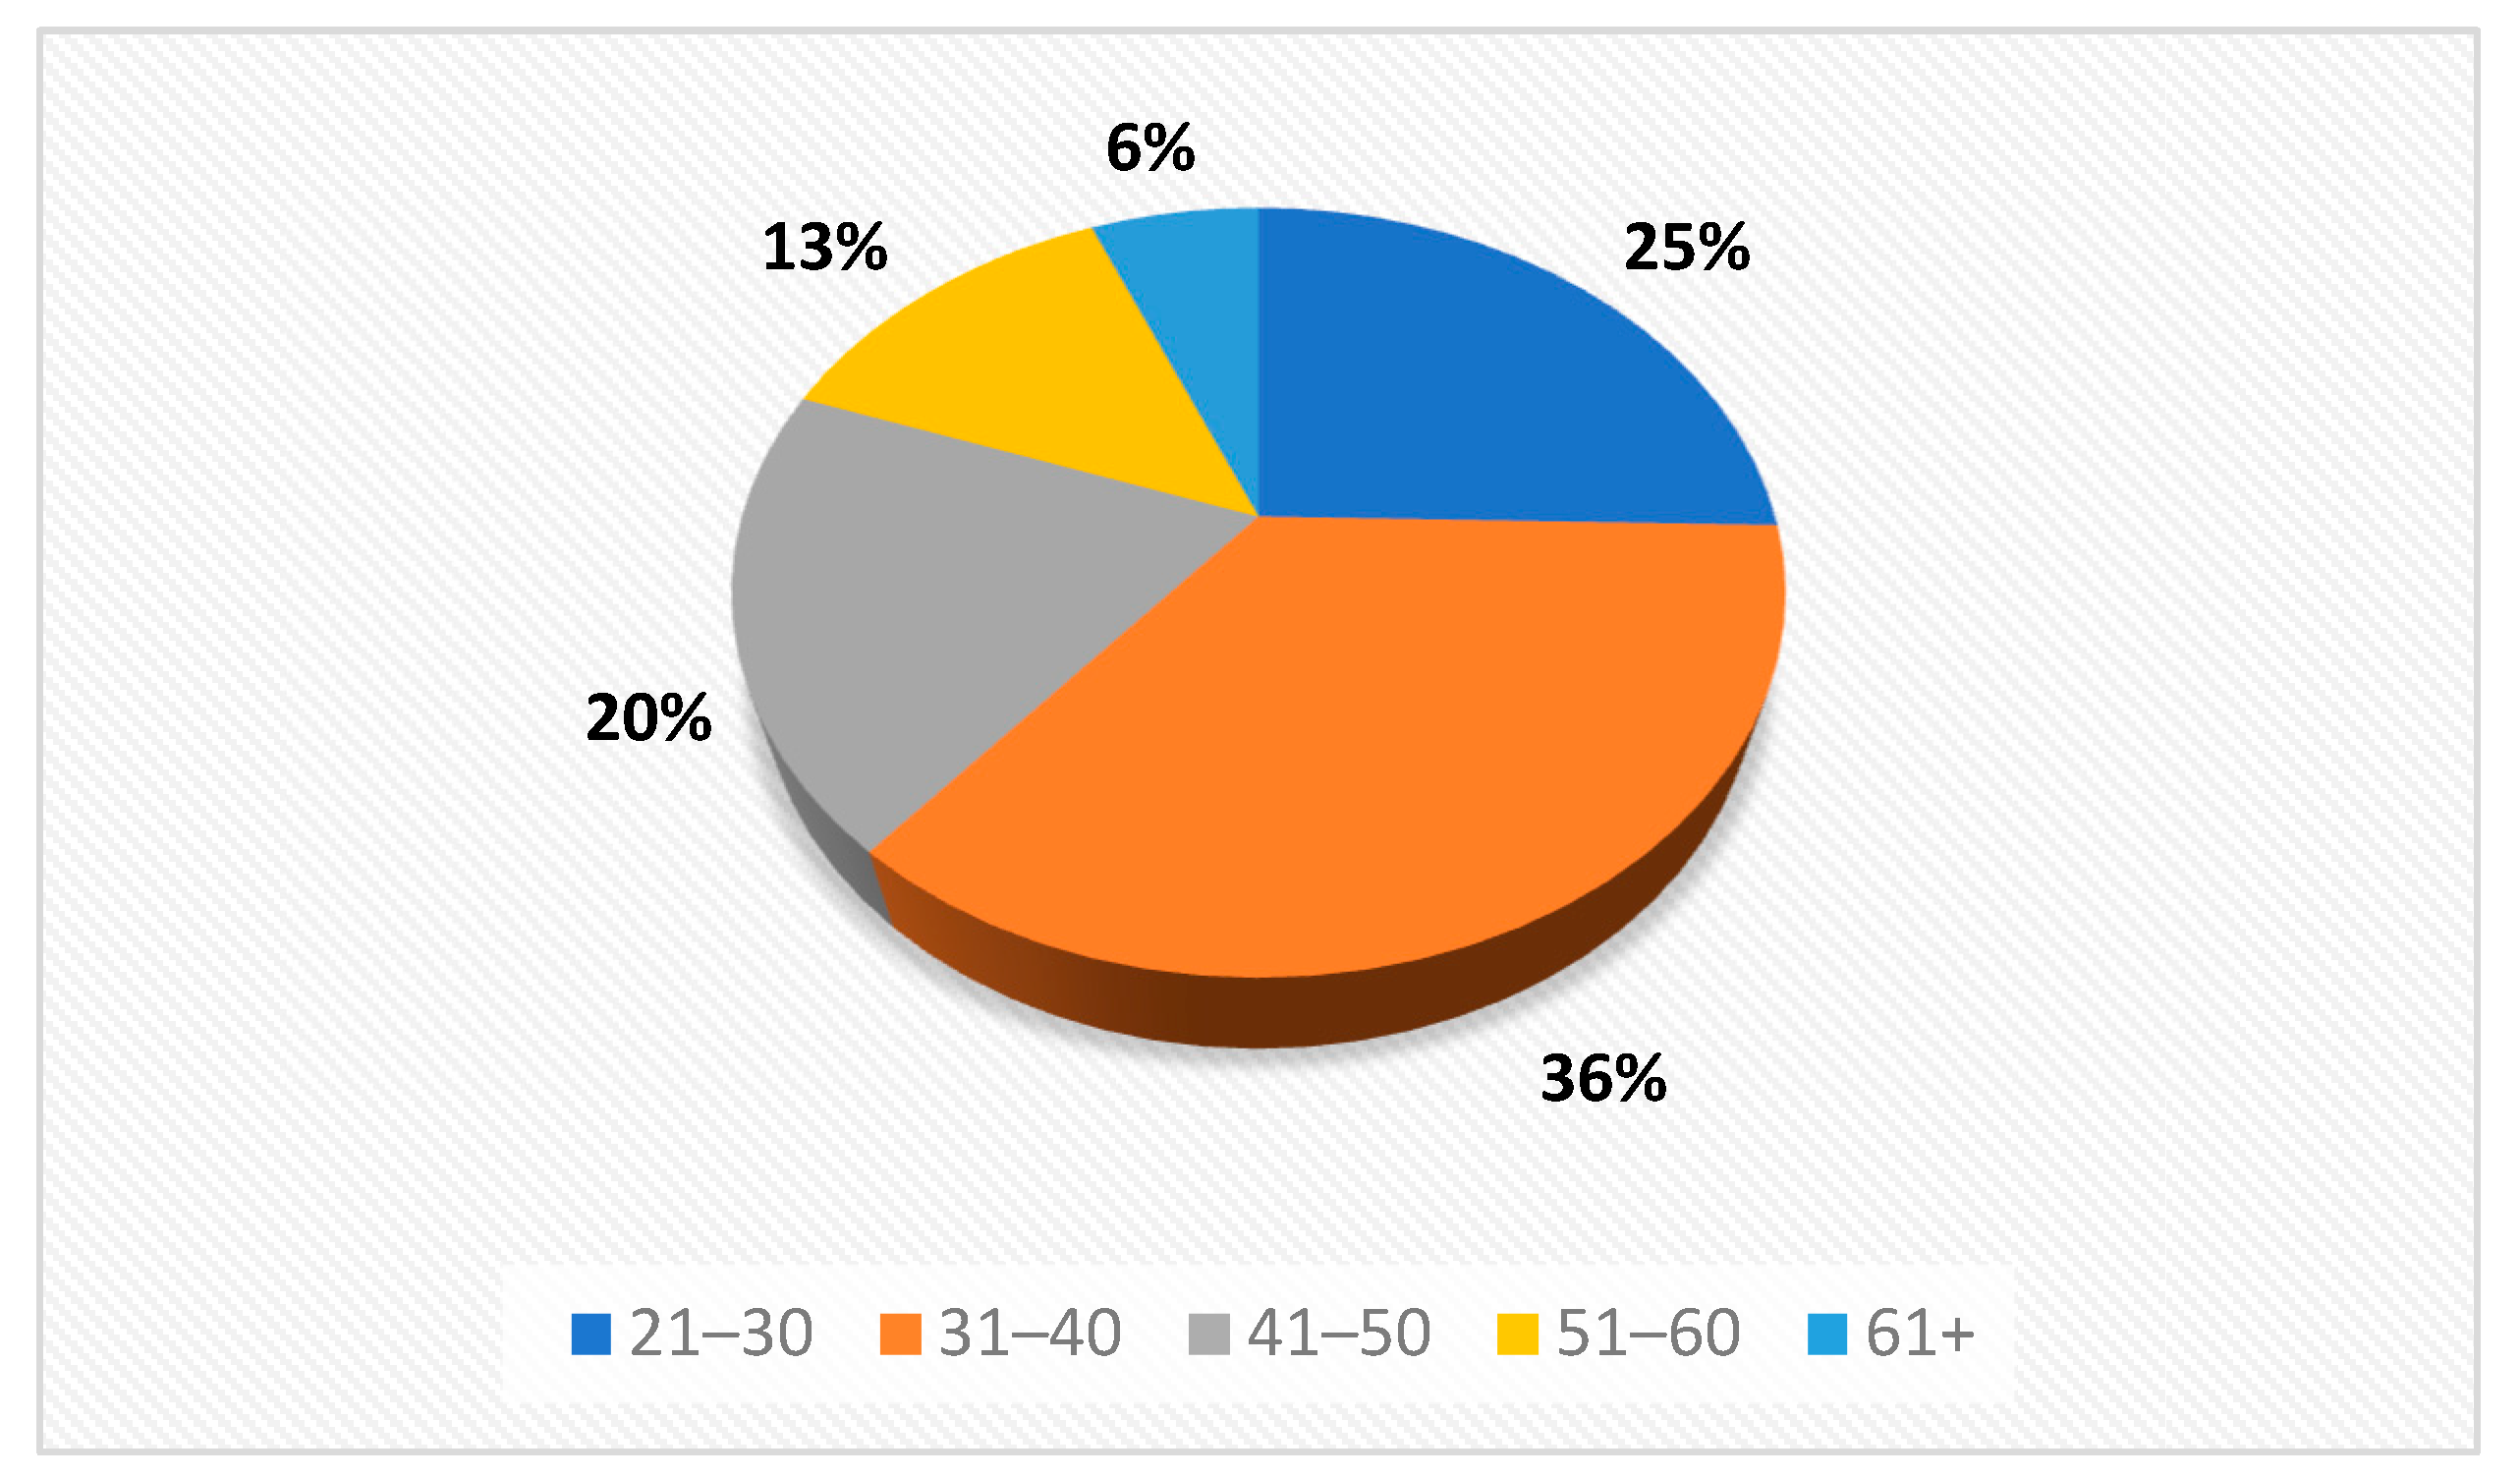
In terms of age groups, 25% were aged 21–30, 36% were 31–40, 20% were 41–50, 13% were 51–60, and 6% were 61 or older, see Figure 3.
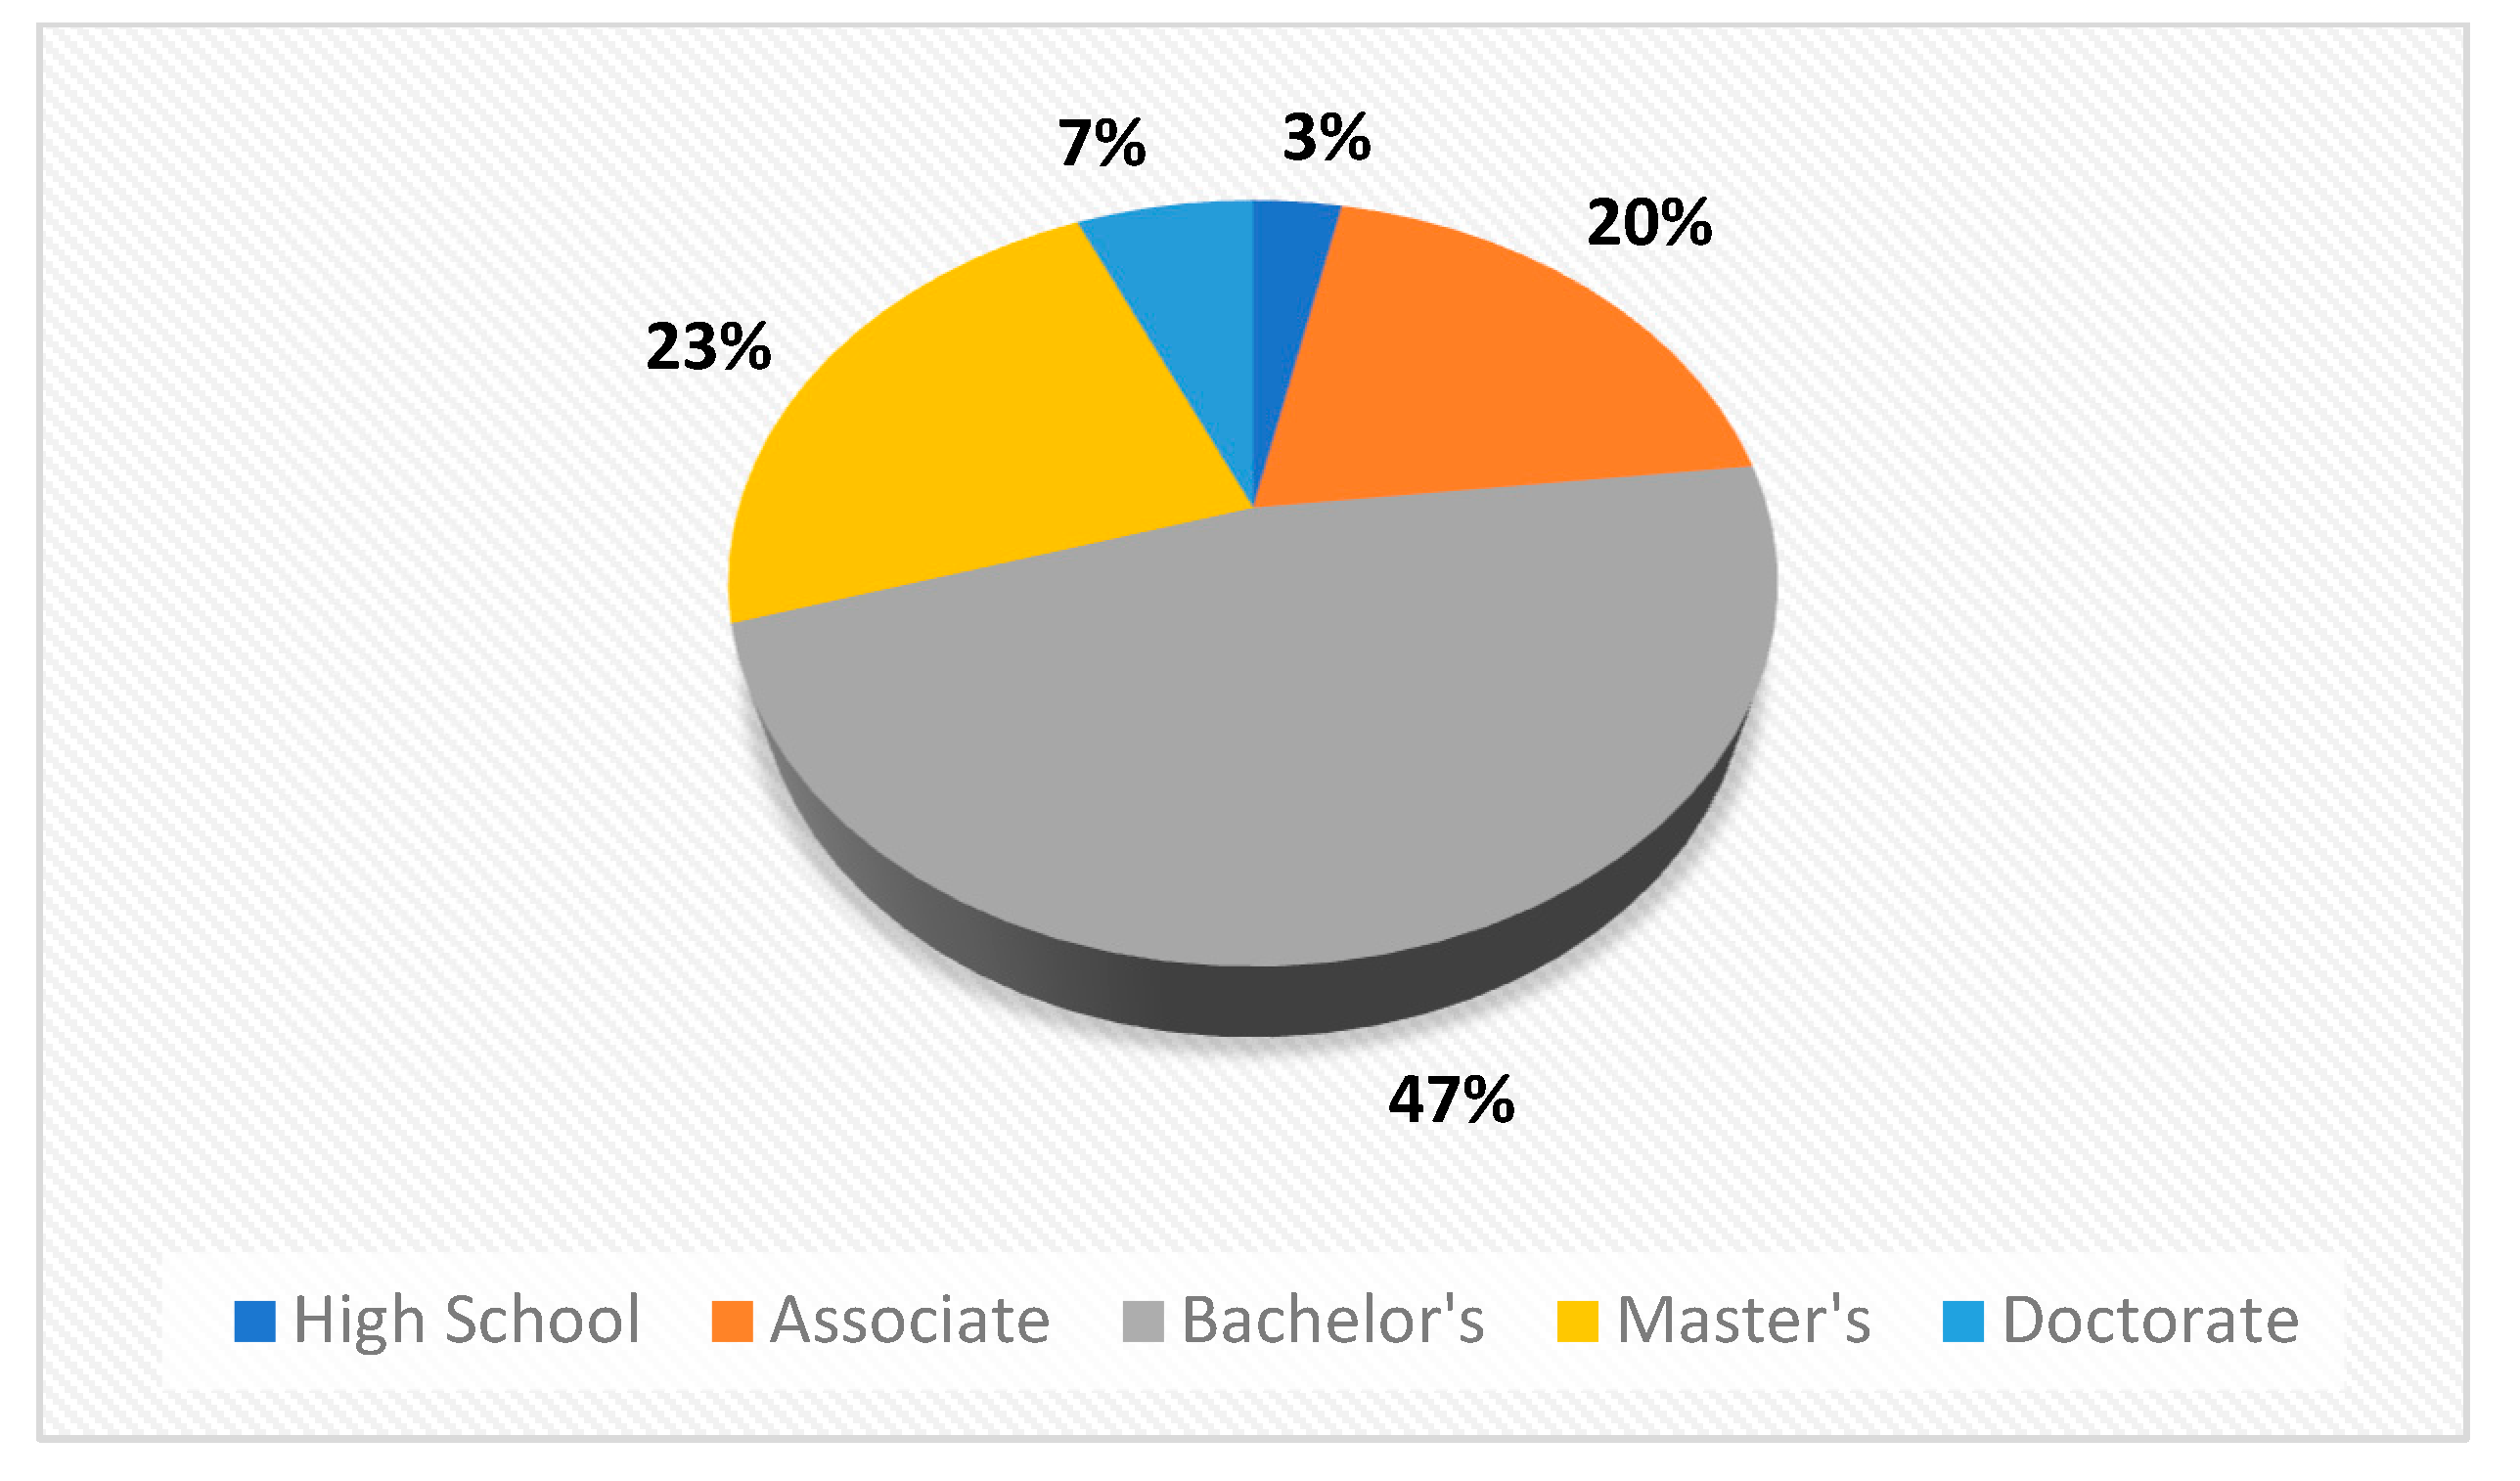
Considering education level (Figure 4), 47% (128) held a bachelor’s degree, 23% (63) a master’s degree, and 20% (54) an associate degree.
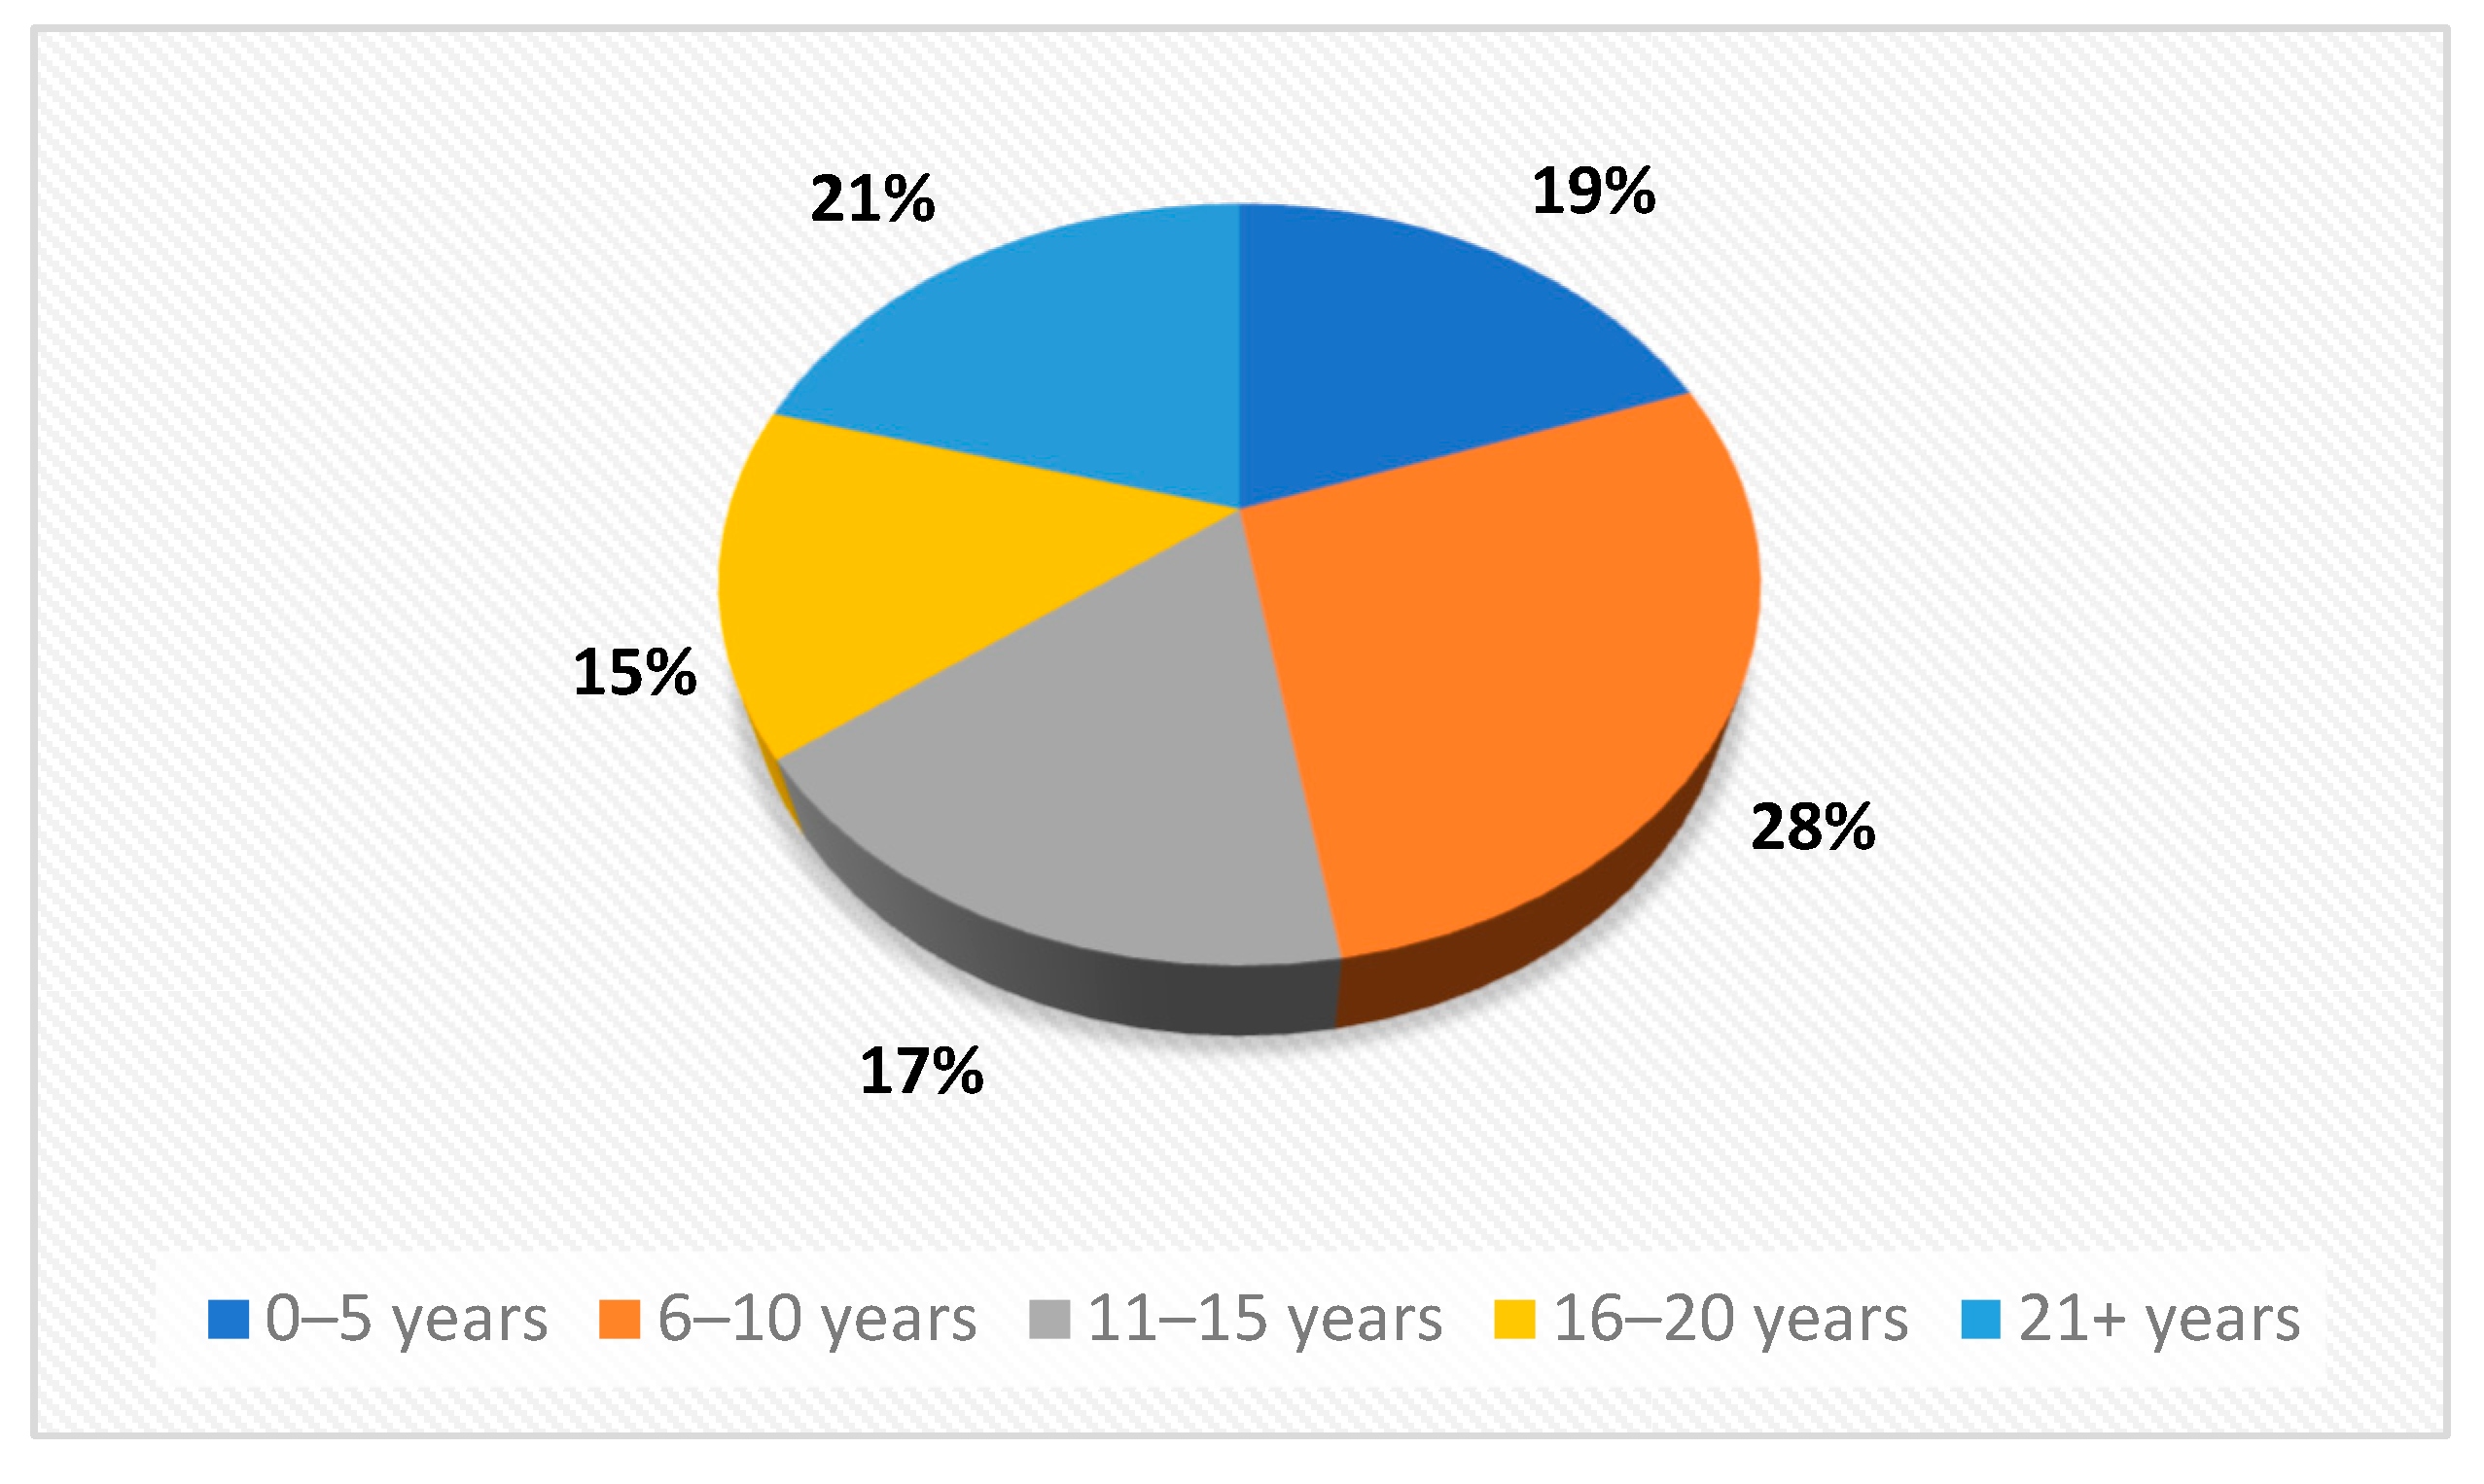
Regarding work experience in the construction sector, 28% had 6–10 years of experience, 21% had 21 years or more, 19% had 0–5 years, and 17% had 11–15 years, compared in Figure 5.
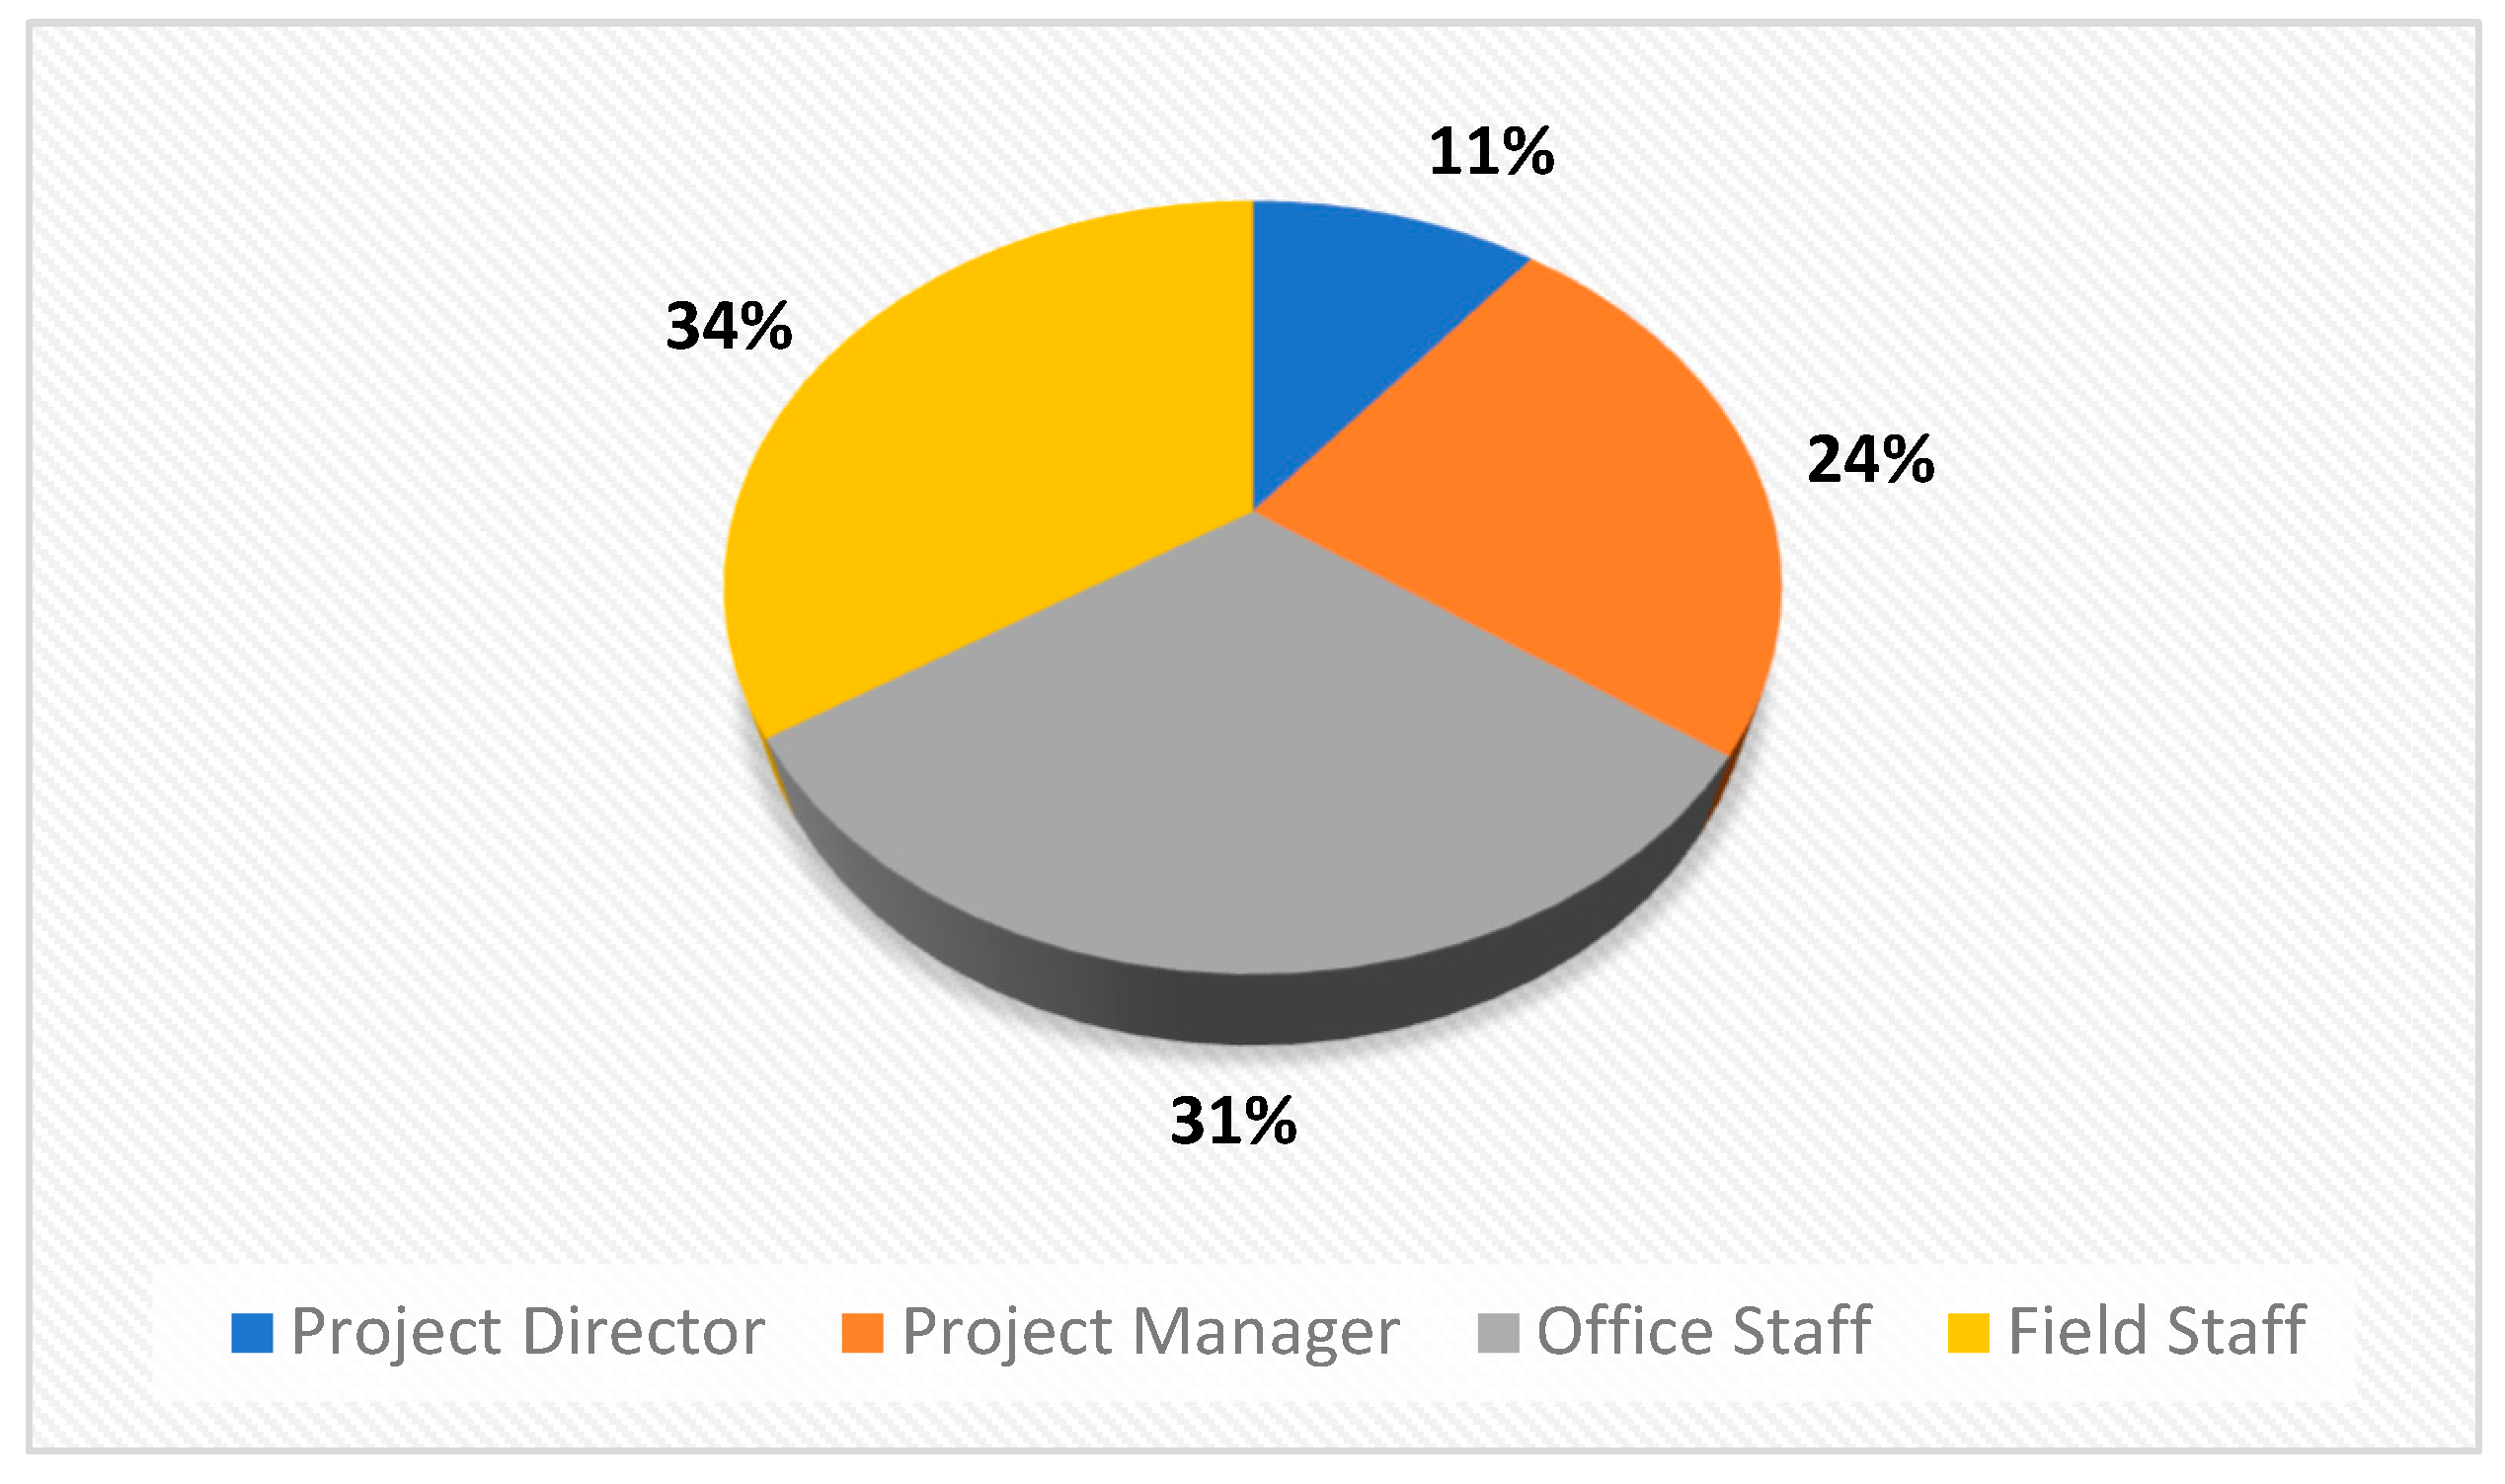
In terms of project roles (Figure 6), 34% were field staff (93), 31% were office staff (84), 24% were project managers (66), and 11% were project directors (29).
Most respondents worked in contractor/subcontractor (C/S) firms (34%), followed by project management/supervision (PM) (24%), design (17%), investor (15%), and consultancy (10%); see Figure 7.
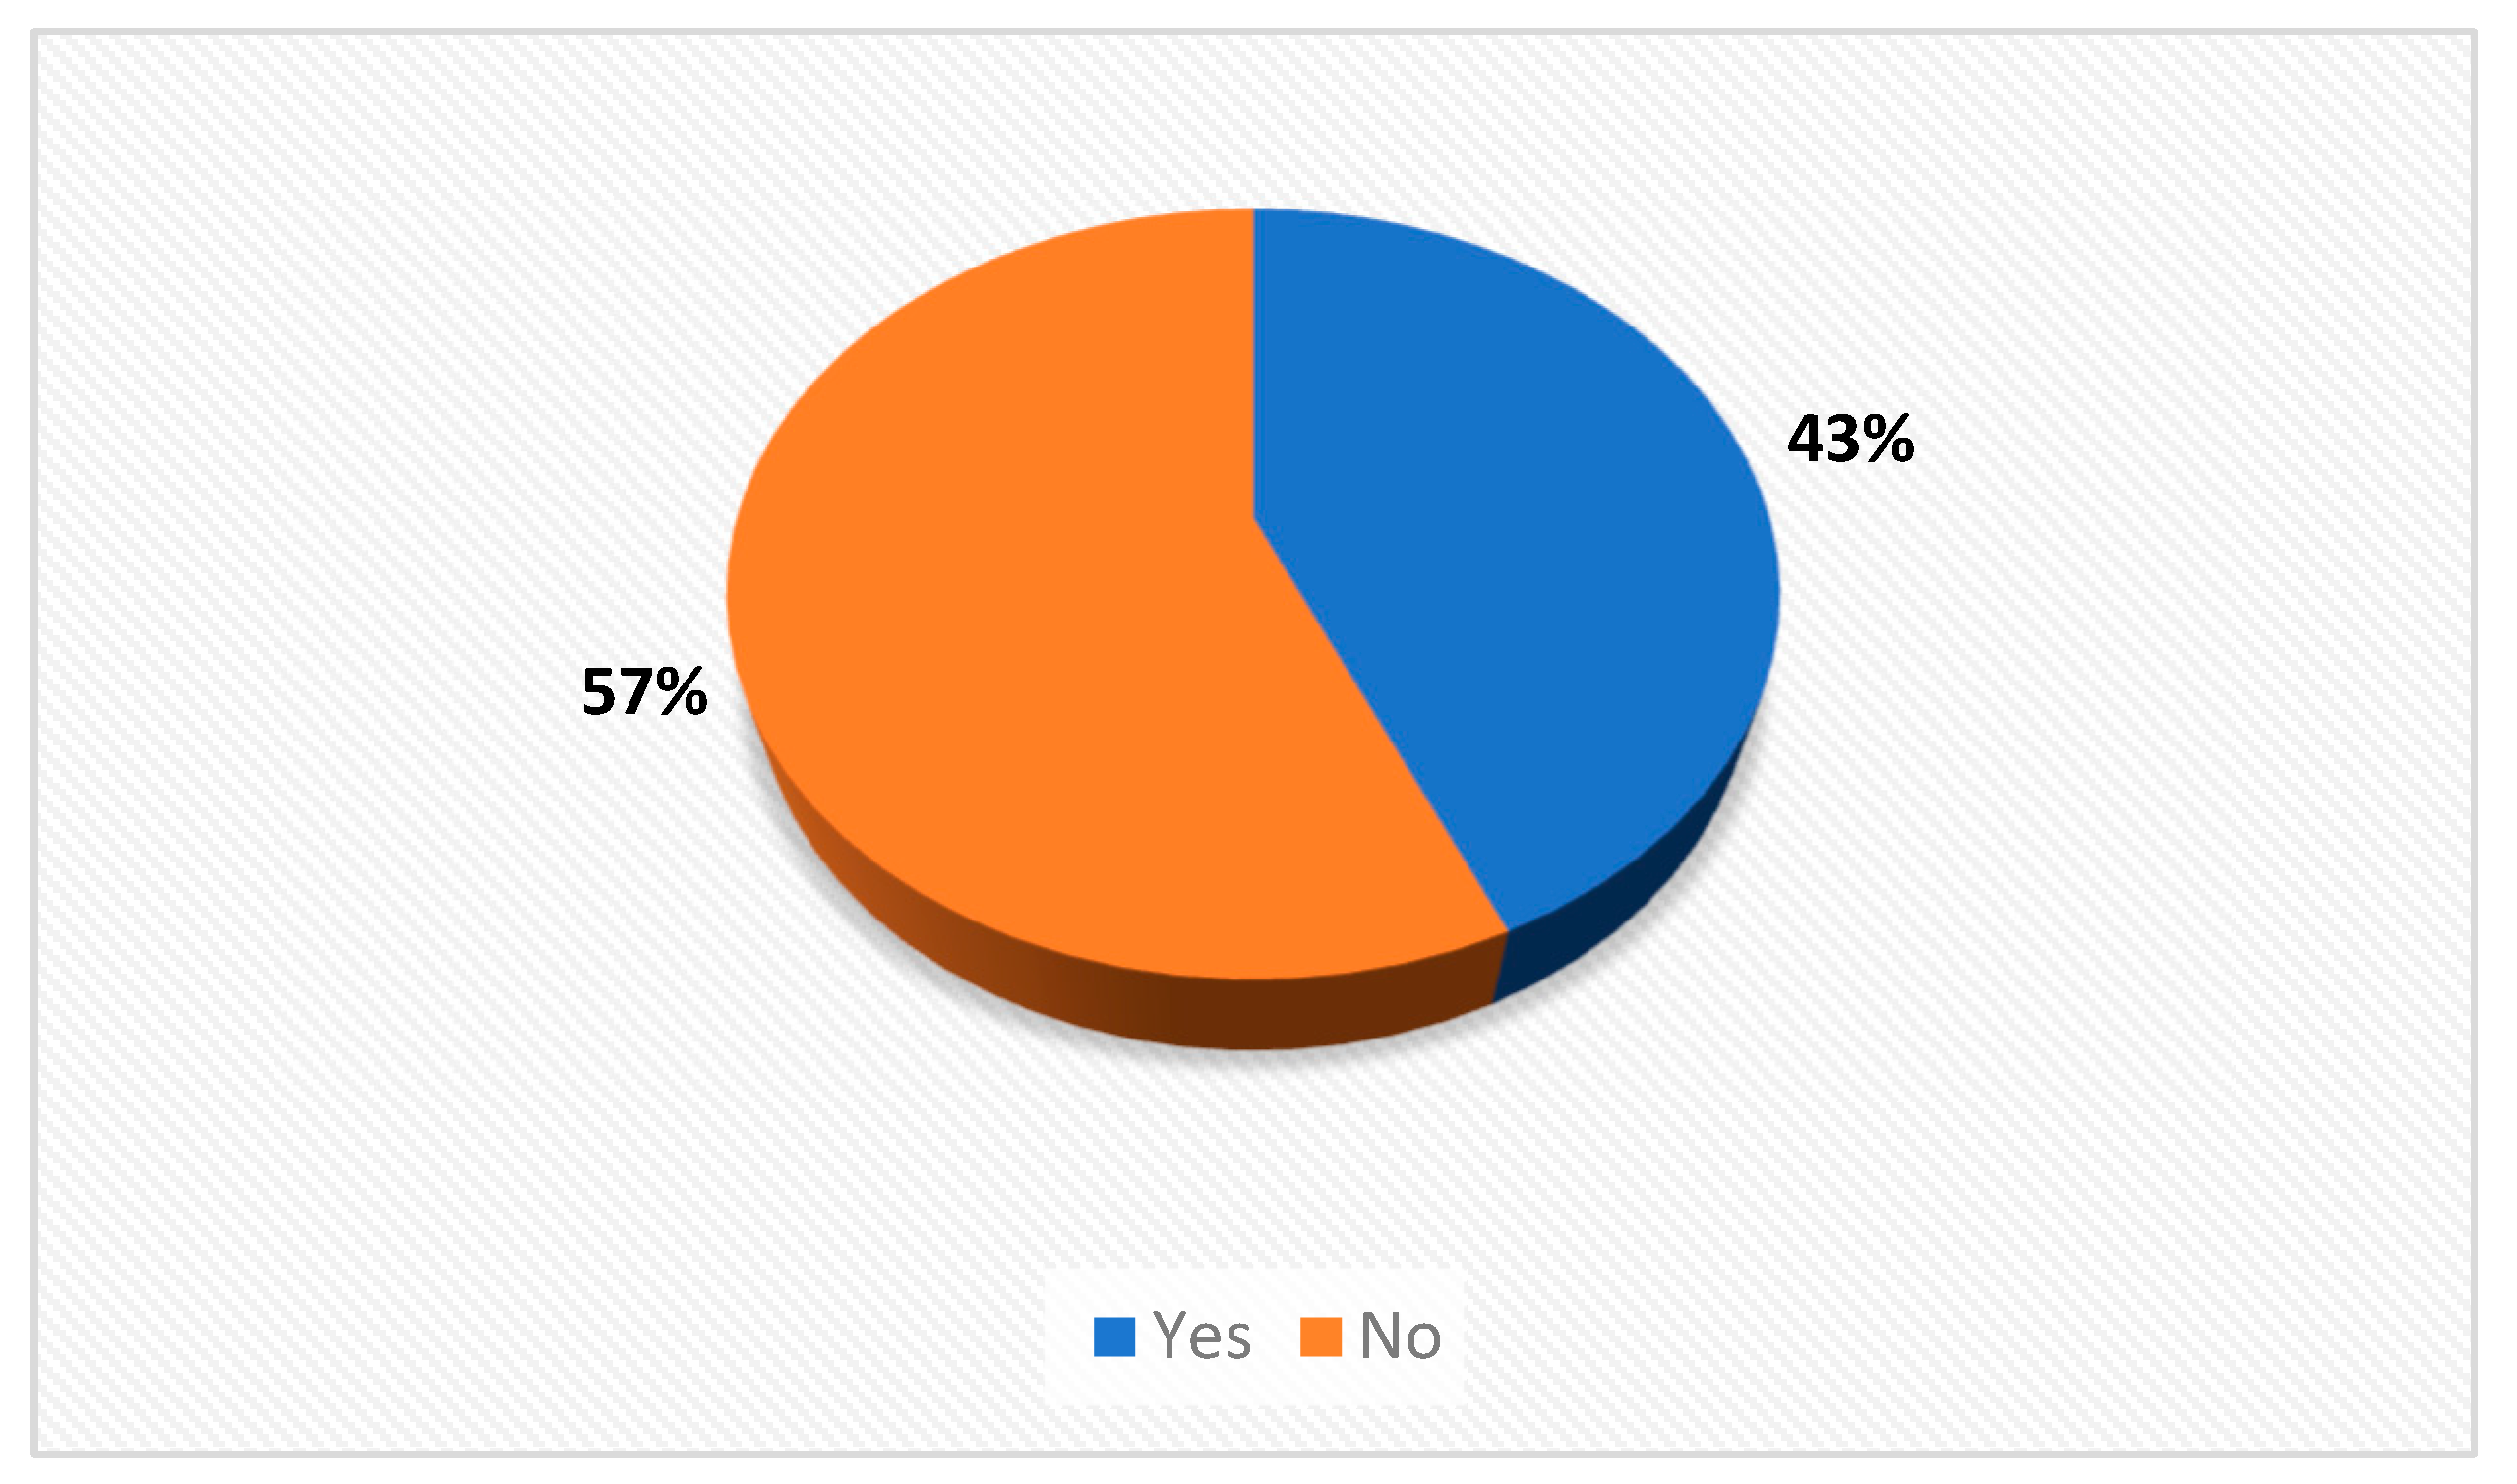
When asked, “Have you received training in project management in the construction sector?”, a majority numbered in 57% of respondents (154) answered “No” while 43% (118) answered “Yes” (Figure 8).

3.3. Normality Analysis Results

Based on the results of the normality tests, parametric tests were used for normally distributed data, and non-parametric tests were used for data that did not follow a normal distribution. Skewness and kurtosis values were examined, and both Kolmogorov–Smirnov and Shapiro–Wilk tests were applied. The results are presented in Table 2.
According to Table 2, the Use of Project Management Knowledge Areas scale has skewness (−1.366) and kurtosis (9.394) values indicating a left-skewed and leptokurtic distribution, i.e., a deviation from normality. In contrast, the Application Level of Project Management model scale, with skewness (−0.189) and kurtosis (0.317), is close to normal and symmetric. The Kolmogorov–Smirnov and Shapiro–Wilk tests confirm this: for the first scale, p = 0.000 rejects normality; for the second, p = 0.200 * supports normality. Accordingly, non-parametric tests were used for the first scale and parametric tests for the second.

3.4. Analysis of Hypotheses on the Use of Project Management Knowledge Areas

To determine significant relationships between the use of project management knowledge areas in the construction sector and education level, project role, project profile, and status of receiving project management training, analyses were performed using Kruskal–Wallis H and Mann–Whitney U tests. Results are presented below.
The findings in Table 3 show a significant relationship between the use of project management knowledge areas and education level. The Kruskal–Wallis H test (p = 0.001) indicates statistical significance; thus, H1 is rejected. Bachelor’s, master’s, and doctoral graduates use knowledge areas at higher levels than high school and associate graduates. Rising education level supports not only technical knowledge but also systems thinking, holistic reasoning, and ethical decision making—skills important for sustainability. Consequently, education level is significantly related to the effectiveness of project management processes and the adoption of sustainable practices.
Table 4 shows significant differences in usage levels by project role (Kruskal–Wallis p = 0.0006); thus, H2 is rejected. Project directors and managers use knowledge areas—such as integration, time, quality, and risk—at higher levels, while office and especially field staff use them more limitedly. This indicates the need to apply knowledge areas effectively at all levels, not only at the top, to ensure sustainability principles are reflected consistently in planning and on-site practice. Capacity-building for all stakeholders is important.
Table 5 indicates significant differences by project type (p = 0.012); thus, H3 is rejected. Knowledge areas are used more in public and industrial projects, likely due to stricter legal frameworks, public oversight, and sustainability reporting. Systematic use supports achieving sustainability goals and helps balance environmental, social, and economic impacts. Lower usage in infrastructure and transportation projects suggests that processes are less holistic and systematic, making integration of sustainability more difficult. There is a need to make project management approaches more integrated and to expand sustainability practices in these project types.
Table 6 shows that having project management training creates a significant difference (p = 0.0009); thus, H4 is rejected. Participants with training use the knowledge areas more than those without. Higher mean ranks among trained participants indicate that theoretical background and applied knowledge support effective use of the knowledge areas. Trained professionals use these areas more systematically and comprehensively, facilitating integration of sustainability and making processes more transparent, traceable, and accountable.

3.5. Analyses of Hypotheses on the Application Level of Project Management Model

To determine whether there is a significant relationship between the application level of the model related to project management knowledge areas and company profile or project profile, ANOVA analyses were performed. Results are as follows.
From Table 7, the Investor group has the highest mean (105.85), while Contractor/Subcontractor is lowest (95.59). The ANOVA result (p < 0.005) shows significant differences by company profile; thus, H5 is rejected. Investors’ more systematic use of the knowledge areas—planning, control, and risk management—supports integration of sustainability. Conversely, limited use among contractors/subcontractors indicates that sustainability practices are insufficiently adopted, particularly on site. This highlights a need to develop project management capacity and integrate sustainability approaches into field practice. Overall, company profile affects usage levels; effective use by all stakeholders is crucial to project success and sustainability.
The p = 0.158 (Table 8) indicates no statistically significant difference between project types in the application level; thus, H6 is accepted. Project management processes appear to be conducted at similar standards across residential, public, infrastructure, transportation, and industrial projects—suggesting institutionalization/standardization in the sector. Nevertheless, each project type has unique environmental, social, and economic conditions; therefore, integrating sustainability criteria should reflect project-specific approaches. Although a general standard exists, more effective achievement of sustainability goals requires tailored strategies for different project types.

4. Discussion

This study examined how PMBOK® project management knowledge areas are used in construction practice and which contextual factors shape their adoption, with a particular focus on implications for sustainability integration. The original contribution of this study is not limited to merely applying known statistical methods but also involves a detailed examination of the application of PMBOK knowledge areas in construction projects in terms of sustainability, as well as revealing differences in application between different companies and project types. This approach addresses gaps in the existing literature and brings together practice and theory.
Firstly, generally, formal education is strongly associated with the systematic use of project management knowledge areas because it provides structured, comprehensive, and accredited learning experiences that cover all essential aspects of project management [38]. The significant differences by education level indicate that formal education is strongly associated with more systematic use of knowledge areas also in construction sector. This aligns with prior observations that project management education deepens analytical and integrative skills required for scope definition, schedule/time planning, quality assurance, and risk management. From a sustainability standpoint, higher education may also enhance the ability to incorporate environmental and social criteria into planning and control (e.g., life-cycle thinking in scope and procurement, risk registers covering environmental and OHS risks), which helps explain the higher perceived use among bachelor’s, master’s, and doctoral graduates. Furthermore, the findings suggest that formal education can encourage proactive thinking about sustainability, enabling practitioners to anticipate environmental and social impacts before they arise.
Secondly, the role type within a project influences the systematic use of project management knowledge areas through the integration of diverse expertise, interdisciplinary knowledge, effective knowledge management, alignment with project characteristics, and supportive leadership [39]. The finding that project directors and managers report greater use than office and field staff confirms a top-heavy adoption pattern also in construction sector. While strategic functions (integration, schedule/time, risk, and quality) are naturally concentrated at managerial levels, the comparatively lower on-site uptake suggests a translation gap between plan and execution. For sustainability, this gap is critical: many sustainability outcomes—waste prevention, energy efficiency during construction, safe working conditions—are realized at the site interface. Similarly, Abuhussain et al. demonstrate that a BIM and machine learning-based model can directly contribute to energy efficiency and environmental impact reduction at the field level through PMBOK knowledge areas [40]. Strengthening field-level routines (e.g., checklists for sustainable procurement and quality inspections, short interval control that includes environmental and safety KPIs) can improve the fidelity with which sustainability objectives embedded in plans are carried through to daily practice.
In addition, the systematic use of project management knowledge areas is influenced by the complexity and size of the project, organizational support, effective knowledge transfer, and the relational context within the project team. These factors collectively ensure that project management practices are comprehensive and well-integrated [41]. The research revealed that higher use of knowledge areas in public and industrial projects likely reflects tighter regulatory scrutiny, clearer documentation requirements, and more formalized governance (e.g., tender specifications, independent supervision, mandatory audits). These mechanisms create incentives for systematic scope, quality, risk, and procurement management—processes that also enable sustainability assurance and traceability. Conversely, infrastructure and transportation projects show lower perceived use, which may stem from dispersed sites, longer horizons, and multi-agency coordination challenges. Targeted interventions—owner-mandated risk and sustainability registers, harmonized document control, and digital collaboration protocols—can raise consistency in these contexts. This situation demonstrates that creating customized digital tools and sustainability dashboards can support coordination and monitoring in large-scale and dispersed projects.
Project management training equips individuals with the necessary knowledge, skills, and frameworks to systematically manage and apply various project management practices, thereby enhancing project success and organizational learning [42]. The positive effect of project-management training corroborates the idea that structured exposure to standards increases not only awareness but also applied competence. The higher mean ranks among trained participants in areas like scope, integration, and procurement are consequential for sustainability: precise scope definition reduces rework and waste; integration ensures sustainability criteria flow down into schedule/time, quality, and risk processes; and procurement can operationalize sustainability through specifications (e.g., recycled content, EPDs) and contractor selection criteria.
The application of project management methodologies varies significantly across different company profiles. For instance, while some companies may adopt their own management methods, others might integrate methodologies to complement their practices. This diversity in methodology adoption reflects the varying needs and operational contexts of different company profiles [43]. In construction management, the investor exhibits the highest application levels, while contractor/subcontractor groups lag. Owners and investors typically set requirements, control gate reviews, and demand evidence of conformance (plans, registers, audits). Such governance naturally promotes consistent application of PMBOK® areas and, by extension, the embedding of sustainability and risk controls. Contractors’ lower scores highlight a need to translate owner requirements into practical, lean on-site routines and to resource middle management with tools that make sustainability “the easy path” (e.g., standardized submittal templates for sustainability data, digital checklists, short training modules). Encouraging information sharing meetings among stakeholders can increase understanding of sustainability measures and their practical implementation. This finding confirms that strengthening social sustainability practices, particularly through stakeholder participation and knowledge sharing processes, can improve sustainability performance in project management, as pointed out by Bashir et al. [44].
Finally, the use of similar application levels in project management across different project profiles is driven by the universal approach to project management, the adoption of standardized models, the generalizability of practices, and the structured frameworks provided by maturity models [45]. The absence of significant differences in the application level of steps by project profile suggests that, despite variation in perceived use, many organizations apply the stepwise mechanics of project management similarly across residential, public, industrial, infrastructure, and transportation projects. This resembles a sectoral baseline or institutionalization of core practices (planning, monitoring, control). For sustainability assessment and risk analysis, this is encouraging: standardized steps provide a stable scaffold into which life-cycle indicators (e.g., materials intensity, waste, energy, emissions) and risk treatments (e.g., environmental, schedule, and safety risks) can be systematically embedded. However, uniform steps should still be parameterized to context—e.g., infrastructure projects may require stronger emphasis on stakeholder and environmental risk due to spatial dispersion and long asset lives.
Concluding the results, the study provides role-differentiated evidence that connects human capital (education/training) and organizational positioning (role, company type) with the operational use of PMBOK® knowledge areas in construction. Then, it distinguishes perceptions of use from the stepwise application level, showing that sectoral standardization can coexist with heterogeneity in perceived depth. Additionally, it frames these determinants as enablers for sustainability assessment and risk-informed decision making across civil-infrastructure contexts. In general, the study suggests that targeted interventions such as specially designed training programs, digital monitoring tools, and information sharing among stakeholders can further increase the adoption of sustainability practices in construction projects.
However, the study is not free of some limitations. The data are self-reported and cross-sectional, which may introduce perception and common-method biases and preclude causal inference. The sample is drawn from Türkiye; while informative, generalizability to other regulatory and market contexts should be tested. The study measures perceived use and application level rather than objective project outcomes (cost/schedule/sustainability performance), and it does not model potential mediators such as firm size, contract type, or digital maturity (e.g., BIM use). Finally, the non-normal distribution of the perceptions scale suggests heterogeneity (possibly ceiling effects in some items), which future measurement work could refine.
For future research plans, three tracks appear most promising. (1) Outcome linkage: combine survey data with objective performance and sustainability metrics (e.g., waste diversion, embodied carbon, safety rates) to test whether higher knowledge-area use predicts better outcomes. (2) Comparative and longitudinal designs: replicate across countries and track organizations over time to examine how training and governance reforms shift adoption. (3) Mechanism testing: evaluate interventions—owner-mandated sustainability clauses in procurement, field-level training packages, digital workflows tying submittals to sustainability criteria—and estimate their effects on both adoption and outcomes. Multi-level models (individual–project–firm) and integration with BIM/LCA datasets could yield especially policy-relevant insights.
In sum, the evidence indicates that education, role, training, and ownership context are pivotal levers for deepening the practical use of PMBOK® knowledge areas. Harnessing these levers can accelerate the mainstreaming of sustainability assessment and risk analysis within the everyday management of civil-infrastructure projects.
5. Conclusions

This section presents the analysis results from the questionnaires under three subheadings: (i) results regarding the use of project management knowledge areas in the construction sector, (ii) results regarding their application level, and (iii) potential application of the research concept in other sectors. It is hoped that these results will contribute to the literature and serve as a platform for future research.

5.1. Conclusions on the Use of Project Management Knowledge Areas

In the survey, participants were asked for their opinions on the use of project management knowledge areas in the construction sector. They were tested for significant differences versus education level, project role, project profile, and project management training. These are some main findings:
  • H1 (Education Level). Education level affects use of knowledge areas. Participants with bachelor’s or higher manage processes more systematically and make more informed decisions. The knowledge areas relate not only to technical knowledge but also to thinking and evaluative skills. With higher education, sustainability awareness and inclination to apply it increase.
  • H2 (Project Role). Project managers/directors systematically use planning, time, cost, and risk areas to manage projects more effectively, whereas field and office staff show limited application. This indicates knowledge areas are not widespread across levels and sustainability remains limited on site. Thus, integration of the knowledge areas at all tiers is critical for managerial effectiveness and sustainability.
  • H3 (Project Profile). In this case, use varies by project type. Public and industrial projects use the knowledge areas more intensively due to legal, social, and environmental oversight, which clarifies responsibilities, increases transparency, and protects the environment. In contrast, infrastructure/transport projects show lower usage, indicating lack of order and sustainability in management. Hence, project management practices should be evaluated per project type in line with sustainability principles.
  • H4 (Training). Participants with project management training maintained higher use than those without. Effective use of knowledge areas depends not only on experience but also on theoretical knowledge. Trained individuals act more systematically—especially in scope, integration, and procurement—contributing to transparent and traceable processes. Their ability to operate in line with sustainability improves; environmental and social impacts are managed more carefully. Training thus increases both the applicability of knowledge areas and sustainability awareness.

5.2. Conclusions on the Application Level of Project Management Model

In this part, participants indicated the application level of model related to the knowledge areas in their projects. We then analyzed whether there were significant differences by company profile and project profile:
  • H5 (Company Profile). Investor companies use the knowledge areas more comprehensively and systematically, conducting process management by integrating planning, quality, integration, and risk—thus facilitating sustainability integration and increasing traceability. In contrast, contractors/subcontractors show limited use, leading to lack of standardization and insufficient sustainability practices. Therefore, regardless of firm type, all stakeholders should effectively adopt the knowledge areas to reach sustainability goals.
  • H6 (Project Profile). No significant differences were found between project types in application level, suggesting a general standard in the sector. While this is positive, each project type carries distinct conditions and risks from a sustainability perspective. For instance, although housing and infrastructure may follow similar management compositions of the model, their environmental and social impacts differ. Hence, standard solutions should be aligned with project-specific sustainability criteria to ensure more effective, context-appropriate management.

5.3. Possibilities for Cross-Sector Extension

Although the empirical evidence in this study comes from construction, the mechanisms identified—education/training and role effects, ownership and governance effects, and the sector-wide standardization of core management steps—are not industry-specific. PMBOK® is designed as an industry-agnostic framework, and the findings show that systematic use of integration, schedule/time, quality, risk and procurement practices and owner-led governance act as enablers of transparent, traceable processes into which sustainability and risk considerations can be embedded. These features are present in several adjacent sectors that execute complex, multi-stakeholder projects under regulatory oversight, including healthcare [46], energy industry [47] or software development [48].

Author Contributions

Conceptualization, A.E.K. and G.G.G.; methodology, A.E.K. and G.G.G.; software, A.E.K., G.G.G. and J.G.; validation, A.E.K., G.G.G. and J.G.; formal analysis, A.E.K., G.G.G. and J.G.; investigation, A.E.K. and G.G.G.; resources, A.E.K., G.G.G. and J.G.; data curation, A.E.K., G.G.G. and J.G.; writing—original draft preparation, A.E.K., G.G.G. and J.G.; writing—review and editing, A.E.K., G.G.G. and J.G.; visualization, A.E.K., G.G.G. and J.G.; supervision, A.E.K. and J.G.; project administration, A.E.K. and J.G.; funding acquisition, J.G. All authors have read and agreed to the published version of the manuscript.

Funding

This research received no external funding.

Institutional Review Board Statement

Not applicable.

Informed Consent Statement

Not applicable.

Data Availability Statement

Data used in this article was derived from the Master thesis entitled “Use of project management knowledge areas in the construction sector” (by Gizem Görkem Gülek) which can be accessed through: https://tez.yok.gov.tr/UlusalTezMerkezi/tezSorguSonucYeni.jsp (accessed on 24 August 2025).

Conflicts of Interest

The authors declare no conflicts of interest.

References

  1. Ercoşkun, P.K.; Avlar, E. Systematic Evaluation of New Technological Building Products in the Decision-Making Process in the Construction Industry. Gazi Üniversitesi Bilim. Derg. Part C Tasarım Teknol. 2013, 1, 17–27. [Google Scholar]
  2. Mavi, R.K.; Gengatharen, D.; Mavi, N.K.; Hughes, R.; Campbell, A.; Yates, R. Sustainability in Construction Projects: A Systematic Literature Review. Sustainability 2021, 13, 1932. [Google Scholar] [CrossRef]
  3. Arabpour, S.; Silvius, G. Sustainability Interventions of Construction Project Managers—Establishing a Minimum Baseline. Sustainability 2023, 15, 9795. [Google Scholar] [CrossRef]
  4. Anantatmula, V.S. Project Management Concepts. In Operations Management–Emerging Trend in the Digital Era; Petrillo, A., De Felice, F., Lambert-Torres, G., Bonaldi, E., Eds.; IntechOpen: London, UK, 2021; ISBN 978-1-83881-202-7. [Google Scholar]
  5. Project Management Institute. A Guide to the Project Management Body of Knowledge; Project Management Institute: Newtown Square, PA, USA, 2017. [Google Scholar]
  6. Tanes, Y.; Meydanlı, İ.İ.; Özdemir, S.S.; Özer, A. Project Management Guide; İstanbul Sanaayi Odası: Istanbul, Turkey, 2011. [Google Scholar]
  7. Suvacı, E.; Lezki, Ş.; Uysal, O.; Önce, S.; Er, F.; Şıklar, E. Project Management; Anadolu Üniversitesi: Eskişehir, Turkey, 2013. [Google Scholar]
  8. Kömürlü, R.; Toltar, L. Project Management in Construction–Its Impact on Project Success. Mimar. Yaşam 2018, 3, 249–258. [Google Scholar] [CrossRef]
  9. Demirkesen, S.; Ozorhon, B. Impact of Integration Management on Construction Project Management Performance. Int. J. Proj. Manag. 2017, 35, 1639–1654. [Google Scholar] [CrossRef]
  10. Dashti, M.S.; RezaZadeh, M.; Khanzadi, M.; Taghaddos, H. Integrated BIM-Based Simulation for Automated Time-Space Conflict Management in Construction Projects. Autom. Constr. 2021, 132, 103957. [Google Scholar] [CrossRef]
  11. Uğural, M.N. Time-Cost Trade-Off Problem in Construction Projects: Case Study Analysis. Avrupa Bilim Teknol. Derg. 2020, 19, 460–465. [Google Scholar] [CrossRef]
  12. Șerbănoiu, A.A.; Grădinaru, C.M. Construction Cost Estimate; Bioflux: Cluj-Napoca, Rumania, 2020; ISBN 9786068887920. [Google Scholar]
  13. Shaqour, E.N. The Role of Implementing BIM Applications in Enhancing Project Management Knowledge Areas in Egypt. Ain Shams Eng. J. 2022, 13, 101509. [Google Scholar] [CrossRef]
  14. Alsulami, B.T.; Hamza, M.A. Identifying Project Management Competencies in the Saudi Public Sector. J. Eng. Res. 2024, 13, 2136–2148. [Google Scholar] [CrossRef]
  15. Zulch, B. Communication: The Foundation of Project Management. Procedia Technol. 2014, 16, 1000–1009. [Google Scholar] [CrossRef]
  16. Karslıoğlu, Y.E.; Bekir, B.; Bayraktar, O.Y.; Gökhan, K. A Sample Risk Assessment in Terms of Risk Management and Occupational Health and Safety in Construction Projects; 5. Uluslararası Muhendislik Mimarlık ve Tasarım Kongresi: Istanbul, Turkey, 2019. [Google Scholar]
  17. Salami, E.; Laptali Oral, E.; Aydinli, S. Critical Success Factors in Supply Chain Management Practices of Contractor Companies. Çukurova Üniversitesi Mühendislik-Mimar. Fakültesi Derg. 2016, 30, 17–24. [Google Scholar] [CrossRef]
  18. Çivici, T. The Relationship Between Interpersonal Conflict Resolution Approaches and Personality Traits in Construction Project Organizations. Çukurova Üniversitesi Mühendislik-Mimar. Fakültesi Derg. 2019, 34, 195–206. [Google Scholar] [CrossRef]
  19. Berber, İ. Development and Condition of Construction Project Management in Türkiye and the World; Beykent Üniversitesi: Istanbul, Turkey, 2019. [Google Scholar]
  20. İslamoğlu, A. Determination of the Profiles of Construction Project Management Companies Operating in Türkiye; Istanbul Technical University: Istanbul, Turkey, 2015. [Google Scholar]
  21. Ata, N.İ. Use of Professional Project Management Standards in the Construction Industry in Turkey; İstanbul Teknik Üniversitesi: Istanbul, Turkey, 2009. [Google Scholar]
  22. Kuru, M.; Çaliş, G. Factors Affecting Quality Performance in Construction Projects: A Field Study in Turkey. Tek. Dergi 2022, 33, 13037–13051. [Google Scholar] [CrossRef]
  23. Williams, C. Research Methods. J. Bus. Econ. Res. (JBER) 2007, 5, 65–72. [Google Scholar] [CrossRef]
  24. George, D.; Mallery, P. SPSS for Windows Step-by-Step: A Simple Guide and Reference, 11.0 Update; Allyn and Bacon: Boston, MA, USA, 2003; ISBN 0205480713. [Google Scholar]
  25. Reliability Analysis–IBM Documentation. Available online: https://www.ibm.com/docs/en/spss-statistics/25.0.0?topic=features-reliability-analysis (accessed on 18 August 2025).
  26. Brown, J.D. The Cronbach Alpha Reliability Estimate. JALT Test. Eval. SIG 2002, 6, 17–18. [Google Scholar]
  27. Demir, S. Comparison of Normality Tests in Terms of Sample Sizes under Different Skewness and Kurtosis Coefficients. Int. J. Assess. Tools Educ. 2022, 9, 397–409. [Google Scholar] [CrossRef]
  28. Hoskin, T. Parametric and Nonparametric: Demystifying the Terms. Available online: https://www.mayo.edu/research/documents/parametric-and-nonparametric-demystifying-the-terms/doc-20408960 (accessed on 18 August 2025).
  29. Filion, G.J. The Signed Kolmogorov-Smirnov Test: Why It Should Not Be Used. Gigascience 2015, 4, 1–3. [Google Scholar] [CrossRef]
  30. Hanusz, Z.; Tarasinska, J.; Zielinski, W. Shapiro–Wilk Test with Known Mean. REVSTAT-Stat. J. 2016, 14, 89–100. [Google Scholar] [CrossRef]
  31. Hatem, G.; Zeidan, J.; Goossens, M.; Moreira, C. Normality Testing Methods and the Importance of Skewness and Kurtosis in Statistical Analysis. BAU J.–Sci. Technol. 2022, 3, 7. [Google Scholar] [CrossRef]
  32. Bhadouria, S.S. Unit 4. Skewness and kurtosis. Indira Gandhi National Tribal University. Available online: https://www.igntu.ac.in/eContent/IGNTU-eContent-467281593500-B.Com-4-Prof.ShailendraSinghBhadouriaDean&-BUSINESSSTATISTICS-All.pdf (accessed on 24 August 2025).
  33. Sawyer, S. Analysis of Variance: The Fundamental Concepts. J. Man. Manip. Ther. 2009, 17, 27E–38E. [Google Scholar] [CrossRef]
  34. Siebert, C.F.; Siebert, D.C. Data Analysis with Small Samples and Non-Normal Data: Nonparametrics and Other Strategies; Oxford University Press: Oxford, UK, 2017; ISBN 9780199391493. [Google Scholar]
  35. Ostertagová, E.; Ostertag, O.; Kováč, J. Methodology and Application of the Kruskal-Wallis Test. Appl. Mech. Mater. 2014, 611, 115–120. [Google Scholar] [CrossRef]
  36. Oti, E.U.; Olusola, M.O.; Esemokumo, P.A. Statistical Analysis of the Median Test and the Mann-Whitney U Test. Int. J. Adv. Acad. Res. 2021, 7, 2488–9849. [Google Scholar]
  37. Nachar, N. The Mann—Whitney U: A Test for Assessing Whether Two Independent Samples Come from the Same Distribution. Tutor. Quant. Methods Psychol. 2008, 4, 13–20. [Google Scholar] [CrossRef]
  38. Savelsbergh, C.M.J.H.; Havermans, L.A.; Storm, P. Development Paths of Project Managers: What and How Do Project Managers Learn from Their Experiences? Int. J. Proj. Manag. 2016, 34, 559–569. [Google Scholar] [CrossRef]
  39. Divjak, B.; Kukec, S.K. Teaching Methods for International R&D Project Management. Int. J. Proj. Manag. 2008, 26, 251–257. [Google Scholar] [CrossRef]
  40. Abuhussain, M.; Alhamami, A.H.; Almazam, K.; Humaidan, O.; Bashir, F.M.; Dodo, Y.A. Integrating BIM, Machine Learning, and PMBOK for Green Project Management in Saudi Arabia: A Framework for Energy Efficiency and Environmental Impact Reduction. Buildings 2025, 15, 3031. [Google Scholar] [CrossRef]
  41. Yang, Y.; Zhao, B. How Building Information Modelling Mitigates Complexity and Enhances Performance in Large-Scale Projects: Evidence from China. Int. J. Proj. Manag. 2025, 43, 102694. [Google Scholar] [CrossRef]
  42. McCreery, J.K. Assessing the Value of a Project Management Simulation Training Exercise. Int. J. Proj. Manag. 2003, 21, 233–242. [Google Scholar] [CrossRef]
  43. Sarmiento Rojas, J.A.; Güiza Pinzón, F.D.; Rueda Varón, M.J. Characteristics and Perceptions of Project Management in the Productive Sectors towards a Sustainable Future. Results Eng. 2024, 22, 102264. [Google Scholar] [CrossRef]
  44. Bashir, H.; Musa, R.; Al Zarooni, H.A.; Ojiako, U.; Haridy, S.; Shamsuzzaman, M. Social Sustainability in Action: An Explorative Study of Practices in Construction Project Management. Proj. Leadersh. Soc. 2024, 5, 100148. [Google Scholar] [CrossRef]
  45. Engwall, M. No Project Is an Island: Linking Projects to History and Context. Res. Policy 2003, 32, 789–808. [Google Scholar] [CrossRef]
  46. Moreno-Domínguez, M.J.; Escobar-Rodríguez, T.; Pelayo-Díaz, Y.M.; Tovar-García, I. Organizational Culture and Leadership Style in Spanish Hospitals: Effects on Knowledge Management and Efficiency. Heliyon 2024, 10, e39216. [Google Scholar] [CrossRef] [PubMed]
  47. Faghihi, V. Chapter 11—Project management in oil and gas. In Life Cycle of a Process Plant; Nouri, M., Lucke, E., Eds.; Elsevier: Amsterdam, The Netherlands, 2022; pp. 205–234. ISBN 9780128135983. [Google Scholar] [CrossRef]
  48. Niazi, M.; Mahmood, S.; Alshayeb, M.; Qureshi, A.M.; Faisal, K.; Cerpa, N. Toward Successful Project Management in Global Software Development. Int. J. Proj. Manag. 2016, 34, 1553–1567. [Google Scholar] [CrossRef]
Figure 1. Workflow of the study.
Sustainability 17 09129 g001
Figure 2. Gender distribution of participants.
Sustainability 17 09129 g002
Figure 3. Age distribution of participants.
Sustainability 17 09129 g003
Figure 4. Education level distribution of participants.
Sustainability 17 09129 g004
Figure 5. Distribution of participants’ work experience in construction.
Sustainability 17 09129 g005
Figure 6. Distribution of participants’ roles in the project.
Sustainability 17 09129 g006
Figure 7. Distribution by company profile.
Sustainability 17 09129 g007
Figure 8. Distribution by project management training history.
Sustainability 17 09129 g008
Table 1. Research Hypotheses.
No.Hypothesis
H1There is no significant difference between the participants’ opinions on the general use of project management knowledge areas and their education level.
H2There is no significant difference between the participants’ opinions on the general use of project management knowledge areas and their position in the project.
H3There is no significant difference between the participants’ opinions on the general use of project management knowledge areas and the profile of the project they work on.
H4There is no significant difference between the participants’ opinions on the general use of project management knowledge areas and whether they have received project management training.
H5There is no significant difference between the company profile of the participants and the level of application of project management model.
H6There is no significant difference between the project profile of the participants and the level of application of project management model.
Table 2. Normality test results.
SkewnessKurtosis
Use of Project Management Knowledge Areas scale−1.3669.394
Application Level of Project Management model scale−0.1890.317
Kolmogorov–SmirnovShapiro–Wilk
StdfpStdfp
Use of Project Management Knowledge Areas0.1022720.0000.8822720.000
Application Level of Project Management model0.0412720.2000.9902720.063
Table 3. Relationship between Use of Project Management Knowledge Areas and Education Level.
Education LevelNMean RankKruskal–Wallis Hp
High School962.5668.12020.001
Associate5475.55
Bachelor’s128139.40
Master’s63175.97
Doctorate18197.58
Total272
Table 4. Relationship between Use of Project Management Knowledge Areas and Project Role.
Project RoleNMean RankKruskal–Wallis Hp
Project Director29188.0753.00550.0006
Project Manager66169.95
Office Staff84140.01
Field Staff9393.51
Total272
Table 5. Relationship between Use of Project Management Knowledge Areas and Project Profile.
Project ProfileNMean RankKruskal–Wallis Hp
Residential Buildings97130.5912.81170.0122
Industrial Buildings78151.74
Infrastructure Projects36112.36
Public Buildings35161.23
Transportation Projects26112.96
Total272
Table 6. Relationship between Use of Project Management Knowledge Areas and status of receiving Project Management Training.
Project Management TrainingNMean RankSum of RanksMann–Whitney Up
Yes118185.4221,880.003313.00000.0009
No15499.0115,248.00
Total272
Table 7. ANOVA Results for Relationship between Application Level of Project Management model and Company Profile.
Company ProfileNMeanSDSource of VarianceSSdfMSFp
Investor41105.85313.188Between Groups3365.234841.34.3950.002
Contractor/Subcontractor9195.59314.442Within Groups51,104.43267191.4
Project Management/Supervision66100.72714.736Total54,469.67271
Design47101.82910.013
Consultancy27100.29615.987
Total27299.93014.177
Table 8. ANOVA Results for Relationship between Application Level of Project Management model and Project Profile.
Project ProfileNMeanSDSource of VarianceSSdfMSFp
Residential Buildings9799.91712.8555Between Groups1326.9884331.7471.6670.158
Industrial Buildings78101.42315.9166Within Groups53,142.685267199.036
Infrastructure Projects3695.25014.3335Total54,469.673271
Public Buildings35102.77114.7968
Transportation Projects2698.15311.1989
Total27299.93014.1772
Disclaimer/Publisher’s Note: The statements, opinions and data contained in all publications are solely those of the individual author(s) and contributor(s) and not of MDPI and/or the editor(s). MDPI and/or the editor(s) disclaim responsibility for any injury to people or property resulting from any ideas, methods, instructions or products referred to in the content.