1. Introduction
With the rapid advancement of China’s urbanization process, the urbanization rate had exceeded 65% by 2023. Large- and medium-sized cities now face increasingly severe traffic pressures and challenges in meeting travel demands. Against this backdrop, urban rail transit—as a high-capacity, high-efficiency public transportation mode—has become a vital infrastructure for modern cities and metropolitan regions. Beyond alleviating urban traffic congestion, urban rail transit delivers substantial benefits in both economic development and urban mobility. Well-planned multi-layer regional rail transit networks promote regional integration, improve employment accessibility, and reduce spatial inequality [
1], while providing energy-efficient solutions that enhance social equity through affordable and accessible transportation for diverse populations. This is fundamentally due to its significant advantages, including large passenger capacity, high speed, high punctuality, and environmental friendliness.
However, as rail transit networks continue to improve and passenger volumes steadily increase, numerous operational challenges have emerged. Particularly in passenger flow organization, traditional point-to-point transportation modes can no longer meet the complex and diverse travel demands. Problems such as uneven passenger flow distribution at stations, low transfer efficiency, and severe congestion during peak hours have become increasingly prominent. These problems not only impact the passenger experience but also constrain the sustainable development of the rail transit system.
Passenger transport corridors refer to passenger flow channels with clear directionality and continuity formed within rail transit networks by optimizing route layouts and other measures based on passenger flow characteristics and travel patterns. The introduction of the passenger transport corridor concept provides new approaches and methods for addressing the aforementioned problems. However, traditional passenger transport corridor identification methods struggle when processing high-dimensional data generated by large-scale rail transit networks, making it difficult to effectively extract deep-level passenger flow patterns. Additionally, they lack adaptability to complex network structures. When dealing with networked operations involving multiple lines and transfer nodes, traditional approaches struggle to accurately capture passenger flow variations across different time periods and spatial regions.
To address traditional approach limitations, this study proposes a passenger transport corridor identification method based on Origin–Destination (OD) clustering in an urban rail transit network to reveal concentrated travel paths and analyze passenger demand patterns. The OD clustering approach identifies core OD pairs with the strongest agglomeration effects, filtering out sporadic trips to enable accurate corridor delineation and differentiation between primary and secondary corridors based on passenger flow. Importantly, the identified OD pairs reveal passengers’ cross-line transfer behaviors within the rail transit system, providing valuable insights for implementing through-service operations and inter-line connectivity improvements. This provides quantitative evidence for corridor identification and achieves strategic goals of enhancing transportation equity, optimizing resource allocation, and improving operational efficiency, ultimately contributing to a more efficient, economically viable public transportation system and sustainable urban development. The methodology involves three phases: clustering analysis of OD data to group pairs with similar travel characteristics, passenger flow assignment to obtain primary flow paths for each cluster, and corridor identification through spatial relationship analysis.
The primary innovations of this research are twofold:
Enhanced Similarity Function: An improved similarity function is developed for OD clustering that incorporates both distance similarity and path overlap similarity between different OD pairs. Unlike conventional approaches that rely solely on spatial distance metrics, this enhanced function enables more accurate identification of passenger groups with similar travel patterns and behavioral characteristics, thereby improving the practical applicability of clustering results.
Optimized Clustering Center Determination: A novel method for determining clustering centers is proposed that simultaneously considers passenger flow volume and the distance from cluster members to the center point. Its advantage lies in its ability to align with physically meaningful actual urban rail transit stations, thereby better reflecting passengers’ genuine transfer needs and travel behavior patterns.
The remainder of this paper is organized as follows:
Section 2 provides a literature review.
Section 3 introduces a passenger transport corridor identification method based on OD clustering.
Section 4 discusses the research results and sensitivity analysis.
Section 5 presents the conclusions.
2. Literature Review
Recent research on urban passenger transport has evolved significantly, reflecting the increasing complexity and interdisciplinary nature of this field. Verano-Tacoronte et al. conducted a comprehensive bibliometric analysis of urban passenger transport research from 2001 to 2021, revealing key research themes including travel behavior, sustainability, transportation efficiency, and network performance [
2]. This evolving research landscape underscores the necessity for data-driven, systematic approaches to identify and optimize passenger transport corridors [
3]. To enhance the efficiency of urban transport networks and optimize public transport services, many scholars have utilized big data mining tools to intelligently identify urban collector/distributor points [
4]. However, relying solely on information from transportation hubs has limitations in understanding the travel needs of urban residents. While transportation hubs reflect local traffic density, they cannot capture information such as the travel directions and actual travel network trajectories of residents’ starting and ending points.
The concept of priority movement corridors in urban passenger transport has gained increasing attention as cities strive to improve public transport efficiency. Gorev et al. investigated the formation of priority movement corridors for urban passenger transport, analyzing the conditions and requirements for establishing such corridors within road networks [
5]. This aligns with our research objective of developing a data-driven approach to identify passenger transport corridors based on actual travel patterns.
In geography, the term “corridor” was first introduced by geographer Griffith Taylor in his 1949 book
Urban Geography [
6]. Later, C. F. J. Whebell, in a journal article, expanded this concept by describing corridors as linear pathways that connect different areas within a city [
7]. Since then, “transport corridors” have emerged as an important planning concept—multi-modal arterials that carry a large proportion of passenger and freight traffic between major transport nodes.
From a theoretical perspective, passenger transport corridor research contributes to enriching and improving rail transit planning theory systems, providing scientific guidance for network operations [
8]. From a practical standpoint, the construction and optimization of passenger transport corridors can enhance system operational efficiency, improve passenger travel experience, and strengthen network resilience and safety [
9]. The core advantages of passenger transport corridors lie in: first, their ability to achieve orderly guidance and efficient evacuation of passenger flows, improving overall network capacity; second, optimizing transfer organization to reduce passenger travel time costs; third, enhancing the system’s emergency response capabilities in sudden situations; and fourth, providing support for integrated connections between rail transit and other transportation modes [
10]. Therefore, constructing an efficient passenger transport corridor system is of great significance for improving urban rail transit service levels and promoting sustainable urban transportation development [
11].
Numerous scholars have explored the identification of urban public transport corridors. In terms of graph theory methods, spatial network analysis has been employed using the topological structure and passenger flow distribution of spatial networks [
12]. On the data-driven front, probabilistic tensor decomposition models have been used to identify regular passenger transport corridors and patterns within urban areas [
13]. To reduce reliance on expert knowledge, some researchers have identified urban public transportation corridors by aggregating neighboring trajectories or Origin–Destination (OD) flows. Tong et al. developed a shared flow clustering algorithm based on single-vehicle bus trip data to identify corridors [
14]. Kinan et al. proposed TraClus-DL for clustering desired line trajectories to identify demand corridors [
15], while Zhang et al. introduced a network flow model integrating statistical traffic assignment and probabilistic OD estimation [
16]. Some scholars have also established the k-Primary Corridor algorithm based on GPS data, setting the objective function as the minimum generalized cost and maximum aggregate utility along the route [
17,
18]. Yin and Zhang proposed an identification method for optimal urban bus corridor locations, employing a K-shortest path algorithm to generate candidate corridors and considering aggregation effects along potential routes [
19]. While their approach focused on bus corridors and route optimization, our research extends this concept to urban rail transit networks and emphasizes the clustering of Origin–Destination pairs to reveal inherent travel patterns and cross-line transfer behaviors.
Existing corridor identification methods primarily rely on idealized prior assumptions or empirical judgments [
4,
20], with algorithms that sometimes deviate from the constraints of real-world road network information. Traditional full traffic assignment methods for transit corridor identification are characterized by high computational complexity and are susceptible to “noise” interference generated by Origin–Destination (OD) pairs with low passenger flows [
21]. Although some researchers have proposed traffic corridor identification approaches based on clustering theory and graph theory [
22,
23], the clustering centers obtained by existing methods are newly generated, and the paths between OD pairs are directly connected spatially, resulting in spatial discrepancies with existing route stations. These methods ignore actual passenger trajectory information, significantly undermining the reliability and accuracy of corridor identification results.
In summary, traditional passenger transport corridor identification methods primarily include empirical judgment, two-step clustering, and travel expectation graph approaches. These approaches fall short when handling high-dimensional data generated by large-scale rail transit networks, failing to effectively extract underlying passenger flow patterns. Furthermore, they neglect the spatiotemporal dynamics of passenger flows and lack the capacity to adapt to complex network structures. When confronting networked operations involving multiple lines and transfer nodes, traditional methods struggle to accurately capture the patterns of passenger flow variation across different time periods and spatial regions.
3. Methodology
3.1. Overall Framework for Passenger Transport Corridor Identification
To identify passenger corridors in urban areas, we propose a novel corridor identification method based on OD (Origin–Destination) clustering.
Figure 1 shows the flowchart of the method. Specifically, OD clustering can identify OD pairs with high similarity, and these OD pairs constitute the components of passenger transport corridors. Each OD pair can correspond to multiple possible paths within the metro network. To accurately allocate passenger flow between these OD pairs, we calculate the path and interval flows for each pair under multiple route selections, thereby identifying the primary passenger flow paths for clustered OD pairs. A multi-path Logit model is employed for the passenger flow assignment, which has been widely validated in metro networks [
24]. This model probabilistically assigns flows across multiple feasible paths based on travel impedance, effectively capturing passenger route choice behavior under diverse travel conditions. Based on this, we analyze the spatial mapping relationship between passenger transport corridors and clustered OD pairs to determine the basic compositional units of corridors, thereby completing corridor identification.
3.2. OD Clustering for Critical OD Pair Identification
OD passenger flow clustering differs from traditional clustering methods in Euclidean space. It is not based solely on Euclidean distance similarity, i.e., elements with high distance similarity are grouped together. The distance function in OD clustering must take into account the specific characteristics of the data, which involves designing appropriate clustering variables, constructing custom distance functions, and ultimately generating a distance matrix.
Moreover, the output of OD clustering includes several key components: the number of clusters, the number of sample points within each cluster, the number of outliers in each cluster, and the cluster assignment for each sample point. However, the process does not provide information about the cluster centroids. Therefore, it is necessary to determine the cluster centroids that hold actual physical significance.
Lastly, an essential step is to evaluate the effectiveness of the OD clustering results in order to identify the optimal clustering scheme.
3.2.1. Custom Distance Metric for OD Clustering
An OD pair is defined as a spatial vector (), where the and are the origin point and destination point with coordinates.
Cluster analysis can be used to identify the destinations of a large number of passengers traveling by urban rail transit. The similarity measurement method of the clustering objects is the basis of clustering. Due to the different types and characteristics of clustering data, different similarity measurement methods need to be adopted to characterize the clustering objects. When clustering OD data, the similarity measurement mainly considers the distance between the corresponding destinations on the travel activity chain and the overlap between destinations.
The distance of the OD pair can be defined by the sum of the origin points path distance () and the destination points path distance () between the and the . The path distances and are measured as the actual travel distance passengers would experience when riding the urban rail transit system, fully accounting for the real route topology and network structure. This measurement reflects both the physical distance and the operational characteristics of the transit network, ensuring that the similarity function captures realistic travel patterns.
Path overlap (
) is an important function for measuring the similarity of travel paths between OD pairs, calculated based on the number of stations along the path.
where
represents the number of stations shared by both OD paths, and
and
denote the total number of stations on the OD paths of the
and
, respectively.
Therefore, the custom distance measurement formula for OD clustering is as follows:
where
and
are distance variables (
,
) after dimensionless processing,
is the overlap variable (
) after inverse processing. In this study,
and
represent the weights for distance variables (
,
), respectively. Since both the origin and destination are equally fundamental components of an OD pair, they are assigned equal importance in measuring spatial similarity. Neither component should be prioritized over the other in passenger corridor identification. The parameter
weights the path overlap component. Setting
and
ensures that the path overlap similarity receives comparable consideration to the combined spatial distance. This reflects the principle that passengers with similar spatial distributions and shared travel routes should be clustered together.
3.2.2. Physical Meaningful Centroids Determination
In traditional clustering analysis, cluster centers are typically generated randomly, usually based on experimental testing or subjective judgment. The cluster centers in the OD clustering proposed in this study differ from those in traditional methods. To accurately identify passenger transport corridors for cross-line renovation, the cluster centers in OD clustering should be existing stations that appear in pairs, with each cluster containing two centers representing the origin point and the destination.
The optimal cluster centroids (
) should satisfy two requirements: the sum of the distances from all points within the same class to the centroids should be minimal, and the OD flow of the centroids should be maximal.
where
and
denote the distances between the origin points and the destination points in the
and
, respectively.
and
represent the OD flow of the
and
, and
means the maximum OD flow proportion of
.
is the number of sample points within the cluster
.
The cluster centroids (
) are determined through a selection process that balances spatial centrality with passenger flow importance. The objective is to identify an OD pair within the cluster that minimizes the total distance to all other cluster members while prioritizing high-flow OD pairs. The algorithm pseudocode is shown in Algorithm 1.
| Algorithm 1: Cluster centroids selection |
Input: Cluster: A set of OD pairs {, , …, };
: Passenger flow vector {, , …, } |
| Output: (): Origin and destination centroids |
| 1: | //Step 1: Calculate total passenger flow |
| 2: | TotalFlow ← |
| 3: | |
| 4: | //Step 2: Find origin centroid |
| 5: | MinScore_O |
| 6: | for each in Cluster do |
| 7: | DistSum |
| 8: | for each in Cluster () do |
| 9: | DistSum ← DistSum + |
| 10: | end for |
| 11: | Score_← DistSum × |
| 12: | if Score_ < MinScore_O then |
| 13: | MinScore_O ← Score_ |
| 14: | ← |
| 15: | end if |
| 16: | end for |
| 17: | |
| 18: | //Step 3: Find destination centroid (same process) |
| 19: | MinScore_D |
| 20: | for each in Cluster do |
| 21: | DistSum |
| 22: | for each in Cluster () do |
| 23: | DistSum ← DistSum + |
| 24: | end for |
| 25: | Score_← DistSum × |
| 26: | if Score_ < MinScore_D then |
| 27: | MinScore_D ← Score_ |
| 28: | ← |
| 29: | end if |
| 30: | end for |
| 31: | |
| 32: | return () |
For each OD pair in the cluster, we calculate a weighted score that combines two components: (1) the sum of distances from this pair to all other pairs in the cluster, and (2) an inverse passenger flow weight . The OD pair with the minimum weighted score is selected as the centroid. This calculation is performed separately for origin points (Equation (3)) and destination points (Equation (4)).
3.2.3. Optimal Clustering Scheme Selection
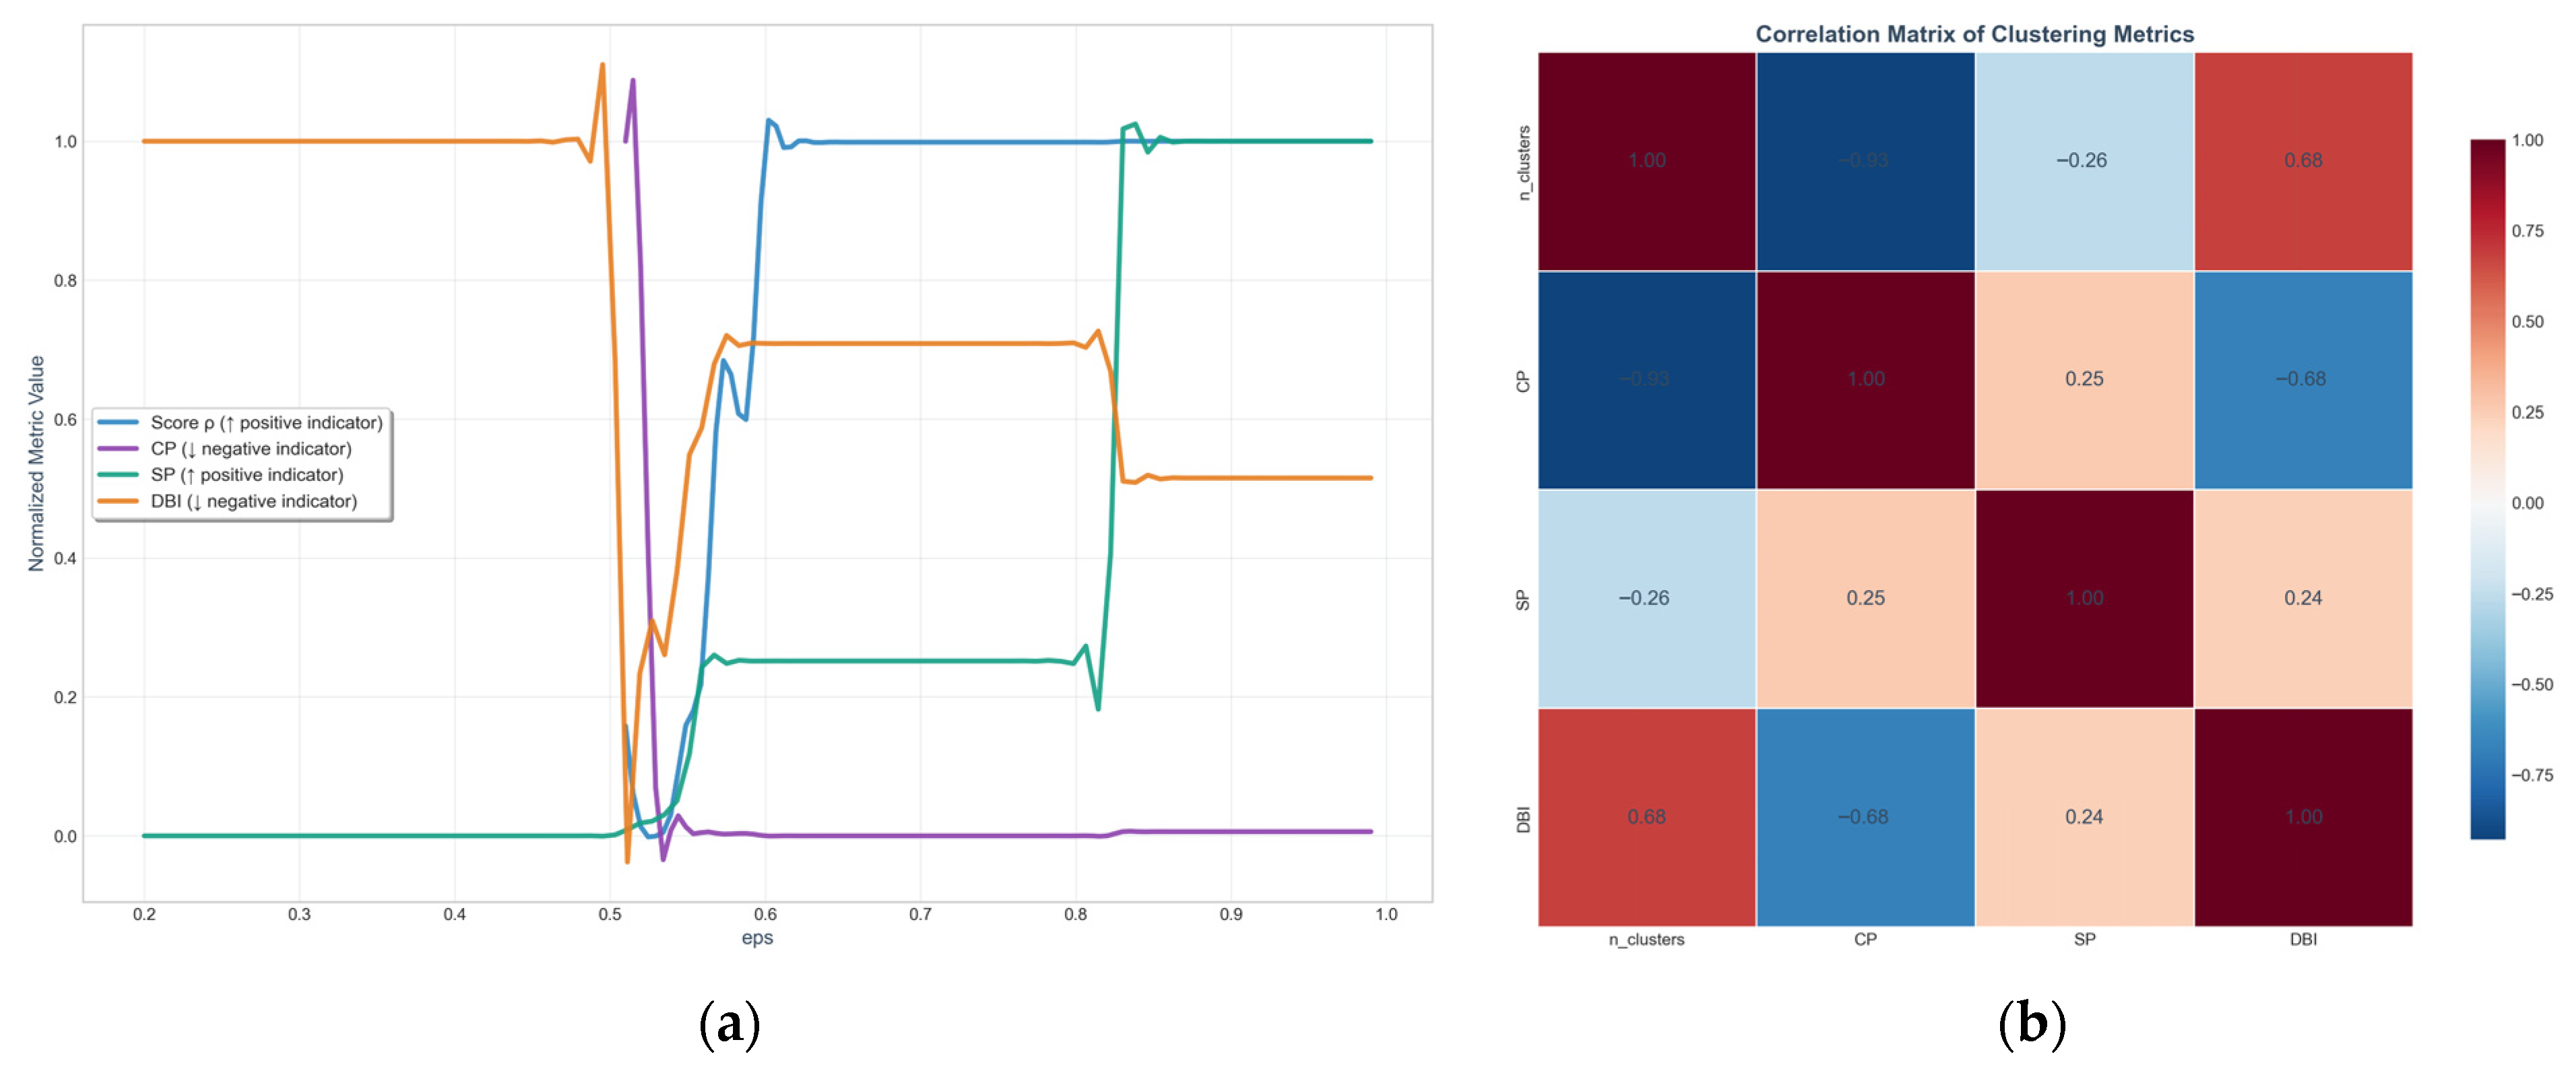
Clustering evaluation metrics are measurement methods used to assess the effectiveness of clustering. The higher the similarity of objects within a cluster and the lower the similarity between clusters, the better the clustering effect. Commonly used clustering effectiveness metrics are internal metrics, which evaluate the quality of clustering based on the distribution characteristics of the data itself. The effectiveness of clustering is primarily evaluated based on two types of metrics: intra-cluster compactness and inter-cluster separation, which correspond to Compactness (CP) and Separation (SP), respectively. Furthermore, the Davies–Bouldin Index (DBI) is employed to comprehensively reflect both intra-cluster compactness and inter-cluster separation.
For a clustering schemes with
clusters in the
clustering scheme,
where
represents the intra-cluster compactness of the
scheme, and
represents the compactness of the
cluster of the
scheme.
and
denote the distances between the origin points and the destination points in the
and cluster centroids (
), respectively.
denotes the number of OD pairs within the
cluster, and
denotes the set of OD pairs within the
cluster.
where
represents the inter-cluster separation of the
scheme, and
and
denote the distances between the origin centroid points and the destination centroid points in the
and
cluster, respectively.
where
reflects the clustering quality by comparing intra-cluster distance with inter-cluster distance.
and
represent the compactness of the
and
cluster of the
scheme, respectively.
The smaller the value, the better the intra-cluster compactness; the larger the value, the better the inter-cluster separation; the smaller the value, the higher the intra-cluster similarity and the lower the inter-cluster similarity, resulting in better clustering performance.
Use the entropy weight method to determine the weights of the three internal indicators, thereby obtaining the comprehensive clustering effect score
of the schemes.
where
,
, and
are the standardized data, respectively.
3.3. Corridor Identification and Spatial Analysis
The OD pairs obtained through OD clustering are isolated and dispersed. The passenger flow allocation method is employed to process clustered OD pairs, thereby identifying the primary passenger flow paths of these clustered pairs. These paths serve as the constituent units for identifying passenger transport corridors.
The constituent units of passenger transport corridors include location information and passenger flow information. It is necessary to analyze the spatial relationship between the OD flows that constitute passenger transport corridors and urban rail transit lines to more clearly distinguish whether passenger transport corridors are cross-line.
The cluster centers obtained from OD cluster analysis are the basis for identifying passenger transport corridors and are also the objects for passenger flow distribution. After completing the passenger flow distribution, the cluster centers and their main passenger flow paths are regarded as the basic units that constitute passenger transport corridors.
Let denote the set of OD clustering results and denote the set of passenger transport corridors. A function is defined as a mapping from to , written as , if and only if for each element , there exists a unique element such that corresponds to . performs passenger flow allocation processing on multiple OD clustering results, which facilitates the calculation of critical quantitative metrics for passenger transport corridors, specifically: (1) the cross-sectional passenger flow volumes within the corridors, and (2) the cumulative mileage of route segments that meet specified passenger flow capacity requirements.
When a single passenger transport corridor component unit already satisfies the corridor identification criteria, this component unit can independently serve as a passenger transport corridor.
When a single passenger transport corridor component unit fails to meet the corridor identification criteria, it is necessary to select multiple connectable passenger transport corridor component units that collectively satisfy the identification standards. Multiple component units can be considered connectable if they meet the conditions of end-to-end connection in the same direction or endpoint connection along the same orientation.
When multiple component units cannot be connected end-to-end or at endpoints, assessment of the disconnected segments is required. If the shortest path length of a disconnected segment is greater than or equal to the length of the shortest passenger transport corridor component unit, these units cannot be considered connectable components. Conversely, if the shortest path length of a disconnected segment is less than the length of the shortest passenger transport corridor component unit, then the multiple component units and the shortest path of their disconnected segments can be treated as connectable passenger transport corridor component units.
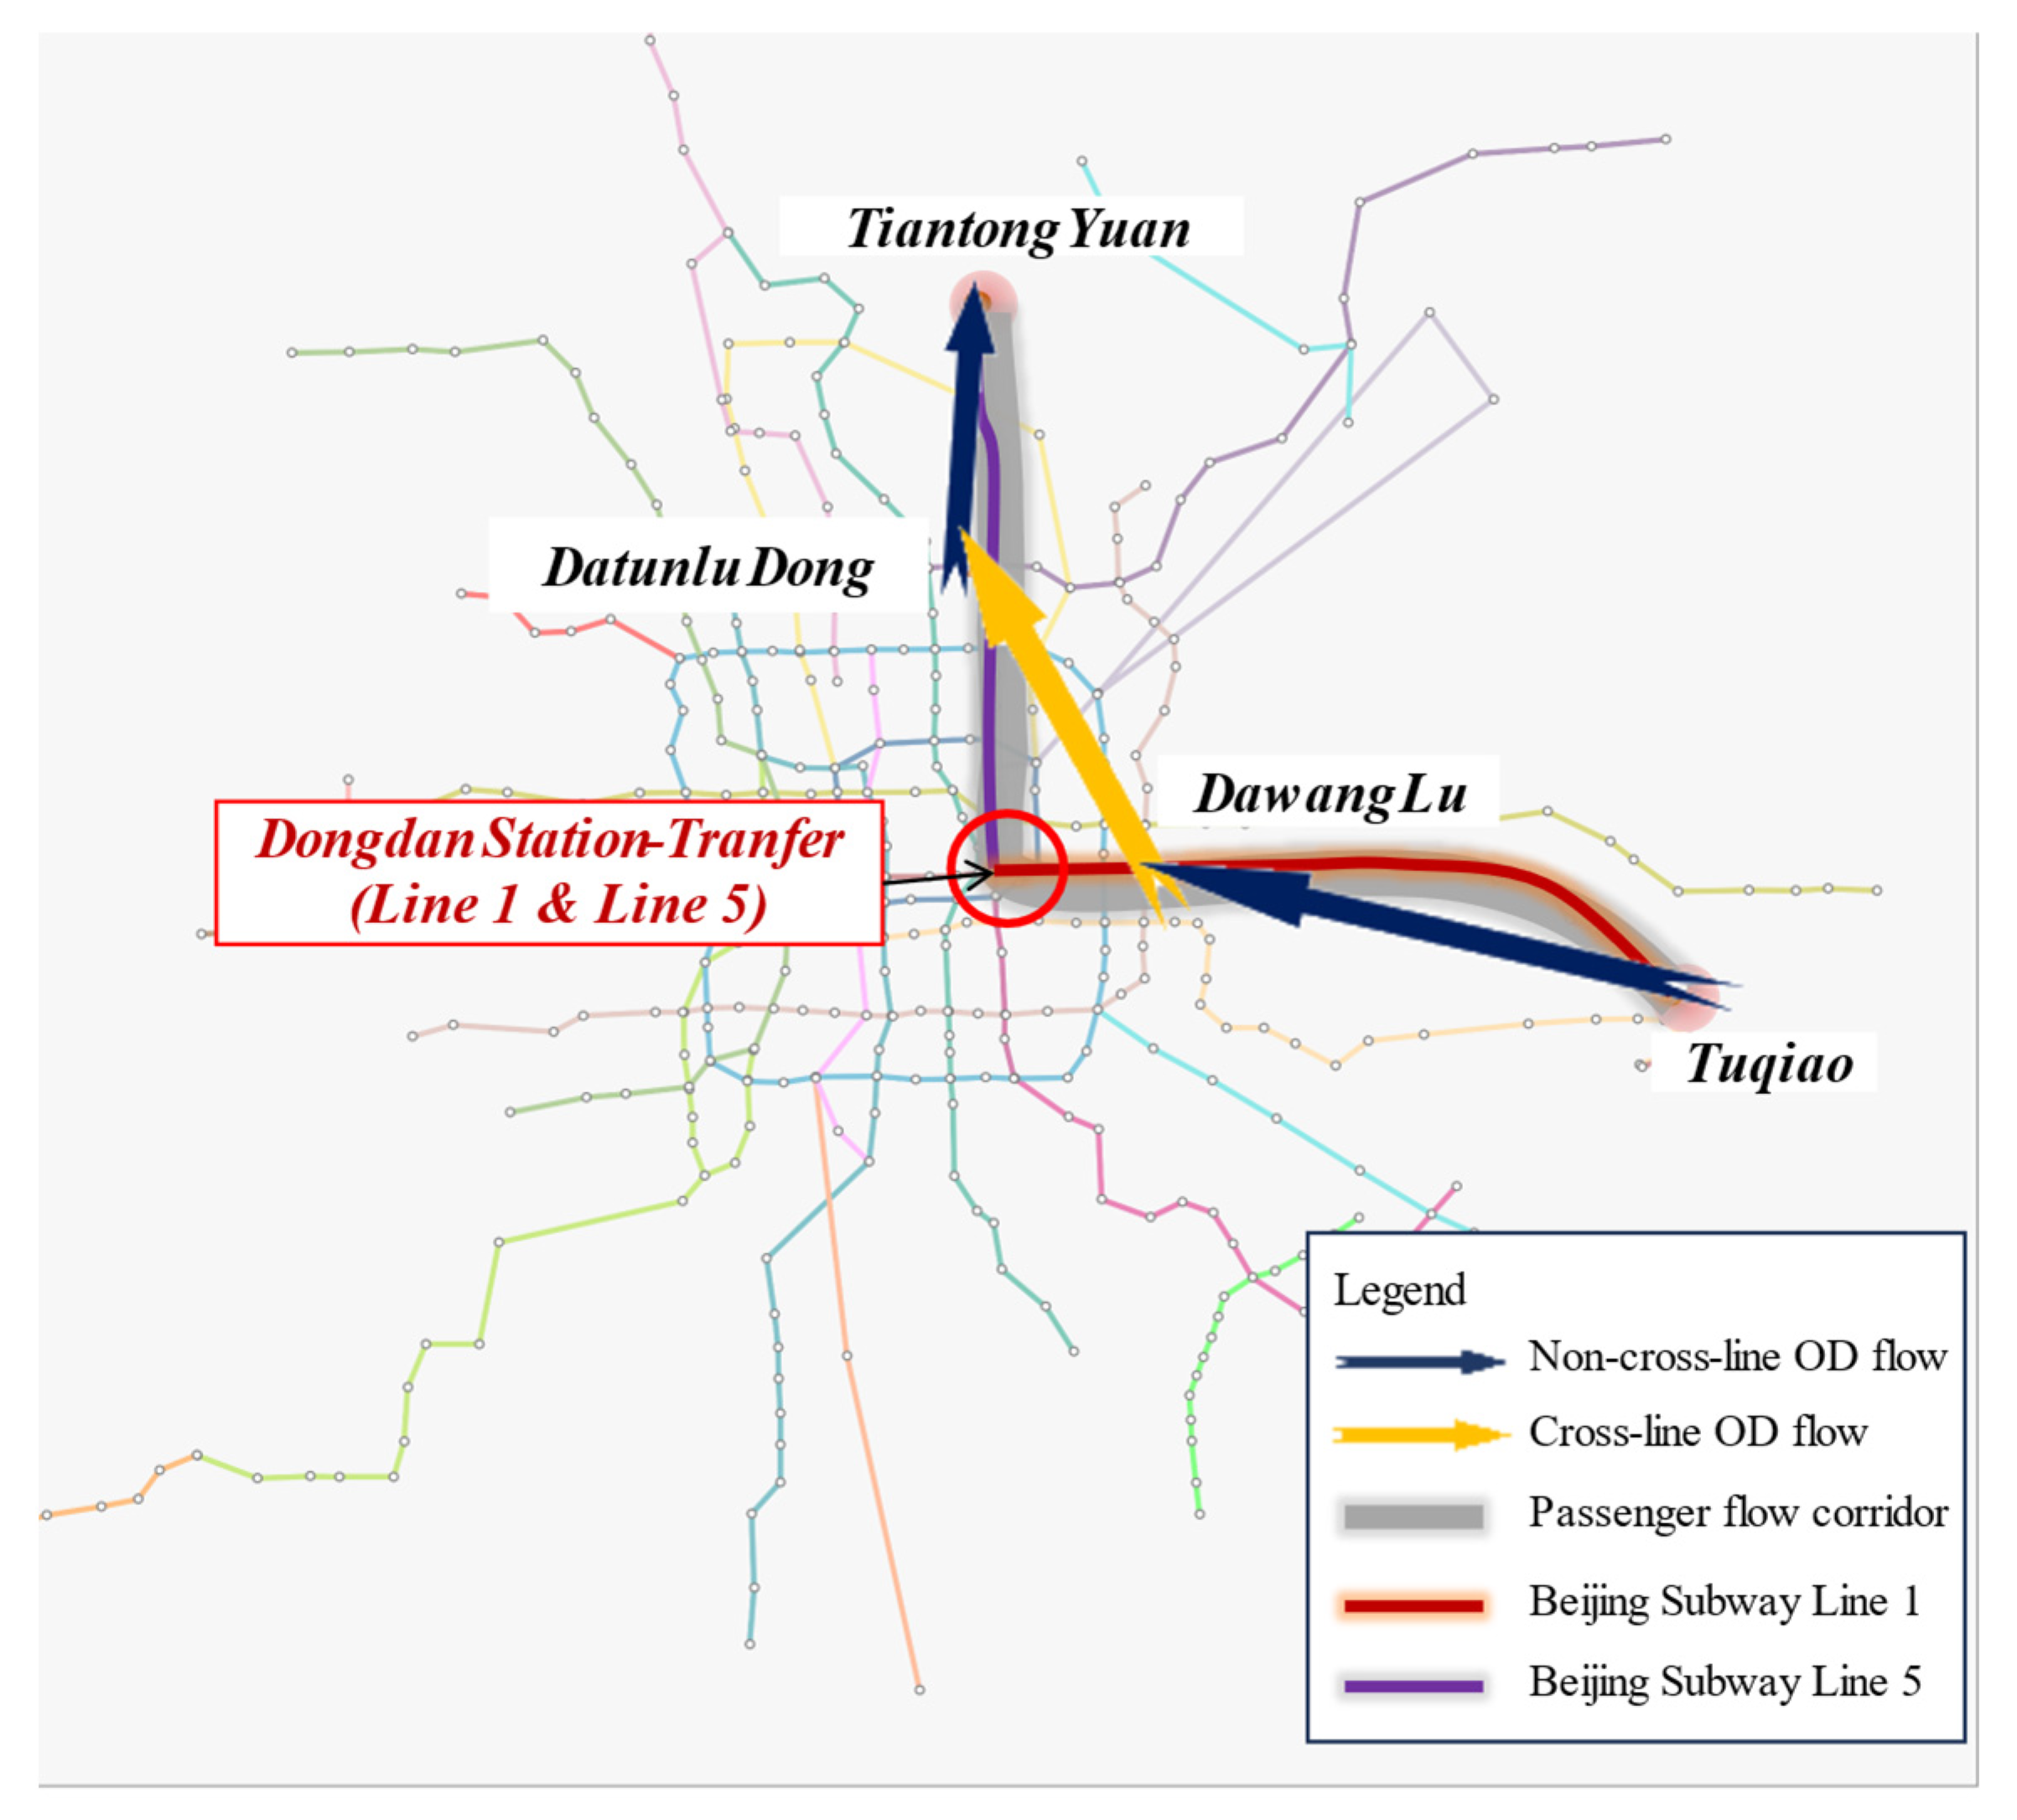
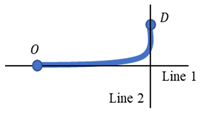
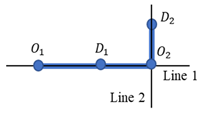
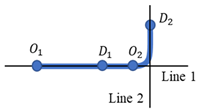
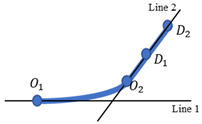
Passenger transport corridors based on OD clustering can be classified as either cross-line or non-cross-line types. The basic units constituting a corridor may consist of either a single unit or multiple units. Specific examples are provided in
Table 1.
To ensure reproducibility, the following quantitative thresholds are established:
- (1)
Minimum cross-sectional flow: ≥10,000 passengers/day.
- (2)
Corridor length criterion: ≥50% of length maintains flow ≥5000 pax/day.
These thresholds were determined based on Beijing’s operational standards for high-capacity corridors and validated through consultation with transit planning experts. Different cities may need to adjust these values based on their network scale and operational characteristics.
5. Conclusions and Discussion
5.1. Conclusions
This study presents a comprehensive analysis of travel demand intensity between origins and destinations in urban rail transit networks, addressing a critical challenge in urban transportation planning and management. The proposed Origin–Destination (OD) clustering method introduces a novel approach that advances beyond traditional clustering techniques by incorporating domain-specific characteristics of transit networks.
The customized similarity calculation method developed in this research represents a significant methodological advancement. Unlike conventional clustering approaches, our method employs a tailored distance function that generates clustering center pairs with concrete physical meaning, directly corresponding to actual station locations within the network. This innovation enables more accurate and interpretable results that align with the operational realities of urban rail systems. The establishment of a mapping relationship between passenger transport corridors and clustered OD pairs provides a systematic framework for corridor identification, bridging the gap between data-driven analysis and practical transportation planning.
The application to Beijing’s urban rail transit system demonstrates the method’s practical viability and reveals several important insights. The identified passenger transport corridors not only exhibit high-concentration passenger flows but also provide valuable information about transfer patterns within the network. By incorporating spatial location information of clustering OD pairs, the method successfully captures the complexity of passenger movement patterns, including multi-line journeys and transfer behaviors. These findings have direct implications for network planning, capacity allocation, and service optimization strategies.
This research contributes to the theoretical understanding of urban mobility patterns by providing a quantitative framework for analyzing the hierarchical structure of travel demand in complex transit networks. The method offers a new perspective on understanding the relationship between network topology and passenger flow distribution, which is essential for developing more efficient and responsive urban transportation systems.
5.2. Discussion
While this study provides valuable contributions to passenger transport corridor identification, several limitations should be acknowledged, which also point to promising directions for future research.
This study utilizes OD flow data from Beijing’s urban rail transit system during a specific time period, which may not fully capture seasonal variations or long-term evolutionary trends in travel patterns. The analysis focuses exclusively on urban rail transit data without incorporating information from other transportation modes. Future research should integrate multi-modal transportation data, including buses, shared bicycles, and ride-hailing services, to achieve a more comprehensive understanding of urban mobility corridors and seamless connections between different transport modes.
Although the DBSCAN clustering method offers flexibility through adjustable parameters, the eps parameter significantly impacts metrics such as the number of clusters and clustering quality. Different eps values can yield entirely distinct clustering results. Due to computational resource constraints, sensitivity analysis experiments employed a subset of 1000 samples. While this sample size represents 5% of the total dataset, sensitivity analysis results indicate that the observed trends in clustering performance metrics align with those of the full dataset. However, we acknowledge that a larger sample size would provide more robust validation of the sensitivity results. Future research will focus on validating the stability of sensitivity analysis results on full datasets while optimizing the joint parameter space of eps and minpts. The method’s universality will be verified across diverse urban datasets to enhance the robustness of passenger transport corridor identification based on OD clustering.
Although this method successfully identifies passenger flow corridors based on core OD data, the actual implementation of through-service operations or connectivity improvements must consider additional operational constraints beyond the scope of this study. These include vehicle compatibility, signal system integration, depot locations, crew scheduling, and operational safety requirements. Future research should establish an integrated framework to bridge the gap between analytical corridor identification and operational implementation.
Looking ahead, this study will expand into multi-modal transportation integration, as urban mobility increasingly relies on seamless connections between different transport modes. Subsequent research will delve into other factors influencing passenger corridor formation, including temporal variability (such as peak-hour vs. off-peak patterns), socioeconomic characteristics, and land use patterns. These extensions will not only improve the quantitative precision of corridor identification but also provide comprehensive theoretical guidance for enhancing urban public transit connectivity. Furthermore, the insights gained will support the development of innovative operational strategies, such as cross-line train services and dynamic capacity allocation, ultimately contributing to the construction of more sustainable and efficient urban transportation systems.

