1. Introduction
As one of the core components of the global low-carbon transportation system, high-speed railway (HSR) plays a pivotal role in reducing transportation-related carbon emissions due to its electric traction and high-capacity transport capabilities [
1,
2]. Ensuring the efficient and stable operation of HSR systems is of strategic importance to the realization of sustainable transportation objectives. However, in complex operational environments, frequent disruptions caused by extreme weather events, equipment failures, or other contingencies often lead to train delays or cancellations, resulting in prolonged passenger waiting times or mode shifts to less sustainable alternatives. These incidents not only increase energy consumption but also reduce passenger satisfaction levels, thereby contradicting the principles of low-carbon sustainability.
Current HSR emergency rescheduling primarily relies on manual expertise, with theoretical studies primarily focusing on single-line disruption scenarios. Existing studies do not adequately address the spatiotemporal coupling effects of multiple spatially and temporally correlated disruption events in networked operations. Experience-based single-disruption management mechanisms exhibit several inefficiencies and inherent limitations, which manifest in three key aspects:
Manual rescheduling fails to effectively quantify disruption impacts on passenger service quality, often resulting in inefficient resource allocation.
Traditional optimization models that prioritize train delay minimization lack a comprehensive integration of passenger demands, potentially leading to suboptimal or controversial outcomes. For instance, canceling trains eliminates their direct delays and associated resource conflicts, mitigating systemic delay propagation, but may result in secondary issues such as large-scale passenger congestion.
In scenarios involving spatially and temporally correlated disruptions, locally optimized strategies often cause cross-line rescheduling conflicts, thereby increasing the systemic risks of cascading network failures. As HSR networks continue to expand and passenger density rises, these challenges intensify, further exposing the inadequacy of traditional experience-based rescheduling approaches in complex, large-scale operational contexts.
To address these issues, this study proposes a passenger-centric integrated timetable rescheduling framework for HSR networks under multiple correlated disruptions. By establishing a multi-objective optimization model that minimizes total passenger delay time and trip failures, our approach dynamically coordinates train speed adjustments, stop-schedule optimization (including dwell time and station skipping), overtaking coordination, and selective train cancellations to align operational resources with passenger demand. We contrast two automated rescheduling strategies: a step-wise method that sequentially optimizes individual disruptions using single-disruption models, and an integrated approach that resolves cross-line conflicts through global optimization. Both strategies address the limitations of manual rescheduling by systematically balancing passenger delays, trip failures, and operational feasibility via data-driven models, unlike subjective, experience-driven manual decisions. Case studies on a real-world China’s HSR subnetwork (Beijing-Shanghai, Shanghai-Chengdu, and Hefei-Bengbu lines) demonstrate that the integrated rescheduling method significantly reduces passenger inconveniences in complex scenarios, validating its practical value in enhancing service quality and providing theoretical foundations for intelligent HSR rescheduling.
The remainder of this paper is organized as follows.
Section 2 reviews advancements in train rescheduling research.
Section 3 formally defines the timetable rescheduling problem under multiple correlated disruptions.
Section 4 constructs the integrated rescheduling model and solution algorithm.
Section 5 validates the method’s effectiveness through case studies on China’s HSR network.
Section 6 concludes the work and outlines future research directions.
2. Literature Review
Existing research directions in railway rescheduling can be categorized into three domains: train-oriented rescheduling, passenger-centric rescheduling, and network-coordinated scheduling.
2.1. Train-Oriented Rescheduling Research
Train-oriented rescheduling prioritizes operational efficiency, employing methodologies such as mixed-integer linear programming (MILP) [
3,
4], heuristic algorithms [
5,
6], and reinforcement learning [
7,
8,
9,
10] to optimize train delay minimization or deviations from planned timetables under single-disruption scenarios. For instance, D’Ariano et al. [
11] developed a conflict detection and speed coordination model based on a spatiotemporal network, reducing delays through iterative scheduling. Fischetti and Monaci [
12] proposed heuristic preprocessing strategies to enhance the computational efficiency of real-time MILP-based adjustments. For large-scale disruptions, Zhan et al. [
13] constructed a spatiotemporal network model for complete line blockages, utilizing train reordering strategies to control cancellations and total delays. Veelenturf et al. [
14] further mitigated service cancellations and delays through train rerouting. However, such studies often neglect to quantify critical service quality metrics directly impacting passenger experience—such as trip failures and increased travel time—potentially leading to paradoxical outcomes where improved train punctuality coincides with reduced passenger satisfaction. Louwerse and Huisman [
15] and Binder et al. [
16] underscored that traditional methods—such as experience-driven manual rescheduling and train-centric optimization models—while effective in reducing delays and cancellations, may unintentionally induce large-scale passenger congestion or route deviations, thereby amplifying overall societal costs.
2.2. Passenger-Centric Rescheduling Research
To address growing passenger demands for enhanced service quality, recent studies have integrated passenger service considerations into rescheduling models through multi-objective optimization, balancing operational costs and passenger experience. These efforts focus on three key dimensions:
Quantifying passenger inconvenience and satisfaction through metrics such as travel time, waiting duration, and transfer frequency [
17,
18,
19]. For instance, Sato et al. [
20] aggregated these factors into a composite inconvenience index, while Xiu et al. [
21] introduced an itinerary deviation index to dynamically optimize cancellation and delay trade-offs using ticketing data.
Coordinating resources to mitigate disruption impacts [
22,
23,
24]. Research in this area emphasizes adaptive strategies like deploying temporary trains [
25] and optimizing dwell times [
26]. Such approaches aim to minimize delays while aligning operational adjustments with real-time passenger demands.
Developing cross-line transfer coordination mechanisms. Zhu and Goverde [
27] established minimum transfer time constraints, whereas Zhang et al. [
28] proposed a multistage decision framework with compensation mechanisms. However, existing studies predominantly address single-disruption scenarios, lacking solutions for resource conflicts and transfer flow interactions under concurrent multiple correlated disruptions.
2.3. Network-Coordinated Rescheduling
Under the networked operations of high-speed railways, the spatiotemporal interdependencies of disruptions have significantly complicated real-time train rescheduling. As a result, research has gradually expanded from line-level rescheduling to network-wide coordinated rescheduling approaches [
29]. For example, Zhan et al. [
30] proposed a decomposition algorithm to synchronize network-wide timetable rescheduling with passenger rerouting, validating its efficacy on China’s high-speed railway network. Binder et al. [
31] developed a multi-objective optimization model based on the concept of passenger equilibrium to balance operator costs, timetable deviations, and passenger satisfaction. While these studies represent important preliminary advances in network-level coordination, their core scenarios remain limited to single-line disruption scenarios and do not address the coupling effects of multi-line resource conflicts and transfer demands under multiple disruptions.
The spatiotemporal correlations of multiple disruptions significantly increase rescheduling complexity, where interactions between disruptions across sections may induce systemic strategy conflicts. For example, resolving delays on Line A by canceling a train may free resources locally but propagate transfer failures to Line B, as passengers miss connections. Similarly, overtaking decisions optimized for a disrupted section might violate station capacity limits on adjacent lines due to overlapping train schedules. Such conflicts arise from uncoordinated resource allocation across interdependent network components, where isolated optimizations neglect cross-line dependencies, ultimately undermining global objectives like passenger satisfaction and operational stability. Corman et al. [
32] employed a bi-level programming model to reveal interdependencies in regional rescheduling decisions, demonstrating that local optimizations may render network-wide timetables infeasible. Zhu and Goverde [
33] formulated a mixed-integer programming model for rolling stock turns optimization and dynamic resource allocation under multiple disruptions. However, their objective function prioritized conventional operational metrics (e.g., cancellation rates, delay durations), neglecting to quantify passenger service quality degradation caused by disruptions. Zhang et al. [
34] developed a rescheduling model to minimize passenger delays for large-scale network disruptions, yet their work focused on concentrated disruptions within single regions, overlooking cross-line, multi-node concurrent disruptions.
2.4. Limitations of Prior Work and Research Contributions
Existing studies on high-speed railway rescheduling exhibit critical limitations in addressing multiple correlated disruptions. Manual rescheduling mechanisms lack adaptability to dynamic passenger flows, while optimization models overly prioritize operational efficiency at the expense of passenger-centric metrics. Furthermore, localized strategies for single-disruption scenarios often induce systemic conflicts in networked operations, amplifying delays and service degradation. These shortcomings highlight the necessity for a holistic framework that reconciles operational efficiency with passenger service quality. To bridge these gaps, this study proposes a passenger-centric integrated timetable rescheduling method under multiple correlated disruptions, offering the following contributions:
A passenger-centric MILP framework is formalized to quantify disruption impacts through dual objectives—minimizing total passenger delays and trip failures—thereby reconciling operational efficiency with service equity.
We introduce a comparative analysis of step-wise and integrated rescheduling strategies, demonstrating how global optimization mitigates cross-line conflicts inherent to localized decision-making.
A rolling horizon algorithm is devised to balance real-time computational tractability with solution quality, validated through empirical case studies on a major Chinese HSR subnetwork. This framework provides operators with a decision-support tool that harmonizes real-time responsiveness and service reliability.
3. Problem Statement
3.1. Train Rescheduling Strategies
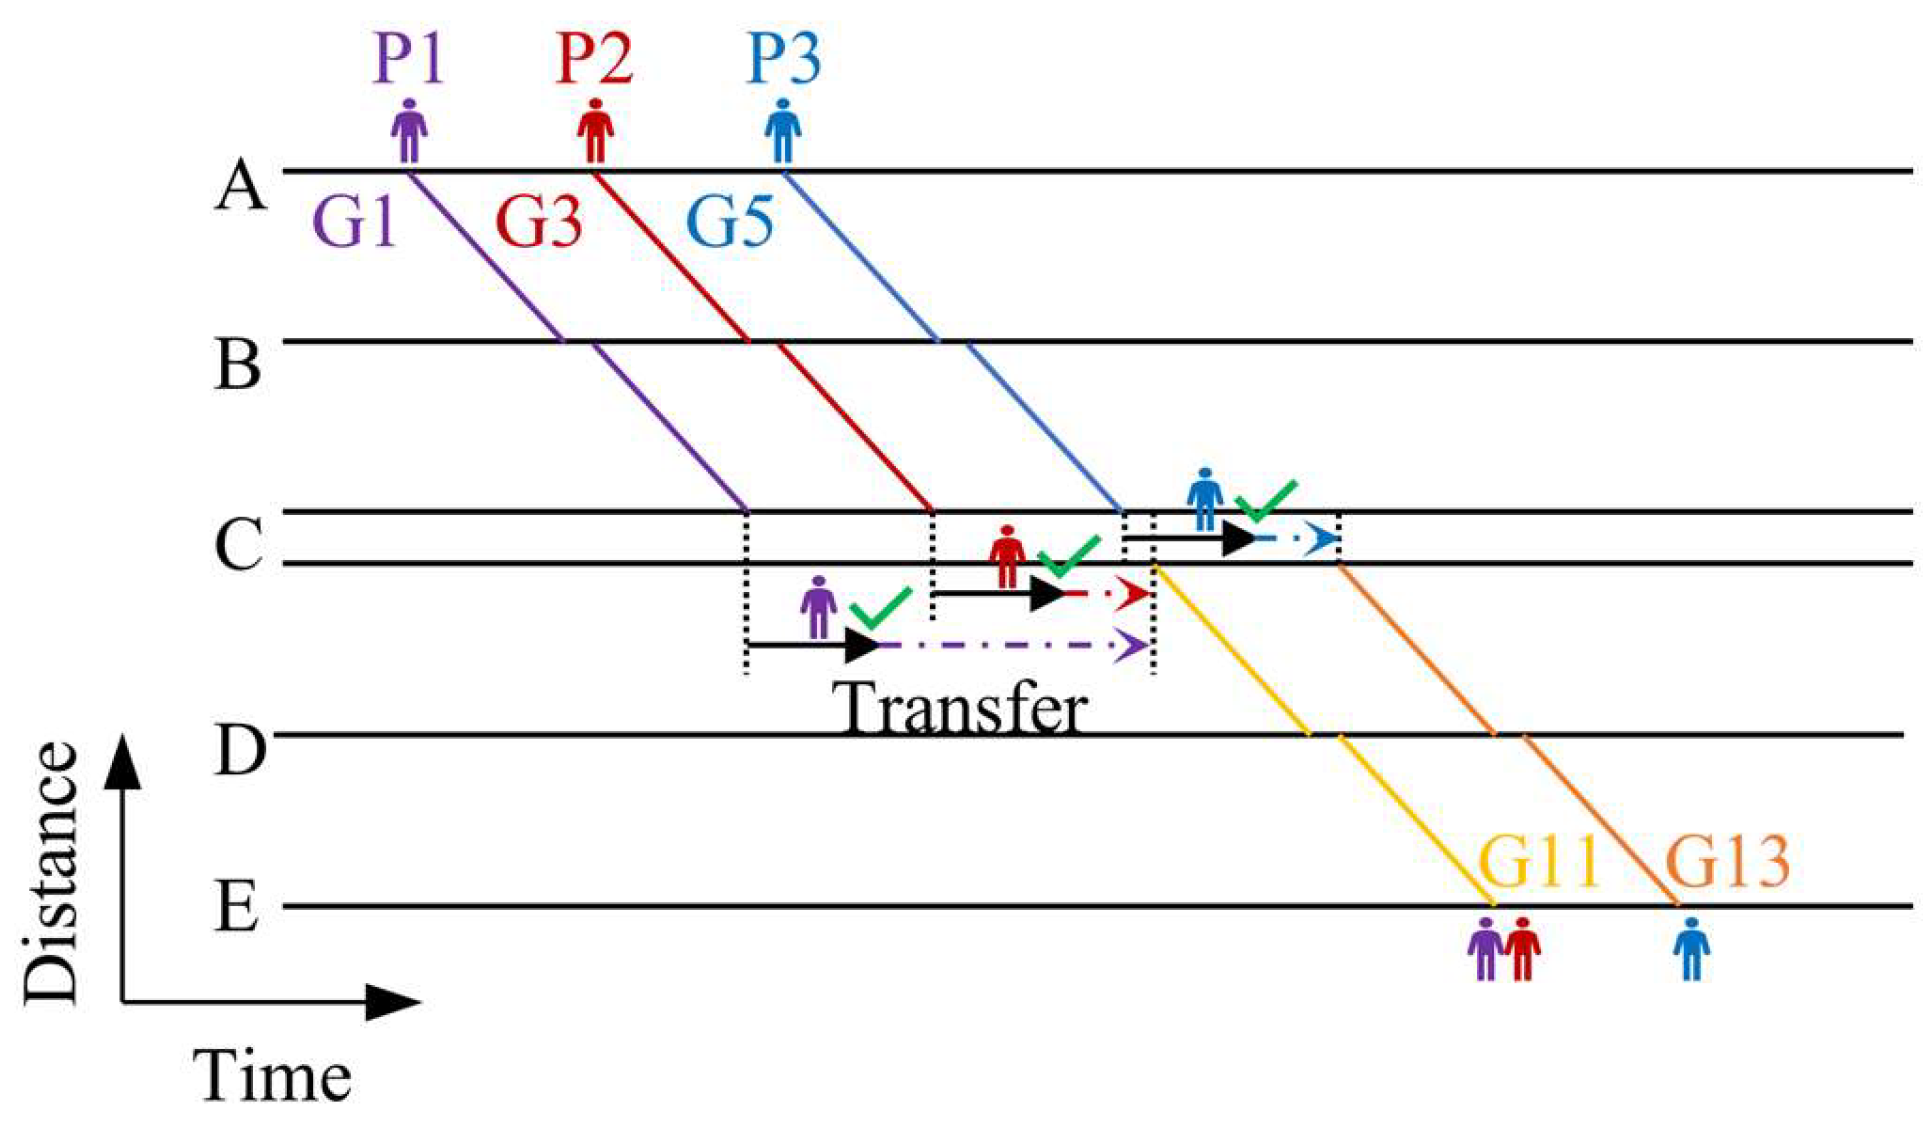
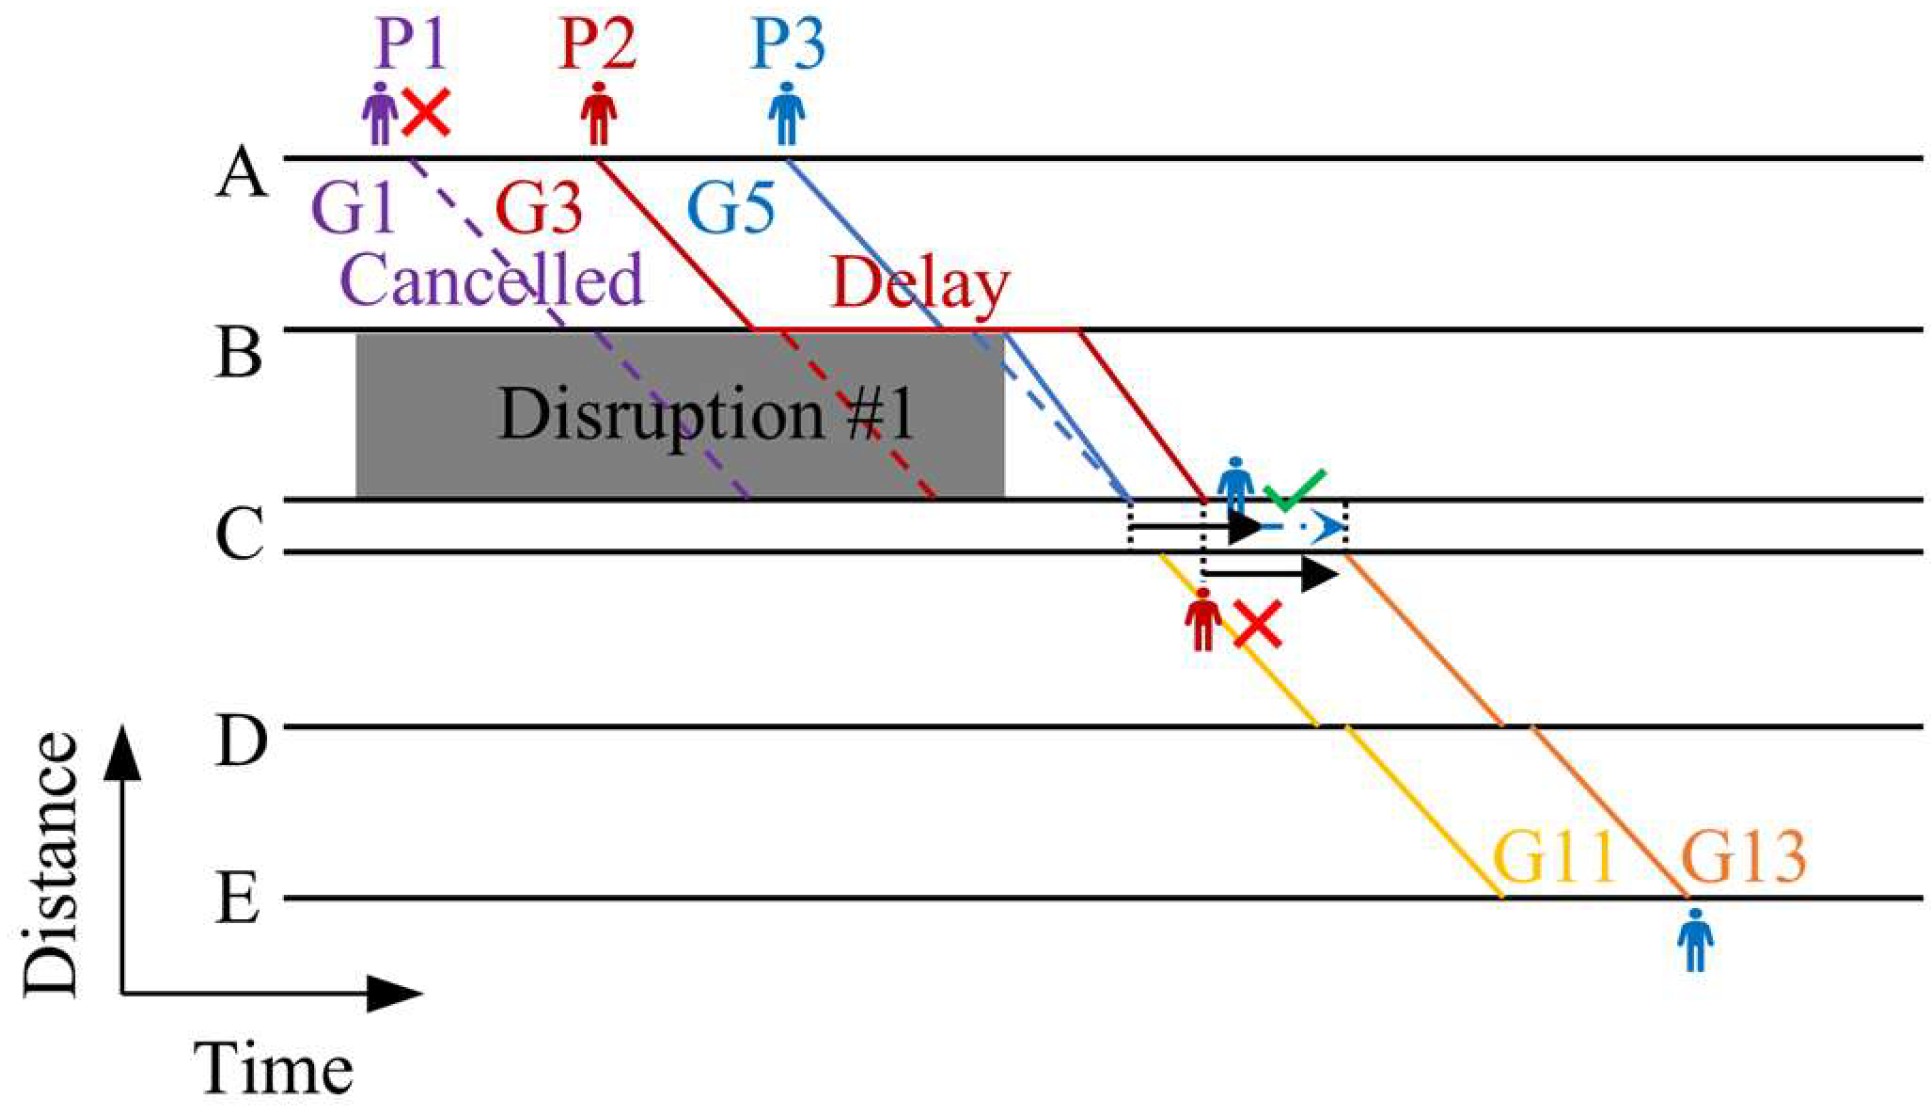
To address the integrated timetable rescheduling problem under multiple correlated disruptions in high-speed railways, this study adopts a passenger-centric approach, integrating dynamic rescheduling strategies, such as train speed adjustment, stop-schedule optimization (adjusting dwell times and skipped stations), train overtaking coordination, and selective train cancellations. Based on travel patterns, passengers are divided into two groups: through passengers (traveling directly from origin to destination), and transfer passengers (requiring connections between multiple trains). Transfer passengers typically travel on two interconnected lines: the preceding line (before transfer) and the connecting line (after transfer). The station where these lines intersect is termed the transfer station. Trains on the preceding line are referred to as preceding trains, while those on the connecting line are connecting trains. Passengers sharing the same origin–destination pairs and originally scheduled trains are combined into passenger groups.
To illustrate the practical implementation of these strategies,
Figure 1 presents the initial timetable and passenger travel plans for a small-scale network, while
Figure 2 demonstrates the effects of applying the strategies. In this network, Line 1 (preceding line) includes Stations A, B, and C, operating trains G1, G3, and G5. Line 2 (connecting line) comprises Stations C, D, and E, operating trains G11 and G13. Passengers traveling from Line 1 to Stations D or E must transfer at Station C. Specifically, passengers in group P1 take train G1 (preceding train) on Line 1 and transfer to train G11 (connecting train) on Line 2 from Station A to E, passengers in group P2 take train G3 (preceding train) on Line 1 and transfer to train G11 (connecting train) on Line 2 from Station A to E, passengers in group P3 take train G5 (preceding train) on Line 1 and transfer to train G13 (connecting train) on Line 2 from Station A to E. When a disruption (e.g., infrastructure failure or signal outage) occurs on Line 1, the following strategies are applied to optimize the timetable:
Train speed adjustment reduces delays by regulating the running time between stations. To enhance timetable flexibility and robustness against disruptions, scheduled timetables typically incorporate buffer times between sections. During operations, trains can adjust their running speeds within predefined limits. For example, as shown in
Figure 2, trains G3 and G5 reduce their total terminal delays by increasing speeds in section B-C to reduce running time.
Stop-schedule optimization dynamically adjusts station stops and dwell times to align with real-time passenger demand and operational priorities. Skipping scheduled stops is applied only when boarding demand is negligible (e.g., when passengers cannot feasibly complete their journeys), thereby accelerating delay recovery. Unscheduled stops are strategically introduced to enable overtaking or enhance transfer coordination, ensuring system-wide efficiency under disruptions.
Train overtaking optimizes resource allocation by reordering departure orders. As illustrated in
Figure 2, after the disruption ends, G5 departs ahead of G3 to prevent G5 passengers from missing connections due to delays, thereby reducing trip failures and enhancing overall service quality.
Selective train cancellation simplifies scheduling complexity during capacity shortages. Prolonged disruptions (e.g., 60–120 min) may result in line capacity insufficient to accommodate all trains, necessitating cancellations of severely delayed trains unable to maintain subsequent schedules (e.g., G1 in
Figure 2). While this affects some passengers, it frees track resources for other trains, mitigating inconveniences for a larger population.
Through coordinated application of these strategies, total passenger delays and trip failures are significantly reduced while ensuring operational safety.
3.2. Rescheduling Under Multiple Disruption Scenarios
This study defines multiple correlated disruptions as two or more disruption events that simultaneously satisfy the following conditions:
Temporal overlap: The disruptions occur during overlapping time periods. For instance, let and denote the start and end times of disruption , and and those of disruption . Temporal overlap exists if or .
Geographical correlation: The disruptions affect distinct railway lines or sections with operational interdependencies (e.g., shared tracks, transfer stations, or adjacent infrastructure).
Passenger flow coupling: At least one group of passengers is affected simultaneously by both disruptions.
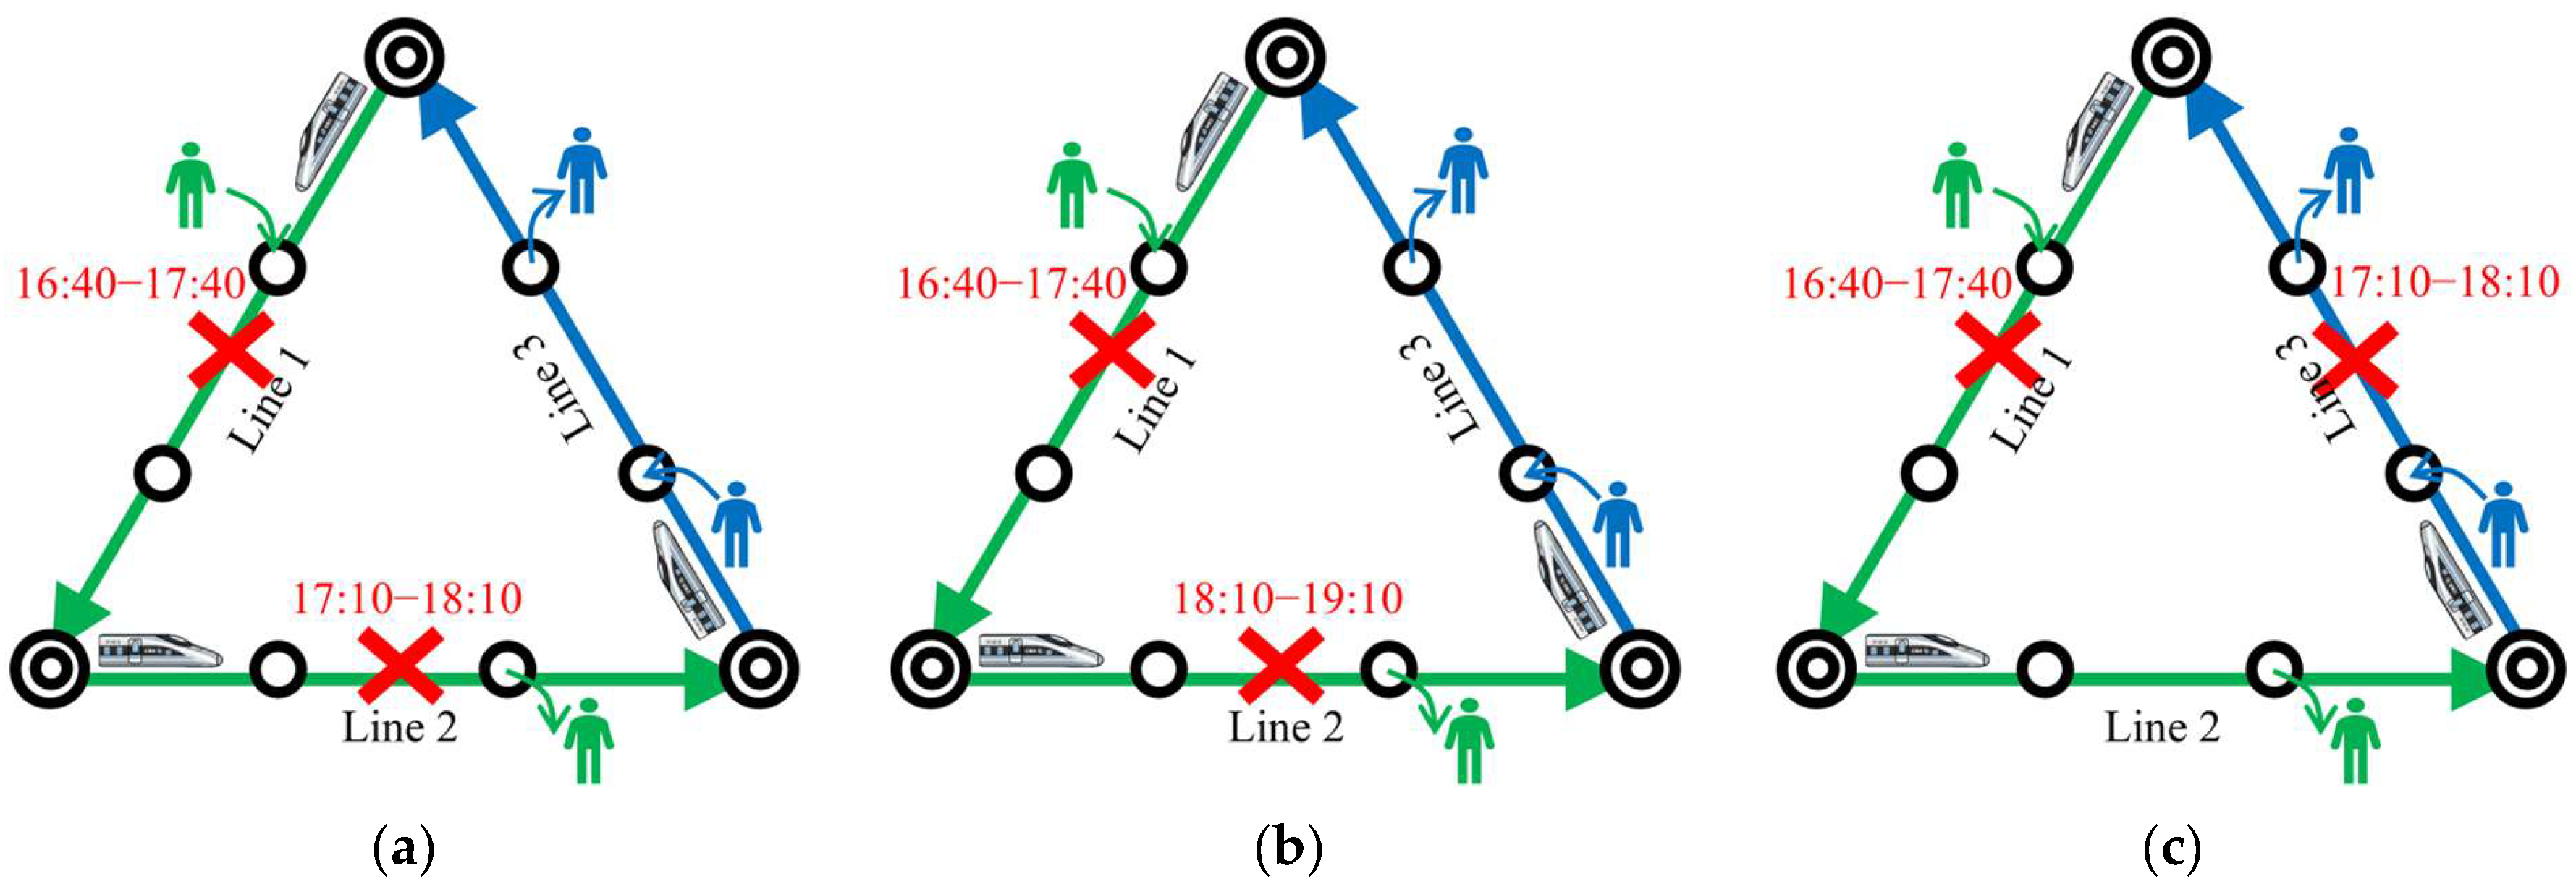
Figure 3 illustrates these scenarios using a small-scale railway network with three lines. Scenario (a) represents a typical multiple correlated disruption meeting all three conditions: temporal overlap (16:40–17:40 and 17:10–18:10), geographical correlation (affecting Lines 1 and 2 with transfer connections), and passenger flow coupling (Passenger Group 1 transfers between the lines). Scenario (b) features two disruptions with geographical correlation but no temporal overlap (Disruption 1: 16:40–17:40; Disruption 2: 18:10–19:10). Scenario (c) involves temporally overlapping disruptions (e.g., 16:40–17:40 and 17:10–18:10) but no geographical or passenger flow interdependencies. Scenarios (b) and (c) exhibit insufficient interdependency to qualify as correlated disruptions, enabling independent resolution via single-disruption models. This study focuses on resolving multiple correlated disruptions and proposes two decision-making approaches:
The step-wise method sequentially addresses each new disruption using a single-disruption rescheduling model. Subsequent disruptions are processed based on prior solutions, with irreversible historical decisions (e.g., cancellation of trains, delayed departures/arrivals). This method lacks flexibility to revise previous solutions.
Figure 4 outlines its workflow.
The integrated method dynamically coordinates all ongoing disruptions by constructing a global optimization framework that simultaneously accounts for the spatiotemporal interdependencies among multiple correlated disruptions. When new disruptions are detected, the method does not process them sequentially but instead re-optimizes the entire network by incorporating all spatiotemporally coupled disruptions into a unified decision model. This approach eliminates conflicts caused by localized optimizations, integrates impacts of all disruptions into a unified framework, and enables real-time resource allocation and transfer coordination. As illustrated in
Figure 5, rescheduling decisions are dynamically adjusted to synchronize all affected trains across the network whenever new disruptions occur, ensuring globally optimal solutions.
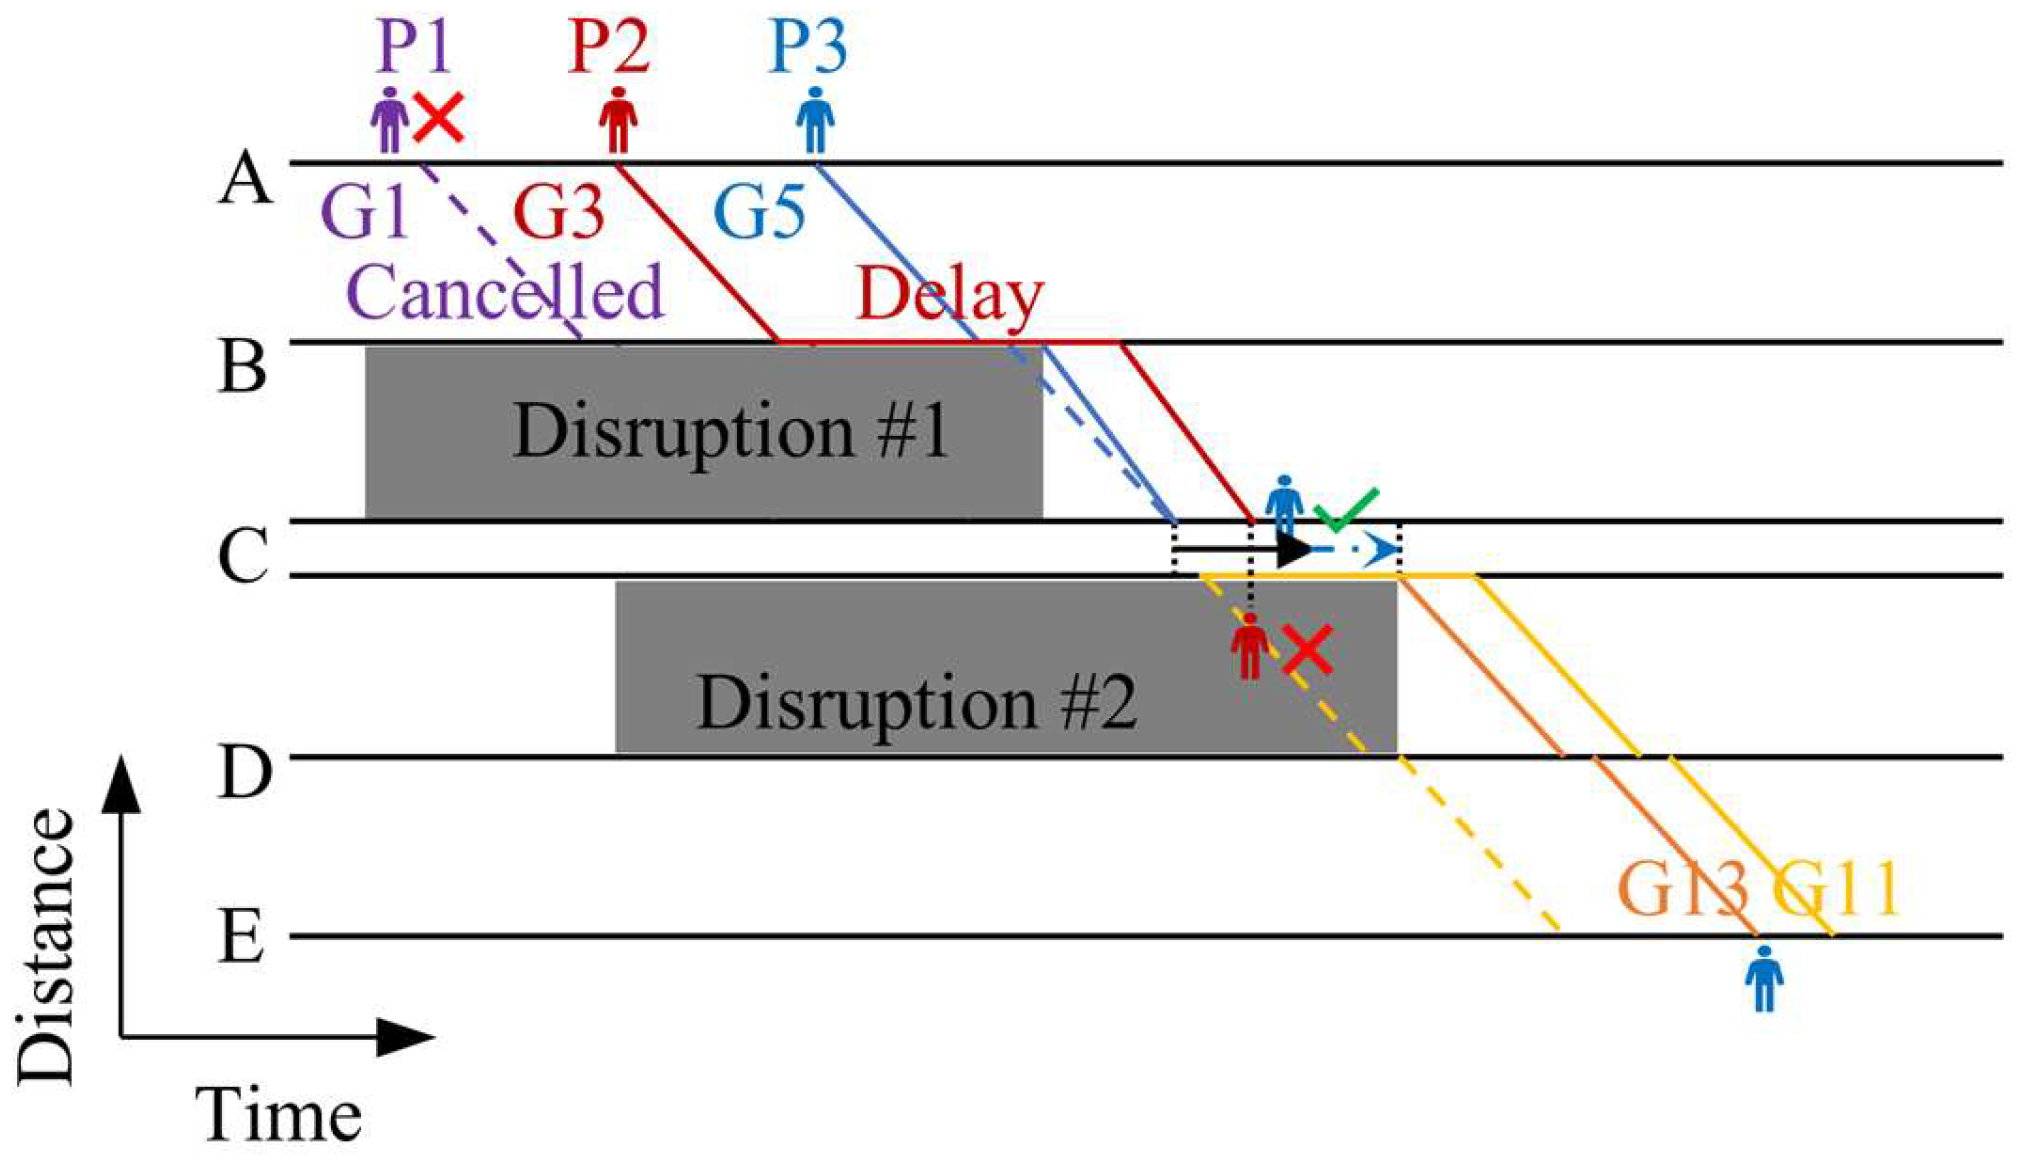
The key difference between the step-wise and integrated rescheduling methods lies in the interactivity of rescheduling decisions. Unlike single-disruption models that focus solely on local rescheduling, the integrated method must holistically address the spatiotemporal coupling effects among multiple disruptions. Taking the small-scale network illustrated in
Figure 1 and
Figure 2 (
Section 3.1) as an example, after a disruption occurs on Line 1, a second disruption subsequently affects the CD section of Line 2. When applying the step-wise method to handle multiple disruptions, the solution is shown in
Figure 6. Specifically, the step-wise method cancels Train G1 and adjusts the departure sequence of Trains G3 and G5 during the resolution of Line 1’s disruption. For Line 2’s disruption, it continues to use a single-disruption model, only optimizing the operational sequence of Line 2 trains (e.g., advancing the departure of G13 to mitigate local delays). However, the cancellation of G1 prevents its passengers from transferring to Line 2’s G11, while the delayed departure of G3 causes its passengers to miss their transfer connections, ultimately causing secondary delays and trip failures. In contrast, the integrated method synchronously rescheduled all affected trains across the network when the disruption occurred on Line 2 (
Figure 7). By rescheduling the departures of G11/G13 on Line 2 while retaining G1 and maintaining the original operational sequence on Line 1, this approach avoids cross-line resource conflicts and reserves sufficient transfer time for G1/G3 passengers. Consequently, all passengers successfully connect to subsequent journeys, and total delay times are minimized. These results demonstrate that the integrated method dynamically coordinates network-wide resources, eliminates dependency on historical decisions inherent to the step-wise approach, and prevents strategy conflicts and service quality degradation caused by localized optimizations.
4. Model Formulation and Solution Algorithm
4.1. Model Assumptions
This study develops an integrated rescheduling model for multiple correlated disruptions based on the following assumptions:
4.2. Notations
The symbols and descriptions of sets, parameters, and variables in the model are listed in
Table 1 and
Table 2, respectively.
4.3. Model Formulation
4.3.1. Objectives
Objective
focuses on reducing passenger delay time caused by train delays, which depends on both the duration of delays and the scale of affected passengers. This ensures a balanced optimization of service quality and operational efficiency, where passenger-centric adjustments are systematically coordinated with train operations to mitigate systemic delays and resource conflicts.
Objective
addresses trip failures induced by disruptions, including transfer failures and cancellations, aiming to minimize the total number of passengers experiencing interrupted journeys.
These two objectives are integrated through a linear weighting approach, offering operators diversified solutions that balance efficiency and service. The weighting coefficients
and
(representing the penalty coefficients for passenger delay time and trip failures, respectively) can be dynamically adjusted based on practical requirements.
4.3.2. Constraints
Passengers plan their travel based on scheduled departure and arrival times; thus, actual departure times must not precede scheduled times. Trains must retain planned stops but may add unscheduled stops to enhance adjustment flexibility. Dwell times must satisfy minimum operational requirements, including time allocations for passenger boarding/alighting, crew operations, and mandatory safety inspections.
Train running times between sections must fall within predefined minimum and maximum thresholds to ensure timetable feasibility.
Safety headways—the minimum time intervals between consecutive trains arriving at or departing from the same station—must be maintained to prevent collisions and ensure adherence to signaling protocols. Overtaking is permitted only at stations, with running orders preserved within sections.
During disruptions, affected sections are blocked, and trains may only resume operations after infrastructure recovery.
Station track occupancy must adhere to capacity limits and minimum arrival–departure headways. Trains passing through or stopping at a station must ensure at least one available track.
Cancelled trains are rescheduled after all active trains to avoid conflicts. Delays for passengers on cancelled trains are excluded from total delay calculations (
) but contribute to trip failures (
), ensuring their impact is minimized within the multi-objective framework.
For successful transfers, the departure time of connecting trains must allow a predefined minimum transfer time
after the arrival of preceding trains. This time is assumed uniform across stations for computational tractability, though station-specific values may be applied in practice. Transfers are deemed successful only if both connecting trains remain uncancelled.
These constraints systematically coordinate spatiotemporal dependencies among disruptions, ensuring operational safety (e.g., adherence to headway rules, track capacity limits, and infrastructure recovery protocols) while minimizing passenger inconvenience quantified by total delay time () and trip failures ().
4.4. Solution Algorithm
To meet the requirements of timeliness and global optimality for rescheduling decisions under multiple disruption scenarios, this study proposes an integrated optimization framework based on a rolling horizon algorithm (RHA). This framework addresses the computational challenges associated with the large-scale variables and real-time solving difficulties in the model. The core concept of this algorithm, validated in the railway rescheduling literature [
28,
33,
35,
36], significantly reduces computational complexity through dynamic problem decomposition and phased progressive solving.
The algorithm divides the global time horizon into consecutive time intervals (stages), each focusing on train rescheduling and passenger service optimization within a specific time window. Let denote the time duration of each stage and the backtracking time, where . Here, controls the coverage of single-stage optimization, while connects the decision boundaries between adjacent stages to prevent local optima. Upon detecting new disruptions, the algorithm dynamically restructures the model to incorporate multiple correlated disruptions into the integrated optimization process. Within each stage, the algorithm first fixes partial decisions from the previous stage (e.g., train cancellations, departure/arrival time offsets) as boundary constraints for the current stage, thereby reducing variable scale and maintaining timetable continuity. Based on real-time disruption information, train status, and passenger transfer demands, an MILP model is constructed to minimize total passenger delay time and trip failures—key proxies for passenger dissatisfaction—within the current window, aligning with passenger-centric rescheduling principles. The model inherits global constraints, including basic train operation rules, section running time constraints, safety headway and overtaking rules, disruption-related constraints, station capacity and arrival/departure headway constraints, train cancellation constraints, and passenger transfer constraints. The Gurobi solver is employed to generate solutions. A feasible solution is output if obtained within a preset time threshold (e.g., 300 s), otherwise, the current best solution and the optimality gap are recorded. Information transfer between stages is achieved through a backtracking mechanism; solutions within the time window of the current stage are retained as fixed inputs for the next stage, balancing computational efficiency and solution quality.
The algorithm incorporates two distinct strategies. The step-wise rescheduling method addresses disruptions in a sequential manner, optimizing only the currently affected sections while inheriting historical rescheduling as rigid constraints. While this approach is computationally efficient, it may result in deviations from the global objective. In contrast, the integrated rescheduling method re-optimizes the impacts of all ongoing disruptions whenever new disruptions occur. This dynamic adjustment of network-wide resource allocation enhances solution quality but increases computational complexity in both time and space. Temporally, the integrated model’s combinatorial nature scales with disruptions, trains, and stations. Spatially, it requires storing network-wide train trajectories and passenger flows. The rolling horizon algorithm alleviates this by decomposing the problem into stages. Algorithm 1 presents the pseudocode workflow of the rolling horizon algorithm for the integrated rescheduling method.
| Algorithm 1: Rolling Horizon Algorithm for Integrated Rescheduling of Multiple Disruptions |
Input:
1: High-speed railway network and parameters.
2: Original timetable and passenger demands.
3: Disruption information. |
| Output: Rescheduled timetable |
1 Initialization
2 Calculate iteration count: ; (where and denote the start/end times of the current rescheduling horizon)
3 ;
4 Define initial scheduling horizon: ;
5 Initialize rescheduled timetable: ;
6 While |
| 7 | Solve the multi-disruption integrated rescheduling model within time window using commercial solver |
| 8 | Retain solutions in ; discard solutions in ; |
| 9 | Update: ; (where denote partial rescheduled timetable obtained in the th stage within the time window ) |
| 10 | Backtracking: |
| 11 | ; |
12 end while
13 Solve the multi-disruption integrated rescheduling model within time window using commercial solver of the th stage;
14 Retain the solution within the time window of the th stage;
15 ;
16 Return the rescheduled timetable |
5. Case Study
5.1. Case Description
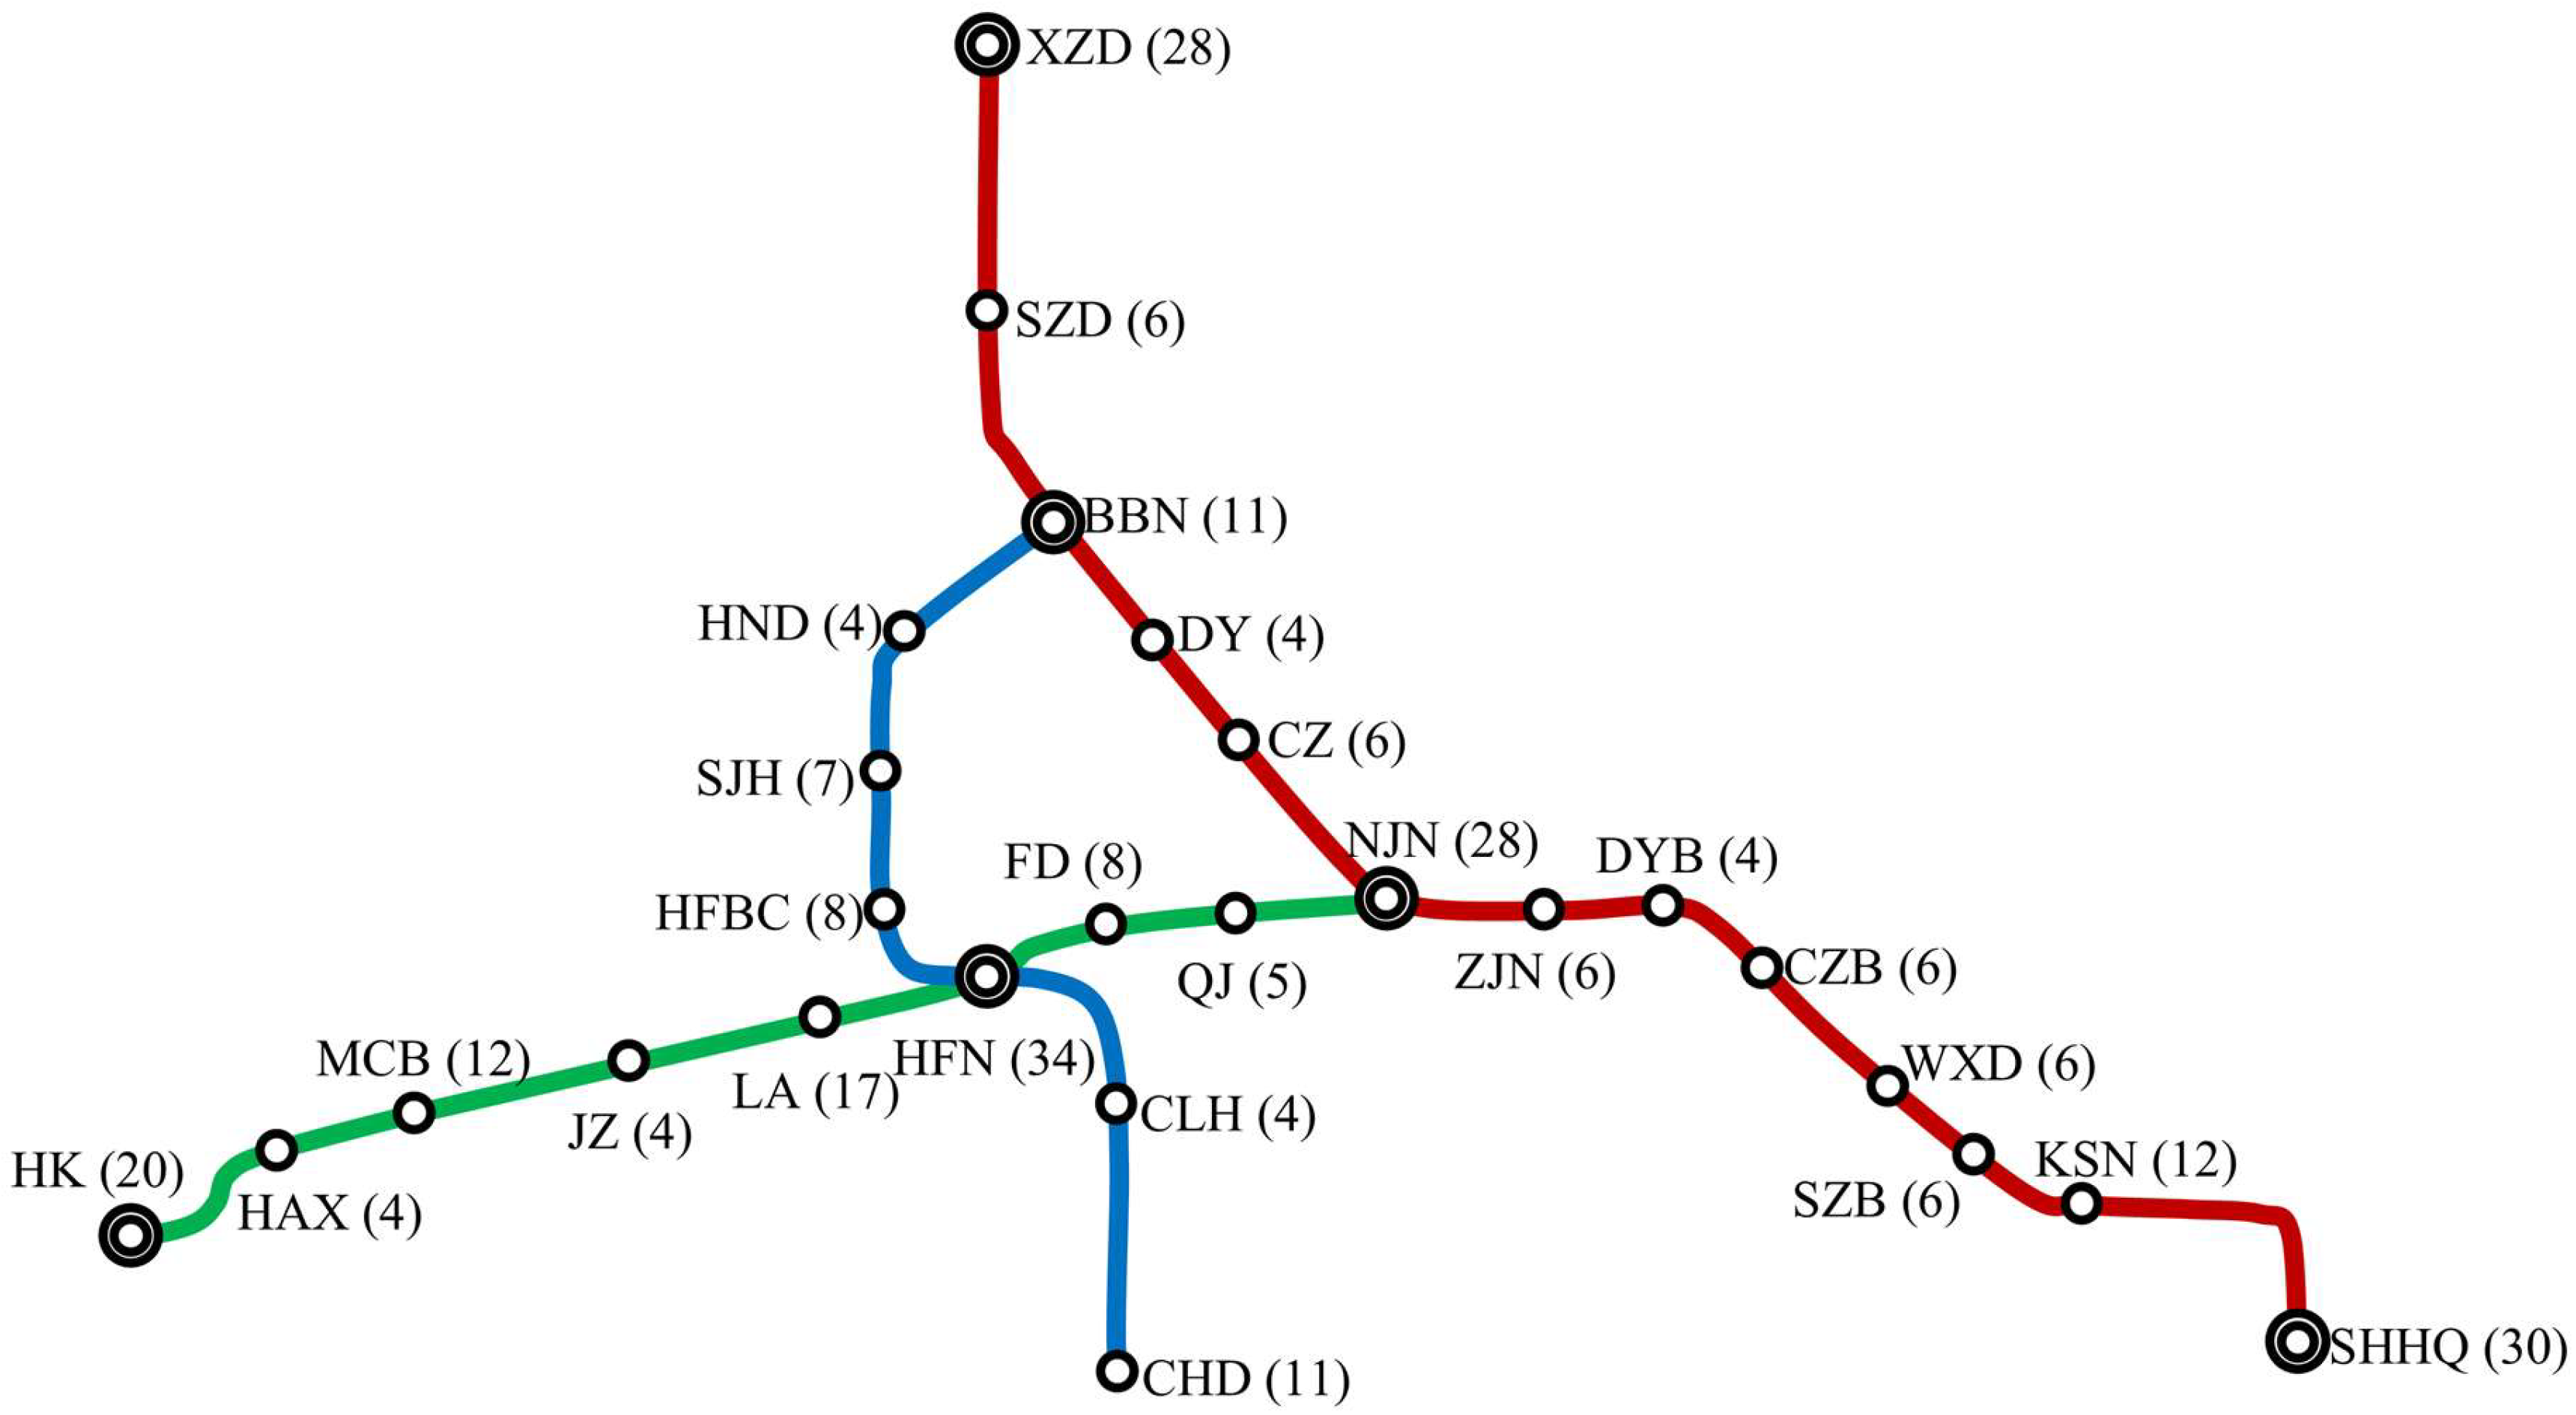
This study selects a real-world HSR network composed of the Beijing-Shanghai, Shanghai-Chengdu, and Hefei-Bengbu lines in China as the test scenario to validate the proposed integrated rescheduling method. As shown in
Figure 8, the network comprises 29 stations, including 7 stations on the Hefei-Bengbu line, 9 stations on the Shanghai-Chengdu line, and 13 stations on the Beijing-Shanghai line. Based on actual operational data, a base timetable was constructed for 42 running trains, with key parameters set according to HSR operational standards: additional acceleration and deceleration times at stations are 2 min and 3 min, respectively; minimum arrival/departure headways and departure–arrival headways are both 3 min; minimum dwell time is 2 min; maximum train capacity is 1000 passengers; minimum transfer connection time is 10 min; and parameter
is set to 1440 min (24 h), a value sufficiently large to encompass all operational scenarios defined in this study. Section running times and station track capacities were configured based on actual network topology and operational specifications.
Due to confidentiality restrictions, real passenger datasets from China’s HSR network cannot be publicly disclosed. Instead, a simulated dataset was generated using real passenger flow characteristics (e.g., spatiotemporal distributions, transfer ratios, and train-loading profiles) from a typical operational day in 2022, encompassing 36,193 passenger trips. The Hefei-Bengbu line includes 79 through passenger groups (6195 passengers) and 112 transfer groups (1978 passengers); the Shanghai-Chengdu line contains 200 through groups (10,598 passengers) and 608 transfer groups (2179 passengers); and the Beijing-Shanghai line comprises 489 through groups (13,700 passengers) and 527 transfer groups (1543 passengers). Passenger travel paths and train selections were simulated using a randomized algorithm to align with real-world passenger distribution patterns.
All experiments were conducted on a computer equipped with an AMD Ryzen 7 4800H processor (AMD; Santa Clara, CA, USA) (2.90 GHz base clock, 16.0 GB RAM) using the Gurobi 9.5.0 commercial solver. A 300 s time limit per optimization iteration was imposed to balance solution quality and real-time requirements. This setup effectively simulates dynamic adjustments in the HSR network under multiple correlated disruptions, providing a robust foundation for method validation.
5.2. Analysis of Multiple Disruptions at Different Sections
This study constructs 10 disruption scenarios at various sections to systematically evaluate the adaptability of the integrated rescheduling method to spatially distributed multiple disruptions (
Table 3). Each scenario involves two spatiotemporally correlated disruptions: the first occurs from 16:40 to 17:40, and the second from 17:10 to 18:10, with a 30 min overlap and at least one transfer passenger group.
Table 4 compares the performance metrics of the step-wise and integrated rescheduling methods across the 10 scenarios, including the total objective value, through passenger delay times, number of trip failures, and calculation time.
Table 4 demonstrates that the integrated rescheduling method consistently optimizes the total objective value across all scenarios, with an average reduction of 13% (calculated as the arithmetic mean of percentage improvements in all 10 scenarios). This is due to the improvement in network accessibility through global resource coordination. For example, in Scenario 1, the integrated method dynamically adjusts the stop plans and reorders trains on the Hefei-Bengbu line (indicated by the red lines in
Figure 9), prioritizing connections for trains with high transfer demands. Simultaneously, it reconstructs the stop plans for trains on the Shanghai-Chengdu line, implementing preventive stopping strategies for connecting trains at the HFN transfer station. This approach not only avoids operational risks in disrupted sections but also reserves sufficient transfer time for transfer passengers. Notably, although the Beijing-Shanghai line is not directly affected by disruptions, connecting trains proactively dwell at the NJN transfer station (indicated by the red lines in
Figure 9), creating time windows for cross-line transfers. This alleviates transfer passenger congestion and highlights the spatiotemporal interdependencies among lines in network-wide collaborative rescheduling.
Through these coordinated measures, the integrated method achieves a significant 86% reduction in trip failures (from 689 to 96) and decreases the total objective value by 19%. This improvement comes at the cost of an increase in through passenger delays (from 221,409 to 273,582 min) in this specific scenario. This outcome reflects a deliberate trade-off inherent in the model’s passenger-centric design: prioritizing the minimization of trip failures and overall system-wide impact (captured by the total objective value) sometimes necessitates accepting increased delays for some through passengers to preserve transfer connections and network-wide service accessibility. Crucially, the substantial reduction in trip failures and the overall improvement in the total objective value validate the effectiveness of this integrated approach in managing correlated disruptions. Subsequent sensitivity analyses further indicate that operators can adjust this balance by modifying the penalty coefficient for trip failures () in the objective function.
In terms of computational efficiency, under a 300 s time limit, the integrated method achieves optimal solutions (Gap = 0%) in eight scenarios, with optimality gaps below 7.8% in the remaining cases. Scenarios 9 and 10 incur longer solving times because disruptions affect high-occupancy transfer stations (Nanjing South and Bengbu South), where concentrated passenger flows and overlapping train schedules amplify combinatorial complexity. This expands the solution search space but does not compromise algorithmic stability. While the step-wise method occasionally solves faster in weakly coupled disruptions (e.g., Scenario 4), its localized optimization often prolongs computation in complex scenarios due to inherited decision conflicts (e.g., Scenarios 1–3), alongside inferior solution quality. The integrated method overcomes historical decision dependencies to systematically explore a broader solution space, effectively resolving resource conflicts in high-speed railway networks despite increased computational demands under complex disruption scenarios.
The integrated rescheduling method exhibits superior performance in multiple disruption scenarios. Through real-time timetable rescheduling, it minimizes passenger inconveniences while delivering near-optimal solutions within 300 s, demonstrating strong computational responsiveness. Evaluation across 10 geographically varied disruption cases confirms its practical applicability and operational versatility in real-world high-speed railway networks under multiple correlated disruptions.
5.3. Analysis of Multiple Disruptions with Different Temporal Overlaps
This section evaluates the impact of disruption overlap duration on the performance of the integrated rescheduling method by constructing scenarios with varying temporal overlaps. As shown in
Table 4, the integrated method significantly outperforms the step-wise approach in Scenario 2, performs comparably in Scenario 4, and shows moderate improvements in Scenario 6. To further investigate the influence of overlap duration, four time combinations were tested for Scenarios 2, 4, and 6: The first disruption was fixed at 16:40–17:40, while the second disruption was adjusted to 16:50–17:50 (50 min overlap), 17:10–18:10 (30 min overlap), 17:30–18:30 (10 min overlap), and 18:00–19:00 (no overlap). The results are summarized in
Table 5.
As shown in
Table 5, the performance of the integrated rescheduling method exhibits significant scenario dependency. In scenarios 2 and 6, the method achieves the largest reductions in the total objective value (26% and 13%, respectively) under 30 min disruption overlaps, rather than the 50 min case with the longest overlap. This discrepancy is due to the spatial distribution of disruption locations and the transfer station. In Scenarios 2 and 6, the disrupted sections are located in the middle of the lines and are spatially distant from the transfer stations, resulting in a time lag effect for the initial disruption impacts. For example, in Scenario 2, the first disruption (BBN-HND section) causes delays to preceding trains. When these delays propagate to the transfer station HFN, the 30 min overlap window exactly covers the critical transfer connection period between preceding and connecting trains. This allows the integrated method to effectively balance cross-line resource conflicts through global coordination. In contrast, when the overlap duration extends to 50 min, the ripple effects of the initial disruption have not yet fully propagated to the connecting lines, leaving the optimization potential of the integrated method not fully exploited.
Scenario 4 exhibits distinct patterns. Since the disrupted sections (HFBC-HFN and HFN-FD) are adjacent to transfer stations, the first disruption directly affects the arrival and departure times of connecting trains. When the overlap duration extends to 50 min, the integrated rescheduling method significantly reduces the number of trip failures (from 615 to 49) by synchronizing stop-schedule adjustments at adjacent stations, achieving a 17% reduction in the total objective value. This indicates that in transfer station-intensive areas, increased temporal overlap strengthens the interdependencies among multiple disruptions, thereby amplifying the necessity for global optimization.
5.4. Sensitivity Analysis of the Penalty for Passenger Trip Failures
This section investigates the impact of penalty coefficients for passenger trip failures on rescheduling decisions under Scenarios 2, 4, and 6. For the comparative experiments, the penalty coefficient for passenger delay time (
) was fixed at 1, while the penalty coefficient for trip failures (
) was systematically adjusted to 100, 300, and 500, with all other parameters remaining unchanged.
Table 6 presents the optimization results of the step-wise and integrated rescheduling methods under different penalty coefficients.
As shown in
Table 6, increasing the penalty coefficient
significantly reduces the number of passengers experiencing trip failures. For instance, in Scenario 2, the integrated rescheduling method reduces failed trips from 863 to 150 passengers (an 82% decrease) when the penalty coefficient
increases to 500. This improvement stems from prioritizing trip failure reduction in the objective function. To ensure successful transfers for more passengers, connecting trains must extend the dwell times at transfer stations to accommodate delays of preceding trains. However, this adjustment directly increases total delay times for through passengers on connecting lines. For example, in Scenario 2, the delay time for through passengers under the integrated method rises from 204,917 min (penalty coefficient
= 300) to 260,920 min (penalty coefficient
= 500). These results demonstrate that penalty coefficients influence the model’s trade-off strategy by adjusting the weighting between delay minimization and trip failure reduction in the objective function. Additionally, higher penalty coefficients amplify decision complexity to satisfy transfer requirements, leading to increased calculation times.
The penalty coefficient should be dynamically adjusted according to real-world operational scenarios. When the penalty coefficient is set too low, the model prioritizes minimizing through passenger delays but inadequately safeguards transfer connections, thereby limiting the optimization potential of the integrated rescheduling method. For instance, in Scenario 2 with a penalty coefficient of 100, the number of trip failures decreased from 1285 to 884 passengers. Conversely, an excessively high penalty coefficient significantly reduces trip failures but disproportionately increases through passenger delays, potentially even worsening the overall objective value. For example, in Scenario 4 with a penalty coefficient of 500, trip failures dropped sharply from 306 to 33 passengers, but the integrated method’s objective value increased by 1%. Therefore, the penalty coefficient must strike a balance between “trip success rate” and “passenger delays”. This trade-off mechanism reflects the inherent conflict between minimizing immediate delays () and ensuring journey completion (). Excessively high β values may over-prioritize trip completion, inadvertently increasing systemic delays and degrading the overall objective . In practical rescheduling, higher penalty coefficients should be adopted for transfer stations with dense passenger flows to prioritize transfer passenger rights, while lower coefficients are recommended for lines dominated by through passengers to control delay propagation.
In summary, as a core parameter of the model, the rational configuration of the penalty coefficient plays a decisive role in ensuring both fairness and efficiency in rescheduling solutions. Railway operators should dynamically adjust the penalty coefficient based on real-time passenger flow characteristics and physical network configuration to achieve optimal global resource allocation.
5.5. Performance of the Rolling Horizon Algorithm
The performance of the RHA is directly influenced by its core temporal parameters: the stage time length
and backtracking time
. Here,
defines the rolling update window length, which affects the iteration frequency and subproblem-solving time. Theoretically, increasing
expands the optimization horizon and reduces the risk of converging to local optima, but excessively large values significantly escalate computational complexity. Furthermore, as a heuristic algorithm, the solution quality of RHA does not strictly monotonically correlate with parameter selection. Experimental validation is thus required to assess the trade-offs among different parameter combinations. Scenarios 2 and 6 were selected for parameter sensitivity analysis due to their higher responsiveness to parameter variations (
Section 5.3 and
Section 5.4), whereas Scenario 4 exhibited minimal sensitivity across tested parameters. This allows focused insights into the RHA’s performance trade-offs. The stage length
is set to 60, 90, and 120 min, while the backtracking time
is configured as 10, 20, 30, and 40 min. All other parameters remain consistent with prior experiments.
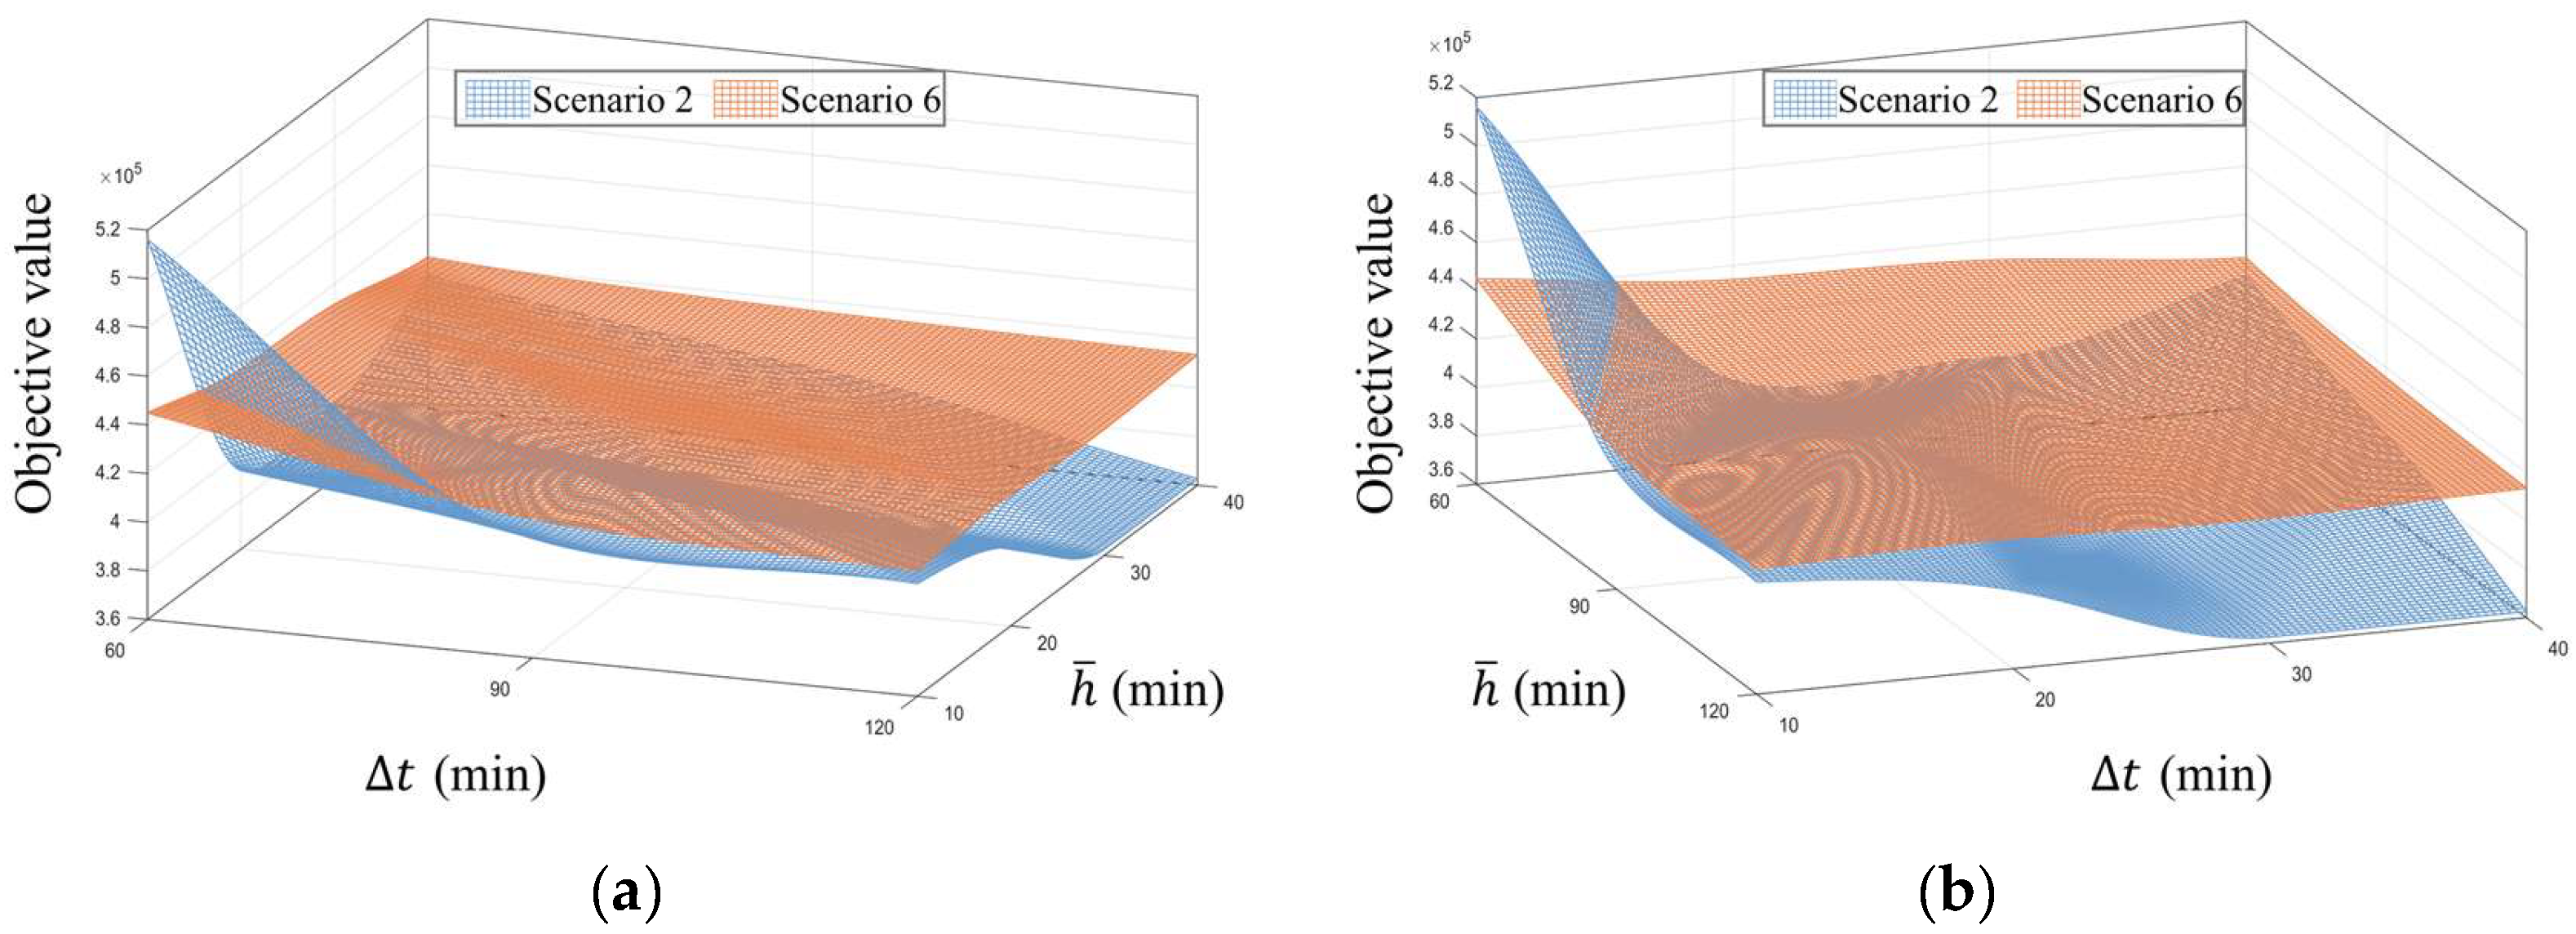
Figure 10 and
Figure 11 illustrate the calculation time and total objective value trends under different parameter combinations. It can be observed that increasing the stage length
and backtracking time
generally leads to a significant rise in calculation time, while the total objective value exhibits a downward trend, aligning with theoretical expectations. However, overlapping and intersecting regions in the figures indicate that the calculation time and solution quality under different parameter combinations do not strictly follow monotonic patterns due to the heuristic nature of RHA. Based on comprehensive experimental results, when the stage length
exceeds 90 min and the backtracking time
exceeds 30 min, the calculation time for both scenarios increases markedly. Conversely, when the stage length
is set to 120 or 90 min and the backtracking time
to 30 or 40 min, the corresponding solution quality improves significantly. Therefore, balancing calculating efficiency and solution quality, the optimal parameters are selected as
min and
min. This configuration provides critical guidance for practical parameter settings of the rolling horizon algorithm in real-time rescheduling.
6. Conclusions
This study compares two rescheduling approaches, step-wise and integrated methods, for addressing multiple correlated disruptions in HSR networks. Case studies on a real-world China’s HSR network (comprising the Beijing-Shanghai, Shanghai-Chengdu, and Hefei-Bengbu lines) demonstrate that the integrated method outperforms the step-wise approach by globally coordinating resources. Specifically, within a 300 s computational threshold, the integrated method reduces total passenger delay time by 13% and trip failures by 67% on average. By dynamically balancing cross-line train rescheduling strategies, this approach effectively mitigates secondary delays and transfer conflicts caused by localized optimizations, thereby validating the necessity of collaborative optimization for spatiotemporally correlated disruptions.
Parameter sensitivity analyses reveal scenario-dependent model performance. Disruptions with high spatiotemporal overlap and proximity to transfer stations should prioritize the integrated method. Dynamic adjustments of penalty coefficients enable flexible trade-offs between minimizing passenger delays and trip failures. And the optimal configuration of stage length and backtracking time in the rolling horizon algorithm balances efficiency and solution quality for real-time rescheduling. These findings provide economically viable and passenger-centric solutions for complex disruption scenarios under networked HSR operations, enriching existing train rescheduling theories and advancing intelligent railway rescheduling frameworks.
Future research will integrate deep reinforcement learning to enhance computational efficiency for large-scale networks, introduce stochastic programming to address uncertainty in disruption durations, incorporate dynamic passenger rerouting behaviors with rolling stock circulation planning, and explicitly consider train capacity constraints coupled with seat allocation strategies to further improve the robustness of passenger service quality under large-scale disruptions. These extensions aim to further improve the model’s practical applicability in real-world operations.
Author Contributions
Conceptualization, L.F. and P.W.; data curation, L.F. and P.W.; formal analysis, K.Q.; funding acquisition, L.F. and K.Q.; investigation, Y.C. and M.H.; methodology, L.F. and P.W.; project administration, M.H. and T.S.; resources, L.F. and K.Q.; software, L.F. and P.W.; supervision, K.Q.; validation, Y.C. and T.S.; visualization, P.W.; writing—original draft, L.F.; writing—review and editing, K.Q. and P.W. All authors have read and agreed to the published version of the manuscript.
Funding
This research was funded by the National Natural Science Foundation of China, grant number 52202379 and the National Natural Science Foundation of China, grant number U2268207.
Institutional Review Board Statement
Not applicable.
Informed Consent Statement
Not applicable.
Data Availability Statement
The data presented in this study are available on request from the corresponding author.
Conflicts of Interest
Authors Letian Fan, Yongsheng Chen, Meiling Hui and Tiqiang Shen are employed by CRRC Tangshan Co., Ltd. The remaining authors declare that the research was conducted in the absence of any commercial or financial relationships that could be construed as a potential conflict of interest.
Abbreviations
The following abbreviations are used in this manuscript:
| MILP | Mixed-integer linear programming |
| HSR | High-speed railway |
| RHA | Rolling horizon algorithm |
References
- Han, C.; Zhou, L.; Guo, B.; Yue, Y.; Zhao, W.; Wang, Z.; Zhou, H. An Integrated Strategy for Rescheduling High-Speed Train Operation Under Single-Direction Disruption. Sustainability 2023, 15, 13040. [Google Scholar] [CrossRef]
- Zhao, W.; Zhou, L.; Han, C. A Hybrid Optimization Approach Combining Rolling Horizon with Deep-Learning-Embedded NSGA-II Algorithm for High-Speed Railway Train Rescheduling Under Interruption Conditions. Sustainability 2025, 17, 2375. [Google Scholar] [CrossRef]
- Lamorgese, L.; Mannino, C. An Exact Decomposition Approach for the Real-Time Train Dispatching Problem. Oper. Res. 2015, 63, 48–64. [Google Scholar] [CrossRef]
- Aydın, G.; Şahin, İ. A Mixed Integer Linear Programming Model with Heuristic Improvements for Single-Track Railway Rescheduling Problem. Appl. Sci. 2023, 13, 696. [Google Scholar] [CrossRef]
- Bettinelli, A.; Santini, A.; Vigo, D. A Real-Time Conflict Solution Algorithm for the Train Rescheduling Problem. Transp. Res. Part B Methodol. 2017, 106, 237–265. [Google Scholar] [CrossRef]
- Liu, X.; Zhou, M.; Dong, H.; Wu, X.; Li, Y.; Wang, F.-Y. ADMM-Based Joint Rescheduling Method for High-Speed Railway Timetabling and Platforming in Case of Uncertain Perturbation. Transp. Res. Part C Emerg. Technol. 2023, 152, 104150. [Google Scholar] [CrossRef]
- Šemrov, D.; Marsetič, R.; Žura, M.; Todorovski, L.; Srdic, A. Reinforcement Learning Approach for Train Rescheduling on a Single-Track Railway. Transp. Res. Part B Methodol. 2016, 86, 250–267. [Google Scholar] [CrossRef]
- Peng, S.; Yang, X.; Wang, H.; Dong, H.; Ning, B.; Tang, H.; Ying, Z.; Tang, R. Dispatching High-Speed Rail Trains via Utilizing the Reverse Direction Track: Adaptive Rescheduling Strategies and Application. Sustainability 2019, 11, 2351. [Google Scholar] [CrossRef]
- Kim, K.-M.; Rho, H.-L.; Park, B.-H.; Min, Y.-H. Deep Q-Network Approach for Train Timetable Rescheduling Based on Alternative Graph. Appl. Sci. 2023, 13, 9547. [Google Scholar] [CrossRef]
- Tang, T.; Chai, S.; Wu, W.; Yin, J.; D’Ariano, A. A Multi-Task Deep Reinforcement Learning Approach to Real-Time Railway Train Rescheduling. Transp. Res. Part E Logist. Transp. Rev. 2025, 194, 103900. [Google Scholar] [CrossRef]
- D’Ariano, A.; Pranzo, M.; Hansen, I.A. Conflict Resolution and Train Speed Coordination for Solving Real-Time Timetable Perturbations. IEEE Trans. Intell. Transp. Syst. 2007, 8, 208–222. [Google Scholar] [CrossRef]
- Fischetti, M.; Monaci, M. Using a General-Purpose Mixed-Integer Linear Programming Solver for the Practical Solution of Real-Time Train Rescheduling. Eur. J. Oper. Res. 2017, 263, 258–264. [Google Scholar] [CrossRef]
- Zhan, S.; Kroon, L.G.; Veelenturf, L.P.; Wagenaar, J.C. Real-Time High-Speed Train Rescheduling in Case of a Complete Blockage. Transp. Res. Part B Methodol. 2015, 78, 182–201. [Google Scholar] [CrossRef]
- Veelenturf, L.P.; Kidd, M.P.; Cacchiani, V.; Kroon, L.G.; Toth, P. A Railway Timetable Rescheduling Approach for Handling Large-Scale Disruptions. Transp. Sci. 2016, 50, 841–862. [Google Scholar] [CrossRef]
- Louwerse, I.; Huisman, D. Adjusting a Railway Timetable in Case of Partial or Complete Blockades. Eur. J. Oper. Res. 2014, 235, 583–593. [Google Scholar] [CrossRef]
- Binder, S.; Maknoon, Y.; Bierlaire, M. The Multi-Objective Railway Timetable Rescheduling Problem. Transp. Res. Part C Emerg. Technol. 2017, 78, 78–94. [Google Scholar] [CrossRef]
- Kanai, S.; Shiina, K.; Harada, S.; Tomii, N. An Optimal Delay Management Algorithm from Passengers’ Viewpoints Considering the Whole Railway Network. J. Rail Transp. Plan. Manag. 2011, 1, 25–37. [Google Scholar] [CrossRef]
- Xie, J.; Zhan, S.; Wong, S.C.; Lo, S.M. A Schedule-Based Model for Passenger-Oriented Train Planning with Operating Cost and Capacity Constraints. IEEE Trans. Intell. Transp. Syst. 2022, 23, 21314–21328. [Google Scholar] [CrossRef]
- Cao, Z.; Wang, Y.; Yang, Z.; Chen, C.; Zhang, S. Timetable Rescheduling Using Skip-Stop Strategy for Sustainable Urban Rail Transit. Sustainability 2023, 15, 14511. [Google Scholar] [CrossRef]
- Sato, K.; Tamura, K.; Tomii, N. A MIP-Based Timetable Rescheduling Formulation and Algorithm Minimizing Further Inconvenience to Passengers. J. Rail Transp. Plan. Manag. 2013, 3, 38–53. [Google Scholar] [CrossRef]
- Xiu, C.; Pan, J.; D’Ariano, A.; Zhan, S.; Peng, Q. Passenger Service-Oriented Timetable Rescheduling for Large-Scale Disruptions in a Railway Network: A Heuristic-Based Alternating Direction Method of Multipliers. Omega 2024, 125, 103040. [Google Scholar] [CrossRef]
- Hong, X.; Meng, L.; D’Ariano, A.; Veelenturf, L.P.; Long, S.; Corman, F. Integrated Optimization of Capacitated Train Rescheduling and Passenger Reassignment Under Disruptions. Transp. Res. Part C Emerg. Technol. 2021, 125, 103025. [Google Scholar] [CrossRef]
- Wang, W.; Bao, Y.; Long, S. Rescheduling Urban Rail Transit Trains to Serve Passengers from Uncertain Delayed High-Speed Railway Trains. Sustainability 2022, 14, 5718. [Google Scholar] [CrossRef]
- Pan, H.; Yang, L.; Liang, Z. Demand-Oriented Integration Optimization of Train Timetabling and Rolling Stock Circulation Planning with Flexible Train Compositions: A Column-Generation-Based Approach. Eur. J. Oper. Res. 2023, 305, 184–206. [Google Scholar] [CrossRef]
- Cadarso, L.; Marín, Á.; Maróti, G. Recovery of Disruptions in Rapid Transit Networks. Transp. Res. Part E Logist. Transp. Rev. 2013, 53, 15–33. [Google Scholar] [CrossRef]
- Veelenturf, L.P.; Kroon, L.G.; Maróti, G. Passenger Oriented Railway Disruption Management by Adapting Timetables and Rolling Stock Schedules. Transp. Res. Part C Emerg. Technol. 2017, 80, 133–147. [Google Scholar] [CrossRef]
- Zhu, Y.; Goverde, R.M.P. Integrated Timetable Rescheduling and Passenger Reassignment During Railway Disruptions. Transp. Res. Part B Methodol. 2020, 140, 282–314. [Google Scholar] [CrossRef]
- Zhang, P.; Zhao, P.; Qiao, K.; Wen, P.; Li, P. A Multistage Decision Optimization Approach for Train Timetable Rescheduling Under Uncertain Disruptions in a High-Speed Railway Network. IEEE Trans. Intell. Transp. Syst. 2023, 24, 6307–6321. [Google Scholar] [CrossRef]
- Zhao, W.; Zhou, L.; Guo, B.; Yue, Y.; Han, C.; Wang, Z.; Mo, Y. An Integrated Optimization Method of High-Speed Railway Rescheduling Problem at the Network Level. Appl. Sci. 2023, 13, 10695. [Google Scholar] [CrossRef]
- Zhan, S.; Wong, S.C.; Shang, P.; Peng, Q.; Xie, J.; Lo, S.M. Integrated Railway Timetable Rescheduling and Dynamic Passenger Routing During a Complete Blockage. Transp. Res. Part B Methodol. 2021, 143, 86–123. [Google Scholar] [CrossRef]
- Binder, S.; Maknoon, M.Y.; Azadeh, S.S.; Bierlaire, M. Passenger-Centric Timetable Rescheduling: A User Equilibrium Approach. Transp. Res. Part C Emerg. Technol. 2021, 132, 103368. [Google Scholar] [CrossRef]
- Corman, F.; D’Ariano, A.; Pacciarelli, D.; Pranzo, M. Optimal Inter-Area Coordination of Train Rescheduling Decisions. Transp. Res. Part E Logist. Transp. Rev. 2012, 48, 71–88. [Google Scholar] [CrossRef]
- Zhu, Y.; Goverde, R.M.P. Dynamic Railway Timetable Rescheduling for Multiple Connected Disruptions. Transp. Res. Part C Emerg. Technol. 2021, 125, 103080. [Google Scholar] [CrossRef]
- Zhang, C.; Gao, Y.; Cacchiani, V.; Yang, L.; Gao, Z. Train Rescheduling for Large-Scale Disruptions in a Large-Scale Railway Network. Transp. Res. Part B Methodol. 2023, 174, 102786. [Google Scholar] [CrossRef]
- Meng, L.; Zhou, X. Robust Single-Track Train Dispatching Model Under a Dynamic and Stochastic Environment: A Scenario-Based Rolling Horizon Solution Approach. Transp. Res. Part B Methodol. 2011, 45, 1080–1102. [Google Scholar] [CrossRef]
- Zhan, S.; Kroon, L.G.; Zhao, J.; Peng, Q. A Rolling Horizon Approach to the High Speed Train Rescheduling Problem in Case of a Partial Segment Blockage. Transp. Res. Part E Logist. Transp. Rev. 2016, 95, 32–61. [Google Scholar] [CrossRef]
Figure 1.
The initial timetable and passenger travel plans for a small-scale network.
Figure 1.
The initial timetable and passenger travel plans for a small-scale network.
Figure 2.
Effectiveness of applying train rescheduling strategies under disruptions.
Figure 2.
Effectiveness of applying train rescheduling strategies under disruptions.
Figure 3.
Multiple disruption scenarios: (a) Multiple correlated disruptions; (b) Disruptions with no temporal overlap; (c) Disruptions with no passenger flow coupling.
Figure 3.
Multiple disruption scenarios: (a) Multiple correlated disruptions; (b) Disruptions with no temporal overlap; (c) Disruptions with no passenger flow coupling.
Figure 4.
Step-wise rescheduling method.
Figure 4.
Step-wise rescheduling method.
Figure 5.
Integrated rescheduling method.
Figure 5.
Integrated rescheduling method.
Figure 6.
Solution of the step-wise rescheduling method for multiple disruptions.
Figure 6.
Solution of the step-wise rescheduling method for multiple disruptions.
Figure 7.
Solution of the integrated rescheduling method for multiple disruptions.
Figure 7.
Solution of the integrated rescheduling method for multiple disruptions.
Figure 8.
Distribution of stations on Beijing-Shanghai (red), Shanghai-Chengdu (green), and Hefei-Bengbu (blue) lines in China’s high-speed railway network. (Numbers indicate the track count at each station).
Figure 8.
Distribution of stations on Beijing-Shanghai (red), Shanghai-Chengdu (green), and Hefei-Bengbu (blue) lines in China’s high-speed railway network. (Numbers indicate the track count at each station).
Figure 9.
Rescheduled timetable with the integrated method.
Figure 9.
Rescheduled timetable with the integrated method.
Figure 10.
Calculation time under different stage lengths and backtracking times : (a) Main view; (b) Right view.
Figure 10.
Calculation time under different stage lengths and backtracking times : (a) Main view; (b) Right view.
Figure 11.
Objective values under different stage lengths and backtracking times : (a) Main view; (b) Right view.
Figure 11.
Objective values under different stage lengths and backtracking times : (a) Main view; (b) Right view.
Table 1.
Symbols and descriptions of parameters.
Table 1.
Symbols and descriptions of parameters.
| Symbol | Description |
|---|
| Set of lines, where . |
| Set of trains on line , where . |
| Set of stations on line , where denotes the station preceding the disrupted section on line . |
| Set of transfer stations, where connects line and . |
| Scheduled departure time of train at station on line . |
| Scheduled arrival time of train at station on line . |
| 0–1 binary parameter: , if train is scheduled to stop at station on line , 0 otherwise. |
| Start time of the disruption on line . |
| End time of the disruption on line . |
| Minimum dwell time for trains at station on line . |
| Additional time for train acceleration and deceleration. |
| , | Minimum and maximum pure running time for trains between station and on line . |
| Safety time interval (arrival or departure headway) between two trains arriving at or departing from the same station. |
| Safety time interval (departure-arrival headway) between two trains occupying the same station track. |
| Minimum transfer time for passengers at transfer station between line and . |
| Number of tracks at station on line . |
| Number of passengers on train traveling to destination on line . |
| Number of passengers transferring from train on line to train on line , with destination . |
| A sufficiently large positive number used in Big-M formulations to relax constraints based on binary variable states. |
Table 2.
Symbols and descriptions of variables.
Table 2.
Symbols and descriptions of variables.
| Symbol | Description |
|---|
| Actual departure time of train at station on line . |
| Actual arrival time of train at station on line . |
| Departure delay of train at station on line . |
| Arrival delay of train at station on line . |
| 0–1 binary variable: = 1 if train is scheduled to stop at station on line , 0 otherwise. |
| 0–1 binary variable: = 1 if train on line is canceled, 0 otherwise. |
| 0–1 binary variable: = 1 if train departs/arrives before train at station on line 0 otherwise. |
| 0–1 binary variable: = 1 if the interval between the arrival and departure of trains and at station on line is greater than 0 otherwise. |
| 0–1 binary variable: = 1 if passengers transfer from train on line to train on line 0 otherwise. |
Table 3.
Random disruption scenarios 1–10.
Table 3.
Random disruption scenarios 1–10.
| Scenario | Disruptions Section 1 | Disruptions Section 2 | Scenario | Disruptions Section 1 | Disruptions Section 2 |
|---|
| 1 | HND-SJH | FD-QJ | 6 | QJ-NJN | DY-BBN |
| 2 | BBN-HND | QJ-NJN | 7 | FD-QJ | CZ-DY |
| 3 | SJH-HFBC | FD-QJ | 8 | NJN-CZ | SJH-HFBC |
| 4 | HFBC-HFN | HFN-FD | 9 | CZ-DY | HFBC-HFN |
| 5 | HFN-FD | CZ-DY | 10 | DY-BBN | BBN-HND |
Table 4.
Results of Scenarios 1–10 with the 1st disruption in [16:40, 17:40] and the 2nd in [17:10, 18:10].
Table 4.
Results of Scenarios 1–10 with the 1st disruption in [16:40, 17:40] and the 2nd in [17:10, 18:10].
| Scenario | Step-Wise Rescheduling Method | Integrated Rescheduling Method |
|---|
| Total Objective | Through Passenger Delay (Min) | Trip Failures (Persons) | Calculation Time (s) | Gap (%) | Total Objective | Through Passenger Delay (Min) | Trip Failures (Persons) | Calculation Time (s) | Gap (%) |
|---|
| 1 | 492,717 | 221,409 | 689 | 83 | 0 | 401,206 (↓ 19%) | 273,582 ↑ | 96 ↓ | 17 | 0 |
| 2 | 492,051 | 168,059 | 927 | 34 | 0 | 365,308 (↓ 26%) | 204,917 ↑ | 314 ↓ | 24 | 0 |
| 3 | 462,154 | 202,683 | 689 | 34 | 0 | 391,074 (↓ 15%) | 269,429 ↑ | 96 ↓ | 24 | 0 |
| 4 | 256,515 | 129,471 | 306 | 41 | 0 | 254,184 (↓ 1%) | 133,371 ↑ | 277 ↓ | 276 | 0 |
| 5 | 449,532 | 322,612 | 196 | 56 | 0 | 442,560 (↓ 2%) | 325,879 ↑ | 151 ↓ | 159 | 0 |
| 6 | 475,759 | 377,369 | 152 | 123 | 0 | 413,842 (↓ 13%) | 354,135 ↓ | 36 ↓ | 26 | 0 |
| 7 | 625,770 | 467,398 | 233 | 48 | 0 | 561,228 (↓ 10%) | 465,016 ↓ | 15 ↓ | 171 | 0 |
| 8 | 565,591 | 230,056 | 1051 | 127 | 0 | 443,810 (↓ 22%) | 269,912 ↑ | 418 ↓ | 266 | 2.2 |
| 9 | 632,758 | 319,849 | 987 | 300 | 3.6 | 510,129 (↓ 19%) | 390,270 ↑ | 207 ↓ | 300 | 7.8 |
| 10 | 407,834 | 287,634 | 346 | 300 | 0.5 | 387,999 (↓ 5%) | 318,923 ↑ | 88 ↓ | 300 | 3.4 |
Table 5.
Results under different disruption overlap durations.
Table 5.
Results under different disruption overlap durations.
| Scenario | Disruption 1 | Disruption 2 | Overlap | Step-Wise Rescheduling Method | Integrated Rescheduling Method | Objective Reduction |
|---|
| Total Objective | Through Passenger Delay (Min) | Trip Failures (Persons) | Total Objective | Through Passenger Delay (Min) | Trip Failures (Persons) |
|---|
| 2 | [16:40, 17:40] | [16:50, 17:50] | 50 | 517,546 | 185,708 | 969 | 484,131 | 321,782 | 177 | 33,415 (↓ 6%) |
| [16:40, 17:40] | [17:10, 18:10] | 30 | 492,051 | 168,059 | 927 | 365,308 | 204,917 | 314 | 126,743 (↓ 26%) |
| [16:40, 17:40] | [17:30, 18:30] | 10 | 477,002 | 194,277 | 750 | 401,073 | 268,313 | 110 | 75,929 (↓ 16%) |
| [16:40, 17:40] | [18:00, 19:00] | 0 | 281,884 | 157,204 | 180 | 277,221 | 156,215 | 180 | 4663 (↓ 2%) |
| 4 | [16:40, 17:40] | [16:50, 17:50] | 50 | 371,187 | 155,856 | 615 | 309,907 | 222,504 | 49 | 61,280 (↓ 17%) |
| [16:40, 17:40] | [17:10, 18:10] | 30 | 256,515 | 129,471 | 306 | 254,184 | 133,371 | 277 | 2331 (↓ 1%) |
| [16:40, 17:40] | [17:30, 18:30] | 10 | 287,954 | 160,167 | 229 | 287,954 | 160,167 | 229 | 0 |
| [16:40, 17:40] | [18:00, 19:00] | 0 | 349,148 | 156,827 | 376 | 349,148 | 156,827 | 376 | 0 |
| 6 | [16:40, 17:40] | [16:50, 17:50] | 50 | 658,730 | 510,540 | 318 | 615,267 | 517,244 | 137 | 43,463 (↓ 7%) |
| [16:40, 17:40] | [17:10, 18:10] | 30 | 475,759 | 377,369 | 152 | 413,842 | 354,135 | 36 | 61,917 (↓ 13%) |
| [16:40, 17:40] | [17:30, 18:30] | 10 | 444,586 | 361,410 | 91 | 404,647 | 346,212 | 15 | 39,939 (↓ 9%) |
| [16:40, 17:40] | [18:00, 19:00] | 0 | 425,394 | 323,047 | 125 | 415,846 | 315,391 | 125 | 9548 (↓ 2%) |
Table 6.
Results under different penalty coefficients for passenger trip failures.
Table 6.
Results under different penalty coefficients for passenger trip failures.
| Scenario | Penalty
() | Step-Wise Rescheduling Method | Integrated Rescheduling Method | Objective Reduction |
|---|
| Total Objective | Through Passenger Delay (Min) | Trip Failures (Persons) | Calculation Time (s) | Total Objective | Through Passenger Delay (Min) | Trip Failures (Persons) | Calculation Time (s) |
|---|
| 2 | 100 | 281,843 | 131,024 | 1285 | 36 | 271,877 | 149,194 | 884 | 30 | 9966 (↓ 4%) |
| 300 | 492,051 | 168,059 | 927 | 34 | 365,308 | 204,917 | 314 | 20 | 126,743 (↓ 26%) |
| 500 | 666,954 | 182,488 | 863 | 34 | 423,736 | 260,920 | 150 | 56 | 243,218 (↓ 36%) |
| 4 | 100 | 195,315 | 129,471 | 306 | 45 | 195,315 | 129,471 | 306 | 38 | 0 |
| 300 | 256,515 | 129,471 | 306 | 41 | 254,184 | 133,371 | 277 | 276 | 2331 (↓ 1%) |
| 500 | 317,757 | 129,513 | 306 | 36 | 320,770 | 215,254 | 33 | 300 | 3013 (↑ 1%) |
| 6 | 100 | 376,923 | 281,544 | 753 | 57 | 368,891 | 285,127 | 583 | 22 | 8032 (↓ 2%) |
| 300 | 475,759 | 377,369 | 152 | 123 | 413,842 | 354,135 | 36 | 20 | 61,917 (↓ 13%) |
| 500 | 500,214 | 384,174 | 121 | 131 | 417,296 | 360,288 | 11 | 21 | 82,918 (↓ 17%) |
| Disclaimer/Publisher’s Note: The statements, opinions and data contained in all publications are solely those of the individual author(s) and contributor(s) and not of MDPI and/or the editor(s). MDPI and/or the editor(s) disclaim responsibility for any injury to people or property resulting from any ideas, methods, instructions or products referred to in the content. |
© 2025 by the authors. Licensee MDPI, Basel, Switzerland. This article is an open access article distributed under the terms and conditions of the Creative Commons Attribution (CC BY) license (https://creativecommons.org/licenses/by/4.0/).


