Abstract
To address the global environmental crisis and achieve sustainable development in the construction industry, the thermal-engineering requirements for building envelope structures in China have been increasing year by year. However, the contradiction between the long-term environmental benefits brought by high-level energy-saving standards and the short-term initial-investment increment has become increasingly prominent. Based on the marginal benefit theory and multi-objective optimisation algorithm, this study constructed a sustainable optimisation framework for the envelope parameters of building energy-saving design standards in cold regions of China. Taking residential buildings and public buildings in the typical city of Shijiazhuang as examples, the optimal marginal benefit values of the thermal parameters of the building envelope were obtained, as well as a multi-objective-optimisation optimal solution that comprehensively weighs the three-dimensional goals of energy efficiency, life-cycle cost, and thermal comfort. This sustainable optimisation framework can provide a scientific and quantified decision-making basis for relevant stakeholders, such as government departments, builders, or architects.
1. Introduction
1.1. Background
In recent decades, rapid urbanisation and the resulting modern construction industry have been crucial for China’s economic development. In 2024, China’s new construction area was about 3.437 billion m2 [1], and the primary energy consumption of the construction industry was 5.96 billion tons of standard coal [2]. In the beginning of the economic reform (1978), China’s primary energy consumption in the construction industry accounted for only 10% of the total energy consumption of society, but this value has increased to 46% at present [3]. Against the backdrop of global efforts to combat climate change and advance sustainable development, continuously reducing building energy consumption and optimising building envelopes hold significant importance for cold regions with long winters and high heating energy demands. Chinese governments and industry associations at all levels have promoted the healthy and virtuous development of the construction industry by establishing building energy efficiency regulations. Meanwhile, as the core city in China’s cold-climate zone and the Beijing–Tianjin–Hebei region, Shijiazhuang, the capital city of Hebei Province, has been at the forefront of high-standard building energy efficiency design in all provinces and cities in China, with typical and representative characteristics.
Civil buildings in China are divided into the following two categories: residential and public (including office buildings, schools, hotels, hospitals, and retail stores). Building energy efficiency has gone through the following broad stages:
1. Initialisation phase (before 1986)
In 1986, China’s Ministry of Housing and Construction promulgated the first national building energy-efficiency design standard, namely, JGJ26-1986, or Energy Efficiency Design Standard for Civil Buildings (Heating Residential Buildings) [4], which required new residential buildings to reduce their energy consumption by 30% compared with the 1980 benchmark building. This standard marked the official start of building energy efficiency in China.
2. Pilot extension phase (1987–2000)
In 1995, the revised JGJ26-1995 Energy Conservation Design Standards for Civil Buildings (Heating Residential Buildings Part) [5] standard raised the energy conservation target for residential buildings to 50% of that of the baseline building [=30% × (1% − 30%) + 30%] and began to promote it on a pilot basis in cold and frigid regions.
3. Comprehensive advancement phase (2001–2015)
At the national level, 2001–2015 is an important transition phase in China’s building energy efficiency field. The newly revised energy conservation law of China in 2007 (implemented in 1997 and first revised in 2007) has become a milestone building energy-efficiency superseding law. The 2007 revised version of China’s energy conservation law included a separate section on building energy, laying the foundation for China to comprehensively work on building energy efficiency.
In the field of public buildings, GB50189-2005, or Energy Conservation Design Standards for Public Buildings [6], was formally implemented in 2005. This standard, for the first time, put forward energy-saving design requirements for China’s public buildings that encompassed air-conditioning, lighting, and other energy-using systems, and it required the comprehensive energy-saving rate to reach 50% of that of the baseline building. It marked the expansion of building energy efficiency from residential buildings to public buildings. In 2015, GB50189-2015 (Energy Efficiency Design Standards for Public Buildings) [7] was revised and promulgated, and the comprehensive energy efficiency rate was further increased to 65% [=30% × (1% − 50%) + 50%].
In the field of residential buildings, JGJ26-2010, or Energy Efficiency Design Standards for Residential Buildings in Severe Cold and Cold Regions [8], was promulgated in 2010. It required the energy efficiency rate of new residential buildings in severe cold and cold regions to be further increased to 65% of that of the baseline building [=30% × (1% − 50%) + 50%], with a focus on reducing heating energy consumption. In the following years, the rest of China’s mild-climate zones, such as the hot-summer and cold-winter and hot-summer and warm-winter regions, also gradually raised their energy efficiency standards to 65%. In 2015, on the basis of the energy efficiency standards in the three previous phases (energy efficiencies of 30%, 50%, and 65%) and through the optimisation of the enclosure structure, equipment systems, and renewable energy applications, the core of northern China’s Beijing–Tianjin–Hebei region continued to increase the energy efficiency standards of residential buildings and was the first to implement the 75% [=30% × (1% − 65%) + 65%] energy efficiency standard. An example is DB13(J) 185-2015, or Energy Efficiency Design Standards for Residential Buildings in Hebei Province (75% Energy Efficiency) [9], the latest revision of which is DB13(J) 185-2020, with the energy efficiency rate remaining unchanged at 75%. In 2019, the Energy Efficiency Design Standards for Residential Buildings in Severe Cold and Cold Regions (JGJ26-2018) [10] was promulgated; it raised the industry standard energy efficiency rate for residential buildings in severely cold and frigid areas to 75%. Energy-saving rates of 30%, 50%, 65%, and 75% are known as the four steps of energy saving in China’s building sector. Notably, 75% of energy-efficient buildings have reached the level of low-energy buildings.
4. High-quality development phase (2016–present)
On the basis of the full implementation of the four-step energy-saving scheme for residential and public buildings, some regions in China have begun to implement stringent requirements for energy-saving standards.
In 2015, on the basis of the experience of the Sino-German Cooperation Demonstration Project, China’s Ministry of Housing and Urban–Rural Development (MOHURD) issued the Technical Guidelines for Passive Ultra-Low Energy Green Buildings [11], which clarified the technical indicators and design points for ultra-low-energy buildings. In the following years, many provinces and cities issued local energy-saving design standards for passive ultra-low-energy buildings (i.e., more than 50% energy savings on top of the current energy-saving design standards for residential/public buildings). For example, the comprehensive energy-savings rate of Hebei Province Engineering and Construction Local Standard DB13(J)/T 8359-2020 (Passive Ultra-low Energy Consumption Residential Building Energy Efficiency Design Standard) [12] is 87.5% [=50% × (1% − 75%) + 75%], and the comprehensive energy-savings rate of DB13(J)/T8360-2020 (Passive Ultra-low Energy Consumption Public Building Energy Efficiency Design Standard) [13] is 82.5% [=50% × (1% − 65%) + 65%].
In 2019, MOHURD issued GB/T51350-2019, or Technical Standard for Near-Zero Energy Consumption Buildings [14], a national basic standard that defines the technical requirements and energy-efficiency indicators for near-zero energy consumption buildings. It required the level of building energy consumption to be reduced by more than 60–75% compared with the 65% energy-saving standard. The rate for residential buildings is reduced by 70–75% on the basis of JGJ26-2010, Energy Conservation Design Standard for Residential Buildings in Severe Cold and Cold Regions [8]; that is, the comprehensive energy-savings rate reaches 89.5–91.25% [=(70% − 75%) × (1% − 65%) + 65%], which is about 90%. The rate for public buildings is reduced by 60% on the basis of GB 50189-2015, Energy Conservation Design Standard for Public Buildings [7]; that is, the comprehensive energy-savings rate reaches 86% [=60% × (1% − 65%) + 65%].
In the same year, the newly revised GB/T50378-2019, Green Building Evaluation Standard, stipulates that the thermal performance of green building envelopes can be improved by 5%, 10%, and 15% over the current national energy-saving design standards and can be awarded scores of 5, 10, and 15, respectively. The 2024 revised version of the Green Building Evaluation Standard [15] has raised the requirements of this index item to 5% (one star), 10% (two stars), and 20% (three stars).
In 2022, China’s MOHURD promulgated and implemented GB55015-2021, or General Specification for Building Energy Efficiency and Renewable Energy Utilization [16]. This standard is another landmark document in the field of building energy efficiency in China and is the only full-text national mandatory specification in the field of building energy efficiency and renewable energy utilisation. The standard integrates the original decentralised standard system and abolishes the relevant mandatory provisions in the 20 original national and industry standards. The standard comprehensively improves the energy efficiency requirements of current residential and public buildings. The average design energy-consumption levels of new residential and public buildings are reduced by 30% and 20%, respectively, relative to the 2016 standard. That is, the rate for cold areas of residential buildings is reduced to 75% of the comprehensive energy-savings rate and that of public buildings is reduced to 72% of the comprehensive energy-savings rate.
In 2023, the Ministry of Housing and Construction of Hebei Province promulgated DB13(J)/T8535-2023, or Zero-Energy Public Building Design Standards [17], which stipulates that the comprehensive energy-savings rate of buildings should reach 100%. It indicates that the energy-savings rate of a building itself should be further reduced by 30% compared with the current standard and that the utilisation rate of renewable energy should be greater than or equal to the comprehensive energy consumption of the building throughout the year. Figure 1 illustrates the development of China’s building energy-efficiency design standards.
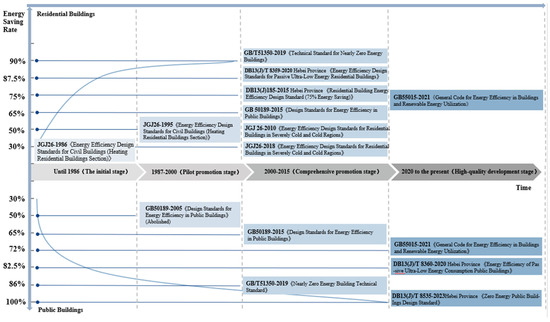
Figure 1.
Development of building energy-efficiency design standards in China [4,5,6,7,8,9,10,12,13,14,16,17].
China’s civil-building energy efficiency has experienced the development of residential buildings followed by public buildings and cold regions followed by hot-summer and warm-winter regions, and a high-demand-building energy-efficiency standard system has been gradually established. However, with the stepwise increase in national, industrial, and local building energy efficiency requirements, the incremental cost of energy efficiency has increased dramatically, leading to difficulties in the implementation of non-mandatory energy efficiency standards [18]. In the implementation of mandatory energy-saving standards, owing to the audited drawing filing system, the design of China’s new buildings is realised in accordance with energy-saving standards, with a proportion as high as 95.7%; however, the proportion of the implementation of energy-saving design standards in the construction phase is only 53.8% [19]. In recent years, China’s economy and real-estate industry have entered a period of transition, and the contradiction between the long-term environmental benefits brought by high-level energy efficiency standards and short-term, incremental initial investment has become increasingly prominent. This has resulted in non-mandatory building energy-efficiency design standards encountering resistance during implementation, with policies proving difficult to enforce. Existing research has focused solely on the continuous improvement in energy-savings rates within building design standards, whilst paying insufficient attention to the economic viability of incremental costs and indoor thermal environments. Meanwhile, as a key physical barrier separating the indoor and outdoor environments, the thermal performance of the building envelope is at the core of achieving passive energy conservation. Studies have shown that passive design for the thermal performance of building envelopes has the highest input–output ratio [20]. Therefore, a cost–benefit study on the envelope parameters in each building energy-efficiency design standard needs to be conducted. The description of the provisions of Chinese building energy efficiency standards states that regardless of a building’s energy consumption (whether low, ultra-low, near-zero, or zero), indoor environmental parameters should satisfy a high level of thermal comfort whilst meeting energy-consumption control objectives; a healthy, comfortable indoor environment is the basic prerequisite for building energy efficiency [14].
Therefore, this study aims to take the current mandatory and recommended energy-saving design standard limits for cold regions of China as the benchmarks and integrate the marginal benefit theory and multi-objective-optimisation algorithm to conduct economic evaluation and multi-objective optimisation of comprehensive energy consumption–cost–thermal comfort for the parameters of the envelope structure. The sustainable optimisation framework proposed in this paper can provide policymakers with a scientific and reasonable quantitative tool to balance environmental goals and economic feasibility, as well as for architects to achieve high-performance energy conservation and comfortable living environments under cost constraints.
1.2. Literature Review
The research on China’s building energy-efficiency design standards has gradually expanded from early clause-based qualitative research to single-item quantitative and comprehensive optimisation research that has multiple objectives. This study’s literature review centres on the following three aspects: building energy efficiency, multi-objective-optimisation frameworks, and the economic evaluation of energy-saving measures, thereby establishing a theoretical foundation for subsequent research.
Building energy efficiency constitutes the core issue in building energy-conservation research. Previous literature has centred on building energy-efficiency evaluation methodologies, the practical performance of building energy efficiency standards, and the relationship between economic benefits and building energy efficiency. Hao Xie et al. [21] analysed the current status and challenges of building energy efficiency in China, identifying industrial, transport, commercial, and residential buildings as the top-three energy-consuming sectors. They outlined the evolution and current state of China’s building energy efficiency, summarised major existing problems, and proposed recommendations to promote its development. Chunmei Guo et al. [22] coupled the analytic hierarchy process with fuzzy comprehensive evaluation to extract 23 quantitative and 7 qualitative indicators from existing building energy codes/standards. They established a three-tier comprehensive evaluation model for the operational energy efficiency of public buildings, proposing a novel method for assessing China’s public-building energy efficiency. Xingmin Liu et al. [23] investigated the knowledge requirements of key stakeholders in public-building energy efficiency enhancement, establishing an indicator system for knowledge needs and proposing targeted knowledge-improvement methods. The findings revealed that stakeholders’ knowledge demands primarily focused on the following five areas: incentive policies, regulations, standards and codes, market dynamics, and technology. Amongst these, incentive policies and market conditions emerged as the most critical concerns across all stakeholder groups. Xia Wang et al. [24] employed propensity-score matching using survey data from 1128 households in Chongqing, China, to evaluate the implementation effects of 50% and 65% energy efficiency standards. The results indicated a performance gap between energy savings calculated during the design phase and those achieved during actual operation. Wenchao Bu et al. [25] employed panel data models and spatial econometric techniques to analyse the relationship between economic growth targets and green energy efficiency. The findings indicate that economic growth targets diminish energy efficiency, whilst environmental regulations exert a positive moderating effect between economic growth targets and energy efficiency.
The construction of multi-objective-optimisation frameworks serves as a common theoretical tool for researching building energy efficiency utilisation. Teng Shao et al. [26] conducted a multi-objective-optimisation study on the key parameters, such as the heat-transfer coefficient of external walls and the performance of external windows, of rural residences in cold regions of northwest China in consideration of energy consumption, thermal comfort, and cost. Their aim was to reduce energy consumption and improve thermal comfort whilst controlling the cost of building renovation. Xiaoli Dong et al. [27] constructed a near-zero-energy building optimisation design method on the basis of the NSGA-II optimisation search algorithm, which includes energy consumption and incremental cost functions for different energy-saving technologies. Xiaofei Zhen [28] integrated four key dimensions, namely, energy consumption, cost, energy-saving effect, and comfort, to construct a multi-objective-optimisation framework. The aim was to achieve a comprehensive balance amongst building envelope performance parameters in multiple performance dimensions. Zhilei Hua et al. [29] conducted multi-objective optimisation for low-carbon building energy systems based on high renewable energy penetration. Results indicate that a low-carbon building energy system with high renewable energy integration was achieved, targeting economic benefits, carbon reduction, and increased renewable energy consumption. V Kills et al. [30] proposed a decision-making methodology for selecting insulation materials, thicknesses, and window frame materials under multi-criteria optimisation encompassing economic, energy, and environmental standards, incorporating a life-cycle perspective. Considering Greece’s diverse climatic conditions, the proposed method was applied to residential buildings. Ling Li et al. [31] selected nine cities with distinct climatic conditions and employed sensitivity analysis to optimise the following four objective functions: air conditioning electricity consumption, lighting electricity consumption, discomfort glare index, and predicted dissatisfaction percentage. Multi-objective optimisation was conducted using NSGA-II, with optimal solutions further analysed via the weighted sum method. The study’s conclusions highlight trade-offs between energy efficiency and lighting quality, further emphasising the necessity for design solutions tailored to specific climatic conditions.
Regarding the economic evaluation of building energy efficiency measures, cost-effectiveness constitutes the central issue in research on the economics of building energy conservation. Previous literature has focused on establishing risk assessment frameworks, conducting whole-life-cycle economic evaluations, and examining energy consumption and costs under different scenarios. Sérgio Tadeu et al. [32] proposed an eco-efficiency approach integrating life-cycle assessment and cost-optimality to support decision making on energy-saving measures and formulate effective incentives for enhancing building performance. Géremi Gilson Dranka et al. [33] introduced a novel, user-friendly, step-by-step framework for the techno-economic and risk-based assessment of energy-efficiency improvement projects. By systematically identifying intervention areas, conducting technology evaluations, and providing integrated tools for economic and risk assessments, the proposed methodology enables decisionmakers to select the most appropriate approach for analysing the economic viability of future projects. Mehmet Kadri Akyüz [34] conducted an economic assessment of building energy and economic performance, employing a life-cycle assessment to optimise the environmental economics of external-wall-insulation thickness. Shengyuan Li et al. [35] established a baseline scenario based on actual data, comparing the following four scenarios: baseline, office energy efficiency retrofit, office-to-residential conversion, and office-to-residential conversion with energy efficiency retrofit. They evaluated energy consumption and costs for each scenario. Hajare et al. [36] calculated the cost of building retrofit under different energy-saving technology options from a full-life-cycle perspective. Caifeng Gao et al. [37] systematically studied the whole-life-cycle energy-saving economic data of six near-zero energy consumption public buildings in China’s cold-climate zone, and by comparing them with those of traditional public buildings, they derived the characteristics and laws of each energy-saving technology in terms of incremental costs and incremental benefits and clarified the positive energy-saving benefits under the whole-life-cycle perspective. Wang et al. [38] analysed the sensitivity and static payback period and found that the sensitivity of the envelope insulation system is very high in building energy efficiency retrofitting, and the economic payback period is about 8–12 years.
1.3. Research Innovation
In summary, in previous research on building envelope parameters, whether energy-saving economic evaluation or multidimensional objective optimisation, the research variables were viewed from conventional perspectives, and the variable selection and threshold setting are not aligned with current building energy-saving design codes. As a result, practical application of the research results entails a certain compliance risk, which affects the feasibility and popularisation of the application of the results. In addition, systematic comparative research on the envelope parameters of different levels of energy-saving design standards for residential and public buildings in cold regions is lacking. Therefore, this study takes the envelope parameters of residential and public buildings in cold regions as the research variables, adopts the mandatory limits in different levels of energy-saving design standards as the variable thresholds, and employs marginal cost and multi-objective-optimisation methods to obtain optimal solutions for the design of the envelopes of residential and public buildings in cold regions.
2. Methodology
Figure 2 depicts the research framework of the constructed evaluation and optimisation method for envelope parameters of residential/public-building energy-efficiency design standards. Section 2.1 presents prototype-building-model construction on the basis of stratified sampling and onsite research. Section 2.2 shows a comparison of building energy-efficiency design standard envelope parameters. Section 2.3 provides a marginal cost evaluation of envelope parameters, and Section 2.4 introduces the multi-objective-optimisation model of envelope parameters, which considers energy efficiency, cost, and indoor thermal comfort.
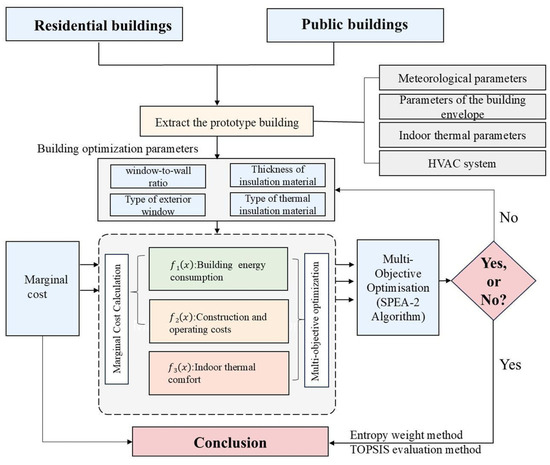
Figure 2.
The research framework.
2.1. Model Configuration
This study selected Shijiazhuang as a representative city in cold regions for field investigations, based on the following principles: ① Cold regions encompass xx cities in northern China, with Shijiazhuang situated at the core of this zone—namely, the heartland of the North China Plain, characterised by the most prosperous economy and densest population. ② The research subjects comprise current building energy-efficiency design codes of varying conservation levels in cold regions, including parallel national standards (GB), industry standards (JGJ), and local standards (DB). As a pioneer in ultra-low-energy and zero-energy buildings within China’s cold regions, Hebei Province took the lead ahead of national authorities, industry bodies, and other cold-region provinces by promulgating China’s first local standard (DB) for the energy-efficient design of ultra-low-energy and zero-energy residential/public buildings. Consequently, this study selected Shijiazhuang, the provincial capital of Hebei, as the representative city for fieldwork to comprehensively cover current design codes across all energy efficiency levels.
2.1.1. Field Survey
China’s residential/public-building energy-saving design standards often use a board-type collection of residential and office buildings as benchmark buildings, so this study adopted the representative-sample-size calculation formula proposed by Robert et al. [39] to conduct a stratified random sampling survey of existing residential and public buildings in Shijiazhuang city’s jurisdiction.
where represents the recommended sample size, x2 is the critical value of the chi-square distribution with preset degrees of freedom and confidence level, N is the total sample size, ME is the designed margin of error in %, and P is the proportion of the population (generally taken as 50% to maximise the representative sample size).
With the degree of freedom being set to 1, the confidence level being set to 0.9, and the statistical error not exceeding 10%, the representative sample sizes for existing residential and office buildings in Shijiazhuang city were calculated to be 68 and 45, respectively [40]. The remote sensing images of Shijiazhuang city’s jurisdiction were divided into 42 sub-regions using a 20 km × 20 km grid, and the sample distribution is shown in Figure 3.
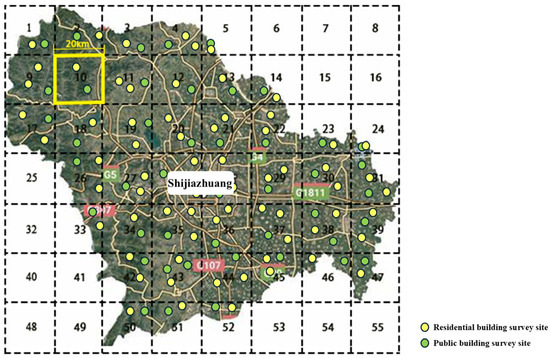
Figure 3.
Stratified sampling of Shijiazhuang city to study the sub-regional distribution.
China’s large-scale urbanisation began in 2000, and the spatial patterns of residential/office buildings have undergone substantial changes and stabilised in the last decade [41]. Therefore, field research was conducted on residential and office buildings designed and built after 2015 in each sub-region. The statistical data of the ontological parameters of the sample buildings are shown in Figure 4.
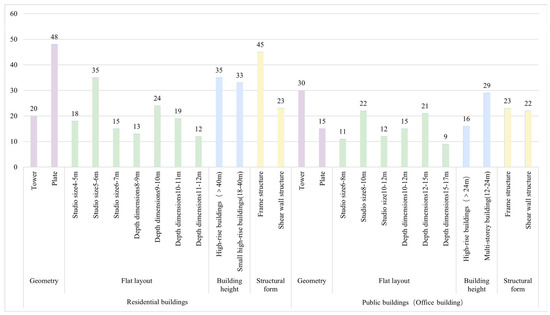
Figure 4.
Statistical data on sample buildings’ principal parameters.
2.1.2. Prototype Building
On the basis of the median of the sample-buildings’ principal parameters and with reference to the limit values of the envelope parameters of current energy-saving design standards for residential/public buildings, two real buildings (Residential Building No. 6, located in a district in Shijiazhuang city, and an office building located in a science and technology centre) were selected as prototype buildings for the present study. The measurement period was from 15 December 2024 to 15 January 2025, with data collected daily at 10:00, 15:00, and 22:00. Instruments were calibrated every 48 consecutive hours. This period encompasses the peak winter heating season. Real measurements were made on the energy bills and indoor physical environments of the two buildings. The measurements included the air temperature of a standard floor of the building, black-bulb temperature, wet-bulb temperature, relative humidity, illuminance, and wind speed. The parameters of the test instrument are detailed in Table A1 of Appendix A.1.
Residential Prototype Building
Residential Building No. 6, located in a district in Shijiazhuang city, was built in 2020. It has a total floor area of 10,901 m2, a building height of 66 m (20 floors), a body shape coefficient of 0.29, a reinforced concrete shear wall + hollow block structural system, and a building plan, as shown in Figure 5. The building’s operating parameters are based on measured data and the current specification GB55015-2021 (General Specification for Building Energy Efficiency and Renewable Energy Utilization) [16]. See Appendix A.2 for details of the residential-prototype operational parameters.
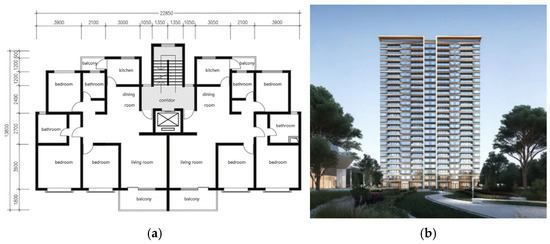
Figure 5.
Residential Building No. 6 in a neighbourhood in Shijiazhuang: (a) standard floor plan; (b) elevation plan.
Public Prototype Building
The science and technology centre’s office building in Shijiazhuang city was built in 2018. It has a total floor area of 164,813 m2, a building height of 96 m (24 floors), a body shape coefficient of 0.10, and a reinforced concrete core + frame structural system. The building’s layout and elevation are shown in Figure 6. The building’s operating parameters are based on measured data and the current specification GB55015-2021 (General Specification for Building Energy Efficiency and Renewable Energy Utilization) [16]. See Appendix A.2 for details of the public-prototype operational parameters.
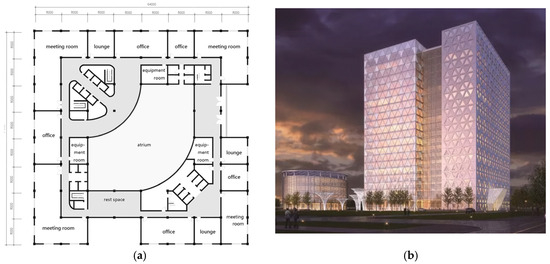
Figure 6.
A science and technology office building in Shijiazhuang: (a) standard floor plan; (b) elevation plan.
2.2. Comparison of the Envelope Parameters of Current Building Energy-Efficiency Design Standards
Current mandatory and recommended building energy-efficiency design standards, including national and local standards in Hebei Province, for cold regions are presented in Figure 1. The envelope parameter limits in each standard are compared in Table 1 and Table 2.

Table 1.
Limit values of the envelope design parameters of energy-saving design standards for residential buildings in cold regions.

Table 2.
Envelope design parameters of energy-saving design standards for public buildings in cold regions.
2.3. Marginal Cost Model
In microeconomics, marginal cost (MC) refers to the additional cost required for each additional unit of output or effect. In this study, the MC of energy savings is defined as the incremental initial investment in the envelope energy-saving system corresponding to each reduction of 1 kWh/m2, CNY/kWh·m2. The calculation formula is as follows:
where denotes the marginal cost considering a payback period of 50 years (same building life) in CNY/kWh·m2; r denotes the discount rate, reflecting price fluctuations over the building’s 50-year life cycle, with the discount rate set at 2%, incorporating the risk-free rate of long-term government bonds and the benchmark yield for the construction sector [44]; represents the energy savings per unit of floor area limited by different building energy-efficiency design standards in kWh/m2; is the incremental initial investment per unit of floor area, i.e., the difference in cost due to differences in envelope parameters in various building energy-efficiency design standards, in units of CNY; denotes the unit price of the i-th envelope material in units of CNY/m2; refers to the use of the envelope material under building energy-efficiency design standard j; is the total floor area in m2; and denotes the i-th material life in years indicating the replacement frequency throughout the entire life cycle of building materials. In this study, building energy consumption was simulated using the Honeybee tool of the Rhino–Grasshopper parameterisation platform, and the meteorological parameters were from typical annual meteorological data of Shijiazhuang city, downloaded from the official website of Energy Plus. The rest of the working condition parameters are given in Table 2 and Table 3. The list of materials for the enclosure structure and the data on the initial-investment cost were from the Budget Department of the Architectural Design Institute and from market enquiry. As shown in Table 3, the material cost data consider the incremental transportation and labour costs.

Table 3.
List of building materials and costs.
The marginal cost model constructed in this section is fundamentally designed to provide quantitative decision-making support for balancing energy consumption and costs from an economic viability perspective. By calculating the MC50 values under different energy efficiency standards, the economic inflection point is identified to define the optimal search range. Consequently, it establishes a rational, economically grounded parameter boundary for subsequent multi-objective optimisation, preventing the optimisation algorithm from conducting futile searches within the parameter space. This approach thereby serves the goal of balancing energy consumption and costs more efficiently.
2.4. Multi-Objective-Optimisation Model
We conducted a multi-objective-optimisation study using. the strength Pareto evolutionary algorithm 2 (SPEA2) built into the Octopus plug-in for the Rhino–Grasshopper platform. SPEA2 is an improved version of the strength Pareto evolutionary algorithm proposed by Zitzler et al. It enhances the original algorithm’s solution diversity and convergence by introducing a density estimation strategy and an archive set truncation algorithm and avoids getting stuck in a local optimum [46]. This study employs the SPEA2 algorithm to construct a multi-objective-optimisation framework, aiming to address multidimensional trade-off problems that cannot be handled by marginal cost models. The mathematical formulation of the multi-objective-optimisation problem is as follows:
where denotes the n-dimensional decision variable, and is the m-dimensional target vector [47].
2.4.1. Setting of the Objective Function
In this study, a multi-objective-optimisation framework for building performance on the basis of the tri-objective function was proposed to synergistically optimise building energy consumption, cost, and indoor thermal comfort [48]. The framework quantifies the trade-off relationship amongst the objectives through mathematical modelling and uses a multi-objective-optimisation algorithm to solve the Pareto-optimal solution set, which provides a scientific basis for design decisions [49]. The specific objective functions are defined as follows:
Energy
The target function of building energy consumption adopts the annual energy consumption per unit of floor area, including heating, cooling, and lighting, at the operational stage as the evaluation index. The calculation formula is as follows:
where E denotes the energy consumption per unit of floor area in kWh/m2, is the total annual energy consumption of the building in kWh/y, and A indicates the floor area in m2.
Cost
The building cost objective function employs life-cycle costs as an evaluation metric to reflect the long-term economic viability of building energy efficiency [50]. This encompasses the following three components: the initial investment for envelope energy-saving strategies, total energy-consumption costs during the operational phase, and maintenance and replacement costs [51]. The calculation formula is as follows:
where indicates the total energy cost of the building for the 50-year operational period (converted at the current electricity price) in USD; denotes the service life of material type , in years. The meanings of other symbols are as defined in Equation (3). The service life of building materials is determined according to Table 3, whereby maintenance and replacement costs are incorporated into the total life-cycle cost.
Indoor Comfort
The building indoor-thermal-comfort objective function adopts the predicted mean vote (PMV)-based annual thermal-discomfort hourly time ratio as the evaluation index [52]. When −1 ≤ PMV ≤ +1, the state is judged as comfortable and vice versa [53]. The calculation formula is as follows:
where and denote the number of thermal discomfort hours in summer and winter for the room (h), respectively, and n is the number of rooms.
2.4.2. Optimising the Setting of Variables
With the parameters in Table 4 and Table 5 of Section 2.2 as variables and combining actual residential- and public-building research at the current stage, five building energy-saving parameters, namely, building window-to-wall ratio, type of thermal-insulation material, thickness of the external-wall thermal-insulation layer, thickness of the roof thermal-insulation layer, and type of external window, were extracted as optimisation variables [54]. The names, types, value ranges, and step sizes of the variables of the residential and public-building prototypes are shown in Table 4 and Table 5, respectively. The detailed parameter-optimisation process is shown in Figure 7.

Table 4.
Parameter settings of optimisation variables for residential-building prototypes.

Table 5.
Parameter settings of optimisation variables for public-building prototypes.
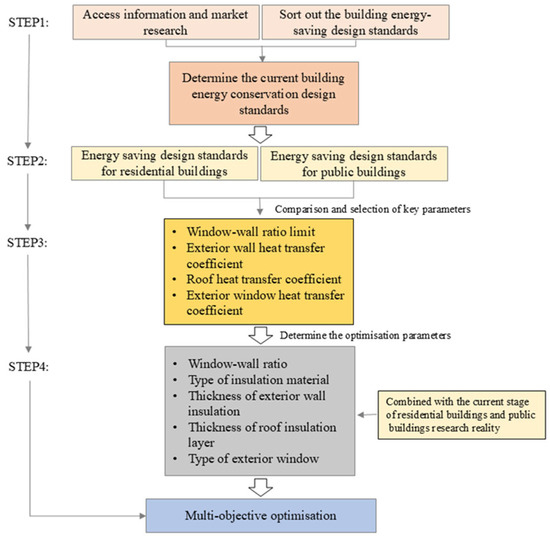
Figure 7.
Multi-objective-optimisation variable-screening process.
2.4.3. Optimal Solution Set Screening
The Pareto frontier solution set obtained via the multi-objective-optimisation algorithm provides multiple optimal solutions under the trade-off of different objective functions [55]. This study adopted the entropy weight–TOPSIS method, which combines subjective and objective approaches to further screen the final design scheme [56]. The entropy-weighting method is an objective-weighting technique that derives final weighting results through the calculation of uncertainty in evaluation criteria [57]. By quantifying the degree of variation (data disparity and volatility) across each evaluation criterion, this approach overcomes interference from subjective human factors, thereby objectively reflecting the interrelationships amongst various indicators. The steps are as follows:
The entropy weight method was adopted to calculate the weights of each objective. Generally, the smaller the information entropy of a certain target, the higher the degree of variation in the target value, the greater its role in the comprehensive evaluation, and the larger its weight [58].
The information entropy, , of item j is as follows:
The degree of variation of item is as follows:
The weight, of item is as follows:
In the formulas, denotes the entropy value of the -th item. refers to the proportion of the -th objective corresponding to the -th scheme; indicates the degree of variation in the -th item; represents the weight assigned to the -th item; m stands for the number of schemes or objects; and denotes the number of evaluation targets.
The TOPSIS method was used to assign weights to the normalised data, obtain the weighted data matrix, and determine the positive and negative ideal solutions and the Euclidean distances of each scenario to the ideal and worst points [59].
The Euclidean distance, , from the ideal point is as follows:
The Euclidean distance, , to the worst point is as follows:
In the formulas above, represents the Euclidean distance between the -th scheme and the positive ideal solution; is the Euclidean distance between the i-th scheme and the negative ideal solution; denotes the weighted value of the -th indicator of the -th scheme; and , respectively, represent the positive and negative ideal solutions of the -th indicator; and is the number of evaluation indicators.
In accordance with the degree of relative proximity to the ideal solution, the positive ideal solution represents the minimum value of each index, and the negative ideal solution represents the maximum value [60]. The final score, is obtained. The closer is to 1, the higher the scheme score.
where represents the score of the -th scheme.
3. Results and Discussion
3.1. Marginal Cost Analysis
This study conducted a double-baseline analysis of the economic laws of building energy-saving design standards in cold regions of China. (1) Eb1 used the same initial benchmark energy consumption for residential/public buildings in China as in JGJ26-1986 [4] and GB50189-2005 [6]. (2) Eb2 adopted the adjacent standard energy consumption of the lower energy-saving-rate level as the benchmark energy consumption.
Table 6 and Table 7 and Figure 8 present the calculation results and change trends of the energy consumption, cost, and MC of residential and public buildings in cold regions under different energy-saving design standards. The results show that the improvement in the energy-savings rate had a nonlinear relationship with the MC.

Table 6.
Calculation results of energy-saving design standards for residential buildings.

Table 7.
Calculation results of energy-efficiency design standards for public buildings.
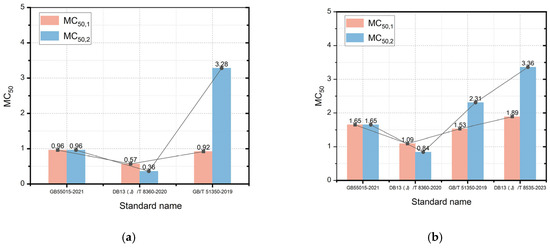
Figure 8.
Comparison of the marginal costs of building energy-saving design standards: (a) residential-building standards; (b) public-building standards [13,14,16,17].
During the medium energy-savings stage, that is, when the energy-savings rate of residential buildings increases from 75% to 87.5%, MC50,1 drops from 0.96 CNY/kWh·m2 to 0.57 CNY/kWh·m2, showing a decrease of approximately 40.6%. MC50,2 declines from 0.96 CNY/kWh·m2 to 0.36 CNY/kWh·m2, with a decrease of approximately 62.5%. When the energy-savings rate of public buildings increases from 72% to 82.5%, MC50,1 and MC50,2 decrease from 1.65 CNY/kWh·m2 to 1.09 CNY/kWh·m2 and 0.84 CNY/kWh·m2, respectively, with reduction rates of approximately 33.9% and 49.1%, respectively. At this stage, the energy-saving effect is remarkable because of the overall improvement and large-scale application of the insulation system of the envelope structure. From the perspective of the life cycle, the MC continues to decrease.
At the advanced energy-savings stage, for residential buildings with near-zero energy consumption, MC50,1 and MC50,2 are 0.92 and 3.28 CNY/kWh·m2, respectively. For public buildings with near-zero energy consumption, MC50,1 and MC50,2 are 1.53 and 2.31 CNY/kWh·m2, respectively. The prices of MC50,1 and MC50,2 for standard public buildings with zero energy consumption are 1.89 and 3.36 CNY/kWh·m2, respectively. At this stage, the increase in each standard MC50,2 is remarkable, indicating that if the building energy-savings rate is further enhanced after achieving near-zero energy consumption, the incremental cost of the building envelope will rise sharply. Amongst these, the residential building MC50,2 saw its energy consumption per square metre surge from 0.36 kWh·m2 in the medium-efficiency stage to 3.28 CNY/kWh·m2 in the high-efficiency stage (kWh·m2), primarily due to the adoption of short-lived, high-cost building materials such as VIP vacuum panels (with a 15-year service life) and triple-glazed composite windows (unit price of CNY 2500/m2) to meet near-zero-energy envelope thermal-transmission standards. This, ultimately, resulted in a sharp increase in the building’s life-cycle costs.
The marginal cost analysis indicates that ultra-low energy consumption standards (87.5% for residential and 82.5% for public buildings) represent the inflection point for achieving optimal economic efficiency. Compared to current mandatory standards (75% for residential and 72% for public), the marginal costs are significantly reduced by 40.6% and 49.1%, respectively, demonstrating the highest cost-effectiveness for implementing energy-saving measures at this stage. However, pursuing near-zero energy standards beyond this inflection point leads to a sharp increase in marginal costs due to the replacement expenses of high-performance materials (such as VIP panels). This finding provides a clear economic rationale for policy formulation and design decisions: prioritising the promotion of ultra-low-energy buildings represents the optimal strategy under current technological conditions for balancing long-term environmental benefits with short-term economic investment.
3.2. Multi-Objective-Optimisation Analysis
A comprehensive balance amongst building energy consumption, cost effectiveness, and indoor thermal comfort should be achieved to reduce the MC of energy-saving design for building envelope structures. Considering the computational resource requirements and time costs of the optimisation process, this study established the boundary conditions for the optimisation model based on prior research literature [61], as presented in Table 8. The stability and accuracy of the optimisation results were verified using the hypervolume method [62]. The hypervolume evaluation method is a key concept in multi-objective optimisation. It is used to measure the performance and quality of a set of solutions and is particularly important in evaluating the convergence and diversity of solution sets [63]. Figure 9 shows the convergence of the Pareto optimal solution sets for the residential/public prototype buildings. Both tend to stabilise after 30 generations, indicating that the optimisation process is effective and that the quality of the optimal solution set is good.

Table 8.
Multi-objective-optimisation boundary-condition settings.
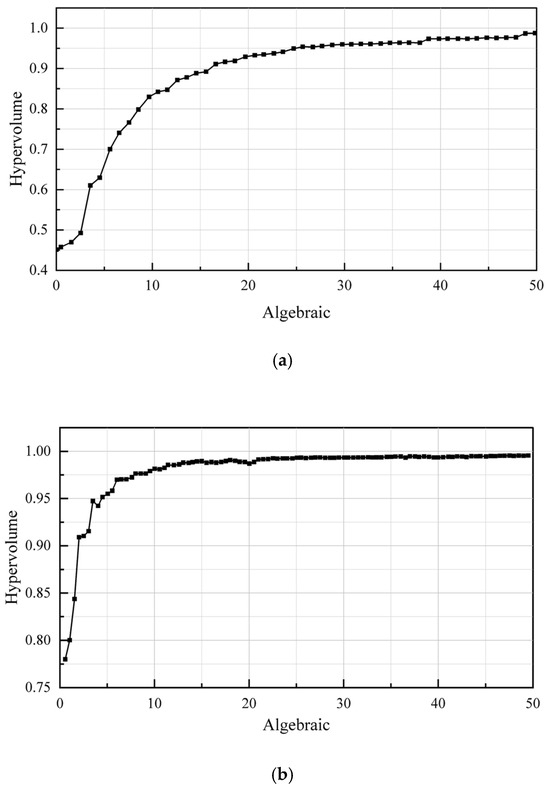
Figure 9.
Convergence of the solution set of the hypervolume evaluation method: (a) residential building; (b) public building.
3.2.1. Distribution of Solutions
Figure 10 presents the trade-offs before 3D objectives and the spatial distribution of the solutions in the multi-objective-optimisation process of the residential and public prototype buildings. In the Pareto frontier, the balance between building energy consumption and cost is prioritised whilst appropriately balancing indoor thermal comfort [64].
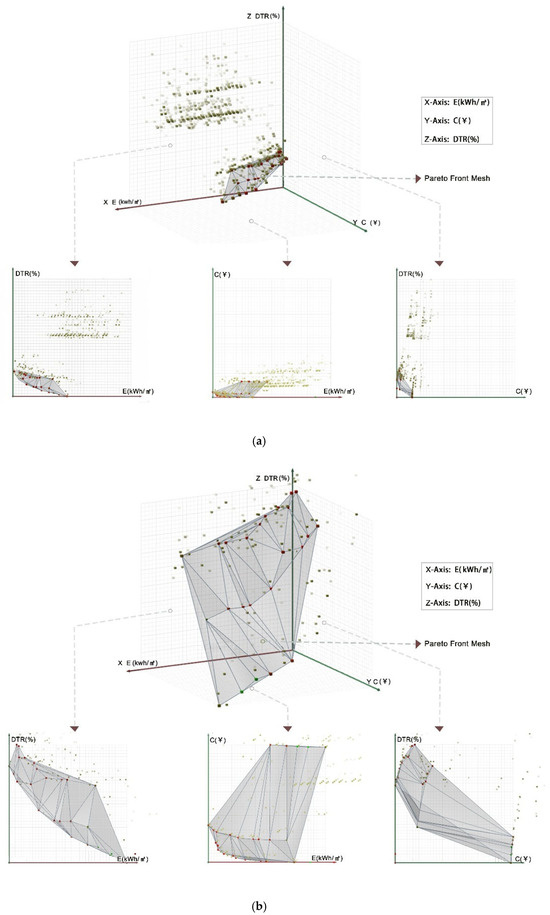
Figure 10.
Spatial distribution of the multi-objective-optimisation solution of the prototype buildings: (a) residential building; (b) public building.
Residential Building
Figure 11 shows a parallel coordinate plot of the Pareto optimal solution set for the residential prototype building. The solution set includes seven optimisation variables and three optimisation objectives [65]. As the number of optimisation generations increases, the values of the variables gradually concentrate within a certain interval. The darker the colour of the line, the larger the amount of data within that interval [66]. Table 9 presents the detailed data of the final optimisation results. The window-to-wall ratios in each orientation are concentrated in the middle range [67]. The insulation materials are expanded polystyrene (EPS) and extruded polystyrene, which are common options in the construction of residential buildings in China [68]. The optimal thicknesses of the exterior walls and the roof are roughly similar, although the walls are slightly thicker than the roof; this might be due to the difference in the optimisation results caused by the large heat-dissipation area of the walls [69]. The preferred types of exterior windows are aluminium-alloy window frames with thermal break + double-layer vacuum glass (3 + 0.3 V + 3) and aluminium-alloy window frames with thermal break + triple-pane composite laminated argon-filled insulating glass (5 T5 + 12 Ar + 5).
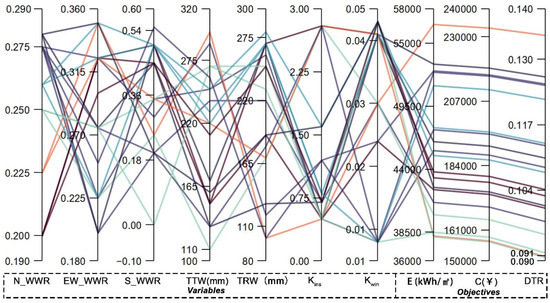
Figure 11.
Distribution of the Pareto optimal solution sets for residential prototype buildings.

Table 9.
Suggested optimisation intervals for residential prototype buildings.
Public Building
Figure 12 shows a parallel coordinate diagram of the Pareto optimal solution for the public prototype building. Similarly, the values of the seven optimisation variables gradually converge within a certain interval [70]. The darker the colour of the line, the larger the amount of data within that interval. Table 10 presents the detailed data of the final optimisation results. Unlike in the residential buildings, the window-to-wall ratio of each orientation in the public buildings is optimised only to the minimum limit value [71]. The types of insulation materials are EPS, rockwool (RW), and VIP. The lower-limit requirement for the thickness of external-wall-insulation materials is much higher than that for the thickness of the roof, which may be due to the spatial characteristics of large spaces and the high energy consumption in public buildings [72]. The optimisation results for the exterior-window types are divided into the following two categories: aluminium-alloy window frame with thermal break + ordinary double-layer insulating glass (5 + 12 A + 5) and aluminium-alloy window frame with thermal break + triple-pane composite laminated argon-filled insulating glass (5 T5 + 12 Ar + 5). The former is due to the relatively large window walls in office buildings, and the combination of aluminium-alloy window frame with ordinary double-layer insulating glass (5 + 12 A + 5) offers a substantial advantage in terms of construction cost.
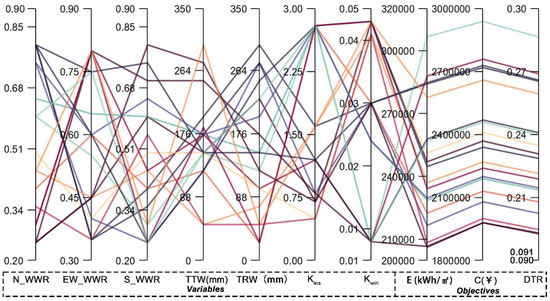
Figure 12.
Distribution of the Pareto optimal solution sets for public prototype buildings.

Table 10.
Suggested optimisation intervals for public prototype buildings.
3.2.2. Screening of Solutions
Firstly, the entropy weight method (Equations (8)–(10)) was adopted to objectively assign weights to the information entropy of the 3D target. The weights of the building energy consumption, cost, and indoor thermal comfort were calculated as follows: 33.37%, 33.26%, and 33.37%, respectively, for residential buildings and 33.34%, 33.40%, and 33.26%, respectively, for public buildings [73]. The weighting values for each evaluation criterion are comparable, indicating that the variability (data dispersion and fluctuation) in the energy consumption, cost, and thermal comfort is similar across both residential and public buildings. This suggests that these factors exert comparable influence on the overall evaluation outcome. Secondly, the TOPSIS evaluation method (Equations (11)–(13)) was adopted to measure the distance between the optimal solution set and the ideal solution and sort them. The closer the comprehensive score, is to 1, the better the scheme.
The optimal energy-saving design scheme for the envelope structure of residential buildings is as follows: the window-to-wall ratio limit is 0.25 for the north, 0.30 for the east and west, and 0.40 for the south. The insulation material for the envelope structure is EPS. The thickness of the external-wall-insulation layer is 200 mm, and the thickness of the roof-insulation layer is 150 mm. The structural selection of the exterior-window material is Window2, which is a broken-bridge aluminium window frame + double-layer vacuum glass (3 + 0.3 V + 3). The energy consumption per unit building area of this scheme is 21.11 kWh/m2, the construction cost is CNY 169,201.7, and the percentage of thermal discomfort time throughout the year is 19.78%. Compared with the benchmark building in the 1980s, the current building saves 87.6% energy, which complies with the provisions of DB13(J)/T 8359-2020 (Energy Efficiency Design Standard for Passive Ultra-Low Energy Residential Buildings) [12].
The optimal energy-saving design scheme for the envelope structure of public buildings is as follows: the window-to-wall ratio limit values are 0.40 for the north, 0.40 for the east and west, and 0.50 for the south. The insulation material for the envelope structure is RW, the thickness of the external-wall-insulation layer is 150 mm, and the thickness of the roof-insulation layer is 100 mm. The structural selection of the exterior-window material is Window5, which is a broken-bridge aluminium window frame + triple-pane composite laminated insulating glass (5 T5 + 12 Ar + 5). Although the unit price of RW is higher than that of EPS, it offers superior fire resistance. The higher initial cost of RW is offset by its durability, fire safety benefits, and enhanced indoor environmental quality over the entire life cycle, demonstrating the comprehensive feasibility of this solution across economic, safety, and environmental dimensions. For the recommended RW insulation material in public buildings, although its thermal conductivity (0.043 W/(m·K)) is slightly higher than that of EPS (0.041 W/(m·K)), it offers superior thermal stability and resistance to ageing. This ensures the thermal performance degradation rate of the building envelope remains lower than that of EPS insulation over the long term, thereby guaranteeing the stability of long-term energy-saving benefits. Furthermore, whilst RW entails higher initial costs, its extended service life enhances its whole-life economic viability. Consequently, RW demonstrates comprehensive feasibility across economic, energy, and thermal environmental dimensions. The energy consumption per unit building area of this scheme is 28.79 kWh/m2, the construction cost is CNY 2,757,300.00 and the percentage of thermal discomfort time throughout the year is 20.79%. Compared with the benchmark building, the current building saves 83% energy, which complies with the provisions of DB13(J)/T8360-2020 (Energy Efficiency Design Standard for Passive Ultra-Low Energy Public Buildings) [13].
4. Conclusions
This paper establishes a sustainable assessment framework for thermal parameters of energy-efficient building envelopes in cold regions of China, balancing energy conservation, economy, and thermal comfort. Based on marginal cost and the SPEA2 optimisation algorithm, the framework was developed. Research findings from Shijiazhuang demonstrate that the improvement in the building energy-savings rate has a nonlinear relationship with investment cost and provides a marginal benefit. When the standard energy-saving rates of residential and public buildings meet the energy-saving design standards for passive ultra-low energy consumption buildings, the marginal benefit of the energy-saving design for the envelope structure is optimal. When the energy-saving design standards continue to rise to near-zero or higher standards, the marginal cost keeps increasing. The best design scheme that considers building energy consumption, long-term economy, and indoor thermal comfort should be considered to avoid blindly pursuing the unilateral benefits of building energy conservation. This best design schemes are as follows:
- (1)
- Residential buildings: The window-to-wall ratio limit is 0.25 for the north, 0.30 for the east and west, and 0.40 for the south. The insulation material for the envelope structure is EPS, the thickness of the insulation material for the exterior walls is 200 mm, and the thickness of the insulation material for the roof is 150 mm. The structural selection of the exterior-window material is Window2, which is a broken-bridge aluminium window frame + double-layer vacuum glass (3 + 0.3 V + 3).
- (2)
- Public buildings: The window-to-wall ratio limit is 0.40 for the north, 0.40 for the east and west, and 0.50 for the south. The insulation material for the envelope structure is RW, the thickness of the insulation material for the exterior walls is 150 mm, and the thickness of the insulation material for the roof is 100 mm. The structural selection of the exterior-window material is Window5, which is a broken-bridge aluminium window frame + triple-pane composite laminated insulating glass (5 T5 + 12 Ar + 5).
Notably, as the building energy-consumption simulation results vary across cities due to differing climate data, the optimal design solutions derived herein cannot be directly applied to other cities in cold regions. However, the sustainable optimisation framework established in this paper can be directly applied to evaluate and optimise the thermal performance parameters of energy-efficient building envelopes in cities across various climate zones—including severe cold and cold regions—by adjusting the input values of urban climate data and thermal envelope parameters (optimisation variable thresholds). Moreover, this sustainable optimisation framework exhibits excellent adaptability. By adjusting the objective function, optimisation variables, and weighting system, decisionmakers can readily and accurately obtain optimal energy-efficient building design solutions for diverse climatic zones, building types, evaluation horizons, and decision-making preferences.
Author Contributions
Conceptualisation, Y.G. and Z.L.; methodology, Y.G.; software, Z.L.; validation, Y.G. and Z.L.; formal analysis, Z.L.; investigation, Z.L., Y.W., and Q.G.; resources, Y.G.; data curation, Z.L.; writing—original draft preparation, Z.L.; writing—review and editing, Y.G.; visualisation, Z.L.; supervision, Y.G.; project administration, Y.G.; funding acquisition, Y.G. All authors have read and agreed to the published version of the manuscript.
Funding
This research was funded by the National Natural Science Foundation of China (no. 51808179) and Science &Technology Program of Hebei (no. 21554501D).
Institutional Review Board Statement
Not applicable.
Informed Consent Statement
Not applicable.
Data Availability Statement
The data presented in this study are available upon request from the corresponding author.
Conflicts of Interest
The authors declare no conflicts of interest.
Abbreviations
| TA | Ambient temperature (°C) |
| WBGT | Wet-bulb globe temperature (°C) |
| TG | Globe temperature (°C) |
| LD | Linear dichroism |
| R.H. | Relative humidity (%) |
| K | Thermal transmittance |
| MC | Marginal cost |
| EPS | Expanded polystyrene |
| XPS | Extruded polystyrene |
| PU | Polyurethane |
| RW | Rock wool |
| VIP | Vacuum-insulated panel |
| SPEA2 | Strength Pareto Evolutionary Algorithm 2 |
| PMV | Predicted mean vote |
| TOPSIS | Technique for Order Preference by Similarity to an Ideal Solution |
| En | Comparison of energy consumptions for building energy design standards (kWh/m2) |
| Eb1 | Initial baseline building energy-efficiency design standard energy consumption (kWh/m2) |
| Eb2 | Energy-efficiency design standard energy consumption of adjacent buildings with lower energy-efficiency rates (kWh/m2) |
| Cn | Comparing the costs of building energy-efficiency design standards (kWh/m2) |
| Cb1 | Initial baseline building energy-efficiency design standard cost (CNY/m2) |
| Cb2 | Cost of energy-efficiency design standards for adjacent buildings with lower levels of energy-efficiency rates (CNY/m2) |
| MC50,1 | Marginal cost of initial baseline building energy-efficiency design standards (CNY/kWh·m2) |
| MC50,2 | Marginal cost of energy-efficiency design standards for neighbouring buildings at the lower level of energy-efficiency rates (CNY/kWh·m2) |
| N_WWR | North-facing window-to-wall area ratio |
| EW_WWR | Ratio of east- and west-facing window wall areas |
| S_WWR | South-facing window-to-wall area ratio |
| TTW | Thickness of external-wall insulation (mm) |
| TRW | Thickness of roof insulation (mm) |
| Kins | Heat-transfer coefficient of insulation material |
| Kwin | Heat-transfer coefficient of external windows |
| E | Energy consumption per unit area of building (kWh/m2) |
| C | Building cost (CNY) |
| DTR | Indoor discomfort time ratio (%) |
Appendix A
Appendix A.1. Range and Accuracy of the Instruments

Table A1.
Range and accuracy of the instruments.
Table A1.
Range and accuracy of the instruments.
| Name | AZ-8778 Black-Bulb Wet-Bulb Thermometer | TR-74Ui Temperature Recorder | Testo 425 Hot Bulb Anemometer | TRM-SCY Hand-Held Solar Radiometer |
|---|---|---|---|---|
| Resolution ratio | 0.1 °C 0.1% R.H. | 0.1 °C | 0.01 m/s | 1 W/m2 |
| Range | 0–100% R.H. TA/WBGT: 0–50 °C TG: 0–80 °C | 0.1 °C 0.1% R.H. | 0–20 m/s | 0–2000 W/m2 |
| Accuracy | ±3% R.H. TA: +0.6 °C TG: ±1 (indoor) ±1.5 (outdoor) | ±0.3 °C ±5.3% | ±0.3 m/s | <5% |
Appendix A.2. Operation Information of the Prototype Building

Table A2.
Operation information of the residential prototype building.
Table A2.
Operation information of the residential prototype building.
| Operating Parameter | Value |
|---|---|
| Heating setting temperature/(°C) | 18 °C |
| Refrigeration setting temperature/(°C) | 26 °C |
| 0.1 | |
| Room occupancy rate/% | 75 |
| Thermal resistance of winter personnel clothing/clo | 1.2 |
| Thermal resistance of summer personnel clothing/clo | 0.5 |
| Human metabolic rate/met | 1.0 |
| 0.5 | |
| Lighting power density/(W/m2) | 3 |
| Equipment power density/(W/m2) | 2 |

Table A3.
Operation information of the public prototype building.
Table A3.
Operation information of the public prototype building.
| Operating Parameter | Value |
|---|---|
| Heating setting temperature/(°C) | 20 °C |
| Refrigeration setting temperature/(°C)) | 26 °C |
| 0.05 | |
| Room occupancy rate/% | 80 |
| Thermal resistance of winter personnel clothing/clo | 1.2 |
| Thermal resistance of summer personnel clothing/clo | 0.7 |
| Human metabolic rate/met | 1.0 |
| 1.0 | |
| Lighting power density/(W/m2) | 6 |
| Equipment power density/(W/m2) | 2 |
Appendix A.3. Energy Consumption Verification
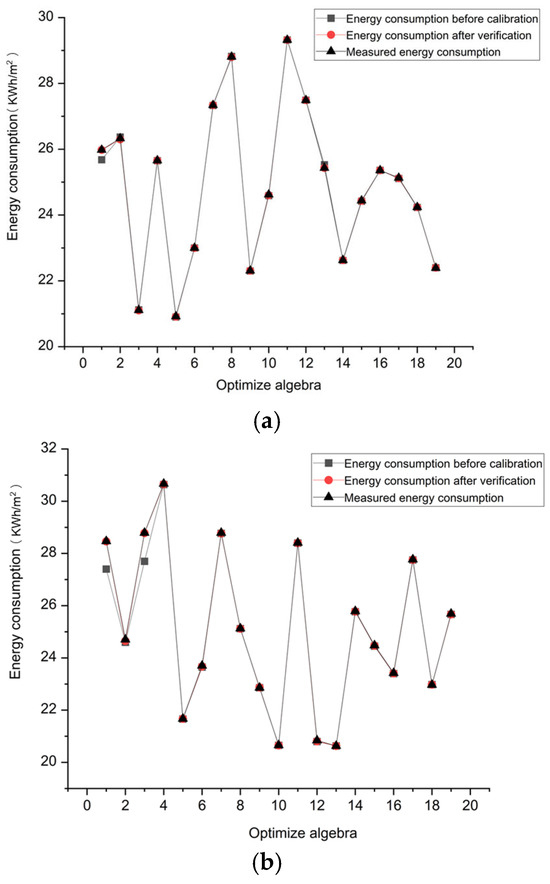
Figure A1.
Energy consumption verification: (a) energy-consumption verification for residential buildings; (b) energy-consumption verification for public buildings.
References
- National Bureau of Statistics of China. Communique of the People’s Republic of China on the National Economic and Social Development Statistics in 2024; China Statistics Press: Beijing, China, 2025. (In Chinese) [Google Scholar]
- Department of Building Energy Efficiency and Technology, Ministry of Housing and Urban-Rural Development. China Building Energy Efficiency Annual Development Research Report 2023; China Architecture & Building Press: Beijing, China, 2023. (In Chinese) [Google Scholar]
- Yan, D.; Hong, T.; Li, C.; Zhang, Q.; An, J.; Hu, S. A thorough assessment of China’s standard for energy consumption of buildings. Energy Build. 2017, 143, 114–128. [Google Scholar] [CrossRef]
- JGJ 26-1986; Energy Efficiency Design Standard for Civil Buildings (Heating Residential Buildings). China Architecture & Building Press: Beijing, China, 1986. (In Chinese)
- JGJ 26-1995; Energy Conservation Design Standard for Civil Buildings: Heating Residential Buildings Part. China Architecture & Building Press: Beijing, China, 1995. (In Chinese)
- GB 50189-2005; Design Standard for Energy Efficiency of Public Buildings. China Architecture & Building Press: Beijing, China, 2005. (In Chinese)
- GB 50189-2015; Design Standard for Energy Efficiency of Public Buildings. China Architecture & Building Press: Beijing, China, 2015. (In Chinese)
- JGJ 26-2010; Design Standard for Energy Efficiency of Residential Buildings in Severe Cold and Cold Zones. China Architecture & Building Press: Beijing, China, 2010. (In Chinese)
- DB13(J) 185-2015; Design Standard for Energy Efficiency of Residential Buildings in Hebei Province (75% Energy-Saving). China Architecture & Building Press: Beijing, China, 2015. (In Chinese)
- JGJ 26-2018; Design Standard for Energy Efficiency of Residential Buildings in Severe Cold and Cold Zones. China Architecture & Building Press: Beijing, China, 2018. (In Chinese)
- China’s Ministry of Housing and Urban-Rural Development (MOHURD). Technical Guidelines for Passive Ultra-Low Energy Green Buildings (Trial Implementation in Residential Buildings); China Architecture & Building Press: Beijing, China, 2015. (In Chinese) [Google Scholar]
- DB13(J)/T 8359-2020; Passive Ultra-Low Energy Consumption Residential Building Energy Efficiency Design Standard. China Architecture & Building Press: Beijing, China, 2020. (In Chinese)
- DB13(J)/T 8360-2020; Passive Ultra-Low Energy Consumption Public Building Energy Efficiency Design Standard. China Architecture & Building Press: Beijing, China, 2021. (In Chinese)
- GB/T 51350-2019; Standard for Near Zero Energy Buildings. China Architecture & Building Press: Beijing, China, 2019. (In Chinese)
- GB/T 50378-2019; Assessment Standard for Green Building. China Architecture & Building Press: Beijing, China, 2019. (In Chinese)
- GB 55015-2021; General Code for Building Energy Conservation and Renewable Energy Utilization. China Architecture & Building Press: Beijing, China, 2021. (In Chinese)
- DB13(J)/T 8535-2023; Zero-Energy Public Building Design Standard. China Architecture & Building Press: Beijing, China, 2023. (In Chinese)
- Liu, X.; Hewings, G.J.D.; Wang, S. Evaluation on the impacts of the implementation of civil building energy efficiency standards on Chinese economic system and environment. Energy Build. 2009, 41, 1084–1090. [Google Scholar] [CrossRef]
- Lang, S. Progress in energy-efficiency standards for residential buildings in China. Energy Build. 2004, 36, 1191–1196. [Google Scholar] [CrossRef]
- Lyu, H.; Herring, D.; Chen, H.; Zhou, S.; Zhang, J.; Wang, L.; Zuo, Z.; Andrews, J.; Spill, F.; Ninic, J.; et al. A Data-Driven Multi-Objective Optimisation Framework for Energy Efficiency and Thermal Comfort in Flexible Building Spaces. Energy Build. 2025, 346, 116100. [Google Scholar] [CrossRef]
- Xie, H.; Yu, Z.; Wu, J. The current situation and problems in China’s building energy efficiency. Procedia Eng. 2011, 21, 1145–1151. [Google Scholar] [CrossRef][Green Version]
- Guo, C.; Bian, C.; Liu, Q.; You, Y.; Li, S.; Wang, L. A new method of evaluating energy efficiency of public buildings in China. J. Build. Eng. 2022, 46, 103776. [Google Scholar] [CrossRef]
- Liu, X.; Zhang, J.; Qin, B.; Wang, H.; Zhu, T.; Ye, Q. Research on the knowledge demands of multiple subjects for energy efficiency improvement in Chinese public buildings. Energy Build. 2023, 300, 113611. [Google Scholar] [CrossRef]
- Wang, X.; Feng, W.; Cai, W.; Ren, H.; Ding, C.; Zhou, N. Do residential building energy efficiency standards reduce energy consumption in China? A data-driven method to validate the actual performance of building energy efficiency standards. Energy Policy 2019, 131, 82–98. [Google Scholar] [CrossRef]
- Bu, W.; Ren, S. Does economic growth target constraint put pressure on green energy efficiency? Evidence from China. Environ. Sci. Pollut. Res. 2023, 30, 31171–31187. [Google Scholar] [CrossRef]
- Teng, S.; Wu Xing, Z.; Kun, Z. Research on the optimisation design model of rural residential buildings in the northwest cold regions under multi-objective conditions. Heat Sci. Technol. 2024, 23, 300–310. (In Chinese) [Google Scholar]
- Dong, X.L.; Cheng, X.L.; Fu, Z. Multi-objective optimisation design method and application of near zero energy buildings in cold regions. Build. Sci. 2024, 40, 205–212. (In Chinese) [Google Scholar]
- Xiaofei, Z. Multi-objective optimisation research on building envelope of near zero energy buildings in northwest regions. Integr. Smart Energy 2024, 46, 81–90. (In Chinese) [Google Scholar]
- Hua, Z.; Zhang, L.; Zhang, S.; Yang, S.; Liu, C. Multi-objective coordinated optimization of low-carbon building energy systems based on high renewable energy penetration. J. Build. Eng. 2024, 96, 110577. [Google Scholar] [CrossRef]
- Kilis, V.; Ploskas, N.; Panaras, G. Investigation of multi-objective decision making approaches for the optimization in building envelope thermal design. Sustain. Energy Technol. Assess. 2025, 82, 104506. [Google Scholar] [CrossRef]
- Li, L.; Zu, S.; Miraba, S.; Dehkordi, S.A.H.H.; Mehr, A.K.; Baghoolizadeh, M.; Baghaie, S.; Marzouki, R. Multi-objective optimization of building performance: Integrating sensitivity analysis for energy efficiency and comfort. Int. Commun. Heat Mass Transf. 2025, 165, 109009. [Google Scholar] [CrossRef]
- Tadeu, S.; Rodrigues, C.; Marques, P.; Freire, F. Eco-efficiency to support selection of energy conservation measures for buildings: A life-cycle approach. J. Build. Eng. 2022, 61, 105142. [Google Scholar] [CrossRef]
- Dranka, G.G.; de Lima, J.D.; Setti, D.; Oliveira, G.A.; Trentin, M.G.; Sirota, T.R.S.; Ferreira, P. Towards a rational framework for economic and risk assessment of energy efficiency projects. Sustain. Energy Technol. Assess. 2025, 73, 104090. [Google Scholar] [CrossRef]
- Akyüz, M.K. Enviroeconomic optimization of insulation thickness for building exterior walls through thermoeconomic and life cycle assessment analysis. Case Stud. Therm. Eng. 2025, 65, 105606. [Google Scholar] [CrossRef]
- Li, S.; Gou, Z. Energy efficiency and cost benefits of office-to-residential building transformation: Insights from Los Angeles. J. Build. Eng. 2024, 98, 111496. [Google Scholar] [CrossRef]
- Hajare, A.; Elwakil, E. Integration of life cycle cost analysis and energy simulation for building energy-efficient strategies assessment. Sustain. Cities Soc. 2020, 61, 102293. [Google Scholar] [CrossRef]
- Gao, C.; Chen, M.; Yu, Z. Technical and economic analysis of near zero energy public buildings in cold climate zones. Build. Sci. 2019, 35, 72–181. (In Chinese) [Google Scholar]
- Xiaobo, W.; Jia, Y. Sensitivity and economic analysis of rural building energy conservation in cold regions. New Build. Mater. 2024, 51, 76–81. (In Chinese) [Google Scholar]
- Robert, V.K.; Daryle, W.M. Determining sample size for research activities. Educ. Psychol. Meas. 1970, 30, 607–610. [Google Scholar] [CrossRef]
- Shijiazhuang Municipal Bureau of Statistics. Shijiazhuang Statistical Yearbook 2023; China Statistics Press: Beijing, China, 2023. (In Chinese) [Google Scholar]
- Jiang, Z. Research on the Evolution of Spatial Structure and Economic Effects of City Clusters in China; Jilin University: Changchun, China, 2024. (In Chinese) [Google Scholar]
- GB 50352-2019; Unified Standard for Civil Building Design. China Architecture & Building Press: Beijing, China, 2019. (In Chinese)
- GB 50096-2025; Residential Design Code. China Architecture & Building Press: Beijing, China, 2025. (In Chinese)
- Peng, Q. Frictions in the Labor and Education Markets, Between-Group Inequality and Economic Growth in China. Ph.D. Thesis, Shanghai University of Finance and Economics, Shanghai, China, 2022. (In Chinese). [Google Scholar]
- Ministry of Housing and Urban-Rural Development of the People’s Republic of China. Standard for Repair of External Thermal Insulation Systems for Building Walls; China Architecture & Building Press: Beijing, China, 2016. (In Chinese) [Google Scholar]
- Zitzler, E.; Thiele, L. Multi-objective evolutionary algorithms: A comparative case study and the strength Pareto approach. IEEE Trans. Evol. Comput. 1999, 3, 257–271. [Google Scholar] [CrossRef]
- Chen, Y. Technical and economic cost analysis and research of building envelope for residential buildings in cold regions based on 75% energy-saving and fire prevention design requirements (Part 1). New Wall Mater. Build. Energy Conserv. 2017, 62–64. (In Chinese) [Google Scholar]
- Hao, Y.H. Energy consumption simulation and cost increment analysis of economical ultra-low energy consumption buildings—Take Building 9 of Hebei Construction Technology Research and Development Center as an example. Build. Energy Conserv. 2018, 46, 134–145. (In Chinese) [Google Scholar]
- Chang, S. Analysis and evaluation of incremental costs and benefits of green buildings throughout their life cycle. China Rubber Tire Resour. Compr. Util. 2024, 51–53. (In Chinese) [Google Scholar]
- China Association for Engineering Construction Standardization. Application Technical Regulations for Building RW Products; China Planning Press: Beijing, China, 2016. (In Chinese) [Google Scholar]
- Qun, L.; Wei, Z. Research on the Service Performance of Vacuum Insulation Panels; Building Energy Efficiency Research Center, Tsinghua University: Beijing, China, 2024; pp. 15–28. (In Chinese) [Google Scholar]
- Ministry of Housing and Urban-Rural Development of the People’s Republic of China. Technical Regulations for Application of Building Glass; China Architecture & Building Press: Beijing, China, 2015. (In Chinese) [Google Scholar]
- Wang, L.; Chen, J.; Liu, X. Multi-objective optimisation of building envelope design in cold regions: A case study in North China. Build. Environ. 2023, 228, 109923. [Google Scholar]
- IEA. Technology Roadmap: Energy-Efficient Building Envelopes; IEA Publications: Paris, France, 2023. [Google Scholar]
- DB13 (J) 185-2020; Energy-Saving Design Standard for Residential Buildings. Hebei Science and Technology Press: Shijiazhuang, China, 2020. (In Chinese)
- GB/T 50034-2024; Building Lighting Design Standard. China Architecture & Building Press: Beijing, China, 2024. (In Chinese)
- GB 50736-2012; Code for Design of Heating, Ventilation and Air Conditioning for Civil Buildings. China Architecture & Building Press: Beijing, China, 2012. (In Chinese)
- Xie, X.; Xu, B.; Fei, Y.; Chen, X.-N.; Pei, G.; Ji, J. Passive energy-saving design strategy and realization on high window-wall ratio buildings in subtropical regions. Renew. Energy 2024, 229, 120709. [Google Scholar] [CrossRef]
- Moharrami, M.; Sadeghifam, A.N.; Golzad, H.; Aminudin, E.B.; Ata, S.S.M.; Kamyab, H. The hybrid attic ventilation technique as a sustainable strategy for thermal comfort improvement and energy saving in tropical residential buildings. Energy Convers. Manag. X 2025, 26, 100944. [Google Scholar] [CrossRef]
- Ibrahim, A.J.; Zangana, D.D.; Liu, S.; Samuelson, H.; Yang, L. Impacts of climate change on energy-saving sensitivity of residential building envelope design parameters in three hot-dry cities. J. Build. Eng. 2024, 99, 111481. [Google Scholar] [CrossRef]
- Weng, L. An Improved SPEA2 Algorithm Based on Local Search. Res. Comput. Appl. 2014, 31, 2617–2619+2639. (In Chinese) [Google Scholar]
- Zhao, T.; Jiang, B.; Li, Y.; Rezgui, Y.; Zhang, C.; Wang, P. Multi-point temperature or humidity prediction for office building indoor environment based on CGC-BiLSTM deep neural network. Build. Environ. 2025, 267, 112259. [Google Scholar] [CrossRef]
- Zhong, W.; Schröder, T.; Bekkering, J. Biophilic design in architecture and its contributions to health, well-being, and sustainability: A critical review. Front. Arch. Res 2022, 11, 114–141. [Google Scholar] [CrossRef]
- Ning, X.; Fiaidhi, A.; Abdulahi, S.; Khordehbinan, M.W. A Comprehensive Review of Nanoparticle Incorporation in Construction and Architecture Materials: Impacts on Properties, Performance, and Sustainability. Iran. J. Chem. Chem. Eng. 2024, 43, 1–45. [Google Scholar]
- Fatima, I.; Lago, P. Software Architecture Assessment for Sustainability: A Case Study. In Software Architecture, Proceedings of the 18th European Conference, ECSA 2024, Luxembourg, 3–6 September 2024; Springer Nature: Cham, Switzerland, 2024; pp. 233–249. [Google Scholar]
- Ahmad, T.; Stephan, A.; Purwaningrum, R.D.A.; Gulzar, S.; De Vecchi, R.; Ahmed, M.; Candido, C.; Sadek, A.H.; Qrayeiah, W. Practices contributing to building sustainability: Investigating opinions of architecture students using partial least squares structural equation modeling. J. Build. Eng 2024, 96, 110391. [Google Scholar] [CrossRef]
- Oestreich, M.; Ewert, I.; Becker, M. Small molecule autoencoders: Architecture engineering to optimize latent space utility and sustainability. J. Cheminform. 2024, 16, 26. [Google Scholar] [CrossRef]
- Ahmadisakha, S.; Andrikopoulos, V. Mining for sustainability in cloud architecture among the discussions of software practitioners: Building a dataset. In Software Architecture, Proceedings of the European Conference on Software Architecture 2024 Tracks and Workshops, Luxembourg, 3–6 September 2024; Springer Nature: Cham, Switzerland, 2024; pp. 150–166. [Google Scholar]
- Haddad, T.; Kumarapeli, P.; de Lusignan, S.; Barman, S.; Khaddaj, S. Advancing Healthcare Sustainability: Embracing MACH Architecture for Health IT System Transformation. Stud. Health Technol. Inform. 2024, 316, 1565–1566. [Google Scholar]
- Beyaz, Ç.; Erçin, Ç. Evaluation of Modern Architecture Criteria in the Context of Sustainability and Architectural Approach; Modern Period in North Nicosia. Sustainability 2023, 15, 10005. [Google Scholar] [CrossRef]
- Sari, L.H.; Wulandari, E.; Idris, Y. An investigation of the sustainability of old traditional mosque architecture: Case study of three mosques in Gayo Highland, Aceh, Indonesia. J. Asian Arch. Build. Eng. 2023, 23, 528–541. [Google Scholar] [CrossRef]
- Hossain, M.S. Concurrent Product and Supply Chain Architecture Design Considering Modularity and Sustainability. Ph.D. Thesis, University of New South Wales, Sydney, Australia, 2023. [Google Scholar]
- Abyaa, Z.; El Harrouni, K.; Degron, R. Characterizing Sustainability and Assessing Biophilic Design in Vernacular Architecture: Case of Kasbahs and Ksour in South of Morocco. Sustainability 2025, 17, 4680. [Google Scholar] [CrossRef]
Disclaimer/Publisher’s Note: The statements, opinions and data contained in all publications are solely those of the individual author(s) and contributor(s) and not of MDPI and/or the editor(s). MDPI and/or the editor(s) disclaim responsibility for any injury to people or property resulting from any ideas, methods, instructions or products referred to in the content. |
© 2025 by the authors. Licensee MDPI, Basel, Switzerland. This article is an open access article distributed under the terms and conditions of the Creative Commons Attribution (CC BY) license (https://creativecommons.org/licenses/by/4.0/).