Abstract
This article focuses on the negative evaluation losses resulting from consumers’ dissatisfaction with the traceability level in agricultural product logistics activities. Based on the supply chain (SC) under the “agricultural product cooperative + live-streaming e-commerce” model, and in accordance with previous research, combined with the differences in the dominant role and the bearers of profit and loss in the SC. By applying Stackelberg game theory, different types of decisions are analyzed and solved. The research results show: (1) Centralized decision-making has advantages in terms of traceability level and SC profit performance. (2) In non-centralized decision-making models, when manufacturers bear negative evaluation losses and retailers act as the leaders of the SC, the overall decision-making effect is more ideal. When manufacturers or retailers act as the leaders of the SC and both bear the traceability costs, the decision-making effect is basically the same. (3) The traceability level sensitivity coefficient and the traceability level effect on traceability both have positive effects on the growth of SC profits and the improvement of the traceability level. (4) The maximization of profits for both parties can be achieved through the coordination of contracts. This study can enhance the traceability level of the agricultural product SC, encourage SC members to increase their investment in the traceability, reduce the profit impact from negative evaluations, and provide a reference for the sustainable development of the agricultural product SC.
1. Introduction
Agricultural product traceability issues not only impact food safety and health but also trigger a crisis of trust in the entire agricultural industry [1]. In recent years, the emergence of cases of “tainted eggs,” “clenbuterol,” and “tainted milk powder” around the world has further underscored the need for effective agricultural product traceability [2]. Agricultural product traceability can realize traceability and management of all links in the supply chain (SC) [3]. When the traceability level cannot meet market demand, it will seriously hinder the development of the agricultural product SC. These incidents directly highlight the current importance of effective agricultural product traceability. In the market, unmet consumer demands can lead to negative word-of-mouth, switching to competing products, and complaints, all of which negatively impact company profits [4]. For example, in the agricultural product SC, unmet consumer demand for traceability can reduce perceived value and purchase intention, further impacting company profits [5,6]. At the same time, unclear traceability information can also lead to negative reviews, indirectly impacting profits [7]. A case study in 2022, which focused on an e-commerce platform, revealed that a merchant specializing in imported fruit received 150 negative reviews in a single week due to a failure to provide key traceability information, such as harvest time and temperature control in cold chain logistics. The store’s rating plummeted from 4.7 out of 5 to 3.2, resulting in a 40% drop in sales (approximately 800,000 yuan) that month and a 20% churn rate among existing customers.
The above cases show that the lack of traceability not only brings direct economic losses but also reflects that, in the context of consumption upgrading, consumers’ demand for traceability of agricultural products is becoming increasingly strong. As the quality of life improves, consumers take pleasure in paying higher costs for agricultural products that meet their expectations to obtain better services. Moreover, due to the diverse demands for agricultural products, they pay more attention to their origin and safety and thus rely on traceability. However, at present, the issue of traceability for agricultural products is prominent. Key data related to production and transportation are often missing, and consumers also lack convenient traceability channels, resulting in a low level of traceability. When consumers’ demands in this regard are not satisfied, they tend to leave negative comments on platforms such as the Internet, which not only undermines brand trust but also damages SC’s profits. Hence, attaching importance to the traceability of agricultural products and reducing negative consumer evaluations are of vital importance to the harmonization and sustainable growth of the agricultural product SC.
Considering the many challenges currently encountered by the agricultural product SC regarding traceability, this study will investigate how to improve the traceability level of agricultural products through optimizing SC decisions and lessening the influence of negative assessments on SC performance. The traceability level is selected as the decision variable because it not only improves the SC visibility but also greatly affects the market requirements for agricultural products. At the same time, the traceability level is in line with the development trend and demand of the modern agricultural product SC. The research objectives of this paper are as follows:
Firstly, starting from the traceability level and negative consumer evaluations, explore their impact on the choice-making and performance of the agricultural product SC.
Secondly, in accordance with the differences in cost-bearing entities and decision-making (DM) sequences, solve for the best choice equilibrium solution of the SC under diverse power structures.
Finally, design a joint coordination contract intended to facilitate Pareto improvement within the SC, strengthen the cooperative relationship among members, and enhance the overall SC profitability.
To sum up, the study conducted in this paper can respond to the questions listed below:
- In various SC models, what equilibrium results will be achieved by the decisions made by each member?
- What is the impact on the SC when the order of SC leaders and DM is different?
- What is the impact of the traceability level effect and the traceability level sensitivity coefficient on the SC?
- How should the inner mechanism of SC contract coordination be explored, and how can the rationality of the coordination function be validated?
The paper is organized as follows: The introduction establishes the research context. A literature review then summarizes previous research findings and foundational results. The methodology section introduces the research approach and describes the problem. The subsequent analysis addresses five SC models and compares their equilibrium solutions. Furthermore, through the design of a joint contract to coordinate a decentralized DM model, the inherent mechanisms of contract coordination are explored in depth. Numerical simulations verify the model’s effectiveness and coordination efficiency, demonstrating its practical significance. Finally, the paper concludes with key findings.
2. Literature Review
2.1. The Importance of Agricultural Product Traceability
It carries considerable importance to improve the agricultural product traceability. From the perspective of consumers, the ability to determine the agricultural product traceability can effectively prevent fraudulent behaviors such as adulteration and counterfeiting and ensure the protection of their rights and interests. From the perspective of enterprises, it helps maintain a fair competitive market environment and promotes the healthy development of the industry [8]. Many scholars have conducted the following investigations into the agricultural product traceability. Within the domain of food safety, the agricultural products traceability is a crucial step for the SC, as it can track the transit route of agricultural products and record information related to their components, which is an important measure to ensure food safety, authenticity, and traceability [9]. Li et al. [10] and Lv et al. [11] proposed that agricultural product traceability is a vital means to maintain the value of food.
Agricultural products are closely tied to public health, stability in society, and national protection [12]. In the relevant research in the field of agricultural products, Gomez et al. [13] proposed that agricultural product traceability can enable all participants within the SC to secure equitable profits. Lin [14] and Zhang [15] also emphasized that the agricultural product traceability is a key means to maintain the safety-assured quality of agricultural products. In terms of meeting consumers’ demands, Gao et al. [16] believed that the agricultural products traceability can satisfy consumers’ need for controllable product risks. Garaus and Treiblmaier [17] studied the impact of agricultural product traceability on retailers and pointed out that traceable agricultural products can enhance consumers’ trust. Wang et al. [18] pointed out that agricultural product traceability can control the quality of agricultural products throughout the entire process from the field to the table, ensuring product safety. Li et al. [19] emphasized that improving the agricultural product traceability can solve the problems of insufficient safety and transparency, while enhancing the consumers’ purchasing experience.
2.2. The Impact of Online Reviews and How Companies Can Respond to Negative Reviews
The degree to which consumers’ traceability demands are met directly affects their evaluation of agricultural products, while online reviews shape potential consumers’ perception of the products. Therefore, consumers’ feedback on enterprises’ products and services has become an important factor that cannot be ignored in enterprise management [20]. Considering the impact of online evaluation on product image, corporate reputation, and SC management, many scholars have conducted research on related topics. Pee [21] emphasized that negative online reviews are inevitable and will remain in consumers’ minds for a longer time and may also harm product sales. Varga et al. [22] proposed that when consumers are exposed to negative online reviews, these reviews often prompt them to look for alternative products. Hu [23] found that when consumers make purchasing decisions, online reviews can help them more effectively evaluate the character and properties of products or services. Certain scholars investigated the effect of online evaluations on consumer behavior and corporate brand image through mathematical modeling. Kollmer et al. [24], Alzate et al. [25], and Roman et al. [26] used mathematical methods such as statistical tests, text mining, and validity analysis to verify that online reviews affect consumers’ purchasing intentions and their perceptions of companies. Ordabayeva et al. [27] believed that external negative comments in online reviews can strengthen identity-related brand preferences. Qin et al. [28] found that positive online reviews can enhance consumers’ emotional trust and further stimulate their willingness to buy. Duan et al. [29] found that online reviews can supplement product and service information and are more likely to win the trust of potential consumers than information provided by sellers. These studies collectively indicate that online reviews, as an important information carrier in the e-commerce environment, not only directly influence consumers’ purchasing decisions but also affect the status of enterprises and products in consumers’ minds.
Negative comments have a greater impact on life [30]. Many scholars have proposed various solutions to deal with negative evaluations. Zhang et al. [31] suggested that a customized language style could be adopted to prioritize responses to negative online comments. Chen et al. [32] believed that when facing negative feedback from consumers, it is necessary to adopt active and effective measures such as giving out coupons, proactively contacting consumers, and promptly handling the situation. Pooja et al. [33] pointed out that highly credible online reviews can offset some of the adverse effects brought by negative reviews. Kapes et al. [34] proposed that when responding to users’ negative comments, personalized responses should be given to users to the greatest extent. Zhang et al. [35] found that users’ negative emotions can be addressed by enhancing the timeliness of the logistics SC. Yuan et al. [36] proposed that enterprises can effectively mitigate the negative impact of negative evaluations on their brand image by releasing remedial information.
2.3. Analysis of Different Cost-Sharing Models
In the SC, there has always been considerable controversy over who should bear different types of costs. Under different SC DM models and in light of the diverse research objects of various scholars, the bearers of different types of costs also vary. Wang et al. [37] studied the situation in which manufacturers bear the costs related to carbon emission rights and curbing carbon emissions in the background of carbon quotas. Wu et al. [38] applied the knowledge of game theory and established a model in which manufacturers bear green input costs when studying the problem of green SCs under random demand. Li et al. [39] developed a model in which advertisement expenditure costs are entirely borne by retailers, while green R&D costs are entirely borne by manufacturers. Xu et al. [40] considered the situation where manufacturers simultaneously bear the costs of preservation efforts and low-carbon input in addressing the issues of the agricultural food SC. Nakhaeinejad et al. [41] proposed that when considering the issue of sustainable SC development, the costs of green quality of products should be borne by manufacturers, while the costs of promotional efforts for products should be borne by retailers. Kong [42] studied the investment in blockchain technology costs, which are borne by the three stakeholders in the SC.
In the relevant research on reverse logistics, Wen et al. [43] created a model in which retailers and third parties bear the cost of waste product recycling to explore the impact of the differences in recycling quality on the DM of dual-channel SCs. Meanwhile, Wan et al. [44] studied the issue of manufacturers bearing the four core costs of remanufacturing: material recycling, new material production, purchasing old products from retailers, and investing in remanufacturing technology research and development. Zhang et al. [45] proposed that for the closed-loop SC of product greenness, manufacturers should bear the green product research and development cost, while the third-party recycler alliance should bear the fixed investment cost of recycled waste.
2.4. Supply Chain Optimization Research
Judging from the existing study findings, the SC optimization field has accumulated a relatively rich set of research methods. Various scholars have suggested different optimization approaches and solutions from diverse viewpoints. Multi-objective fuzzy linear programming, as a mature method for solving uncertainty problems, was adopted by Lo et al. [46] and Sutthibutr et al. [47] to assist decision-makers in optimizing the entire SC network. Furthermore, Sharif et al. [48] adopted “a novel method integrating group multi-criteria decision-making and interval Type 2 fuzzy set” in optimizing the food SC. Esteso et al. [49] proposed a multi-objective mathematical programming model for the agricultural product food SC, which achieves the SC coordination by simultaneously maximizing its financial gains and the average freshness of horticultural product sales. As the competitive behaviors of traditional manufacturers and retailers tend to fall into local optima and fail to find the global optimal solution, Li et al. [50] proposed that the government should take intervention measures to optimize the SC.
In addition, game theory has also been widely applied in SC optimization problems. On the basis of differential game theory, researchers Jiang et al. [51] and Shu et al. [52], respectively, constructed SC optimization models, revealing the optimal DM mechanism under multi-agent interaction and promoting the achievement of the maximum collective benefits of the SC. Zhang et al. [53] also employed the research method of evolutionary game theory to elaborate on the strategic choice issues of manufacturers and retailers from the three levels of government, enterprises, and consumers, ultimately reaching SC optimization. By using the Stackelberg game theory, Qiao et al. [54] and Shen et al. [55] optimized the SC by designing cost-sharing contracts. Lv et al. [56] studied the optimal SC decisions by comparing three recycling channels.
Overall, the existing research mainly focuses on different types of agricultural products, their backgrounds, and consumer preferences, exploring issues such as the agricultural product traceability and SC sustainable development from two aspects: literature review and model establishment. Among them, one type of research, through literature review and trend analysis, summarized the current situation and challenges of agricultural product traceability, but most of them lacked specific model construction and empirical support. Another type of research attempts to establish mathematical models, such as demand functions and profit functions, and uses tools like game theory to examine the pricing models and optimization strategies within the SC. However, many studies have not fully considered the role of manufacturers in cost assumptions or ignored variable costs. Future research can further optimize the model construction and cost-sharing mechanism to achieve Pareto improvement in the agricultural product SC and enhance the applicability of its DM model in real-world scenarios. Table 1 is a brief survey of prior research.

Table 1.
Survey of Prior Research.
The prior research mainly has the subsequent deficiencies:
Firstly, in the research of agricultural product SCs, there is a lack of systematic contrast of various models, and the effect of negative evaluation losses and DM sequences on SC members’ decisions and profit distribution remains insufficiently considered.
Secondly, the current studies have not thoroughly considered the consequences of the agricultural product traceability level on consumer demand and the overall profit of the SC, nor have they linked the traceability level with online evaluation.
Finally, previous studies have paid less attention to the comparative analysis of SC profit distribution when different actors bear costs and have failed to deeply explore the differentiated impact of cost-bearing models on SC choices.
This paper’s innovation, in contrast to existing research, is as follows:
Firstly, based on consumers’ online evaluations, this article takes the beneficial effect of traceability levels on the agricultural product SC into account and introduces the negative evaluation costs into the model, providing new inspirations for the optimization and sustainable development of the agricultural product SC, and also making the research conclusions closer to practical applications.
Secondly, this study establishes a centralized decision framework together with multiple non-centralized decision models, explicitly accounting for the distinctions between SC leaders and the entities responsible for bearing traceability costs, and the optimal decisions, and systematically compares SC profit situations under different models. By comparing the non-centralized DM models, the differentiated consequence of the DM sequence and cost-bearing mode on the members’ behavior is clarified, providing theoretical guidance and practical reference for managers in formulating scientific decisions.
3. Research Methodology
3.1. Methodology Introduction
As a non-cooperative game model, the Stackelberg game captures strategic interactions in which players make decisions sequentially. In this model, the leader takes the initiative, and followers respond based on the leader’s decisions. The leader formulates its own strategy by predicting the followers’ optimal response functions, thereby gaining a first-mover advantage. Based on Stackelberg game theory, decisions are made sequentially by SC members, and the leader taking the first action can forecast the decision information of the follower. Stackelberg game theory employs a backward induction approach, reasoning and induction backward hierarchically according to the strategic sequence. Its key steps include: first, once the follower observes the leader’s decision, it makes a choice aimed at maximizing its own interests; then, after predicting the follower’s decision response, the leader formulates its own optimal decision.
Numerous scholars have utilized this method in their research on SC optimization and coordination. Zhang and Qu [57] focused on green SC issues, employing cost-sharing and revenue-sharing coordination contracts to optimize the SC. Xu et al. [58] used a dual-channel green SC game model to study SC pricing strategies in various power structures. Wei et al. [59] examined various SC decisions and suggested that SC members collectively take on corporate social responsibility to achieve optimization. Zhang et al. [60] explored the optimization of SCs under carbon trading policies by selecting different cost-sharing models based on internal and external carbon prices. Alzoubi et al. [61] put forward a two-level game model to compare three SC coordination structures, aiming to offset the negative impact of tariffs through the use of well-designed subsidies. Chen et al. [62] compared and analyzed the profits of e-commerce retailers with and without blockchain technology from dual channels, proposing that the use of agency sales agreements can achieve Pareto improvements in SCs. In summary, previous research on Stackelberg games provides important references for the design and operation of this model and lays a theoretical foundation for our research.
3.2. Problem Description
The main focus of this paper is a two-tier agricultural product SC system, comprising agricultural product cooperatives and live-streaming(LS) e-commerce. Among them, the cooperatives are responsible for supplying agricultural products to LS e-commerce and determining the acquisition price of agricultural products, while LS e-commerce is responsible for selling and determining the market price of agricultural products. Consumers can check whether the agricultural products they purchase meet their needs through the QR code on the purchased agricultural products or other channels. During this process, consumers have a strong demand for transparency of agricultural products. If cooperatives and LS e-commerce can do a good job in the agricultural product traceability, it can greatly stimulate consumers’ purchasing desire, drive up the volume of agricultural products purchased by consumers, and ultimately augment the total profit of SC. Simultaneously, if the agricultural products purchased by consumers do not meet their own needs or their traceability requirements are not met, it may lead to negative reviews of the agricultural products by consumers, which in turn also affects the profitability of the SC. Figure 1 depicts the SC relationship.
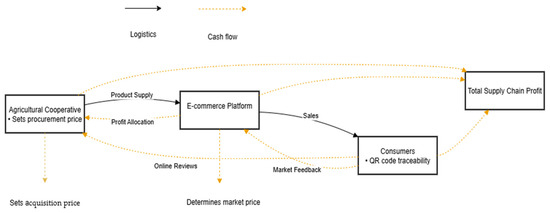
Figure 1.
Supply Chain Relationship Description.
As can be seen from Figure 1, consumers hold a perception of the agricultural product traceability level. When the traceability level fails to meet their expectations, negative evaluations may occur. Meanwhile, when potential consumers come across negative reviews of products on the Internet, their purchase intention may significantly decrease. Such negative evaluations will further affect the stability of the cooperation between cooperatives and LS e-commerce, and ultimately be detrimental to the sustainability of the agricultural product SC.
The study explores diverse models, including one centralized DM model and several non-centralized DM models. Within these, the centralized DM model is defined as the joint DM of cooperatives and LS e-commerce to strive for maximizing the total profit of the SC, and to jointly bear the costs of agricultural product traceability and the loss of negative evaluations. The non-centralized DM model is defined as the situation where different leaders in the SC and different bearers of traceability costs make decisions successively among SC members. Table 2 presents the classification and symbolic description of the SC DM model.
Table 2.
Classifying and Describing Supply Chain DM Models.
Table 3 outlines the parameter descriptions for the model.
Table 3.
Meaning table of each parameter of the model.
Some assumptions are made in this paper:
Assumption 1.
Without loss of generality, the reference research [12] showed that the relationship of the traceability level () with the input cost () can be assumed as: , where is a constant. This indicates that increasing the traceability level will lead to an increase in traceability costs. This study will discuss two scenarios: one in which this cost is borne by the cooperative and the other in which it is borne by the LS e-commerce merchant.
Assumption 2.
Traceability enhances consumer trust by providing transparent information, thereby reducing the negative review rate caused by information asymmetry. Drawing on Zhang et al.’s [63] research on the relationship between fresh produce return rates and preservation efforts, and in light of the context of this study, we assume that the relationship of negative review rate with the traceability level is , where represents the initial negative review rate (i.e., the negative review rate without traceability), and represents the traceability level effect, measuring the ability of a unit of traceability level to suppress negative reviews.
Assumption 3.
The demand for agricultural products in the market is impacted by both the retail price and the traceability level . A price increase generally leads to a decrease in demand, while a higher traceability level stimulates demand growth. Reference [64] expressed market demand as: , where parameters satisfy , .
Assumption 4.
Both cooperatives and LS e-commerce companies are rational decision-makers and have a neutral attitude towards risks.
In light of the assumptions above, the profit functions of different DM models are expressed as follows ( denotes the cooperative’s profit, denotes the LS e-commerce’s profit, and denotes the overall profit of the SC):
When the cooperative bears the traceability costs:
When LS e-commerce bears the traceability costs:
The total SC profit and agricultural product market demand are:
Equation (5) comprises four parts: (i) the first part refers to the profit that the cooperative derives from trading agricultural products to LS e-commerce; (ii) the second part refers to the profits LS e-commerce makes from trading agricultural products; (iii) the third part is the loss from negative evaluations; (iv) the fourth part is the traceability costs.
4. Model Solution and Analysis
This part solves and analyzes different SC decision models, assuming that the following conditions are always satisfied:
4.1. TT Model
The TT model is a representation of a centralized DM model. Within the centralized DM framework, cooperatives and LS e-commerce collaborate on decisions, with no conflict of interest among SC members. Both cooperatives and LS e-commerce are taken into account as a whole. The objective of the SC members is to enhance the total profit of the SC. In this model, the profit function is expressed as:
Theorem 1.
The equilibrium solution
of the agricultural product SC in the TT model can be obtained as follows:
Proof of Theorem 1.
The first-order derivative of with respect to and are given below:
Based on and , we can easily derive the second-order Hessian matrix of as follows:
Under this condition (M1), is jointly concave with respect to and , implying that has an optimal solution. By letting and , the solutions for and are derived as follows:
Substituting and into and yields and , and then we complete the proof. □
4.2. MM Model
In the MM model, the cooperative, as the leader of the SC, bears the traceability costs and negative review losses, while the LS e-commerce acts as the follower of the SC. The cooperative sets the acquisition price and traceability level of agricultural products according to market demand and its own interests to maximize its profit within the SC. Subsequently, LS e-commerce determines the agricultural products market prices according to the acquisition price and traceability level set by the cooperative to maximize its own profits. The following equilibrium solution represents the final decision made by the members in the agricultural product SC after the game.
Theorem 2.
The equilibrium solution of the agricultural product SC in the MM model can be obtained as follows:
Proof of Theorem 2.
In this model, the cooperative first determines the traceability level and purchase price of agricultural products, and the LS e-commerce follows up with the pricing. The problem is solved through backward induction:
First, take the first-order derivative of for and we get:
It can be known that it follows that it is a concave with respect to , and has an optimal solution. Let we can derive:
Substituting into , we obtain:
The first-order derivatives of with respect to and are:
By using and , we can easily derive the second-order Hessian matrix of with respect to and as follows:
Under this condition (M2), is jointly concave with respect to and , implying that has an optimal solution. By letting and , the solutions for and are derived as follows:
When we substitute and into , we get:
Finally, substituting the equilibrium solutions , and into , , and , , , and can be obtained, and then we complete the proof. □
4.3. RM Model
In the RM model, the cooperative, as the SC leader, bears the loss of negative reviews and takes the lead in determining the acquisition price of agricultural products. As a follower, LS e-commerce bears the costs of traceability. Based on the acquisition prices set by cooperatives, combined with market demand and traceability investment, they make decisions regarding both the market prices of agricultural products and the traceability levels. The following equilibrium solution represents the final decision made by the members in the agricultural product SC after the game.
Theorem 3.
The equilibrium solution
of the agricultural product SC in the RM model can be obtained as follows:
Proof of Theorem 3.
In the RM model, the cooperative, taking the lead in the SC, determines the agricultural product acquisition price first. As a follower, LS e-commerce optimizes the final market price and traceability level based on the cooperative’s pricing, combined with market preferences and traceability demands. The steps for solving by backward induction are as follows:
First, take the first-order derivative of and for , respectively, we can obtain:
According to and , we can easily derive the second-order Hessian matrix of with respect to and as follows:
Under this condition (M3), is jointly concave with respect to and , implying that has an optimal solution. By letting and , the solutions for and can be derived as follows:
Substituting the solved and into , the cooperative profit function can be obtained as:
To find the first-order derivative of with respect to as:
Obviously, , then under the condition (M4), has an optimal value. Let , then we can solve as follows:
Substitute into and , solving for and as:
Finally, by substituting the equilibrium solutions , and into , , and , , , and can be obtained, and then we complete the proof. □
4.4. MR Model
In the MR model, LS e-commerce is the leader of the SC and is the first to determine the market price of agricultural products. As the followers of the SC, cooperatives bear the negative evaluation losses and traceability costs. They will set the acquisition price of agricultural products and the traceability level according to the market prices of LS e-commerce. The following equilibrium solution represents the final decision made by the members in the agricultural product SC after the game.
Theorem 4.
The equilibrium solution
of the agricultural product SC in the MR model can be obtained as follows:
Proof of Theorem 4.
In the MR model, LS e-commerce first determines the market price of agricultural products. Then, the cooperative determines the acquisition price and the agricultural product traceability level according to the market price set by LS e-commerce. Let , where represents the profit obtained from selling each unit of agricultural products. Given this situation, the respective profits of the cooperative and the LS e-commerce operator are:
The first-order derivative of with respect to and are:
According to and , we can derive the second-order Hessian matrix of with respect to and as follows:
Under the condition (M1), is jointly concave with respect to and , implying that has an optimal solution. By letting and , the solutions for and can be obtained as follows:
Substituting and into , we obtain:
Calculate the first-order derivative of with respect to :
Let , then we can get
Substituting the solved into and yields:
Because , we can get the sales price :
Finally, substituting , and into , , and lead to , , and . Then, the equilibrium solution of the agricultural product SC in the MR model is proven. □
4.5. RR Model
In the RR model, LS e-commerce, as the SC leader and bearing the traceability costs, initially determines the market price and the agricultural product traceability level. Cooperatives, as followers, bear the costs of negative reviews and determine the acquisition price of agricultural products based on the market price and traceability level set by LS e-commerce. The following equilibrium solution represents the final decision made by the members in the agricultural product SC after the game.
Theorem 5.
The equilibrium solution
of the agricultural product SC in the RR model can be obtained as follows:
Proof of Theorem 5.
In the RR model, LS e-commerce first determines the market price and the agricultural product traceability level. On the basis of the market price and traceability level set by the LS e-commerce platform, the cooperative then determines its acquisition price for agricultural products. Let , then the profits of the cooperative and the LS e-commerce are, respectively:
Differentiating with respect to yields:
Obviously, . Thus , it has an optimal solution. Let , then we can solve
Substituting into yields:
The first-order derivatives of and with respect to are:
From and , it can be concluded that the second-order Hessian matrix of with respect to and is:
Under the condition (M2), is jointly concave with respect to and , implying that has an optimal solution. By letting and , the solutions for and can be derived as follows:
Substituting and into yields:
Because we can get the sales price :
Finally, by substituting , and into , , and , , , and can be obtained. Then we complete the proof. □
4.6. Model Equilibrium Analysis
This section conducts a comparison of the optimal decisions across various SC models and obtains Theorems 6 to 12 through Proof. Theorems 6 to 10 discuss the differences in profits, traceability levels, revenue gaps between leaders and followers, market prices, and market demand among the different models of the SC. Theorems 11 and 12 discuss the influence of (traceability level effect) and (traceability level sensitivity coefficient) on SC DM. Combining the Hessian matrix under different decision types in the previous text to draw the conclusion of , the following propositions can be derived.
Theorem 6.
,
.
Proof of Theorem 6.
Let , and we get .
□
Remark 1.
As indicated in Theorem 6, the centralized DM mode brings higher SC profit compared to all non-centralized alternatives. Among the non-centralized models, the MR model generates a higher profit compared to the other three.
Theorem 7.
,
.
Proof of Theorem 7.
□
Remark 2.
As stated in Theorem 7, the centralized DM model results in the highest traceability level for agricultural products. Among non-centralized DM models, the MR model attains a superior agricultural product traceability level than the RM model and MM model, while the traceability level of the MM model is on par with that of the RR model.
Theorem 8.
,
,
,
Proof of Theorem 8.
□
Remark 3.
Theorem 8 indicates that in the non-centralized DM models, in the SC, the member in the leading position has more advantages in the interest game and obtains more profits than its followers.
Theorem 9.
,
.
Proof of Theorem 9.
When and , it can be concluded that:
□
Remark 4.
Theorem 9 indicates that in the TT model, higher total profit and traceability level can be achieved, while the market price can also remain at a relatively low level. SC managers should give priority to DM models that can optimize resource allocation and increase overall profits. At the same time, they should maintain price stability through effective market pricing strategies, thereby enhancing the collaborative efficiency and market competitiveness of the SC.
Theorem 10.
,
.
Proof of Theorem 10.
□
Remark 5.
Theorem 10 indicates that in the TT model, cooperatives and LS e-commerce are an integrated whole. The market pricing they carry out does not involve the speculative behavior of middlemen, and the market price is more consistent with how the market actually operates. Consumers are more willing to purchase agricultural products that can be traced back.
Theorem 11.
(1)
,
, , , ;
(2)
, , , , .
Proof of Theorem 11.
Obviously, we have
Similarly, we can get: , , , , , , , □
Remark 6.
Theorem 11 suggests that across various SC DM models, the increased sensitivity of consumers to the traceability level will increase their purchasing desire, thus boosting the total profit of the SC. The agricultural product traceability level sensitivity coefficient and the traceability level effect exert a positive effect on the overall profit of the SC.
Theorem 12.
(1) ,
,
,
,
;
(2)
,
,
,
,
.
Proof of Theorem 12.
Obviously, we have
Similarly, we can get: , , , , , , , . □
Remark 7.
Theorem 12 indicates that in different SC DM models, it is necessary to actively respond to consumers’ preferences for the traceability level. The agricultural product traceability level is proportional to the traceability level sensitivity coefficient and the traceability level effect.
5. Joint Coordination Contract
According to the research conclusions above, the centralized DM model outperforms the other four non-centralized ones in terms of SC profit level. In this section, we coordinate one of the decentralized DM models by introducing a joint contract, taking the MM model as an example. In the agricultural product SC, cooperatives need to invest a large amount of traceability costs in the early stage. Moreover, as the traceability level improves, the initial investment costs show an upward trend. A large amount of initial investment will dampen the enthusiasm of cooperatives for cooperation. To enhance the willingness of cooperatives to cooperate, strengthen the stability of collaboration among SC members, and expand the demand of the consumer market, LS e-commerce and cooperatives can achieve coordinated development by signing coordination contracts. The coordination contract requires LS e-commerce companies to share part of the profits with cooperatives, with the sharing ratio being , and to help cooperatives share part of the traceability costs required, with the sharing ratio being . As a case of decentralized DM, the main reasons for choosing the MM model are as follows: Firstly, the cooperative-led SC model is widely present in reality and has strong representativeness; Secondly, the DM behavior in this model clearly demonstrates the non-cooperative game characteristics of non-centralized DM within the SC; Finally, the profit dispersion issue revealed by the MM model serves as an entry point for researching the coordination mechanism of SC contracts. The objectives of introducing the joint coordination contract are: (1) To increase the overall profit of the agricultural product SC; (2) To enhance the agricultural product traceability level throughout the entire logistics process; (3) To boost the profit levels of every member within the SC. The main contents of the joint contract include cost sharing of SC traceability, benefit sharing, and acquisition price discount. Meanwhile, cooperatives need to lower the acquisition prices of agricultural products, which can also indirectly bring profits to LS e-commerce. The profit situations of cooperatives and LS e-commerce are outlined below (The joint contract coordination model is represented by the JJ Model):
Theorem 13.
Under the joint coordination contract, in the agricultural product SC, the traceability level and market price are:
Proof of Theorem 13.
Find the first-order derivative of with respect to . Let , and solve for:
To solve for , we can substitute into and then set , and thus obtain:
□
Theorem 14.
When the introduced parameter
and
satisfy the conditions listed below, the profit of the agricultural product SC attains the optimal level, which signifies that the SC realizes coordination
Proof of Theorem 14.
When and , we can obtain the relationship of , and . □
Theorem 15.
In accordance with the principle of self-executing constraints, if the scope of the acquisition price meets the subsequent inequality, the cooperative’s earnings and those of LS e-commerce under the joint coordination contract can be improved. Under the current conditions, every participant in the SC is willing to agree to the contract.
Among them:
Proof of Theorem 15.
To guarantee equitable profit assignment among the members of the agricultural product SC within the collaborative cooperation framework, an effective profit coordination mechanism needs to be established, so that the profits obtained by each participant after collaborative DM are not lower than the profit level when they make independent decisions. Hence, it must satisfy: , . From this, the range of can be obtained. □
Theorem 15 demonstrates that within the agricultural product SC, the cooperative is tasked with managing the traceability level and assumes the corresponding traceability costs, when meets the above scope, it can ensure that the profits obtained by the cooperative and the LS e-commerce in the SC within this scope can be higher than the decisions established in the context of the non-centralized DM model, that is, the joint coordination contract is capable of realizing the SC’s Pareto optimization.
6. Case Analysis
This section verifies the conclusions already drawn above through case studies, referring to the research in reference [65], and furthermore explores the disparities among different SC models in conjunction with the practical situation of the agricultural product SC. The specific parameter settings are shown in Table 4. All parameter selections meet the following conditions:
Table 4.
Parameter assignment table.
- The selection of parameters aligns with the actual circumstances of the agricultural product market as much as possible.
- The established parameters satisfy all the assumptions of model construction mentioned in the preceding content.
- , , ;
6.1. Model Analysis
On the basis of parameter assignment, Table 5 below provides the acquisition price, market price, traceability level, and demand volume of the agricultural product SC, in addition to the profits of cooperatives, LS e-commerce, and the total profit of the SC under different types of SC DM models.
Table 5.
Decision Practices and Profit Scenarios Across Diverse SC Models.
The following analysis can be obtained based on Table 5:
- (1)
- As a characteristic of the centralized DM mode, there is a game with aligned interests in the DM process, and all SC members collaborate with each other. Its core objective is the maximization of the SC’s overall profit. That is why the TT model achieves the highest profit and the best traceability level in the SC.
- (2)
- Although both are cooperative-led SCs, in the RM model, the cooperative can only make up for the negative evaluation losses by controlling the acquisition price. In the MM model, cooperatives bear the negative evaluation losses and traceability costs, and can enhance the traceability level to meet consumers’ traceability demands. To compensate for these costs, cooperatives boost sales by enhancing traceability levels and lowering acquisition prices.
- (3)
- In the SC where cooperatives bear the traceability costs, under the MR model, LS e-commerce is the dominant player in the SC. It can expand its market share by selling goods at low prices and in high volumes, and requires a high traceability level to enhance the competitiveness of the SC. Within the MM model, cooperatives independently determine the acquisition price and bear the traceability costs. To cover their costs, cooperatives will proactively raise the acquisition price to ensure their own profit maximization.
- (4)
- Regarding the MM model and the RR model, while the entities responsible for bearing traceability costs differ and the SC leaders vary, the decision regarding the traceability level is consistently made by the SC leader. The similarity between market prices and traceability level mainly stems from the commonality between consumers’ market expectations and traceability needs. The difference in acquisition prices stems from the different bearers of traceability costs, which leads to adjustments in pricing strategies.
- (5)
- In the RM model, LS e-commerce bears the traceability costs, but the dominant player is the cooperative. It needs to increase the acquisition price to cover the traceability costs and the negative evaluation loss it bears. Therefore, LS e-commerce tends to raise the market price to stabilize its own profits. Within the RR model, LS e-commerce takes the leading role in the SC and determines the traceability level. To meet consumers’ traceability demands, it will proactively enhance the traceability level.
- (6)
- Both are SCs dominated by LS e-commerce. In the MR model, LS e-commerce decides on market prices and does not bear traceability costs. They are more willing to adopt low market prices to capture market share and may force cooperatives to enhance traceability levels. Additionally, cooperatives also need to set higher acquisition prices to offset traceability costs and negative evaluation losses.
- (7)
- When LS e-commerce platforms bear the traceability costs, they usually tend to reduce investment in traceability to achieve the goal of cost control. Meanwhile, LS e-commerce may pass on some traceability costs to other members, which also leads to an increase in market prices.
Table 6.
Performance comparison and analysis of different DM models.
6.2. Sensitivity Analysis
Sensitivity analysis was conducted on parameters and an in-depth study was conducted on the impact of the traceability level effect and the traceability level sensitivity coefficient on decisions within the SC. Figure 2 reflects that, regardless of whether centralized DM or non-centralized DM is adopted, the traceability level effect and the traceability level sensitivity coefficient have a positive promoting effect on SC profits. Compared with non-centralized DM, centralized DM leads to superior profitability.
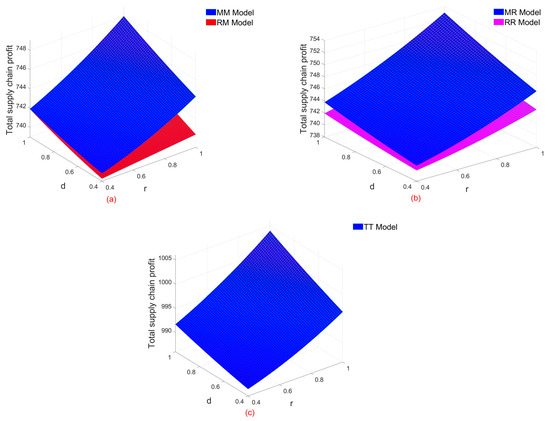
Figure 2.
The effect of and on SC profits. (a) Total profit of MM model and RM model supply chain; (b) Total profit of MR model and RR model supply chain; (c) Total profit of TT model supply chain.
In the agricultural product SC, the traceability level effect and the traceability sensitivity coefficient have a favorable influence on the SC’s total profit. The traceability level effect reflects the operational efficiency and information transparency of the traceability mechanism. Improving this can enhance consumer trust, promote purchasing behavior, and ultimately increase profits. It can also effectively reduce negative reviews and mitigate market losses caused by unmet traceability needs. The traceability sensitivity coefficient reflects consumers’ perception of changes in the transparency of traceability information. High sensitivity means that consumers are more inclined to choose products with higher transparency, and this directly fosters an increase in the profits of the SC. Therefore, the combination of an appropriate traceability level effect and traceability level sensitivity coefficient can not only enhance consumers’ purchasing intention but also optimize SC profits and promote the SC’s sustainable development.
Figure 3 and Figure 4 show the relationship between the traceability level, the traceability level effect, and the traceability level sensitivity coefficient within the different SC DM models. The traceability level is positively correlated with the traceability level effect and the traceability level sensitivity coefficient.
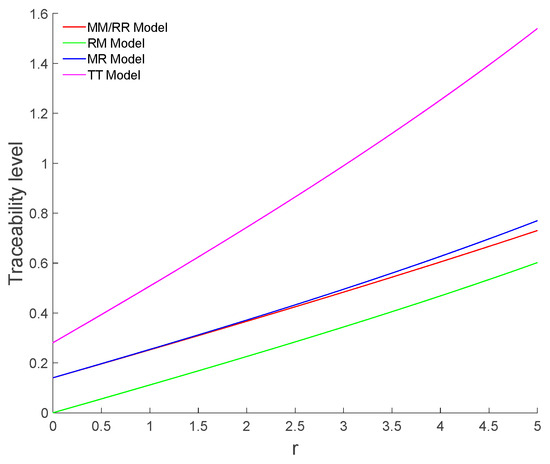
Figure 3.
The influence of on the traceability level.
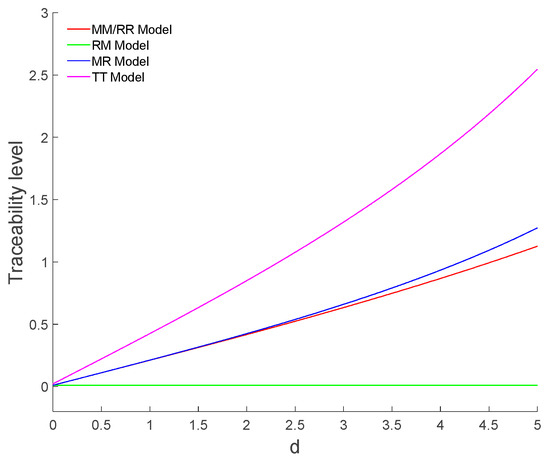
Figure 4.
The influence of on the traceability level.
The traceability level effect and traceability sensitivity coefficient both have a positive impact on the traceability level. Improving the traceability level effect directly improves the accuracy and transparency of the traceability system, laying the foundation for higher traceability levels. A higher traceability sensitivity coefficient indicates a stronger consumer demand for traceability information, incentivizing SC companies to continuously improve their traceability levels to meet market expectations. Therefore, in the agricultural product market, where consumer sensitivity is high, companies along the SC should increase their investment in traceability to enhance their SC’s competitiveness.
In summary, the traceability level effect and traceability sensitivity coefficient play a significant role in improving SC profits and traceability performance. On the one hand, they enhance SC profits by influencing consumer trust and purchasing preferences; on the other hand, they improve traceability levels by optimizing and strengthening market demand feedback. Therefore, SC members should focus on improving the visibility of agricultural products throughout the entire process to better meet consumer traceability needs and optimize overall SC performance.
6.3. Verification of the Effect of the Coordination Contract
On the premise of reaching a coordination contract, in accordance with the parameter configurations outlined earlier, the applicable scope of agricultural product acquisition prices is [1.3539, 2.7141]. Within this range, the SC’s total profit exceeds the profit obtained during the non-centralized DM process, and the earnings of each member on the chain are no less than the profits before contract coordination. Therefore, they are also willing to accept the contract to attain valid coordination of the SCs for agricultural products. With the increase in the acquisition price, the profits of the cooperative show a downward trend. Thus, intending to advance lasting and balanced partnerships between cooperatives and LS e-commerce platforms within the SC, the setting of agricultural product acquisition prices needs to be maintained within this range. Judging from the evolution trend of the data in the Table 7, when the acquisition price is not within the range of [1.3539, 2.7141], the profits obtained by the members in the SC are no higher than those before the contract coordination, and the coordination contract becomes invalid. This also verifies the rationality of Theorem 15.
Table 7.
The changes in profits before and after contract coordination.
Although the fluctuation of the acquisition price in [1.3539, 2.7141] produces no substantial difference in the SC’s total profit situation or the outcomes of contract coordination, it has affected the distribution of benefits between cooperatives and LS e-commerce. The acquisition price is determined by the negotiating advantages of the cooperative and LS e-commerce. The party with a bargaining advantage can obtain higher profits by adjusting the acquisition price. On the one hand, it is important to note that all parties in the SC must strictly abide by the terms of the contract to ensure the effective operation of the coordination mechanism. On the other hand, as rational decision-makers, all parties should actively use their bargaining power within the contractual framework to strive for the best economic returns for themselves. It is worth noting that for members of the agricultural product SC to achieve more profits, deeper cooperation between cooperatives and LS e-commerce is an inevitable choice for both sides.
For the purpose of further testing the effectiveness of the coordination contract put forward in Section 5, this paper combines the parameter assignment situation and draws Figure 5. From the results shown in Figure 5, the total profit function of the agricultural product SC has a unique global optimal solution. This numerical optimal solution is consistent with the theoretical expression in Table 5, which confirms the correctness of the decision model in this paper from the perspective of numerical calculation.
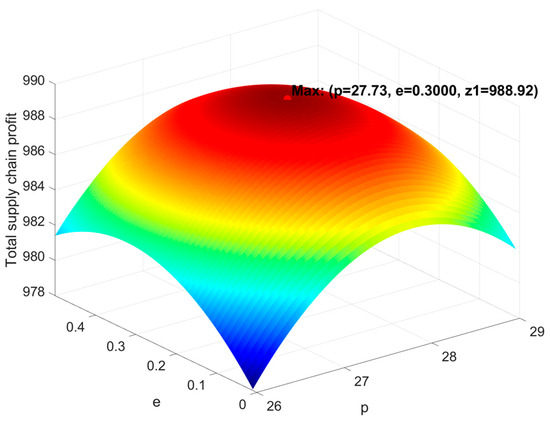
Figure 5.
The effect of and on SC profits.
The rise in agricultural product prices has driven a continuous improvement in the total profit of the SC. This relationship is clearly reflected in Figure 5, indicating that a higher market price can significantly enhance the SC profits. However, if the price is too high, it may lead to a decrease in demand, thereby affecting the profits. Meanwhile, with the improvement of the agricultural product traceability level, profits also show an increasing trend, indicating that the improvement of the traceability level can enhance consumer trust, thereby increasing demand and raising profits. However, when the traceability level reaches a certain level, the growth of profits gradually flattens out. This might be because the increase in traceability costs begins to offset the benefits it brings. Overall, research shows that agricultural product market prices and traceability levels have a significant impact on SC profits through a synergistic mechanism, and the superposition effect of the two further amplifies this impact.
6.4. Discussion
The sustainable development of the agricultural product SC is inseparable from the collaborative cooperation between cooperatives and LS e-commerce. Through case analysis, the following insights can be drawn: First, agricultural product traceability is the key to attracting consumers to buy and increasing SC profits. All parties in the SC should prioritize the development of agricultural product traceability and improve overall benefits through joint investment and information sharing, especially in the current highly competitive market. Consumers are increasingly sensitive to agricultural product traceability, which directly affects their purchasing decisions. References [8,17] also show that traceable agricultural products can enhance consumers’ trust in products, prompt them to make purchasing decisions, and enhance the competitiveness of the SC. Secondly, the traceability level effect and traceability level sensitivity coefficient have a positive impact on SC performance and traceability levels. Existing studies have also shown that a good traceability system has an important impact on food quality, safety, and agricultural product quality assurance. For example, references [10,11] point out that the effective implementation of agricultural product traceability can ensure food safety and preserve food value. Reference [18] also pointed out that agricultural product traceability can achieve quality control of agricultural products from the farmland to the table. Therefore, agricultural product traceability not only improves the efficiency of SC operation but also provides enterprises with new opportunities for differentiated development in the fierce market competition. Finally, the design of coordination contracts has a significant impact on the holistic SC operational capacity, enhancing its stability and operational efficiency. The optimization of the SC through the design of coordination contracts is consistent with previous research findings [54,55]. The contract mechanism provides institutional guarantees for cost sharing and profit distribution within the SC, helps consolidate partnerships, enhance system resilience, and thus promote the long-term and stable development of the SC.
7. Conclusions
In order to ensure that the agricultural products they purchase meet their own needs, consumers have increased their attention to and demand for agricultural product traceability information. Given that suppliers and retailers play the role of core stakeholders in the agricultural product SC, this study explores a typical scenario within the theoretical framework of the Stackelberg game: a two-echelon SC system consisting of an agricultural product cooperative and a live e-commerce platform. It also considers the attractiveness of traceability levels to consumers and the impact of consumers’ online reviews on the agricultural product SC, taking SC profits and traceability levels as key indicators. To deeply explore this issue, this paper first adopts the conventional analysis method. Without introducing the contract model, it compares the DM of different SC models. Then, the agricultural product SC is optimized by introducing the coordination contract, and the validity and feasibility of the model were verified through case analysis. This article summarizes the following main conclusions and management implications:
- (1)
- In the agricultural product SC, centralized DM significantly enhances traceability capabilities and overall profits through system collaboration and information integration, demonstrating the management advantage of optimizing resource allocation. On the one hand, members in the SC can implement unified procurement, planning, and distribution, reducing resource waste and efficiency losses caused by multi-level DM. On the other hand, centralized DM is more suitable for promoting a value proposition of low price and high quality, which aligns with consumers’ demands for high cost-effectiveness and traceability of agricultural products.
- (2)
- The total SC profit, market demand for agricultural products, traceability level, and market price of the MM model and the RR model can all remain consistent. However, the cooperatives in the MM Model can make up for the losses through transfer payments, resulting in their acquisition prices being higher than those in the RR model. Among the four non-centralized DM models, the total SC profit of the MR model is the highest, and this result is also verified through case analysis. The total profit and the agricultural products traceability level under all SC decision models are all positively correlated with the traceability level effect and the traceability level sensitivity coefficient.
- (3)
- SC managers can optimize the cooperative relationships among members in the SC by designing coordination contracts. Introducing appropriate contract parameters can ensure that when certain conditions are met, members in the SC can achieve maximum benefits and transfer profits by adjusting the acquisition price. Core enterprises in the SC can establish incentive-compatible contractual mechanisms to coordinate the interests of members and prevent the stability of cooperation from being affected by unfair distribution. At the same time, efforts should be made to promote the reengineering of SC processes, taking into account fairness and sustainability while pursuing efficiency, in order to achieve a common improvement in system resilience and competitiveness.
- (4)
- Within the same SC DM model, followers often earn lower profits than leaders. This phenomenon highlights the crucial influence of power structure on profit distribution. To enhance overall competitiveness and collaborative efficiency, SC members must not only strengthen cooperation but also actively strive for DM leadership to improve their bargaining position. Within the constraints of coordination contracts, companies must rationally utilize their bargaining power and optimize profit distribution mechanisms to promote sustainable SC development.
The limitations of this paper are: First, the model focuses mainly on traceability and fails to fully cover all factors that affect consumer evaluation. Second, the theoretical conclusions have not been empirically tested, and their practical applicability needs further exploration.
In our future study, we will mainly consider the following research topics: (1) incorporating different parameters into the model to better reflect the complexity of agricultural product SCs; (2) applying typical agricultural product SC cases and providing empirical data to analyze actual SC operations to enhance the practical value of this research.
Author Contributions
Formal analysis, H.R.; writing—original draft preparation, Y.G., H.R., and X.H.; writing—review and editing, Y.G., H.R., and X.H.; funding acquisition, X.H. All authors have read and agreed to the published version of the manuscript.
Funding
This research was funded by Jiangxi Humanities and Social Science Research Project, grant number GL24108.
Institutional Review Board Statement
Not applicable.
Informed Consent Statement
Not applicable.
Data Availability Statement
Data is contained within the article.
Conflicts of Interest
The authors declare no conflicts of interest.
References
- Yao, Q.; Zhang, H.J. Improving agricultural product traceability using blockchain. Sensors 2022, 22, 3388. [Google Scholar] [CrossRef] [PubMed]
- Zhang, X.W.; Lin, J.Z.; Li, Z.H.; Yao, Y.N. Traceability scheme of edible agricultural products based on novel fair blind signature and attribute-based encryption. J. Electron. Inf. Technol. 2023, 45, 836–846. [Google Scholar]
- Li, C.; Lu, Y.X.; Bian, Y.; Tian, J.; Yuan, M. Design of safety evaluation and risk traceability system for agricultural product quality. Appl. Sci. 2024, 14, 2980. [Google Scholar] [CrossRef]
- Boadi, P.O.; Li, G.; Sai, A.A.; Antwi, P. A critique of the impact of consumer dissatisfaction. In Proceedings of the International Conference on Transformations and Innovations in Management (ICTIM 2017), Shanghai, China, 9–10 September 2017. [Google Scholar]
- Yuan, C.L.; Wang, S.M.; Yu, X.L. The impact of food traceability system on consumer perceived value and purchase intention in China. Ind. Manag. Data Syst. 2020, 120, 810–824. [Google Scholar] [CrossRef]
- Lian, X.Q.; Zhou, Y. Research on the live-streaming sales model of e-commerce supply chain network-considering the impact of product traceability level and consumer traceability preference. J. Qingdao Univ. (Nat. Sci. Ed.) 2024, 37, 50–58. [Google Scholar] [CrossRef]
- Yu, M.J.; Yan, X.X.; Wang, J.K. Research on the influence of traceability information of fresh agricultural products on consumers’ purchasing behavior. Open J. Bus. Manag. 2021, 9, 2370–2388. [Google Scholar] [CrossRef]
- Shi, Y.; Yu, Y.; Zhang, J.Y.; Yin, C.B.; Chen, Y.Z.; Men, H. Origin traceability of agricultural products: A lightweight collaborative neural network for spectral information processing. Food Res. Int. 2025, 208, 116131. [Google Scholar] [CrossRef]
- Hasan, A.T.; Sabah, S.; Daria, A.; Haque, R.U. A peer-to-peer blockchain-based architecture for trusted and reliable agricultural product traceability. Decis. Anal. J. 2023, 9, 100363. [Google Scholar] [CrossRef]
- Li, L.; Tian, P.B.; Dai, J.P.; Miao, F.J. Design of agricultural product traceability system based on blockchain and RFID. Sci. Rep. 2024, 14, 23599. [Google Scholar] [CrossRef]
- Lv, G.J.; Song, C.X.; Xu, P.M.; Qi, Z.G.; Song, H.Y.; Liu, Y. Blockchain-based traceability for agricultural products: A systematic literature review. Agriculture 2023, 13, 1757. [Google Scholar] [CrossRef]
- Li, C.; Chen, G.P. Research on evolutionary traceability decision-making of quality and safety traceability of stakeholders: Based on the dual channel supply chain of agricultural products. IEEE Access 2023, 11, 48463–48479. [Google Scholar] [CrossRef]
- Gómez, C.; Garbinato, B. Blockchain technology to improve traceability in the coffee supply chain: A Systematic Literature Review. IJM Data Insights 2025, 5, 100359. [Google Scholar]
- Lin, X.L. Analysis of agricultural product information traceability and customer preference based on blockchain. Wirel. Commun. Mob. Comput. 2022, 2022, 1–10. [Google Scholar] [CrossRef]
- Zhang, Q. Research of blockchain technology in the traceability of characteristic agricultural products. J. Electron. Res. Appl. 2024, 8, 60–65. [Google Scholar] [CrossRef]
- Gao, Y.T.; Hu, Y.Y. Construction of traceability system for cross-border e-commerce agricultural products. Value Eng. 2023, 42, 162–165. [Google Scholar] [CrossRef]
- Garaus, M.; Treiblmaier, H. The influence of blockchain-based food traceability on retailer choice: The mediating role of trust. Food Control 2021, 129, 108082. [Google Scholar] [CrossRef]
- Wang, X.; Zhang, J.Y.; Ma, D.Q.; Sun, H. Green agricultural products supply chain subsidy scheme with green traceability and data-driven marketing of the platform. Int. J. Environ. Res. Public Health 2023, 20, 3056. [Google Scholar]
- Li, X.F.; Du, J.G.; Li, W.; Shahzad, F. Green ambitions: A comprehensive model for enhanced traceability in agricultural product supply chain to ensure quality and safety. J. Clean. Prod. 2023, 420, 138397. [Google Scholar] [CrossRef]
- Zhou, Y.; Wang, D.P.; Dong, H.X. Research on two stage pricing strategy of competitive manufacturers considering negative reviews sensitivity and response. Chin. J. Manag. 2022, 19, 1240–1250. [Google Scholar]
- Pee, L.G. Negative online consumer reviews: Can the impact be mitigated? Int. J. Mark. Res. 2016, 58, 545–567. [Google Scholar] [CrossRef]
- Varga, M.; Albuquerque, P. The impact of negative reviews on online search and purchase decisions. J. Mark. Res. 2024, 61, 803–820. [Google Scholar] [CrossRef]
- Hu, F. What makes a hotel review helpful? An information requirement perspective. J. Hosp. Mark. Manag. 2020, 29, 571–591. [Google Scholar] [CrossRef]
- Kollmer, T.; Eckhardt, A.; Reibenspiess, V. Explaining consumer suspicion: Insights of a vignette study on online product reviews. Electron. Mark. 2022, 32, 1221–1238. [Google Scholar] [CrossRef]
- Alzate, M.; Arce-Urriza, M.; Cebollada, J. Mining the text of online consumer reviews to analyze brand image and brand positioning. J. Retail. Consum. Serv. 2022, 67, 102989. [Google Scholar] [CrossRef]
- Roman, S.; Riquelme, I.P.; Iacobucci, D. Unlocking the helpfulness of extreme and exaggerated hotel online reviews: Consumers and brand influences. Tour. Manag. Perspect. 2024, 54, 101321. [Google Scholar] [CrossRef]
- Ordabayeva, N.; Cavanaugh, L.A.; Dahl, D.W. The upside of negative: Social distance in online reviews of identity-relevant brands. J. Mark. 2022, 86, 70–92. [Google Scholar] [CrossRef]
- Qin, C.; Zeng, X.Y.; Liang, S.C.; Zhang, K. Do live streaming and online consumer reviews jointly affect purchase intention? Sustainability 2023, 15, 6992. [Google Scholar] [CrossRef]
- Duan, Y.R.; Liu, T.H.; Mao, Z.X. How online reviews and coupons affect sales and pricing: An empirical study based on e-commerce platform. J. Retail. Consum. Serv. 2022, 65, 102846. [Google Scholar] [CrossRef]
- Bi, D.T.; Kong, J.Y.; Gao, Y. Prevention of negative online customer reviews: A dynamic and compensation perspective. J. Hosp. Tour. Manag. 2024, 58, 269–285. [Google Scholar] [CrossRef]
- Zhang, S.; Su, L.X.; Zhuang, W.L.; Babin, B.J. How to respond to negative online reviews: Language style matters. J. Serv. Theor. Pract. 2024, 34, 598–620. [Google Scholar] [CrossRef]
- Chen, X.L.; Zhou, F.; Zhang, Y. The feedback strategy of negative evaluation of buyers and its influence on consumers’ purchase decision. Chin. J. Commerce 2019, 19, 56–59. [Google Scholar] [CrossRef]
- Pooja, K.; Upadhyaya, P. Does negative online review matter? An investigation of travel consumers. Int. J. Consum. Stud. 2025, 49, e70043. [Google Scholar] [CrossRef]
- Kapeš, J.; Keča, K.; Fugošić, N.; Čuić Tanković, A. Management response strategies to a negative online review: Influence on potential guests’trust. Tour. Hosp. Manag. 2022, 28, 1–27. [Google Scholar]
- Zhang, X.H.; Xiao, L. Research on evaluation of express logistics service quality based on consumer online comment data. J. Chongqing Technol. Business Univ. Soc. Sci. Ed. 2023, 40, 66–79. [Google Scholar] [CrossRef]
- Yuan, B.; Zheng, W.Z. The influence of entrepreneur’s word of mouth on brand evaluation in internet environment-from the perspective of customer’s language cognition. Nankai Bus. Rev. Int. 2019, 22, 33–44. [Google Scholar] [CrossRef]
- Wang, L.; Su, X.X. Carbon reduction decision-making in the supply chain considering carbon allowances and bidirectional option trading mode of carbon emission rights. Energy Rep. 2025, 13, 2678–2696. [Google Scholar] [CrossRef]
- Wu, K.L.; De Schutter, B.; Rezaei, J.; Tavasszy, L. Decision analysis and coordination in green supply chains with stochastic demand. Int. J. Syst. Sci. Oper. Logist. 2023, 10, 2208277. [Google Scholar] [CrossRef]
- Li, F.; Xiong, H.B. Green supply chain decision-making considering fair concerns and consumer environmental mindset. Heliyon 2025, 11, e42916. [Google Scholar] [CrossRef]
- Xu, J.; Xiong, S.H.; Cui, T.Y.; Zhang, D.M.; Li, Z.B. Incorporating consumers’ low-carbon and freshness preferences in dual-channel agri-foods supply chains: An analysis of decision-making behavior. Agriculture 2023, 13, 1647. [Google Scholar] [CrossRef]
- Nakhaeinejad, M.; Dehghan, A.; Vaziri, N.S. Developing a supply chain coordination model through a revised revenue sharing contract: Incorporating sales efforts and green quality considerations. Int. J. Prod. Manag. Eng. 2025, 13, 102–121. [Google Scholar] [CrossRef]
- Kong, M.L. Closed-loop supply chain decision making for waste electrical appliances in the context of blockchain. Procedia Comput. Sci. 2024, 243, 809–818. [Google Scholar] [CrossRef]
- Wen, T.X.; Hu, Y.C.; Liu, H.Y. Dual-channel logistics supply chain decisions based on recycling quality differences. Control Eng. China 2024, 31, 1355–1361. Available online: https://http-qikan--cqvip--com.jxust.opac.vip/Qikan/Article/Detail?id=7112808376 (accessed on 9 July 2025).
- Wan, P.; Xie, Z.Y. Decision making and benefit analysis of closed-loop remanufacturing supply chain considering government subsidies. Heliyon 2024, 10, e38487s. [Google Scholar] [CrossRef]
- Zhang, Y.F.; Shi, Q.Q. Closed-loop supply chain alliance decision considering product greenness. Logist. Sci.-Tech. 2024, 47, 134–140. [Google Scholar] [CrossRef]
- Lo, H.W.; Pai, C.J.; Deveci, M. A multi-objective model for integrated supplier order allocation and supply chain network transportation planning decision-making. Inf. Sci. 2025, 689, 121487. [Google Scholar] [CrossRef]
- Sutthibutr, N.; Hiraishi, K.; Chiadamrong, N. A fuzzy multi-criteria decision-making for optimizing supply chain aggregate production planning based on cost reduction and risk mitigation. J. Open Innov. Technol. Mark. Complex 2024, 10, 100377. [Google Scholar] [CrossRef]
- Sharifi, E.; Amin, S.H.; Fang, L.P. Assessing sustainability of food supply chains by using a novel method integrating group multi-criteria decision-making and interval type-2 fuzzy set. Environ. Dev. Sustain. 2023, 27, 3665–3705. [Google Scholar]
- Esteso, A.; Alemany, M.M.E.; Ortiz, A.; Iannacone, R. Integrating freshness and profitability in horticultural supply chain design. Cent. Eur. Oper. Res. 2024, 32, 1–44. [Google Scholar]
- Li, Q.X.; Zhang, H.W.; Liu, K.L. Research on closed-loop supply chain decision-making in different cooperation modes with government’s reward-penalty mechanism. Sustainability 2021, 13, 6425. [Google Scholar]
- Jiang, M.L.; Lin, X.W.; Zhou, X.D.; Qiao, H.F. Research on supply chain quality decision model considering reference effect and competition under different decision-making modes. Sustainability 2022, 14, 10338. [Google Scholar] [CrossRef]
- Shu, Y.D.; Dai, Y.; Ma, Z.J. Differential game model of closed-loop supply chain with fairness concern. Oper. Res. Manag. Sci. 2024, 33, 29–34. [Google Scholar]
- Zhang, J.Q.; Wen, S.B.; Li, H.; Lv, X. Evolutionary game analysis of supply chain operations decision under the background of low-carbon economy-based on the perspective of government-enterprise-consumer synergy. Oper. Res. Manag. Sci. 2024, 33, 77–83. [Google Scholar]
- Qiao, X.J.; Xu, S.M.; Shi, D.; Zhao, X.K. Data-driven sustainable supply chain decision making in the presence of low carbon awareness. Sustainability 2023, 15, 9576. [Google Scholar] [CrossRef]
- Shen, Y.; Gao, T.; Song, Z.Z.; Ma, J. Closed-loop supply chain decision-making and coordination considering fairness concerns under carbon neutral rewards and punishments. Sustainability 2023, 15, 6466. [Google Scholar]
- Lv, Y.; Bi, X.H.; Li, Q.X.; Zhang, H.W. Research on closed-loop supply chain decision making and recycling channel selection under carbon allowance and carbon trading. Sustainability 2022, 14, 11473. [Google Scholar] [CrossRef]
- Zhang, B.Y.; Qu, S.J. Green supply chain game: Decision-making and coordination mechanism design. Sustainability 2023, 15, 15608. [Google Scholar] [CrossRef]
- Xu, Y.M.; Zhang, P. Decision-making in dual-channel green supply chain considering market structure. J. Serv. Sci. Manag. 2018, 11, 116. [Google Scholar] [CrossRef]
- Wei, H.; Wang, X.H.; Hu, G. Agricultural product supply chain decision-making considering digital traceability and corporate social responsibility. Econ. Probl. 2024, 46, 111–120. Available online: https://http-qikan--cqvip--com.jxust.opac.vip/Qikan/Article/Detail?id=7112677799 (accessed on 9 July 2025).
- Zhang, W.S.; Sun, L.; Wang, Y.Q.; Luo, X.M. Optimizing emission reduction strategies in a two-echelon supply chain: A stackelberg game perspective under cap-and-trade regulation. Int. J. Low-Carbon Technol. 2024, 19, 850–872. [Google Scholar] [CrossRef]
- Alzoubi, A.H.; Shafee, A. Strategic analysis of tariff and subsidy policies in supply chains with 3PLs: A bilevel game-theoretic model. Mathematics 2025, 13, 2603. [Google Scholar] [CrossRef]
- Chen, Q.; Yang, X.J.; Yang, D.; Liu, S.; Liao, C.C. Blockchain technology for supply chain traceability: A game-theoretic analysis between e-platforms. PLoS ONE 2024, 19, e0297978. [Google Scholar]
- Zhang, K.J.; Ma, M.Q. Research on dual-channel supply chain coordination considering fresh e-tailer’s returns. J. Donghua Univ. (Nat. Sci.) 2021, 47, 116–123. [Google Scholar] [CrossRef]
- Tan, Y.; Hong, X.L.; Qin, X.H. A research on supply chain coordination of fresh agricultural products considering bilateral fresh-keeping efforts under fairness concern. Ind. Eng. J. 2021, 24, 27–38. [Google Scholar]
- Wang, H.Y.; Shen, C.J. Decision and coordination of fresh food dual-channel supply chain considering fresh-keeping efforts and CSR. J. Univ. Electron. Sci. Technol. China Soc. Sci. Ed. 2023, 25, 77–87. [Google Scholar]
Disclaimer/Publisher’s Note: The statements, opinions and data contained in all publications are solely those of the individual author(s) and contributor(s) and not of MDPI and/or the editor(s). MDPI and/or the editor(s) disclaim responsibility for any injury to people or property resulting from any ideas, methods, instructions or products referred to in the content. |
© 2025 by the authors. Licensee MDPI, Basel, Switzerland. This article is an open access article distributed under the terms and conditions of the Creative Commons Attribution (CC BY) license (https://creativecommons.org/licenses/by/4.0/).