
Effect of Ventilation Strategies of Center-Mounted Louver Ventilation Window on Building Energy Consumption and Daylighting


Abstract
1. Introduction
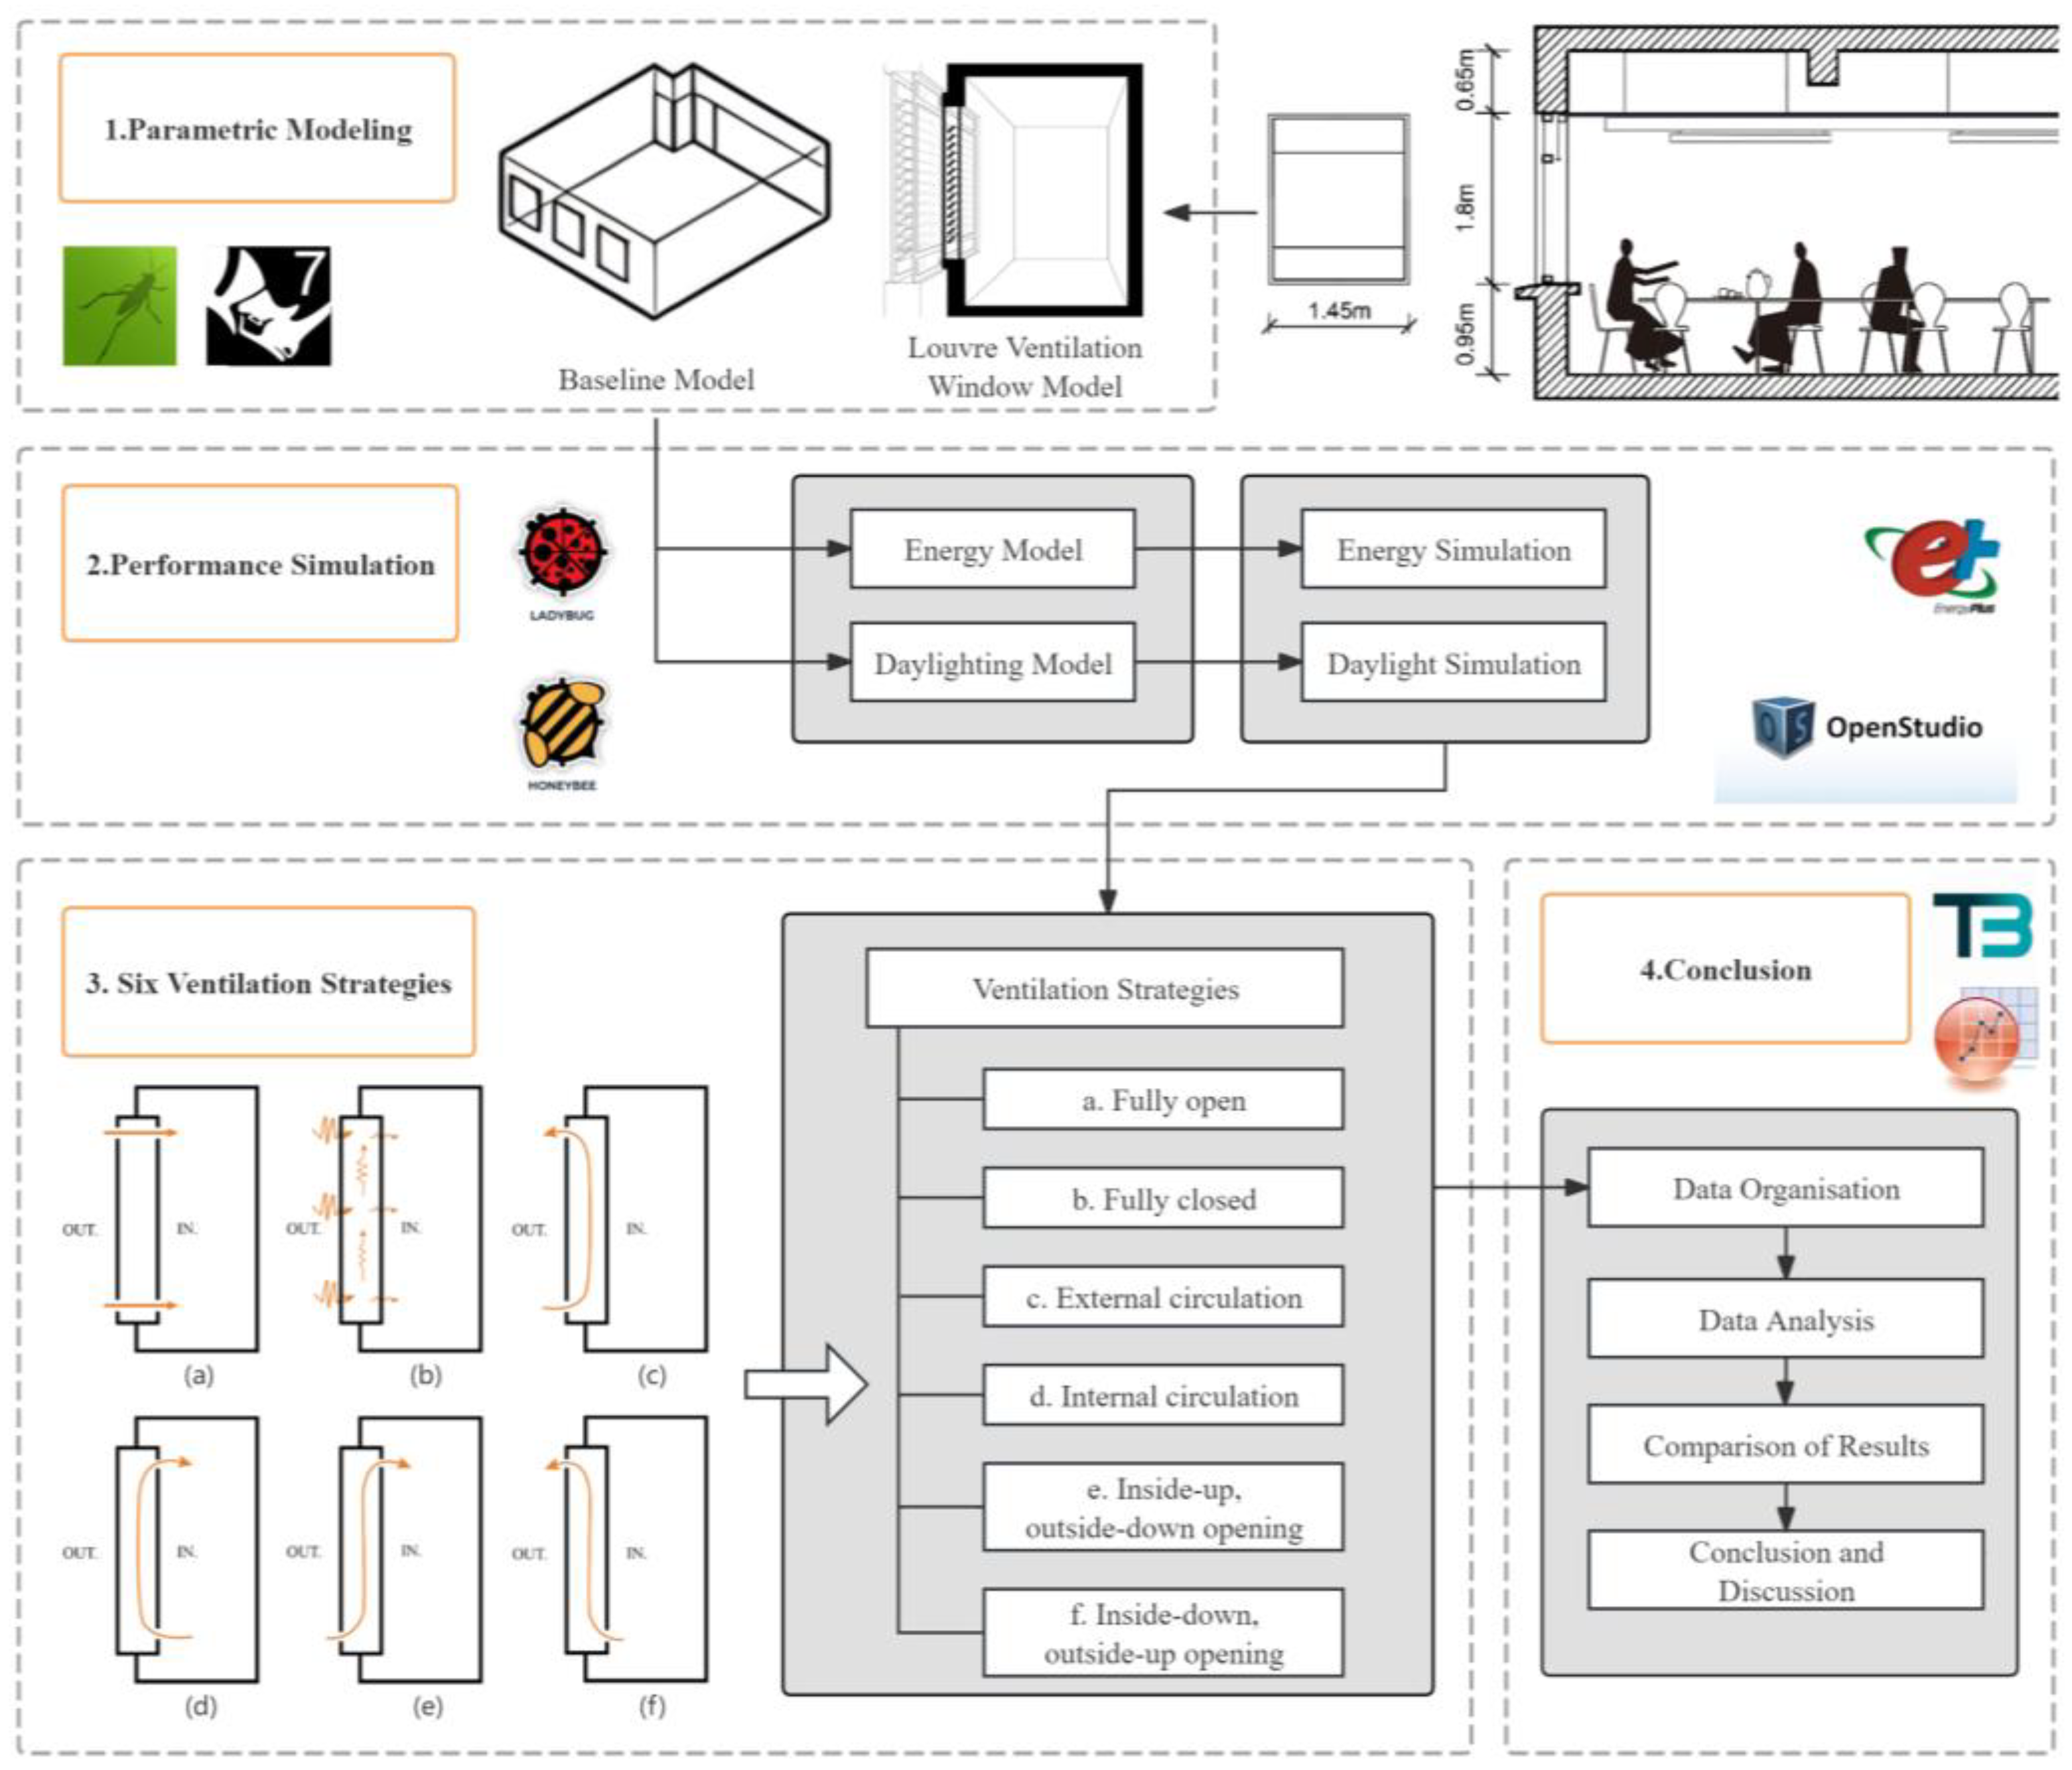
2. Methods
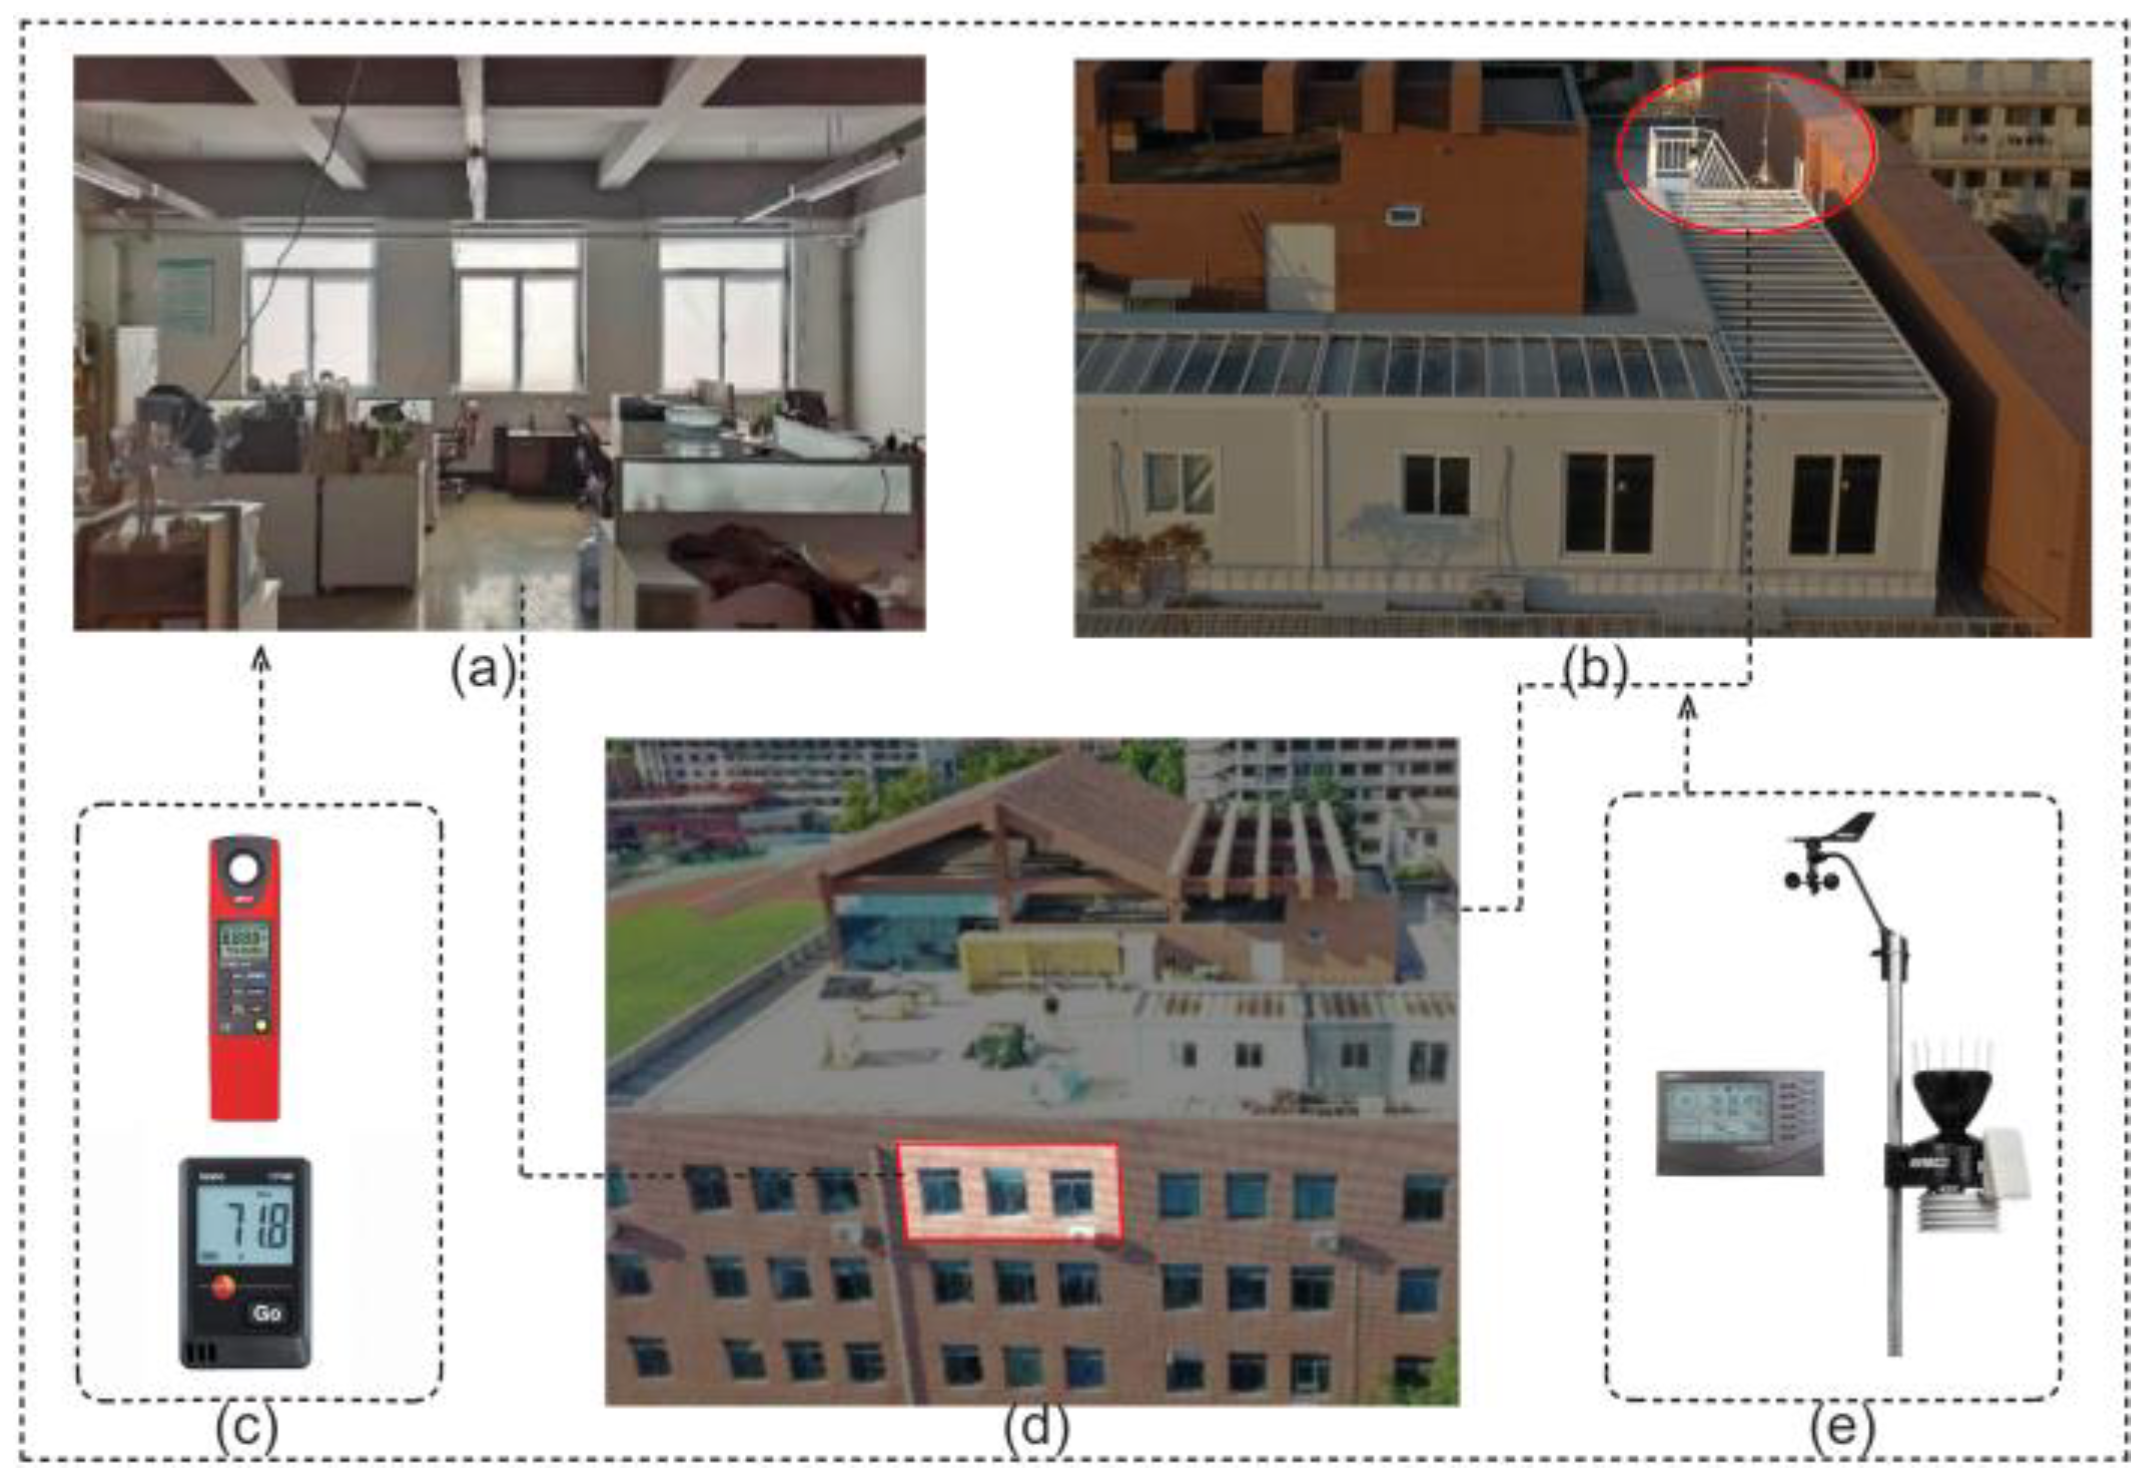
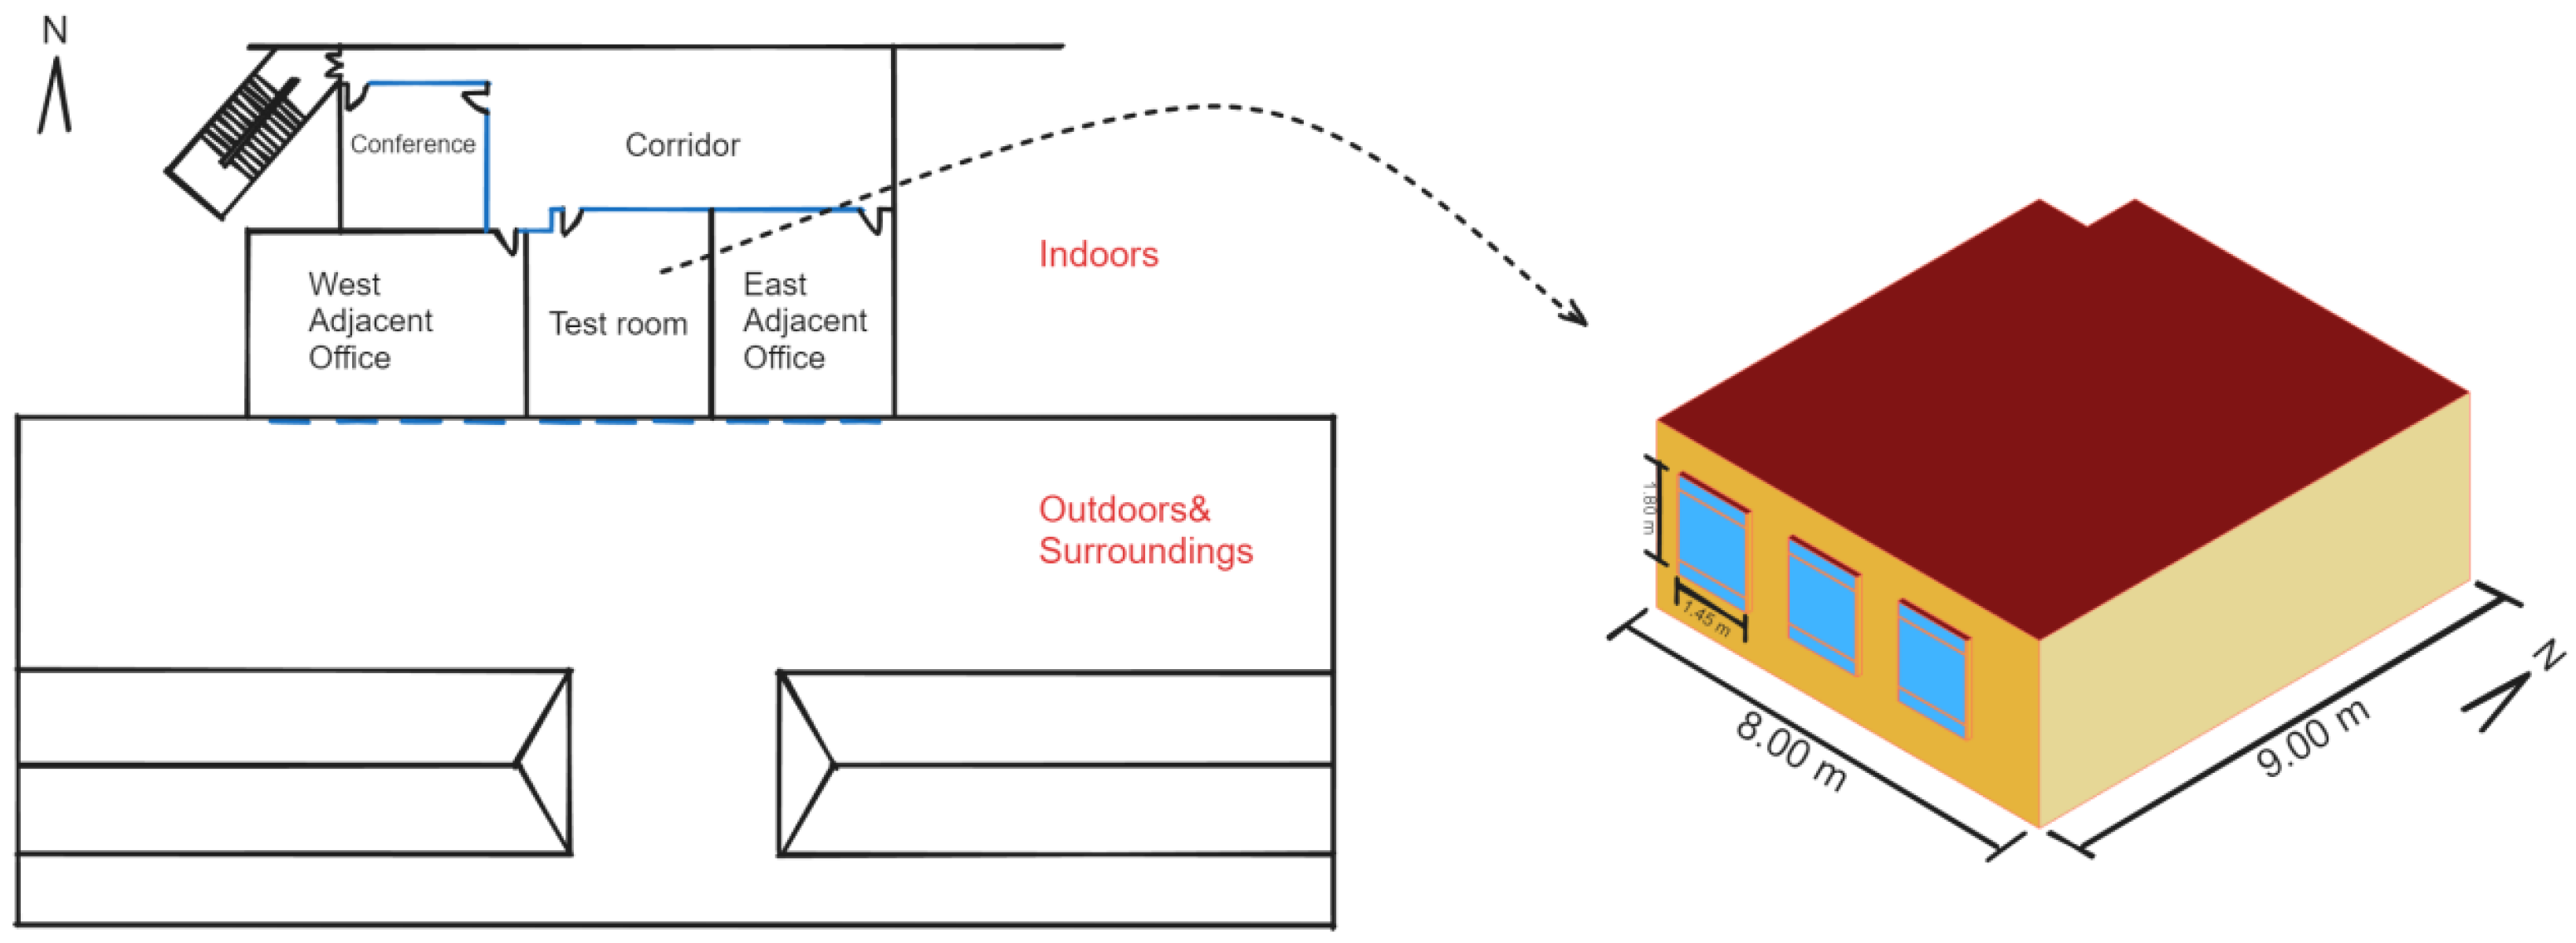
2.1. Case Study Description
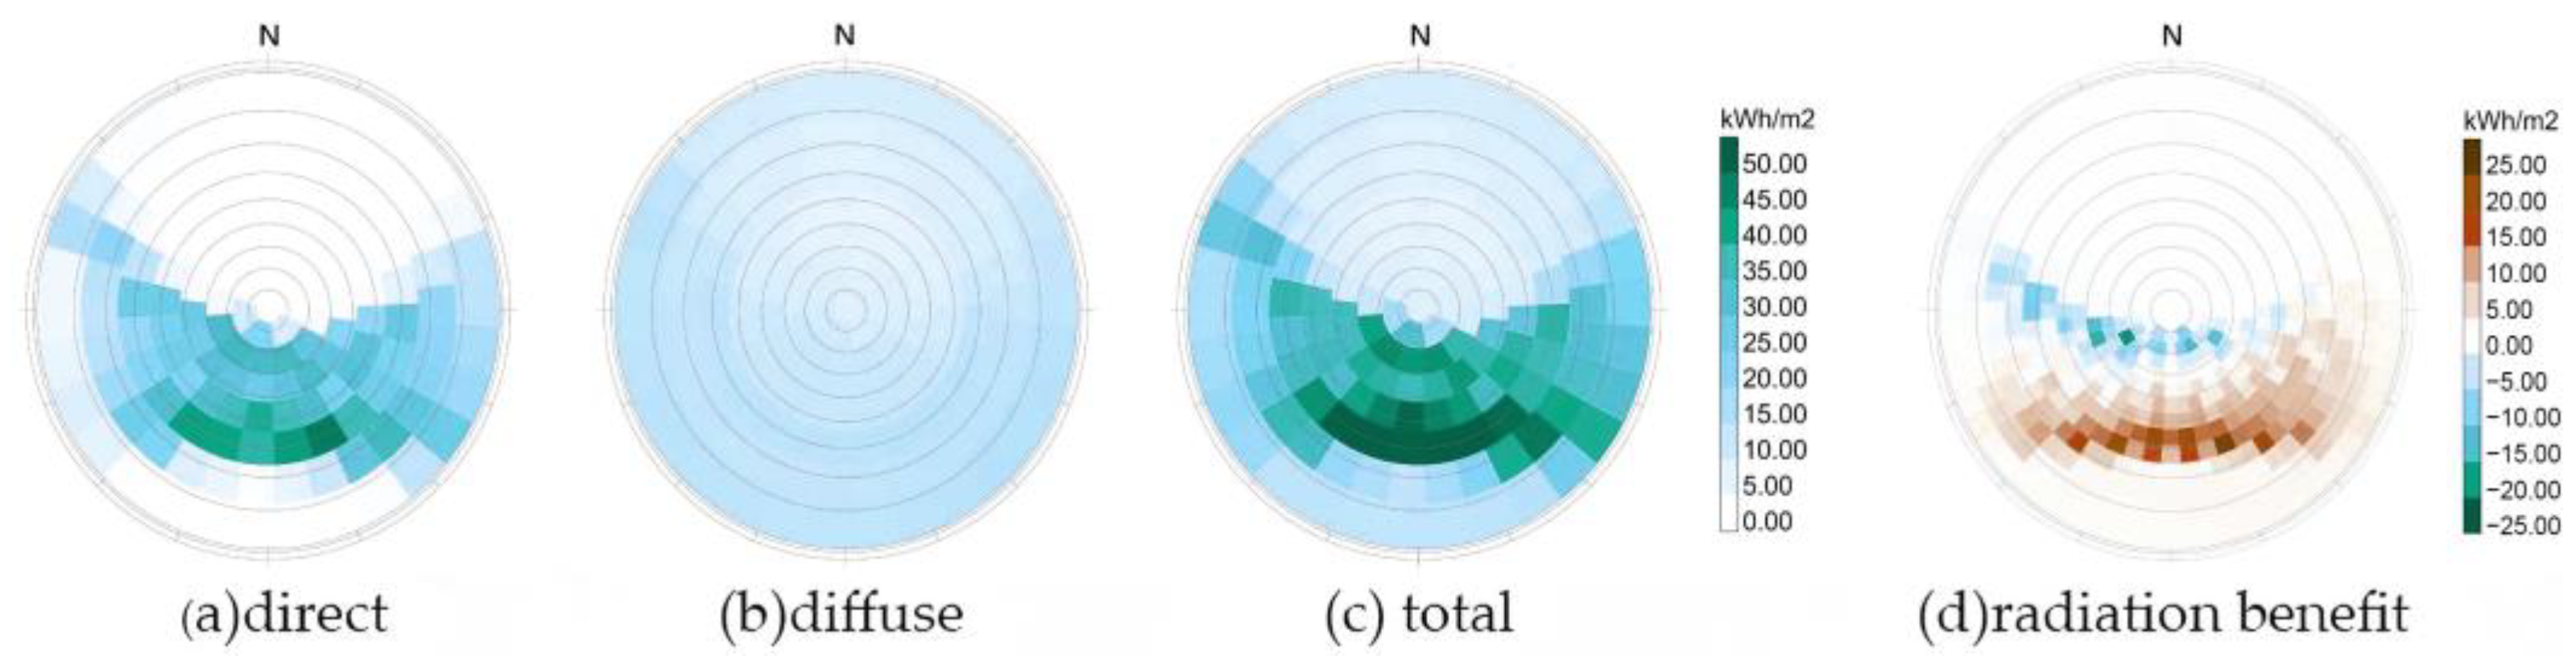
2.2. Climate Condition in Qingdao
2.3. Baseline Model Settings
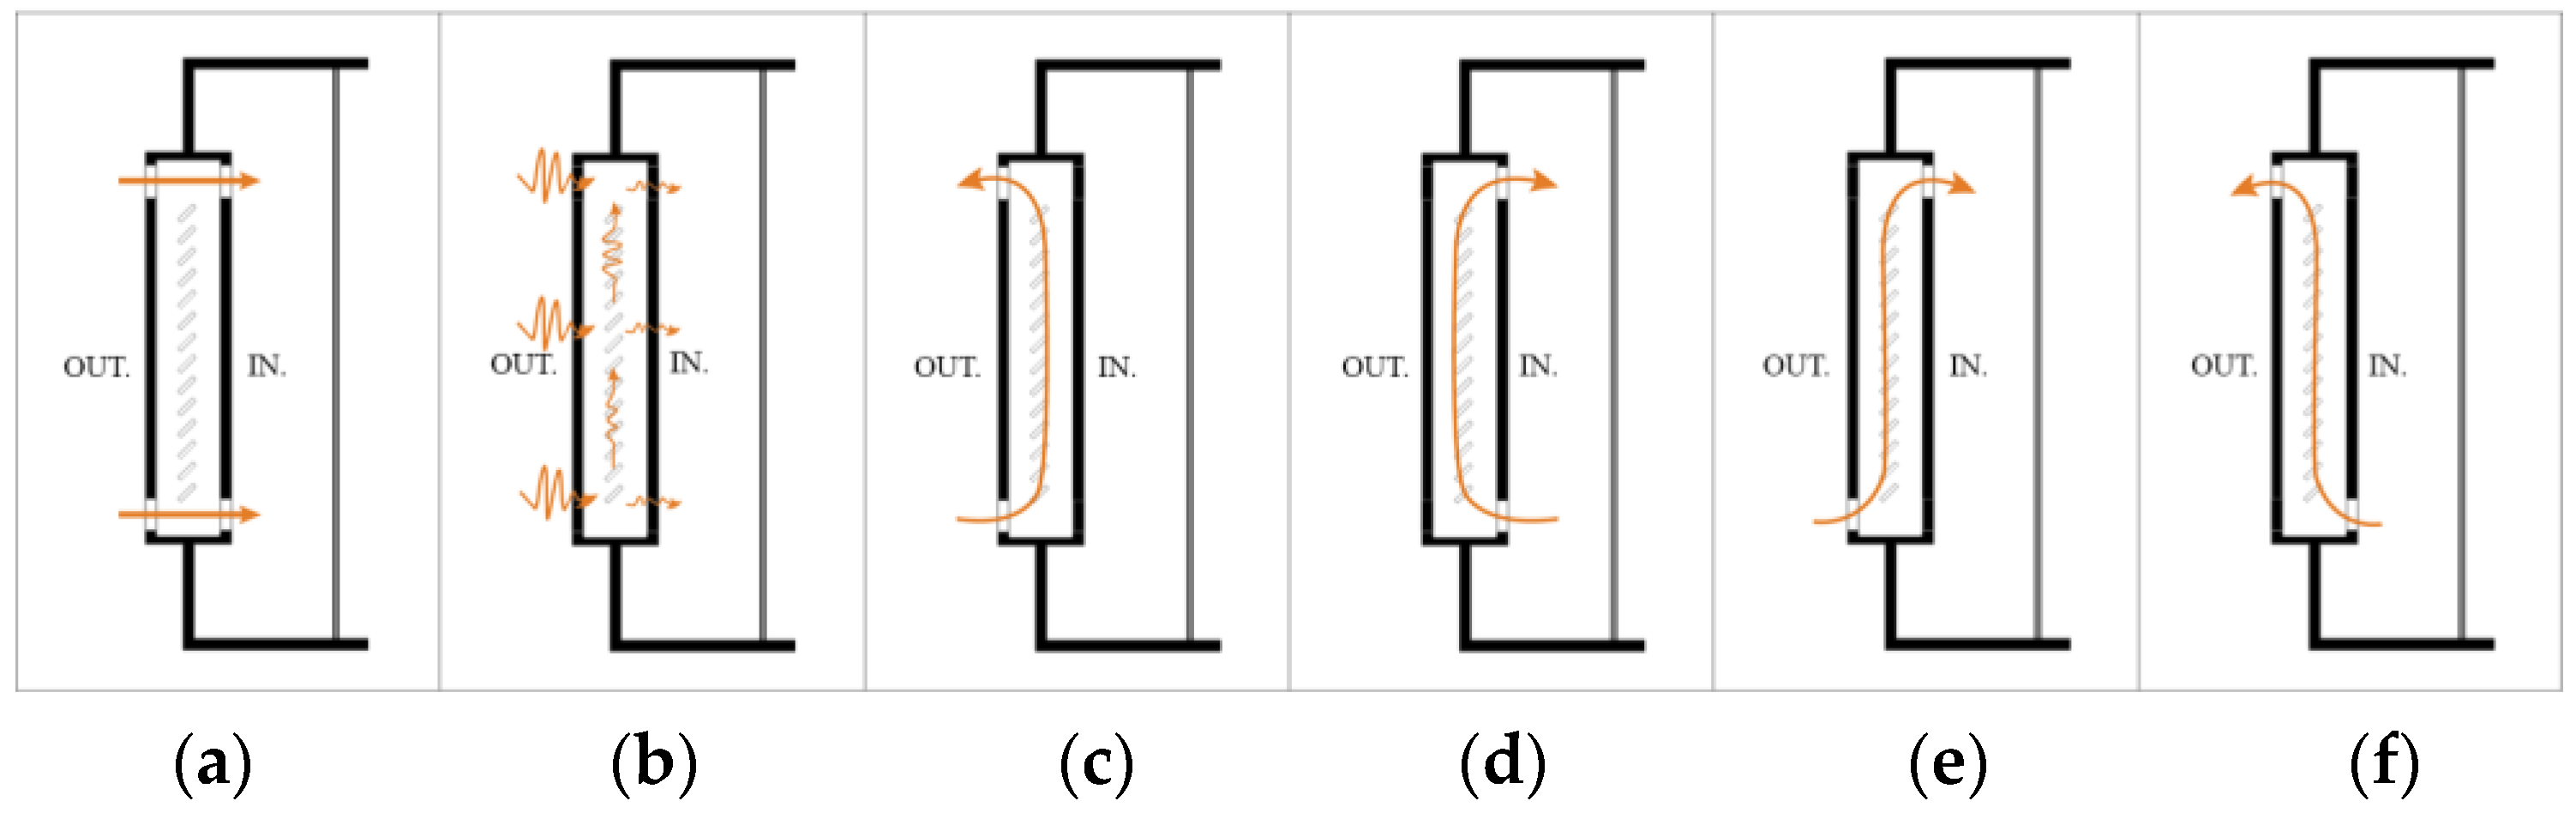
2.4. Working Principle of Center-Mounted Louver Ventilation Window
2.5. Objectives and Metrics
2.5.1. Daylighting
2.5.2. Energy
3. Results
3.1. Model Validation
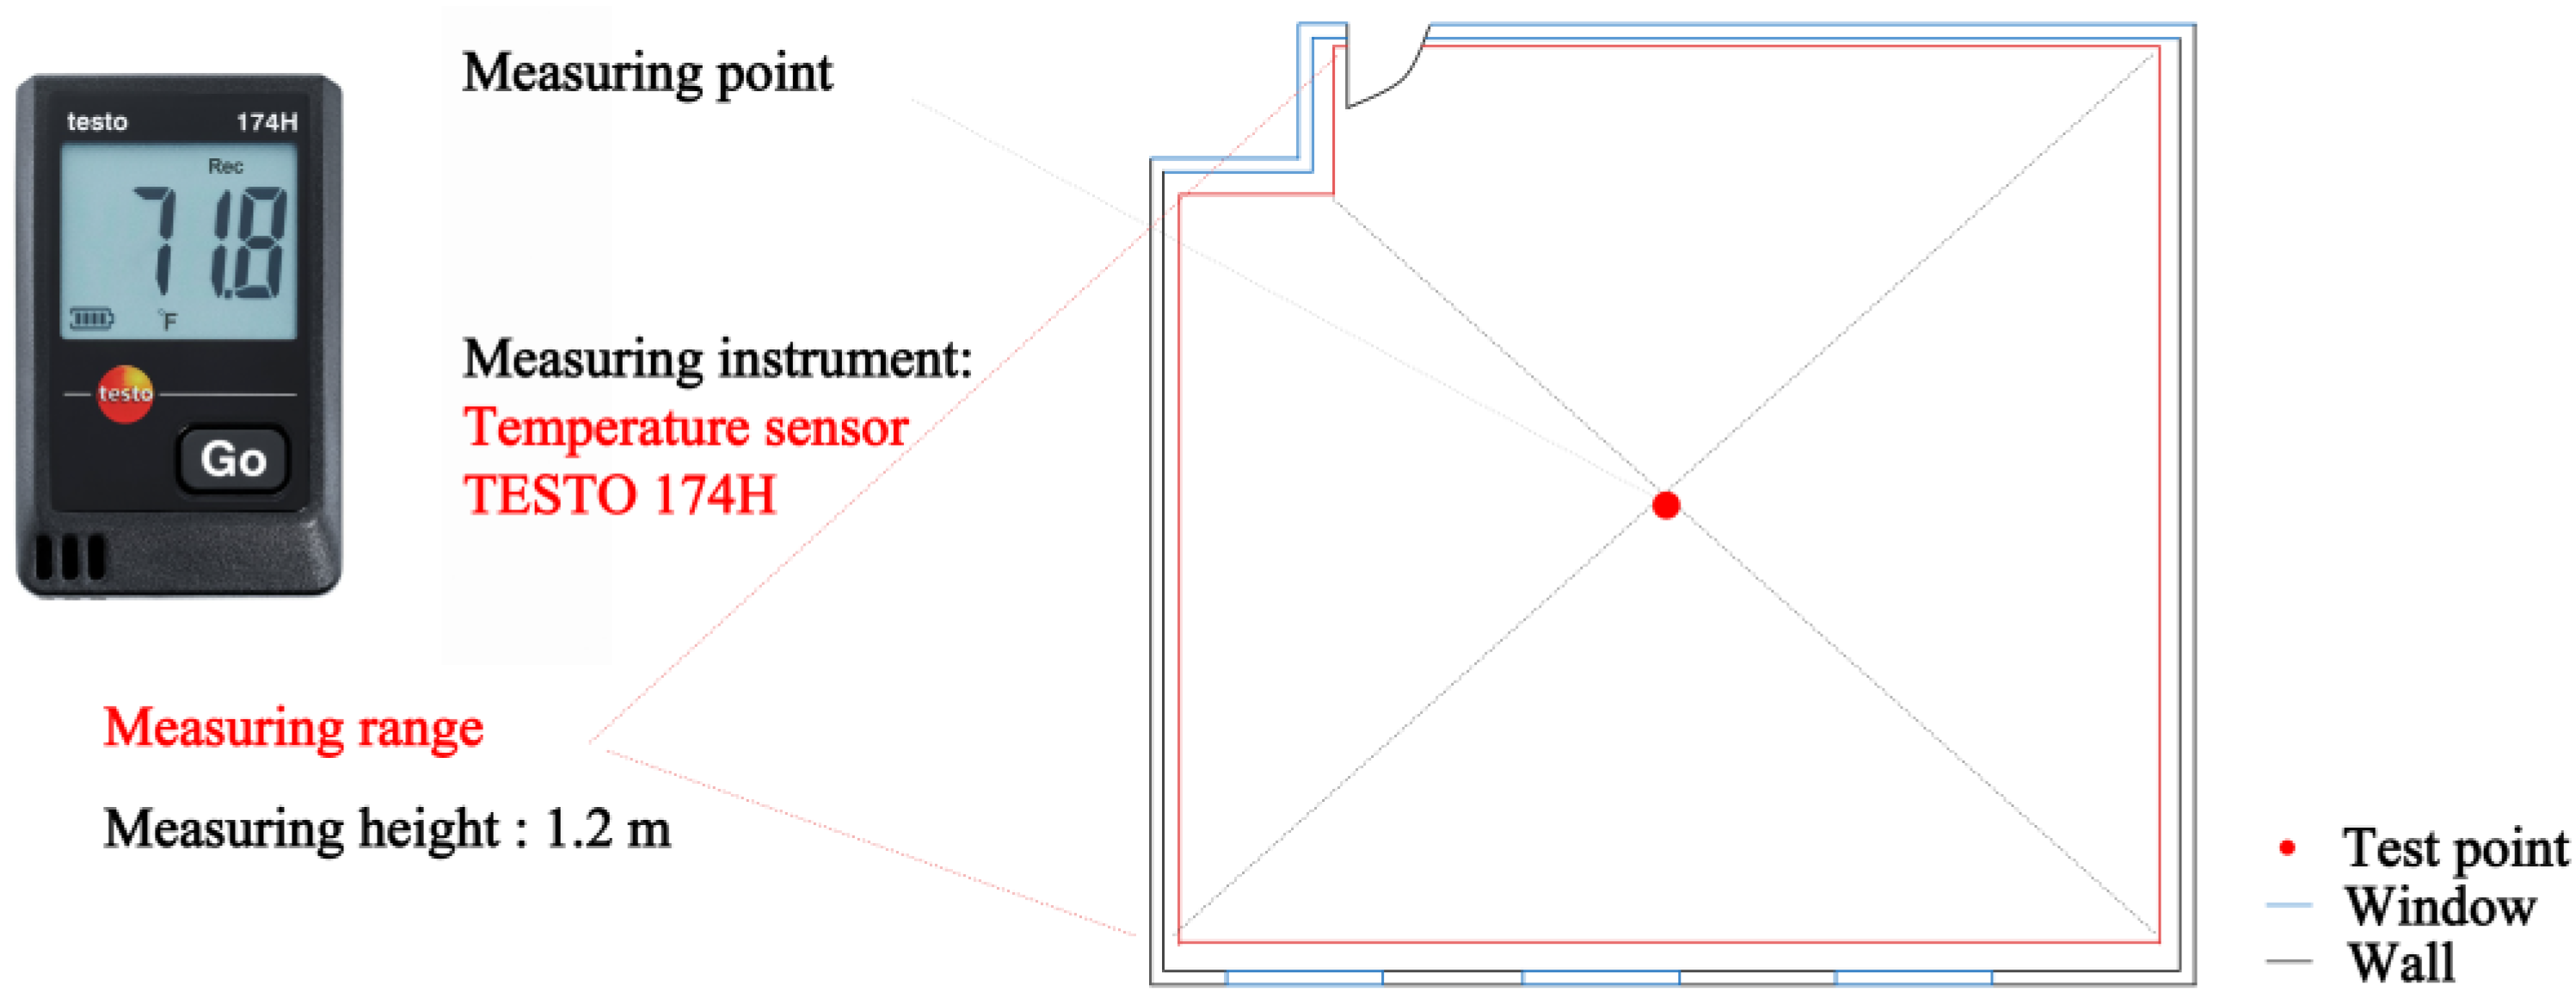
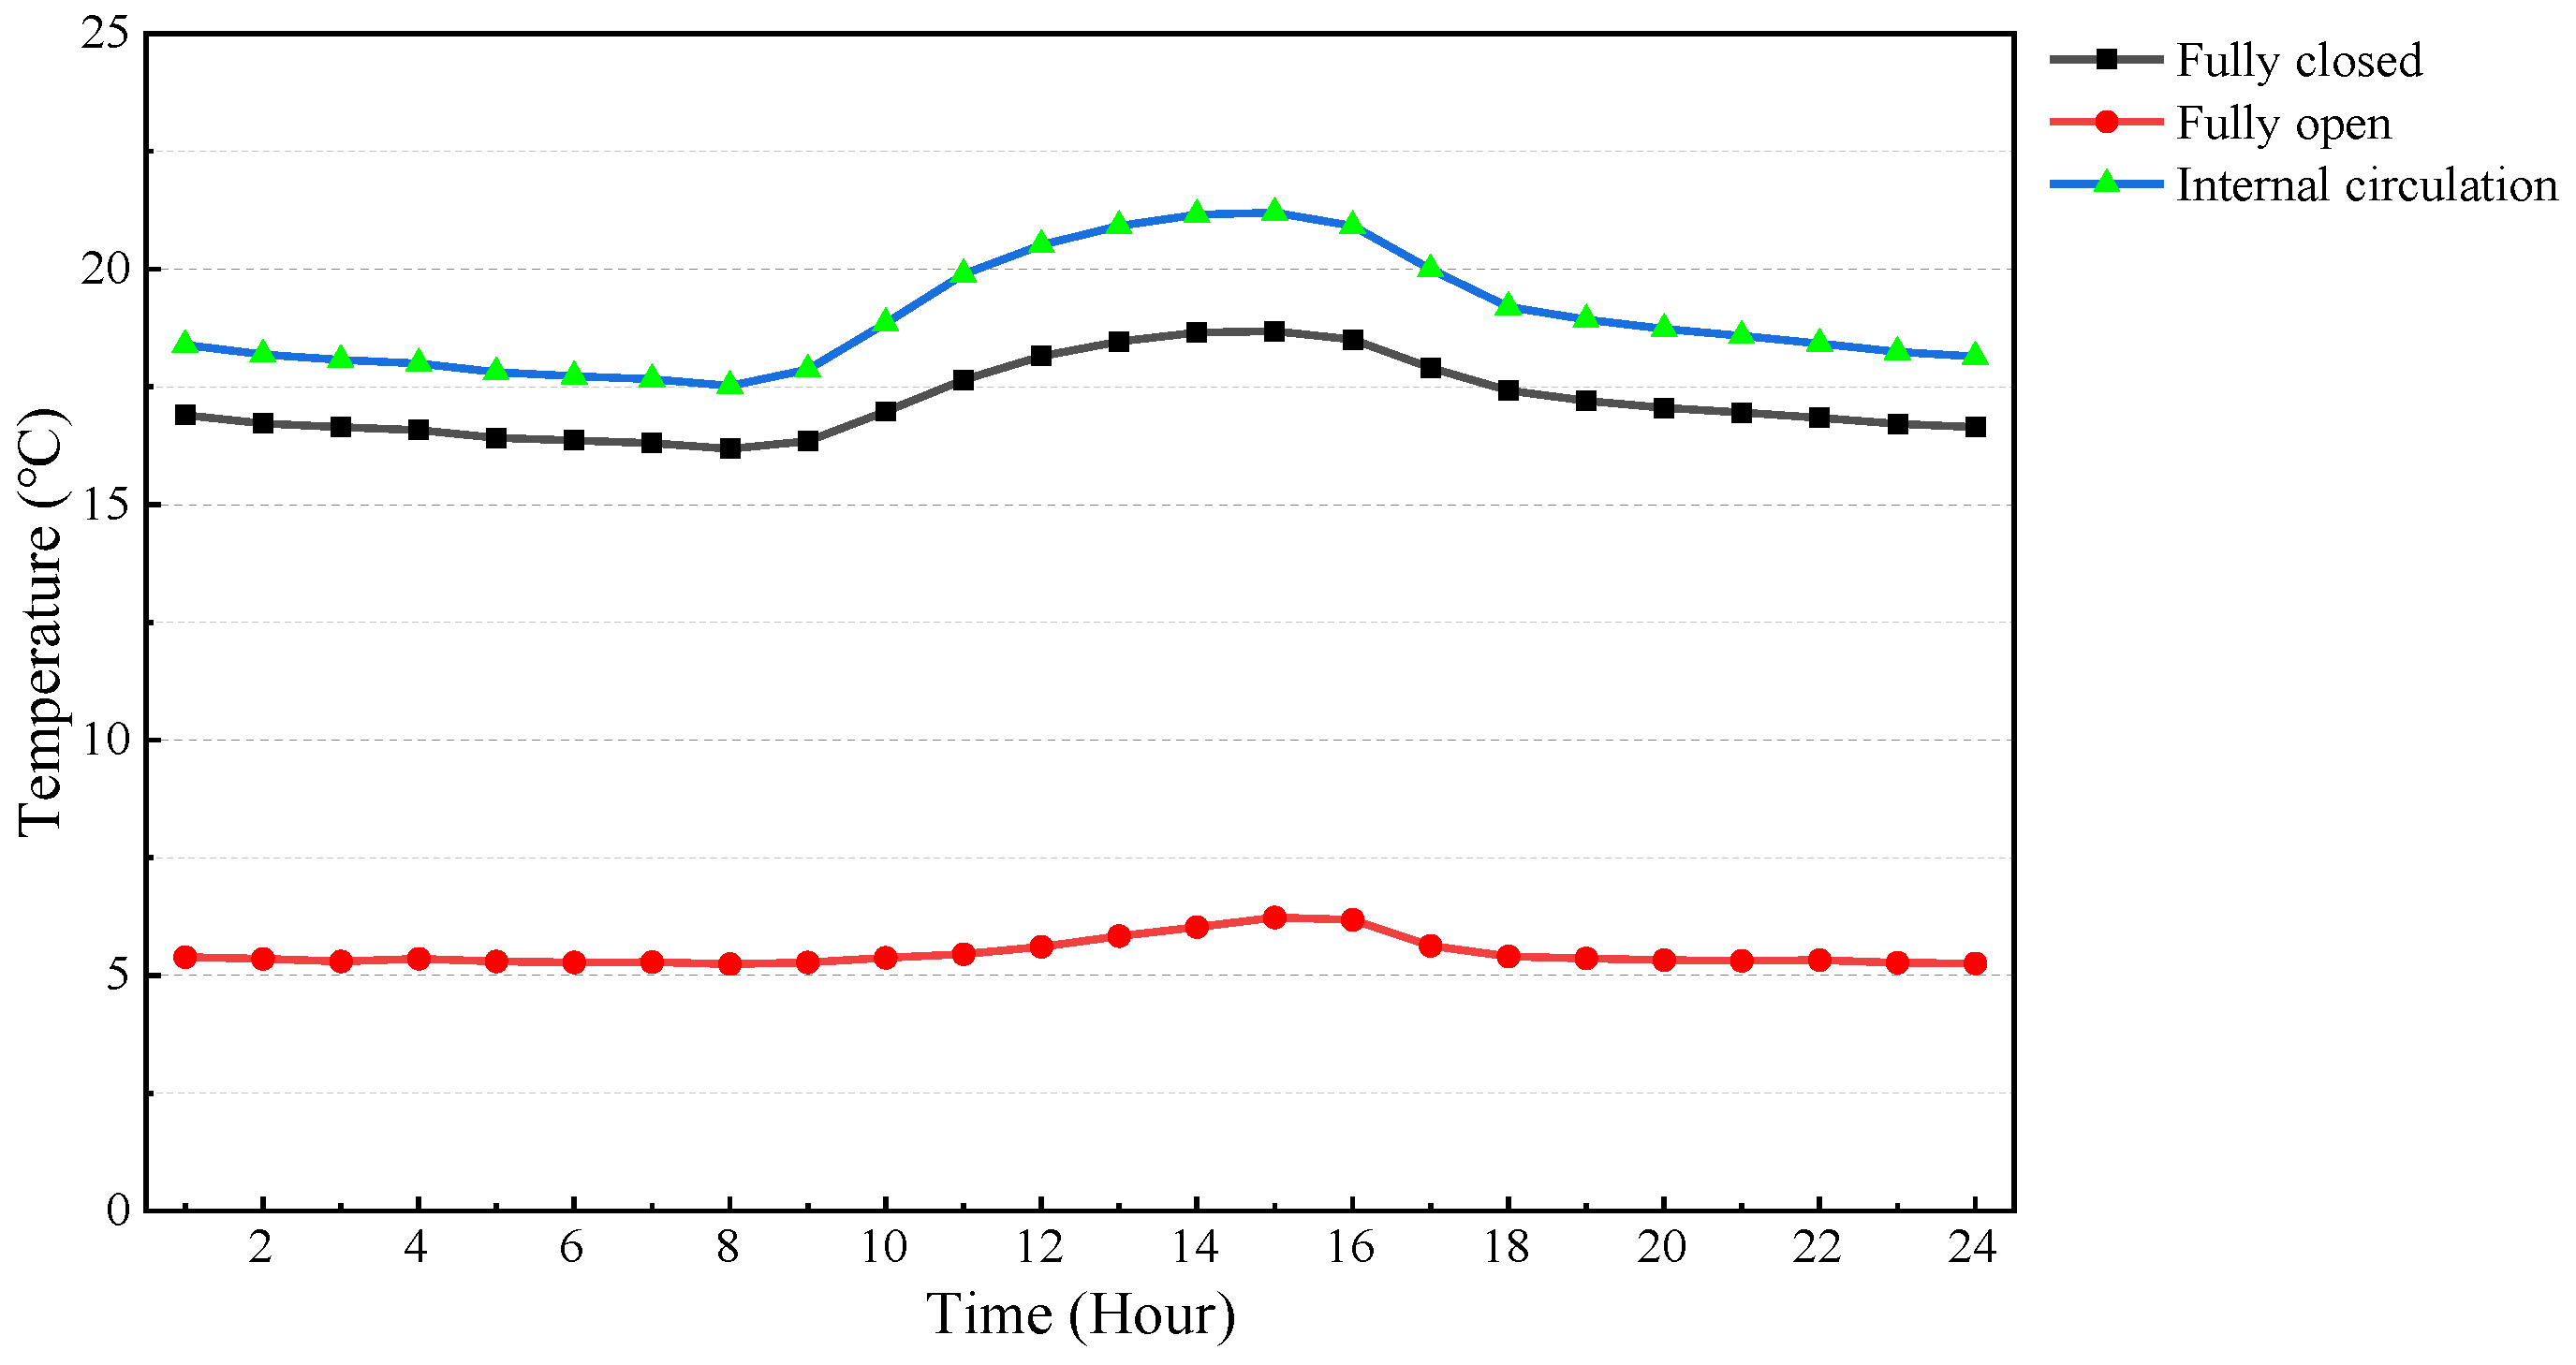
3.1.1. Temperature
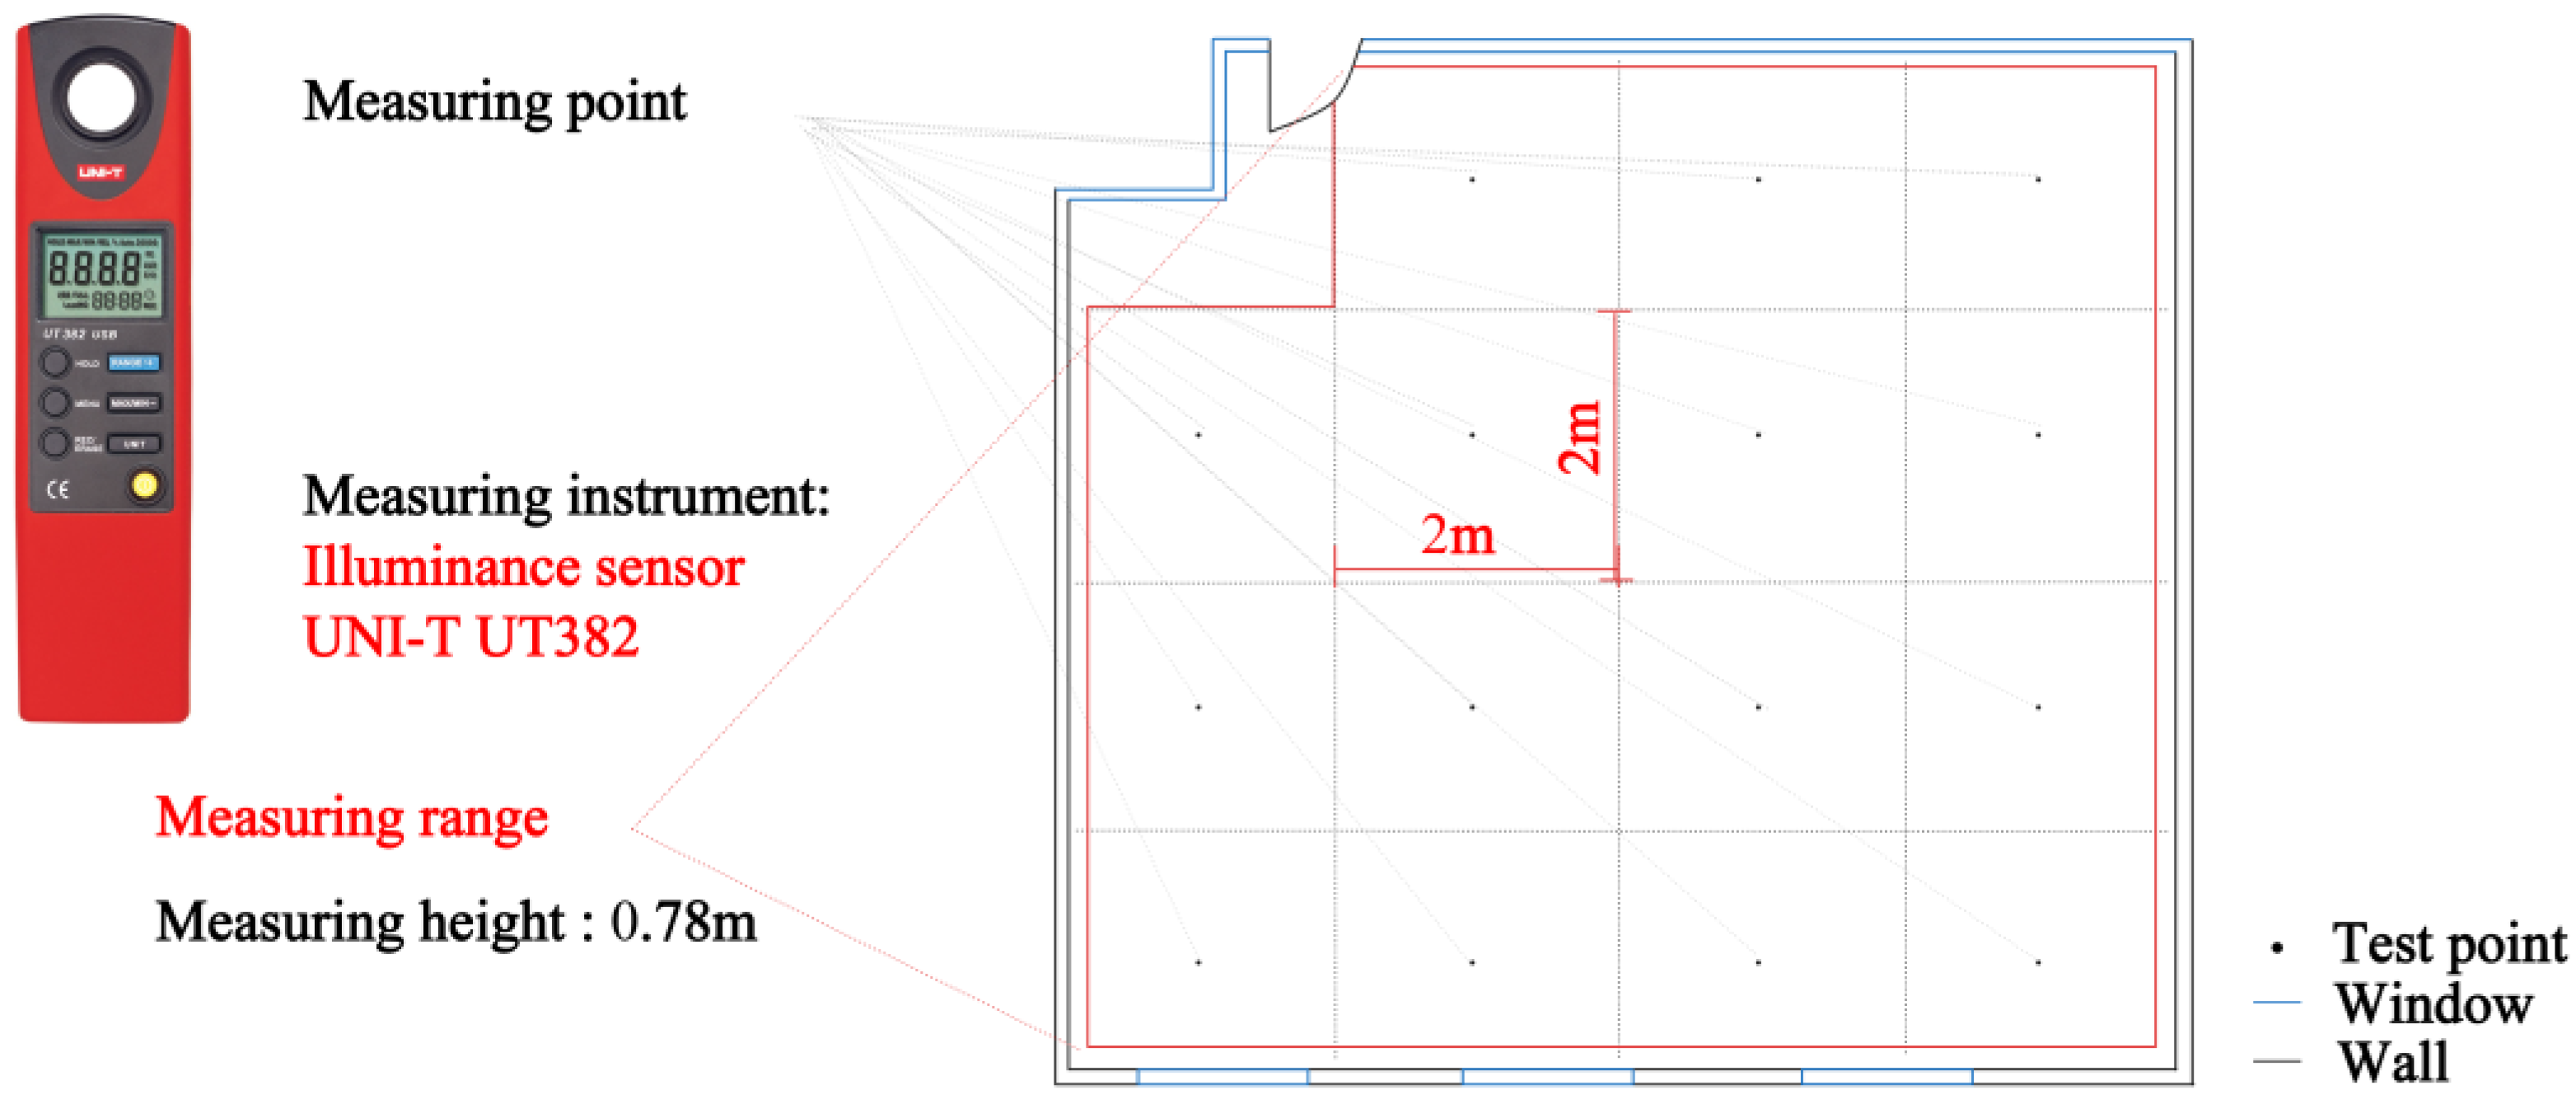
3.1.2. Illuminance
3.2. The Influence of Center-Mounted Louver Ventilation Window on Daylighting
3.2.1. The Daylighting Potential of the Year
3.2.2. Analysis of Daylighting Potential in Typical Summer Months
3.2.3. Analysis of Daylighting Potential in Typical Winter Months
3.3. The Influence of Center-Mounted Louver Ventilation Window on Energy Saving
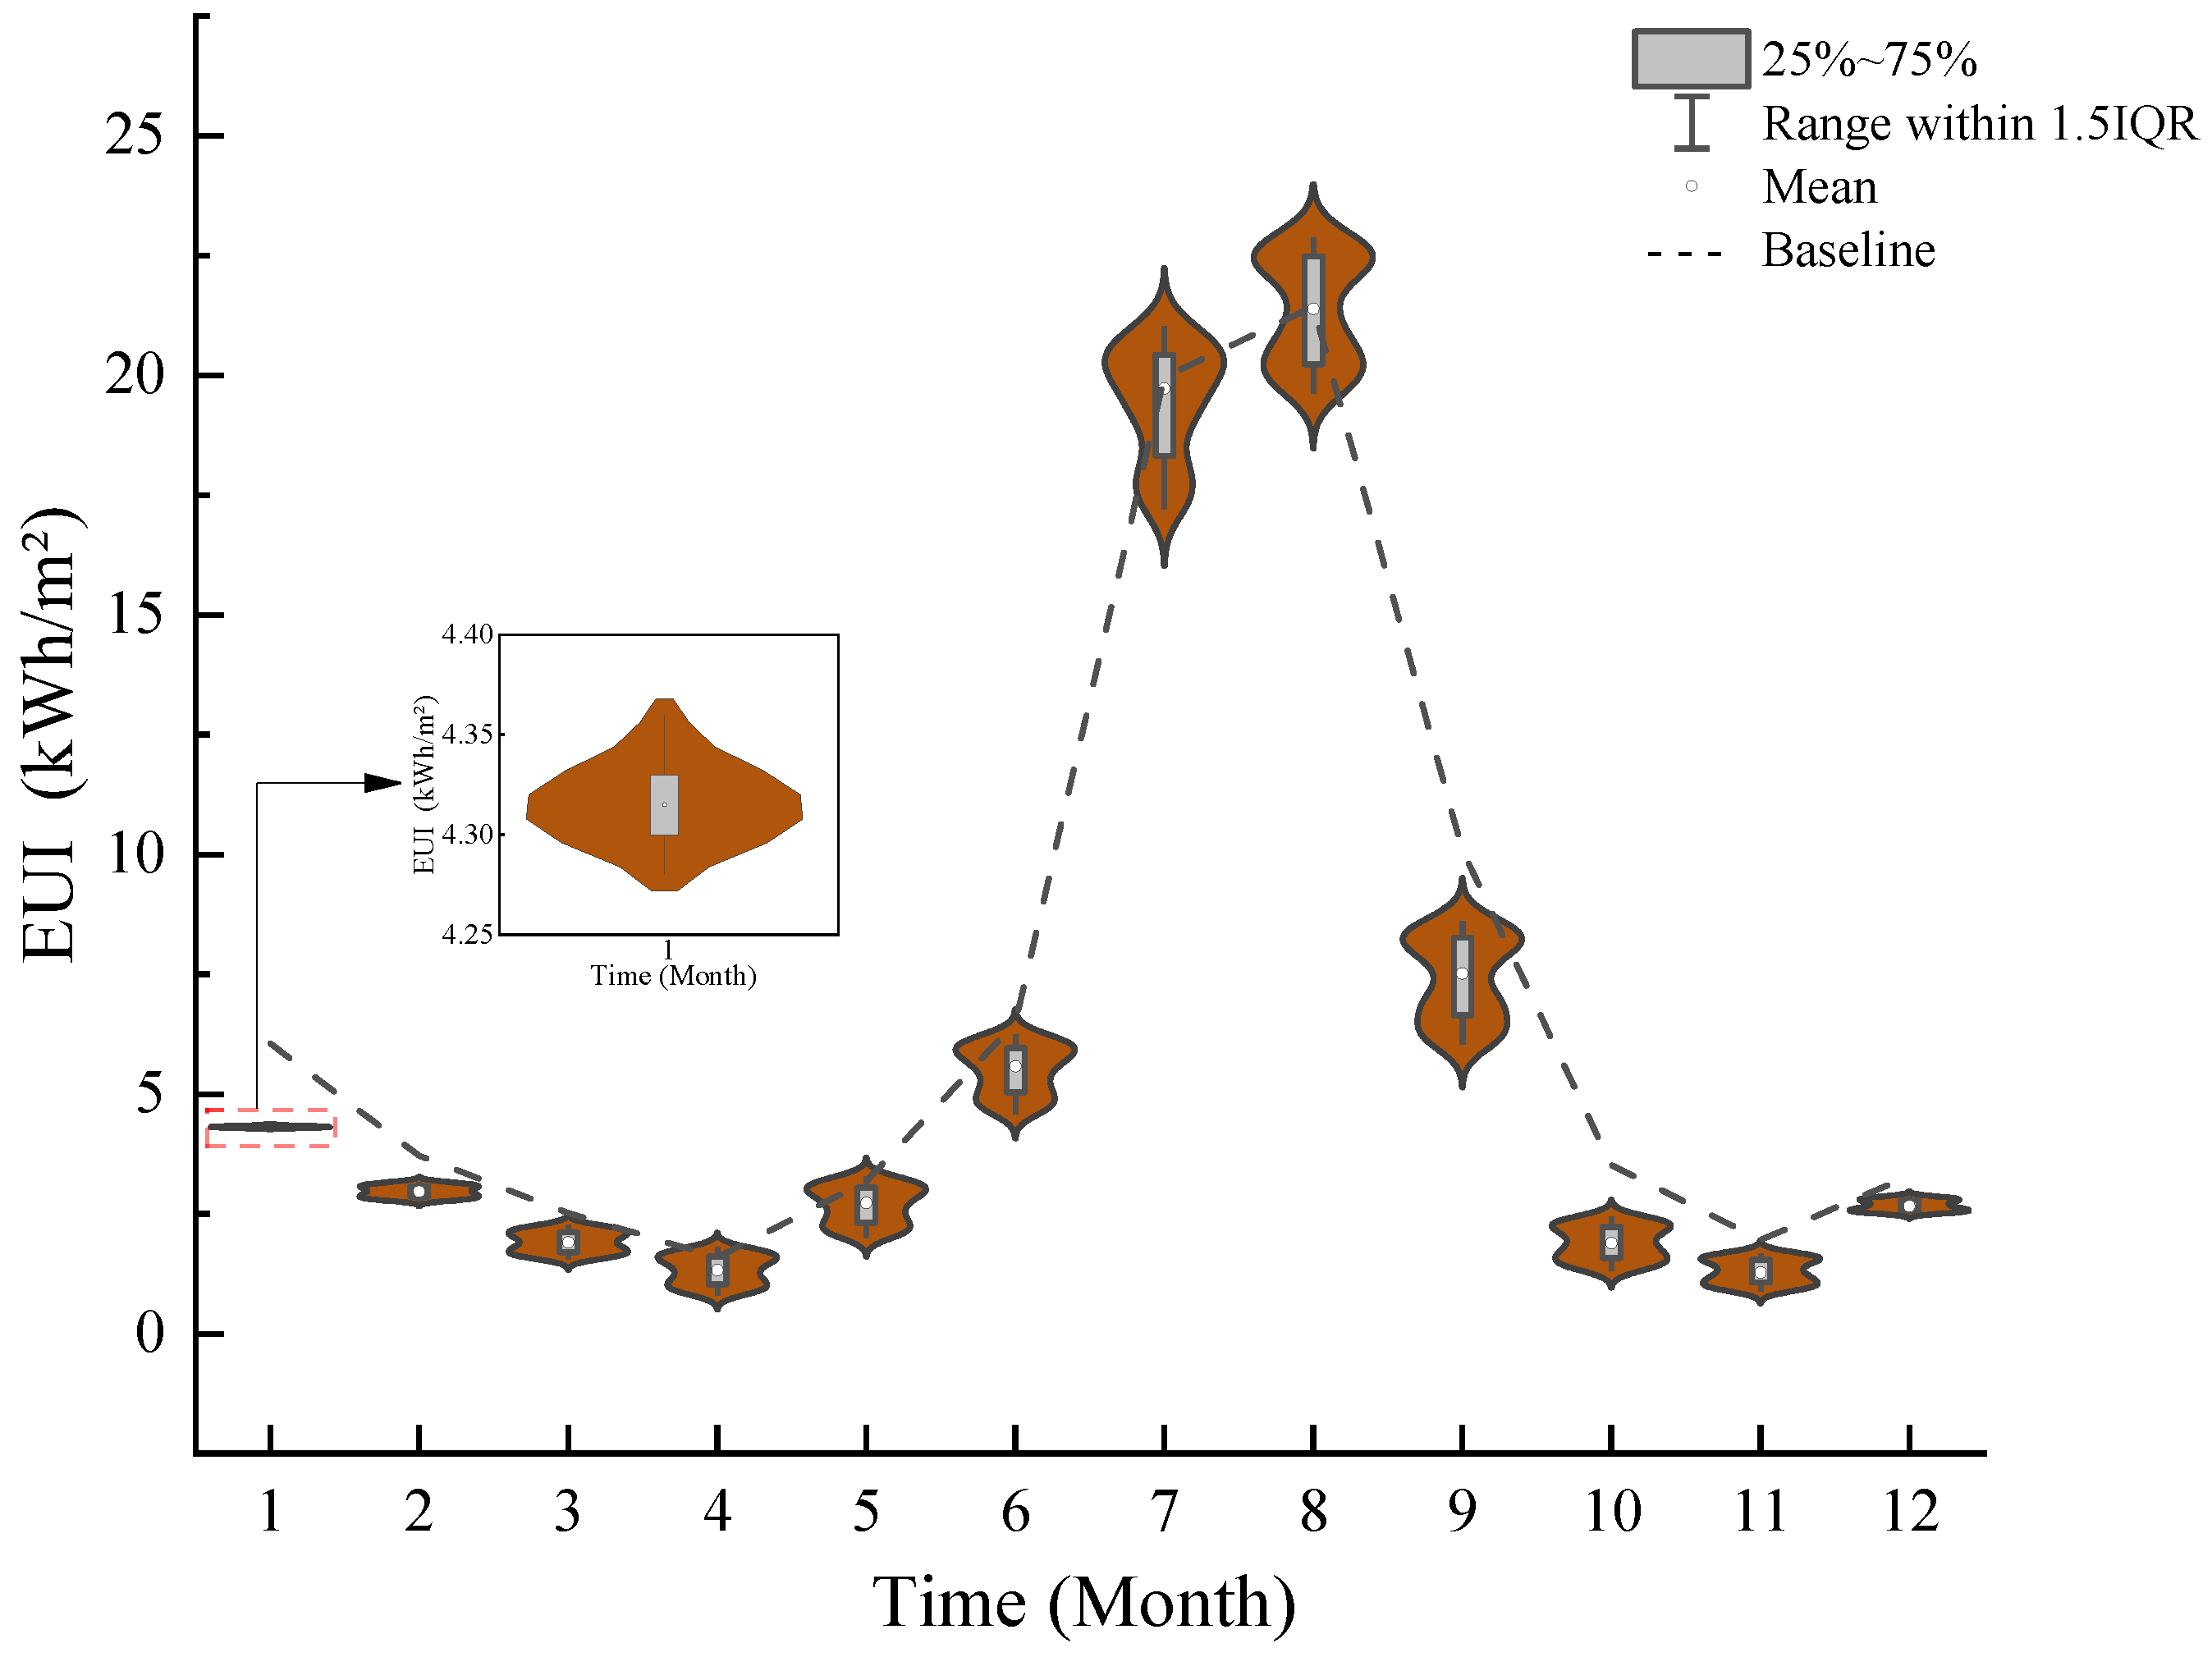
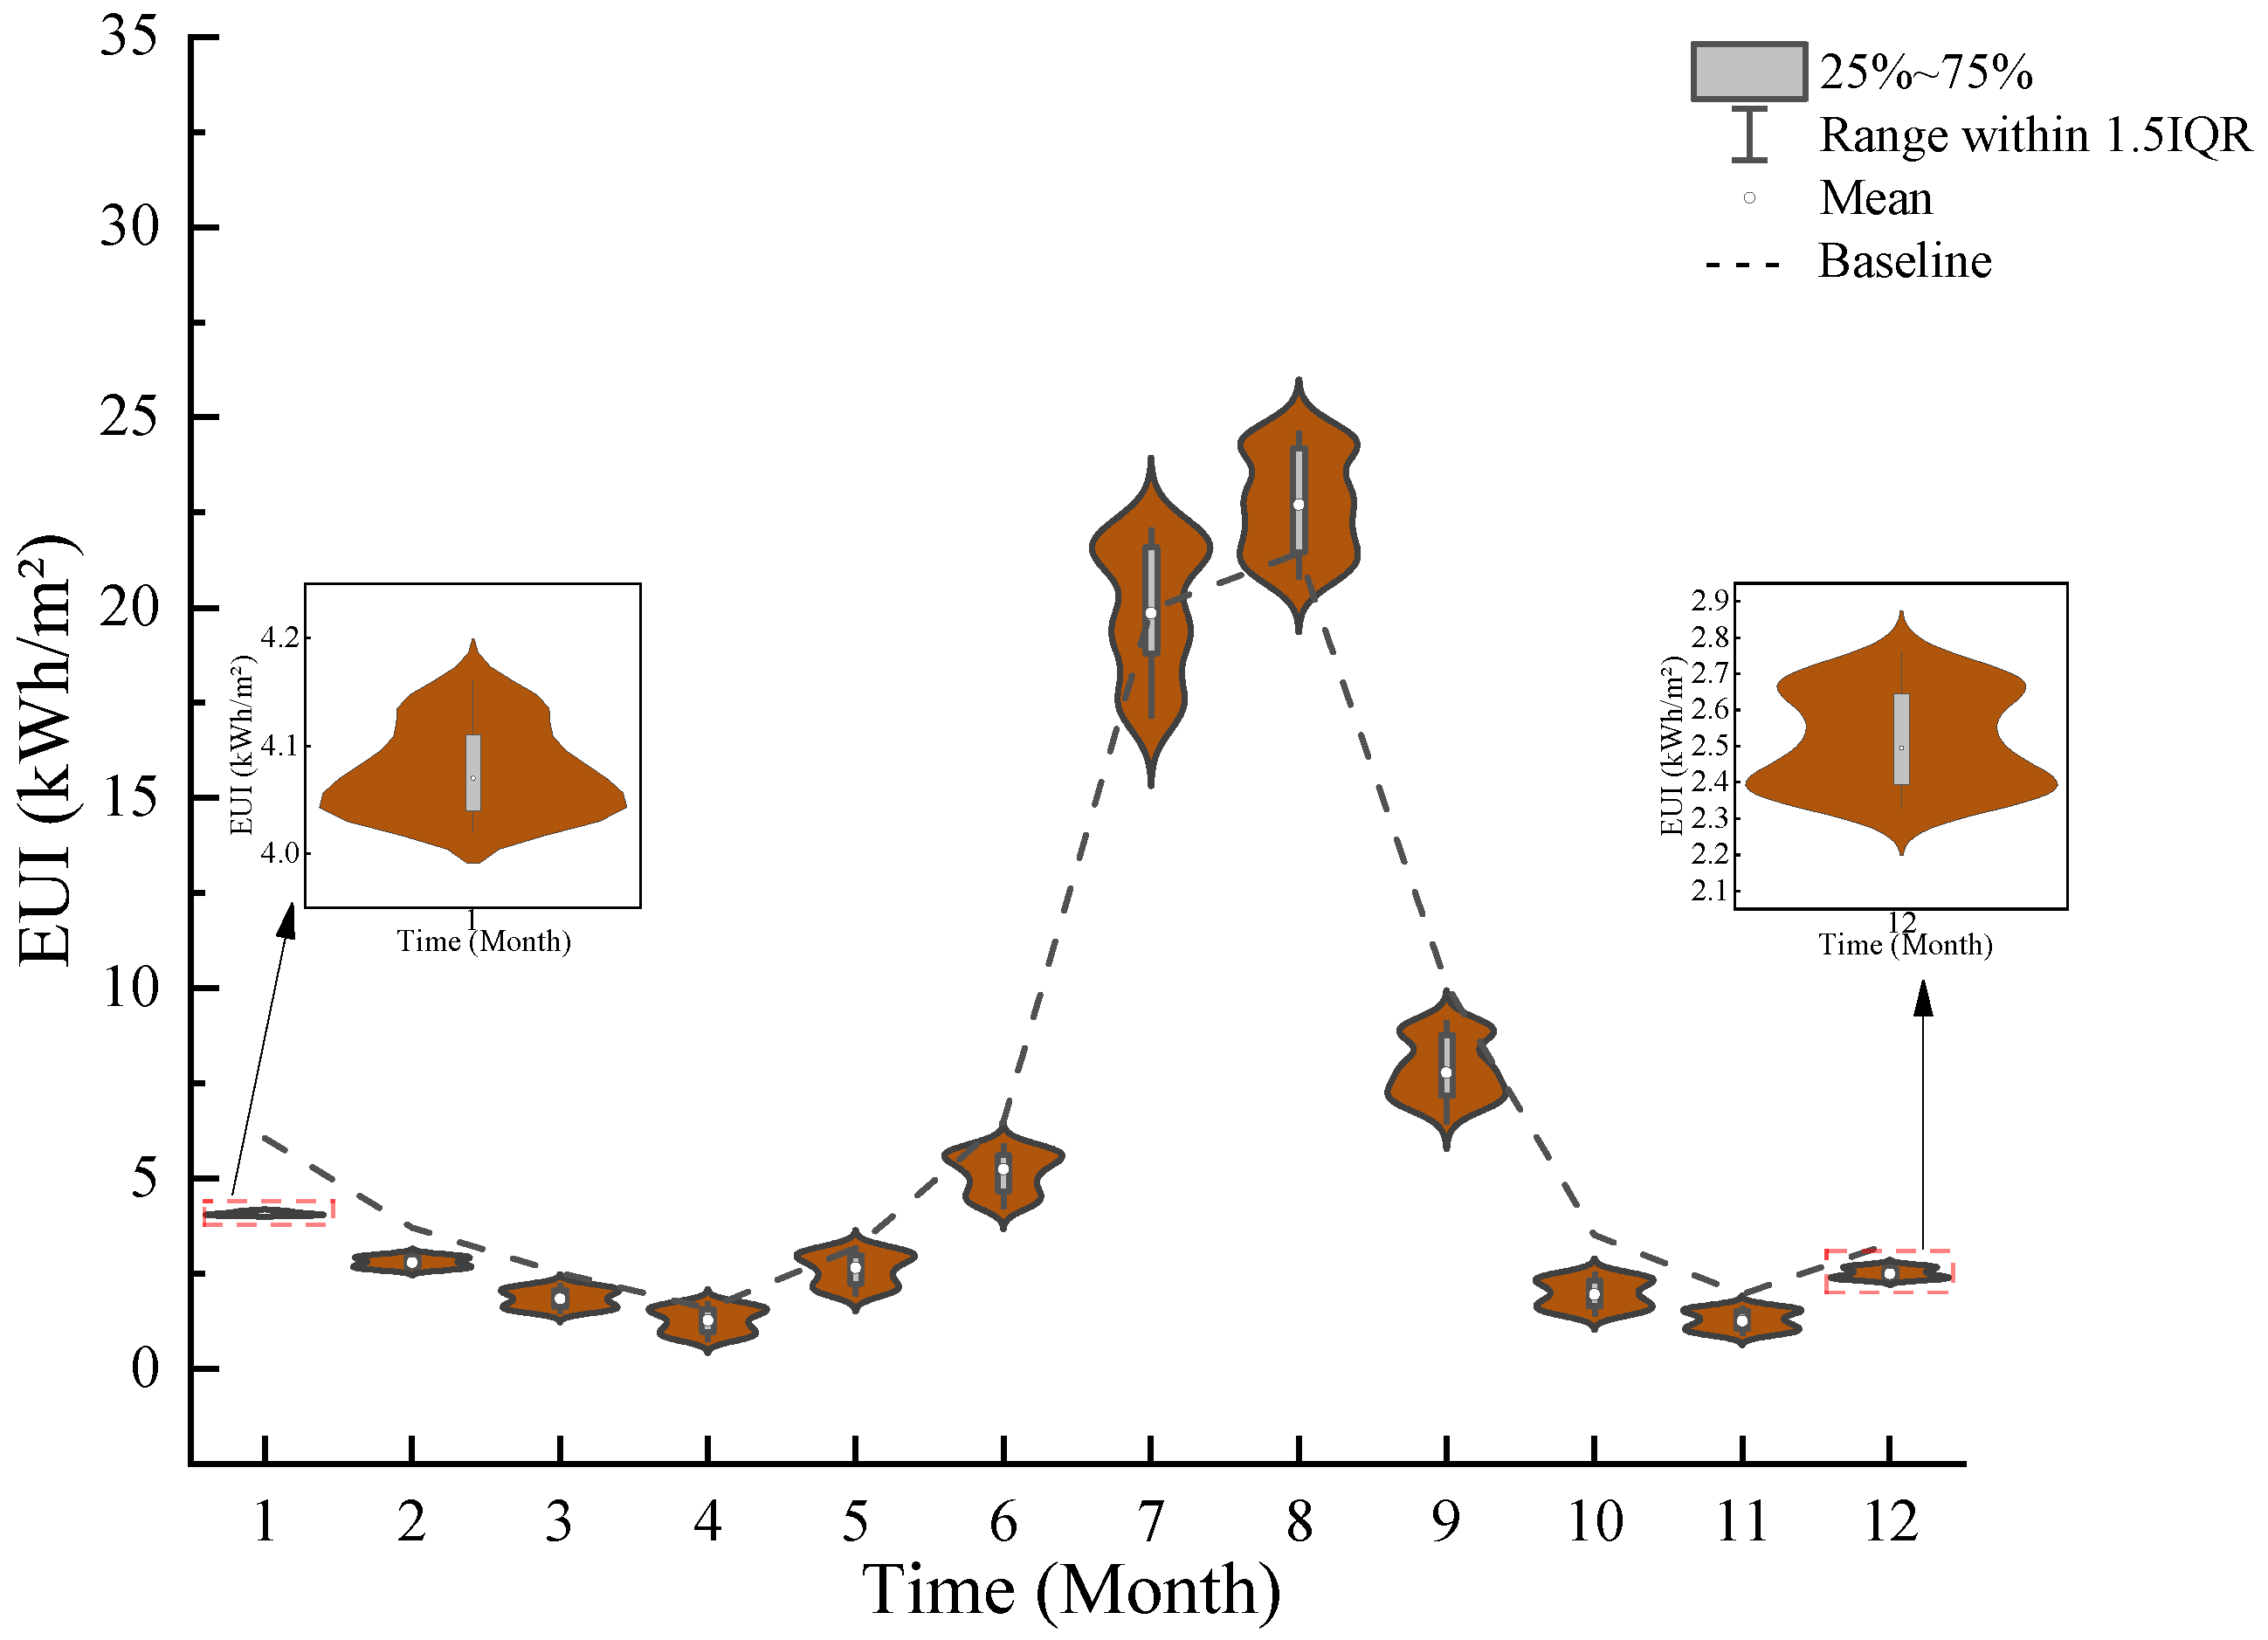
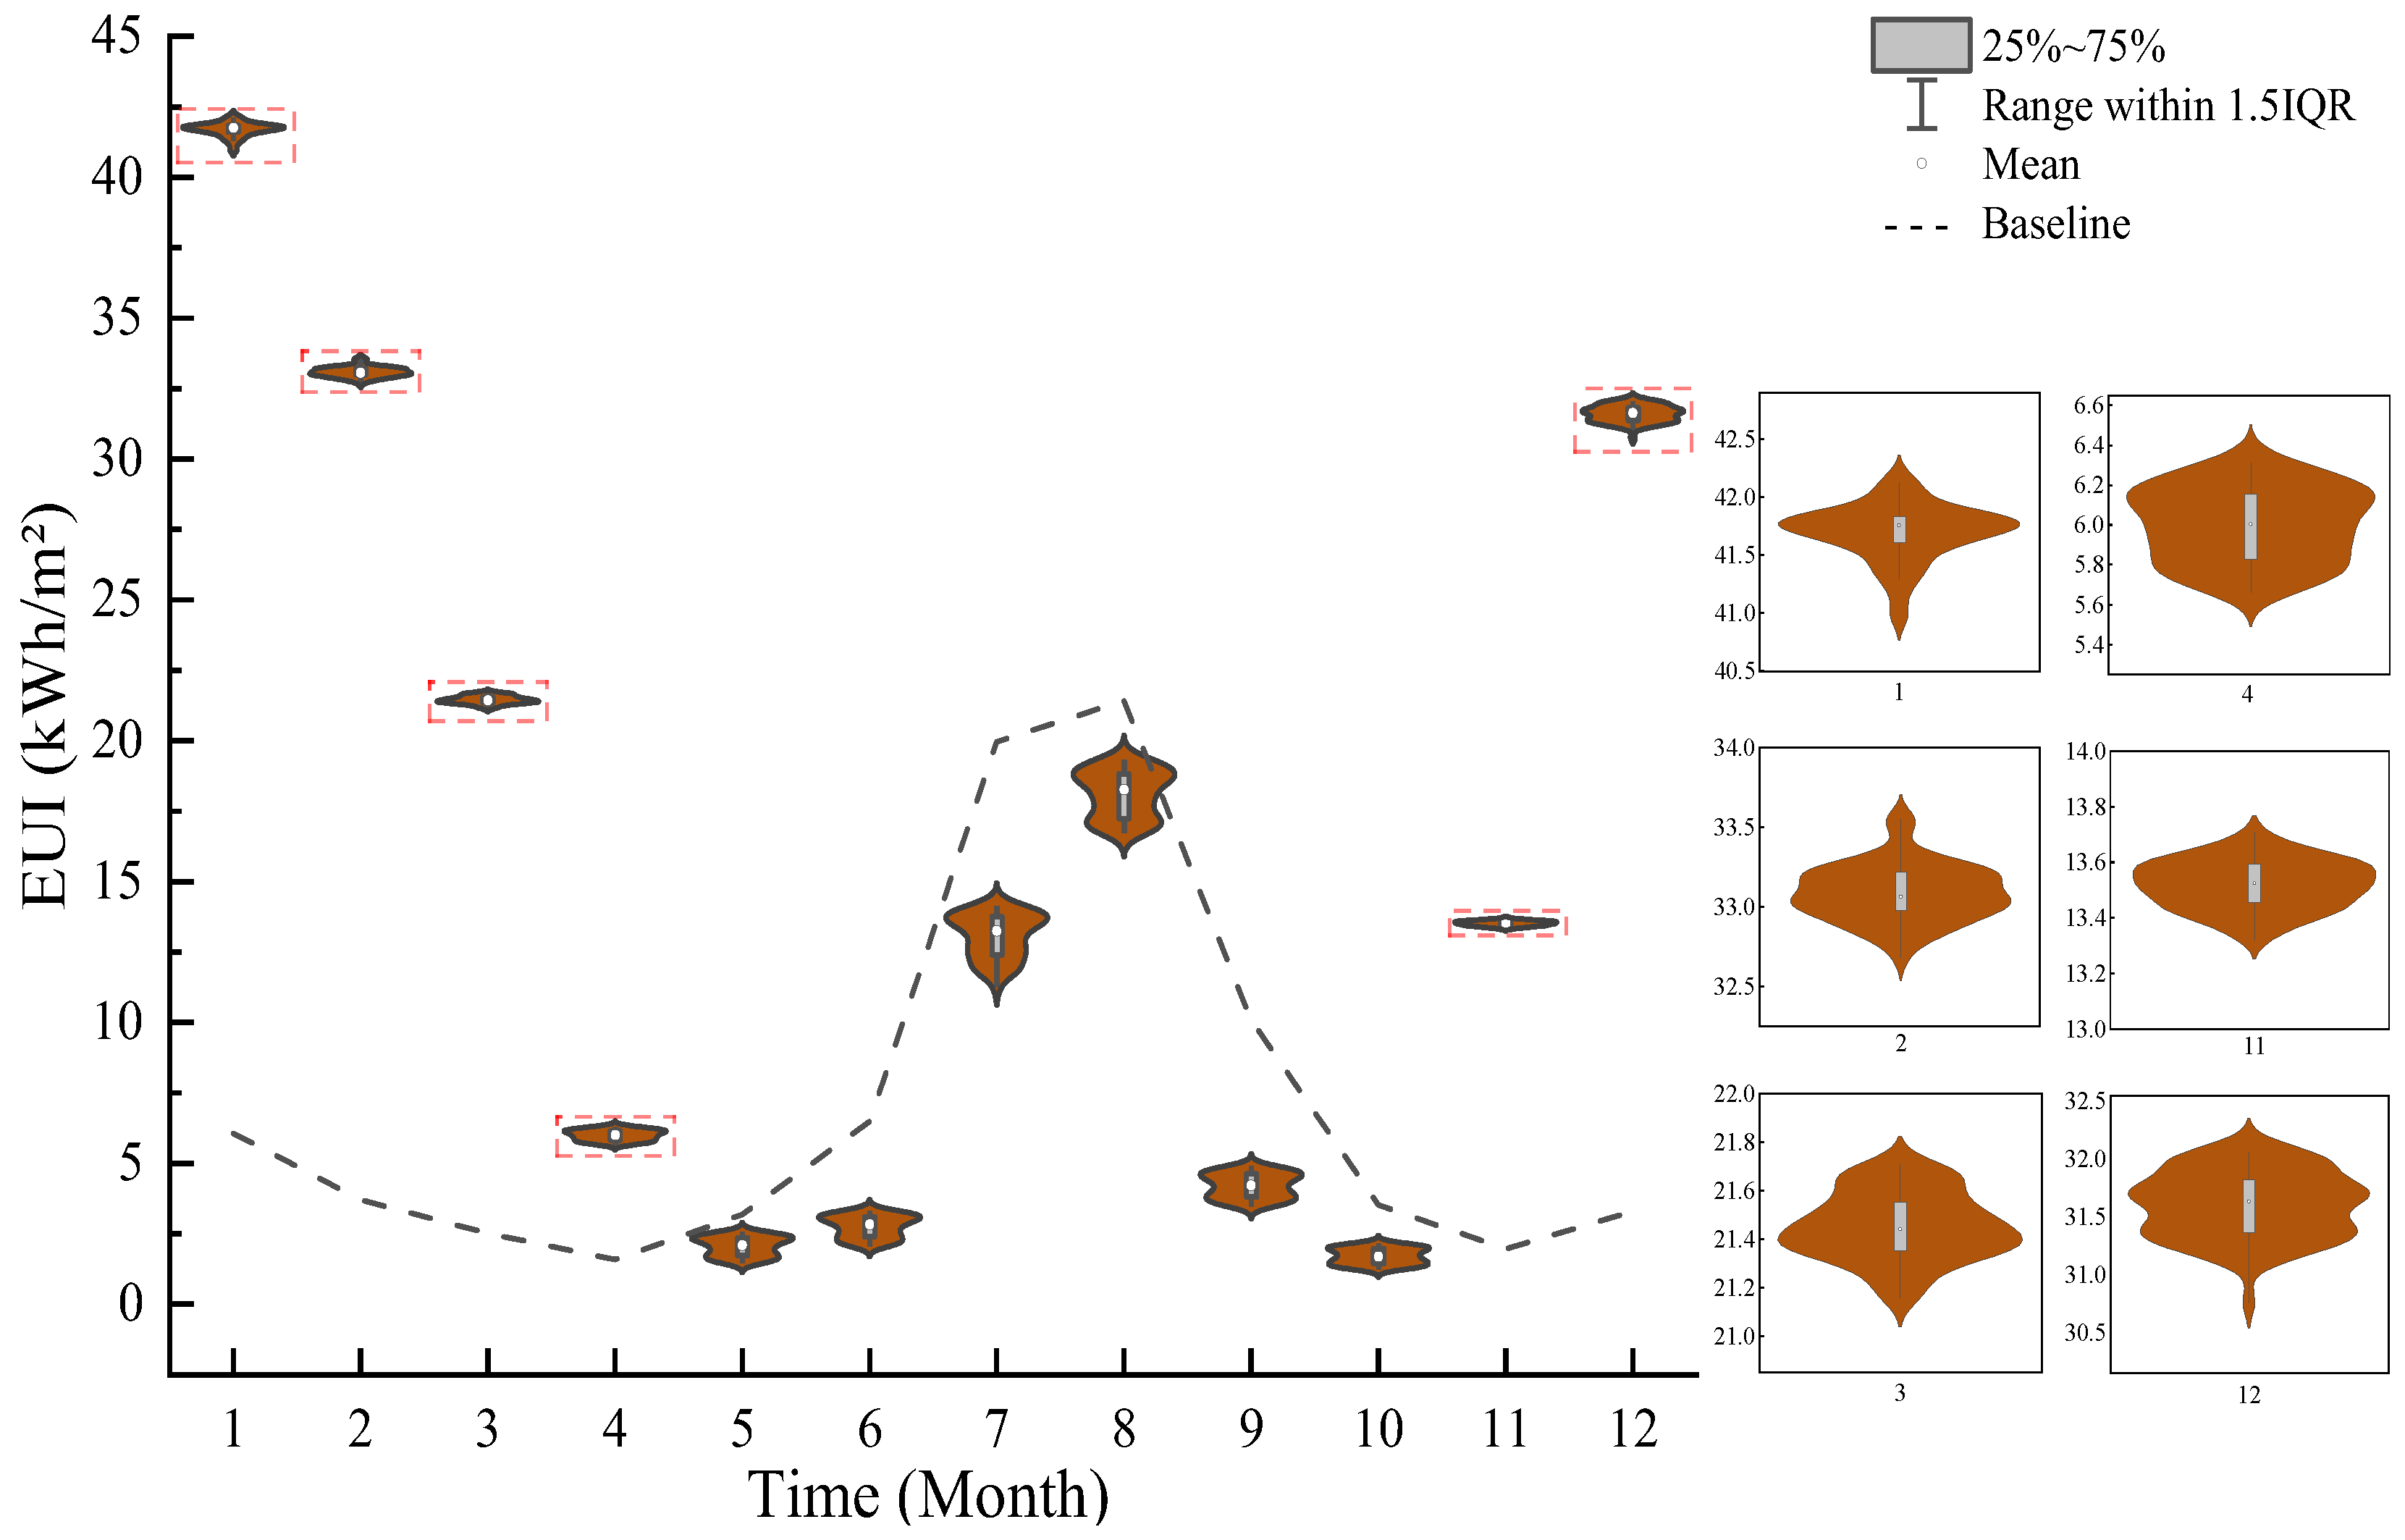
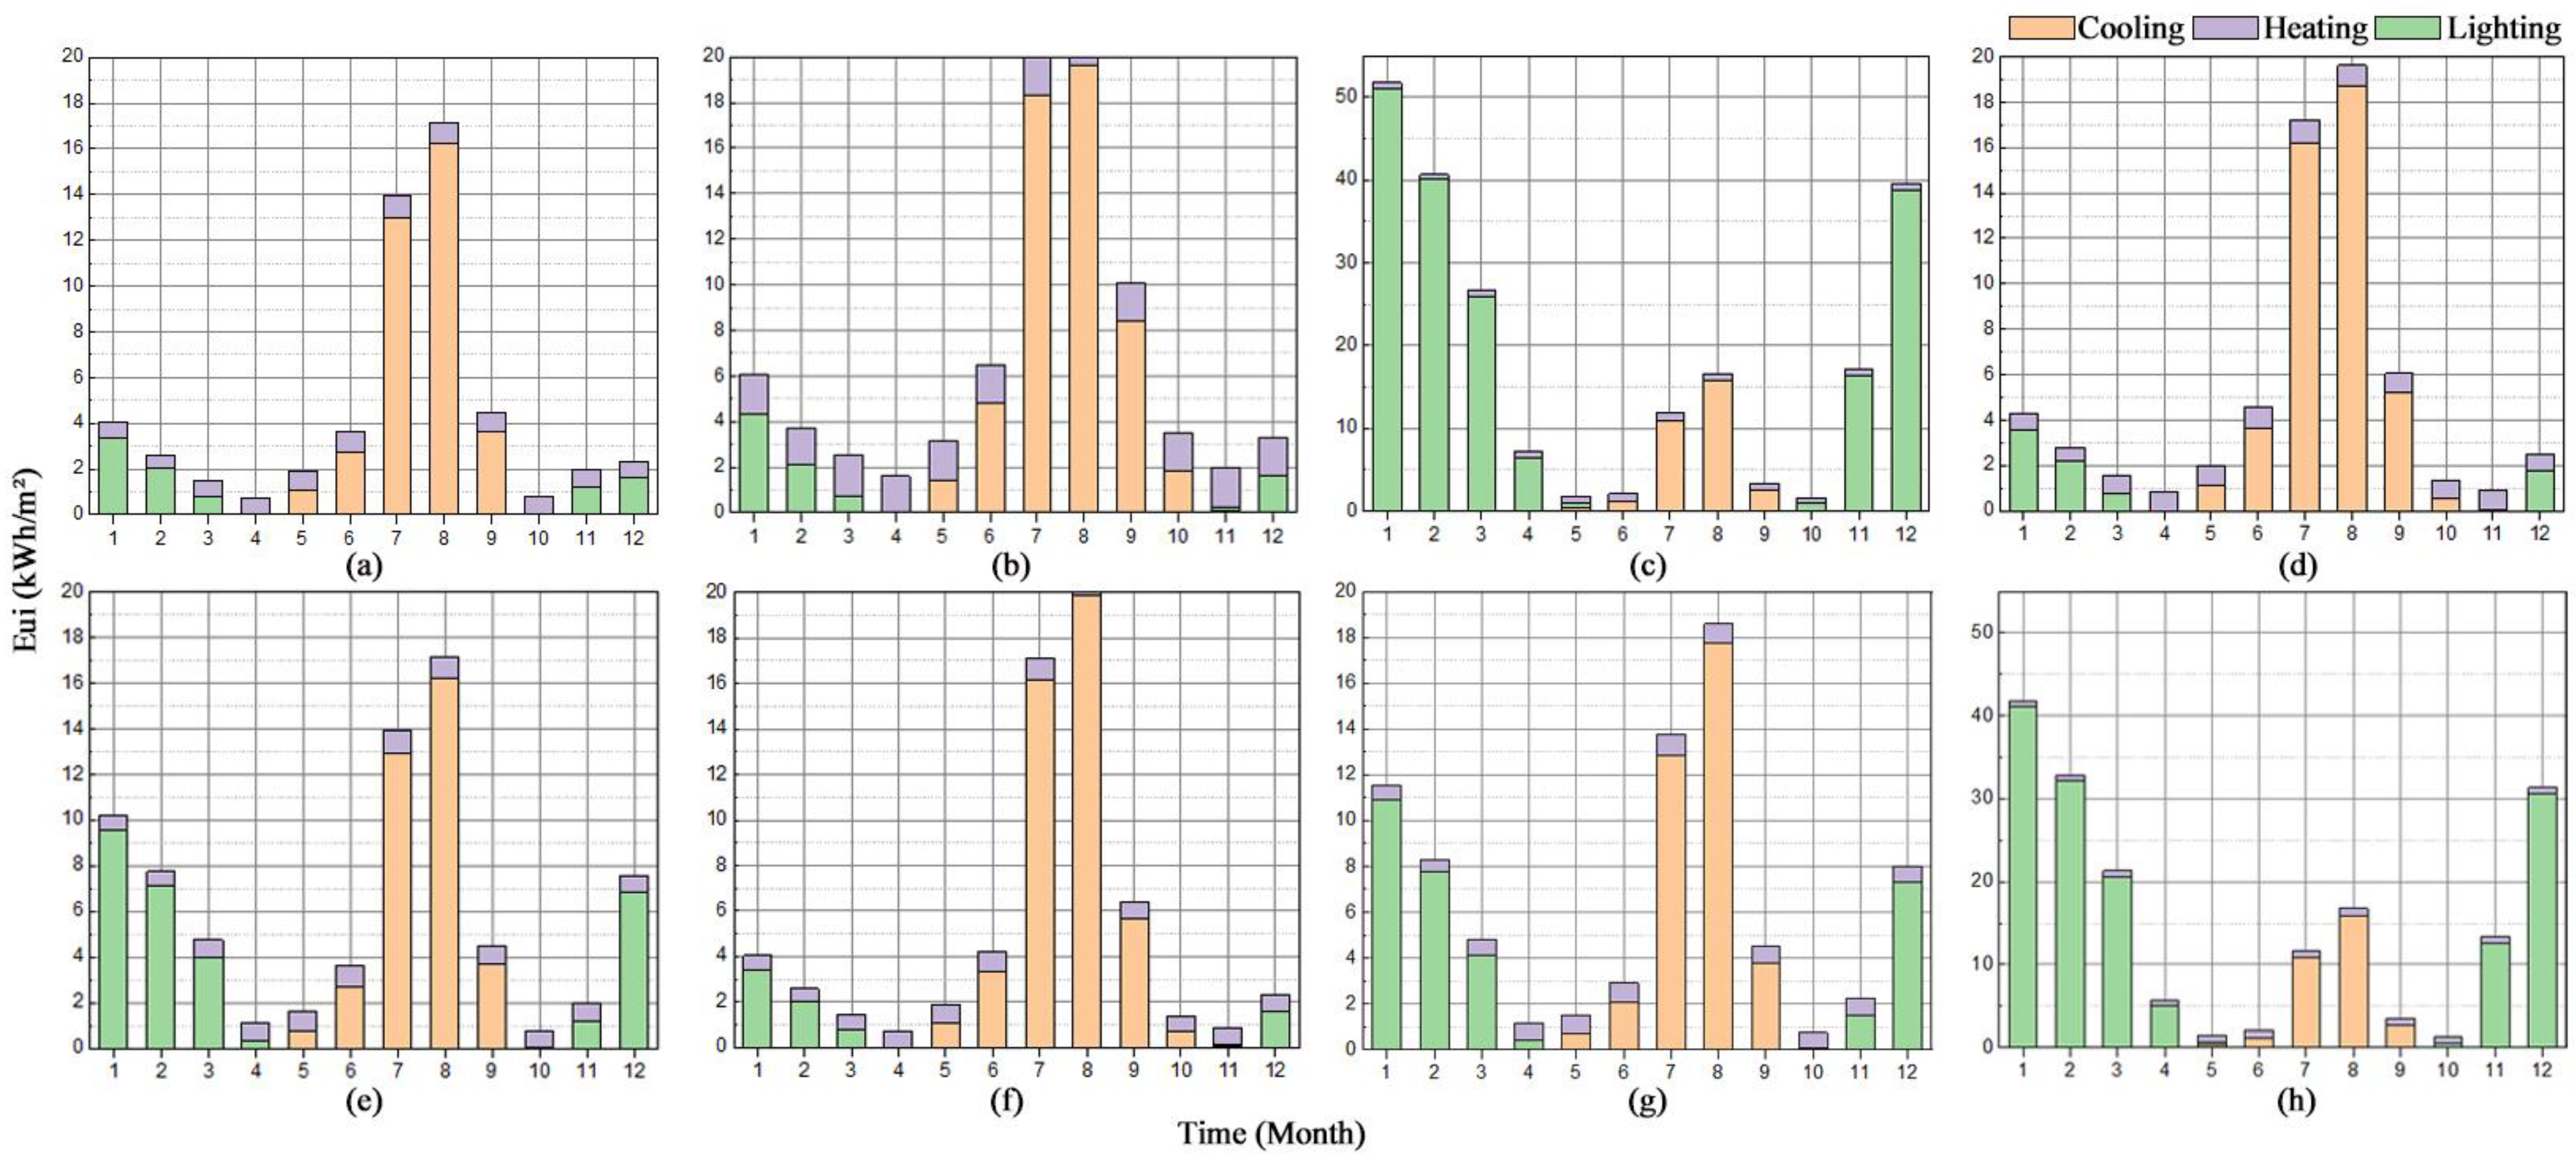
3.3.1. Annual Energy Consumption Potential
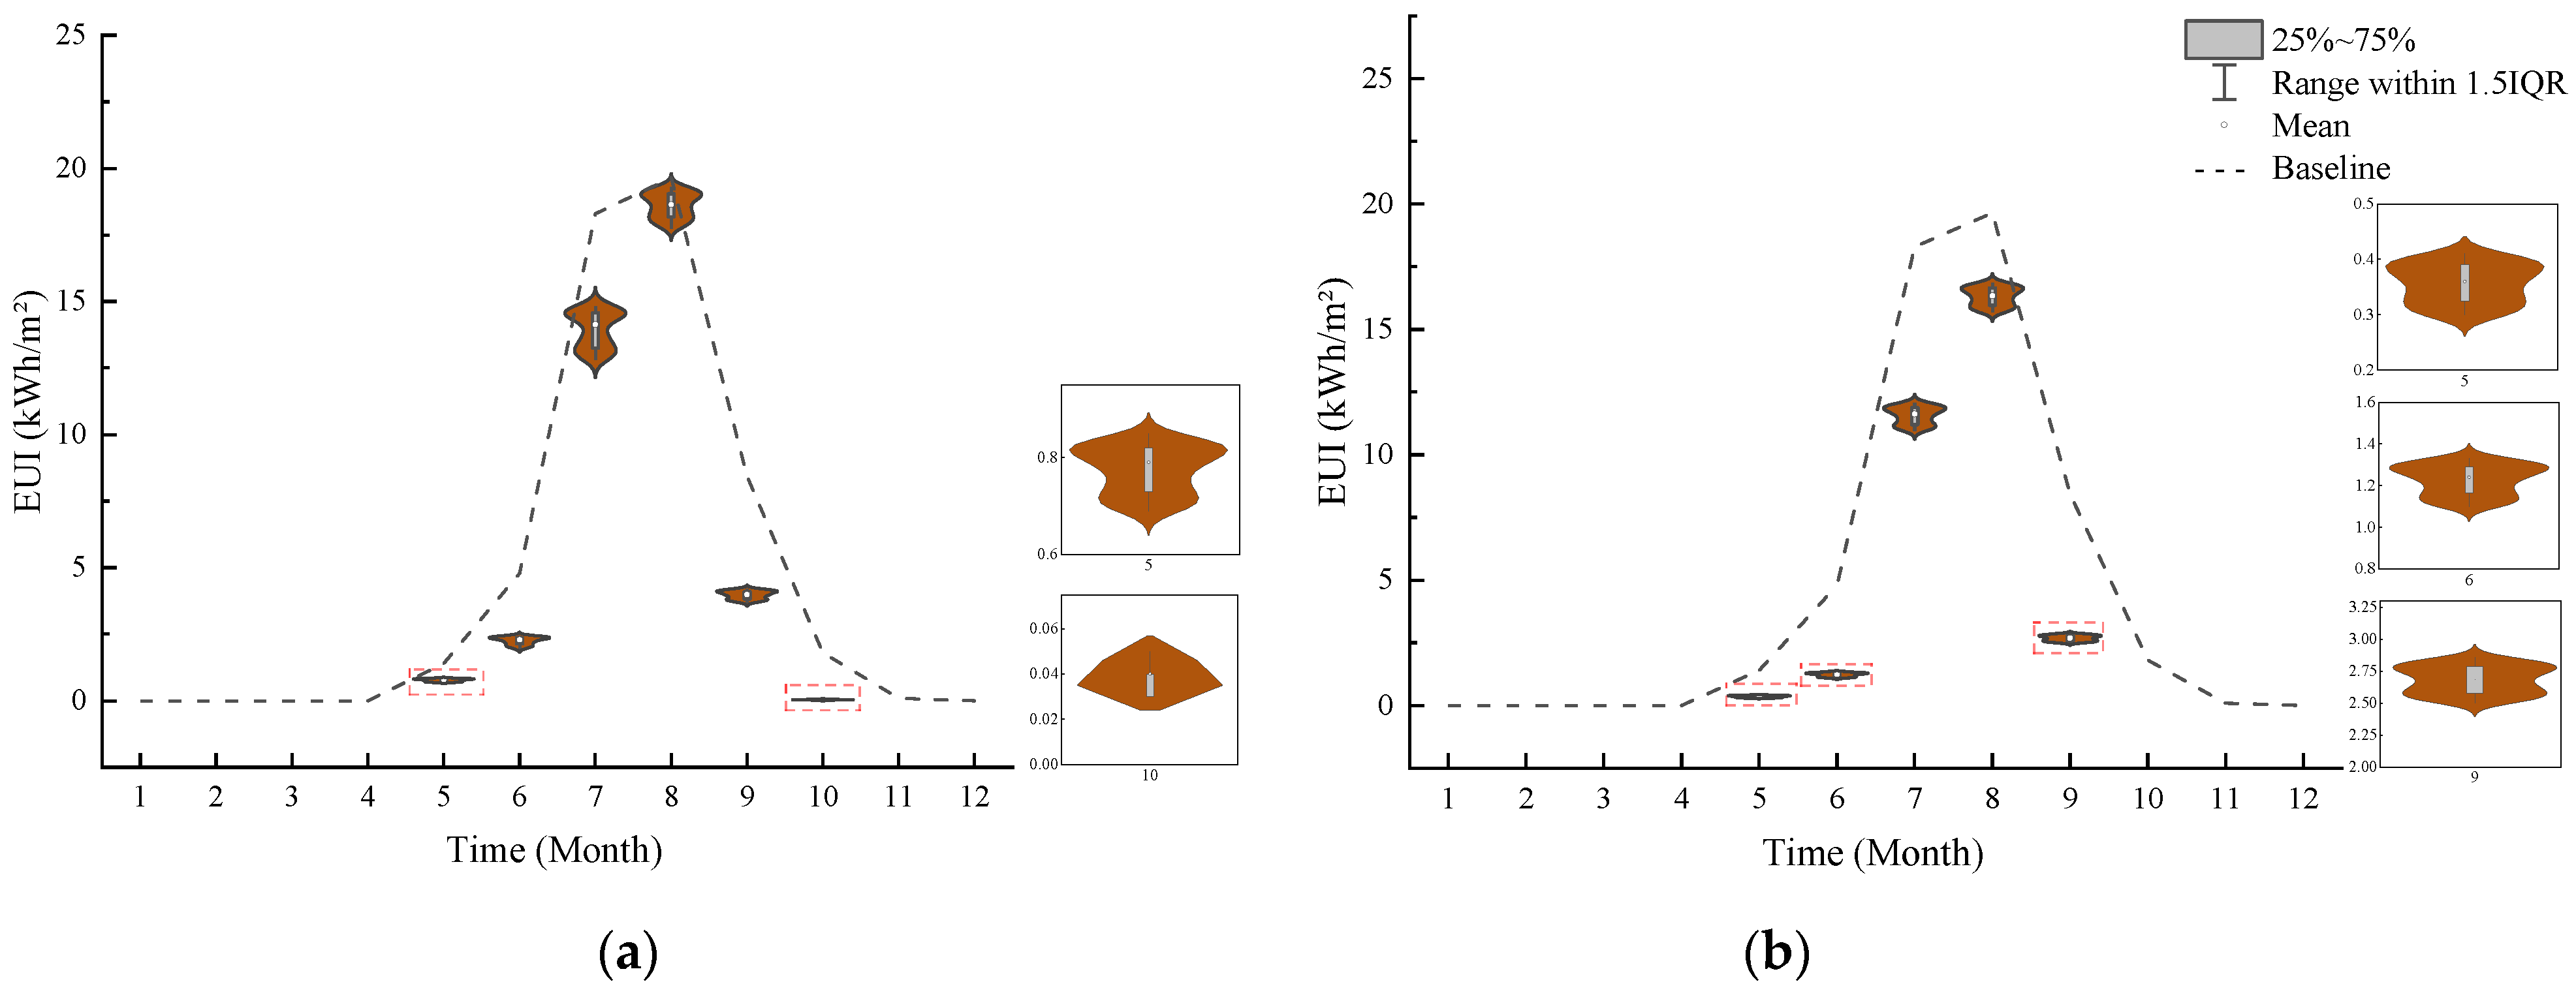
3.3.2. Ventilation Strategy 1—Fully Open Strategy
3.3.3. Ventilation Strategy 2—Fully Closed Strategy
3.3.4. Ventilation Strategy 3—External Circulation Strategy
3.3.5. Ventilation Strategy 4—Internal Circulation Strategy
3.3.6. Ventilation Strategy 5—Inside-Up, Outside-Down Opening Strategy
3.3.7. Ventilation Strategy 6—Inside-Down, Outside-Up Opening Strategy
3.4. Energy Consumption and Daylighting Potential of Center-Mounted Louver Ventilation Window
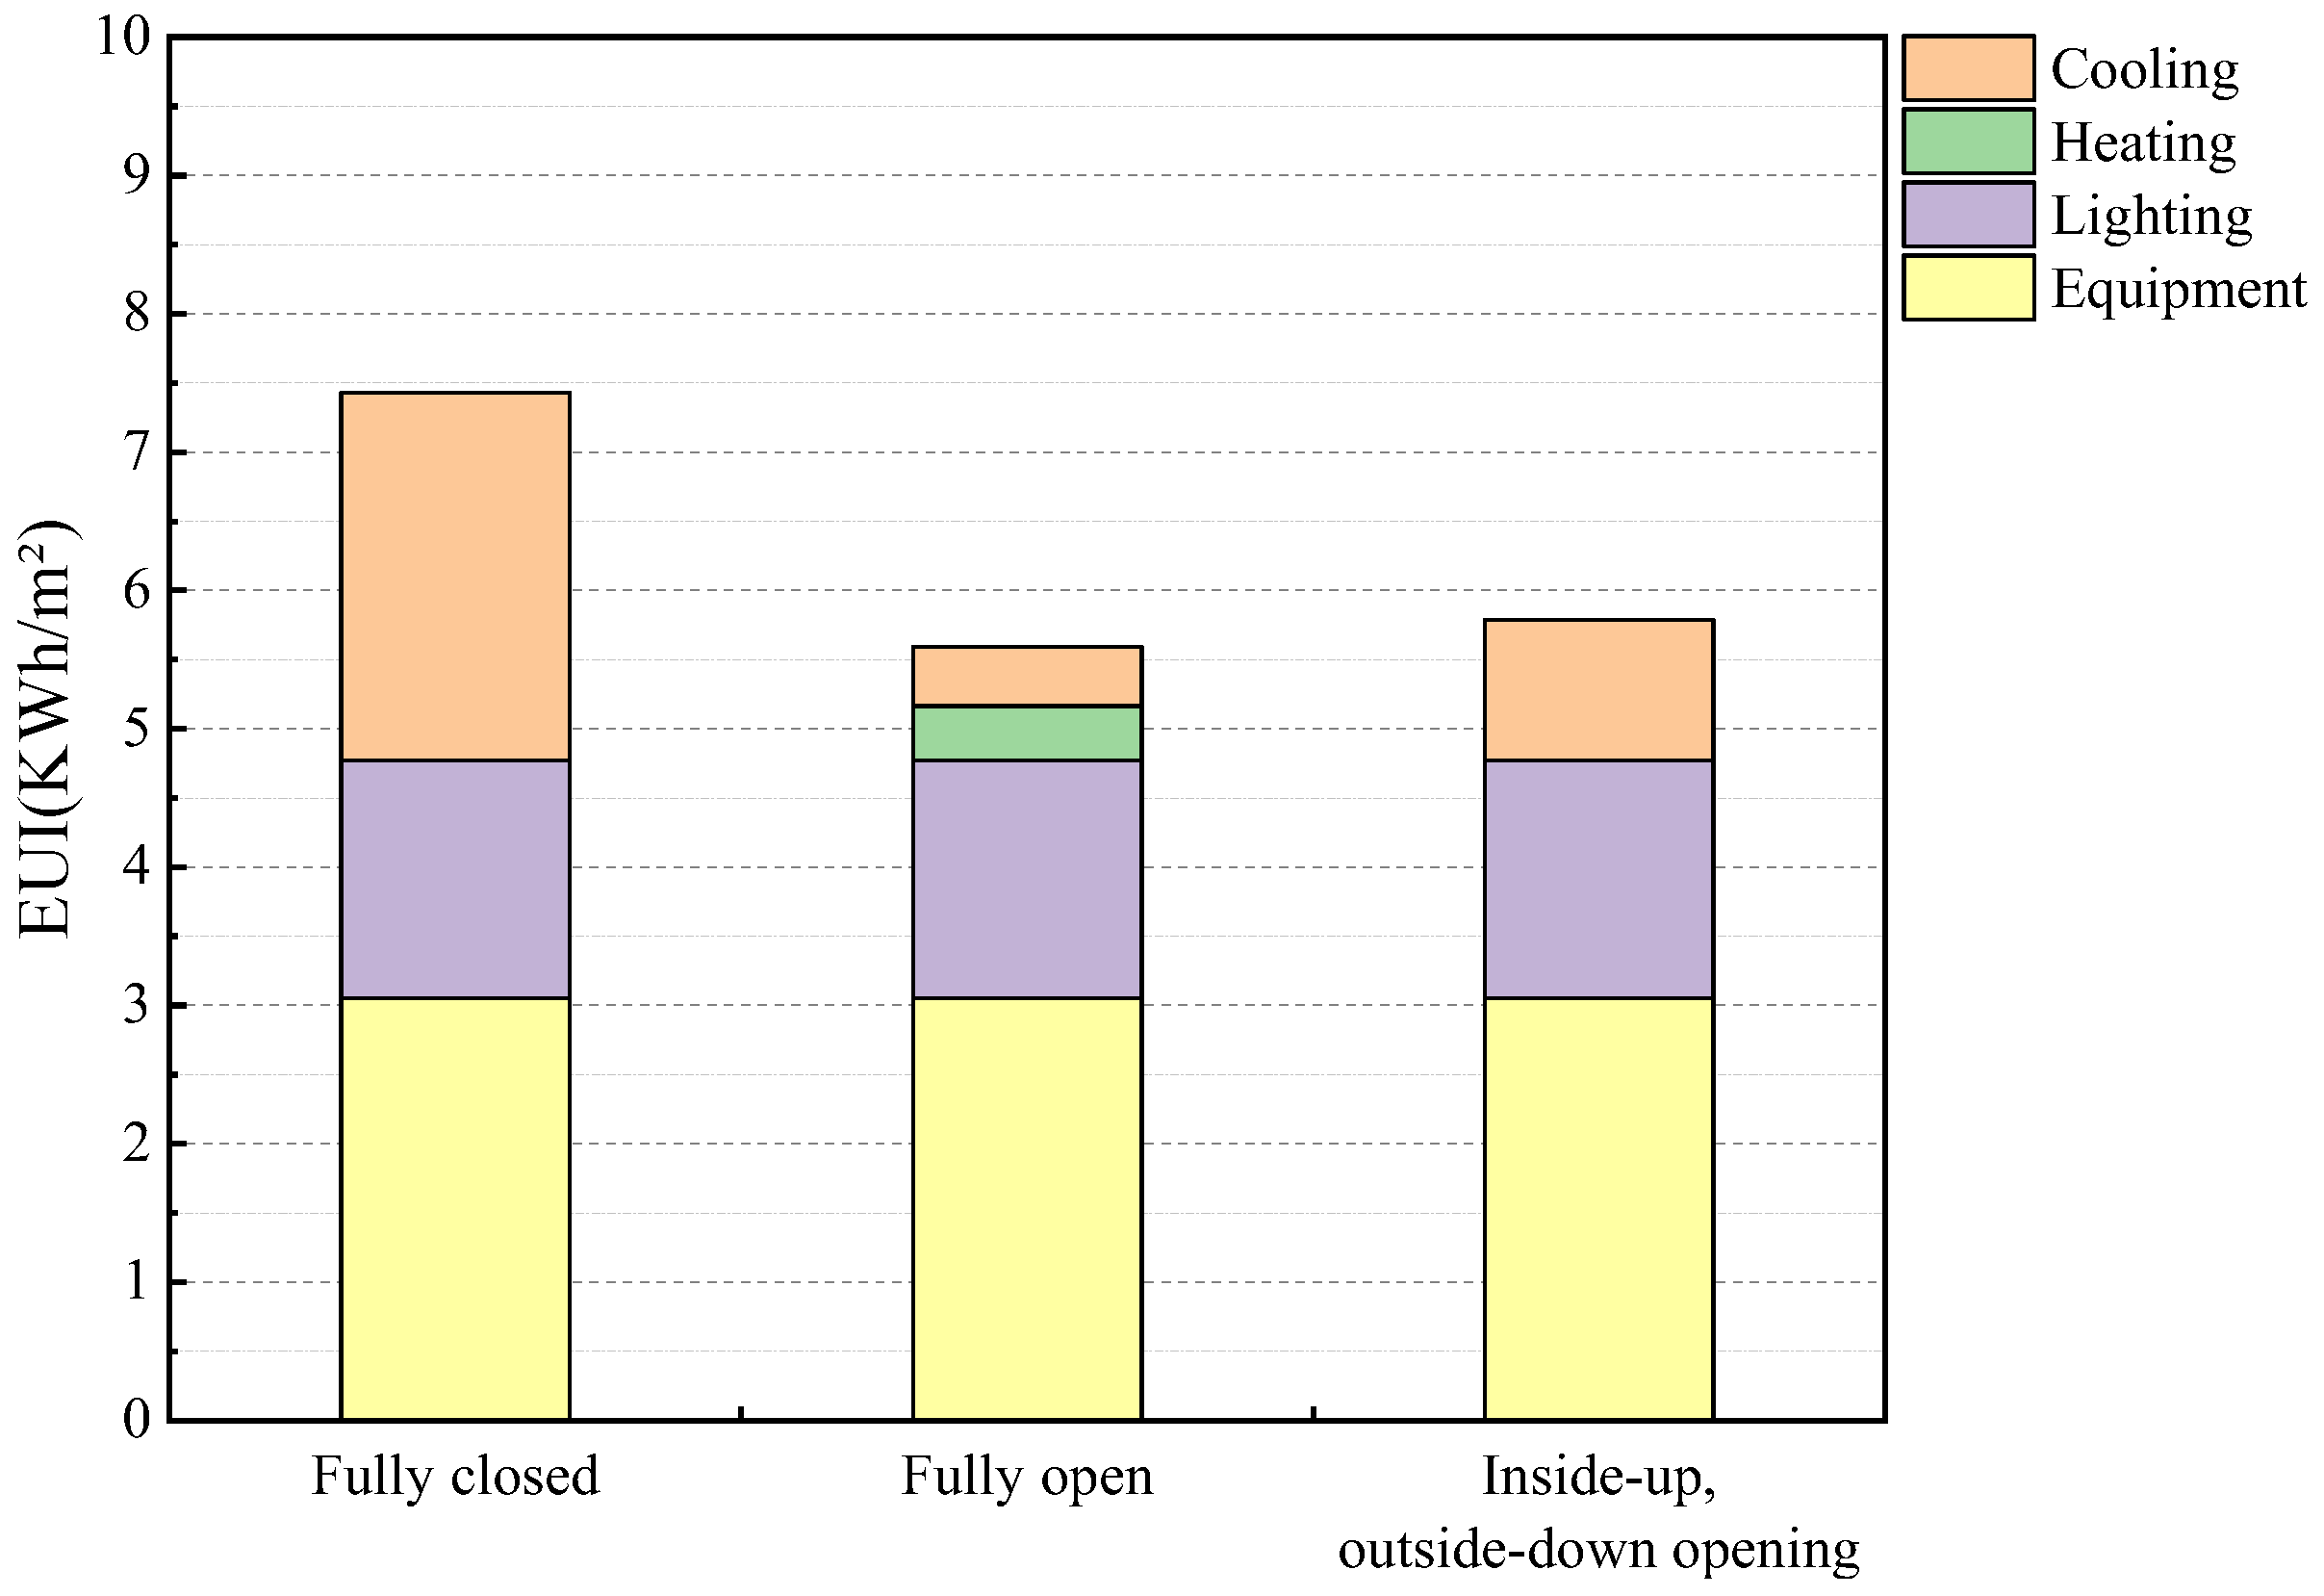
3.4.1. Energy Consumption Potential of Center-Mounted Louver Ventilation Window
3.4.2. Daylighting Potential of Center-Mounted Louver Ventilation Window
4. Discussion
5. Conclusions
- In terms of energy efficiency, the seasonal ventilation strategies and parameters of blinds were optimized to significantly improve the energy efficiency of the building. The optimized solution reduces energy consumption from 83.81 kWh/m2 to 55.0 kWh/m2, achieving a 34.4% reduction. It indicates that no ventilation or a single ventilation strategy is difficult to adapt to needs throughout the year, and the ventilation strategy needs to be flexibly adjusted according to seasonal changes.
- In terms of daylighting, the system shows stability characteristics. The indoor effective daylighting under different ventilation strategies remains at a high level, with a fluctuation range of 77.48–78.51%. The internal circulation strategy performs best in terms of daylighting effect (78.51%), which is slightly better than the baseline model (78.01%).
- Different ventilation strategies show obvious differences in seasonal adaptability: The external circulation strategy is most effective in summer by blocking hot air infiltration and using the chimney effect to remove cavity heat. The internal circulation strategy performs best in winter and can effectively use solar radiation to raise the indoor temperature by 1–2 °C. The transition season needs to consider the regional climate, especially the influence of the seasonal lag effect, and flexibly adjust the operation strategy.
- Regional climate characteristics have an important impact on system performance. This study found that in Qingdao, due to its coastal location, the climate has oceanic characteristics. The thermal inertia effect of the building and seasonal lag of the building envelope will affect the actual effect of the ventilation strategy and need to be specially considered in operation optimization.
Author Contributions
Funding
Institutional Review Board Statement
Informed Consent Statement
Data Availability Statement
Acknowledgments
Conflicts of Interest
References
- Building on the Past and Starting a New Journey to Address Climate Change Globally. Available online: http://www.gov.cn/gongbao/content/2020/content_5570055.htm (accessed on 25 September 2024).
- Lakhdari, K.; Sriti, L.; Painter, B. Parametric optimization of daylight, thermal and energy performance of middle school classrooms, case of hot and dry regions. Build. Environ. 2021, 204, 108173. [Google Scholar] [CrossRef]
- Bakmohammadi, P.; Noorzai, E. Optimization of the design of the primary school classrooms in terms of energy and daylight performance considering occupants’ thermal and visual comfort. Energy Rep. 2020, 6, 1590–1607. [Google Scholar] [CrossRef]
- AlAnzi, A.; Seo, D.; Krarti, M. Impact of building shape on thermal performance of office buildings in Kuwait. Energy Convers. Manag. 2009, 50, 822–828. [Google Scholar] [CrossRef]
- Haveman, S.P.; Bonnema, G.M.; van den Berg, F.G. Early insight in systems design through modeling and simulation. Procedia Comput. Sci. 2014, 28, 171–178. [Google Scholar] [CrossRef]
- Yin, X.; Muhieldeen, M.W. Evaluation of cooling energy saving and ventilation renovations in office buildings by combining bioclimatic design strategies with CFD-BEM coupled simulation. J. Build. Eng. 2024, 91, 109547. [Google Scholar] [CrossRef]
- Lin, B.; Chen, H.; Liu, Y.; He, Q.; Li, Z. A preference-based multi-objective building performance optimization method for early design stage. Build. Simul. 2020, 14, 477–494. [Google Scholar] [CrossRef]
- Liu, K.; Tian, J.; Chen, J.; Wen, Y. Low-Carbon retrofitting path of existing public buildings: A comparative study based on green building rating systems. Energies 2022, 15, 8724. [Google Scholar] [CrossRef]
- Halawa, E.; Ghaffarianhoseini, A.; Ghaffarianhoseini, A.; Trombley, J.; Hassan, N.; Baig, M.; Yusoff, S.Y.; Ismail, M.A. A review on energy conscious designs of building façades in hot and humid climates: Lessons for (and from) Kuala Lumpur and Darwin. Renew. Sustain. Energy Rev. 2018, 82, 2147–2161. [Google Scholar] [CrossRef]
- Pilechiha, P.; Mahdavinejad, M.; Rahimian, F.P.; Carnemolla, P.; Seyedzadeh, S. Multi-objective optimisation framework for designing office windows: Quality of view, daylight and energy efficiency. Appl. Energy 2020, 261, 114356. [Google Scholar] [CrossRef]
- Kangazian, A.; Razavi, S.Z.E. Multi-criteria evaluation of daylight control systems of office buildings considering daylighting, glare and energy consumption. Sol. Energy 2023, 263, 111928. [Google Scholar] [CrossRef]
- Omrany, H.; Ghaffarianhoseini, A.; Ghaffarianhoseini, A.; Raahemifar, K.; Tookey, J. Application of passive wall systems for improving the energy efficiency in buildings: A comprehensive review. Renew. Sustain. Energy Rev. 2016, 62, 1252–1269. [Google Scholar] [CrossRef]
- Todorović, B.; Cvjetković, T. Glass Envelope above the Basic One–Influence on Energy Demand. In Proceedings of the 2001 IEEE International Conference on Data Mining, San Jose, CA, USA, 29 November–2 December 2001. [Google Scholar]
- Hien, W.N.; Liping, W.; Chandra, A.N.; Pandey, A.R.; Xiaolin, W. Effects of double glazed facade on energy consumption, thermal comfort and condensation for a typical office building in Singapore. Energy Build. 2005, 37, 563–572. [Google Scholar] [CrossRef]
- Huo, H.; Xu, W.; Li, A.; Lv, Y.; Liu, C. Analysis and optimization of external venetian blind shading for nearly zero-energy buildings in different climate regions of China. Sol. Energy 2021, 223, 54–71. [Google Scholar] [CrossRef]
- Ghaffarianhoseini, A.; Ghaffarianhoseini, A.; Berardi, U.; Tookey, J.; Li, D.H.W.; Kariminia, S. Exploring the advantages and challenges of double-skin façades (DSFs). Renew. Sustain. Energy Rev. 2016, 60, 1052–1065. [Google Scholar] [CrossRef]
- Lyberg, M.D. Energy losses due to airing by occupants. In Proceedings of the CIB W67 3rd International Symposium ‘Energy Conservation in the Built Environment’, Dublin, Ireland, 30 March–1 April 1982. [Google Scholar]
- European Centre for Disease Prevention and Control. Heating, Ventilation and Air-Conditioning Systems in the Context of COVID-19: First Update, s.L; European Centre for Disease Prevention and Control: Solna, Sweden, 2020. [Google Scholar]
- n.d International Well Building Institute, Operable Windows [Online]. Available online: https://standard.wellcertified.com/air/operable-windows (accessed on 25 September 2024).
- Department of Health and Social Care. New Film Shows Importance of Ventilation to Reduce Spread of COVID-19; Department of Health and Social Care: London, UK, 2020. [Google Scholar]
- Scientific Advisory Group for Emergencies, EMG: Role of Ventilation in Controlling SARS-CoV-2 Transmission, 30 September 2020. 2020; [Online]. Available online: https://www.gov.uk/government/publications/emg-role-of-ventilation-in-controlling-sars-cov-2-transmission-30-september-2020 (accessed on 25 September 2024).
- Yu, J.; Ouyang, Q.; Zhu, Y.; Shen, H.; Cao, G.; Cui, W. A comparison of the thermal adaptability of people accustomed to air-conditioned environments and naturally ventilated environments. Indoor Air 2012, 22, 110–118. [Google Scholar] [CrossRef]
- Energy Efficiency Best Practice Programme (EEBPP). Energy Consumption Guide 19; Energy Efficiency Office/HMSO: London, UK, 1993. [Google Scholar]
- Allard, F. Natural Ventilation in Buildings; James & James (Science Publisher) Ltd.: London, UK, 1998. [Google Scholar]
- Su, Z.; Li, X.; Xue, F. Double-skin façade optimization design for different climate zones in China. Sol. Energy 2017, 155, 281–290. [Google Scholar] [CrossRef]
- Kim, D.D. Computational fluid dynamics assessment for the thermal performance of double-skin façades in office buildings under hot climatic condition. Build. Serv. Eng. Res. Technol. 2021, 42, 45–61. [Google Scholar] [CrossRef]
- Wong, P.C.; Prasad, D.; Behnia, M. A new type of double-skin façade configuration for the hot and humid climate. Energy Build. 2008, 40, 1941–1945. [Google Scholar] [CrossRef]
- Gratia, E.; De Herde, A. Natural ventilation in a double-skin facade. Energy Build. 2004, 36, 137–146. [Google Scholar] [CrossRef]
- Jiang, F.; Tao, S.; Tao, Q.; Yuan, Y.; Zheng, J. The effect of louver blinds on the wind-driven cross ventilation of multi-storey buildings. J. Build. Eng. 2022, 54, 104614. [Google Scholar] [CrossRef]
- Movassag, S.Z.; Zamzamian, K. Numerical investigation on the thermal performance of double glazing air flow window with integrated blinds. Renew. Energy 2020, 148, 852–863. [Google Scholar] [CrossRef]
- Tao, Y.; Fang, X.; Setunge, S.; Tu, J.; Liu, J.; Shi, L. Naturally ventilated double-skin façade with adjustable louvers. Sol. Energy 2021, 225, 33–43. [Google Scholar] [CrossRef]
- Lin, Z.; Song, Y.; Chu, Y. Summer performance of a naturally ventilated double-skin facade with adjustable glazed louvers for building energy retrofitting. Energy Build. 2022, 267, 112163. [Google Scholar] [CrossRef]
- Choi, W.; Joe, J.; Kwak, Y.; Huh, J.-H. Operation and control strategies for multi-storey double skin facades during the heating season. Energy Build. 2012, 49, 454–465. [Google Scholar] [CrossRef]
- Kong, X.; Liu, S.; Yang, H.; Zhong, Y.; Qi, C. An experimental study of all-season operation strategy for a respiration-type double-layer glass curtain wall system in cold zone of China. Build. Environ. 2016, 97, 166–176. [Google Scholar] [CrossRef]
- Nguyen, A.-T.; Reiter, S.; Rigo, P. A review on simulation-based optimization methods applied to building performance analysis. Appl. Energy 2014, 113, 1043–1058. [Google Scholar] [CrossRef]
- Sun, H.; Wang, Y.; Liu, R.; Yin, P.; Li, D.; Shao, L. Speciation and source changes of atmospheric arsenic in Qingdao from 2016 to 2020-Response to control policies in China. Chemosphere 2023, 313, 137438. [Google Scholar] [CrossRef]
- Sun, B.; Duan, M.; Li, X.; Cui, B. Research on human thermal comfort of dalian office buildings in winter. 040(008) (2021) 1-6. Available online: https://www.doc88.com/p-70487163023401.html (accessed on 25 September 2024).
- The Daylight Metrics Committee. IES Spatial Daylight Autonomy (sDA) and Annual Sunlight Exposure (ASE); Approved Method IES LM-83-12; Illuminating Engineering Society of North America: New York, NY, USA, 2012; Available online: https://store.ies.org/product/approved-method-ies-spatial-daylight-autonomy-sda-and-annual-sunlight-exposure-ase/?v=0b3b97fa6688 (accessed on 25 September 2024).
- Reinhart, C.F.; Mardaljevic, J.; Rogers, Z. Dynamic daylight performance metrics for sustainable building design. Leukos 2006, 3, 7–31. [Google Scholar] [CrossRef]
- Carlucci, S.; Causone, F.; De Rosa, F.; Pagliano, L. A review of indices for assessing visual comfort with a view to their use in optimization processes to support building integrated design. Renew. Sustain. Energy Rev. 2015, 47, 1016–1033. [Google Scholar] [CrossRef]
- Nabil, A.; Mardaljevic, J. Useful daylight illuminances: A replacement for daylight factors. Energy Build. 2006, 38, 905–913. [Google Scholar] [CrossRef]
- Mardaljevic, J.; Andersen, M.; Roy, N.; Christoffersen, J. Daylighting metrics: Is there a relation between useful daylight illuminance and daylight glare probabilty? In Proceedings of the Building Simulation and Optimization Conference BSO12, Loughborough, UK, 10–11 September 2012. [Google Scholar]
- GB 50034−2013; Standard for Lighting Design of Buildings. Standardization Administration of China: Beijing, China, 2013.
- Borgstein, E.; Lamberts, R.; Hensen, J. Evaluating energy performance in non-domestic buildings: A review. Energy Build. 2016, 128, 734–755. [Google Scholar] [CrossRef]
- Energy Star. US energy use intensity by property type. 2016. Available online: https://portfoliomanager.energystar.gov/pdf/reference/US%20National%20Median%20Table.pdf (accessed on 25 September 2024).
- Ng, E.Y.-Y.; Poh, L.K.; Wei, W.; Nagakura, T. Advanced lighting simulation in architectural design in the tropics. Autom. Constr. 2001, 10, 365–379. [Google Scholar] [CrossRef]
- Reinhart, C.F.; Andersen, M. Development and validation of a Radiance model for a translucent panel. Energy Build. 2006, 38, 890–904. [Google Scholar] [CrossRef]
- McNeil, A.; Lee, E.S. A validation of the Radiance three-phase simulation method for modelling annual daylight performance of optically complex fenestration systems. J. Build. Perform. Simul. 2013, 6, 24–37. [Google Scholar] [CrossRef]
- Reinhart, C.; Breton, P.-F. Experimental validation of Autodesk® 3ds Max® Design 2009 and DAYSIM 3.0. Leukos 2009, 6, 7–35. [Google Scholar] [CrossRef]
- Reinhart, C.F.; Walkenhorst, O. Validation of dynamic RADIANCE-based daylight simulations for a test office with external blinds. Energy Build. 2001, 33, 683–697. [Google Scholar] [CrossRef]
- Yoon, Y.; Moon, J.W.; Kim, S. Development of annual daylight simulation algorithms for prediction of indoor daylight illuminance. Energy Build. 2016, 118, 1–17. [Google Scholar] [CrossRef]
- Merghani, A.H.; Bahloul, S.A. Comparison between radiance daylight simulation software results andMeasured on-site data. J. Build. Road Res. 2016, 20, 48–69. [Google Scholar] [CrossRef]
- American Society of Heating Refrigerating and Air-Conditioning Engineers. Guideline 14-2014, Measurement of Energy and Demand Savings; American Society of Heating, Refrigerating, and Air-conditioning Engineers: Atlanta, GA, USA, 2014. [Google Scholar]
- Manz, H. Total solar energy transmittance of glass double façades with free convection. Energy Build. 2004, 36, 127–136. [Google Scholar] [CrossRef]
- Xu, L.; Ojima, T. Field experiments on natural energy utilization in a residential house with a double skin façade system. Build. Environ. 2007, 42, 2014–2023. [Google Scholar] [CrossRef]
- Yılmaz, Z.; Çetintaş, F. Double skin façade’s effects on heat losses of office buildings in Istanbul. Energy Build. 2005, 37, 691–697. [Google Scholar] [CrossRef]
- El-Sadi, H.; Haghighat, F.; Fallahi, A. CFD analysis of turbulent natural ventilation in double-skin façade: Thermal mass and energy efficiency. J. Energy Eng. 2010, 136, 68–75. [Google Scholar] [CrossRef]


| Building Elements | R Reflectance | G Reflectance | B Reflectance | Roughness | Specularity |
|---|---|---|---|---|---|
| White wall | 0.9 | 0.9 | 0.9 | 0.65 | 0.0064 |
| Dark gray ceiling | 0.17 | 0.17 | 0.17 | 0.002 | 0.005 |
| Light gray floor | 0.42 | 0.42 | 0.42 | 0.001 | 0.02 |
| Glass Elements | R Transmittance | G Transmittance | B Transmittance | Refraction |
|---|---|---|---|---|
| Interior | 0.65 | 0.65 | 0.65 | 1.52 |
| Exterior | 0.58 | 0.58 | 0.58 | 1.52 |
| Material | Thickness | Conductivity | Density | Specific Heat | Roughness |
|---|---|---|---|---|---|
| Veneer | 0.01 m | 0.69 W/m·K | 1858 Kg/m3 | 836 J/kg·K | Rough |
| Aluminum silicate cotton | 0.12 m | 0.05 W/m·K | 120 Kg/m3 | 1220 J/kg·K | Very rough |
| Concrete | 0.22 m | 0.80 W/m·K | 1800 Kg/m3 | 1250 J/kg·K | Smooth |
| Tile | 0.005 m | 0.69 W/m·K | 1050 Kg/m3 | 1000 J/kg·K | Medium rough |
| Insulation | 0.12 m | 0.039 W/m·K | 100 Kg/m3 | 1300 J/kg·K | Rough |
| Material | Thickness | Transmittance | Reflectance | Infrared Transmittance | Conductivity |
|---|---|---|---|---|---|
| Clean glass | 0.006 m | 0.85 | 0.071 | 0 | 0.85 W/m·K |
| Low-e glass | 0.006 m | 0.6 | 0.06 | 0 | 0.85 W/m·K |
| Name | Definition | Advantage | Limitation |
|---|---|---|---|
| DF (daylight factor) | The ratio of the light level inside a structure to the daylighting level outside the structure. | Easy to understand and calculate. | It does not take into account the variable sky radiation, solar altitude angle, and direction in actual situations. It only emphasizes the quantity of daylighting but does not consider the quality. |
| DA (daylight autonomy) | A daylight availability metric that corresponds to the percentage of the occupied time when the target illuminance at a point in a space is met by daylighting. | Taking into account the time changes and the minimum lighting requirements of users. | The calculation process is more complicated than DF. It only considers the minimum illumination and does not consider the visual discomfort caused by excessive daylighting. |
| cDA (continuous daylight autonomy) | On the basis of DA, consider the percentage of target illumination that daylighting can achieve when the daylighting illumination at the test point is lower than the target illumination. | It takes into account the time change and the minimum daylighting requirements of human vision. Compared with sDA and DA, cDA takes into account the continuity of light changes and more accurately reflects the changes in indoor daylighting. | Requires more complex calculation methods and software support, and the calculation process is more complicated. |
| sDA (spatial daylight autonomy) | The percentage of space at a test point that achieves a specific daylighting level for a specific percentage of time, using natural lighting alone, over a given period of time. | The minimum daylighting requirements for time of day and human vision are taken into account. | The calculation process is more complicated than DF. It only considers the minimum illumination and does not consider the visual discomfort caused by excessive daylighting. |
| UDI (useful daylight illuminance) | A daylight availability metric that corresponds to the percentage of the occupied time when a target range of illuminances at a point in a space is met by daylight. | The design takes into account the changes in time and the human visual demand for lighting, as well as the visual discomfort caused by excessive lighting. | More complex calculation methods and software support are required, and the calculation process is relatively cumbersome; the useful illumination range needs to be determined according to actual conditions; otherwise, the results may not accurately represent the lighting conditions. |
| Time | Sky | Measurement | Simulation | MBE | RMSE | Table | |
|---|---|---|---|---|---|---|---|
| 10:30 |  |  |  |  | −1.14% | 13.67% | 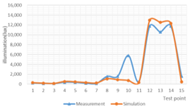 |
| 14:30 | 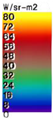 |  |  |  | −6.03% | 16.21% | 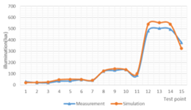 |
| Baseline Room | Center-Mounted Louver Ventilation Window | |
|---|---|---|
Distribution Map of UDI(%) UDIlow UDIlow UDIsup UDIsup UDIauto UDIauto UDIup UDIup |  | |
| Average UDIlow | 9.42% | 16.31% |
| Average UDIsup | 17.06% | 35.26% |
| Average UDIauto | 59.9% | 43.21% |
| Average UDIup | 13.62% | 4.23% |
Disclaimer/Publisher’s Note: The statements, opinions and data contained in all publications are solely those of the individual author(s) and contributor(s) and not of MDPI and/or the editor(s). MDPI and/or the editor(s) disclaim responsibility for any injury to people or property resulting from any ideas, methods, instructions or products referred to in the content. |
© 2025 by the authors. Licensee MDPI, Basel, Switzerland. This article is an open access article distributed under the terms and conditions of the Creative Commons Attribution (CC BY) license (https://creativecommons.org/licenses/by/4.0/).
Share and Cite
Ma, Q.; Ma, H.; Wan, Z.; Wang, Z.; Wei, X. Effect of Ventilation Strategies of Center-Mounted Louver Ventilation Window on Building Energy Consumption and Daylighting. Sustainability 2025, 17, 670. https://doi.org/10.3390/su17020670
Ma Q, Ma H, Wan Z, Wang Z, Wei X. Effect of Ventilation Strategies of Center-Mounted Louver Ventilation Window on Building Energy Consumption and Daylighting. Sustainability. 2025; 17(2):670. https://doi.org/10.3390/su17020670
Chicago/Turabian StyleMa, Qingsong, Hao Ma, Ziwei Wan, Zhen Wang, and Xindong Wei. 2025. "Effect of Ventilation Strategies of Center-Mounted Louver Ventilation Window on Building Energy Consumption and Daylighting" Sustainability 17, no. 2: 670. https://doi.org/10.3390/su17020670
APA StyleMa, Q., Ma, H., Wan, Z., Wang, Z., & Wei, X. (2025). Effect of Ventilation Strategies of Center-Mounted Louver Ventilation Window on Building Energy Consumption and Daylighting. Sustainability, 17(2), 670. https://doi.org/10.3390/su17020670