Article

The Synergy of Pollution and Carbon Reduction by Green Fiscal Policy: A Quasi-Natural Experiment Utilizing a Pilot Program from China’s Comprehensive Demonstration Cities of Energy Conservation and Emission Reduction Fiscal Policy

1
Research Center of “Agriculture, Rural areas and Farmers” Issues, Jiangxi Agricultural University, Nanchang 330045, China
2
School of Economics and Management, Jiangxi Agricultural University, Nanchang 330045, China
3
School of Economics, Yunnan University, Kunming 650500, China
4
College of Finance, Nanjing Agricultural University, Nanjing 210095, China
*
Author to whom correspondence should be addressed.
Sustainability 2025, 17(2), 667; https://doi.org/10.3390/su17020667
Submission received: 17 October 2024 / Revised: 28 December 2024 / Accepted: 12 January 2025 / Published: 16 January 2025

Abstract

Using data from 2003 to 2019 for China’s 257 cities, this quantitative research utilizes the difference-in-differences approach to evaluate the synergy of the Comprehensive Demonstration Cities of Energy Conservation and Emission Reduction Fiscal Policy on pollution and carbon reduction. The primary results are as follows. The policy successfully reduces total emissions of industrial SO2, industrial wastewater, and CO2, thus achieving the desired synergistic effect of pollution and carbon reduction. Facilitating green technological innovation and promoting industrial upgrading are the transmission mechanisms through which the synergistic effect of the policy operates. The negative effect of the policy on the total emissions of industrial SO2 and CO2 is greater in the eastern area than in the mid-western area and the impact of the policy on decreasing the total emissions of industrial SO2 is more pronounced in non-resource-based cities compared to resource-based cities. This study provides an empirical reference for green fiscal policy with respect to reducing air pollution, wastewater pollution, and greenhouse gas emissions.

1. Introduction

Due to human activities such as land use changes and fossil fuel combustion, global warming triggers a chain reaction, leading to various consequences like frequent extreme weather events, causing irreversible adverse effects [1,2]. To combat global warming, nations need to collaborate in controlling cumulative carbon emissions and limiting temperature rise to 1.5 °C [3]. Currently, China stands as the world’s largest carbon dioxide (CO2) emitter, accounting for 32.61% of global emissions in 2020 (https://data.worldbank.org/, accessed on 20 February 2024). In alignment with the goals of the Paris Agreement and addressing climate change on a global scale, China pledged to embark on the “dual carbon” objectives at the 75th United Nations General Assembly session, aiming for carbon peaking by 2030 and achieving carbon neutrality by 2060. However, the post-COVID-19 era has brought forth multiple challenges for China, encompassing economic recovery, environmental standards, and the attainment of the “dual carbon” ambitions. Recent studies have shown that economic recovery will be achieved at the cost of increased pollution and carbon emissions [4,5]. Given this context, there is an urgent need to actively propel the green growth of China’s economy. This endeavor is not only pivotal for the high-quality sustainable development of China’s economy but also a fundamental pillar for realizing the “dual carbon” objectives. The synergistic effect of pollution and carbon reduction (PCR) stands out as a crucial pathway to steer the comprehensive green transformation of China’s economic growth. Air pollutants like sulfur dioxide (SO2) and greenhouse gasses such as CO2 stem from common sources and exhibit shared processing pathways [6,7], setting the stage for attaining a synergistic effect of PCR. Furthermore, collaborative governance targeted at PCR can rectify disparities in environmental policy creation, notably boosting the efficiency of policy implementation [8]. China’s ecological civilization construction ventured into a fresh phase during the 14th Five-Year Plan, amplifying efforts toward collaborating with PCR and embracing carbon reduction as a central strategic thrust. Conducting in-depth analyses on the synergy of PCR can provide vital decision-making assistance, guiding China’s economy towards a holistic green transition in the post-pandemic era.
Green fiscal policy is a tool used by governments to drive the green transition and sustainable economic development through fiscal measures. It aims to harmonize environmental protection with economic growth. It reflects the principles of green development in the fiscal domain. Green fiscal policy serves a multifaceted function encompassing pollution control, energy conservation, emission reduction, ecological protection, and economic regulation [9,10]. The operational framework of this policy incorporates green fiscal revenue and green fiscal expenditure. Conceptually, green fiscal revenue leverages “revenue-oriented” environmental taxes and fees to rectify pollutant discharge costs and internalize the external environmental expenses associated with pollutant emissions. Green fiscal expenditure directs funds towards “expenditure-oriented” environmental governance initiatives, curbing corporate emissions, encouraging the uptake of eco-friendly production technologies, and promoting energy efficiency and emission reduction endeavors. Positioned as a pivotal instrument in advancing energy efficiency, emission reduction, and climate change mitigation strategies, green fiscal policy garners escalated attention amid the worsening global climate conditions, evolving into a central research theme in environmental economics and public finance across diverse nations [11,12]. While prevailing research largely acknowledges the environmental merits of green fiscal policies, the exploration of their potential synergistic effects on PCR remains incomplete. Hence, a comprehensive examination of the synergistic effects of green fiscal policies on PCR, along with the elucidation of their transmission mechanisms within China, can furnish pivotal insights and knowledge for enhancing the role of green fiscal policies in driving the green development of China’s economy.
This study delves into the examination of the potential synergies of PCR linked to green fiscal policies. By utilizing the data from 2003 to 2019 spanning 257 cities in China, the research systematically explores the synergy of PCR propelled by China’s green fiscal policy. The analysis commences with an investigation into the Comprehensive Demonstration Cities of Energy Conservation and Emission Reduction Fiscal Policy (ECER policy) conducted in China in 2011, 2013, and 2014. Distinct from the existing literature, this study offers several notable contributions. Primarily, it employs a range of indices to gauge the objectives of pollution or carbon reduction. Furthermore, leveraging the difference-in-differences methodology, the research affirms that green fiscal policy can engender synergistic emission reduction effects, alongside delineating its transmission mechanisms. These findings yield consequential implications for enhancing green fiscal policies aimed at PCR. The joint governance of PCR can significantly enhance the efficiency of policy implementation. The discourse on the synergistic effects of PCR brought about by green fiscal policies stands as a pivotal focal point for fostering comprehensive green transformation within China’s economic and societal fabric.

2. Literature Review

2.1. The Synergistic Effect of PCR

China, as the world’s second-largest economy, is experiencing rapid growth and development. Extensive international research delves into China’s environmental conditions [13], and the intricate interplay between its economic evolution and environmental stewardship [14,15]. Against the backdrop of China’s economy transitioning towards comprehensive green practices, the investigation into the synergistic effect of PCR has emerged as a focal point within environmental economics. Studies have predominantly corroborated the synergistic outcomes of PCR [16,17,18]. For instance, in a cost-effectiveness assessment, Chae [19] noted that the adoption of low-sulfur fuels could efficiently curtail CO2 emissions at minimal expense. Employing a partial equilibrium model that links localized air pollutants and carbon emissions, Yang and Teng [20] contended that achieving China’s carbon peak by 2030 could potentially slash SO2 emissions by 78.85% compared to 2010, aligning CO2 emission peaks with air quality standards. Drawing upon comprehensive data pertaining to air pollutants and CO2 emissions in China’s industrial sector, Wang et al. [21] documented that a 1000-ton reduction in industry-induced CO2 emissions corresponded to a 1-ton decline in comprehensive air pollutant emissions.
Additionally, recent studies have extensively explored the synergistic effect of PCR stemming from diverse public policies [22,23,24]. For instance, through the utilization of the difference-in-differences methodology, Gao et al. [25] observed that the environmental protection tax legislation notably amplified the collaborative decrease in SO2-CO2 by 41%, unveiling the varied policy effects induced by varying increments in tax rates. Hu [26] scrutinized the impact of establishing comprehensive big data experimental zones on carbon emissions and air pollutants, noting this initiative curbed pollution and carbon outputs, with energy efficiency enhancements serving as an effective mechanism. Shen and Yang [27] discerned that the integration and deployment of industrial robots within enterprises fostered a collaborative reduction in pollution and carbon emissions, underscoring the pivotal role of green technological innovation (GTI) as a key transmission mechanism.
In the realm of research exploring the synergy of PCR, while numerous studies have utilized the difference-in-differences technique to explore the synergistic effects of diverse public policies, there remains a scarcity of discourse on the potential synergistic effects of green fiscal policies in reducing pollution and carbon emissions. Aligning with previous policy evaluation methodologies, this study leverages the difference-in-differences technique to scrutinize the synergies of PCR achieved by green fiscal policies.

2.2. Concerning Green Fiscal Policy and Its Relationship with the Environment

With the surge in global carbon emissions and ongoing environmental degradation, attaining green economic growth stands as a critical imperative for nations across the globe [28]. The majority of research has affirmed the potential of green bonds in fostering green economic recovery [29,30], a sentiment shared concerning green credit [31,32]. Similarly, green fiscal policy can bring about environmental benefits in addition to economic benefits [33]. Empirically, scholars have utilized various variables as proxy variables for green fiscal policy to evaluate its economic and environmental effects [34,35].
For instance, using data from Asian economies such as the Philippines, Indonesia, and Japan, Hidayat et al. [36] examined the relationship between green fiscal policy and the sustainability index and found that there was a significant positive correlation between green fiscal policy and the sustainability index. Hu et al. [37] argued that green fiscal policies (carbon taxes and subsidies) could reduce enterprises’ carbon emissions by positively affecting green investment. Applying the spatial Durbin model, Dong et al. [38] identified dual effects of green fiscal expenditure on carbon emissions across various stages of environmental assessments. The introduction of the ECER policy in China facilitated energy conservation, and emission reduction, and fostered a shift in the economic development paradigm. Considering the ECER policy in China as a quasi-natural experiment, Lin and Zhu [39] contended that the ECER policy positively impacted eco-efficiency, with this effect notably emerging three years after its implementation. Jin et al. [40] discovered that the ECER policy notably enhanced green innovation performance among enterprises in the pilot area, with a more pronounced positive impact observed for enterprises in high-carbon-emission industries.
By reviewing the above literature, it can be observed that most existing studies affirm that green fiscal policy can have environmental benefits. This provides both theoretical and empirical references for the research conducted in this paper. However, there is still a research gap regarding whether these policies have synergistic effects on PCR. This will be examined and validated in this study. Differing from existing literature, the main contributions of this study are outlined as follows. Primarily, the study uses multiple indices, such as the total emissions of industrial SO2, industrial wastewater, and CO2, to quantify the targets of pollution reduction or carbon reduction, which contributes to a more comprehensive understanding of environmental benefits. Additionally, given the efficacy of the difference-in-differences method in evaluating policy impacts, this study treats the pilot program “Comprehensive Demonstration Cities of Energy Conservation and Emission Reduction Fiscal Policy” as a quasi-natural experiment, and utilizes the difference-in-differences technique to confirm the synergistic effect of emission reduction through green fiscal policy. This study provides an empirical reference for green fiscal policy with respect to reducing air pollution, wastewater pollution, and greenhouse gas emissions. Third, this study reveals that the transmission mechanisms by which green fiscal policy reduces pollution and carbon include facilitating GTI and promoting industrial upgrading (IU).

3. Theoretical Analysis and Research Hypotheses

The ECER policy can affect the environmental benefits of pilot cities through the combination of financial incentives and target constraints. On one front, the central government allocates incentive funds to pilot cities for motivating energy conservation and emission reduction efforts. Additionally, provincial and municipal governments are tasked with establishing dedicated funds to support these initiatives in pilot cities and aligning their policies with central financing to address energy conservation and emission reduction deficiencies. Furthermore, the ECER policy mandates a gradual transition of preferential policies, including energy conservation, emission reduction, and renewable energy development, towards pilot cities. On the other hand, the central government conducts targeted evaluations of pilot cities to ensure the efficacy of energy conservation and emission reduction measures. The ECER policy can realize the synergy of PCR in pilot cities through financial incentives and target constraints. Accordingly, the following hypothesis is postulated.
Hypothesis 1 (H1).
The ECER policy can achieve the synergy of PCR.
GTI serves as the catalyst for enhancing the efficacy of regional environmental governance. This innovation has the capacity to revolutionize conventional production methods, driving energy transformation to bolster environmental standards and foster economic green recovery [41,42]. Throughout the development of pilot cities, stringent environmental regulations were enforced to ensure the successful implementation of energy conservation and emission reduction practices. In response to these regulatory measures, enterprises increased investments in technological research and intensified efforts in GTI. Furthermore, dedicated funds were established within pilot cities to support energy conservation and emission reduction initiatives. Subsequently, pilot cities actively motivated and facilitated GTI among production enterprises via matching funds and direct incentives. Consequently, facilitating GTI serves as the transmission mechanism for realizing the synergistic emission reduction effects of the ECER policy. Thus, the second hypothesis is posited as follows.
Hypothesis 2 (H2).
The ECER policy can achieve the synergy of PCR by facilitating GTI.
IU is the key path to realizing environmental benefits [43]. The advancement of green industries can mitigate fossil fuel usage and drive energy transition, ultimately enhancing environmental outcomes [44]. According to their factor endowment and comparative advantages, pilot cities use fiscal means to develop strategic emerging industries and service industries based on their own characteristics. Moreover, the pilot cities support the intensive development of modern service industries such as modern logistics, finance, science and technology, and livelihood services such as community services, housekeeping services, and recycling of renewable resources by creating service industry clusters. Hence, within the framework of the ECER policy’s incentives and constraints, the establishment of pilot cities facilitates the advancement of traditional industries towards green transformation and fosters the growth of strategic emerging and service industries. That is, promoting IU is one of the transmission mechanisms for achieving the synergistic effect of emission reduction through ECER policy. Hence, the third hypothesis is proposed as follows.
Hypothesis 3 (H3).
The ECER policy can achieve the synergy of PCR by promoting IU.

4. Materials and Methods

4.1. Policy Overview

In June 2011, the Ministry of Finance and the National Development and Reform Commission jointly released a directive to initiate Comprehensive Demonstration Work on Fiscal Policies for Energy Conservation and Emission Reduction. The initial phase involved the selection of eight cities—Shenzhen, Beijing, Hangzhou, Chongqing, Guiyang, Changsha, Xinyu, and Jilin—as the pioneering comprehensive demonstration cities. This directive predominantly assigned primary responsibility to local governments, utilizing cities as pivotal platforms to enhance the amalgamation of diverse energy conservation and emission reduction fiscal policies. Subsequently, in 2013, ten additional cities were integrated into the program, including Tangshan, Shijiazhuang, Qiqihar, Tieling, Nanping, Tongling, Shaoguan, Jingmen, Tongchuan, and Dongguan. The following year, 12 more cities, such as Baotou, Linfen, Tianjin, Xuzhou, Hebi, Liaocheng, Meizhou, Deyang, Nanning, Haidong, Urumqi, and Lanzhou, were designated as comprehensive demonstration cities. The cumulative count reached 30 cities across China. To ensure comprehensive data collection, 24 pilot cities were specifically chosen as the treatment group, with 233 cities designated as the control group for quasi-natural experimental research. The selected pilot cities included the initial eight, as well as Tangshan, Shijiazhuang, Tongling, Jingmen, Nanping, Shaoguan, Tianjin, Dongguan, Xuzhou, Hebi, Liaocheng, Nanning, Meizhou, Lanzhou, Deyang, and Urumqi.

4.2. Construction of Empirical Models

To validate Hypothesis 1, we formulate a benchmark regression model using the difference-in-differences method as follows:
C i t = β 0 + β 1 P o l i c y i t + β X i t + μ i + γ t + ε i t
where i denotes the city and t denotes the year. The dependent variable, Cit, measures pollution reduction or carbon reduction objectives. In this paper, Cit can represent 3 variables, including the natural logarithm of total emissions of industrial SO2 (C_Sit), industrial wastewater (C_Wit), or CO2 (C_Cit). Policyit serves as the core independent variable, embodying the ECER policy, assessed through the dummy variable of pilot cities. Xit represents the vector of observable control variables that influence regional environmental benefits. γt denotes the year dummy variables used for controlling year fixed effects, while μi represents the city dummy variables used for controlling city fixed effects. The parameter to be estimated in the model (1) is denoted by β. εit represents the random error term. Hence, the verification of Hypothesis 1 is confirmed if β1 is negative.
To validate Hypothesis 2, we formulate a mechanism test model as follows:
G T I i t = α 0 + α 1 P o l i c y i t + α X i t + μ i + γ t + ε i t
where GTIit stands for the mechanism variable, indicating the GTI in city i of China in year t. The parameter to be estimated in the model (2) is denoted by α. The definitions of the other variables align with those in the model (1). Therefore, the verification of Hypothesis 2 is confirmed if α1 is positive.
To validate Hypothesis 3, we establish a mechanism test model in the following manner:
I U i t = λ 0 + λ 1 P o l i c y i t + λ X i t + μ i + γ t + ε i t
where IUit stands for the mechanism variable, indicating the IU in the city i of China in year t. The parameter to be estimated in the model (3) is denoted by λ. The definitions of the other variables align with those in the model (1). Therefore, the verification of Hypothesis 3 is confirmed if λ1 is positive.

4.3. Variable Selection

Dependent Variable. The natural logarithm of the total emissions of industrial SO2 (C_Sit), industrial wastewater (C_Wit), or CO2 (C_Cit) is the dependent variable and can be used to quantify pollution reduction or carbon reduction targets. For example, the formulas for C_Sit, C_Wit, and C_Cit are as follows:
C _ S i t = ln S O 2 i t ;   C _ W i t = ln W a t e r i t ;   C _ C i t = ln C O 2 i t
where SO2it is the total emissions of industrial SO2, in tons. Waterit is the total emissions of industrial wastewater in ten thousand tons. CO2it is the total emissions of CO2, in million tons.
Core independent variable. The ECER policy (Policyit) is the core independent variable. If city i in China is designated as a comprehensive demonstration city in year t, its Policyit is assigned a value of 1 from year t onwards; otherwise, it is assigned a value of 0. As per the theoretical analysis, it is anticipated that Policyit could potentially exert a negative impact on total emissions.
Mechanism Variable. GTI (GTIit) and IU (IUit) serve as the focal mechanism variables in our analysis. This study employs the number of green patents granted per 10,000 individuals as a metric for evaluating GTI. A higher value of GTIit signifies a more substantial level of GTI. Furthermore, the share of tertiary industry value added to the GDP is utilized to gauge IU. A higher value of IUit indicates a heightened degree of IU.
Control Variables. In the regression models, we incorporate various observable control variables that potentially influence regional environmental benefits, including the following: economic development (PGDPit), quantified by the natural logarithm of per capita GDP; openness (Opit), quantified by the natural logarithm of the count of foreign-invested enterprises; government size (Govit), quantified by the share of expenditure within the general budget of local finance relative to GDP; financial development (Finit), quantified by the share of the balance of loans from financial institutions at year-end to GDP; science input (Sciit), quantified by the share of expenditures for science to the expenditure within the general budget of local finance; and population density (Popit), measured by the natural logarithm of the proportion of the registered population to the land area of the administrative district.

4.4. Data Description and Descriptive Statistics

To ensure comprehensive data acquisition, we utilized the data comprising 257 cities in China from 2003 to 2019 for empirical analysis, taking into account data availability. The total number of samples collected from 2003 to 2019 was 3041. The CO2 emissions data for each city came from the Carbon Emission Accounts and Datasets (https://www.ceads.net/, accessed on 21 March 2024). The data of industrial SO2 emissions, industrial wastewater emissions, annual GDP, per capita GDP, tertiary industry added value, count of foreign-invested enterprises, expenditure within the general budget of local finance, balance of loans from financial institutions at year-end, number of registered population, and expenditures for science of each city came from the Chinese Urban Statistical Yearbook. The data on the number of green patents granted were obtained from the China National Intellectual Property Administration (https://www.cnipa.gov.cn/, accessed on 21 March 2024). The definitions and descriptive statistics of all variables are shown in Table 1.

5. Results and Discussion

5.1. Benchmark Regression

To validate Hypothesis 1, we employed the ordinary least squares (OLS) technique to conduct a benchmark regression on model (1). Table 2 displays the outcomes of the benchmark regression concerning total emissions. Columns (1) and (2) illustrate the impact of Policyit on C_Sit. As illustrated in columns (1) and (2), irrespective of the inclusion of control variables in the model, Policyit exhibits a significantly negative impact on C_Sit at the 0.01 level, suggesting that establishing demonstration cities aids in lowering the total emissions of industrial SO2. Furthermore, in column (2), the coefficient of Policyit is −0.2068, suggesting that the ECER policy, on average, can lead to a 21.36% reduction in total emissions of industrial SO2. As displayed in columns (3) and (4), Policyit has a significantly negative effect on C_Wit at the 0.01 level, indicating that establishing demonstration cities aids in reducing the total emissions of industrial wastewater. Moreover, in column (4), the coefficient of Policyit is −0.1303, indicating that the ECER policy, on average, can decrease the total emissions of industrial wastewater by 13.03%. As displayed in columns (5) and (6), Policyit has a significantly negative effect on C_Cit at the 0.01 level, indicating that establishing demonstration cities aids in reducing total CO2 emissions. Moreover, in column (6), the coefficient of Policyit is −0.1375, indicating that the ECER policy, on average, can lower the total emissions of CO2 by 13.75%.
According to the above results, the ECER policy can simultaneously reduce the total emissions of industrial SO2, industrial wastewater, and CO2, which verifies Hypothesis 1 (the ECER policy can achieve the synergy of PCR). Based on the theoretical analysis, the combination of financial incentives and target constraints in the ECER policy can enhance the environmental benefits of pilot cities. The results provide an empirical reference for green fiscal policy with respect to promoting the green development of China and other developing countries that simultaneously pursue economic development and environmental protection. Moreover, the R2 values of all regression results in Table 2 are greater than 0.850, which indicates that all models fit well.

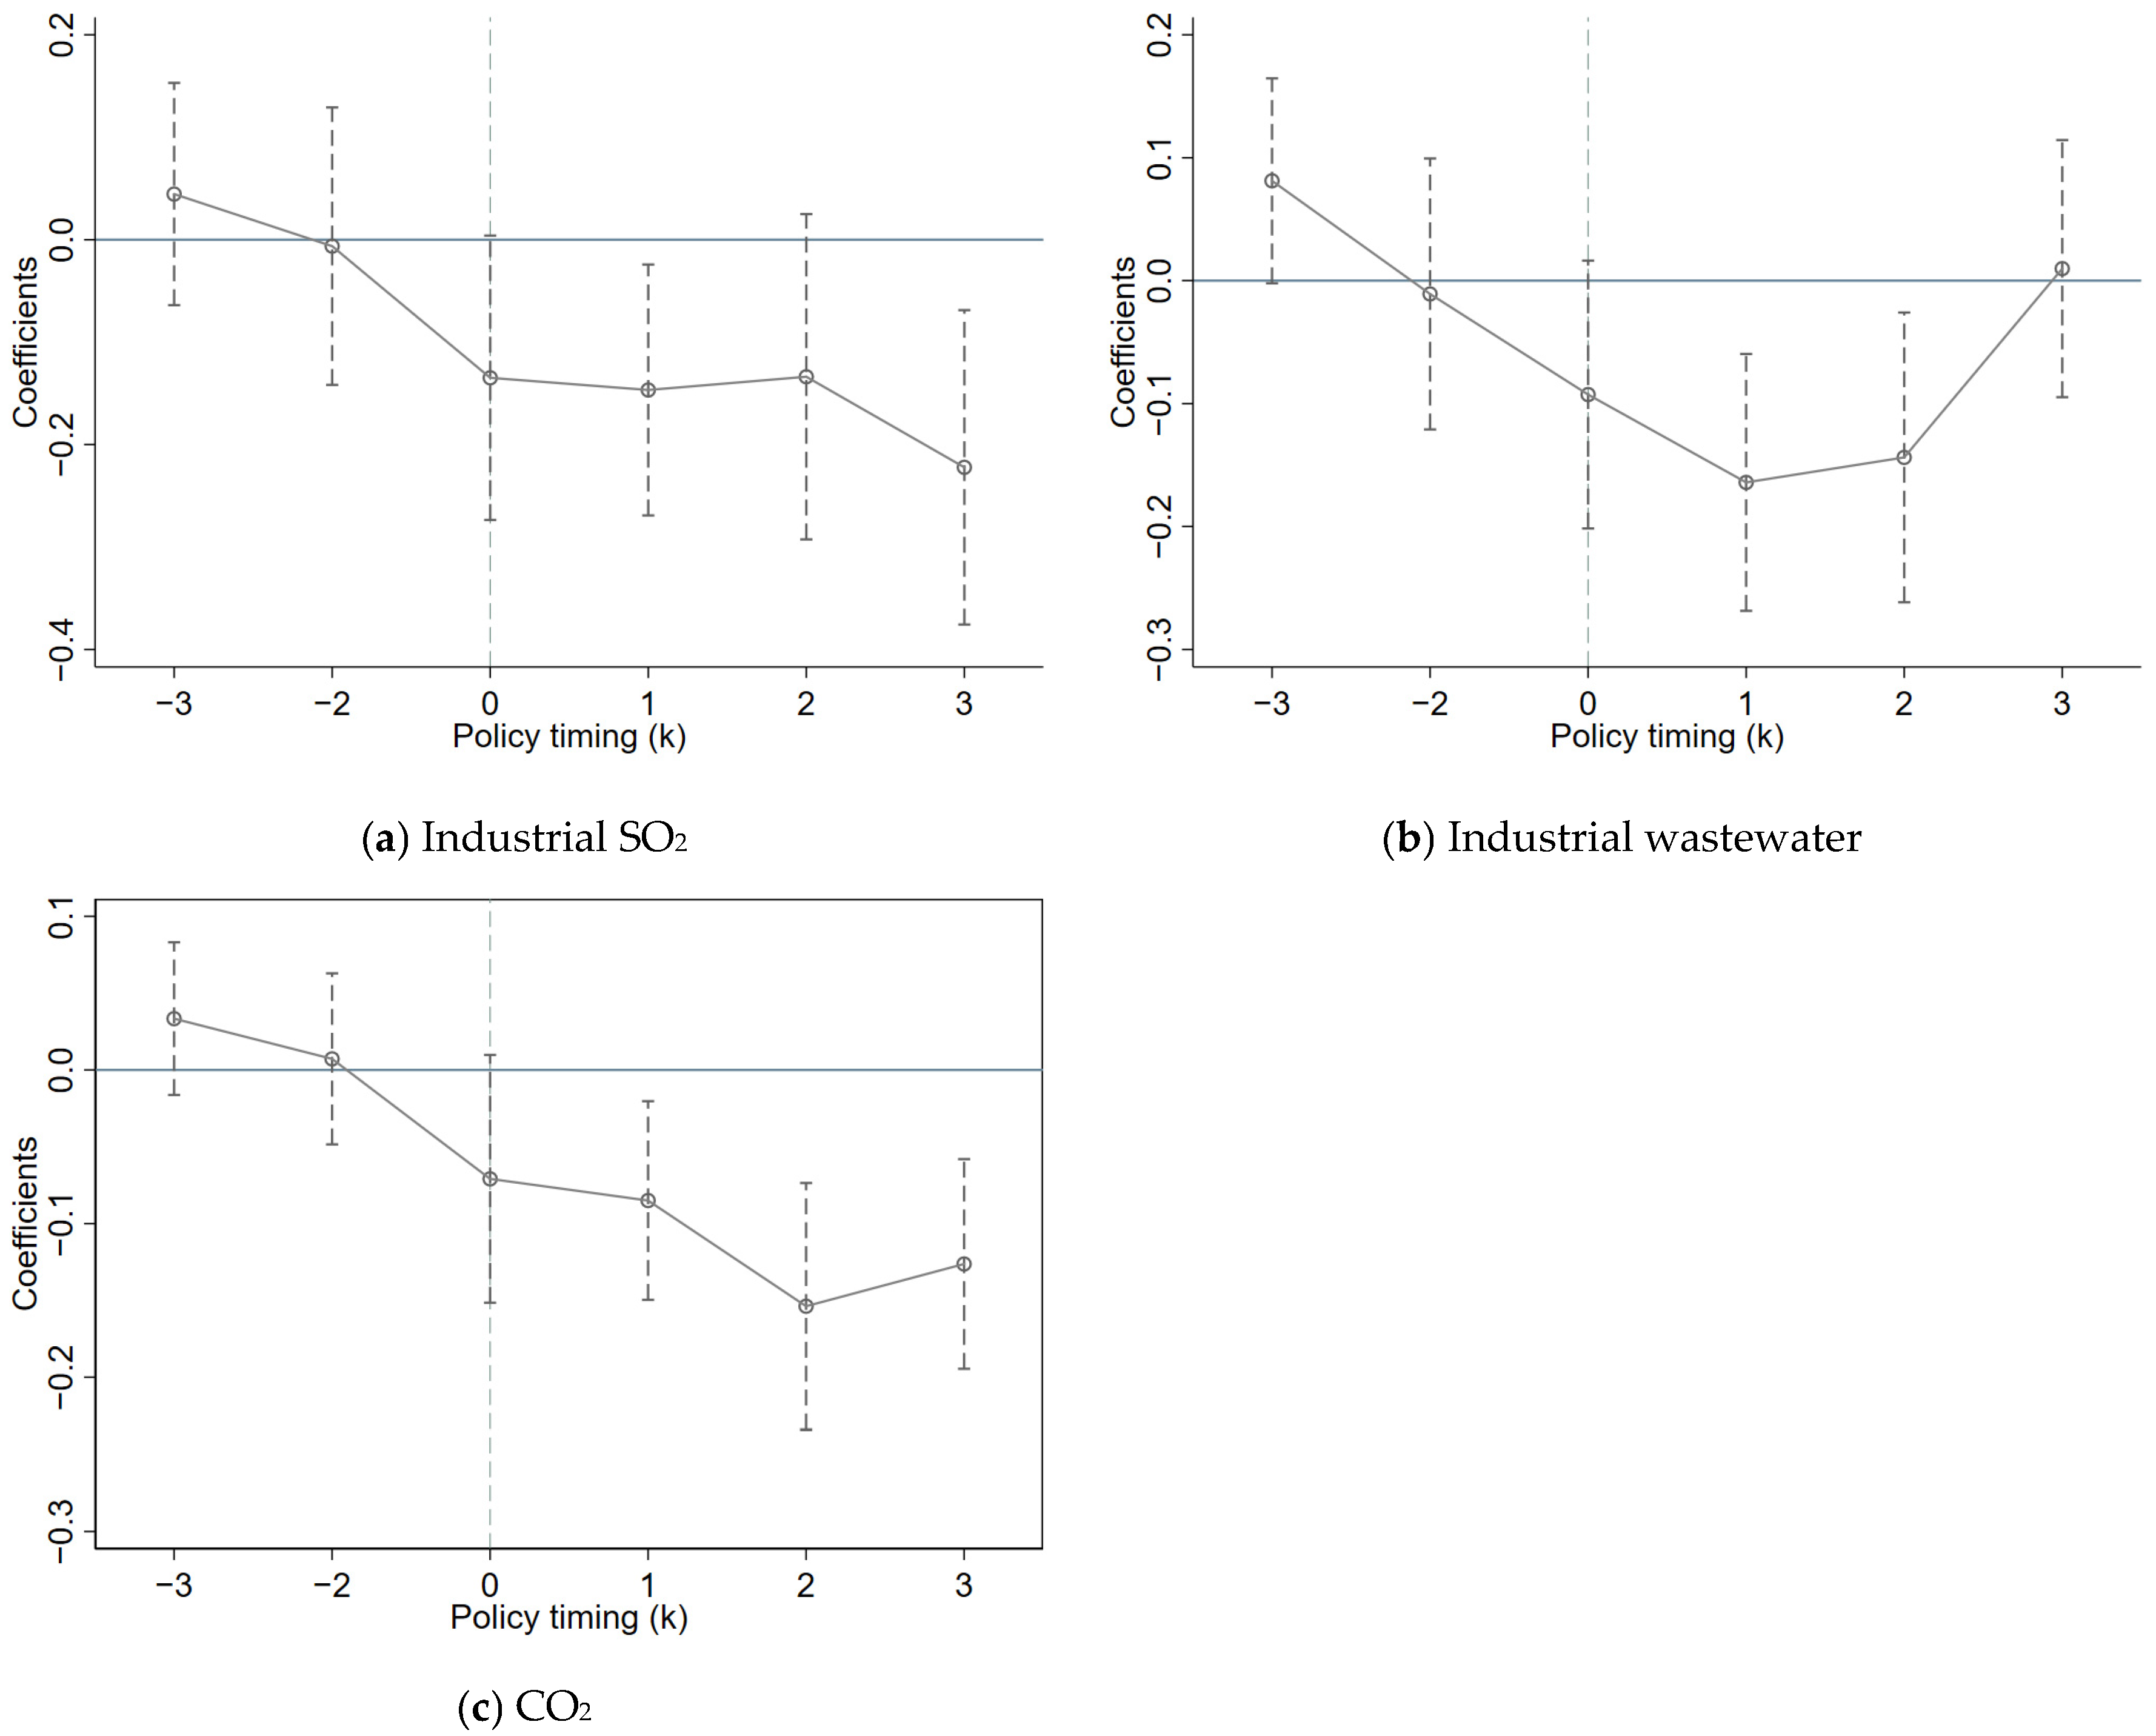
5.2. Parallel Trend Test

The validity of the difference-in-differences method for policy assessment is dependent on the parallel trend hypothesis; that is, if the ECER policy is not implemented, then the pollution and carbon emissions of demonstration cities and non-demonstration cities should have a common change trend. To verify this hypothesis, we conduct a parallel trend test for the total emissions of industrial SO2, industrial wastewater, and CO2 and their emission intensities via event analysis. The test model is established as follows:
C i t = η 0 + k = 3 3 χ k D i t k + φ X i t + μ i + γ t + ε i t
where D i t k is a dummy variable representing the event of construction of the demonstration city. More specifically, D i t k represents the k-th year in which city i implemented the construction of the demonstration cities. D i t 0 indicates the starting year of policy implementation. The parameters to be estimated in the model (5) are η, χ, and φ. The definitions of the other variables align with those specified in the model (1). In this research, if k > 3, k equals 3; if k < −3, k equals −3. Moreover, we take the year before the construction of demonstration cities as the base year; that is, D i t 1 is not included in the model (5). Then, if χ−2 and χ−3 are not significantly different from 0, the parallel trend hypothesis is verified. Figure 1 depicts the outcomes of the parallel trend test for total emissions. The estimated coefficients of χ−2 and χ−3 in (a), (b), and (c) are insignificantly different from 0. This indicates that there were no substantial disparities in total emissions of industrial SO2, industrial wastewater, or CO2 between pilot and non-pilot cities prior to the implementation of the ECER policy. Based on the findings, we confirm the validation of the parallel trend hypothesis for total emissions. The ECER policy manifests a synergy in reducing pollution and carbon emissions.

5.3. Robustness Tests

In this section, we examine the robustness of the benchmark regression findings. First, we handle samples with outliers. To minimize the impact of outliers on the precision of the regression outcomes, we conduct a bilateral winsorization at 1% for the variable values. Bilateral winsorization converts the outliers of samples to reasonable values. Then, we perform regressions on model (1) using the OLS method. Table 3 displays the outcomes of the robustness test utilizing bilateral winsorization. As displayed in columns (1) to (3), the ECER policy (Policyit) demonstrates a significantly negative impact on the total emissions of industrial SO2 (C_Sit), industrial wastewater (C_Wit), and CO2 (C_Cit) at the 0.01 level. These results verify the robustness of the results of the benchmark regression, indicating that the ECER policy can indeed achieve synergy in reducing pollution and carbon emissions.
Second, we eliminate the samples of municipalities under the direct jurisdiction of the central government. Due to the particularity of municipalities in enjoying national policies and city positioning functions, this paper deletes the samples of four municipalities, namely, Shanghai, Beijing, Chongqing, and Tianjin. Then, we perform regressions on model (1). Table 4 shows the results of the robustness test by deleting the samples of municipalities. As displayed in columns (1) to (3), Policyit has a significantly negative effect on C_Sit, C_Wit, and C_Cit at the 0.01 level. Despite excluding the samples of municipalities under the central government’s direct jurisdiction, the regression results demonstrate the ECER policy’s efficacy in reducing pollution and carbon emissions. This confirms the robustness of the benchmark regression findings.

5.4. Mechanism Tests

Based on theoretical analysis, the primary mechanisms for realizing the synergy of emission reduction through the ECER policy are the facilitation of GTI and the promotion of IU. To confirm Hypotheses 2 and 3, we perform regressions on models (2) and (3). The findings of the mechanism tests are presented in Table 5. As indicated in column (1), the ECER policy (Policyit) demonstrates a statistically significant positive impact on GTI (GTIit) at the 0.01 level, suggesting that the establishment of demonstration cities supports the advancement of GTI. Moreover, the coefficient of Policyit in column (1) is 0.4768, which indicates that ECER policy can increase the number of green patents granted per 10,000 individuals by 0.477. These results verify Hypothesis 2 (the ECER policy can achieve the synergy of PCR by facilitating GTI). The advancement of GTI plays a crucial role in enhancing the effectiveness of regional environmental governance. Enterprises respond to the environmental regulations enforced by the ECER policy by augmenting their investments in technology research and reinforcing efforts towards GTI.
As displayed in column (2), Policyit has a significantly positive effect on IU (IUit) at the 0.10 level, which indicates that the establishment of demonstration cities aids in promoting IU. Moreover, the coefficient of Policyit in column (2) is 0.7146, which indicates that the ECER policy can increase the share of tertiary industry value added to the GDP by 0.715. These results verify Hypothesis 3 (the ECER policy can achieve the synergy of PCR by promoting IU). IU is the key path to realizing environmental benefits [43]. Within the framework of the ECER policy’s incentives and constraints, the establishment of pilot cities aids in fostering the green evolution of industries along with the advancement of strategic emerging industries and service sectors.

5.5. Heterogeneity Analysis

The ECER policy is extensively implemented across geographical areas encompassing cities in eastern, middle, and western China. In comparison to the mid-western region, the eastern area of China demonstrates a higher degree of economic advancement and manufacturing technology. Therefore, the synergy of PCR by the ECER policy may be heterogeneous for different areas. To test the heterogeneity of the synergy of PCR by the ECER policy between the eastern area and the mid-western area, we classify 257 cities into the eastern area and the mid-western area and introduce an interaction term (Policyit × Ei) into the model (1). If city i belongs to the eastern area of China, Ei equals 1; otherwise, it equals 0. Then, we perform regressions. Table 6 shows the results of the heterogeneity analysis for different areas. As shown, the coefficient of the interaction term (Policyit × Ei) in columns (1) and (3) is significantly negative, indicating that compared with the effect in the mid-western area, the negative effect of Policyit on C_Sit and C_Cit in the eastern area is stronger. Hence, we believe that in the eastern area of China, the ECER policy can bring better environmental benefits since it has a stronger effect on reducing total emissions of industrial SO2 and CO2 in this area. One likely explanation is that the eastern area of China exhibits superior levels of economic development and production technology. Higher levels of economic development imply more efficient production processes and management capabilities. Higher levels of production technology can improve industrial processes and production methods, reducing energy and resource waste. These factors make the eastern area more capable of implementing and enforcing ECER policy, thereby increasing policy efficiency.
Due to the substantial divergence in resource endowments among cities, we proceed to examine the heterogeneity in the combined impact of PCR enforced by the ECER policy across resource-based and non-resource-based cities. We classify 257 cities into resource-based cities and non-resource-based cities and introduce an interaction term (Policyit × Ri) into the model (1). If city i is a non-resource-based city, Ri equals 1; otherwise, it equals 0. Then, we perform regressions. Table 7 shows the results of the heterogeneity analysis for cities with different resource endowments. As shown, the coefficient of the interaction term (Policyit × Ri) in column (1) is significantly negative, which indicates that compared with the effect in resource-based cities, the negative effect of Policyit on C_Sit in non-resource-based cities is stronger. Hence, we believe that in non-resource-based cities, the ECER policy can bring better environmental benefits since it has a stronger reduction effect on total emissions of industrial SO2 in these cities. The possible reason is that resource-based cities are highly dependent on resource development, and their economic development is dominated by resource exploitation and related industries. This has resulted in long-term high pollution and carbon emissions and a relatively narrow economic development pattern in resource-based cities. Excessive reliance on resource development has led to a lack of diversification in the traditional industry structure, making it difficult to achieve a diversified and non-resource-dependent economic structure. This singularity poses greater challenges for these cities in undertaking green transformation, as transformation requires profound changes and innovations to the existing economic mode.

6. Conclusions

China’s ecological civilization development currently faces the strategic goals of significantly enhancing the ecological environment and attaining the “dual carbon” objectives. The coordinated reduction in pollution and carbon emissions has become a necessary strategy for China’s comprehensive transition towards a greener economy and sustainable social progress in this new phase. This study utilizes the data from 2003 to 2019 across 257 Chinese cities to assess PCR targets. The research empirically examines the impact of the ECER policy on PCR along with its transmission mechanisms, offering insights into green fiscal policies conducive to PCR. Key findings indicate that the ECER policy effectively lowers total emissions of industrial SO2, industrial wastewater, and CO2, showcasing its potential to generate synergy in PCR. Notably, these conclusions hold after rigorous testing, including parallel trend tests and robustness tests. Mechanism tests reveal that the establishment of pilot cities fosters GTI and spurs IU, serving as pathways to achieve the synergy of emission reduction under the ECER policy. Moreover, heterogeneous analysis demonstrates that the ECER policy’s impact on total emissions of industrial SO2 and CO2 is more pronounced in eastern areas compared to the mid-western areas, and the policy exhibits greater efficacy in reducing industrial SO2 emissions in non-resource-based cities relative to resource-based cities.

7. Implications and Limitations

7.1. Implications

The conclusions drawn above yield policy implications that can assist China in realizing the synergy of PCR through green fiscal policies and promoting eco-friendly economic growth. First, the ECER policy is an important means to reduce pollution and carbon emissions. Therefore, the central and local governments in China should promptly consolidate the experience gained from pilot cities and establish a replicable model based on this experience. Specifically, the central and local governments should fully leverage current digital technologies to create a digital platform or a series of dedicated workshops/conferences to share best practices, challenges, and lessons learned from ECER pilot cities. This platform should facilitate real-time exchanges and updates to ensure timely dissemination of replicable modes. Moreover, the scope and fields of ECER policy should be further expanded, and the energy conservation and emission reduction funds of governments at all levels should be actively integrated. Second, the transmission mechanisms of the synergistic effect of ECER policy include facilitating GTI and promoting IU. Therefore, governments can integrate funds to prioritize the promotion of GTI and IU. At the same time, the government can also guide market capital to support the development of GTI and IU. When carrying out ECER policy, governments should increase their support for GTI and encourage and support non-basic green technology R&D projects and GTI projects with a clear market orientation. For example, governments can simultaneously implement corresponding convenient preferential policies for GTI in enterprises while implementing ECER policy. This might include subsidies for green tech companies, grants for research on sustainable practices, and tax benefits for businesses implementing these green technologies. Third, the synergy of PCR by the ECER policy is heterogeneous for different areas and cities with different resource endowments. Therefore, when carrying out ECER policy, local governments should build green industrial systems with their own characteristics according to local conditions. Furthermore, additional support and incentives might be needed in the mid-western area and in resource-based cities to enhance the effectiveness of the policy. Moreover, resource-based cities should focus on the green transformation of traditional industries and avoid blindly developing strategic industries.
This study has significant implications for future scientific research, policy formulation, interdisciplinary collaboration, and global environmental governance, among other fields. On the one hand, exploring the synergistic effect of green fiscal policies involves not only economics but also multiple disciplines, such as political science, sociology, and environmental science. Future research can facilitate the exchange and cooperation between these disciplines, comprehensively analyze the complex impacts of green fiscal policies from multiple perspectives, and promote the deepening and development of interdisciplinary research. On the other hand, carbon reduction and pollution control are global challenges that require joint efforts from the international community. Future research can analyze the mechanisms and effects of collaboration between different countries in implementing green fiscal policies, providing a scientific basis for global environmental governance and international cooperation.

7.2. Limitations

This study has several limitations. First, the evaluation of the effect of green fiscal policies in this study is based on city-level data. However, companies are the basic units of production and business activities. Future research could assess the synergy of PCR by green fiscal policies using data at the firm level. Second, considering the availability of data, the research data used in this study are unbalanced panel data, which leads to the inability to test for the spatial spillover effects of ECER policy. Although unbalanced panel data do not affect the effectiveness of the difference-in-differences method when sample attrition is unrelated to policy implementation, in the future, as data become more complete, researchers could consider using balanced panel data. Third, future studies can examine the synergy of PCR from the perspective of relative terms to obtain a more comprehensive understanding.

Author Contributions

Conceptualization: S.P., L.W. and L.X.; methodology: S.P. and L.W.; formal analysis: S.P.; writing—original draft and editing: S.P., L.W. and L.X.; funding acquisition: L.X. and S.P. All authors were committed to improving this paper and are responsible for the viewpoints mentioned in this work. All authors have read and agreed to the published version of the manuscript.

Funding

This work was supported by the Yunnan Fundamental Research Projects (Grant No. 202401AU070205), the General Project of Humanities and Social Sciences Research, Ministry of Education (Grant No. 24YJCZH224), the Major Research Base Project for Humanities and Social Sciences in Colleges and Universities of Jiangxi Province (Grant No. JD23051), and the Scientific and Technological Research Project of the Jiangxi Provincial Department of Education (Grant No. GJJ2400305).

Institutional Review Board Statement

Not applicable.

Informed Consent Statement

Not applicable.

Data Availability Statement

The raw data supporting the conclusions of this article will be made available by the authors upon request.

Conflicts of Interest

The authors declare no conflicts of interest.

References

  1. Bergquist, P.; Marlon, J.R.; Goldberg, M.H.; Gustafson, A.; Rosenthal, S.A.; Leiserowitz, A. Information about the human causes of global warming influences causal attribution, concern, and policy support related to global warming. Think. Reason. 2022, 28, 465–486. [Google Scholar] [CrossRef]
  2. Peng, S.G.; Wang, L.; Xu, L. Impact of the marketization of industrial land transfer on regional carbon emission intensity: Evidence from China. Land 2023, 12, 984. [Google Scholar] [CrossRef]
  3. Preston, B.J. The influence of the Paris agreement on climate litigation: Legal obligations and norms (Part I). J. Environ. Law 2021, 33, 1–32. [Google Scholar] [CrossRef]
  4. Wang, Q.; Wang, S.S. Preventing carbon emission retaliatory rebound post-COVID-19 requires expanding free trade and improving energy efficiency. Sci. Total Environ. 2020, 746, 141158. [Google Scholar] [CrossRef]
  5. Jiang, S.Q.; Lin, X.Y.; Qi, L.L.; Zhang, Y.Q.; Sharp, B. The macro-economic and CO2 emissions impacts of COVID-19 and recovery policies in China. Econ. Anal. Policy 2022, 76, 981–996. [Google Scholar] [CrossRef]
  6. Figueres, C.; Landrigan, P.J.; Fuller, R. Tackling air pollution, climate change, and NCDs: Time to pull together. Lancet 2018, 392, 1502–1503. [Google Scholar] [CrossRef]
  7. Dong, Z.Y.Z.; Xia, C.Y.; Fang, K.; Zhang, W.W. Effect of the carbon emissions trading policy on the co-benefits of carbon emissions reduction and air pollution control. Energy Policy 2022, 165, 112998. [Google Scholar] [CrossRef]
  8. Nam, K.M.; Waugh, C.J.; Paltsev, S.; Reilly, J.M.; Karplus, V.J. Carbon co-benefits of tighter SO2 and NOx regulations in China. Glob. Environ. Chang. 2013, 23, 1648–1661. [Google Scholar] [CrossRef]
  9. Zhao, X.; Guo, Y.F.; Liu, Z.; Xiu, A.T. Boosting green recovery: The impact of green fiscal policy on green total factor productivity. Econ. Chang. Restruct. 2023, 56, 2601–2619. [Google Scholar] [CrossRef]
  10. Hu, J.B.; Chen, H.; Dinis, F.; Xiang, G. Nexus among green finance, technological innovation, green fiscal policy and CO2 emissions: A conditional process analysis. Ecol. Indic. 2023, 154, 110706. [Google Scholar] [CrossRef]
  11. Fang, M.; Chang, C.L. Nexus between fiscal imbalances, green fiscal spending, and green economic growth: Empirical findings from E-7 economies. Econ. Chang. Restruct. 2022, 55, 2423–2443. [Google Scholar] [CrossRef]
  12. Miao, N.; Sharif, A.; Ozturk, I.; Razzaq, A. How do the exploitation of natural resources and fiscal policy affect green growth? Moderating role of ecological governance in G7 countries. Resour. Policy 2023, 85, 103911. [Google Scholar] [CrossRef]
  13. Liu, H.Y.; Pata, U.K.; Zafar, M.W.; Kartal, M.T.; Karlilar, S.; Caglar, A.E. Do oil and natural gas prices affect carbon efficiency? Daily evidence from China by wavelet transform-based approaches. Resour. Policy 2023, 85, 104039. [Google Scholar] [CrossRef]
  14. Kartal, M.T.; Pata, U.K. Impacts of renewable energy, trade globalization, and technological innovation on environmental development in China: Evidence from various environmental indicators and novel quantile methods. Environ. Dev. 2023, 48, 100923. [Google Scholar] [CrossRef]
  15. Jia, W.L.; Li, L.; Lei, Y.L.; Wu, S.M. Synergistic effect of CO2 and PM2.5 emissions from coal consumption and the impacts on health effects. J. Environ. Manag. 2023, 325, 116535. [Google Scholar] [CrossRef]
  16. Ma, X.N.; Wei, X.L.; Yang, B.J.; Zhao, J.Y. Analysis of carbon pollution synergistic effect of different underlying surface spaces in Xi’an high residential area. Sustain. Energy Technol. Assess. 2023, 56, 103022. [Google Scholar] [CrossRef]
  17. Nie, C.F.; Lee, C.C. Synergy of pollution control and carbon reduction in China: Spatial-temporal characteristics, regional differences, and convergence. Environ. Impact Assess. Rev. 2023, 101, 107110. [Google Scholar] [CrossRef]
  18. Zeng, Q.H.; He, L.Y. Study on the synergistic effect of air pollution prevention and carbon emission reduction in the context of “dual carbon”: Evidence from China’s transport sector. Energy Policy 2023, 173, 113370. [Google Scholar] [CrossRef]
  19. Chae, Y. Co-benefit analysis of an air quality management plan and greenhouse gas reduction strategies in the Seoul metropolitan area. Environ. Sci. Policy 2010, 13, 205–216. [Google Scholar] [CrossRef]
  20. Yang, X.; Teng, F. Air quality benefit of China’s mitigation target to peak its emission by 2030. Clim. Policy 2018, 18, 99–110. [Google Scholar] [CrossRef]
  21. Wang, B.; Wang, Y.F.; Zhao, Y.Q. Collaborative Governance Mechanism of Climate Change and Air Pollution: Evidence from China. Sustainability 2021, 13, 6785. [Google Scholar] [CrossRef]
  22. Chen, H.; Chen, W.Y. Potential impacts of coal substitution policy on regional air pollutants and carbon emission reductions for China’s building sector during the 13th Five-Year Plan period. Energy Policy 2019, 131, 281–294. [Google Scholar] [CrossRef]
  23. Du, W.J.; Li, M.J. Assessing the impact of environmental regulation on pollution abatement and collaborative emissions reduction: Micro-evidence from Chinese industrial enterprises. Environ. Impact Assess. Rev. 2020, 82, 106382. [Google Scholar] [CrossRef]
  24. Zhu, J.P.; Wu, S.H.; Xu, J.B. Synergy between pollution control and carbon reduction: China’s evidence. Energy Econ. 2023, 119, 106541. [Google Scholar] [CrossRef]
  25. Gao, X.W.; Liu, N.; Hua, Y.J. Environmental protection tax law on the synergy of pollution reduction and carbon reduction in China: Evidence from a panel data of 107 cities. Sustain. Prod. Consum. 2022, 33, 425–437. [Google Scholar] [CrossRef]
  26. Hu, J. Synergistic effect of pollution reduction and carbon emission mitigation in the digital economy. J. Environ. Manag. 2023, 337, 117755. [Google Scholar] [CrossRef]
  27. Shen, Y.; Yang, Z.H. Chasing green: The synergistic effect of industrial intelligence on pollution control and carbon reduction and its mechanisms. Sustainability 2023, 15, 6401. [Google Scholar] [CrossRef]
  28. Goenka, A.; Liu, L.; Nguyen, M.H. COVID-19 and a green recovery? Econ. Model. 2021, 104, 105639. [Google Scholar] [CrossRef]
  29. Zhao, L.H.; Chau, K.Y.; Tran, T.K.; Sadiq, M.; Xuyen, N.T.M.; Phan, T.T.H. Enhancing green economic recovery through green bonds financing and energy efficiency investments. Econ. Anal. Policy 2022, 76, 488–501. [Google Scholar] [CrossRef]
  30. Tan, X.J.; Dong, H.M.; Liu, Y.S.; Su, X.; Li, Z.X. Green bonds and corporate performance: A potential way to achieve green recovery. Renew. Energy 2022, 200, 59–68. [Google Scholar] [CrossRef]
  31. Wang, H.T.; Qi, S.Z.; Zhou, C.B.; Zhou, J.J.; Huang, Y.Y. Green credit policy, government behavior and green innovation quality of enterprises. J. Clean. Prod. 2022, 331, 129834. [Google Scholar] [CrossRef]
  32. Lv, C.C.; Fan, J.F.; Lee, C.C. Can green credit policies improve corporate green production efficiency? J. Clean. Prod. 2023, 397, 136573. [Google Scholar] [CrossRef]
  33. Scholtens, B. Borrowing green: Economic and environmental effects of green fiscal policy in The Netherlands. Ecol. Econ. 2001, 39, 425–435. [Google Scholar] [CrossRef]
  34. Lin, B.Q.; Zhu, J.P. Impact of energy saving and emission reduction policy on urban sustainable development: Empirical evidence from China. Appl. Energy 2019, 239, 12–22. [Google Scholar] [CrossRef]
  35. Meng, Z.S.; Sun, H.K.; Liu, X.T. Impact of green fiscal policy on the investment efficiency of renewable energy enterprises in China. Environ. Sci. Pollut. Res. 2022, 29, 76216–76234. [Google Scholar] [CrossRef]
  36. Hidayat, A.; Manurung, A.B.U.S.; Liliana, L.; Rohima, S.; Pertiwi, R.; Andaiyani, S.; Shodrokova, X. Green bonds and the Sustainable Development Index in Asian countries: Panel data evidence. Argum. Oeconomica 2024, 53, 107–119. [Google Scholar] [CrossRef]
  37. Hu, Y.F.; Ding, Y.Q.; Liu, J.; Zhang, Q.Z.; Pan, Z.J. Does carbon mitigation depend on green fiscal policy or green investment? Environ. Res. Lett. 2023, 18, 045005. [Google Scholar] [CrossRef]
  38. Dong, W.; Hou, X.M.; Qin, G.W. Research on the carbon emission reduction effect of green taxation under china’s fiscal decentralization. Sustainability 2023, 15, 4591. [Google Scholar] [CrossRef]
  39. Lin, B.Q.; Zhu, J.P. Is the implementation of energy saving and emission reduction policy really effective in Chinese cities? A policy evaluation perspective. J. Clean. Prod. 2019, 220, 1111–1120. [Google Scholar] [CrossRef]
  40. Jin, H.; Yang, J.; Chen, Y.Y. Energy saving and emission reduction fiscal policy and corporate green technology innovation. Front. Psychol. 2022, 13, 1056038. [Google Scholar] [CrossRef]
  41. Yan, Z.M.; Zou, B.L.; Du, K.R.; Li, K. Do renewable energy technology innovations promote China’s green productivity growth? Fresh evidence from partially linear functional-coefficient models. Energy Econ. 2020, 90, 104842. [Google Scholar] [CrossRef]
  42. Xie, F.M.; Zhang, B.; Wang, N. Non-linear relationship between energy consumption transition and green total factor productivity: A perspective on different technology paths. Sustain. Prod. Consum. 2021, 28, 91–104. [Google Scholar] [CrossRef]
  43. Huang, S.Z. Do green financing and industrial structure matter for green economic recovery? Fresh empirical insights from Vietnam. Econ. Anal. Policy 2022, 75, 61–73. [Google Scholar] [CrossRef]
  44. Guo, W.; Lin, X.R. Market fragmentation of energy resource prices and green total factor energy efficiency in China. Resour. Policy 2022, 76, 102580. [Google Scholar] [CrossRef]
Figure 1. The parallel trend test for total emissions. Notes: in the figure, the estimated values of χk are represented by hollow circles, while the 90% confidence intervals are indicated by dashed lines.
Sustainability 17 00667 g001
Table 1. Variable definitions and descriptive statistics.
VariablesDefinitionsObs.MeanStd. Dev.Min.Max.
C_SitNatural logarithm
of total emissions of industrial SO2
304110.54411.08074.317513.4345
C_WitNatural logarithm
of total emissions of industrial wastewater
30418.57640.98904.477311.4773
C_CitNatural logarithm
of total emissions of CO2
30413.22330.92060.15836.0306
PolicyitDummy variable of pilot cities30410.04370.20450.00001.0000
GTIitGTI30410.39431.01260.000017.6220
IUitIU304138.45909.443610.150083.5200
PGDPitEconomic development304110.35780.75864.595113.0557
OpitOpenness30413.46021.62890.00008.4707
GovitGovernment size30410.14880.07440.03131.4852
FinitFinancial development30410.87290.55430.11227.4502
SciitScience input30410.01480.01490.00000.2068
PopitPopulation density3041−3.31230.8305−6.9061−1.3287
Table 2. Results of the benchmark regression for total emissions.
VariablesC_SitC_WitC_Cit
(1)(2)(3)(4)(5)(6)
Policyit−0.2136 ***−0.2068 ***−0.1115 ***−0.1303 ***−0.1344 ***−0.1375 ***
(0.0483)(0.0469)(0.0371)(0.0363)(0.0252)(0.0256)
CONSTANT10.6762 ***9.0550 ***9.1572 ***11.0778 ***4.0073 ***2.3013 ***
(0.1954)(1.0555)(0.0781)(1.0362)(0.0617)(0.5540)
Control variablesWithoutWithWithoutWithWithoutWith
City dummy variablesWithWithWithWithWithWith
Year dummy variablesWithWithWithWithWithWith
Obs.304130413041304130413041
R20.87390.87490.87100.87220.93720.9382
Notes: In parentheses, robust standard errors are reported. Significance at the 0.01 level is denoted by “***”.
Table 3. Results of the robustness test via bilateral winsorization.
VariablesTotal Emissions
(1) C_Sit(2) C_Wit(3) C_Cit
Policyit−0.1566 ***−0.0616 ***−0.1528 ***
(0.0425)(0.0325)(0.0233)
CONSTANT9.9684 ***11.0179 ***2.1037 ***
(0.9000)(0.7715)(0.5813)
Control variablesWithWithWith
City dummy variablesWithWithWith
Year dummy variablesWithWithWith
Obs.304130413041
R20.87080.87250.9368
Notes: In parentheses, robust standard errors are reported. Significance at the 0.01 level is denoted by “***”.
Table 4. Results of the robustness test after deleting the sample of municipalities.
VariablesTotal Emissions
(1) C_Sit(2) C_Wit(3) C_Cit
Policyit−0.1701 ***−0.1098 ***−0.1368 ***
(0.0482)(0.0385)(0.0286)
CONSTANT11.0278 ***11.7811 ***2.8601 ***
(0.9841)(1.0112)(0.5292)
Control variablesWithWithWith
City dummy variablesWithWithWith
Year dummy variablesWithWithWith
Obs.297429742974
R20.87120.86490.9339
Notes: In parentheses, robust standard errors are reported. Significance at the 0.01 level is denoted by “***”.
Table 5. Results of the mechanism tests.
Variables(1) GTIit(2) IUit
Policyit0.4768 ***0.7146 *
(0.0980)(0.3676)
CONSTANT19.9285 ***131.6982 ***
(2.7141)(12.9996)
Control variablesWithWith
City dummy variablesWithWith
Year dummy variablesWithWith
Obs.30413041
Adj R20.78210.9174
Notes: In parentheses, robust standard errors are reported. Significance at the 0.10 and 0.01 levels is denoted by “*” and “***”, respectively.
Table 6. Results of heterogeneity analysis for different areas.
VariablesTotal Emissions
(1) C_Sit(2) C_Wit(3) C_Cit
Policyit−0.1351 **−0.1228 **−0.0944 ***
(0.0573)(0.0505)(0.0331)
Policyit × Ei−0.1612 *−0.0169−0.0970 **
(0.0908)(0.0695)(0.0490)
CONSTANT9.3053 ***11.1041 ***2.4519 ***
(1.0380)(1.0672)(0.5607)
Control variablesWithWithWith
City dummy variablesWithWithWith
Year dummy variablesWithWithWith
Obs.304130413041
R20.87500.87220.9383
Notes: In parentheses, robust standard errors are reported. Significance at the 0.10, 0.05, and 0.01 levels is denoted by “*”, “**” and “***”, respectively.
Table 7. Results of heterogeneity analysis for cities with different resource endowments.
VariablesTotal Emissions
(1) C_Sit(2) C_Wit(3) C_Cit
Policyit0.0341−0.2024 ***−0.1372 **
(0.0920)(0.0604)(0.0676)
Policyit × Ri−0.3086 ***0.0923−0.0004
(0.1036)(0.0701)(0.0711)
CONSTANT9.1645 ***11.0451 ***2.3014 ***
(1.0513)(1.0378)(0.5550)
Control variablesWithWithWith
City dummy variablesWithWithWith
Year dummy variablesWithWithWith
Obs.304130413041
R20.87520.87220.9382
Notes: In parentheses, robust standard errors are reported. Significance at the 0.05, and 0.01 levels is denoted by “**” and “***”, respectively.
Disclaimer/Publisher’s Note: The statements, opinions and data contained in all publications are solely those of the individual author(s) and contributor(s) and not of MDPI and/or the editor(s). MDPI and/or the editor(s) disclaim responsibility for any injury to people or property resulting from any ideas, methods, instructions or products referred to in the content.

