Abstract
Developing a green energy strategy for municipalities requires creating a framework to support the local production, storage, and use of renewable energy and green hydrogen. This framework should cover essential components for small-scale applications, including energy sources, infrastructure, potential uses, policy backing, and collaborative partnerships. It is deployed as a small-scale renewable and green hydrogen unit in a municipality or building demands meticulous planning and considering multiple elements. Municipality can promote renewable energy and green hydrogen by adopting policies such as providing financial incentives like property tax reductions, grants, and subsidies for solar, wind, and hydrogen initiatives. They can also streamline approval processes for renewable energy installations, invest in hydrogen refueling stations and community energy projects, and collaborate with provinces and neighboring municipalities to develop hydrogen corridors and large-scale renewable projects. Renewable energy and clean hydrogen have significant potential to enhance sustainability in the transportation, building, and mining sectors by replacing fossil fuels. In Canada, where heating accounts for 80% of building energy use, blending hydrogen with LPG can reduce emissions. This study proposes a comprehensive approach integrating renewable energy and green hydrogen to support small-scale applications. The study examines many scenarios in a building as a case study, focusing on economic and greenhouse gas (GHG) emission impacts. The optimum scenario uses a hybrid renewable energy system to meet two distinct electrical needs, with 53% designated for lighting and 10% for equipment with annual saving CAD$ 87,026.33. The second scenario explores utilizing a hydrogen-LPG blend as fuel for thermal loads, covering 40% and 60% of the total demand, respectively. This approach reduces greenhouse gas emissions from 540 to 324 tCO2/year, resulting in an annual savings of CAD$ 251,406. This innovative approach demonstrates the transformative potential of renewable energy and green hydrogen in enhancing energy efficiency and sustainability across sectors, including transportation, buildings, and mining.
Keywords:
wind energy; solar energy; energy transition; hybrid renewable energy; green hydrogen; GHG 1. Introduction
Renewable energy from natural elements is more environmentally friendly than fossil fuels and offers an alternative to conventional energy sources. In the context of buildings, renewable energy involves incorporating sustainable energy sources like solar, wind, hydrogen, and biomass throughout the entire building lifecycle spanning design, construction, operation, and maintenance to lessen reliance on fossil fuels and traditional energy, fostering environmental sustainability and helping combat climate change [1]. The use of renewable energy in buildings primarily depends on the energy requirements of the building and the specific types of energy sources available. Among the various renewable energy options, solar, wind, hydro, tidal, geothermal, and hydrogen are widely acknowledged as leading and well-established technologies in the renewable energy industry. However, solar, wind, geothermal, and hydrogen energy hold the greatest potential for meeting the energy demands of buildings [2]. Figure 1 visually summarizes the progression of energy policies and the growing integration of renewable energy and energy efficiency measures in building design and operation. It reflects the increasing emphasis on sustainability and global commitments towards reducing carbon footprints in the construction and operation of buildings.
The International Energy Agency (IEA) reports that buildings are responsible for approximately 40% of global energy use and contribute 30% of worldwide carbon dioxide emissions [3]. Therefore, reducing energy consumption in buildings becomes essential for lowering greenhouse gas emissions and minimizing environmental impact. Implementing renewable hybrid energy systems in buildings can significantly contribute to this objective. The demand for renewable hybrid energy systems in buildings is anticipated to increase consistently over the coming decade. The building sector currently accounts for 20–40% of total energy consumption in developed countries [4,5]. With two-thirds of greenhouse gas (GHG) emissions stemming from energy consumption, transitioning from fossil fuels to low-carbon alternatives is essential [6]. Renewable energy and energy efficiency offer effective solutions for reducing greenhouse gas emissions while meeting the energy needs of billions, steering the world toward sustainable economic and social development [7]. Furthermore, renewable energy sources offer viable alternatives to fossil fuels, helping to address the building industry’s energy challenges and reduce environmental pollution. Renewable options such as solar, hydrogen, and wind energy have seen considerable growth in recent years [8,9]. Clean hydrogen offers significant potential to enhance the environmental sustainability of the transportation and mining sectors as an alternative to fossil fuels. Heating currently constitutes 80% of energy use in Canadian homes, and blending hydrogen with natural gas offers an alternative for reducing emissions. The combustion process results in 541 Mt CO2e annually, encompassing emissions from electricity and fuel production (192 Mt CO2e) and the end use of carbon-based fuels (349 Mt CO2e) across transportation, buildings, and industry. Table 1 provides a breakdown of carbon emissions by application.
Table 1.
Carbon emission yearly due to application.
Figure 1.
Five-phase diagram illustrating the progression of energy efficiency and renewable energy integration in buildings [4].
Utilizing low-emission hydrogen and hydrogen-based fuels is projected to yield a moderate reduction in CO2 emissions by 2030, especially when compared to other significant mitigation strategies such as expanding renewable energy, direct electrification, and promoting behavior change. Figure 2 illustrates the global share of renewable energy from 2018 to 2020, highlighting variations across different renewable sources. Canada’s pathways to achieving net zero carbon rely on a mix of economic, political, cultural, and technological factors that will shape tangible results and interact dynamically throughout the process. While Canada has full control over some of these factors, others can influence only partially, and some remain entirely beyond its control. Technological innovation, particularly in negative emission solutions like direct air capture, hydrogen generation, and carbon-sequestering bioenergy, is expected to play a pivotal role in reaching the net zero target. These choices will shape Canada’s net zero journey and existing pathways.
Figure 2.
Annual growth for renewable electricity generation by source, 2018–2020 [10].
The shift towards reducing GHG emissions should focus on moving from a heavy reliance on fossil fuels to an increased use of renewable energy sources and hydrogen. Key strategic points for transitioning from fossil fuel energy to net zero emissions are summarized in Table 2.
Table 2.
The strategies sequences needed to achieve net zero emissions.
Using renewable energy and hydrogen (H2) for building loads is gaining traction as residents, industries, and governments focus on sustainability and carbon reduction. The use of renewable energy and hydrogen (H2) for building loads is indeed gaining momentum, driven by the dual goals of sustainability and carbon footprint reduction. Governments and industries worldwide are increasingly prioritizing these technologies, as they not only reduce dependence on fossil fuels but also support grid stability and energy resilience.
Figure 3 illustrates the different applications of Hydrogen (H2) as a central energy source, categorized into three main areas: Fuel, Heat, and Feedstock:
Figure 3.
Hydrogen (H2) with its uses for fuel, heat, and feedstock.
1.1. Fuel for
- Transportation: Hydrogen is used as a clean fuel for various transportation modes, including cars, trucks, buses, and even airplanes. Hydrogen fuel cells generate electricity through a chemical reaction, powering electric motors without producing harmful emissions.
- Power: Hydrogen is also used in electricity generation, particularly in electricity peaking plants. These plants rely on hydrogen to generate power during periods of high electricity demand, providing a clean and efficient solution to meet peak energy needs.
1.2. Heat for
- Industry: Hydrogen provides heat for industrial processes, playing a crucial role in high-temperature applications such as steel, cement, and aluminum production, as well as industries like food and paper manufacturing. It offers a clean alternative to fossil fuels traditionally used in these energy-intensive sectors.
- Buildings: Hydrogen can provide heating for residential and commercial buildings, offering an environmentally friendly way to maintain comfortable indoor temperatures and meet energy needs in urban areas.
1.3. Feedstock for
- Chemicals: Hydrogen is a key raw material in the production of chemicals such as fertilizers, fuel refining, and plastics. It plays an essential role in processes like ammonia synthesis for fertilizers and in refining crude oil into useful fuels.
- Products: In addition to chemicals, hydrogen is used in various products, including metallurgy, where it is involved in processes like reducing metal ores, as well as in food and glass production.
The municipality can effectively collaborate with local businesses and communities to enhance the adoption of small-scale renewable energy systems through some approaches as:
- Municipality can partner with local businesses to co-fund and implement small-scale renewable projects, such as rooftop solar installations or microgrids. These partnerships can reduce financial burdens and encourage private-sector participation.
- Support programs as offering tax breaks, subsidies, or low-interest loans to small businesses and residents can make small-scale renewable energy systems more accessible and affordable.
- Municipality can host workshops, and stakeholder meetings to raise awareness about the benefits of renewable energy and gather input on local energy needs.
- Municipality can support the establishment of community energy co-operatives that allow residents and businesses to collectively invest in and benefit from renewable energy systems.
- Simplifying regulations and approval processes for small-scale renewable installations reduces barriers for businesses and homeowners.
- Municipality can collaborate with local businesses to implement pilot projects that showcase the feasibility and benefits of renewable energy, inspiring wider adoption.
- Facilitate resource-sharing initiatives, such as solar panel leasing programs or community solar gardens, to make renewable energy systems accessible to those who cannot install them independently.
- Provide technical expertise, data, and tools to help businesses and communities make informed decisions about renewable energy adoption.
2. Literature Survey
Wind energy, for instance, is utilized at both large and small scales, with wind turbines often installed in remote or offshore locations [11]. Solar energy is another promising power source, particularly suitable for integration with existing structures in urban areas where installation space is limited, vibration control is essential, and wind conditions are unfavorable. However, energy storage technologies are necessary to ensure a reliable power supply, as both solar and wind energy are typically intermittent and unpredictable [12], leading to inconsistency with buildings’ energy demands. In addition to cutting greenhouse gas emissions and boosting energy efficiency, hybrid energy systems in buildings can also result in long-term cost savings. A report by the Rocky Mountain Institute indicates that hybrid systems can offer a cost-effective alternative to conventional energy sources, potentially reducing energy bills by 10% to 60%, depending on specific conditions. These systems integrate renewable sources like solar, hydrogen, and wind with traditional sources like fossil fuels to create a sustainable and efficient energy solution. This combination enhances energy efficiency, lowers dependency on traditional sources, reduces emissions, and cuts operating costs for building owners. As more recognize these advantages, hybrid systems are increasingly adopted in commercial and residential buildings to lower energy expenses and support sustainability [13]. Following a similar approach to ecosystem development for building demandsAbdin, Z.; and Mérida, W conducted a techno-economic analysis across various locations for an off-grid renewable hybrid energy system designed to generate power and hydrogen. Using HOMER, nine different renewable energy system configurations were simulated to identify the most cost-effective setup to meet load demand. The results indicate that improved solar radiation and wind speed profiles can help achieve a lower cost of energy (COE) for renewable hybrid systems. Additionally, the analysis suggests that hydrogen technologies, such as fuel cells, electrolyzers, and hydrogen tanks, could potentially replace battery banks. However, the current high capital costs of these components lead to an overall higher system cost [14]. However, R. Al Afif et al. assessed the techno-economic feasibility of hybrid renewable energy systems, both off-grid and on-grid, for Jordan’s Al-Karak governorate. Using HOMER Pro software, the study evaluates configurations to maximize renewable energy integration by exploring grid-connected and stand-alone systems comprising wind turbines, biogas plants, photovoltaic (PV) panels, flywheels, and batteries. The goal is to minimize net present costs, the leveled cost of energy, and CO2 emissions. Results indicate that the PV/Wind system, grid-connected with battery storage, offers the optimal setup for sustainable electrification in Al-Karak, combining environmental benefits with dependable, uninterrupted energy access. This configuration achieves the lowest net present cost (USD 298,359) and Levelized cost (USD 0.024/kWh), with a renewable energy share of 71.8% (wind-generated), while 28.2% is purchased from the grid. This setup reduces CO2 emissions to 220 tons annually, marking a 53% decrease compared to a grid-only system, contributing to energy independence and environmental quality improvements [15]. Moreover, P. Malik et al. studied the technical, economic, and environmental feasibility of a grid-connected hybrid microgrid system in the western Himalayan region, utilizing local renewable resources such as solar, wind, and biomass (pine needles). Five unique system configurations are evaluated, considering both the presence and absence of a storage unit. Comparative analysis indicates that the grid-connected PV/BG hybrid system is the most cost-effective, achieving the lowest levelized cost of energy (LCOE) at US$0.099 per kWh. Key findings reveal that the BG system contributes the largest portion (62%) of total power generation, followed by PV (20%) and grid supply (18%). Environmental assessments show that CO2 emissions from the optimal hybrid system are reduced by approximately 85% compared to a DG-only system [16]. In 2021, B.K. Das et al. studied and explored the optimal sizing of a Hybrid Renewable Energy System (HRES) that integrates photovoltaic (PV), wind turbine, battery storage, and a converter to meet the electricity demands of a remote community in Broome, WA. Additionally, any surplus energy produced by the system is channeled through Thermal Load Control (TLC) to address the community’s thermal needs, specifically for hot water. The optimized HRES, which supports both electrical and thermal demands, is evaluated against systems that fulfill only electrical needs. Findings reveal that the PV/Wind/Batt/TLC-based HRES achieves a lower Cost of Energy (COE) at 0.255 US$/kWh and Net Present Cost (NPC) of US$1,416,590, outperforming both the PV/Batt/TLC (COE: 0.282 US$/kWh, NPC: US$1,567,361) and the Wind/Batt/TLC (COE: 0.406 US$/kWh, NPC: US$2,241,687) systems under conditions optimized for combined electric and thermal load fulfillment [17]. On the other hand, K. Muruga Perumal and P. Ajay D Vimal Raj studied primarily aims to identify a technically practical and economically viable hybrid energy solution for off-grid electrification in Korkadu village, Puducherry. The goal is to determine the least-cost configuration of solar PV, wind turbines, a bio-generator, and battery storage to reliably meet the projected energy demand at an estimated cost of Rs.10.18 per kWh. This design and analysis focus on a hybrid renewable system that leverages solar energy as a primary source, supplemented by wind power and the village’s biomass resources as alternative energy sources [18]. Wang et al. developed an environmentally efficient system for power and cooling, achieving a total efficiency of 77.5%, primarily due to the high hydrogen-to-electricity conversion rate and waste heat recovery from AFCs [19]. However, Behzadi et al. introduced and rigorously evaluated an innovative approach to integrate solar and wind energy sources through hydrogen storage, aiming to improve grid stability and manage peak loads. Using the Transient System Simulation (TRNSYS) tool and the Engineering Equation Solver, the study comprehensively analyzed the technical, economic, and environmental aspects of a residential building in Sweden. A four-objective optimization was performed using MATLAB, combining the grey wolf optimization algorithm with an artificial neural network to balance key indicators. Results showed optimal conditions could yield an 80.6% improvement in primary energy savings, a 219% reduction in CO2 emissions, a cost of $14.8/h and purchased energy of 24.9 MWh. Scatter distribution analysis highlighted the importance of minimizing fuel cell voltage and collector length, while electrode area had a limited impact. The smart renewable system proposed could meet 70% of the building’s annual energy needs, with surplus energy sellable back to the local grid, establishing it as a practical and sustainable solution [20].
Li et al. proposed a novel solar-based system featuring an Alkaline Fuel Cell (AFC) paired with an electrolyzer. The study found that, along with significant electricity generation and low exergy loss, the AFC’s waste heat could be effectively utilized to co-generate power via a Stirling engine and provide cooling with an absorption chiller [21]. A case study for different buildings was performed by Chen et al. by reviewing and examining new approaches to incorporating renewable energy within the construction industry, concentrating on energy types, policies, advancements, and future perspectives. The energy sources discussed include solar, wind, geothermal, and biomass. Case studies from Seattle, USA, and Manama, Bahrain, illustrate these practices. Key perspectives cover self-sufficiency, microgrid systems, carbon neutrality, intelligent building design, cost reduction, energy storage solutions, policy backing, and market visibility. Integrating wind power into buildings can meet approximately 15% of energy needs, while solar can boost renewable energy use by up to 83%. Additionally, financial incentives, such as a 30% subsidy for renewable technology adoption, enhance the appeal of these innovations [3]. T. Ahmad and D. Zhang’s study integrates renewable energy sources and conducts a techno-economic feasibility analysis in both grid-connected and islanded modes to address community and commercial energy demands. Four sensitivity cases were developed, each further divided into four loops with varying combinations of photovoltaics, wind turbines, battery storage, power grids, converters, and diesel generators. The analysis utilized parameters such as capital, replacement, and operational costs, along with maintenance, salvage, fuel costs, real-time load demands, and climate data. The optimal results from sensitivity case 2 were applied to evaluate the remaining cases. In sensitivity case-2, the net present cost and annualized cost for the islanded mode in loop-1 were found to be $1,381,080.42 and US$106,832.62, respectively, whereas, in the grid-connected mode, they were noted at US$512,792.1 and US$39,666.71, respectively. The study demonstrates that the proposed utility grid-connected mode incurs costs that are half those of the islanded mode, highlighting its cost-effectiveness in meeting energy demands [22]. Patil, A et al. conducted a techno-economic and environmental analysis on grid-connected Hybrid Renewable Energy Systems (HRES) with and without a battery bank to determine the optimal solution for a remote area in the Bhorha Village, India., Among the six feasible configurations analyzed, the grid-connected PV/BG (biogas) hybrid setup was identified as the most cost-effective, with a Levelized Cost of Energy (LCOE) of $0.309 per kWh. Results from the optimal configuration show that 62% of energy production is from the PV system, followed by 20% from wind turbine and 18% from the biogas. Environmentally, this configuration resulted in an approximately 85% reduction in CO2 emissions compared to a system relying solely on diesel generators (DG) [23]. Furthermore, H. Karunathilake et al. study aims to introduce a structured framework for integrating renewable energy into community development. A scenario-based analysis was carried out for a planned neighborhood in Okanagan, British Columbia (BC), Canada, with each scenario evaluated based on life cycle cost (LCC) and greenhouse gas (GHG) emission reduction. Scenarios were then compared by weighing their costs and benefits to key stakeholders. The study’s findings showed that increasing the share of renewable sources in the energy mix does not always reduce LCC or GHG emissions. The advantages of adding renewables to a region’s energy mix vary depending on the existing energy sources. Consequently, the composition of the regional power grid affects the feasibility and acceptance of renewable energy integration in any given area. The suitability of renewable options depends on local conditions, resource availability, and the current energy mix. To accurately assess the potential for emissions reduction and the benefits of integrating renewable energy, an examination of the regional energy mix specific to the community’s location is essential. The study indicates that the extent of environmental impact reduction through renewable integration varies significantly by province within Canada. Developers should consider the optimal investment level that can be wholly or partially recovered through premium home pricing [24]. Moreover, they stated that a comprehensive framework that includes decision-making, design, and occupancy considerations is essential for realizing the full potential of energy demand reduction initiatives in residential communities. This framework also serves as an initial step toward planning energy-sustainable communities. Long-term energy modeling provides valuable insights into the effectiveness and the costs and benefits of demand reduction measures. The life cycle costs and impacts should play a key role in selecting suitable interventions for a residential community, as it’s essential to assess whether the investment and effort justify the anticipated results. Given the diverse climatic conditions across Canada, demand reduction interventions must be tailored for regional applicability to achieve maximum impact. Additionally, information dissemination, along with regulatory and policy-level measures, is crucial for effectively managing residential energy consumption [25]. K. Singh and C. Hachem-Vermette developed a new optimization approach for cost-effective energy resource planning in neighborhoods, designed to meet energy load demands, achieve a targeted return on investment, and ensure an optimal payback period. This methodology incorporates various tariff structures alongside renewable energy sources (RES), alternative energy sources (AES), borehole thermal energy storage (BTES), and other cost models. The proposed approach is demonstrated through a case study of a mixed-use neighborhood, developing multiple energy system scenarios and waste-to-energy (WtE) operational strategies. In an all-electric scenario (SC1), a combination of PV panels and a continuously operated WtE-CHP plant offers the shortest payback period. For the scenario where domestic hot water (DHW) is supplied by non-electrical systems (SC2), it is not recommended to install a WtE-CHP plant or BTES. In the scenario where DHW and space heating are provided by non-electrical systems (SC3), the use of natural gas, WtE-CHP, and BTES is advised, achieving a payback period of 15.2 years [26]. F.D. Minuto, P. Lazzeroni, R. Borchiellini et al. developed multiple retrofit scenarios for buildings to identify optimal solutions. Data-driven retrofit models were simulated for an 87-unit condominium in Northwestern Italy, using various technology combinations—such as rooftop photovoltaic (PV) systems, air-source heat pumps, battery energy storage, and electric vehicle chargers—to meet both electric and heating demands. Each scenario’s techno-economic feasibility was assessed through multi-criteria analysis, evaluating compliance with EU climate goals. The PV system retrofit consistently yields positive environmental and economic benefits, achieving an internal rate of return of 18.2%. The air-to-water heat pump also reduces primary energy demand by 26% and CO2 emissions by 30%. However, it introduces electric load volatility on the grid, posing challenges potentially greater than those presented by PV intermittency [27].
Hydrogen complements direct electrification by enhancing renewable energy integration through its time-shifting and energy storage capabilities. While Canada’s primary renewable energy source is hydropower, which inherently provides energy storage, wind energy capacity has grown steadily over the last decade. Wind power is among the fastest-growing electricity sources globally, accounting for 4% of Canada’s national electricity generation, with Ontario and Quebec leading in capacity. Notably, Prince Edward Island generates 98% of its local electricity from wind but relies on imported power from New Brunswick’s grid. Hydrogen offers a dispatchable energy solution to increase energy independence and can serve as a hybrid system for winter heating, reducing peak electric heating demand. Its versatility as an energy carrier allows for tailored applications across Canada [28]. While solar technologies have matured significantly, challenges such as high initial costs and intermittent energy production remain. Wind power, in contrast, is abundant, sustainable, and cost-effective for domestic energy applications. Combining solar and wind energy sources offers a strategic approach to producing reliable, clean, and cost-effective energy. Recent studies have explored integrating solar and wind systems for multi-generation purposes, including hydrogen generation, electricity generation, and heating/cooling, with a focus on techno-economic and environmental benefits [29]. Parra et al. developed a hydrogen energy storage system incorporating a polymer electrolyte membrane electrolyzer, a metal hydride tank, and a proton-exchange membrane fuel cell, achieving a round-trip efficiency of 52% for mid- to long-term energy storage. Izadi et al. simulated hybrid systems integrating solar panels, wind turbines, and hydrogen storage across four locations, creating zero-energy buildings where renewables and hydrogen systems provided 70–88% of required electricity. Wei et al. conducted similar simulations in Saskatoon, Canada, finding solar panels to have greater energy generation potential than wind turbines [30]. Further research by Mansir et al. analyzed residential systems using TRNSYS software, comparing hydrogen fuel cells and conventional batteries for energy storage. While hydrogen systems had double the capital cost, their larger capacities improved overall performance [31]. Behzadi et al. explored combining solar and wind energy with hydrogen storage to enhance grid stability and reduce peak loads in Sweden. Their optimized system demonstrated an 80.6% improvement in primary energy savings, a 219% reduction in carbon emissions, and the ability to meet 70% of annual energy needs while selling excess energy back to the grid [32].
Moreover, Ishaq et al. developed a system combining a wind turbine with high-temperature solar collector, and a CuCl2 thermochemical hydrogen cycle, achieving a 50% performance efficiency. Hasan and Genç analyzed a hybrid solar-wind system with electrolyzers, showing that selling surplus power to the grid could reduce hydrogen production costs by US$0.03/m3 [33]. Similarly, Al-Buraiki and Al-Sharafi designed a wind-solar system for hydrogen production in Dhahran, Saudi Arabia, capable of independently meeting electricity demands while cutting carbon emissions by 9.6 tons annually [34].
Table 3 summarizes the findings from the previous literature by categorizing the studies based on their focus, key results, technologies utilized, and locations, offering a clear and comprehensive overview.
Table 3.
Literature survey summery.
The previous survey demonstrates that all research aligns with the objectives outlined in the paper. Consequently, this paper aims to address various scenarios, detailed in the following sections, with the primary goal of conducting a comparative analysis of renewable energy and hydrogen as power sources for buildings. This analysis includes power calculations and cost assessments, focusing specifically on the impact of wind turbines, hydrogen as fuel mixture with LPG, and photovoltaic (PV) panels. The comparison seeks to evaluate and contrast the efficiency, performance, and economic factors related to wind, hydrogen–LPG fuel mixture, and solar energy. This study depending on the adopting of a hybrid renewable energy system combined with a hydrogen-LPG mix for building energy in Canada entails upfront expenses for renewable energy infrastructure such as solar panels (CAD$2.5–$3/Watt installed), wind turbines (CAD$1500–CAD$2500/kW), electrolyzers, and storage systems, as well as retrofitting LPG setups and ongoing maintenance (solar and wind maintenance: ~1–2% of system cost annually). Operational costs include electricity for hydrogen production and system upkeep, with hydrogen priced at ~CAD$3–CAD$5/kg and LPG at ~CAD$0.60/L. Financial support is available through programs like the Canada Greener Homes Grant (up to CAD$5000), the Clean Energy Innovation Program, provincial incentives (e.g., Alberta Hydrogen Roadmap, Quebec’s ÉcoPerformance), carbon tax savings, and tax advantages such as accelerated depreciation for clean energy systems. These measures lower long-term energy expenses, boost resilience, and enhance property value [35].
The paper introduces a transformative approach to addressing critical gaps in energy sustainability for buildings by leveraging Hybrid Renewable Energy Systems (HRES). Unlike previous studies that often focus on isolated renewable energy solutions, this research emphasizes the integration of solar panels, wind turbines, and green hydrogen production to achieve environmental and socio-economic sustainability.
The innovation of this study lies in its comprehensive analysis and dynamic simulation of HRES using TRNSYS 16 software under diverse climatic conditions. By addressing key challenges such as optimizing energy generation, reducing greenhouse gas (GHG) emissions, and enhancing energy reliability, the manuscript provides actionable solutions for transitioning to sustainable energy systems.
Through this assessment, the study aims to provide valuable insights into the most efficient and cost-effective approach to meeting building energy demands.
3. Methodology
To effectively implement a Hybrid Energy System (HES), a comprehensive approach is required, encompassing:
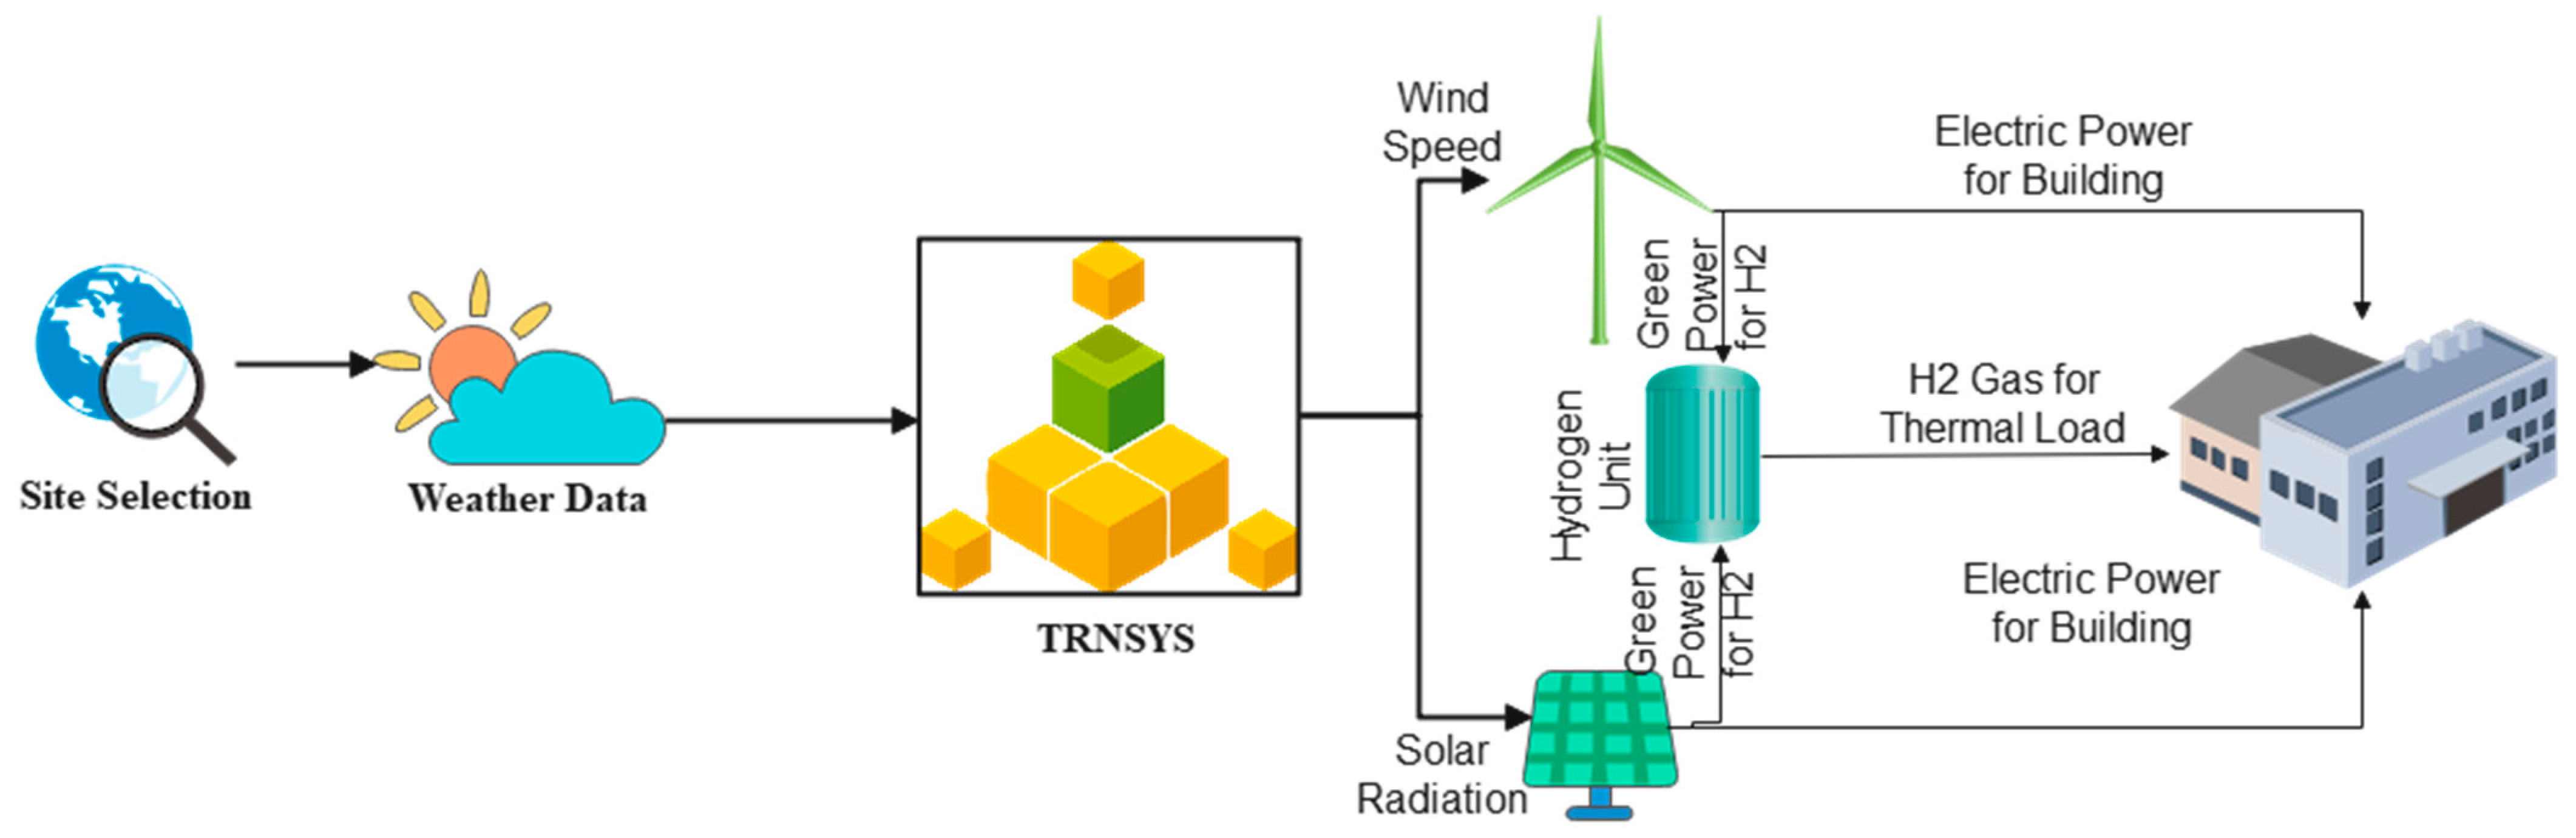
3.1. Energy Available Analysis
This step evaluates energy available patterns to understand the optimum energy system needed dynamically. It includes two primary functions:
- Weather Data: This is done by analyzing historical data, weather conditions, and usage patterns. This helps ensure that the system can meet expected energy needs.
- Demand Profiling: Demand profiling focuses on analyzing daily, weekly, and seasonal energy consumption trends. It identifies peak and off-peak periods, enabling the optimization of energy supply and system operations [36].
3.2. Energy Supply Analysis
This step evaluates the availability and performance of different energy sources within the system. It involves two main functions:
- Renewable Energy Assessment: This function assesses the potential of renewable energy sources, such as solar, wind, and others, based on geographic and environmental data. It determines the viability of these sources in meeting energy demands.
- Supply Profiling: Supply profiling develops detailed profiles of energy supply from various sources, aligning them with demand profiles. This ensures a balance between energy generation and consumption, optimizing the system’s efficiency [7].
The methodology adopted in this paper is depicted in Figure 4 as a flowchart, offering a clear visual representation of the workflow and the steps involved in obtaining and calculating the results.
Figure 4.
The Block Diagram for The Workflow.
- The implementation of hybrid renewable energy system: Launch a hybrid power system in a select residential area or community to install and monitor power and hydrogen generation for both electric demand and heating systems.
- Data Collection and Analysis: Collect data on electric power demand, heating efficiency, energy consumption, cost, and user satisfaction.
- Comparative Study: Contrast the collected data with similar metrics from utility as grid and natural gas for electric power demand and heating systems in comparable settings.
Developing and implementing hybrid renewable energy systems and a green hydrogen strategy for buildings necessitates the creation of an algorithm, as depicted in Figure 5, to facilitate the generation and utilization of green energy and hydrogen within local communities. This algorithm should address multiple aspects of small-scale applications, including energy sources and their specific uses. The focus of this paper is to investigate the deployment of a small-scale wind turbine and photovoltaic (PV) system integrated with a green hydrogen production unit via electrolysis for use in a building. Moreover, to integrate wind turbines and solar panels as power sources for buildings and an H2-LPG mixture for heating systems without compromising reliability and safety can be summarized into points as:
Figure 5.
Algorithm for Electric Power and Heat Energy in Buildings.
- Use batteries to manage intermittent energy from wind and solar sources, ensuring consistent power supply.
- Implement advanced controllers to balance power generation and heating demands efficiently.
- Adhere to strict safety standards for handling and using the H2-LPG mixture to prevent leaks or combustion risks.
- Include backup systems, such as grid connections or additional energy sources, to ensure reliability.
- Develop a real-time monitoring system for power generation and heating components, coupled with regular maintenance to address potential issues promptly.
- Ensure all systems comply with building codes and energy standards for renewable integration and fuel safety.
The paper highlights several scenarios as examples to demonstrate the potential outcomes that can be achieved.
MBD is specified according to some parameters inside the algorism and scenarios in Figure 5 and Figure 6 and definition of each one in Table 4, these parameters are:
Figure 6.
Algorithm of the Building Electric Power and Heat Energy.
Table 4.
The symbols definition for the selected building.
- MBD physical and dimension specifications.
- MBD loads (Electrical-Thermal-Gas).
- Location & weather specification at the building location.
- Building facility.
MBD encompasses numerous scenarios that together address all demand loads, starting with SC0, where the utility grid supplies 100% of the energy requirements. The scenarios are grouped based on load type:
- Scenario 0 (SC0): All electric, thermal, and gas loads are fully dependent on the utility grid (Electricity and Gas).
- Scenario 1 (SC1): A portion of the electric loads (lighting and equipment) is supplied by photovoltaic (PV) panels.
- Scenario 2 (SC2): A portion of the electric loads (lighting and equipment) is covered by a wind turbine.
- Scenario 3 (SC3): A portion of the electric loads (lighting and equipment) is supported by hydrogen (H2) and a fuel cell.
- Scenario 4 (SC4): A portion of the electric loads (lighting and equipment) is supplied by both wind turbines and PV panels.
- Scenario 5 (SC5): A portion of the electric loads (lighting and equipment) is supported by wind turbines, fuel cells, and PV panels.
- Scenario 6 (SC6): The thermal loads (air and water heating) are partially covered by the hydrogen system.
- Scenario 7 (SC7): The gas loads (e.g., kitchen use) are partially supplied by the hydrogen system.
The specification of the building that is used as a case study can be shown in Table 5.
Table 5.
Building Characteristics.
4. Modelling
The TRNSYS is a versatile simulation software widely used for analyzing the performance of dynamic systems, including solar energy applications. In this study, TRNSYS version 16 was utilized to simulate system performance over an entire year, with hourly simulations covering a total of 8760 h. The system under analysis includes solar panels, wind turbines, an electric controller, and an electrolyzer. Each component is detailed in this section. As shown in Figure 7, the TRNSYS software provides a schematic representation of two renewable energy simulations, with offering a clear visualization of the hydrogen system and illustrating the power output of the renewable energy and hydrogen production.
Figure 7.
Schematic of the renewable energy and the hydrogen system in TRNSYS software.
The following components of the TRNSYS simulation and their interactions are thoroughly outlined:
- Data Reader:
This component reads data from external files at regular intervals, converts it into the required units, and makes it available for use by other components in the TRNSYS simulation as time-dependent forcing functions. It is highly flexible, capable of handling various data file formats, provided the data is organized at consistent time intervals. It simplifies the management of weather data and solar radiation inputs within the TRNSYS environment.
- Wind Turbine:
This mathematical model represents a Wind Energy Conversion System (WECS) and calculates its power output based on wind speed and the turbine’s power characteristics, typically stored in a table within an external file. The model considers variations in air density and wind speed at different heights, enabling accurate simulation of WECS performance. This approach is crucial for evaluating wind energy systems and optimizing their efficiency under changing conditions. The selected wind turbine has a nominal maximum power output of 29 kW. TRNSYS employs a power curve-based model, where the turbine’s power output (Pw) is determined by the Equation (1) [37]:
: Air density (kg/m3).
: Swept area of the turbine blades (m2).
: Wind speed (m/s).
: Power coefficient, representing the efficiency of the turbine in extracting power from the wind.
Solar Panels:
PV panels are integral to the system, converting solar irradiation into direct electric current. A portion of the incident solar energy is transformed into electricity, while the rest is dissipated as heat. The selected PV panels, installed on the laboratory rooftop, have a nominal maximum power rating of 550 W. TRNSYS uses the Type 94a model to simulate the electrical output of the PV array, with the power output calculated using Equation (2):
: Conversion efficiency of the PV module.
: Incident solar radiation on the module (W/m2).
: Area of the PV module (m2).
- Electrolyzer:
The electrolyzer facilitates water electrolysis, splitting water into hydrogen and oxygen, thereby producing green hydrogen. This study uses an alkaline electrolyzer simulated with the TRNSYS Type160a model. The electrolysis process adheres to Faraday’s law, which relates the amount of chemical reaction to the electrical charge passed through the system. The reaction is:
Faraday’s Law
The Faraday’s law equation is given by Equation (4):
: Charge (Coulombs)
: No. of moles for electrons exchanged in the reaction.
: Faraday’s constant (approximately 96,485 C/mol)
Cell Voltage:
The cell voltage in an electrolysis system can be related to the standard cell potential and overpotentials:
: Standard cell potential
: Activation overpotential
: (electrical resistance) overpotential
: Concentration overpotential
- Control Unit:
This module governs the electrolyzer’s operation within an integrated mini-grid that includes a wind turbine, and electrolyzer. The electrolyzer operates in variable power mode, adjusting its power setpoint based on available excess renewable energy. If excess power exceeds the idling power, the electrolyzer’s setpoint is adjusted to utilize it efficiently. Otherwise, the setpoint remains at the idling power level.
- Power Conditioning:
This component models power conditioning units, including electrical converters (DC/DC) and inverters (DC/AC or AC/DC). Using empirical efficiency curves, it calculates output power based on known input power, enabling system optimization.
These components are seamlessly integrated within TRNSYS to simulate the annual performance of wind turbines and solar panels, as well as hydrogen production. This integration accounts for the dynamic nature of energy generation and consumption.
Together, these components are integrated into the TRNSYS software to simulate the annual performance of the hydrogen energy system, accounting for the dynamic variability in energy generation and consumption.
5. Results and Discussion
A dynamic simulation of the system is performed using TRNSYS software, covering various hours and months throughout the year. The simulation operates with a time step of one hour and spans a full year, running from 1 January to 31 December 2023. This comprehensive simulation enables a detailed analysis of the system’s behavior across different seasons and under varying conditions. The weather data used corresponds to Oshawa City, located within the Durham region of Ontario, Canada. This data is essential for capturing the specific climatic and environmental conditions of the region, playing a critical role in energy system simulations and environmental modeling. The simulation incorporates two primary power sources: a wind turbine and a photovoltaic (PV) panel. The characteristics, input data, and output performance of these power sources will be thoroughly detailed in the next section to provide a complete understanding of their roles and contributions to the energy system.
5.1. Turbine Simulation Parameters
The simulation is conducted with TRNSYS package for the power output of the wind turbine, which is subsequently used in the building power demand and the electrolysis process to produce green hydrogen. The primary input for this simulation is weather data, specifically the correlation between wind speed and hours. This data is sourced from the official Government of Canada website [38], ensuring it is accurate and reliable due to its authoritative origin. The simulation focuses on the power output for building loads with the conventional green hydrogen generation system. The simulation aims to assess and evaluate the performance of this stage within the overall energy system.
Table 6 outlines the key specifications and parameters used to model the wind turbine in the simulation.
Table 6.
Turbine specification.
Figure 8 depicts the turbine’s performance across different wind speeds, with its cut-off speed of 12 m/s with 29.63 kW. It demonstrates how the turbine’s power output fluctuates with varying wind speeds and identifies the point where power generation is restricted or ceases. This visualization is crucial for understanding the turbine’s operational behavior and efficiency under various wind conditions.
Figure 8.
The power Curve for the Wind Turbine with cut-off power.
5.2. PV Simulation Parameter
The simulation employs TRNSYS package for modelling and simulate the PV panel’s power output. It is subsequently utilized to meet the building’s electrical load and to support the electrolysis process for hydrogen production. The primary input for this simulation is solar irradiance data, provided as hourly irradiance values. This data is sourced from the official Government of Canada website [38], ensuring accuracy and reliability for the simulation.
Table 7 likely presents the specifications of the photovoltaic (PV) panel employed in the TRNSYS simulation. These specifications generally include essential details such as the PV panel’s electrical characteristics, physical dimensions, efficiency, temperature coefficients, and performance under standard test conditions (STC). Table 8 shows the electrolysis specification used in the simulation for H2 generation.
Table 7.
Electrical specification of PV panel at STC.
Table 8.
The Electrolysis Specification.
5.3. Electrolysis Characteristics
In the following section, various scenarios are generated for both the electric and thermal loads of the building specified in Table 5. A selection of a few scenarios from the hundreds available is analyzed as follows:
5.4. Electric Load Scenarios
5.4.1. SC 0
This scenario represents a power demand for the building mall that is fully met (100% coverage) by the utility supply. The statistical analysis of this scenario is presented in the following Table 9.
Table 9.
Electric Load.
The cost analysis of the grid utility is considering in Table 9 due the price of kWh in Table 10 with considering the total annual cost in Table 11.
Table 10.
Price list for Non-Residential.
Table 11.
Utility Cost Analysis.
5.4.2. SC 4-1
The proposed hybrid renewable energy system efficiently covers the mall’s light load demand while utilizing wind and solar energy resources. It emphasizes the environmental benefits of reducing reliance on conventional energy sources and showcases an effective design for renewable energy integration in urban infrastructure.
This scenario offers a power rate of green power due to the available wind and solar energy at the building mall location. In this scenario, wind turbines and solar panels (PV) are used as a power source to cover a percentage of the building’s light load (Eq-E1) (300 kW), which runs for 8 h. Wind turbines work 18 h, and PV with 550 W (1 kW needs 10 m2) works for 5 h per day. To cover this load, it is simulated the power output from 6 wind turbines with 29 kW for one, and PV 15 in series and 15 in parallel.
Figure 9 and Figure 10 present the annual solar irradiation and wind speed data for the selected zone, based on the available weather data for this location. This data serves as input to the TRNSYS simulation, enabling the calculation and modeling of power generation from both PV panels and wind turbines.
Figure 9.
Annually hour solar irradiance data for Oshawa City, located within the Durham zone.
Figure 10.
Annual wind speed data for Oshawa City, located within the Durham zone.
Figure 11 and Figure 12 depict the simulated power output from the PV panels and wind turbines. This generated power is utilized to partially meet the building’s load requirements, as indicated in Scenario 4-1, detailed in Table 12.
Figure 11.
Annually PV Power output data for Oshawa City, located within the Durham zone Sc 4-1 and Sc 4-2.
Figure 12.
Annually Wind Turbines Power output data for Oshawa City, located within the Durham zone Sc 4-1 and Sc 4-2.
Table 12.
Scenario SC 4-1 analysis.
5.4.3. Sc 4-2
This scenario provides a green power supply based on the available wind and solar energy at the building mall location. In this setup, both wind turbines and photovoltaic (PV) solar panels are used as power sources to cover a portion of the equipment load (Eq-E2) of 200 kW, operating for 8 h daily. The wind turbines operate for 18 h per day, while the PV panels function for 5 h per day. The statistical analysis of this scenario is presented in Table 13.
Table 13.
Scenario SC 4-2 analysis.
5.4.4. Sc 4-3
This scenario utilizes green power derived from wind and solar energy resources available at the building mall location. In this setup, both wind turbines and photovoltaic (PV) solar panels are employed as power sources to partially meet the building’s light load (Eq-E1), which has a capacity of 300 kW and operates for 8 h daily. Wind turbines work 18 h, and PV with 550 W works for 5 h per day. To cover this load, it is simulated the power output from 4 wind turbines with 29 kW for one, and PV 9 in series and 7 in parallel as can be seen in Figure 13 and Figure 14.
Figure 13.
Annually PV Power output data for Oshawa City, located within the Durham zone Sc 4-3 and Sc 4-4.
Figure 14.
Annually Wind Turbines Power output data for Oshawa City, located within the Durham zone Sc 4-3 and Sc 4-4.
5.4.5. Sc 4-4
This scenario offers a power rate of green power due to the available wind and solar energy at the building mall location. In this scenario, both wind turbines and solar panels (PV) are used as a power source to cover a percentage of the equipment load (Eq-E2) (200 kW) of the building running for 8 h. Wind turbines work for 18 h, and PV works for 5 h per day. To cover this load, it is simulated the power output from 4 wind turbines with 29 kW for one, and PV 9 in series and 7 in parallel.
Table 14.
Scenario SC 4-3 analysis.
Table 15.
Scenario SC 4-4 analysis.
Figure 15, Figure 16 and Figure 17 identify Scenario 4-1 (SC 4-1) as the most efficient configuration for addressing the electric light load demand in the specified building. This scenario optimally combines renewable energy sources, utilizing:
Figure 15.
Electric Loads (Light) Summary.
Figure 16.
Electric Loads (Equipment) Summary.
Figure 17.
Cost Saving Analysis Yearly Summary.
- Wind Turbine Capacity: 70 kW
- Photovoltaic (PV) System Capacity: 50 kW
Key Details: SC 4-1 and 4-2 integrate both wind turbines and solar panels to ensure a balanced and reliable power supply. This combination maximizes the use of renewable energy resources available at the location, such as solar irradiance and wind speed, to reduce dependence on utility-supplied electricity. The system Performance of the wind turbine generates power for extended periods, leveraging the consistent wind speeds in the area, while the PV panels contribute additional power during peak sunlight hours, complementing the wind turbine’s output. This led to specifically targets the electric light and equipment loads demand, ensuring that the renewable energy sources provide sufficient power while minimizing gaps in coverage. From the point of sustainability, it reduces carbon footprint by minimizing reliance on traditional utility power. And for meanwhile, the cost-effectiveness decreases for the operational costs by harnessing renewable energy, particularly during peak production hours.
Furthermore, Figure 18 depicts the proposed arrangement of PV panels and turbines on the building’s rooftop.
Figure 18.
Building Roof Layout with PV and Wind turbines Installed.
Thermal Loads (TL—T1).
This scenario explores the use of a blended fuel approach, combining hydrogen (H2) and propane, to meet the energy demands of the building’s heating air system. By integrating hydrogen, a clean and sustainable energy source, with propane, the system aims to enhance energy efficiency while reducing environmental impact. This innovative approach leverages the advantages of both fuels, contributing to a more sustainable and reliable heating solution.
SC 0
In this scenario, the thermal load demands in Table 16 are entirely reliant on the utility supply, with 100% of the required energy being provided by the utility. The detailed statistical analysis of this scenario is presented in the following Table 16, Table 17 and Table 18.
Table 16.
Thermal Load.
Table 17.
Fuel used for the thermal load.
Table 18.
Cost Analysis.
A TRNSYS simulation is conducted in Figure 19 for the green hydrogen generation system, emphasizing a partial power supply from wind turbines and photovoltaic (PV) panels. This simulation focuses on the alkaline electrolysis system, with a vital component of the hydrogen production process. The goal is to analyze and evaluate its performance, particularly in terms of the annual hydrogen output generated.
Figure 19.
Annually Hydrogen Production.
Sc 6-1
This scenario utilizes a fuel mixture of hydrogen (H2) and propane to supply the building mall’s heating air system (TL-T1). The mixture consists of 40% hydrogen and 60% propane, providing an efficient and balanced fuel source to meet the thermal load demands with analysis of cost reduction which can be seen in Table 19.
Table 19.
H2 Propane mixture analysis for the thermal load (Air heating).
Sc 6-2
This scenario offers a fuel mixture of H2 and Propane at the building mall. In this scenario, H2 gas and propane are used as a fuel mixture with 25% H2 and 75% propane to feed the building’s air heating system (TL-T1) with analysis of cost reduction which can be seen in Table 20.
Table 20.
H2 Propane mixture analysis for the thermal load (Air heating).
SC 6-3
This scenario offers a fuel mixture of H2 and Propane at the building mall. In this scenario, both H2 gas and propane are used as a fuel mixture with 15% H2 and 85% propane to feed the building’s air heating system (TL-T1) with analysis of cost reduction which can be seen in Table 21.
Table 21.
H2 Propane mixture analysis for the thermal load (Air heating).
The amount of fuel consumption for a thermal load of air heating of the building can be shown in Figure 20. SC 6-1 is the optimum one for the Propane-H2 mixture. This scenario has many privileges as compared to others as can be seen in Figure 21 as saving costs yearly, and in Figure 22 for GHG emissions.
Figure 20.
Fuel Consumption for Different Scenarios with and Without Propane -H2 mixture.
Figure 21.
Running Cost and Saving for Different Scenarios.
Figure 22.
GHG Emissions for Different Scenarios.
Risk Analysis for H2 Generation Unit
Conducting a risk analysis for an alkaline electrolysis system designed to generate hydrogen involves evaluating potential hazards associated with each component and the system as a whole with some assumptions built out as in Table 22.
Table 22.
Assumed Probabilities for Basic Events.
Figure 23 and Figure 24 outlines a Risk Assessment and Scenarios Framework designed for evaluating and managing risks in a hydrogen (H2) system. The framework is divided into three interconnected components:
Figure 23.
The Definition of the Risk Scenarios.
Figure 24.
Fault tree Analysis of hydrogen hazard.
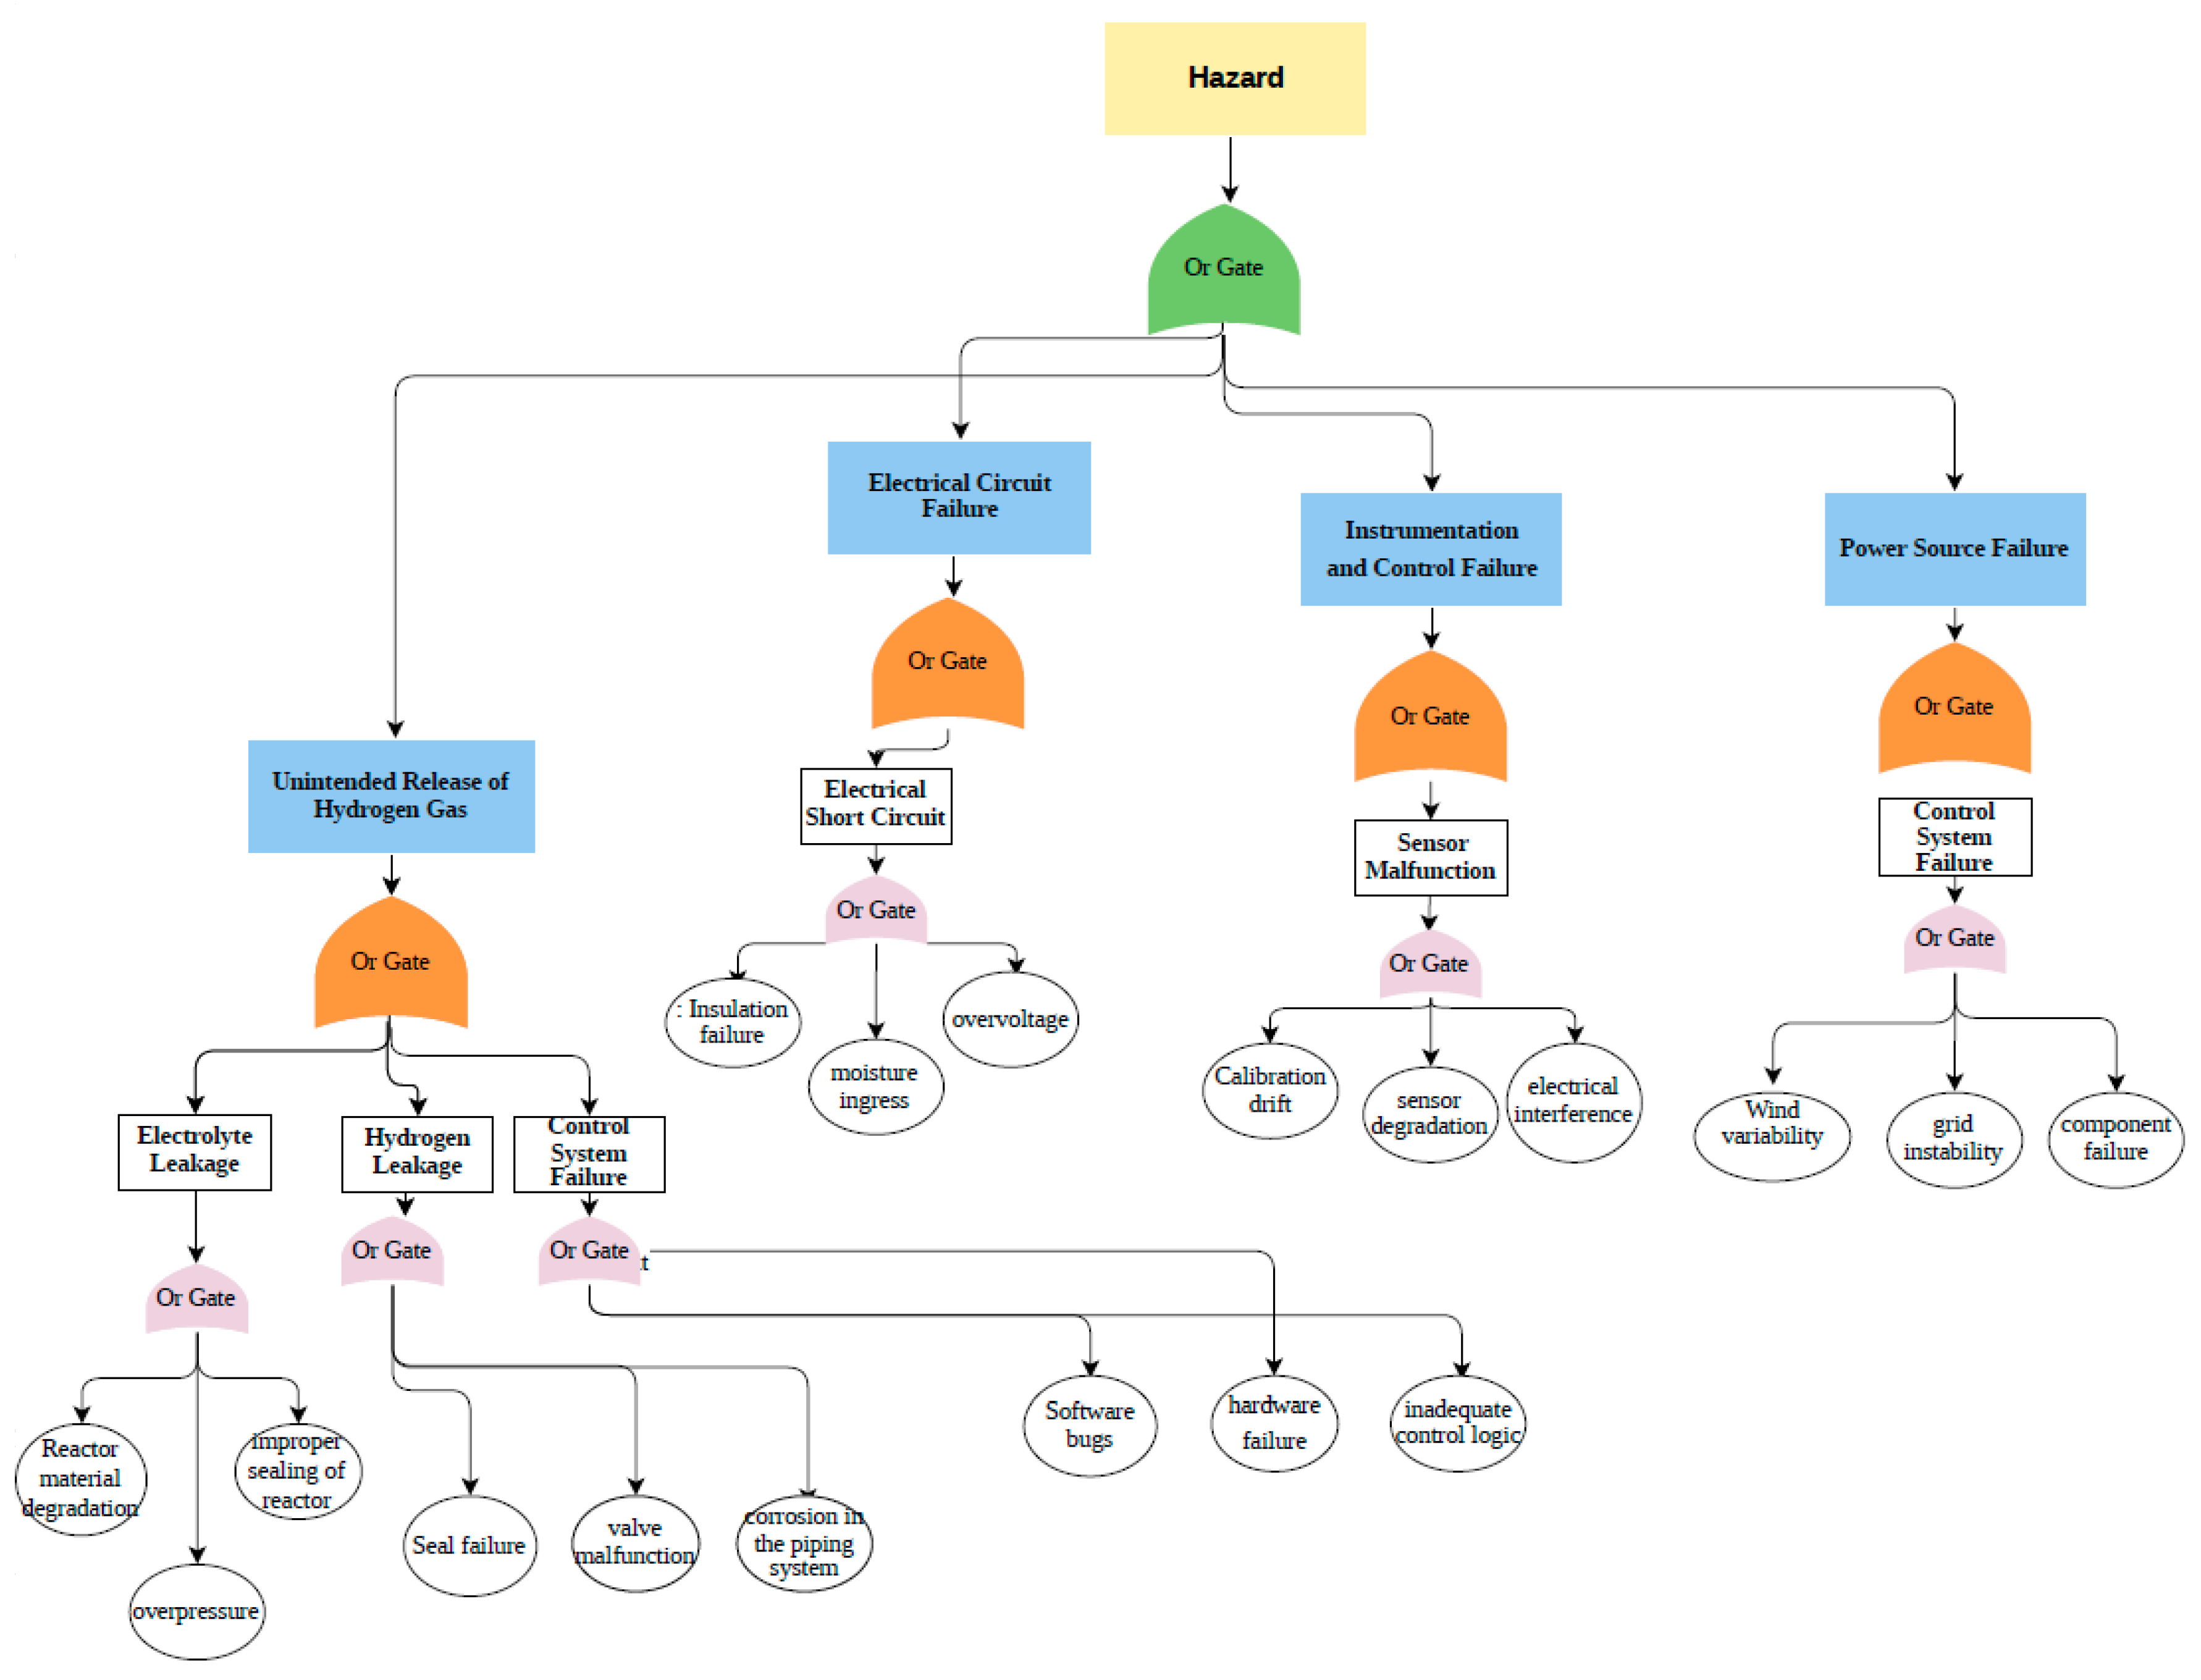
- Risk Assessment of H2 Unit: This component focuses on identifying and analyzing potential risks specific to the hydrogen unit, including operational, safety, and environmental hazards.
- Risk Scenarios: Based on the assessment, various potential risk scenarios are developed. These scenarios help in understanding how different risk factors could materialize under specific conditions.
- Risk Level Calculation: This step involves quantifying the level of risk associated with each scenario. It calculates risk severity and probability, providing a clear understanding of the overall risk profile.
Intermediate Events and Top-Level Calculations
- Instrumentation and Control Failure Hazard
This is caused by a Sensor Malfunction (single basic event):
Instrumentation = P Sensor Malfunction = 0.02
- 2.
- Electrical Hazard (OR Gate)
Combines:
- Electrical Short Circuit (P1): 0.03
- Control System Failure (P2): 0.04
P Electrical Hazard = 1 − (1 − P1) ×( 1 − P2)
= 1 − (1 − 0.03) × (1 − 0.04)
= 1 − (0.97) × (0.96) = 1 − 0.9312 = 0.0688
= 1 − (1 − 0.03) × (1 − 0.04)
= 1 − (0.97) × (0.96) = 1 − 0.9312 = 0.0688
Piping System with Valve Control (OR Gate)
Combines:
- Control System Failure (P3): 0.04
- Hydrogen Leak (P4): 0.01
- Electrolyte Leak (P5): 0.02
P Piping System = 1 − (1 − P3) × (1 − P4) × (1 − P5)
= 1 − (1 − 0.04) × (1 − 0.01) × (1 − 0.02)
= 1 − (0.96) × (0.99) × (0.98)
= 1 − 0.931
= 0.069
= 1 − (1 − 0.04) × (1 − 0.01) × (1 − 0.02)
= 1 − (0.96) × (0.99) × (0.98)
= 1 − 0.931
= 0.069
Power Supply Hazard (Single Event)
This is caused by a Power Supply Interruption:
P Power Supply Hazard = 0.03
Top-Level Event (Risk Scenarios)
The top event Risk Scenarios combines:
- Instrumentation and Control Failure Hazard (P6): 0.02
- Electrical Hazard (P7): 0.0688
- Piping System with Valve Control (P8): 0.069
- Power Supply Hazard (P9): 0.03
OR Gate Calculation:
P Risk Scenarios = 1 − (1 − P6) × (1 − P7) × (1 − P8) × (1 − P9)
= 1 − (1 − 0.02) × (1 − 0.0688) × (1 − 0.069) × (1 − 0.03)
= 1 − (0.98) × (0.9312) × (0.931) × (0.97)
= 1 − (0.98) × (0.9312) × (0.931) × (0.97)
= 0.186
= 1 − (1 − 0.02) × (1 − 0.0688) × (1 − 0.069) × (1 − 0.03)
= 1 − (0.98) × (0.9312) × (0.931) × (0.97)
= 1 − (0.98) × (0.9312) × (0.931) × (0.97)
= 0.186
The overall probability of the Risk Scenarios is 18.6%. This value reflects the combined likelihood of the hazards associated with instrumentation, electrical systems, piping systems, and power supply interruptions. If actual probabilities are available, these calculations can be further refined.
6. Conclusions
This study fills a significant void in the literature by presenting a clear pathway to replacing fossil fuels in buildings with hybrid renewable systems. The integration of green hydrogen amplifies the systems’ environmental impact, offering a versatile energy carrier for diverse applications. It highlights the transformative capabilities of hybrid renewable energy systems (HRES) in meeting the energy needs of buildings, emphasizing their pivotal role in achieving environmental and socio-economic sustainability. By integrating solar panels, wind turbines, and green hydrogen production, the research highlights a pathway to reducing greenhouse gas (GHG) emissions, lowering operational costs, and enhancing energy reliability. Through dynamic simulations using TRNSYS software, the paper validates the effectiveness of hybrid systems in optimizing energy generation and consumption under varying climatic conditions, as demonstrated through carefully analyzed scenarios.
Key findings include:
- Hybrid systems, such as Scenario SC 4-1, effectively meet up to 63% of electrical light loads, combining solar and wind energy to maximize renewable energy utilization and reduce reliance on utility grids, achieving annual savings of CAD$ 87,026.33.
- The introduction of hydrogen-propane fuel blends for thermal loads, exemplified by SC 6-1, reduces greenhouse gas emissions by 216 tCO2/year and generates annual cost savings of CAD$ 251,406 achieves significant reductions in GHG emissions and operational costs while enhancing energy efficiency.
- Risk assessments and fault tree analyses provide actionable insights into mitigating hazards associated with hydrogen generation units, ensuring the safety and reliability of these advanced systems.
The results clearly demonstrate that the hybrid renewable energy systems are not only practical but have extra advantageous in meeting energy demands sustainably. They present a compelling case for replacing fossil fuels in buildings with renewable energy sources, driving progress toward global net-zero targets. The integration of green hydrogen into these systems further amplifies their environmental benefits, offering a clean, versatile energy carrier for diverse applications.
Future work should focus on scaling these systems, optimizing their cost-effectiveness, and integrating emerging technologies to address the ever-evolving challenges of energy sustainability. By embracing these innovative solutions, municipalities, industries, and governments can accelerate the transition to a cleaner, more sustainable energy future.
Author Contributions
A.R.: Conceptualization and Methodology, Visualization, Investigation, Writing—Original Draft Preparation. H.A.G.: Funding Acquisition, Principal Investigator, Methodology, Writing—Reviewing and Editing. All authors have read and agreed to the published version of the manuscript.
Funding
The research is supported by the Government of Canada and NSERC.
Institutional Review Board Statement
Not Applicable.
Informed Consent Statement
Not Applicable.
Data Availability Statement
The authors will provide the raw data that supports the conclusions of this article upon request.
Conflicts of Interest
The authors declare no conflicts of interest.
Abbreviations
| PV | Photovoltaic panel. |
| WT | Wind turbine |
| STC | Standard Test Conditions |
| DG | Diesel Generator |
| BG | Biogas |
| LCE | Levelized Cost of Energy |
| LCC | Life Cycle Cost |
| GHG | Green House Gas |
Nomenclature
| RotorHt | Turbine rotor center height (m) |
| Rotor_Di | Turbine rotor diameter (m) |
| Sher_Exp | Power-law exponent for vertical wind profile |
| Turb_Int | Turbulence intensity valid for this curve |
| Air_Dens | air density (kg/m3) |
| Pwr_Ratd | Rated power of the turbine (W) |
| Spd_Ratd | Rated wind speed (m/s) |
| IELY | Current through single electrolyzer stack (A) |
| PELY | Electrolyzer pressure (Pa) |
| TROOM | Room temperature (°C) |
| TELY | Temperature of electrolyzer (°C) |
| Pmax | Rated Maximum Power (W) |
| Voc | Open Circuit Voltage (V) |
| Vmp | Maximum Power Voltage (V) |
| Isc | Short Circuit Current (A) |
| Imp | Maximum Power Current (A) |
Creek Letter
| α | Temperature Coefficient of Isc |
| β | Temperature Coefficient of Voc |
| γ | Temperature Coefficient of Pmax |
| Ρ | Air Density (kg/m3) |
| η | Efficiency |
References
- Dey, S.; Sreenivasulu, A.; Veerendra, G.T.N.; Rao, K.V.; Babu, P.S.S.A. Renewable energy present status and future potentials in India: An overview. Innov. Green Dev. 2022, 1, 100006. [Google Scholar] [CrossRef]
- Khan, S.A.; Al-Ghamdi, S.G. Renewable and Integrated Renewable Energy Systems for Buildings and Their Environmental and Socio-Economic Sustainability Assessment. In Energy Systems Evaluation (Volume 1); Ren, J., Ed.; Springer International Publishing: Cham, Switzerland, 2021; pp. 127–144. [Google Scholar]
- Energy Efficiency 2019—Analysis. Available online: https://www.iea.org/reports/energy-efficiency-2019 (accessed on 16 October 2024).
- Chen, L.; Hu, Y.; Wang, R.; Li, X.; Chen, Z.; Hua, J.; Osman, A.I.; Farghali, M.; Huang, L.; Li, J.; et al. Green building practices to integrate renewable energy in the construction sector: A review. Environ. Chem. Lett. 2024, 22, 751–784. [Google Scholar] [CrossRef]
- Pérez-Lombard, L.; Ortiz, J.; Pout, C. A review on buildings energy consumption information. Energy Build. 2008, 40, 394–398. [Google Scholar] [CrossRef]
- Shahzad, U.; Gupta, M.; Sharma, G.D.; Rao, A.; Chopra, R. Resolving energy poverty for social change: Research directions and agenda. Technol. Forecast. Soc. Change 2022, 181, 121777. [Google Scholar] [CrossRef]
- Gielen, D.; Boshell, F.; Saygin, D.; Bazilian, M.D.; Wagner, N.; Gorini, R. The role of renewable energy in the global energy transformation. Energy Strategy Rev. 2019, 24, 38–50. [Google Scholar] [CrossRef]
- Ramadan, A.; Gabbar, H.A. Evaluation of Hydrogen Generation with Hybrid Renewable Energy Sources. Appl. Sci. 2024, 14, 6235. [Google Scholar] [CrossRef]
- Nazari-Heris, M.; Asadi, S. Reliable energy management of residential buildings with hybrid energy systems. J. Build. Eng. 2023, 71, 106531. [Google Scholar] [CrossRef]
- Canada’s Clean Hydrogen Gets Set to Power the World—Financial Times—Partner Content by Invest in Canada. Available online: https://canada-next-best-place-to-home.ft.com/canadas-clean-hydrogen-gets-set-to-power-the-world (accessed on 16 October 2024).
- Ma, T.; Yang, H.; Lu, L. Development of hybrid battery–supercapacitor energy storage for remote area renewable energy systems. Appl. Energy 2015, 153, 56–62. [Google Scholar] [CrossRef]
- Ghahramani, M.; Nazari-Heris, M.; Zare, K.; Mohammadi-Ivatloo, B. A two-point estimate approach for energy management of multi-carrier energy systems incorporating demand response programs. Energy 2022, 249, 123671. [Google Scholar] [CrossRef]
- The Economics of Load Defection: How Grid-Connected Solar-Plus-Battery Systems Will Compete with Traditional Electric Service, Why It Matters, and Possible Paths Forward. This Report, Published by the Rocky Mountain Institute in May 2015. Available online: https://rmi.org/wp-content/uploads/2017/04/2015-05_RMI-TheEconomicsOfLoadDefection-FullReport-1.pdf (accessed on 16 December 2024).
- Abdin, Z.; Mérida, W. Hybrid energy systems for off-grid power supply and hydrogen production based on renewable energy: A techno-economic analysis. Energy Convers. Manag. 2019, 196, 1068–1079. [Google Scholar] [CrossRef]
- Al Afif, R.; Ayed, Y.; Maaitah, O.N. Feasibility and optimal sizing analysis of hybrid renewable energy systems: A case study of Al-Karak, Jordan. Renew. Energy 2023, 204, 229–249. [Google Scholar] [CrossRef]
- Malik, P.; Awasthi, M.; Sinha, S. A techno-economic investigation of grid integrated hybrid renewable energy systems. Sustain. Energy Technol. Assess. 2022, 51, 101976. [Google Scholar] [CrossRef]
- Das, B.K.; Tushar, M.S.H.K.; Hassan, R. Techno-economic optimisation of stand-alone hybrid renewable energy systems for concurrently meeting electric and heating demand. Sustain. Cities Soc. 2021, 68, 102763. [Google Scholar] [CrossRef]
- Murugaperumal, K.; Ajay D Vimal Raj, P. Feasibility design and techno-economic analysis of hybrid renewable energy system for rural electrification. Sol. Energy 2019, 188, 1068–1083. [Google Scholar] [CrossRef]
- Wang, J.; Pan, Z.; Ge, H.; Zhao, H.; Xia, T.; Wang, B. Economic Dispatch of Integrated Electricity–Heat–Hydrogen System Considering Hydrogen Production by Water Electrolysis. Electronics 2023, 12, 4166. [Google Scholar] [CrossRef]
- Behzadi, A.; Arabkoohsar, A.; Perić, V.S. Innovative hybrid solar-waste designs for cogeneration of heat and power, an effort for achieving maximum efficiency and renewable integration. Appl. Therm. Eng. 2021, 190, 116824. [Google Scholar] [CrossRef]
- Shen, Y.; Li, X.; Wang, N.; Li, L.; Hoseyni, A. Introducing and investigation of a pumped hydro-compressed air storage based on wind turbine and alkaline fuel cell and electrolyzer. Sustain. Energy Technol. Assess. 2021, 47, 101378. [Google Scholar] [CrossRef]
- Ahmad, T.; Zhang, D. Renewable energy integration/techno-economic feasibility analysis, cost/benefit impact on islanded and grid-connected operations: A case study. Renew. Energy 2021, 180, 83–108. [Google Scholar] [CrossRef]
- Patil, A.A.; Arora, R.; Sridhara, S. Techno-economic analysis of solar, wind, and biomass hybrid renewable energy systems in Bhorha Village, India. J. Atmos. Sol. -Terr. Phys. 2024, 265, 106362. [Google Scholar] [CrossRef]
- Karunathilake, H.; Perera, P.; Ruparathna, R.; Hewage, K.; Sadiq, R. Renewable energy integration into community energy systems: A case study of new urban residential development. J. Clean. Prod. 2018, 173, 292–307. [Google Scholar] [CrossRef]
- Karunathilake, H.; Hewage, K.; Sadiq, R. Opportunities and challenges in energy demand reduction for Canadian residential sector: A review. Renew. Sustain. Energy Rev. 2018, 82, 2005–2016. [Google Scholar] [CrossRef]
- Singh, K.; Hachem-Vermette, C. Economical energy resource planning to promote sustainable urban design. Renew. Sustain. Energy Rev. 2021, 137, 110619. [Google Scholar] [CrossRef]
- Minuto, F.D.; Lazzeroni, P.; Borchiellini, R.; Olivero, S.; Bottaccioli, L.; Lanzini, A. Modeling technology retrofit scenarios for the conversion of condominium into an energy community: An Italian case study. J. Clean. Prod. 2021, 282, 124536. [Google Scholar] [CrossRef]
- Environment and Climate Change Canada (ECCC). Air Health Trends. Available online: https://www.canada.ca/en/environment-climate-change/services/environmental-indicators/air-health-trends.html (accessed on 18 December 2024).
- Nematollahi, O.; Alamdari, P.; Jahangiri, M.; Sedaghat, A.; Alemrajabi, A.A. A techno-economical assessment of solar/wind resources and hydrogen production: A case study with GIS maps. Energy 2019, 175, 914–930. [Google Scholar] [CrossRef]
- Wei, D.; Zhang, L.; Alotaibi, A.A.; Fang, J.; Alshahri, A.H.; Almitani, K.H. Transient simulation and comparative assessment of a hydrogen production and storage system with solar and wind energy using TRNSYS. Int. J. Hydrogen Energy 2022, 47, 26646–26653. [Google Scholar] [CrossRef]
- Mansir, I.B.; Bani Hani, E.H.; Farouk, N.; AlArjani, A.; Ayed, H.; Nguyen, D.D. Comparative transient simulation of a renewable energy system with hydrogen and battery energy storage for residential applications. Int. J. Hydrogen Energy 2022, 47, 26198–26208. [Google Scholar] [CrossRef]
- Behzadi, A.; Alirahmi, S.M.; Yu, H.; Sadrizadeh, S. An efficient renewable hybridization based on hydrogen storage for peak demand reduction: A rule-based energy control and optimization using machine learning techniques. J. Energy Storage 2023, 57, 106168. [Google Scholar] [CrossRef]
- Ishaq, H.; Dincer, I.; Naterer, G.F. Development and assessment of a solar, wind and hydrogen hybrid trigeneration system. Int. J. Hydrogen Energy 2018, 43, 23148–23160. [Google Scholar] [CrossRef]
- Al-Buraiki, A.S.; Al-Sharafi, A. Hydrogen production via using excess electric energy of an off-grid hybrid solar/wind system based on a novel performance indicator. Energy Convers. Manag. 2022, 254, 115270. [Google Scholar] [CrossRef]
- Aide Financière|Programme Chauffez Vert|Innovation et Transition Énergétiques. Available online: https://transitionenergetique.gouv.qc.ca/residentiel/programmes/chauffez-vert/aide-financiere (accessed on 2 January 2025).
- Pandey, A.K.; Singh, P.K.; Nawaz, M.; Kushwaha, A.K. Forecasting of non-renewable and renewable energy production in India using optimized discrete grey model. Environ. Sci. Pollut. Res. 2023, 30, 8188–8206. [Google Scholar] [CrossRef]
- Solar Energy Laboratory, University of Wisconsin–Madison. TRNSYS 16: A Transient System Simulation Program—User Manual; University of Wisconsin–Madison: Madison, WI, USA, 2017. [Google Scholar]
- Historical Data—Climate—Environment and Climate Change Canada. Available online: https://climate.weather.gc.ca/historical_data/search_historic_data_e.html (accessed on 19 December 2024).
Disclaimer/Publisher’s Note: The statements, opinions and data contained in all publications are solely those of the individual author(s) and contributor(s) and not of MDPI and/or the editor(s). MDPI and/or the editor(s) disclaim responsibility for any injury to people or property resulting from any ideas, methods, instructions or products referred to in the content. |
© 2025 by the authors. Licensee MDPI, Basel, Switzerland. This article is an open access article distributed under the terms and conditions of the Creative Commons Attribution (CC BY) license (https://creativecommons.org/licenses/by/4.0/).